characteristics of specialty occupation workers (h-1b) · characteristics of specialty occupation...
TRANSCRIPT
Characteristics of Specialty Occupation Workers (H-1B):
Fiscal Year 2005
Issued November 2006
Report Mandated by Public Law 105-277, Division C, American Competitiveness and Workforce
Improvement Act of 1998
Page 2
Characteristics of Specialty Occupation Workers (H-1B): October 2004 to September 2005
This report is mandated under section 416(c)(2) of the American Competitive and Workforce Improvement Act of 1998 (ACWIA) which states: “…(T)he Attorney General shall submit on an annual basis, to the Committees on the Judiciary of the United States House of Representatives and the Senate, information on the countries of origin and occupations of, educational levels attained by, and compensation paid to, aliens who were issued visas or otherwise provided nonimmigrant status under section 101(a)(15)(H)(i)(b) of the Immigration and Nationality Act during the previous fiscal year.”
During the transition to the Department of Homeland Security, the legacy Immigration and Naturalization Service (INS) and the newly created United States Citizenship and Immigration Services (USCIS) failed to identify and assume the reporting responsibility for this report and therefore did not provide the report in a timely manner. USCIS is submitting the required information and will provide future reports in accordance with applicable statutes.
Highlights
• The number of petitions filed decreased 14 percent from 312,200 in fiscal year 2004 to 266,474 in
fiscal year 2005. • The number of petitions approved decreased seven percent from 287,418 in fiscal year 2004 to
267,131 in fiscal year 2005. • Approximately forty-four percent of all petitions approved in fiscal year 2005 were for workers
born in India. • Sixty-five percent of petitions approved in fiscal year 2005 were for workers between the ages of
25 and 34. • Forty-five percent of petitions approved in fiscal year 2005 were for workers with a bachelor’s
degree. Thirty-seven percent a master’s degree, five percent had a doctorate, and twelve percent were for workers with a professional degree.
• Forty-three percent of petitions approved in fiscal year 2005 were for workers in computer-related
occupations. • The median salary rose slightly from $53,000 in fiscal year 2004 to $55,000 in fiscal year 2005.
Page 3
Background
An H-1B temporary worker is an alien admitted to the United States to perform services in a
“specialty occupation.”1
The H-1B nonimmigrant classification is a vehicle through which qualified aliens may seek admission to the United States on a temporary basis to work in their fields of expertise. Prior to employing an H-1B temporary worker, a U.S. employer must first file an H-1B petition with USCIS. However, while USCIS is responsible for evaluating an alien’s qualifications for the H-1B classification, approval of an H-1B petition does not equate to admission of the alien to the U.S. in H-1B status. The Department of State (DOS) plays a vital role in the H-1B admission process.
Prior to filing the H-1B petition with USCIS, the U.S. employer must first file a Labor Condition
Application (LCA) with the Department of Labor (DOL) specifying the job, salary, length and geographic location of employment. In addition, the employer must agree to pay the alien the greater of the actual or prevailing wage for the position. Once DOL approves the LCA, the U.S. employer may file the H-1B petition with USCIS.
To qualify as a specialty occupation, the position must meet one of the following requirements: (1)
a bachelor’s or higher degree or its equivalent is normally the minimum entry requirement for the position; (2) the degree requirement is common to the industry or, in the alternative, the position is so complex or unique that it can be performed only by an individual with a degree; (3) the employer normally requires a degree or its equivalent for the position; or (4) the nature of the specific duties is so specialized and complex that the knowledge required to perform the duties is usually associated with attainment of a bachelor’s or higher degree. See 8 C.F.R. § 214.2(h)(4)(iii)(A). In order to perform services in a specialty occupation, an alien must meet one of the following criteria: (1) hold a United States baccalaureate or higher degree as required by the specialty occupation from an accredited college or university; (2) possess a foreign degree determined to be equivalent to a United States baccalaureate or higher degree as required by the specialty occupation from an accredited college or university; (3) have any required license or other official permission to practice the occupation (for example, architect, surveyor, physical therapist) in the state in which employment is sought; or (4) have, as determined by USCIS, the equivalent of the degree required by the specialty occupation acquired through a combination of education, training, and/or experience. Specialty occupations may include, but are not limited to, computer systems analysts and programmers, physicians, professors, engineers, and accountants.
An alien may be admitted to the United States in H-1B status for a maximum period of six years;
however, the H-1B petition may only be approved for a maximum period of three years. See INA § 214(g)(4). Thus, the H-1B petition may be used to sponsor an alien for an initial period of H-1B employment or to extend or change the authorized stay of an alien previously admitted to the United States in H-1B status or another nonimmigrant status. Additionally, an employer may file the petition to sponsor an alien who currently has status as an H-1B nonimmigrant working for another employer or to seek an amendment of a previously approved petition. In the case of a petition to amend a previously approved petition, no corresponding request need be made to extend the authorized stay of the beneficiary. For example, an employer may file an amended petition notifying USCIS of a different location where the
1 Section 214(i)(1) of the Immigration and Nationality Act defines a specialty occupation as “an occupation that requires (A) the theoretical and practical application of a body of highly specialized knowledge, and (B) attainment of a bachelor’s or higher degree in the specific specialty (or its equivalent) as a minimum for entry into the occupation in the United States.” 8 U.S.C. §1184(i).
Page 4
beneficiary will be employed or a material change in the beneficiary’s job duties. Therefore, the total number of approved petitions exceeds the actual number of aliens who are provided nonimmigrant status as H-1B. At the end of the six-year period, the alien must either change to a different status (if eligible) or depart the United States.2 USCIS regulations provide that an alien who has been outside the United States for at least one year may be eligible for a new six-year period of admission in H-1B status. See 8 CFR 214.2(h) (13)(iii)(A).
When the H-1B category was enacted in 1990, Congress established that a maximum of 65,000 H-1B visas may be issued to aliens during each fiscal year. This limitation, commonly referred to as the “H-1B cap,” does not apply to H-1B petitions filed on behalf of aliens who have been counted against the cap in the previous six years and who have not been outside of the United States for one year or longer. Thus, generally, petitions to extend an H-1B nonimmigrant’s period of stay, change the conditions of the H-1B nonimmigrant’s current employment, or request new H-1B employment filed on behalf of H-1B workers already in the United States will not count against the H-1B fiscal year cap. The INA, as amended by the Immigration Act of 1990 and the American Competitiveness and Workforce Improvement Act of 1998 (ACWIA) and the American Competitiveness in the Twenty-first Century Act (AC21), made significant changes to policy and procedure governing the H-1B category, including providing temporary increases in the fiscal year limitations on available H-1B visas and providing for certain exemptions to these limitations. Under ACWIA, the annual ceiling of H-1B petitions valid for new employment was increased from 65,000 to 115,000 in fiscal years 1999 and 2000 and to 107,500 in 2001. AC21 raised the limit on petitions in fiscal year 2001 from 107,500 to 195,000 and in fiscal year 2002 from 65,000 to 195,000. The limit in fiscal year 2003 was 195,000. Starting in fiscal year 2004, the H-1B cap reverted back to 65,000 per fiscal year and presently remains at that level. These statutory provisions also provided for certain exemptions from the fiscal year H-1B cap; petitions for new H-1B employment are exempt if the aliens will be employed at institutions of higher education or related or affiliated nonprofit entities, or at nonprofit research organizations or governmental research organizations. In addition, the H-1B Visa Reform Act of 2004 mandates that the first 20,000 H-1B petitions filed on behalf of aliens with U.S.-earned masters’ or higher degrees will be exempt from any fiscal year cap on available H-1B visas.
2 Certain aliens are exempt from the six-year maximum period of admission under the provisions of the American Competitiveness in the Twenty-First Century Act of 2000 (AC21) (Public Law 106-313).
Page 5
Petitions
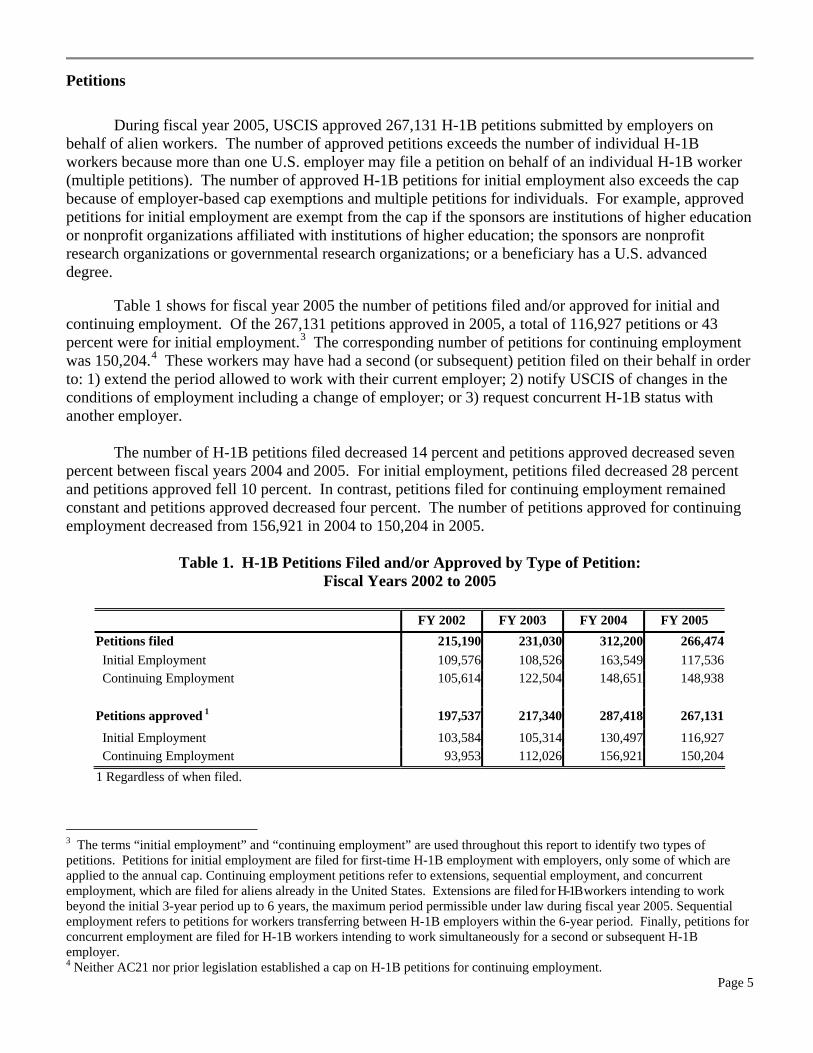
During fiscal year 2005, USCIS approved 267,131 H-1B petitions submitted by employers on behalf of alien workers. The number of approved petitions exceeds the number of individual H-1B workers because more than one U.S. employer may file a petition on behalf of an individual H-1B worker (multiple petitions). The number of approved H-1B petitions for initial employment also exceeds the cap because of employer-based cap exemptions and multiple petitions for individuals. For example, approved petitions for initial employment are exempt from the cap if the sponsors are institutions of higher education or nonprofit organizations affiliated with institutions of higher education; the sponsors are nonprofit research organizations or governmental research organizations; or a beneficiary has a U.S. advanced degree.
Table 1 shows for fiscal year 2005 the number of petitions filed and/or approved for initial and continuing employment. Of the 267,131 petitions approved in 2005, a total of 116,927 petitions or 43 percent were for initial employment.3 The corresponding number of petitions for continuing employment was 150,204.4 These workers may have had a second (or subsequent) petition filed on their behalf in order to: 1) extend the period allowed to work with their current employer; 2) notify USCIS of changes in the conditions of employment including a change of employer; or 3) request concurrent H-1B status with another employer.
The number of H-1B petitions filed decreased 14 percent and petitions approved decreased seven percent between fiscal years 2004 and 2005. For initial employment, petitions filed decreased 28 percent and petitions approved fell 10 percent. In contrast, petitions filed for continuing employment remained constant and petitions approved decreased four percent. The number of petitions approved for continuing employment decreased from 156,921 in 2004 to 150,204 in 2005.
Table 1. H-1B Petitions Filed and/or Approved by Type of Petition:
Fiscal Years 2002 to 2005
FY 2002 FY 2003 FY 2004 FY 2005 Petitions filed 215,190 231,030 312,200 266,474 Initial Employment 109,576 108,526 163,549 117,536 Continuing Employment 105,614 122,504 148,651 148,938 Petitions approved 1 197,537 217,340 287,418 267,131
Initial Employment 103,584 105,314 130,497 116,927 Continuing Employment 93,953 112,026 156,921 150,2041 Regardless of when filed.
3 The terms “initial employment” and “continuing employment” are used throughout this report to identify two types of petitions. Petitions for initial employment are filed for first-time H-1B employment with employers, only some of which are applied to the annual cap. Continuing employment petitions refer to extensions, sequential employment, and concurrent employment, which are filed for aliens already in the United States. Extensions are filed for H-1B workers intending to work beyond the initial 3-year period up to 6 years, the maximum period permissible under law during fiscal year 2005. Sequential employment refers to petitions for workers transferring between H-1B employers within the 6-year period. Finally, petitions for concurrent employment are filed for H-1B workers intending to work simultaneously for a second or subsequent H-1B employer. 4 Neither AC21 nor prior legislation established a cap on H-1B petitions for continuing employment.
Page 6
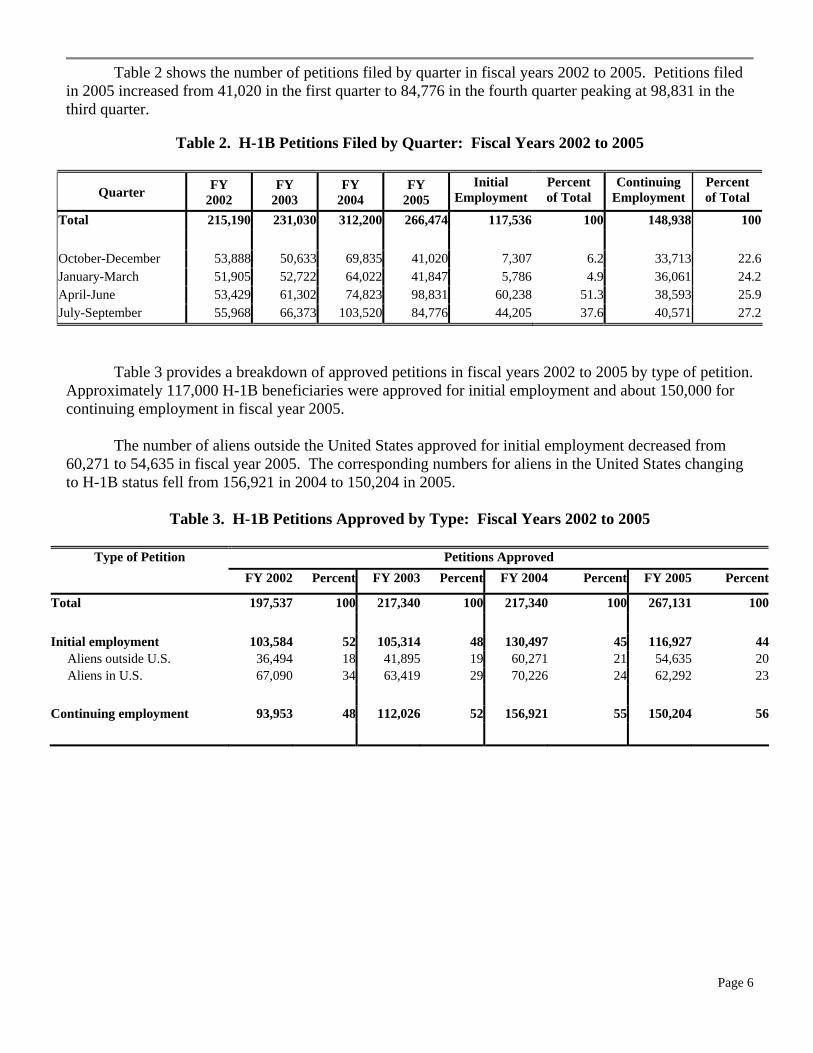
Table 2 shows the number of petitions filed by quarter in fiscal years 2002 to 2005. Petitions filed in 2005 increased from 41,020 in the first quarter to 84,776 in the fourth quarter peaking at 98,831 in the third quarter.
Table 2. H-1B Petitions Filed by Quarter: Fiscal Years 2002 to 2005
Quarter FY 2002
FY 2003
FY 2004
FY 2005
Initial Employment
Percent of Total
ContinuingEmployment
Percent of Total
Total 215,190 231,030 312,200 266,474 117,536 100 148,938 100 October-December 53,888 50,633 69,835 41,020 7,307 6.2 33,713 22.6January-March 51,905 52,722 64,022 41,847 5,786 4.9 36,061 24.2April-June 53,429 61,302 74,823 98,831 60,238 51.3 38,593 25.9July-September 55,968 66,373 103,520 84,776 44,205 37.6 40,571 27.2
Table 3 provides a breakdown of approved petitions in fiscal years 2002 to 2005 by type of petition. Approximately 117,000 H-1B beneficiaries were approved for initial employment and about 150,000 for continuing employment in fiscal year 2005.
The number of aliens outside the United States approved for initial employment decreased from
60,271 to 54,635 in fiscal year 2005. The corresponding numbers for aliens in the United States changing to H-1B status fell from 156,921 in 2004 to 150,204 in 2005.
Table 3. H-1B Petitions Approved by Type: Fiscal Years 2002 to 2005
Type of Petition Petitions Approved
FY 2002 Percent FY 2003 Percent FY 2004 Percent FY 2005 Percent
Total 197,537 100 217,340 100 217,340 100 267,131 100 Initial employment 103,584 52 105,314 48 130,497 45 116,927 44 Aliens outside U.S. 36,494 18 41,895 19 60,271 21 54,635 20 Aliens in U.S. 67,090 34 63,419 29 70,226 24 62,292 23 Continuing employment 93,953 48 112,026 52 156,921 55 150,204 56
Page 7
Country of Birth
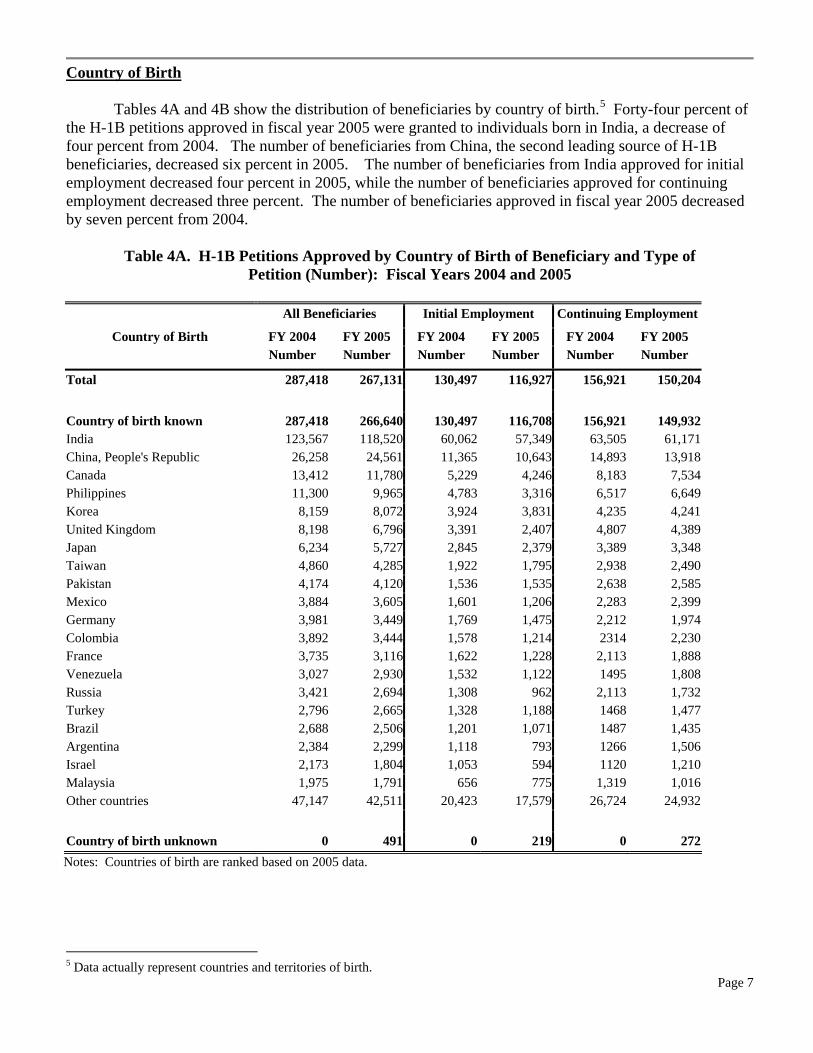
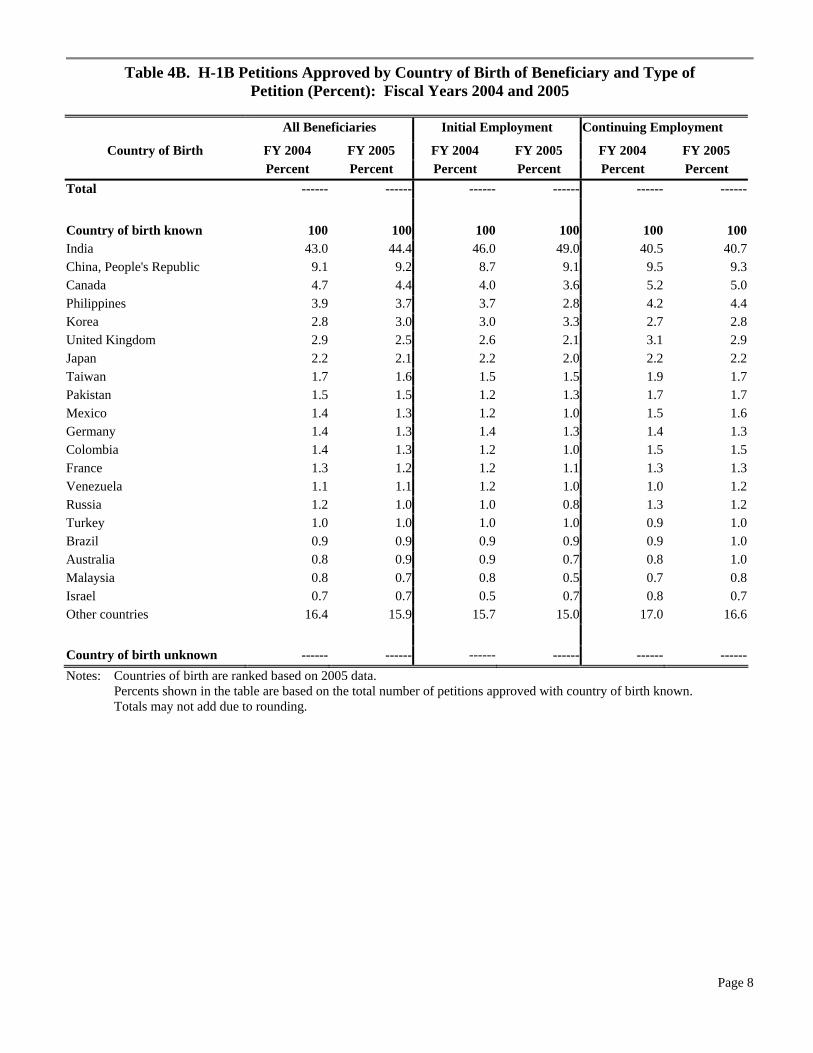
Tables 4A and 4B show the distribution of beneficiaries by country of birth.5 Forty-four percent of the H-1B petitions approved in fiscal year 2005 were granted to individuals born in India, a decrease of four percent from 2004. The number of beneficiaries from China, the second leading source of H-1B beneficiaries, decreased six percent in 2005. The number of beneficiaries from India approved for initial employment decreased four percent in 2005, while the number of beneficiaries approved for continuing employment decreased three percent. The number of beneficiaries approved in fiscal year 2005 decreased by seven percent from 2004.
Table 4A. H-1B Petitions Approved by Country of Birth of Beneficiary and Type of
Petition (Number): Fiscal Years 2004 and 2005
All Beneficiaries Initial Employment Continuing Employment
Country of Birth FY 2004 FY 2005 FY 2004 FY 2005 FY 2004 FY 2005 Number Number Number Number Number Number
Total 287,418 267,131 130,497 116,927 156,921 150,204 Country of birth known 287,418 266,640 130,497 116,708 156,921 149,932India 123,567 118,520 60,062 57,349 63,505 61,171China, People's Republic 26,258 24,561 11,365 10,643 14,893 13,918Canada 13,412 11,780 5,229 4,246 8,183 7,534Philippines 11,300 9,965 4,783 3,316 6,517 6,649Korea 8,159 8,072 3,924 3,831 4,235 4,241United Kingdom 8,198 6,796 3,391 2,407 4,807 4,389Japan 6,234 5,727 2,845 2,379 3,389 3,348Taiwan 4,860 4,285 1,922 1,795 2,938 2,490Pakistan 4,174 4,120 1,536 1,535 2,638 2,585Mexico 3,884 3,605 1,601 1,206 2,283 2,399Germany 3,981 3,449 1,769 1,475 2,212 1,974Colombia 3,892 3,444 1,578 1,214 2314 2,230France 3,735 3,116 1,622 1,228 2,113 1,888Venezuela 3,027 2,930 1,532 1,122 1495 1,808Russia 3,421 2,694 1,308 962 2,113 1,732Turkey 2,796 2,665 1,328 1,188 1468 1,477Brazil 2,688 2,506 1,201 1,071 1487 1,435Argentina 2,384 2,299 1,118 793 1266 1,506Israel 2,173 1,804 1,053 594 1120 1,210Malaysia 1,975 1,791 656 775 1,319 1,016Other countries 47,147 42,511 20,423 17,579 26,724 24,932 Country of birth unknown 0 491 0 219 0 272
Notes: Countries of birth are ranked based on 2005 data.
5 Data actually represent countries and territories of birth.
Page 8
Table 4B. H-1B Petitions Approved by Country of Birth of Beneficiary and Type of Petition (Percent): Fiscal Years 2004 and 2005
All Beneficiaries Initial Employment Continuing Employment
Country of Birth FY 2004 FY 2005 FY 2004 FY 2005 FY 2004 FY 2005 Percent Percent Percent Percent Percent Percent Total ------ ------ ------ ------ ------ ------
Country of birth known 100 100 100 100 100 100India 43.0 44.4 46.0 49.0 40.5 40.7China, People's Republic 9.1 9.2 8.7 9.1 9.5 9.3Canada 4.7 4.4 4.0 3.6 5.2 5.0Philippines 3.9 3.7 3.7 2.8 4.2 4.4Korea 2.8 3.0 3.0 3.3 2.7 2.8United Kingdom 2.9 2.5 2.6 2.1 3.1 2.9Japan 2.2 2.1 2.2 2.0 2.2 2.2Taiwan 1.7 1.6 1.5 1.5 1.9 1.7Pakistan 1.5 1.5 1.2 1.3 1.7 1.7Mexico 1.4 1.3 1.2 1.0 1.5 1.6Germany 1.4 1.3 1.4 1.3 1.4 1.3Colombia 1.4 1.3 1.2 1.0 1.5 1.5France 1.3 1.2 1.2 1.1 1.3 1.3Venezuela 1.1 1.1 1.2 1.0 1.0 1.2Russia 1.2 1.0 1.0 0.8 1.3 1.2Turkey 1.0 1.0 1.0 1.0 0.9 1.0Brazil 0.9 0.9 0.9 0.9 0.9 1.0Australia 0.8 0.9 0.9 0.7 0.8 1.0Malaysia 0.8 0.7 0.8 0.5 0.7 0.8Israel 0.7 0.7 0.5 0.7 0.8 0.7Other countries 16.4 15.9 15.7 15.0 17.0 16.6 Country of birth unknown ------ ------ ------ ------ ------ ------Notes: Countries of birth are ranked based on 2005 data.
Percents shown in the table are based on the total number of petitions approved with country of birth known. Totals may not add due to rounding.
Page 9
Age
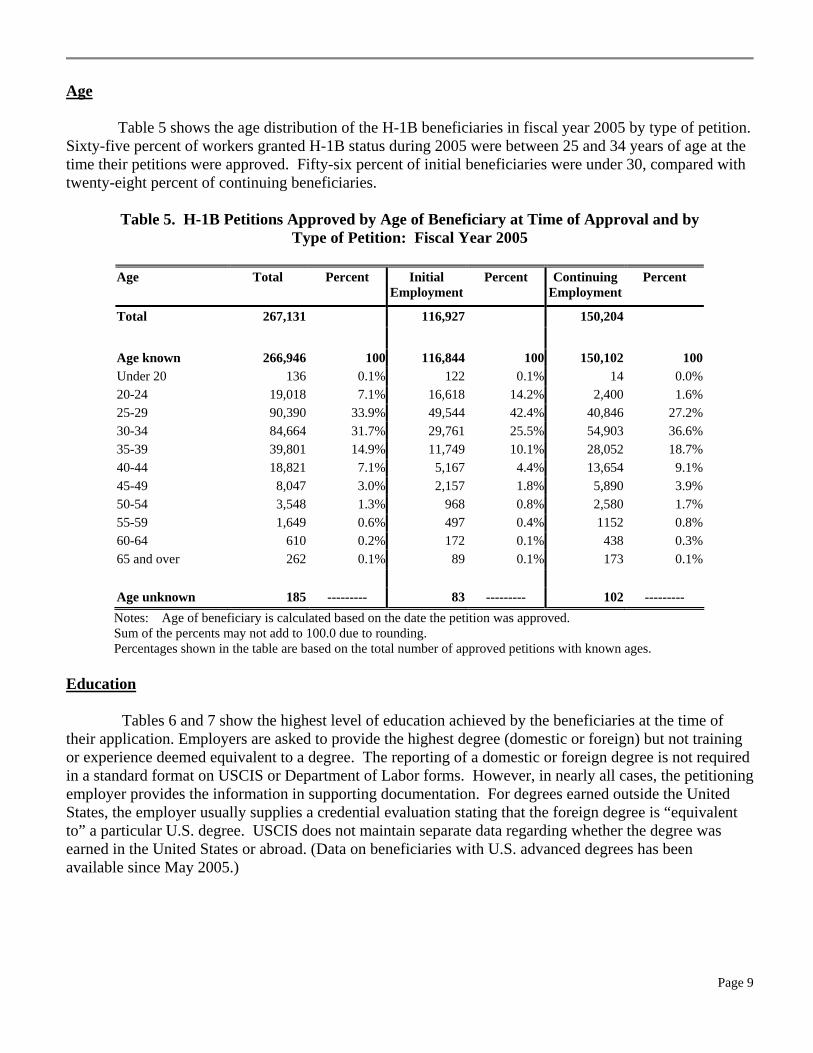
Table 5 shows the age distribution of the H-1B beneficiaries in fiscal year 2005 by type of petition. Sixty-five percent of workers granted H-1B status during 2005 were between 25 and 34 years of age at the time their petitions were approved. Fifty-six percent of initial beneficiaries were under 30, compared with twenty-eight percent of continuing beneficiaries.
Table 5. H-1B Petitions Approved by Age of Beneficiary at Time of Approval and by
Type of Petition: Fiscal Year 2005
Age Total Percent Initial Employment
Percent Continuing Employment
Percent
Total 267,131 116,927 150,204 Age known 266,946 100 116,844 100 150,102 100Under 20 136 0.1% 122 0.1% 14 0.0%20-24 19,018 7.1% 16,618 14.2% 2,400 1.6%25-29 90,390 33.9% 49,544 42.4% 40,846 27.2%30-34 84,664 31.7% 29,761 25.5% 54,903 36.6%35-39 39,801 14.9% 11,749 10.1% 28,052 18.7%40-44 18,821 7.1% 5,167 4.4% 13,654 9.1%45-49 8,047 3.0% 2,157 1.8% 5,890 3.9%50-54 3,548 1.3% 968 0.8% 2,580 1.7%55-59 1,649 0.6% 497 0.4% 1152 0.8%60-64 610 0.2% 172 0.1% 438 0.3%65 and over 262 0.1% 89 0.1% 173 0.1% Age unknown 185 --------- 83 --------- 102 ---------
Notes: Age of beneficiary is calculated based on the date the petition was approved. Sum of the percents may not add to 100.0 due to rounding.
Percentages shown in the table are based on the total number of approved petitions with known ages. Education
Tables 6 and 7 show the highest level of education achieved by the beneficiaries at the time of their application. Employers are asked to provide the highest degree (domestic or foreign) but not training or experience deemed equivalent to a degree. The reporting of a domestic or foreign degree is not required in a standard format on USCIS or Department of Labor forms. However, in nearly all cases, the petitioning employer provides the information in supporting documentation. For degrees earned outside the United States, the employer usually supplies a credential evaluation stating that the foreign degree is “equivalent to” a particular U.S. degree. USCIS does not maintain separate data regarding whether the degree was earned in the United States or abroad. (Data on beneficiaries with U.S. advanced degrees has been available since May 2005.)
Page 10
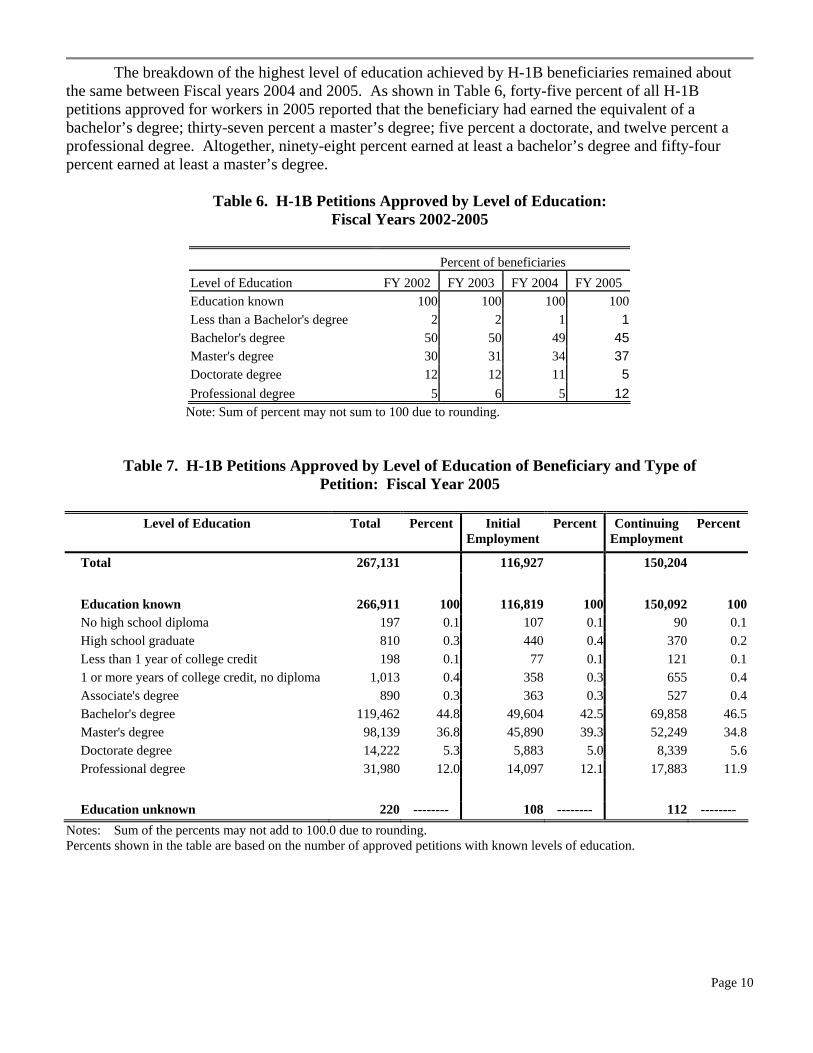
The breakdown of the highest level of education achieved by H-1B beneficiaries remained about the same between Fiscal years 2004 and 2005. As shown in Table 6, forty-five percent of all H-1B petitions approved for workers in 2005 reported that the beneficiary had earned the equivalent of a bachelor’s degree; thirty-seven percent a master’s degree; five percent a doctorate, and twelve percent a professional degree. Altogether, ninety-eight percent earned at least a bachelor’s degree and fifty-four percent earned at least a master’s degree.
Table 6. H-1B Petitions Approved by Level of Education: Fiscal Years 2002-2005
Percent of beneficiaries Level of Education FY 2002 FY 2003 FY 2004 FY 2005 Education known 100 100 100 100 Less than a Bachelor's degree 2 2 1 1 Bachelor's degree 50 50 49 45 Master's degree 30 31 34 37 Doctorate degree 12 12 11 5 Professional degree 5 6 5 12
Note: Sum of percent may not sum to 100 due to rounding.
Table 7. H-1B Petitions Approved by Level of Education of Beneficiary and Type of Petition: Fiscal Year 2005
Level of Education Total Percent Initial
EmploymentPercent Continuing
EmploymentPercent
Total 267,131 116,927 150,204 Education known 266,911 100 116,819 100 150,092 100No high school diploma 197 0.1 107 0.1 90 0.1High school graduate 810 0.3 440 0.4 370 0.2Less than 1 year of college credit 198 0.1 77 0.1 121 0.11 or more years of college credit, no diploma 1,013 0.4 358 0.3 655 0.4Associate's degree 890 0.3 363 0.3 527 0.4Bachelor's degree 119,462 44.8 49,604 42.5 69,858 46.5Master's degree 98,139 36.8 45,890 39.3 52,249 34.8Doctorate degree 14,222 5.3 5,883 5.0 8,339 5.6Professional degree 31,980 12.0 14,097 12.1 17,883 11.9 Education unknown 220 -------- 108 -------- 112 --------
Notes: Sum of the percents may not add to 100.0 due to rounding. Percents shown in the table are based on the number of approved petitions with known levels of education.
Page 11
Occupation - Occupation Category
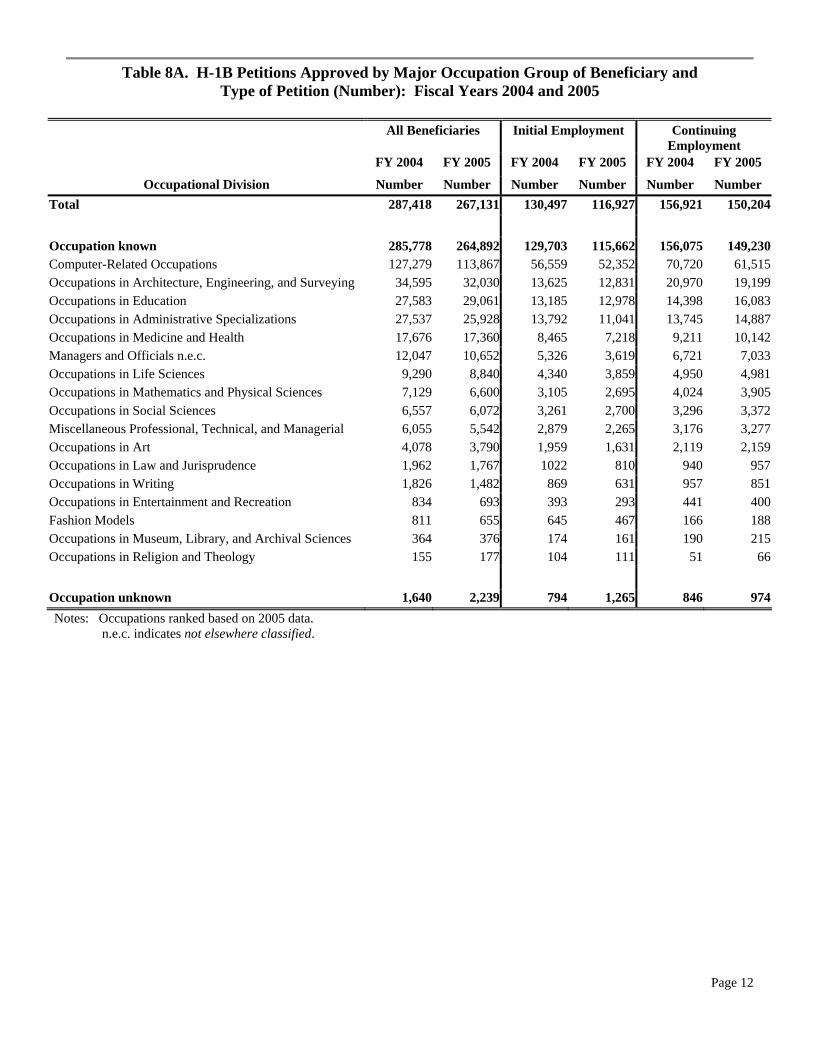
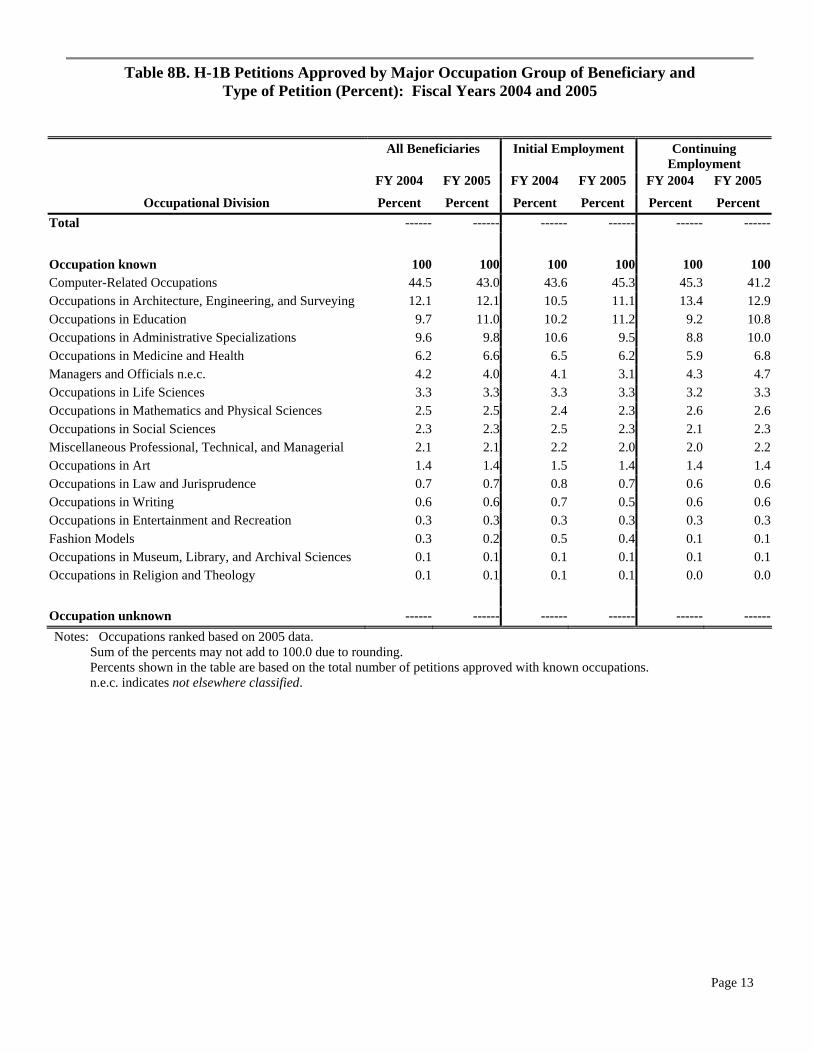
Tables 8A and 8B shows the distribution of beneficiaries by occupation category for fiscal year 2005. The petitioning employer supplies the occupation code on the Labor Condition Application (LCA).6 Computer-related occupations were the most numerous occupation category in 2005; their share of total petitions approved decreased from 45 percent in 2004 to 43 percent in fiscal year 2005. The corresponding percentages for initial employment and continuing employment in computer-related occupations were 45 and 41 percent, respectively. Fifteen of the seventeen occupation categories had more continuing than initial H-1B beneficiaries. One category – namely, occupations in architecture, engineering and surveying - had 53 percent more continuing than initial beneficiaries.
The number of H-1B petitions approved for workers in computer-related occupations decreased eleven percent from 127,279 in 2004 to 113,867 in 2005. The majority of occupation groups decreased between 2004 and 2005. The only exceptions were occupations in education (5 percent); occupations in museum, library, and archival sciences (3 percent); and occupations in religion and theology (14 percent).
6 H-1B status requires a sponsoring U.S. employer. The employer must file a Labor Condition Application (LCA) with the Department of Labor attesting to several items, including payment of prevailing wages for the position, and the working conditions offered.
Page 12
Table 8A. H-1B Petitions Approved by Major Occupation Group of Beneficiary and Type of Petition (Number): Fiscal Years 2004 and 2005
All Beneficiaries Initial Employment Continuing
Employment FY 2004 FY 2005 FY 2004 FY 2005 FY 2004 FY 2005
Occupational Division Number Number Number Number Number Number Total 287,418 267,131 130,497 116,927 156,921 150,204
Occupation known 285,778 264,892 129,703 115,662 156,075 149,230Computer-Related Occupations 127,279 113,867 56,559 52,352 70,720 61,515Occupations in Architecture, Engineering, and Surveying 34,595 32,030 13,625 12,831 20,970 19,199Occupations in Education 27,583 29,061 13,185 12,978 14,398 16,083Occupations in Administrative Specializations 27,537 25,928 13,792 11,041 13,745 14,887Occupations in Medicine and Health 17,676 17,360 8,465 7,218 9,211 10,142Managers and Officials n.e.c. 12,047 10,652 5,326 3,619 6,721 7,033Occupations in Life Sciences 9,290 8,840 4,340 3,859 4,950 4,981Occupations in Mathematics and Physical Sciences 7,129 6,600 3,105 2,695 4,024 3,905Occupations in Social Sciences 6,557 6,072 3,261 2,700 3,296 3,372Miscellaneous Professional, Technical, and Managerial 6,055 5,542 2,879 2,265 3,176 3,277Occupations in Art 4,078 3,790 1,959 1,631 2,119 2,159Occupations in Law and Jurisprudence 1,962 1,767 1022 810 940 957Occupations in Writing 1,826 1,482 869 631 957 851Occupations in Entertainment and Recreation 834 693 393 293 441 400Fashion Models 811 655 645 467 166 188Occupations in Museum, Library, and Archival Sciences 364 376 174 161 190 215Occupations in Religion and Theology 155 177 104 111 51 66
Occupation unknown 1,640 2,239 794 1,265 846 974Notes: Occupations ranked based on 2005 data.
n.e.c. indicates not elsewhere classified.
Page 13
Table 8B. H-1B Petitions Approved by Major Occupation Group of Beneficiary and Type of Petition (Percent): Fiscal Years 2004 and 2005
All Beneficiaries Initial Employment Continuing Employment
FY 2004 FY 2005 FY 2004 FY 2005 FY 2004 FY 2005
Occupational Division Percent Percent Percent Percent Percent Percent Total ------ ------ ------ ------ ------ ------
Occupation known 100 100 100 100 100 100Computer-Related Occupations 44.5 43.0 43.6 45.3 45.3 41.2Occupations in Architecture, Engineering, and Surveying 12.1 12.1 10.5 11.1 13.4 12.9Occupations in Education 9.7 11.0 10.2 11.2 9.2 10.8Occupations in Administrative Specializations 9.6 9.8 10.6 9.5 8.8 10.0Occupations in Medicine and Health 6.2 6.6 6.5 6.2 5.9 6.8Managers and Officials n.e.c. 4.2 4.0 4.1 3.1 4.3 4.7Occupations in Life Sciences 3.3 3.3 3.3 3.3 3.2 3.3Occupations in Mathematics and Physical Sciences 2.5 2.5 2.4 2.3 2.6 2.6Occupations in Social Sciences 2.3 2.3 2.5 2.3 2.1 2.3Miscellaneous Professional, Technical, and Managerial 2.1 2.1 2.2 2.0 2.0 2.2Occupations in Art 1.4 1.4 1.5 1.4 1.4 1.4Occupations in Law and Jurisprudence 0.7 0.7 0.8 0.7 0.6 0.6Occupations in Writing 0.6 0.6 0.7 0.5 0.6 0.6Occupations in Entertainment and Recreation 0.3 0.3 0.3 0.3 0.3 0.3Fashion Models 0.3 0.2 0.5 0.4 0.1 0.1Occupations in Museum, Library, and Archival Sciences 0.1 0.1 0.1 0.1 0.1 0.1Occupations in Religion and Theology 0.1 0.1 0.1 0.1 0.0 0.0
Occupation unknown ------ ------ ------ ------ ------ ------Notes: Occupations ranked based on 2005 data.
Sum of the percents may not add to 100.0 due to rounding. Percents shown in the table are based on the total number of petitions approved with known occupations. n.e.c. indicates not elsewhere classified.
Page 14
- Detailed Occupation
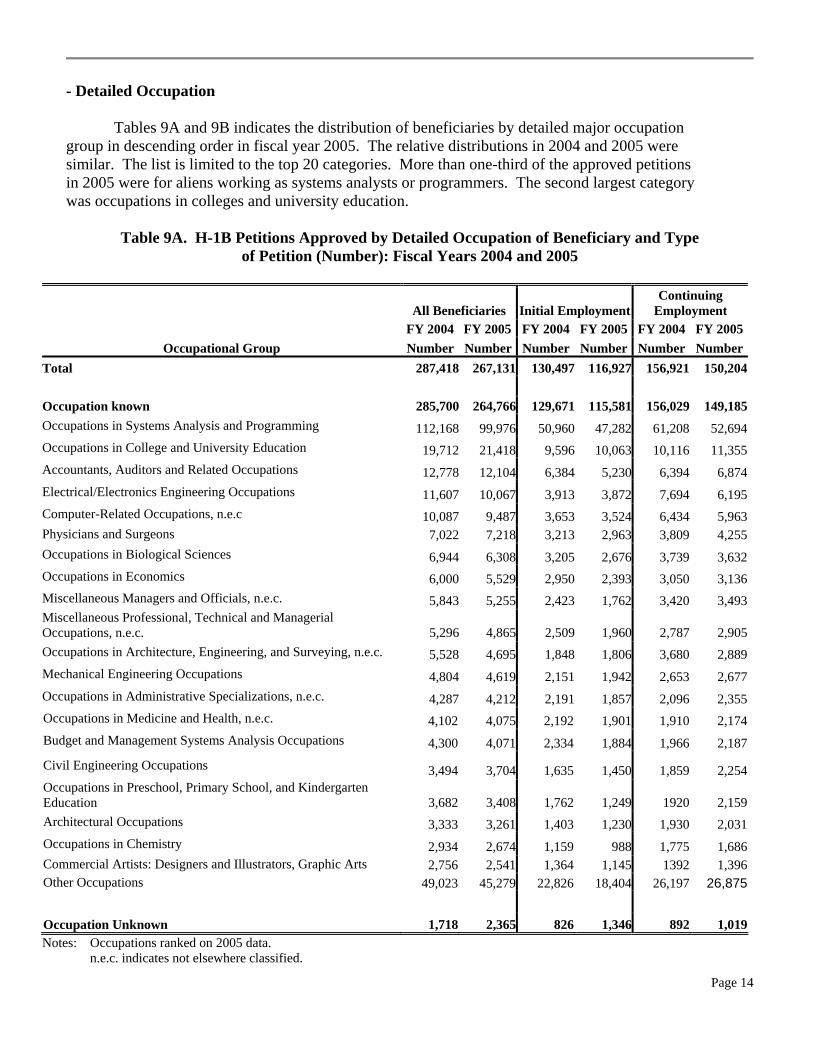
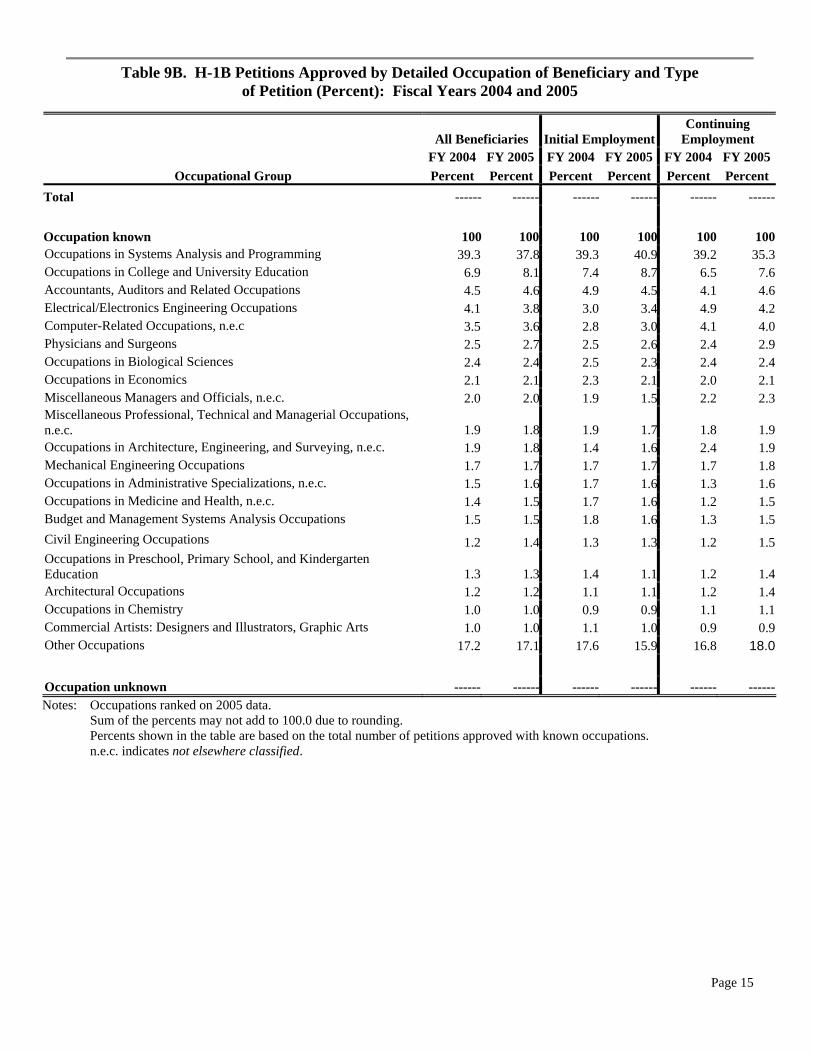
Tables 9A and 9B indicates the distribution of beneficiaries by detailed major occupation group in descending order in fiscal year 2005. The relative distributions in 2004 and 2005 were similar. The list is limited to the top 20 categories. More than one-third of the approved petitions in 2005 were for aliens working as systems analysts or programmers. The second largest category was occupations in colleges and university education.
Table 9A. H-1B Petitions Approved by Detailed Occupation of Beneficiary and Type
of Petition (Number): Fiscal Years 2004 and 2005
All Beneficiaries Initial Employment Continuing
Employment FY 2004 FY 2005 FY 2004 FY 2005 FY 2004 FY 2005
Occupational Group Number Number Number Number Number NumberTotal 287,418 267,131 130,497 116,927 156,921 150,204 Occupation known 285,700 264,766 129,671 115,581 156,029 149,185Occupations in Systems Analysis and Programming 112,168 99,976 50,960 47,282 61,208 52,694Occupations in College and University Education 19,712 21,418 9,596 10,063 10,116 11,355Accountants, Auditors and Related Occupations 12,778 12,104 6,384 5,230 6,394 6,874Electrical/Electronics Engineering Occupations 11,607 10,067 3,913 3,872 7,694 6,195Computer-Related Occupations, n.e.c 10,087 9,487 3,653 3,524 6,434 5,963Physicians and Surgeons 7,022 7,218 3,213 2,963 3,809 4,255Occupations in Biological Sciences 6,944 6,308 3,205 2,676 3,739 3,632Occupations in Economics 6,000 5,529 2,950 2,393 3,050 3,136Miscellaneous Managers and Officials, n.e.c. 5,843 5,255 2,423 1,762 3,420 3,493Miscellaneous Professional, Technical and Managerial Occupations, n.e.c. 5,296 4,865 2,509 1,960 2,787 2,905Occupations in Architecture, Engineering, and Surveying, n.e.c. 5,528 4,695 1,848 1,806 3,680 2,889Mechanical Engineering Occupations 4,804 4,619 2,151 1,942 2,653 2,677Occupations in Administrative Specializations, n.e.c. 4,287 4,212 2,191 1,857 2,096 2,355Occupations in Medicine and Health, n.e.c. 4,102 4,075 2,192 1,901 1,910 2,174Budget and Management Systems Analysis Occupations 4,300 4,071 2,334 1,884 1,966 2,187
Civil Engineering Occupations 3,494 3,704 1,635 1,450 1,859 2,254Occupations in Preschool, Primary School, and Kindergarten Education 3,682 3,408 1,762 1,249 1920 2,159Architectural Occupations 3,333 3,261 1,403 1,230 1,930 2,031Occupations in Chemistry 2,934 2,674 1,159 988 1,775 1,686Commercial Artists: Designers and Illustrators, Graphic Arts 2,756 2,541 1,364 1,145 1392 1,396Other Occupations 49,023 45,279 22,826 18,404 26,197 26,875 Occupation Unknown 1,718 2,365 826 1,346 892 1,019Notes: Occupations ranked on 2005 data. n.e.c. indicates not elsewhere classified.
Page 15
Table 9B. H-1B Petitions Approved by Detailed Occupation of Beneficiary and Type of Petition (Percent): Fiscal Years 2004 and 2005
All Beneficiaries Initial EmploymentContinuing
Employment FY 2004 FY 2005 FY 2004 FY 2005 FY 2004 FY 2005
Occupational Group Percent Percent Percent Percent Percent Percent Total ------ ------ ------ ------ ------ ------ Occupation known 100 100 100 100 100 100Occupations in Systems Analysis and Programming 39.3 37.8 39.3 40.9 39.2 35.3Occupations in College and University Education 6.9 8.1 7.4 8.7 6.5 7.6Accountants, Auditors and Related Occupations 4.5 4.6 4.9 4.5 4.1 4.6Electrical/Electronics Engineering Occupations 4.1 3.8 3.0 3.4 4.9 4.2Computer-Related Occupations, n.e.c 3.5 3.6 2.8 3.0 4.1 4.0Physicians and Surgeons 2.5 2.7 2.5 2.6 2.4 2.9Occupations in Biological Sciences 2.4 2.4 2.5 2.3 2.4 2.4Occupations in Economics 2.1 2.1 2.3 2.1 2.0 2.1Miscellaneous Managers and Officials, n.e.c. 2.0 2.0 1.9 1.5 2.2 2.3Miscellaneous Professional, Technical and Managerial Occupations, n.e.c. 1.9 1.8 1.9 1.7 1.8 1.9Occupations in Architecture, Engineering, and Surveying, n.e.c. 1.9 1.8 1.4 1.6 2.4 1.9Mechanical Engineering Occupations 1.7 1.7 1.7 1.7 1.7 1.8Occupations in Administrative Specializations, n.e.c. 1.5 1.6 1.7 1.6 1.3 1.6Occupations in Medicine and Health, n.e.c. 1.4 1.5 1.7 1.6 1.2 1.5Budget and Management Systems Analysis Occupations 1.5 1.5 1.8 1.6 1.3 1.5Civil Engineering Occupations 1.2 1.4 1.3 1.3 1.2 1.5Occupations in Preschool, Primary School, and Kindergarten Education 1.3 1.3 1.4 1.1 1.2 1.4Architectural Occupations 1.2 1.2 1.1 1.1 1.2 1.4Occupations in Chemistry 1.0 1.0 0.9 0.9 1.1 1.1Commercial Artists: Designers and Illustrators, Graphic Arts 1.0 1.0 1.1 1.0 0.9 0.9Other Occupations 17.2 17.1 17.6 15.9 16.8 18.0 Occupation unknown ------ ------ ------ ------ ------ ------Notes: Occupations ranked on 2005 data. Sum of the percents may not add to 100.0 due to rounding. Percents shown in the table are based on the total number of petitions approved with known occupations.
n.e.c. indicates not elsewhere classified.
Page 16
Annual Compensation 7
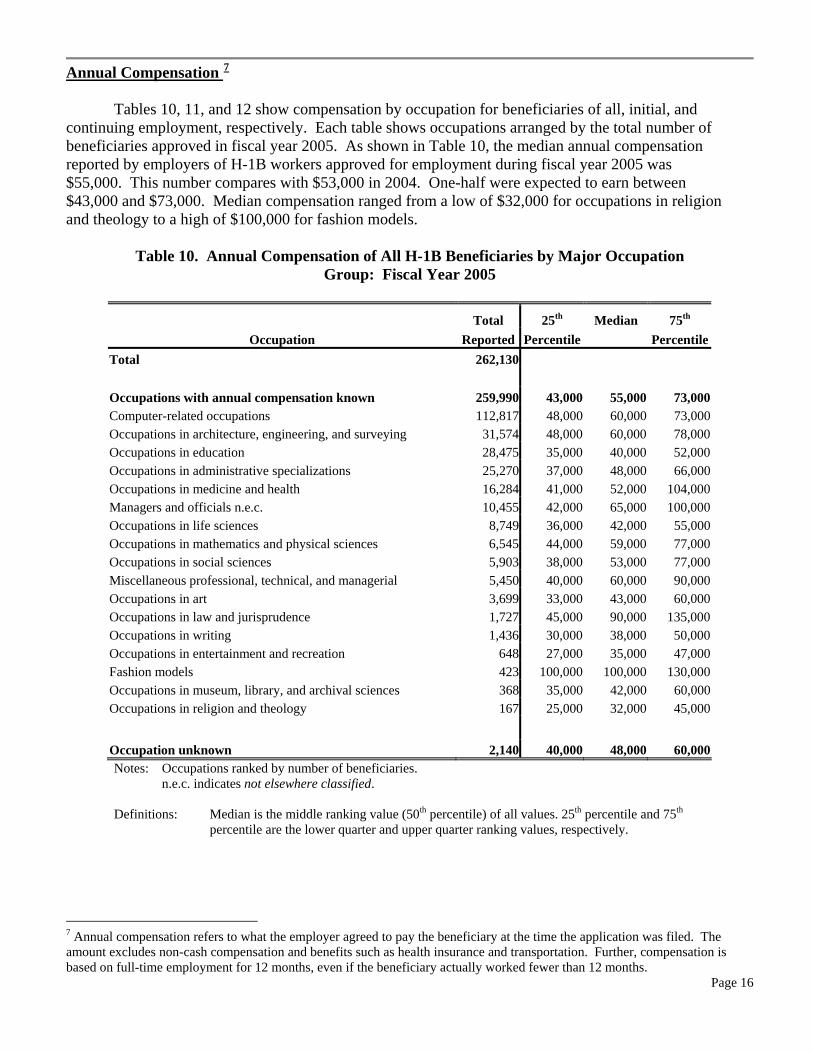
Tables 10, 11, and 12 show compensation by occupation for beneficiaries of all, initial, and continuing employment, respectively. Each table shows occupations arranged by the total number of beneficiaries approved in fiscal year 2005. As shown in Table 10, the median annual compensation reported by employers of H-1B workers approved for employment during fiscal year 2005 was $55,000. This number compares with $53,000 in 2004. One-half were expected to earn between $43,000 and $73,000. Median compensation ranged from a low of $32,000 for occupations in religion and theology to a high of $100,000 for fashion models.
Table 10. Annual Compensation of All H-1B Beneficiaries by Major Occupation
Group: Fiscal Year 2005
Total 25th Median 75th Occupation Reported Percentile Percentile
Total 262,130 Occupations with annual compensation known 259,990 43,000 55,000 73,000Computer-related occupations 112,817 48,000 60,000 73,000Occupations in architecture, engineering, and surveying 31,574 48,000 60,000 78,000Occupations in education 28,475 35,000 40,000 52,000Occupations in administrative specializations 25,270 37,000 48,000 66,000Occupations in medicine and health 16,284 41,000 52,000 104,000Managers and officials n.e.c. 10,455 42,000 65,000 100,000Occupations in life sciences 8,749 36,000 42,000 55,000Occupations in mathematics and physical sciences 6,545 44,000 59,000 77,000Occupations in social sciences 5,903 38,000 53,000 77,000Miscellaneous professional, technical, and managerial 5,450 40,000 60,000 90,000Occupations in art 3,699 33,000 43,000 60,000Occupations in law and jurisprudence 1,727 45,000 90,000 135,000Occupations in writing 1,436 30,000 38,000 50,000Occupations in entertainment and recreation 648 27,000 35,000 47,000Fashion models 423 100,000 100,000 130,000Occupations in museum, library, and archival sciences 368 35,000 42,000 60,000Occupations in religion and theology 167 25,000 32,000 45,000 Occupation unknown 2,140 40,000 48,000 60,000Notes: Occupations ranked by number of beneficiaries.
n.e.c. indicates not elsewhere classified.
Definitions: Median is the middle ranking value (50th percentile) of all values. 25th percentile and 75th percentile are the lower quarter and upper quarter ranking values, respectively.
7 Annual compensation refers to what the employer agreed to pay the beneficiary at the time the application was filed. The amount excludes non-cash compensation and benefits such as health insurance and transportation. Further, compensation is based on full-time employment for 12 months, even if the beneficiary actually worked fewer than 12 months.
Page 17
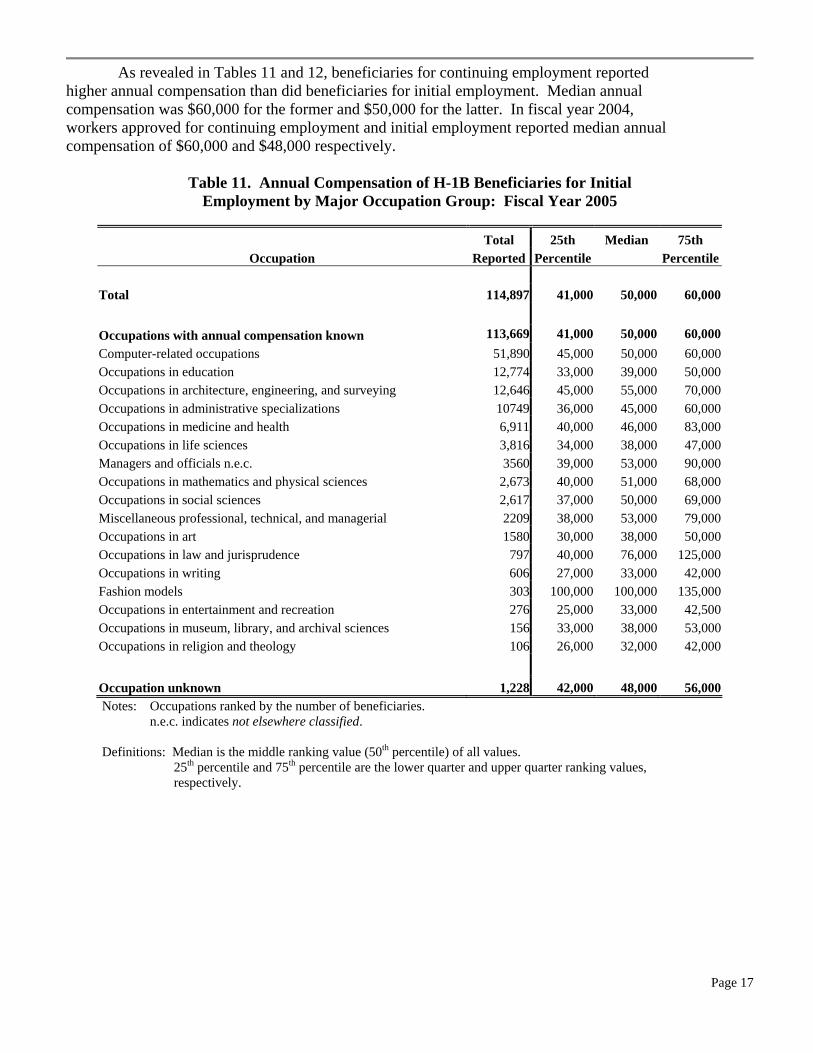
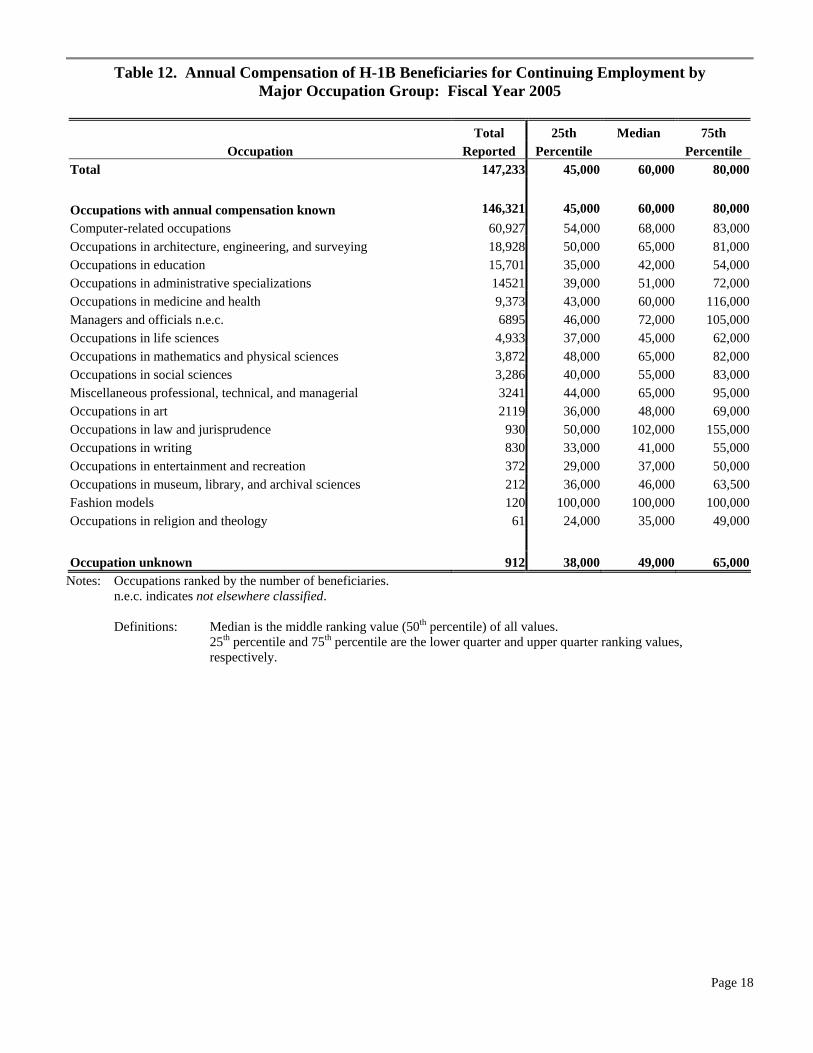
As revealed in Tables 11 and 12, beneficiaries for continuing employment reported higher annual compensation than did beneficiaries for initial employment. Median annual compensation was $60,000 for the former and $50,000 for the latter. In fiscal year 2004, workers approved for continuing employment and initial employment reported median annual compensation of $60,000 and $48,000 respectively.
Table 11. Annual Compensation of H-1B Beneficiaries for Initial Employment by Major Occupation Group: Fiscal Year 2005
Total 25th Median 75th Occupation Reported Percentile Percentile
Total 114,897 41,000 50,000 60,000 Occupations with annual compensation known 113,669 41,000 50,000 60,000Computer-related occupations 51,890 45,000 50,000 60,000Occupations in education 12,774 33,000 39,000 50,000Occupations in architecture, engineering, and surveying 12,646 45,000 55,000 70,000Occupations in administrative specializations 10749 36,000 45,000 60,000Occupations in medicine and health 6,911 40,000 46,000 83,000Occupations in life sciences 3,816 34,000 38,000 47,000Managers and officials n.e.c. 3560 39,000 53,000 90,000Occupations in mathematics and physical sciences 2,673 40,000 51,000 68,000Occupations in social sciences 2,617 37,000 50,000 69,000Miscellaneous professional, technical, and managerial 2209 38,000 53,000 79,000Occupations in art 1580 30,000 38,000 50,000Occupations in law and jurisprudence 797 40,000 76,000 125,000Occupations in writing 606 27,000 33,000 42,000Fashion models 303 100,000 100,000 135,000Occupations in entertainment and recreation 276 25,000 33,000 42,500Occupations in museum, library, and archival sciences 156 33,000 38,000 53,000Occupations in religion and theology 106 26,000 32,000 42,000 Occupation unknown 1,228 42,000 48,000 56,000Notes: Occupations ranked by the number of beneficiaries.
n.e.c. indicates not elsewhere classified.
Definitions: Median is the middle ranking value (50th percentile) of all values. 25th percentile and 75th percentile are the lower quarter and upper quarter ranking values, respectively.
Page 18
Table 12. Annual Compensation of H-1B Beneficiaries for Continuing Employment by Major Occupation Group: Fiscal Year 2005
Total 25th Median 75th
Occupation Reported Percentile Percentile Total 147,233 45,000 60,000 80,000 Occupations with annual compensation known 146,321 45,000 60,000 80,000Computer-related occupations 60,927 54,000 68,000 83,000Occupations in architecture, engineering, and surveying 18,928 50,000 65,000 81,000Occupations in education 15,701 35,000 42,000 54,000Occupations in administrative specializations 14521 39,000 51,000 72,000Occupations in medicine and health 9,373 43,000 60,000 116,000Managers and officials n.e.c. 6895 46,000 72,000 105,000Occupations in life sciences 4,933 37,000 45,000 62,000Occupations in mathematics and physical sciences 3,872 48,000 65,000 82,000Occupations in social sciences 3,286 40,000 55,000 83,000Miscellaneous professional, technical, and managerial 3241 44,000 65,000 95,000Occupations in art 2119 36,000 48,000 69,000Occupations in law and jurisprudence 930 50,000 102,000 155,000Occupations in writing 830 33,000 41,000 55,000Occupations in entertainment and recreation 372 29,000 37,000 50,000Occupations in museum, library, and archival sciences 212 36,000 46,000 63,500Fashion models 120 100,000 100,000 100,000Occupations in religion and theology 61 24,000 35,000 49,000 Occupation unknown 912 38,000 49,000 65,000
Notes: Occupations ranked by the number of beneficiaries. n.e.c. indicates not elsewhere classified. Definitions: Median is the middle ranking value (50th percentile) of all values.
25th percentile and 75th percentile are the lower quarter and upper quarter ranking values, respectively.
Page 19
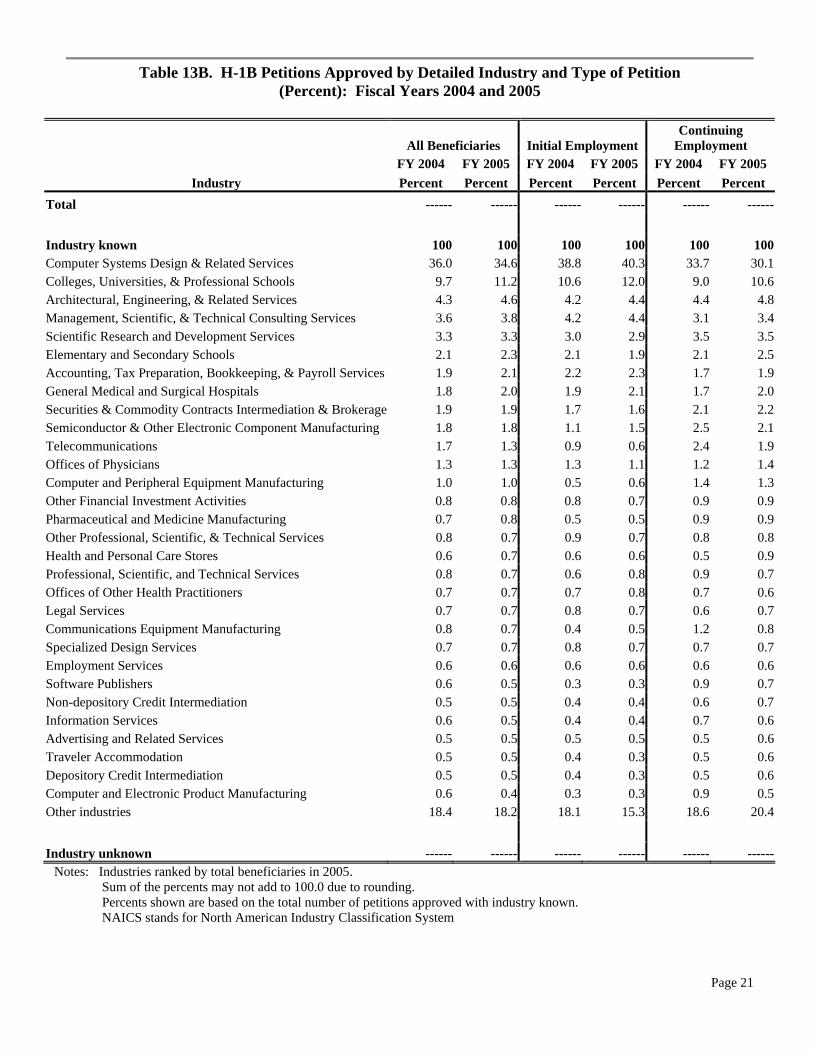
Industry
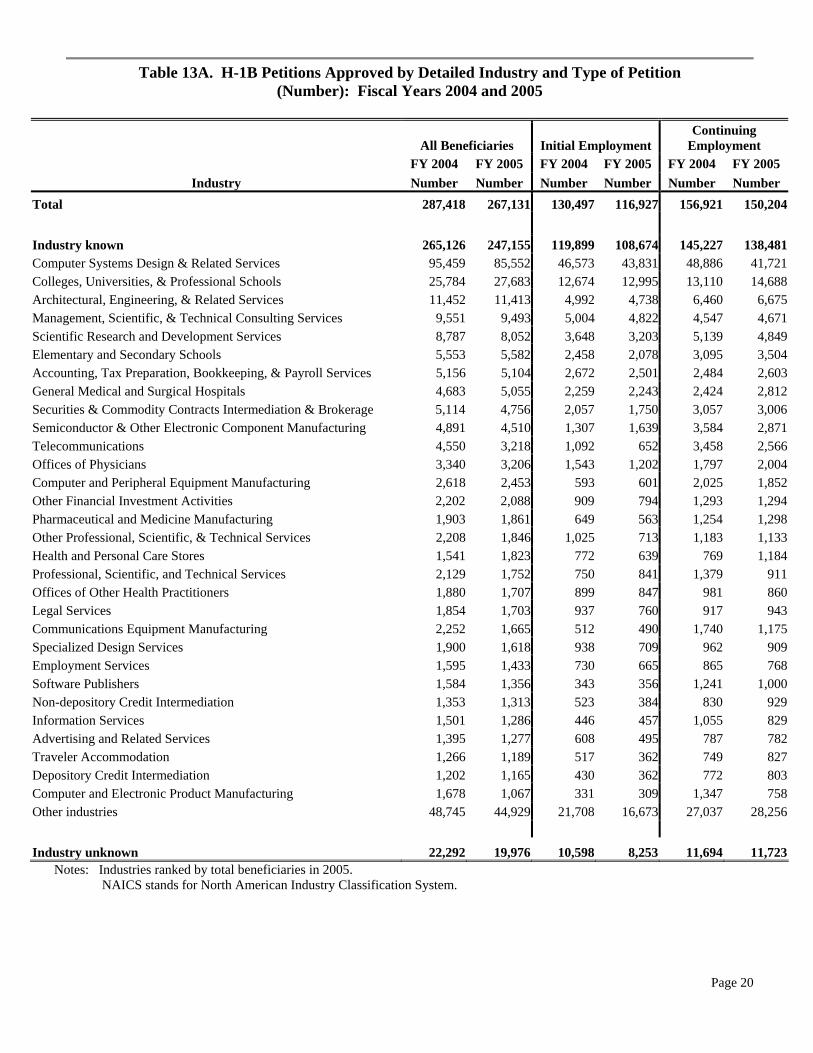
Tables 13A and 13B shows the industries that employed the most H-1B workers in fiscal year 2005. The number of workers approved for all industries decreased seven percent from 287,418 in fiscal year 2004 to 267,131 in fiscal year 2005. The largest decrease for the top 10 industries was in computer systems design, and related services (-10 percent). Among the remaining top ten industries, scientific research and development services (-8 percent); semiconductor and other electronic component manufacturing (-7 percent); and securities and commodity contracts intermediation and brokerage (-7 percent) experienced the largest decreases.
Industry data are collected using the North American Industry Classification System (NAICS). Unlike country of birth, age, education, and occupation, USCIS does not verify the NAICS code because the sponsor does not provide supporting documentation.
Page 20
Table 13A. H-1B Petitions Approved by Detailed Industry and Type of Petition (Number): Fiscal Years 2004 and 2005
All Beneficiaries Initial Employment Continuing
Employment FY 2004 FY 2005 FY 2004 FY 2005 FY 2004 FY 2005
Industry Number Number Number Number Number Number Total 287,418 267,131 130,497 116,927 156,921 150,204
Industry known 265,126 247,155 119,899 108,674 145,227 138,481Computer Systems Design & Related Services 95,459 85,552 46,573 43,831 48,886 41,721Colleges, Universities, & Professional Schools 25,784 27,683 12,674 12,995 13,110 14,688Architectural, Engineering, & Related Services 11,452 11,413 4,992 4,738 6,460 6,675Management, Scientific, & Technical Consulting Services 9,551 9,493 5,004 4,822 4,547 4,671Scientific Research and Development Services 8,787 8,052 3,648 3,203 5,139 4,849Elementary and Secondary Schools 5,553 5,582 2,458 2,078 3,095 3,504Accounting, Tax Preparation, Bookkeeping, & Payroll Services 5,156 5,104 2,672 2,501 2,484 2,603General Medical and Surgical Hospitals 4,683 5,055 2,259 2,243 2,424 2,812Securities & Commodity Contracts Intermediation & Brokerage 5,114 4,756 2,057 1,750 3,057 3,006Semiconductor & Other Electronic Component Manufacturing 4,891 4,510 1,307 1,639 3,584 2,871Telecommunications 4,550 3,218 1,092 652 3,458 2,566Offices of Physicians 3,340 3,206 1,543 1,202 1,797 2,004Computer and Peripheral Equipment Manufacturing 2,618 2,453 593 601 2,025 1,852Other Financial Investment Activities 2,202 2,088 909 794 1,293 1,294Pharmaceutical and Medicine Manufacturing 1,903 1,861 649 563 1,254 1,298Other Professional, Scientific, & Technical Services 2,208 1,846 1,025 713 1,183 1,133Health and Personal Care Stores 1,541 1,823 772 639 769 1,184Professional, Scientific, and Technical Services 2,129 1,752 750 841 1,379 911Offices of Other Health Practitioners 1,880 1,707 899 847 981 860Legal Services 1,854 1,703 937 760 917 943Communications Equipment Manufacturing 2,252 1,665 512 490 1,740 1,175Specialized Design Services 1,900 1,618 938 709 962 909Employment Services 1,595 1,433 730 665 865 768Software Publishers 1,584 1,356 343 356 1,241 1,000Non-depository Credit Intermediation 1,353 1,313 523 384 830 929Information Services 1,501 1,286 446 457 1,055 829Advertising and Related Services 1,395 1,277 608 495 787 782Traveler Accommodation 1,266 1,189 517 362 749 827Depository Credit Intermediation 1,202 1,165 430 362 772 803Computer and Electronic Product Manufacturing 1,678 1,067 331 309 1,347 758Other industries 48,745 44,929 21,708 16,673 27,037 28,256
Industry unknown 22,292 19,976 10,598 8,253 11,694 11,723Notes: Industries ranked by total beneficiaries in 2005.
NAICS stands for North American Industry Classification System.
Page 21
Table 13B. H-1B Petitions Approved by Detailed Industry and Type of Petition (Percent): Fiscal Years 2004 and 2005
All Beneficiaries Initial Employment Continuing
Employment FY 2004 FY 2005 FY 2004 FY 2005 FY 2004 FY 2005
Industry Percent Percent Percent Percent Percent Percent Total ------ ------ ------ ------ ------ ------
Industry known 100 100 100 100 100 100Computer Systems Design & Related Services 36.0 34.6 38.8 40.3 33.7 30.1Colleges, Universities, & Professional Schools 9.7 11.2 10.6 12.0 9.0 10.6Architectural, Engineering, & Related Services 4.3 4.6 4.2 4.4 4.4 4.8Management, Scientific, & Technical Consulting Services 3.6 3.8 4.2 4.4 3.1 3.4Scientific Research and Development Services 3.3 3.3 3.0 2.9 3.5 3.5Elementary and Secondary Schools 2.1 2.3 2.1 1.9 2.1 2.5Accounting, Tax Preparation, Bookkeeping, & Payroll Services 1.9 2.1 2.2 2.3 1.7 1.9General Medical and Surgical Hospitals 1.8 2.0 1.9 2.1 1.7 2.0Securities & Commodity Contracts Intermediation & Brokerage 1.9 1.9 1.7 1.6 2.1 2.2Semiconductor & Other Electronic Component Manufacturing 1.8 1.8 1.1 1.5 2.5 2.1Telecommunications 1.7 1.3 0.9 0.6 2.4 1.9Offices of Physicians 1.3 1.3 1.3 1.1 1.2 1.4Computer and Peripheral Equipment Manufacturing 1.0 1.0 0.5 0.6 1.4 1.3Other Financial Investment Activities 0.8 0.8 0.8 0.7 0.9 0.9Pharmaceutical and Medicine Manufacturing 0.7 0.8 0.5 0.5 0.9 0.9Other Professional, Scientific, & Technical Services 0.8 0.7 0.9 0.7 0.8 0.8Health and Personal Care Stores 0.6 0.7 0.6 0.6 0.5 0.9Professional, Scientific, and Technical Services 0.8 0.7 0.6 0.8 0.9 0.7Offices of Other Health Practitioners 0.7 0.7 0.7 0.8 0.7 0.6Legal Services 0.7 0.7 0.8 0.7 0.6 0.7Communications Equipment Manufacturing 0.8 0.7 0.4 0.5 1.2 0.8Specialized Design Services 0.7 0.7 0.8 0.7 0.7 0.7Employment Services 0.6 0.6 0.6 0.6 0.6 0.6Software Publishers 0.6 0.5 0.3 0.3 0.9 0.7Non-depository Credit Intermediation 0.5 0.5 0.4 0.4 0.6 0.7Information Services 0.6 0.5 0.4 0.4 0.7 0.6Advertising and Related Services 0.5 0.5 0.5 0.5 0.5 0.6Traveler Accommodation 0.5 0.5 0.4 0.3 0.5 0.6Depository Credit Intermediation 0.5 0.5 0.4 0.3 0.5 0.6Computer and Electronic Product Manufacturing 0.6 0.4 0.3 0.3 0.9 0.5Other industries 18.4 18.2 18.1 15.3 18.6 20.4
Industry unknown ------ ------ ------ ------ ------ ------
Notes: Industries ranked by total beneficiaries in 2005. Sum of the percents may not add to 100.0 due to rounding. Percents shown are based on the total number of petitions approved with industry known. NAICS stands for North American Industry Classification System
Page 22
Appendix: H-1B Petition Processing and Data Limitations Petition Processing
Petitions for obtaining H-1B nonimmigrant status for alien workers are submitted by their prospective employers on USCIS Form I-129, Petition for a Nonimmigrant Worker, and the addendum Data Collection and Filing Fee Exemption Supplement. The petitions are mailed to one of four USCIS Service Centers for processing depending on the location of the sponsoring employer: St. Albans, Vermont; Lincoln, Nebraska; Dallas Texas; and Laguna Nigel, California.
Upon receipt, each petition is stamped with its date of arrival at the Service Center. File assembly clerks create a paper file that contains the original petition as well as all supporting documentation. This file becomes the official file of record for all activities connected with the petition.
Bio-data such as name, date of birth, and country of birth are entered from the petition by data entry
clerks into the case tracking system Computer-Linked Application Information Management System (CLAIMS3). The computer system generates a unique number for the file, known as a receipt number. The files are distributed to adjudicators after being sorted into potential cap and non-cap cases.
After being received, the files are reviewed by adjudicators, who determine whether they have
adequate information in the file to approve or deny the petition. If sufficient evidence is available, a decision is made by the adjudicator and then corresponding information is entered into the tracking system. Otherwise, additional information is sought from the sponsoring employer by the adjudicator. A response from the employer must be made within a set period of time or else the petition will be denied.
After petitions are adjudicated, the associated paper files are forwarded either to the USCIS records
center in Harrisonburg, Virginia for storage or to the Kentucky Consular Center in Williamsburg, Kentucky for consular processing.
Data Limitations
The tables in this report have been tabulated from an electronic data file created at headquarters from USCIS service center electronic data files. Errors in this extract file may have occurred in several ways. For example, petition data might have been inaccurate on petitions; keying errors may have occurred during data entry at the service centers or as a result of being improperly transferred electronically between the service centers and headquarters. Minimum editing has been done to the data in this file. Impossible or highly improbable values have been defined as unknown; for example, beneficiaries younger than 16 (except for fashion models) or those beneficiaries working without compensation.
Lastly, information in electronic format is not available regarding the city or state where H-1B workers are employed.