characterization and correction of global ozone monitoring
TRANSCRIPT
Characterization and correction of Global Ozone MonitoringExperiment 2 ultraviolet measurements and applicationto ozone profile retrievals
Zhaonan Cai,1 Yi Liu,1 Xiong Liu,2 Kelly Chance,2 Caroline R. Nowlan,2 Ruediger Lang,3
Rosemary Munro,3 and Raid Suleiman2
Received 15 November 2011; revised 17 January 2012; accepted 20 February 2012; published 5 April 2012.
[1] We present an assessment study of the Global Ozone Monitoring Experiment 2(GOME-2) reflectance for the wavelength range 270–350 nm by comparing measurementswith simulations calculated using the vector linearized discrete ordinate radiative transfermodel (VLIDORT) and Microwave Limb Sounder (MLS) ozone profiles. The resultsindicate wavelength- and cross-track-position-dependent biases. GOME-2 reflectance isoverestimated by 10% near 300 nm and by 15%–20% around 270 nm. Stokes fractionmeasurements made by onboard polarization measurement devices are also validateddirectly using the VLIDORT model. GOME-2 measurements agree well with the simulatedStokes fractions, with mean biases ranging from �1.0% to �2.9%; the absolute differencesare less than 0.05. Cloudiness-dependent biases suggest the existence of uncorrectedstray-light errors that vary seasonally and latitudinally. Temporal analysis indicates thatreflectance degradation began at the beginning of the mission; the reflectance degrades by15% around 290 nm and by 2.2% around 325 nm from 2007 through 2009. Degradationshows wavelength- and viewing-angle-dependent features. Preliminary validation ofozone profile retrievals with MLS, Michelson Interferometer for Passive AtmosphericSounding, and ozonesonde reveals that the application of radiometric recalibrationimproves the ozone profile retrievals as well as reduces fitting residuals by 30% in band 2b.
Citation: Cai, Z., Y. Liu, X. Liu, K. Chance, C. R. Nowlan, R. Lang, R. Munro, and R. Suleiman (2012), Characterization andcorrection of Global Ozone Monitoring Experiment 2 ultraviolet measurements and application to ozone profile retrievals,J. Geophys. Res., 117, D07305, doi:10.1029/2011JD017096.
1. Introduction
[2] The quality of the radiance measured by satellites andthe understanding of instrument performance are critical foraccurate retrievals of atmospheric trace gases. Absolute cal-ibration of radiance in the ultraviolet (UV) region is essentialfor retrievals of ozone profiles especially in the troposphere[Munro et al., 1998; Hoogen et al., 1999; Hasekamp andLandgraf, 2001; van der A et al., 2002; Liu et al., 2005,2010a], the absorbing aerosol index (AAI) [Torres et al.,1998], and surface albedo [Koelemeijer et al., 2003; Kleipoolet al., 2008]. Both wavelength and radiometric calibrationsare important for deriving these geophysical products.[3] The Meteorological Operational satellite program
(Metop), with Metop-A launched in October 2006, isEurope’s first polar-orbiting meteorological satellite series.
Metop-A flies in a Sun-synchronous polar orbit at 817 kmaltitude with an equator-crossing time (descending node)of 09:30 local solar time. The Global Ozone MonitoringExperiment 2 (GOME-2) [European Organisation for theExploitation of Meteorological Satellites (EUMETSAT),2006], on board Metop-A, continues monitoring of atmo-spheric ozone, following on from GOME/ERS-2 and Scan-ning Imaging Absorption Spectrometer for AtmosphericChartography (SCIAMACHY)/Envisat [Bovensmann et al.,1999]. GOME-2, as the successor of GOME, is a nadir-viewing spectrometer that scans from east to west and backwith a nominal swath width of 1920 km. This instrumentmeasures backscattered radiance in the ultraviolet and visiblerange (240–790 nm) with a spectral sampling interval of0.11–0.22 nm and a spectral resolution of 0.24–0.53 nm.Channel 1 (240–315 nm) was divided into two subbands (i.e.,bands 1a and 1b) at 307 nm before 10 December 2008 and at283 nm thereafter. Each forward scan lasts 4.5 s and eachbackward scan lasts 1.5 s. The nominal integration time forband 1a is 1.5 s, corresponding to three forward groundpixels (640 km � 40 km); band 1b, channel 2 (310–403 nm)and visible channels have an integration time of 0.1875 s,corresponding to 24 forward ground pixels with a maximumresolution of 80 km � 40 km.
1Key Laboratory of Middle Atmosphere and Global EnvironmentObservation, Institute of Atmospheric Physics, Chinese Academy ofSciences, Beijing, China.
2Harvard-Smithsonian Center for Astrophysics, Cambridge,Massachusetts,USA.
3EUMETSAT, Darmstadt, Germany.
Copyright 2012 by the American Geophysical Union.0148-0227/12/2011JD017096
JOURNAL OF GEOPHYSICAL RESEARCH, VOL. 117, D07305, doi:10.1029/2011JD017096, 2012
D07305 1 of 16

[4] The GOME-2 operational level 1b data set containscalibrated Earth radiance, solar irradiance, and polarizationmeasurements derived from raw measurements. The cali-brations applied to level 1b data in addition to radiometriccalibration include an in-flight spectral calibration, dark-current correction, pixel-to-pixel gain correction, etaloncorrection, stray-light correction, and a polarization correction[EUMETSAT, 2006]. However, some anomalies still existin the data owing to instrument degradation, applicability ofpreflight calibration key data, and auxiliary parameters. ForGOME, a large reflectance offset in band 1a and radio-metric correction problems in the ozone fitting window havebeen reported [van der A et al., 2002; Krijger et al., 2005a].Comparison of our preliminary GOME-2 ozone profileretrievals using the GOME and OMI retrieval algorithm [Liuet al., 2005, 2010a] with Microwave Limb Sounder (MLS)ozone profiles showed a large negative bias above the ozonepeaks (�25 km), suggesting a reflectance offset at shorterwavelengths.[5] GOME-2/Metop-A and the GOME-2 instruments to be
launched on Metop-B and -C continue monitoring of atmo-spheric ozone after GOME. They will provide informationon ozone, SO2, and other products for more than 30 years.Thus, study of the instrument degradation and impact on themeasurements is critical to the long-term performance ofthese instruments. GOME measurements have been shownto degrade over time, with Earth radiance and solar irradiancemeasurements degrading in different ways, leading to deg-radation in reflectance [van der A et al., 2002; Krijger et al.,2005a; Liu et al., 2007]. Ozone profile retrievals can be sig-nificantly affected if reflectance degradation in the ozonefitting window is not considered. The degradation can causebiases of up to 3% and 30% in total column ozone and tro-pospheric ozone, respectively, for GOME data [Liu et al.,2007]. GOME-2 has a notable loss of throughput (i.e., deg-radation), especially toward the UV band. The irradiancethroughput decreases about 20% per year, which is likelyowing to wavelength-dependent degradation of the scanmirror coating and potential contribution from contaminationon the detectors. Following an instrument decontaminationprocedure carried out during one week in September 2009the throughput of the instrument initially dropped by another15% [EUMETSAT, 2009]. Ozone profile and other productslike absorbing aerosol index [Tilstra et al., 2010] using UVchannels can be significantly affected by degradation and thereflectance degradation must be corrected.[6] The purpose of this study is to characterize GOME-2
reflectance by comparing experimental measurements withsimulated reflectance calculated using a radiative transfermodel. Note that the reflectance is derived using the mea-sured daily irradiance corresponding to the measured radi-ance. For this purpose, the atmospheric state should becarefully estimated. For wavelengths <350 nm, uncertaintiesintroduced by ground albedo and clouds are relatively smallcompared with those from ozone [Tilstra et al., 2005], andozone profiles can be estimated accurately from other collo-cated and well-validated measurements. In this paper, wefocus on the UV region of the spectrum and present a vali-dation study of the reflectance of GOME-2 for the wave-length range of 270–350 nm from February 2007 toDecember 2009. Liu et al. [2010a] validated OMI reflec-tance and derived an empirical radiometric calibration by
comparing measurements with forward model simulationsusing AuraMLS ozone profiles and ozone profile climatology.We extended and modified this method to validate GOME-2radiance and polarization measurements in level 1b data.Similar methods for radiance validation have been applied toGOME [van der A et al., 2002; Krijger et al., 2005a] andSCIAMACHY [Tilstra et al., 2005; van Soest et al., 2005]measurements, using different radiative transfer models,spectral precalibration, ozone profile measurements, andother atmospheric state parameters. The Earth’s radiance isgenerally polarized, and therefore the measured signals are oftotal intensity and the polarized state. Polarization-sensitiveinstruments such as GOME-2 require polarization correctionof radiance. Several methods have been developed to validateGOME and GOME–2 polarization measurements in–flight.One is based on identification of specific geometries forwhich the light is expected to be unpolarized and anotherrelies on constant limits of polarization in atmosphere [Abenet al., 2003; Krijger et al., 2005b]. In this paper we studythe performance of polarization measurements devices ofGOME-2 in cloud free conditions with direct radiativetransfer model calculations.[7] In section 2, we describe the GOME-2 level 1b data
used in the analysis and details of our simulation method andsensitivity analysis. Section 3 discusses precalibration of theinstrument line shape and wavelength shifts in irradianceand radiance spectra. Section 4 characterizes the quality ofGOME-2 reflectance using simulated reflectance. We alsovalidate GOME-2 polarization measurement device (PMD)measurements directly with model results. Reflectance deg-radation is studied and corrected from early 2007 to late2009. Application of the derived correction to ozone profileretrievals is presented. Section 5 concludes this study.
2. Data and Methods
2.1. GOME-2 Data
[8] The operational calibrated level 1b data are generatedby the GOME-2 Product Processing Facility (PPF) from level1a data, with all calibration steps turned on (dark-signalcorrection, pixel-to-pixel gain, spectral calibration, etaloncorrection, polarization correction, and stray-light correction).Level 1b data includes regular solar irradiance measurementsover time. Solar spectra are typically acquired once per day atthe terminator in the northern hemisphere. The Sun meanreference spectrum will be derived from this mode. Thedegradation in solar irradiance can be easily monitored bycomparing with the solar irradiance measured at the begin-ning, but it is not easy to tell whether the radiance showsthe same reduction and temporal changes as the irradiance.Currently, degradation correction for solar irradiance andearthshine radiance is not included in current versions. Inthis study, we used 68 days of level 1b spectral data from16 February 2007 through 16 December 2009, sampledevery 15 days. The GOME-2 level 0 to 1b processor wasupdated to version 4.5 on 9 December 2009. Because thenew PPF was applied to only the near-real-time (NRT) data,all data from February 2007 to December 2008 were pro-cessed by PPF 4.0, and data from 2009 were processed byversions 4.1 to 4.3. PPF updates are mainly on key data andother issues, which partly improve the data quality (e.g.,Stokes fractions). All processor versions up to the most
CAI ET AL.: VALIDATION OF GOME-2 REFLECTANCE D07305D07305
2 of 16

recent one implemented in March 2011 (version 5.1) havenot addressed the issue of changes in reflectance levels dueto the observed instrument degradation and stray light.[9] GOME-2 level 1b PPF data provide the total absolute
error (a combination of random and systematic components)in radiance and irradiance measurements [EUMETSAT,2006]. In level 1b data, the total error of irradiance is con-stant (�1.42%) and for radiance it is �2% above 312 nm.Proper estimate of the random-noise error component ofmeasurements is essential for optimal estimation technique-based algorithms [Rodgers, 2000]. Random-noise errors(readout noise and shot noise) of GOME-2 spectra can beestimated from detector counts (original binary units) in theGOME-2 level 1a data. A more convenient way is to convertradiance in level 1b to detector counts using the Müllermatrix radiance response elements [Nowlan et al., 2011].Table 1 lists the averaged signal-to-noise ratio (SNR) valuesfor measured radiance, which can be considered as a mea-sure of the uncertainty (random-noise error) in the measuredEarth radiance. Here, we assume that the measured rawspectra were accurately calibrated, so that no uncertaintiesfrom calibration key data contributed to the SNR.[10] The magnitudes of the estimated uncertainties agree
well with the standard deviation of spectral fitting residualsfor ozone profile and SO2 retrievals. The relative random-noise error of GOME-2 radiance is �0.1% in the range 310–350 nm and increases to 11% in the range 270–290 nm (asseen in Figure 5), with values depending on the signal levelresulting from factors such as surface albedo, cloud fraction,solar zenith angle (SZA), and scattering angle. The depen-dency on scattering angle is quite strong in this wavelengthregion with low surface albedo (high correlation with theRayleigh scattering phase function). In addition, the overallaccuracy (total error) is also dependent on the scatteringangle, for example, errors in the angular dependence ofcalibration key data. The signal-to-noise ratio decreases asthe instrument degradation becomes worse.
2.2. Simulation Method
[11] We compare observed and simulated reflectancespectra for the spectral range 270–350 nm. The reason whywe limit the analysis to this window is to understand theGOME-2 instrument calibration for improving ozone pro-files and SO2 retrievals. Simulated spectra are modeled bythe vector linearized discrete ordinate radiative transfermodel (VLIDORT) [Spurr, 2006], a fully linearized multiplescattering radiative transfer model that can simulate thefull Stokes vector I, Q (0�/90� polarization), U (�45� polar-ization), V, and their analytic Jacobians with respect to anyatmospheric or surface parameter. VLIDORT can be run in
scalar mode only (without polarization), which is faster byalmost an order of magnitude than a vector calculation butcauses significant errors in the UV. Considering the compu-tational cost of running this vector model, we adopt an opti-mized scheme to speed up the radiative transfer calculationby a factor of six, while maintaining the accuracy at betterthan 0.1% [Liu et al., 2010a]. The ring effect, namely, thefilling in of solar Fraunhofer lines and telluric absorptionstructures in the UV/visible due to inelastic rotational Ramanscattering (RRS) by air molecules, is directly modeled usinga single scattering RRS model [Sioris and Evans, 2000], anda scaling parameter is fitted from the observed spectral data toaccount for multiple scattering effect in the atmosphere.Radiative transfer calculation is performed on a 48 verticallayers grid with approximately 1.5 km thick for each layer.Daily zonal mean ozone profiles are estimated from v2.2MLS/AURA ozone profiles from 0.1 to 215 hPa and ozoneclimatology [McPeters et al., 2007] above 215 hPa. Theseprofiles are further normalized by zonal mean OMI totalcolumn ozone, which were processed with TOMS algorithm(version 8.5) [Bhartia and Wellemeyer, 2002] and havebeen well validated [McPeters et al., 2008]. Temperature-dependent ozone absorption cross section is taken from Brionet al. [1993]. Note that in our forward simulation we accountfor ozone and Rayleigh scattering to the top of atmosphere.The MLS ozone data were well validated and quality con-trolled, with uncertainty estimates of �5% in the strato-sphere, �10% at the lowest stratospheric altitudes, and �2%in stratospheric column ozone [Froidevaux et al., 2008;Jiang et al., 2007]. Temperature profiles and surface pres-sures are taken from daily National Centers for Environ-mental Protection (NCEP) reanalysis data (http://www.ncep.noaa.gov/).[12] The radiance is calculated for a Rayleigh atmosphere
(no aerosols) with Lambertian equivalent reflectance (LER)assumed for the surface and for clouds (treated as reflectingboundaries). Clouds are assumed to be Lambertian surfaceswith a reflectivity of 80% and partial clouds are treated as amixture of clear and cloudy scenes using the IndependentPixel Approximation (IPA). In the IPA, we use the effectivecloud top pressure provided in the level 1b data, which isretrieved by FRESCO algorithm [Koelemeijer et al., 2001]from the O2 A band at 762 nm. The initial surface albedo isdetermined at 347 nm from the OMI surface climatology[Kleipool et al., 2008]. The cloud fraction derivation from347 nm follows the method of retrieving cloud fraction fromweak ozone absorbing wavelengths in the TOMS total ozonealgorithm [Bhartia and Wellemeyer, 2002] and has beenused in our ozone profile retrieval algorithm [Liu et al.,2005, 2010a]. Note that the effective cloud top pressure isalso dependent on wavelength [Stammes et al., 2008]. Thedifference between cloud top derived from O2-A band androtational Raman scattering near 350 nm are between 2 to 45hPa [Sneep et al., 2008], which is less than the estimateduncertainty of 53 hPa for FRESCO cloud top retrievals[Koelemeijer et al., 2001]. For near clear sky pixel, the useof inconsistent cloud top pressure will introduce a maximumerror of 0.5% near 305 nm assuming 20% cloud and 633 hPacloud top. We exclude ground pixels flagged as snow/ice byFRESCO. In investigating the zonal mean differencesbetween the observed and simulated reflectance, onlyground pixels with effective cloud fractions less than 20%
Table 1. Averaged Estimates of GOME-2 Signal-To-Noise Ratio(SNR) for Orbit 8452 on 15 August 2008
Cross-TrackPosition
SNR (Mean/Standard Deviation, Min/Max)a
270–290 nm 290–306 nm 310–350 nm
East 8/6, 2/83 62/59, 10/480 859/329, 10/2851Nadir 10/7, 2/95 85/93, 7/602 915/404, 34/2531West 13/9, 2/101 97/88, 7/586 1094/472, 22/2648
aThe mean and standard deviation are calculated using ground pixels withSZA < 75�.
CAI ET AL.: VALIDATION OF GOME-2 REFLECTANCE D07305D07305
3 of 16

are included in the average. GOME spectral data are notNyquist sampled in the spectral domain, which introduceserrors when normalizing radiance with irradiance [Chanceet al., 2005]. GOME-2 improves the spectral sampling;therefore, an undersampling correction is not implemented.[13] Over South America and the South Atlantic (0�–45�S,
0�–75�W), the South Atlantic anomaly (SAA) can lead tolarge measurement spikes in band 1a; thus, the SAA pixelswere excluded from the average. We also excluded Sun glintpixels, which can significantly enhance backscattered radi-ance as well as the polarization state but are not well mod-eled in our forward model simulation. Scenes or pixels thatfulfill all these selection criteria (i.e., nearly clear sky, noSAA, or Sun glint effects) are included in our investigation.
2.3. Forward Model Error and Sensitivity Analysis
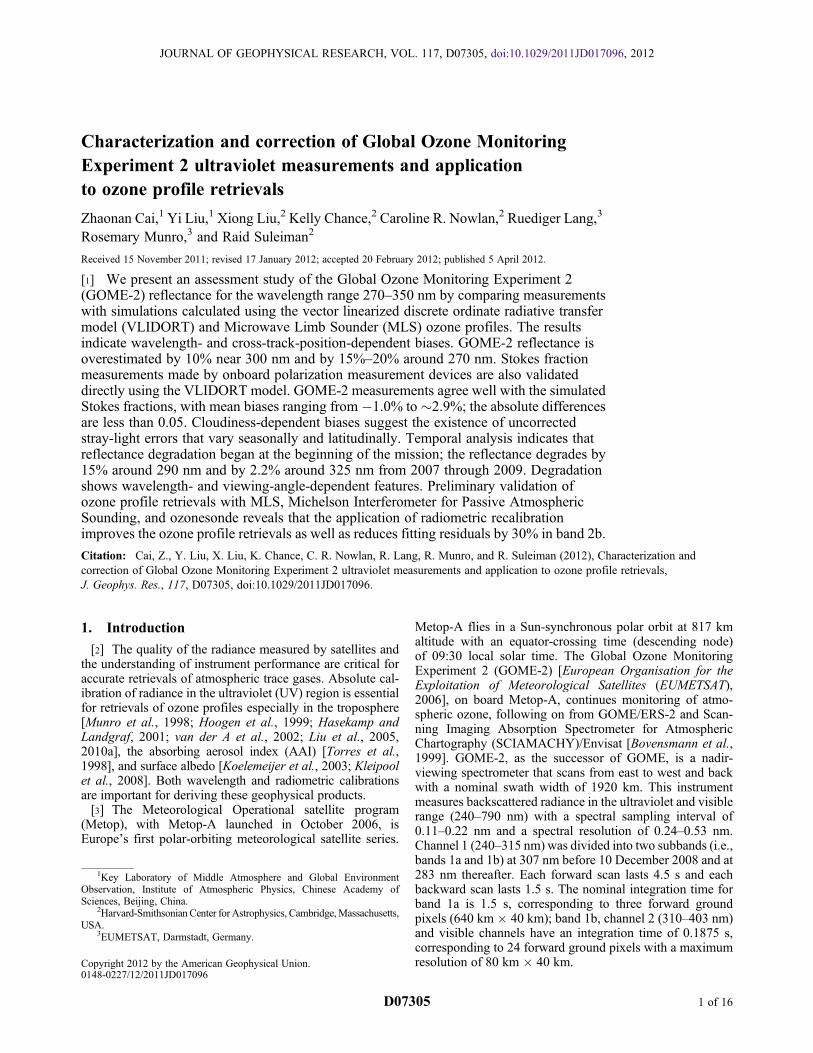
[14] We study the sensitivity of modeled reflectance forcloud free scenes in tropics to several forward model para-meters: ozone profile, surface albedo and ring effect scalingparameter. We also examine sensitivity to several otherparameters that are not included in the model: radiance/O3
wavelength shift, radiance/irradiance wavelength shift andfirst-order wavelength-dependent term for surface albedo.The sensitivity of reflectance R to model parameter x isdefined as
dR∗=dx∗ ¼ d ln Rð Þ=d ln xð Þ: ð1Þ
[15] Derivatives with respect to ozone profile and surfacealbedo are directly calculated by VLIDORT. Derivativeswith respect to wavelength shift and ring effect are derivedusing the “finite difference ” approach. Here we assume that aLambertian surface is described by albedo that varies linearlywith wavelength l, A = A0 + B(l � �l). The derivative withrespect to the first-order term of albedo is dR/dB = dR/dA �(l � �l), where A is surface albedo and B is the albedo slope.[16] In Figure 1a, we present sensitivity of reflectance
with respect to Lambertian surface albedo: dR/dA0 anddR/dB as function of wavelength. Below 300 nm, possibleerrors in albedo will not affect the simulated reflectance. Theeffect of albedo increases toward longer wavelengths. TheOMI surface albedo data stops at 328 nm, so we assume thatthe wavelength dependence is small in the forward model,which is a good assumption because the surface albedo isgenerally small for both land and water surfaces (except forsnow/ice surface) and Rayleigh scattering is strong. Assum-ing wavelength independence, albedo will introduce an errorup to 0.9% near 310 nm for water. However, in the ozoneprofile retrieval algorithm, we fit an additional parameternamed “First-order wavelength-dependent term for surfacealbedo” to account for albedo variation and aerosol effect.Figure 1b shows the sensitivity to ozone profile as a functionof wavelength for a typical ozone profile in tropics. Solarzenith angle, viewing zenith angle, and relative azimuthangle are based on a typical GOME-2 pixel on the east side.Above 340 nm, the sensitivity to ozone at all layers is verysmall. Ozone distribution from �30 km to bottom layersshows largest impact near 305 nm. The forward model errorat shorter wavelengths (<300 nm) is mainly due to errors inozone profiles. According to Froidevaux et al. [2008], theMLS uncertainty estimate is on the order of 5% and closer to
10% at the lowest stratospheric altitudes. The error in simu-lated reflectance due to uncertainties in MLS data is lessthan 2%. Figure 1c shows sensitivity of simulated reflec-tance to the ring effect scaling parameter. Following themethod by Liu et al. [2010a], we derive the first-order ringspectrum from an independent RRS model [Sioris and Evans,2000]; then a scaling parameter is fitted to account for a smalloffset in ring spectrum due to multiple scattering. This isdone in the first iteration of retrievals before fitting. Althoughin principle, rotational Raman scattering can be calculatedwithout using fit parameters, the calculation depends on theknowledge of the vertical distribution of ozone, aerosol,clouds, and surface reflection, which are not accuratelyavailable.[17] Other possible error sources are the wavelength shifts
between radiance and ozone absorption cross section andbetween radiance and irradiance, which are not involved inthe forward model. Figure 2 presents the calculated sensi-tivity of the reflectance to the wavelength shifts. Wavelengthcalibration errors in both radiance and ozone cross-sectionspectroscopy will introduce some fluctuating structures asseen in Figure 4 and will be discussed in section 4.1. Ther-mally induced shift and possibly squeeze may occur betweenirradiance and radiance, in addition to the Doppler shift fromacquisition of irradiances when the substantial spacecraftvelocity vector is mostly in the Earth-Sun direction, whichhas already been corrected in level 0–1b processing. Wave-length adjustment between radiance and irradiance is neededwhen calculating reflectance, which will introduce addi-tional errors as seen in Figure 2b. We did not shift irradianceand radiance during the simulation because the retrievedwavelength shift (section 3) produces highly variable valuesdepending on the pixel window used and does not makeimprovement. In the ozone retrieval algorithm, we further fitradiance/irradiance shift parameters to account for residualwavelength registration errors.
3. Precalibration of the Slit Function
[18] A preflight instrument study found GOME-2 slitfunctions to be quite asymmetric in channels 1 and 2, espe-cially for the shorter part of band 2b [Siddans et al., 2006].Here, we assume a variable (wavelength-dependent) asym-metric Gaussian slit shape for convolving high-resolutionspectra to GOME-2 spectral resolution. The prefitted slitwidths (full width at half maximum, FWHM), wavelengthshift, and asymmetric factor were retrieved by nonlinear leastsquares (NLLS) fitting of the observed irradiance spectrumwith an improved high-resolution (0.04 nm) solar referencespectrum, which has a wavelength accuracy better than 3.2�10�4 above 305 nm and better than 3 � 10�3 below 305 nm[Chance and Kurucz, 2010]. The asymmetric Gaussian g(x)is defined as
g xð Þ ¼ expx2
hw1e⋅ 1� aymð Þð Þ2 !
; ð2Þ
where x is the difference in wavelengths, hw1e is half widthat 1/e intensity, FWHM = 1.66511 � hw1e, and aym is theasymmetry factor.[19] To account for variable slit width, we prefit the slit
width over a spectral range of 31 pixels with a sliding step
CAI ET AL.: VALIDATION OF GOME-2 REFLECTANCE D07305D07305
4 of 16
size of 1 pixels increment. The fitting procedure includesbaseline and scaling polynomials that can partly account forsystematic errors like those due to stray light. Figure 3ashows an example of slit widths (FWHM) and asym-metry factor retrieved from GOME-2 irradiance spectra on15 August 2008. The retrieved slit widths, similar to preflightmeasurements (red line) [Siddans et al., 2006], vary less withwavelength in both channels 1 and 2 compared with GOME,where slit width varies substantially with wavelength in theHuggins bands [Liu et al., 2005]. The much larger slitwidths than the preflight measurements around 280 nmmay be due to errors around this strong Fraunhofer region.The slit width changes with time decreasing by 6% from2007 to 2009. The fitting residuals of ozone profiles andSO2 for GOME-2 are reduced using the retrieved slit shape.GOME-2 spectra are acquired by linear photodiode arraydetectors, and operational wavelength calibration is performed
by the spectral light source (SLS), which provides a numberof narrow spectral lines at known wavelengths across theGOME-2 wavelength range [Murray, 1994]. We examinedthe wavelength shifts for irradiance spectra and earthshineradiance spectra. Figure 3b gives an example of fitted wave-length shifts for solar irradiance and radiance in the range of270–350 nm measured on 15 August 2008. GOME-2 showswavelength-dependent variation similar to GOME: largewavelength shifts in the overlap region of channel 1 andchannel 2 (i.e., the end of band 1b (309–314 nm) and thebeginning of band 2b (310–315 nm)); large fluctuations forradiance shift in the range of 313–323 nm. However, thefluctuating structures of solar irradiance have much smalleramplitudes than those of GOME. We do not perform awavelength adjustment on individual radiance spectra owingto overall similar shifts between radiance and irradiances. Inaddition, this does not improve fitting residuals. In the
Figure 1. Sensitivity of the reflectance to (a) Lambertian surface albedo: zero-order and first-order term;(b) typical ozone profile (O3i), where subscript i denotes layer or altitude and different altitudes are shownin different colors; and (c) ring effect scaling parameter as a function of wavelength, on 15 August 2008.For these cases, SZA = 42� and viewing zenith angle (VZA) = 41�, which corresponds to eastside pixel forone GOME-2 scan (see Figure 3).
CAI ET AL.: VALIDATION OF GOME-2 REFLECTANCE D07305D07305
5 of 16

retrieval, we fit a relative radiance/irradiance shift parameter,that is, we calculated the reflectance as the ratio of radianceto shifted irradiances. The fitted radiance/irradiance shiftsare usually very small, within 0.005 nm.
4. Reflectance and Polarization Comparison
[20] We examine average differences between observed(Robs) and simulated (Rsim) reflectance for each cross-trackposition, spectrally and temporally. The relative differenceof N selected pixels, dR, is defined as
dR ¼ 1
N
XNi¼1
Robs � Rsimð Þ=Rsim � 100: ð3Þ
[21] The measurement uncertainties have to be reduced byincreasing the number of comparison spectra, especiallybelow 290 nm. We focus on comparisons over the tropics(25�S–5�N) where there is less ozone variation. For eachcross-track position on each day, 400–900 measurements areaveraged to ensure that most of the longitudes are covered, inorder to minimize the effect of zonal variability in ozone andto average out the variation due to measurement uncertainty.We also compare the Stokes fraction polarization measure-ments made by GOME-2 with modeled simulation results.To identify the reflectance degradation in GOME-2 data,we compared the reflectance from February 2007 throughDecember 2009. Because of the large computational effortinvolved, we only apply this comparison every 15 daysduring the 3 year period. We also examine the comparisonglobally for several days from different seasons.
4.1. Spectrum Comparison
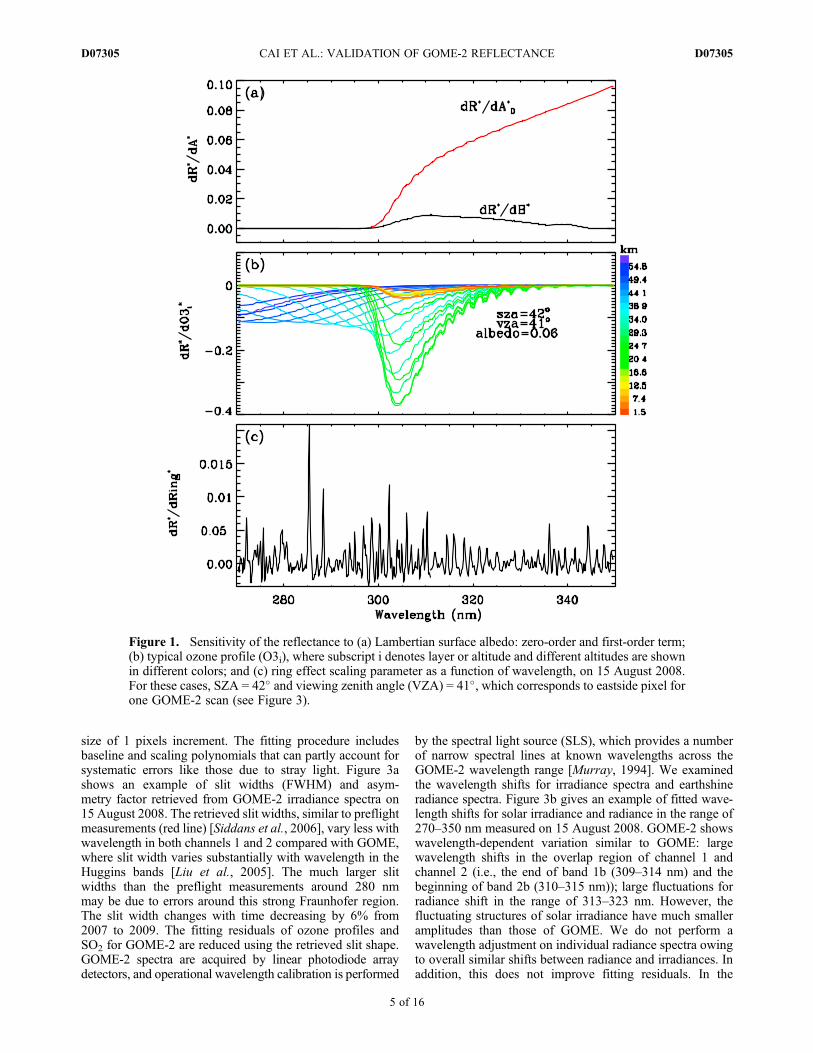
[22] Figure 4 shows an example of a comparison betweenRobs and Rsim as a function of wavelength in the wavelength
range of 270–350 nm on 15 August 2008. Strong wave-length- and cross-track-position (scanning angle)-dependentbiases indicate the existence of radiometric calibration pro-blems including instrument degradation in the GOME-2data. Below 300 nm, the GOME-2 reflectance is typicallyoverestimated by 8–25% compared with the simulation,which are too large to be explained by error in the forwardmodel. Below 289 nm, dR had a strong correlation (0.4–0.8)with the averaged radiance of band 1a (270–307 nm), aswell as with the cloud fraction, suggesting the existence ofuncorrected uniform stray light. The correlation also showscross-track and latitude dependencies (e.g., weaker corre-lation for west and lower solar zenith angle pixels). Spikes at280 and 285 nm (280 nm is an Mg+ or Mg II Fraunhofer line,285 nm is a neutral Mg Fraunhofer line) are likely caused bythe emission of Mg and Mg+ in the ionosphere and residualstray light [Joiner and Aikin, 1996], which are not modeledin the forward simulation. Radiances below 300 nm arescattered back to the instrument through single scatteringand have low sensitivity to tropospheric clouds, aerosols,and surface albedo, owing to the strong ozone absorption.Thus, the polarization can be modeled accurately, and mostlikely the cross-track-dependent biases cannot be explainedby errors in the polarization correction; this is discussedfurther in section 4.2. The fine structures at shorter wave-lengths, especially below 290 nm, are likely caused by metalemission lines (e.g., Mg, Fe), NO gamma emission features,and stray light filling in Fraunhofer lines.[23] The discontinuity in the overlap region (310–313 nm)
of bands 1b and 2b varies from 7% in the western/easternpositions to 3.5% at nadir. In band 2b, the observed reflec-tance near 312 nm is higher than the simulation by 3%,whereas by 310 nm, the difference is larger than 10%. Theseare possible effects of the missing Etalon correction below315 nm. The fluctuating structures in band 2b have a strong
Figure 2. Sensitivity of the reflectance to (a) wavelength shift between radiance and ozone cross sectionand (b) radiance/irradiance wavelength shift.
CAI ET AL.: VALIDATION OF GOME-2 REFLECTANCE D07305D07305
6 of 16

correlation (0.5–0.7) with the wavelength shift betweenradiance and ozone cross sections and a weaker correlation(�0.3) with the wavelength shift between irradiance andradiance and the residual ring effect. The stronger correlationbetween ozone cross sections and radiance suggests a relativewavelength shift rather than a wavelength calibration errorbecause of the weak correlation with radiance/irradiancewavelength shifts, which were fitted in our simulation. Thesewavelength shifts introduced features indicate wavelengthcalibration problems in level 1b data or in ozone cross sec-tions and can be removed by smoothing the spectra with arunning average of 1 or 2 nm.[24] On the basis of the methodology described in section 2,
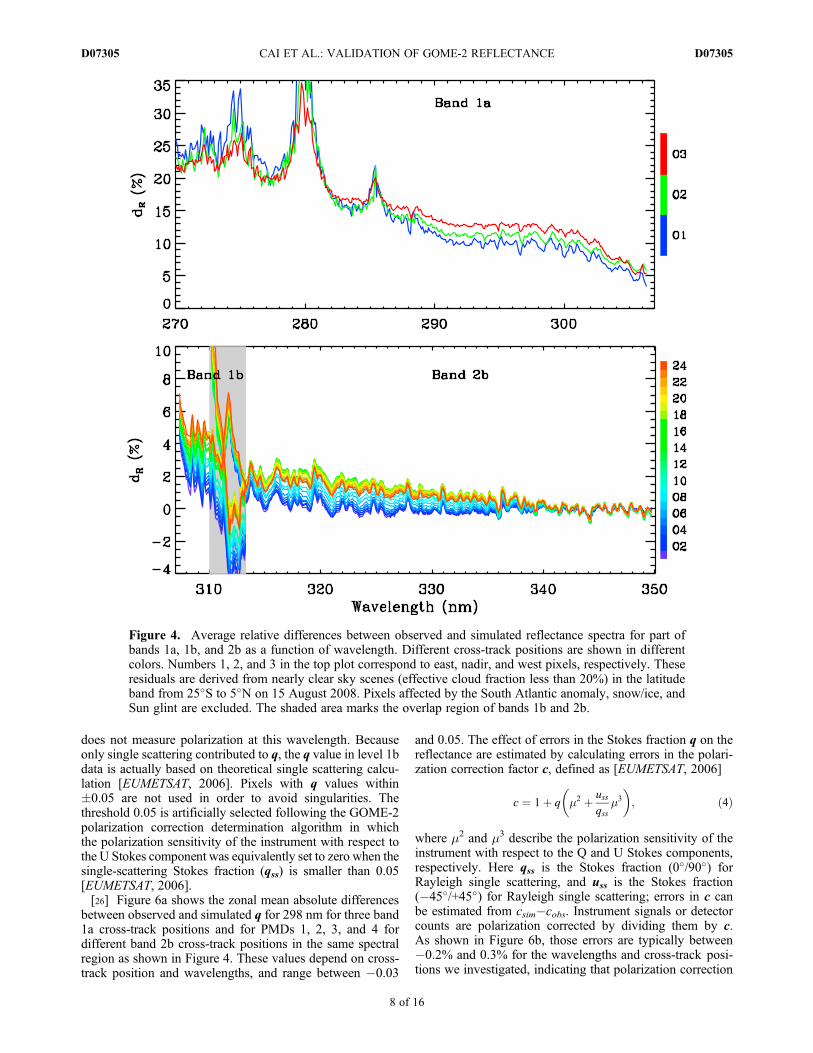
reflectance correction is derived for GOME-2 level 1bspectra. Figure 5 shows the mean difference and 3s stan-dard deviation of 68 dR spectra during 2007–2009 for allscans under nearly clear sky condition (effective cloudfaction <20%). Eight band 1b and 2b spectra are coaddedto match the band 1a integration time (spatial resolution).Biases for different days show similar structures (not shownhere), but the magnitudes vary substantially with wavelength,time, and cross-track positions. The mean biases (deviation)vary from 18% (18%) at 270 nm to <0.1% (0.1%) at 347 nm.At longer wavelengths, the small biases result from the cloud
fraction determination so that differences close to 347 nm areminimized. The absolute error provided by the level 1bproduct is based on the assumption of zero degradation andno systematic error in the stray-light characterization of theinstrument and the radiance errors estimated in this study aremainly due to degradation and stray light. As a comparison,we also plot total absolute error in the level 1b data andestimated random noise in Figure 5. The absolute errors inradiance are almost constant (�2%), above 312 nm and donot vary much with time and cross-track position. Note thatin Figure 5, the value is 1.6% because it is a combination ofirradiance and radiance errors and 8 band 2b pixels havebeen coadded to match band 1a integration time.
4.2. Polarization Comparison
[25] The GOME-2 PMDs measure light polarized paralleland perpendicular to the reference plane in 15 broad bandsfrom 312 to 790 nm, from which the Stokes fraction q = Q/Ican be determined. For comparison, we used VLIDORT tocalculate q directly and evaluate radiance biases due to thepolarization correction. This is done for four PMD wave-lengths (312.7, 318.0, 325.3, and 332.6 nm, correspondingto PMDs 1, 2, 3, and 4) in the Huggins ozone absorptionband. We also examine the differences at 298 nm. GOME-2
Figure 3. (a) Retrieved GOME-2 slit widths and asymmetry factors in the range 270–350 nm, averagedfrom 96 spectra during 2007–2009. Red lines denote slit widths from calibration key data. (b) One exampleof GOME-2 wavelength shifts for irradiance (solid line) and radiance (dashed line) in the range 270–350 nm for a pixel on 15 August 2008.
CAI ET AL.: VALIDATION OF GOME-2 REFLECTANCE D07305D07305
7 of 16
does not measure polarization at this wavelength. Becauseonly single scattering contributed to q, the q value in level 1bdata is actually based on theoretical single scattering calcu-lation [EUMETSAT, 2006]. Pixels with q values within�0.05 are not used in order to avoid singularities. Thethreshold 0.05 is artificially selected following the GOME-2polarization correction determination algorithm in whichthe polarization sensitivity of the instrument with respect tothe U Stokes component was equivalently set to zero when thesingle-scattering Stokes fraction (qss) is smaller than 0.05[EUMETSAT, 2006].[26] Figure 6a shows the zonal mean absolute differences
between observed and simulated q for 298 nm for three band1a cross-track positions and for PMDs 1, 2, 3, and 4 fordifferent band 2b cross-track positions in the same spectralregion as shown in Figure 4. These values depend on cross-track position and wavelengths, and range between �0.03
and 0.05. The effect of errors in the Stokes fraction q on thereflectance are estimated by calculating errors in the polari-zation correction factor c, defined as [EUMETSAT, 2006]
c ¼ 1þ q m2 þ ussqss
m3
� �; ð4Þ
where m2 and m3 describe the polarization sensitivity of theinstrument with respect to the Q and U Stokes components,respectively. Here qss is the Stokes fraction (0�/90�) forRayleigh single scattering, and uss is the Stokes fraction(�45�/+45�) for Rayleigh single scattering; errors in c canbe estimated from csim�cobs. Instrument signals or detectorcounts are polarization corrected by dividing them by c.As shown in Figure 6b, those errors are typically between�0.2% and 0.3% for the wavelengths and cross-track posi-tions we investigated, indicating that polarization correction
Figure 4. Average relative differences between observed and simulated reflectance spectra for part ofbands 1a, 1b, and 2b as a function of wavelength. Different cross-track positions are shown in differentcolors. Numbers 1, 2, and 3 in the top plot correspond to east, nadir, and west pixels, respectively. Theseresiduals are derived from nearly clear sky scenes (effective cloud fraction less than 20%) in the latitudeband from 25�S to 5�N on 15 August 2008. Pixels affected by the South Atlantic anomaly, snow/ice, andSun glint are excluded. The shaded area marks the overlap region of bands 1b and 2b.
CAI ET AL.: VALIDATION OF GOME-2 REFLECTANCE D07305D07305
8 of 16
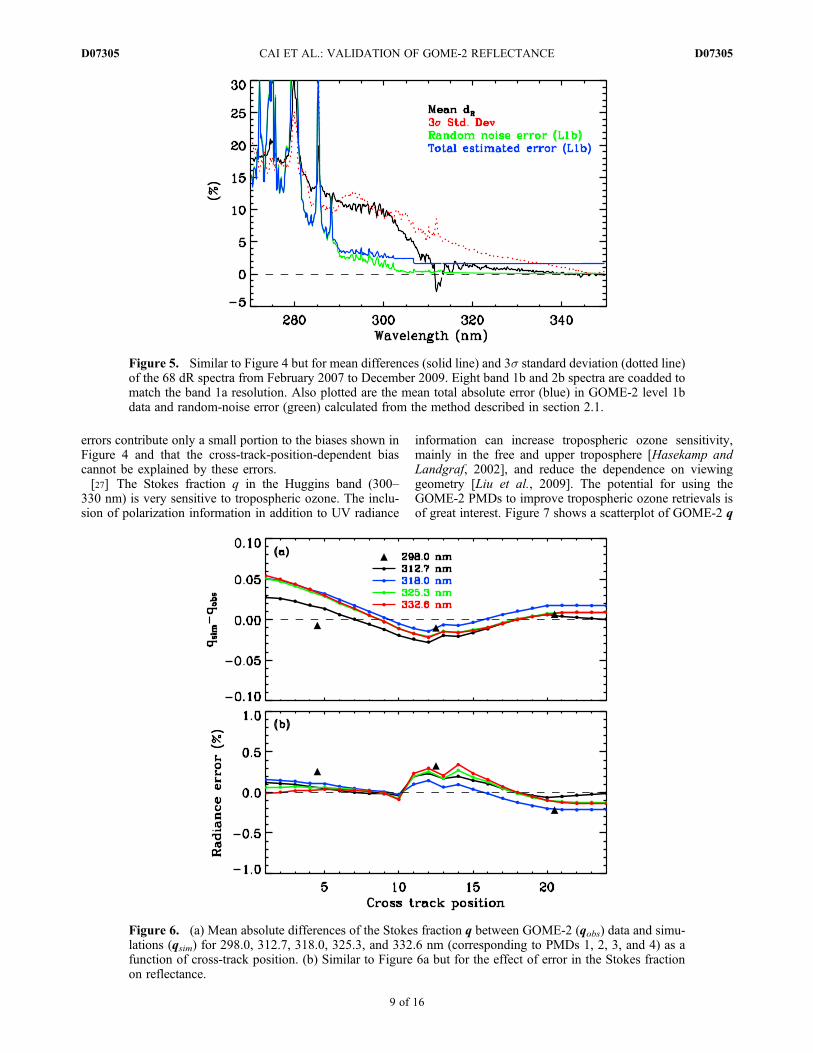
errors contribute only a small portion to the biases shown inFigure 4 and that the cross-track-position-dependent biascannot be explained by these errors.[27] The Stokes fraction q in the Huggins band (300–
330 nm) is very sensitive to tropospheric ozone. The inclu-sion of polarization information in addition to UV radiance
information can increase tropospheric ozone sensitivity,mainly in the free and upper troposphere [Hasekamp andLandgraf, 2002], and reduce the dependence on viewinggeometry [Liu et al., 2009]. The potential for using theGOME-2 PMDs to improve tropospheric ozone retrievals isof great interest. Figure 7 shows a scatterplot of GOME-2 q
Figure 5. Similar to Figure 4 but for mean differences (solid line) and 3s standard deviation (dotted line)of the 68 dR spectra from February 2007 to December 2009. Eight band 1b and 2b spectra are coadded tomatch the band 1a resolution. Also plotted are the mean total absolute error (blue) in GOME-2 level 1bdata and random-noise error (green) calculated from the method described in section 2.1.
Figure 6. (a) Mean absolute differences of the Stokes fraction q between GOME-2 (qobs) data and simu-lations (qsim) for 298.0, 312.7, 318.0, 325.3, and 332.6 nm (corresponding to PMDs 1, 2, 3, and 4) as afunction of cross-track position. (b) Similar to Figure 6a but for the effect of error in the Stokes fractionon reflectance.
CAI ET AL.: VALIDATION OF GOME-2 REFLECTANCE D07305D07305
9 of 16

versus those simulations for PMD channels 1, 2, 3, and 4,derived for clear-sky conditions on 15 August 2008.GOME-2 correlates well with the simulations (r > 0.99, N =32,303). The slopes are close to one, with values rangingfrom 0.99 to 1.04. There is scatter between GOME-2 andthe simulated q. The deviations are due to errors in the cli-matological tropospheric ozone and the exclusion of aerosolsin the forward model simulation. The mean biases, whichminimize errors due to ozone zonal variability, are 2.9% forPMD 1 and �1.0% for PMD 4. The mean absolute differ-ences in q (similar to Figure 6a, but averaged globally) arewithin �0.05 and show similar cross-track-position depen-dencies as those shown in Figure 6a. Similar values havebeen found by examining the angular dependency of Stokesfractions for special viewing geometries (where q should beclose to zero) [EUMETSAT, 2008]. For highly polarizedcloud-free cases, PMD measurements are verified withaccuracy better than 2.9%, and no cloud-fraction-dependentbias is found. For low-polarized measurements, neither
observations nor model simulations represented Stokesfractions very well; they do not improve ozone profileretrievals owing to little information content.
4.3. Spatial Comparison
[28] To understand the spatial variations of anomalies inreflectance, we examine the spectrally averaged residuals fortwo wavelength ranges, 270–290 nm (dR(270–290)) and 320–340 nm (dR(320–340)), as a function of latitude on 15 January,15 April, 16 July, and 16 October 2008. The spikes at 276,280, 285, and 288 nm are excluded. In Figure 8, for clearconditions (effective cloud fraction <20%), dR(270–290) variesless than 5% with latitude, and dR(320–340) is constant overmost latitudes. For cloudy conditions (effective cloud frac-tion >40%), peaks of dR(270–290) occur in the tropics arelikely due to the presence of more reflective deep convectiveclouds. For wavelengths shorter than 290 nm, dR(270–290),which was thought to be insensitive to the presence ofclouds, increases with increasing cloudiness, suggesting that
Figure 7. Scatterplots of the GOME-2 Stokes fraction q versus simulations for four PMD channels at312.7, 318.0, 325.3, and 332.6 nm on 15 August 2008. GOME-2 pixels were selected in the same manneras that used for Figure 4. The solid and dashed lines denote the linear regression and 1:1 relationship,respectively. The slope, offset, correlation, mean difference, and 1s standard deviation are also shown.
CAI ET AL.: VALIDATION OF GOME-2 REFLECTANCE D07305D07305
10 of 16

there are residual uniform stray-light errors in band 1a, andthat these errors depend on the intensity level (e.g., depend onscattering angle, surface albedo, and SZA). For dR(320–340),no distinct difference between clear and cloudy conditionsis found. Although there are errors in MLS and climato-logical ozone in the simulations, sample errors, and errors incloud parameters, the overall features indicate that theradiometric correction derived in the tropics could be appliedto other latitudes. Residual stray-light errors vary seasonallyand latitudinally and should be corrected independently orfitted in the retrieval.
4.4. Reflectance Degradation
[29] For GOME and SCIAMACHY, several empiricalmethods have been developed to correct reflectance degra-dation by comparing observed and simulated reflectance[van der A et al., 2002; Krijger et al., 2005a; van Soest et al.,2005] or by comparing the observed reflectance with that atthe start after removing dependences on the SZA and sea-sonal variation [Liu et al., 2007]. These methods suffer fromseveral disadvantages: First, simulation methods requirecareful collocations of independent ozone measurements suchas ozonesondes and ozone profile data from other instruments.However, there are generally not enough collocations. Second,the method of comparing the observed reflectance with that atthe beginning of instrument operation does not remove thechange in reflectance due to ozone variation and could notdetect and correct any initial offset in the measurements.
[30] Figure 9 shows a temporal analysis of the zonal meandifferences between observed and simulated reflectance fortwo wavelengths, 290 nm and 325 nm, in our ozone profilefitting window derived from nearly clear sky conditions(cloud fraction less than 20%) in the tropics during the studyperiod (2007–2009). The increasing values indicate theexistence of wavelength-dependent degradation in theGOME-2 reflectance. The overall characteristics are similarto those of GOME in the first 3 years in orbit. For GOME,the degradation is quite small up to 1999 [Liu et al., 2007].The degradation began in 2007 and is expected to be non-linear with time, as observed in GOME. The cross-trackdependent slopes indicate that reflectance degradation sig-nificantly depends on viewing angle (e.g., the east pixelsdegraded less than nadir and west pixels), with first-ordervalues ranging from 3% to 15% at 290 nm and 0.6% to lessthan 2.2% at 325 nm after 3 years. On the basis of theGOME experience, the physical understanding of the scan-angle-dependent degradation is that the scan mirror’sreflective properties, due to contamination, depend stronglyon the incident angle [Snel, 2000]. Our approach mainlyderives the wavelength- and cross-track-position-dependentpart of the radiance errors, so degradation for longer wave-lengths cannot be fully identified since we derived cloudfractions from 347 nm, which forced the measurement/simulation ratio to be equal to one. However, degradationrates decreased thereafter from 20% to below 5% per year in
Figure 8. Spectrally averaged relative differences between GOME-2 data and simulated reflectance forfour days in 2008 as a function of latitude, in two wavelength windows: 270–290 nm (black lines) and320–340 nm (red lines). Solid lines show differences derived from clear-sky conditions (effective cloudfraction <20%), and dotted lines show differences derived from cloudy conditions (effective cloud fraction>40%). Pixels affected by the South Atlantic anomaly, snow/ice, and Sun glint were excluded.
CAI ET AL.: VALIDATION OF GOME-2 REFLECTANCE D07305D07305
11 of 16

the UV with virtually no degradation in the visible and NIRregion during 2010.[31] The derived degradation correction has some dis-
advantages. First, the effective cloud fraction was fitted atwavelengths around 347 nm from uncorrected measure-ments; thus, error in the derived cloud fraction directlypropagates into the simulated spectra, which reduces thebiases at longer wavelengths [Krijger et al., 2005a]. So theratio of simulated reflectance to observed reflectance at longerwavelengths might not reflect the absolute calibration. How-ever, for ozone profile retrievals, the wavelength-dependentradiometric calibration is more important. Second, sampling(68 days) and modeling errors (e.g., zonal mean ozone, cli-matology) remain, as does instrument uncertainty.
4.5. Application to Ozone Profile Retrievalsand Validation
4.5.1. Example of Reflectance Correction[32] On the basis of the comparison between measured
and simulated radiance, radiometric recalibration of reflec-tance as a function of wavelength, cross-track position, andtime is derived. To validate the derived correction, we applyrecalibrated GOME-2 radiance in our ozone profile retrievalalgorithm [Liu et al., 2005, 2010a]. We choose fittingwindows of 289–307 nm and 325–340 nm. Figure 10shows the effect of the correction on GOME-2 ozone pro-file retrievals. GOME-2 ozone profile retrievals with andwithout radiometric correction are compared with coincidentMLS and the a priori profile at MLS layers (0.3–215 hPa) for
1 August 2008, globally. Coincident GOME-2 and MLSozone profiles are selected to be <300 km in space and 6 h intime. The total number of coincident pairs is 632. The com-parison process is similar to that used by Liu et al. [2010b].The MLS ozone volume mixing ratio recorded at each pres-sure level record is integrated to partial columns (in Dobsonunits, DU), and then MLS profiles are convolved withGOME-2 averaging kernels to reduce the smoothing error.For profile comparison, GOME-2 ozone profiles are inter-polated to the MLS vertical grid. For clarity, the Dobsonunits are converted to parts per million by volume (ppmv).The uncorrected retrievals show a negative bias above 22 hPa,decreasing to �18% near 2 hPa, and positive biases up to10% at bottom levels. The radiometric correction improvesthe comparison with MLS at all layers above 215 hPa.GOME-2 agrees with MLS to within 3.5% from 0.3 to215 hPa. The standard deviations are within 8%, increasingto 20% near 215 hPa. Additionally, the correction reducedfitting residuals in band 2b by �30%. The large deviationsin bottom layers were largely due to ozone variability inthe upper troposphere and lower stratosphere (UTLS)region and uncertainty from MLS precision (green dashedline, Figure 10). Large differences between corrected anduncorrected profiles near 2 hPa are due to the radianceoffset below 300 nm.[33] The “soft” calibration is also implemented in
GOME-2 SO2 retrieval [Nowlan et al., 2011] and improvesthe SO2 retrieval by (1) improving cross-track-dependentbias, (2) improving SO2 background offset retrieved in clean
Figure 9. Mean differences between observed and simulated reflectance for (top) 290 nm versus timeand (bottom) 325 nm versus time. The band 1a cross-track positions are shown in different colors for east(black), nadir (blue), and west (red), respectively. First-order fitted lines are also shown.
CAI ET AL.: VALIDATION OF GOME-2 REFLECTANCE D07305D07305
12 of 16

environment by 0.5–1 DU, (3) reducing large systematicresiduals in the normalized log of radiance by a factor of4 in the wavelength range below 320 nm, and (4) allowinga retrieval combining both channels 1 and 2, which can beused to reduce retrieval noise in later years after degrada-tion, as well as permitting altitude retrievals of high-altitudeSO2 plumes, whose weighting functions peak at shorter
wavelengths than those at lower altitudes [Yang et al.,2010].4.5.2. Validation of Ozone Profile With MichelsonInterferometer for Passive Atmospheric SoundingOzone Data[34] The Michelson Interferometer for Passive Atmo-
spheric Sounding (MIPAS) is a limb scanning Fourier
Figure 10. (a) Comparison of retrieved GOME-2 ozone profiles with (red) and without (blue) reflectancecorrection, MLS (green), and the a priori profile (black). (b) Mean bias (solid line) and standard deviation(dashed line) at MLS layers on 1 August 2008. MLS profiles are convolved with GOME-2 averagingkernels; the green dashed line shows MLS precision.
Figure 11. (a) Mean bias between GOME-2 and MIPAS convolved with GOME-2 averaging kernels ateach MIPAS layer for seven 10�-latitude bands during 2008. (b) Corresponding smoothing errors.
CAI ET AL.: VALIDATION OF GOME-2 REFLECTANCE D07305D07305
13 of 16

infrared spectrometer on board the European EnvironmentalSatellite (Envisat) in March 2002. The instrument was sus-pended in March 2004 owing to problems with the mirrordrive of the interferometer and restarted in January 2005with a degraded spectral resolution of 0.0625 cm�1 andmeasurement scenario to extend instrument life time. Thehorizontal sampling step is 410 km in normal mode andvertical sampling step is 1.5 km to 4 km with vertical rangeof 7 to 70 km. MIPAS ozone profiles are obtained for mostof the stratosphere during both daytime and nighttime hours.MIPAS ozone data shows consistent error less than 10%from 1 hPa to 50 hPa and 5–25% around 100 hPa [Cortesiet al., 2007; Ceccherini et al., 2008]. Here we use MIPASoperational near real time data of processor version 5.05.[35] Figure 11 shows the mean biases of differences
between GOME-2 and MIPAS ozone profiles for sevenlatitude bands from 80�S to 80�N during 2008 and
corresponding smoothing errors. The comparison process issame as that is section 4.5.1. GOME-2 agrees well withMIPAS with biases less than 10% except for large values atbottom layers which are likely due to degradation in thequality of MIPAS in the lower stratosphere and upper tro-posphere [Cortesi et al., 2007] and, as already noticed, tothe large ozone gradients in the UTLS region. The meansmoothing errors, estimated by assuming MIPAS as true,are generally within 3% except for several layers below 1 hPa(�10%) and above 80 hPa (up to 25%). The biases showsimilar characteristics as the results of the comparisonfor MIPAS reduced-spectral-resolution measurements withGlobal Ozone Monitoring by Occultation of Stars (GOMOS)data [Ceccherini et al., 2008]. Biases between MIPAS andGOME-2 show similar magnitude of values (negative biasesup to 10%) as the comparison of MIPAS and MLS in thestratosphere [Froidevaux et al., 2008; Chauhan et al., 2009].
Figure 12. Comparison of tropospheric ozone column from surface to 200 hPa (TOC200) betweenretrievals/a priori and ozonesondes: (a, b) tropics (30�S–30�N) and (c, d) midlatitude (30�N–60�N) during2008. Figures 12a and 12c show a priori TOC200 versus ozonesonde. Figures 12b and 12d show GOME-2TOC200 versus ozonesonde. The solid and dashed lines denote the linear regression and 1:1 relationship,respectively. The number of coincident profiles, slope, offset, correlation, mean difference, and 1s standarddeviation are also shown.
CAI ET AL.: VALIDATION OF GOME-2 REFLECTANCE D07305D07305
14 of 16
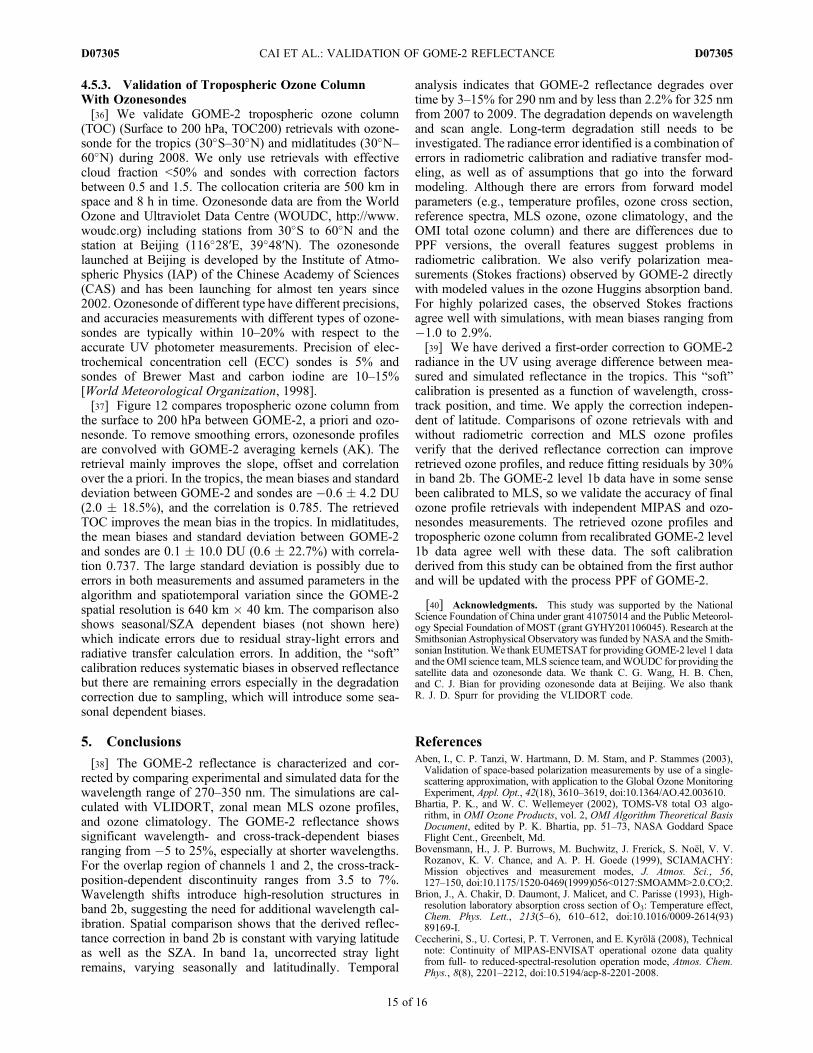
4.5.3. Validation of Tropospheric Ozone ColumnWith Ozonesondes[36] We validate GOME-2 tropospheric ozone column
(TOC) (Surface to 200 hPa, TOC200) retrievals with ozone-sonde for the tropics (30�S–30�N) and midlatitudes (30�N–60�N) during 2008. We only use retrievals with effectivecloud fraction <50% and sondes with correction factorsbetween 0.5 and 1.5. The collocation criteria are 500 km inspace and 8 h in time. Ozonesonde data are from the WorldOzone and Ultraviolet Data Centre (WOUDC, http://www.woudc.org) including stations from 30�S to 60�N and thestation at Beijing (116�28′E, 39�48′N). The ozonesondelaunched at Beijing is developed by the Institute of Atmo-spheric Physics (IAP) of the Chinese Academy of Sciences(CAS) and has been launching for almost ten years since2002. Ozonesonde of different type have different precisions,and accuracies measurements with different types of ozone-sondes are typically within 10–20% with respect to theaccurate UV photometer measurements. Precision of elec-trochemical concentration cell (ECC) sondes is 5% andsondes of Brewer Mast and carbon iodine are 10–15%[World Meteorological Organization, 1998].[37] Figure 12 compares tropospheric ozone column from
the surface to 200 hPa between GOME-2, a priori and ozo-nesonde. To remove smoothing errors, ozonesonde profilesare convolved with GOME-2 averaging kernels (AK). Theretrieval mainly improves the slope, offset and correlationover the a priori. In the tropics, the mean biases and standarddeviation between GOME-2 and sondes are �0.6 � 4.2 DU(2.0 � 18.5%), and the correlation is 0.785. The retrievedTOC improves the mean bias in the tropics. In midlatitudes,the mean biases and standard deviation between GOME-2and sondes are 0.1 � 10.0 DU (0.6 � 22.7%) with correla-tion 0.737. The large standard deviation is possibly due toerrors in both measurements and assumed parameters in thealgorithm and spatiotemporal variation since the GOME-2spatial resolution is 640 km � 40 km. The comparison alsoshows seasonal/SZA dependent biases (not shown here)which indicate errors due to residual stray-light errors andradiative transfer calculation errors. In addition, the “soft”calibration reduces systematic biases in observed reflectancebut there are remaining errors especially in the degradationcorrection due to sampling, which will introduce some sea-sonal dependent biases.
5. Conclusions
[38] The GOME-2 reflectance is characterized and cor-rected by comparing experimental and simulated data for thewavelength range of 270–350 nm. The simulations are cal-culated with VLIDORT, zonal mean MLS ozone profiles,and ozone climatology. The GOME-2 reflectance showssignificant wavelength- and cross-track-dependent biasesranging from �5 to 25%, especially at shorter wavelengths.For the overlap region of channels 1 and 2, the cross-track-position-dependent discontinuity ranges from 3.5 to 7%.Wavelength shifts introduce high-resolution structures inband 2b, suggesting the need for additional wavelength cal-ibration. Spatial comparison shows that the derived reflec-tance correction in band 2b is constant with varying latitudeas well as the SZA. In band 1a, uncorrected stray lightremains, varying seasonally and latitudinally. Temporal
analysis indicates that GOME-2 reflectance degrades overtime by 3–15% for 290 nm and by less than 2.2% for 325 nmfrom 2007 to 2009. The degradation depends on wavelengthand scan angle. Long-term degradation still needs to beinvestigated. The radiance error identified is a combination oferrors in radiometric calibration and radiative transfer mod-eling, as well as of assumptions that go into the forwardmodeling. Although there are errors from forward modelparameters (e.g., temperature profiles, ozone cross section,reference spectra, MLS ozone, ozone climatology, and theOMI total ozone column) and there are differences due toPPF versions, the overall features suggest problems inradiometric calibration. We also verify polarization mea-surements (Stokes fractions) observed by GOME-2 directlywith modeled values in the ozone Huggins absorption band.For highly polarized cases, the observed Stokes fractionsagree well with simulations, with mean biases ranging from�1.0 to 2.9%.[39] We have derived a first-order correction to GOME-2
radiance in the UV using average difference between mea-sured and simulated reflectance in the tropics. This “soft”calibration is presented as a function of wavelength, cross-track position, and time. We apply the correction indepen-dent of latitude. Comparisons of ozone retrievals with andwithout radiometric correction and MLS ozone profilesverify that the derived reflectance correction can improveretrieved ozone profiles, and reduce fitting residuals by 30%in band 2b. The GOME-2 level 1b data have in some sensebeen calibrated to MLS, so we validate the accuracy of finalozone profile retrievals with independent MIPAS and ozo-nesondes measurements. The retrieved ozone profiles andtropospheric ozone column from recalibrated GOME-2 level1b data agree well with these data. The soft calibrationderived from this study can be obtained from the first authorand will be updated with the process PPF of GOME-2.
[40] Acknowledgments. This study was supported by the NationalScience Foundation of China under grant 41075014 and the Public Meteorol-ogy Special Foundation of MOST (grant GYHY201106045). Research at theSmithsonian Astrophysical Observatory was funded by NASA and the Smith-sonian Institution.We thank EUMETSAT for providing GOME-2 level 1 dataand the OMI science team,MLS science team, andWOUDC for providing thesatellite data and ozonesonde data. We thank C. G. Wang, H. B. Chen,and C. J. Bian for providing ozonesonde data at Beijing. We also thankR. J. D. Spurr for providing the VLIDORT code.
ReferencesAben, I., C. P. Tanzi, W. Hartmann, D. M. Stam, and P. Stammes (2003),Validation of space-based polarization measurements by use of a single-scattering approximation, with application to the Global Ozone MonitoringExperiment, Appl. Opt., 42(18), 3610–3619, doi:10.1364/AO.42.003610.
Bhartia, P. K., and W. C. Wellemeyer (2002), TOMS-V8 total O3 algo-rithm, in OMI Ozone Products, vol. 2, OMI Algorithm Theoretical BasisDocument, edited by P. K. Bhartia, pp. 51–73, NASA Goddard SpaceFlight Cent., Greenbelt, Md.
Bovensmann, H., J. P. Burrows, M. Buchwitz, J. Frerick, S. Noël, V. V.Rozanov, K. V. Chance, and A. P. H. Goede (1999), SCIAMACHY:Mission objectives and measurement modes, J. Atmos. Sci., 56,127–150, doi:10.1175/1520-0469(1999)056<0127:SMOAMM>2.0.CO;2.
Brion, J., A. Chakir, D. Daumont, J. Malicet, and C. Parisse (1993), High-resolution laboratory absorption cross section of O3: Temperature effect,Chem. Phys. Lett., 213(5–6), 610–612, doi:10.1016/0009-2614(93)89169-I.
Ceccherini, S., U. Cortesi, P. T. Verronen, and E. Kyrölä (2008), Technicalnote: Continuity of MIPAS-ENVISAT operational ozone data qualityfrom full- to reduced-spectral-resolution operation mode, Atmos. Chem.Phys., 8(8), 2201–2212, doi:10.5194/acp-8-2201-2008.
CAI ET AL.: VALIDATION OF GOME-2 REFLECTANCE D07305D07305
15 of 16

Chance, K., and R. L. Kurucz (2010), An improved high-resolution solarreference spectrum for Earth’s atmosphere measurements in the ultraviolet,visible, and near infrared, J. Quant. Spectrosc. Radiat. Transfer, 111(9),1289–1295, doi:10.1016/j.jqsrt.2010.01.036.
Chance, K., T. P. Kurosu, and C. E. Sioris (2005), Undersampling correc-tion for array detector-based satellite spectrometers, Appl. Opt., 44(7),1296–1304, doi:10.1364/AO.44.001296.
Chauhan, S., et al. (2009), MIPAS reduced spectral resolution UTLS-1mode measurements of temperature, O3, HNO3, N2O, H2O and relativehumidity over ice: Retrievals and comparison to MLS, Atmos. Meas.Tech., 2(2), 337–353, doi:10.5194/amt-2-337-2009.
Cortesi, U., et al. (2007), Geophysical validation of MIPAS-ENVISAT opera-tional ozone data, Atmos. Chem. Phys., 7(18), 4807–4867, doi:10.5194/acp-7-4807-2007.
European Organisation for the Exploitation of Meteorological Satellites(EUMETSAT) (2006), GOME-2 Level 1 product generation specifica-tion, EPS.SYS.SPE.990011, Darmstadt, Germany.
European Organisation for the Exploitation of Meteorological Satellites(EUMETSAT) (2008), GOME-2 PMD band definitions 3.0 and PMDcalibration, EUM/OPS-EPS/DOC/07/0601, Darmstadt, Germany.
European Organisation for the Exploitation of Meteorological Satellites(EUMETSAT) (2009), GOME-2 FM3 long-term in-orbit degradation:Status after 2nd throughput test, EUM.OPS-EPS.TEN.09.0318, Darmstadt,Germany.
Froidevaux, L., et al. (2008), Validation of Aura Microwave Limb Sounderstratospheric ozone measurements, J. Geophys. Res., 113, D15S20,doi:10.1029/2007JD008771.
Hasekamp, O. P., and J. Landgraf (2001), Ozone profile retrieval from back-scattered ultraviolet radiances: The inverse problem solved by regulariza-tion, J. Geophys. Res., 106(D8), 8077–8088, doi:10.1029/2000JD900692.
Hasekamp, O. P., and J. Landgraf (2002), Tropospheric ozone informa-tion from satellite-based polarization measurements, J. Geophys. Res.,107(D17), 4326, doi:10.1029/2001JD001346.
Hoogen, R., V. Rozanov, and J. Burrows (1999), Ozone profiles from GOMEsatellite data: Algorithm description and first validation, J. Geophys. Res.,104(D7), 8263–8280, doi:10.1029/1998JD100093.
Jiang, Y. B., et al. (2007), Validation of Aura Microwave Limb SounderOzone by ozonesonde and lidar measurements, J. Geophys. Res., 112,D24S34, doi:10.1029/2007JD008776.
Joiner, J., and A. C. Aikin (1996), Temporal and spatial variations in upperatmospheric Mg+, J. Geophys. Res., 101(A3), 5239–5249, doi:10.1029/95JA03517.
Kleipool, Q. L., M. R. Dobber, J. F. de Haan, and P. F. Levelt (2008), Earthsurface reflectance climatology from 3 years of OMI data, J. Geophys.Res., 113, D18308, doi:10.1029/2008JD010290.
Koelemeijer, R., P. Stammes, J. Hovenier, and J. D. Haan (2001), A fastmethod for retrieval of cloud parameters using oxygen A band measure-ments from the Global Ozone Monitoring Experiment, J. Geophys. Res.,106(D4), 3475–3490, doi:10.1029/2000JD900657.
Koelemeijer, R. B. A., J. F. de Haan, and P. Stammes (2003), A databaseof spectral surface reflectivity in the range 335–772 nm derived from5.5 years of GOME observations, J. Geophys. Res., 108(D2), 4070,doi:10.1029/2002JD002429.
Krijger, J. M., I. Aben, and J. Landgraf (2005a), CHEOPS-GOME: WP2.1:Study of instrument degradation, SRON-EOS/RP/05–018, Eur. SpaceAgency, Paris.
Krijger, J. M., C. P. Tanzi, I. Aben, and F. Paul (2005b), Validation ofGOME polarization measurements by method of limiting atmospheres,J. Geophys. Res., 110, D07305, doi:10.1029/2004JD005184.
Liu, X., K. Chance, C. E. Sioris, R. J. D. Spurr, T. P. Kurosu, R. V. Martin,and M. J. Newchurch (2005), Ozone profile and tropospheric ozoneretrievals from the Global Ozone Monitoring Experiment: Algorithmdescription and validation, J. Geophys. Res., 110, D20307, doi:10.1029/2005JD006240.
Liu, X., K. Chance, and T. P. Kurosu (2007), Improved ozone profile retrie-vals from GOME data with degradation correction in reflectance, Atmos.Chem. Phys., 7(6), 1575–1583, doi:10.5194/acp-7-1575-2007.
Liu, X., P. K. Bhartia, K. Chance, and R. J. D. Spurr (2009), Monitoring oftropospheric ozone from backscattered ultraviolet/visible measurementson geostationary platforms, Eos Trans. AGU, 90(52), Fall Meet. Suppl.,Abstract A53A-0243.
Liu, X., P. K. Bhartia, K. Chance, R. J. D. Spurr, and T. P. Kurosu (2010a),Ozone profile retrievals from the Ozone Monitoring Instrument, Atmos.Chem. Phys., 10(5), 2521–2537, doi:10.5194/acp-10-2521-2010.
Liu, X., P. K. Bhartia, K. Chance, L. Froidevaux, R. J. D. Spurr, and T. P.Kurosu (2010b), Validation of Ozone Monitoring Instrument (OMI)ozone profiles and stratospheric ozone columns with Microwave LimbSounder (MLS) measurements, Atmos. Chem. Phys., 10(5), 2539–2549,doi:10.5194/acp-10-2539-2010.
McPeters, R. D., G. J. Labow, and J. A. Logan (2007), Ozone climatologicalprofiles for satellite retrieval algorithms, J. Geophys. Res., 112, D05308,doi:10.1029/2005JD006823.
McPeters, R., et al. (2008), Validation of the Aura Ozone MonitoringInstrument total column ozone product, J. Geophys. Res., 113, D15S14,doi:10.1029/2007JD008802.
Munro, R., R. Siddans, W. J. Reburn, and B. J. Kerridge (1998), Directmeasurement of tropospheric ozone distributions from space, Nature,392(6672), 168–171, doi:10.1038/32392.
Murray, J. E. (1994), Atlas of the spectrum of a platinum/chromium/neonhollow-cathode reference lamp in the region 240–790 nm, report, Eur.Space Agency, Paris.
Nowlan, C. R., X. Liu, K. Chance, Z. Cai, T. P. Kurosu, C. Lee, andR. V. Martin (2011), Retrievals of sulfur dioxide from the Global OzoneMonitoring Experiment 2 (GOME-2) using an optimal estimationapproach: Algorithm and initial validation, J. Geophys. Res., 116,D18301, doi:10.1029/2011JD015808.
Rodgers, C. D. (2000), Inverse Methods for Atmospheric Sounding: Theoryand Practice, World Sci., Hackensack, N. J.
Siddans, R. B. J. K., B. G. Latter, J. Smeets, G. Otter, and S. Slijkhuis(2006), Analysis of GOME-2 slit function measurements: Final report,EUM/CO/04/1298/RM, Eur. Organ. for the Exploit. of Meteorol. Satell.,Darmstadt, Germany.
Sioris, C., and W. Evans (2000), Impact of rotational Raman scattering inthe O2 A band, Geophys. Res. Lett., 27(24), 4085–4088, doi:10.1029/2000GL012231.
Sneep, M., J. F. de Haan, P. Stammes, P. Wang, C. Vanbauce, J. Joiner,A. P. Vasilkov, and P. F. Levelt (2008), Three-way comparison betweenOMI and PARASOL cloud pressure products, J. Geophys. Res., 113,D15S23, doi:10.1029/2007JD008694.
Snel, R. (2000), In-orbit optical path degradation: GOME experience andSCIAMACHY prediction, paper SP-461 presented at ERS Envisat Sym-posium, Eur. Space Agency, Göteborg, Sweden.
Spurr, R. J. D. (2006), VLIDORT: A linearized pseudo-spherical vectordiscrete ordinate radiative transfer code for forward model and retrievalstudies in multilayer multiple scattering media, J. Quant. Spectrosc.Radiat. Transfer, 102(2), 316–342, doi:10.1016/j.jqsrt.2006.05.005.
Stammes, P., M. Sneep, J. F. de Haan, J. P. Veefkind, P. Wang, andP. F. Levelt (2008), Effective cloud fractions from the Ozone MonitoringInstrument: Theoretical framework and validation, J. Geophys. Res., 113,D16S38, doi:10.1029/2007JD008820.
Tilstra, L. G., G. van Soest, and P. Stammes (2005), Method for in-flightsatellite calibration in the ultraviolet using radiative transfer calculations,with application to Scanning Imaging Absorption Spectrometer forAtmospheric Chartography (SCIAMACHY), J. Geophys. Res., 110,D18311, doi:10.1029/2005JD005853.
Tilstra, L. G., O. N. E. Tuinder, and P. Stammes (2010), GOME-2 absorbingaerosol index: Statistical analysis, comparison to GOME-1 and impact ofinstrument degradation, paper presented at 2010 Meteorological SatelliteConference, Eur. Organ. for the Exploit. of Meteorol. Satell., Darmstadt,Germany.
Torres, O., P. Bhartia, J. Herman, Z. Ahmad, and J. Gleason (1998), Deri-vation of aerosol properties from satellite measurements of backscatteredultraviolet radiation: Theoretical basis, J. Geophys. Res., 103(D14),17,099–17,110, doi:10.1029/98JD00900.
van der A, R. J., R. F. van Oss, A. J. M. Piters, J. P. F. Fortuin, Y. J. Meijer,and H. M. Kelder (2002), Ozone profile retrieval from recalibrated GlobalOzone Monitoring Experiment data, J. Geophys. Res., 107(D15), 4239,doi:10.1029/2001JD000696.
van Soest, G., L. G. Tilstra, and P. Stammes (2005), Large-scale validationof SCIAMACHY reflectance in the ultraviolet, Atmos. Chem. Phys., 5(8),2171–2180, doi:10.5194/acp-5-2171-2005.
World Meteorological Organization (1998), SPARC/IO3C/GAW assessmentof trends in the vertical distribution of ozone, Rep. 43, Global OzoneRes. and Monit. Proj., Geneva, Switzerland.
Yang, K., X. Liu, P. K. Bhartia, N. A. Krotkov, S. A. Carn, E. J. Hughes,A. J. Krueger, R. J. D. Spurr, and S. G. Trahan (2010), Direct retrieval ofsulfur dioxide amount and altitude from spaceborne hyperspectral UVmeasurements: Theory and application, J. Geophys. Res., 115, D00L09,doi:10.1029/2010JD013982.
Z. Cai and Y. Liu, Key Laboratory of Middle Atmosphere and GlobalEnvironment Observation, Institute of Atmospheric Physics, ChineseAcademy of Sciences, Beijing 100029, China. ([email protected])K. Chance, X. Liu, C. R. Nowlan, and R. Suleiman, Harvard-Smithsonian
Center for Astrophysics, Cambridge, MA 02138, USA.R. Lang and R. Munro, EUMETSAT, D-64295 Darmstadt, Germany.
CAI ET AL.: VALIDATION OF GOME-2 REFLECTANCE D07305D07305
16 of 16