characterization and heating value prediction of municipal
TRANSCRIPT
International Journal of Environmental & Agriculture Research (IJOEAR) ISSN:[2454-1850] [Vol-7, Issue-1, January- 2021]
Page | 14
Characterization and Heating value Prediction of Municipal
solid waste Yohannis Fetene
Ethiopian Environment & Forest Research Institute, Environmental Pollution Management Research Directorate, P.O. Box
1187, Addis Ababa, Ethiopia
Abstract— There is an increasing trend of using municipal solid waste as an alternative energy resource, burning and
converting it into energy in the form of heat or steam or electricity. The aim of this study is to predict energy value of MSW
using compositional and proximate-based analysis of solid waste and compare the reliability of models in predicting the
energy recovery potentials from different solid waste components. Physical characterization showed that food, yard, textile,
leather, rubber, wood scrap, yard, metal, plastic and paper waste were the constituents of all waste samples in the
study area, but in varying proportions. The energy content of combustible solid waste was estimated to be 17.50 MJ/kg for
gross heating value, and 9.54 MJ/kg for net heating value, which revealed the suitability of solid waste as energy recovery
option. In this study several proposed composition and proximate-based mathematical models have been used to estimate the
HHV of municipal solid waste. The average high heating values estimated from some models were found to be 16.27 ± 0.90
MJ/kg (Model II), 16.45 ± 0.43 MJ/kg (Model III), 18.97 ± 0.03 MJ/kg (Model XVIII), and 16.60 ± 0.32 MJ/kg (Model XXIV)
which were closely match the value with experimentally determined calorific value as 17.50 ± 0.68 MJ/kg. Therefore, it is
concluded that the quantity of energy obtainable from a known amount and composition of mixed solid waste can be
estimated using already developed models without conducting calorimetric experiments.
Keywords— Characterization, Heating value; Models, Proximate Analysis, Municipal solid waste.
I. INTRODUCTION
Municipal solid wastes, collected from cities, have recently thought as one of the important renewable energy resources.
Recovering energy by means of a number of energy generation processes such as combustion, pyrolysis and gasification
from municipal solid waste is feasible [1]. This method will reduce the quantity of incoming solid waste to dumping site and
also open opportunities for new technologies in treating MSW. The first step to understand the feasibility of design energy
conversion (incineration plan) is to obtain the basic data regarding to quantity and quality of generated MSW [2].
This research study was primarily motivated by the lack of laboratory facilities in calorific value and ultimate analysis in
Ethiopia and this article is a continuation of Fetene et al., [3] and aims to determine the reliability of models in predicting the
energy recovery potentials from different solid waste components at Jimma city households. Researchers have developed
many empirical models. The mathematic models for the evaluation of heating value from physical and chemical properties
have been developed by several researchers, and have reviewed several of these models based on physical composition and
proximate and ultimate analysis [4]–[9]. However, given the determination of ultimate analysis data is relatively expensive,
therefore, for the practice purpose correlation based on proximate analysis data will be more profitable. This data is the
easiest and most widely used in the characterization of fuels mainly solid fuel.
Received: 26 December 2020/ Revised: 7 January 2021/ Accepted: 15 January 2021/ Published: 31-01-2021
Copyright @ 2021 International Journal of Environmental and Agriculture Research
This is an Open-Access article distributed under the terms of the Creative Commons Attribution
Non-Commercial License (https://creativecommons.org/licenses/by-nc/4.0) which permits unrestricted
Non-commercial use, distribution, and reproduction in any medium, provided the original work is properly cited .

International Journal of Environmental & Agriculture Research (IJOEAR) ISSN:[2454-1850] [Vol-7, Issue-1, January- 2021]
Page | 15
II. MATERIALS AND METHODS
2.1 Sampling Protocol and waste characteristics
Each of the 6 districts/kebeles was sampled at random three times a year in all seasons namely: dry (March), rainy (July), and
in between the two seasons (November) [10], [11]. The waste from the assigned households was collected onto a clean,
impervious floor where it was mixed rapidly with a shovel and quartered. Finally, components of solid wastes were sorted,
weighed and recorded based on the standard procedure [10], [11]. Homogenized samples with appropriate sampling,
handling and transportation mechanism were taken to laboratory for proximate analysis and calorific value determination.
2.2 Proximate analysis
The proximate analysis, gives percent of moisture content, ash content, volatile matter and fixed carbon, were determined by
putting the samples to different range of temperature (100°C to 950°C). The laboratory methods to measuring the proximate
analysis of samples in this study were conducted according to ASTM standards described in [10], [12] [13], [14].
2.2.1 Moisture content (ASTM D 3173)
The sample will be dried in an oven at 105°C for one hour to a constant weight. The percent MC was calculated as a
percentage loss in weight before and after drying for each solid waste component.
2.2.2 Ash Contents (ASTM D 3174)
The ash content was determined by drying the samples and burning at 750°C for 1 hour in a furnace.
2.2.3 Volatile matter (ASTM D 3175)
The dried sample will be heated at 950°C for seven minute in muffle furnace. After combustion, the samples were weighed
to determine the ash dry weight, with volatile solids being the difference between the dried solids and the ash
2.2.4 Fixed Carbon
The carbon content in the ash sample was determined by removing the mass of volatile from the original mass of the sample
using the following equation:
FC = 100 − (%MC + %AC + %VS)
Where: MC is moisture content, AC is Ash content, VS is Volatile matter
2.3 Prediction of Energy content (calorific value)
Calorific value of solid waste usually described in terms of high heat value (HHV) and lower heat value (LHV), which can
be determined either experimentally using Bomb calorimeter or by using mathematical models [15]. The calorific value,
expressed as kcal/kg or KJ/Kg, Experimentally energy value is determined using Bomb calorimeter (ASTM D 5865-85) in
which the heat generated at a constant temperature of 25oC from the combustion of a dry sample is measured [16] [17], [18].
In case when direct calorific value measurements are not feasible, empirical models can be useful to predict the calorific
value of municipal solid waste (MSW) [23]. Several models have been developed to describe and predict the energy content
of commingled MSW. The common independent variables in such empirical models are either the elemental composition
[23], the physical composition [24] or the proximate composition (i.e., the content in volatile matter, moisture, fixed carbon)
of MSW [20]. Some of the models that correlate the energy content of MSW with its composition and proximate analysis
used in study presented in Table 1 & 2.

International Journal of Environmental & Agriculture Research (IJOEAR) ISSN:[2454-1850] [Vol-7, Issue-1, January- 2021]
Page | 16
TABLE 1
MODELS SELECTED FROM LITERATURE REVIEW FOR THE PREDICTION OF HEATING VALUE BASED ON
SOLID WASTE COMPOSITIONAL ANALYSIS
Models Models Equation Basis Units References
Model I LHV = (23(PFo + 3.6PPa) + 160(PPt + PRu)) x 2.326 Wet kJ/kg [19]
Model II HHV = 112.15PFo + 183.386PPa + 288.737PPt + 5064.701 Wet kJ/kg [20]
Model III HHV = 81.209PFo + 285.035PPa + 8724.209 Wet kJ/kg [21]
Model IV HHV = 112.15PFo + 184.366PPa + 298.343Ppt - 1.920M + 5130.380 Wet kJ/kg [21]
Model V LHV = 6.0PFo + 22.1Ppa + 28.1PPt + 12.7PWo + 24.6PTe + 57.4PRu + 17.2PMi Wet Kcal/kg [22]
Model VI LHV = (45.2PFo + 47.3PPa + 58.6PPt + 32.4PWo + 38.6PTe + 62.3PRu + 50.1PMi)(100-
M)/100-6M Dry Kcal/kg [22]
Model VII LHV = (42.21TGa + 35.19PPa + 71.17PPt + 48.06PWo + 36.24PTe + 44PMi)(100-M)/100-
6M Dry Kcal/kg [22]
Model VIII LHV = 2229.91 + 4.87TGa + 7.9PPa – 37.28M Dry Kcal/kg [23]
Model IX HHV = 267.0(PPt/PPa) + 2285.7 Dry Kcal/kg [24]
Model X HHV = [88.2PPt + 40.5(PFo + PPa)] (100-W)/100 – 6W Dry Kcal/kg [24]
Model XI HHV = [(100 – W)/100][38.8(PPa + PFo + PT + POc) + 50.9(PTe + PRu) + 73.7PPt] – 6W Dry Kcal/kg [20]
PFo: food waste (wt%); PPa: paper and cardboard (wt%); PPt: plastics or plastics and rubber (wt%); PRu: rubber
(wt%); M: moisture (wt%); PWo: wood waste (wt%); PTe: textile (wt%); PMi: miscellaneous components (wt%);
TGa : garbage (wt%; textiles, wood, food waste, miscellaneous also included); W: water (wt%); PT: wood and
glass (wt%); POc: other combustibles (wt%).
TABLE 2
MODELS SELECTED FROM LITERATURE REVIEW FOR THE PREDICTION OF HEATING VALUE BASED ON
SOLID WASTE PROXIMATE ANALYSIS: Models Models Equation Basis Units References
XII HHV = -0.125M + 17.251 Dry (Wt %) MJ/kg [12]
XIII HHV = 19.44 - 0.258A Dry (Wt %) MJ/kg [12]
XIV HHV = 2.467 + 0.196VM Dry (Wt %) MJ/kg [12]
XV HHV = 9.355 + 0.38FC Dry (Wt %) MJ/kg [12]
XVI HHV = -9.509 +0.259(VM+FC) Dry (Wt %) MJ/kg [12]
XVII HHV = -30.727 + 0.459VM + 0.716FC Dry (Wt %) MJ/kg [12]
XVIII HHV = 0.192A + 0.459VM + 0.716FC - 30.727 Dry (Wt %) MJ/kg [12]
XIX HHV = 0.185A + 0.467VM + 0.712FC + 0.056M - 31.723 Dry (Wt %) MJ/kg [12]
XX HHV = 0.226A + 0.519(VM+ FC) -31.916 Dry (Wt %) MJ/kg [12]
XXI HHV = -10.81408 + 0.3133(VM + FC) Dry (Wt %) MJ/kg [21]
XXII HHV = 19.914 - 0.2324A Dry (Wt %) MJ/kg [8]
XXIII HHV = -3.0368 + 0.2218VM + 0.2601FC Dry (Wt %) MJ/kg [8]
XXIV HHV = 0.196FC + 14.119 Dry (Wt %) MJ/kg [6]
XXV HHV = 0.312FC + 0.1534VM Dry (Wt %) MJ/kg [25]
XXVI HHV = 0.3543FC + 0.1708VM Dry (Wt %) MJ/kg [26]
XXVII HHV = 356.248VM - 6998.497 Dry (Wt %) KJ/Kg [20]
XXVIII HHV = 356.047VM - 118.035FC - 5600.613 Dry (Wt %) KJ/Kg [20]
XXIX HHV = 44.75VM - 5.85W + 21.2 Wet (Wt %) Kcal/Kg [20]
III. RESULTS AND DISCUSSION
3.1 Waste characterization Studies
The composition of household solid waste are not homogeneous, it vary according to changes in commercial activities,
population behaviour, consumption patterns and economic growth rates. Food waste that include food left over, egg shells,
fruit or vegetable peels, cooked food, and food preparation wastes from residences comprise the largest component of Jimma
town HHs MSW stream which accounts 35.14%. Yard waste comprises the second largest components of Jimma town MSW
stream (23.65%), which includes grass clippings, leaves, and tree trimmings. Paper and paper products comprise 17.08% of
Jimma household MSW stream. This result is in agreement with those results obtained for Ethiopian cities Diriba [27] in

International Journal of Environmental & Agriculture Research (IJOEAR) ISSN:[2454-1850] [Vol-7, Issue-1, January- 2021]
Page | 17
Hawassa town, Cheru [28] in Dessie town where the food and yard waste were found to be the major component of the solid
waste stream generated. The products that comprise paper and paperboard wastes are newspapers, magazines, office papers,
tissue paper, cigarette packages and towels, paper plates and cups, corrugated boxes, milk cartons. Plastic products comprise
14.3% of the total MSW in Jimma town. Plastic products were found in nondurable goods (plastic plates and cups, trash
bags, disposable diapers), and plastic containers and packaging (soft drink bottles, bags, sacks, wraps). The plastic products
are consisting mainly of plastic food items, trash bags, milk and water bottles, and soft drink bottles.
Metals comprising 0.07% of the total MSW consists mainly of aluminium (foil), ferrous metals (iron and steel found in
appliances, furniture, and corroded metal scrap, containers and packaging materials), and non-ferrous metals (copper, zinc,
and lead found in durable products such as appliances and consumer electronics). Glass and ceramics products comprise
0.40% of the total MSW and occurred primarily in the form of containers as soft drink bottles, bottles and jars of food, and
other consumer products. Textile (occurred in discarded clothing, footwear) and rubber and leather products (occurred in
bicycle tires, Leather (clothing and shoes) were found in Jimma MSW stream in small amount (1.07% and 1.46%
respectively). Some hazardous materials (insignificant amount) were also recognized in Household MSW stream of Jimma
town such as paint strippers, batteries and paint residues. Accordingly, about 33.31% of total wastes generated have a
potential for recycling and consisting of paper products (17.08%), plastic waste (14.3%), wood scrap waste (1.46%), metals
waste (0.07%), and glass and ceramics waste (0.4%). Knowing that not whole portion of paper, plastic, wood scrap, metals
and glass and ceramics waste are applicable for recycling; a separate study should be conducted to separate all materials into
recyclable and non-recyclable portion. In general, household solid waste in Jimma city is characterized by a high organic
content and combustible matter consisting of food, yard, textile, paper, and plastic comprising 91.24% of the total waste
suggesting that energy and plant nutrients can be recovered.
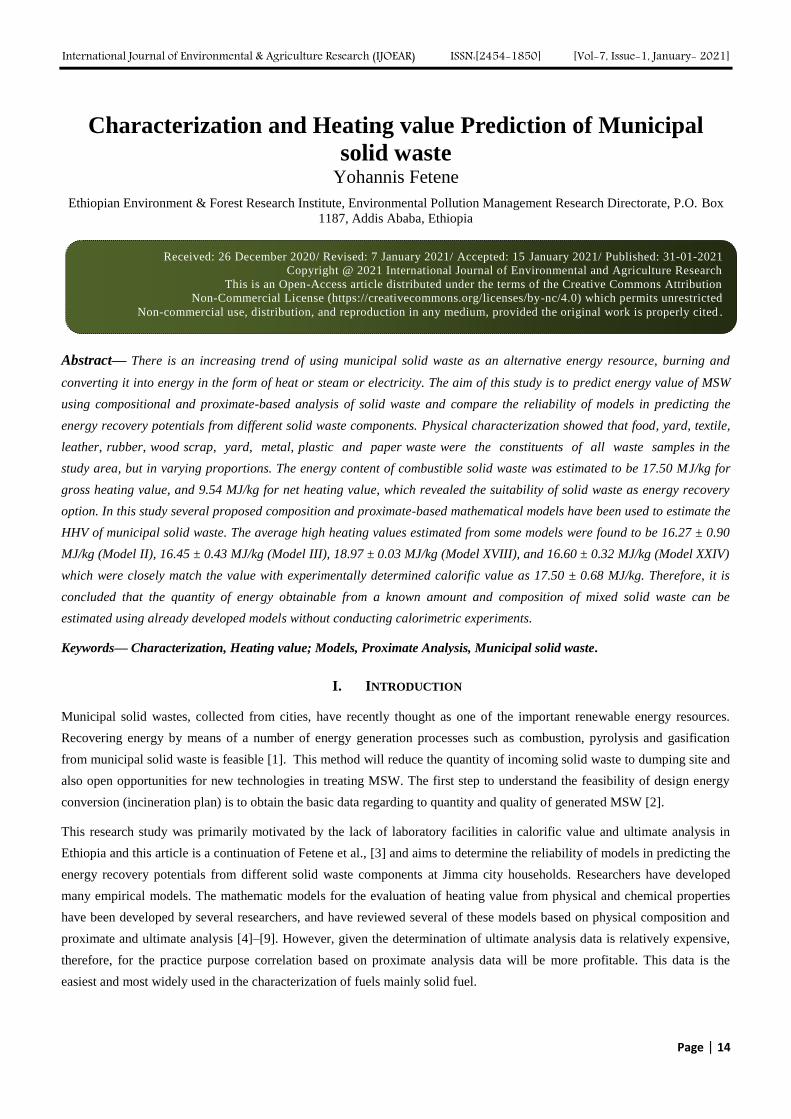
As Figure 2 shows, the result from quantity of yard waste wasn’t consistent during the sampling period and fluctuated from
21.05 to 26.31%. Another main component was the paper and paper which made about 17.08% and 14.3% of the total
weight. According to the result from sorting process, the amount of mixed paper, wood, Rubber & Leather, glass & ceramics
and metals that comes from residential weren’t much different during the sampling period, with an average 17.08%, 0.52%,
1.46%, 0.40%, and 0.07% of total waste per day respectively (Fig. 1).
FIGURE 1: Variation of waste categories quantity within a week
3.2 Chemical Waste composition Analysis
Another important parameters used for prediction of MSW heating value is proximate analysis basically it helps in deciding
and setting up a good waste processing and disposal facility in the city and in determination of efficiency of a waste
treatment process [29]. Proximate analysis involves determination of moisture content, volatile matter, ash content and fixed
carbon of sample. The analysis was performed according to ASTM method. In [3] were reported that MSM in Jimma city,
containing an average of 63.38% volatile matter, 3.13% ash, and 4.08% fixed carbon in dry basis, and the average moisture
content is 39.60%. High moisture content of solid waste has negative and undesirable effect on applicability of the waste for
energy recovery as it adds weight to the fuel without adding to the heating value. Result from moisture content analysis
directly affected by the quantity of wet basis materials such as yard waste and food waste in waste stream. Higher percentage
of yard waste (28.17%) and food waste (34.79%) on Sunday compare with result on Tuesday (yard waste 22.92 % and food
waste 25.33%) is the reason of increasing the percentage of moisture content.
International Journal of Environmental & Agriculture Research (IJOEAR) ISSN:[2454-1850] [Vol-7, Issue-1, January- 2021]
Page | 18
FIGURE 2: Obtained results from proximate analysis of composite household solid waste
The inorganic components including miscellaneous present in the sample (stones, metals, glass, etc.) were removed from
laboratory analysis after sorting. Therefore, only the selected organic & combustible fraction of the households MSW was
analysed. Based on the above, the results of the analyses of the household MSW are expressed on a per organic
fraction basis; that is, the results are expressed per MSW fraction after the removal of the inorganic components
(stones, glass, metals), since no calorific value analyses were performed on the inorganic fraction. To express calorific value
per total commingled MSW, then the values reported here should be multiplied by [1- inorganic fraction of the commingled
MSW]. The inorganic fraction of the commingled MSW used in this research work ranged from 0.16 to 0.23.
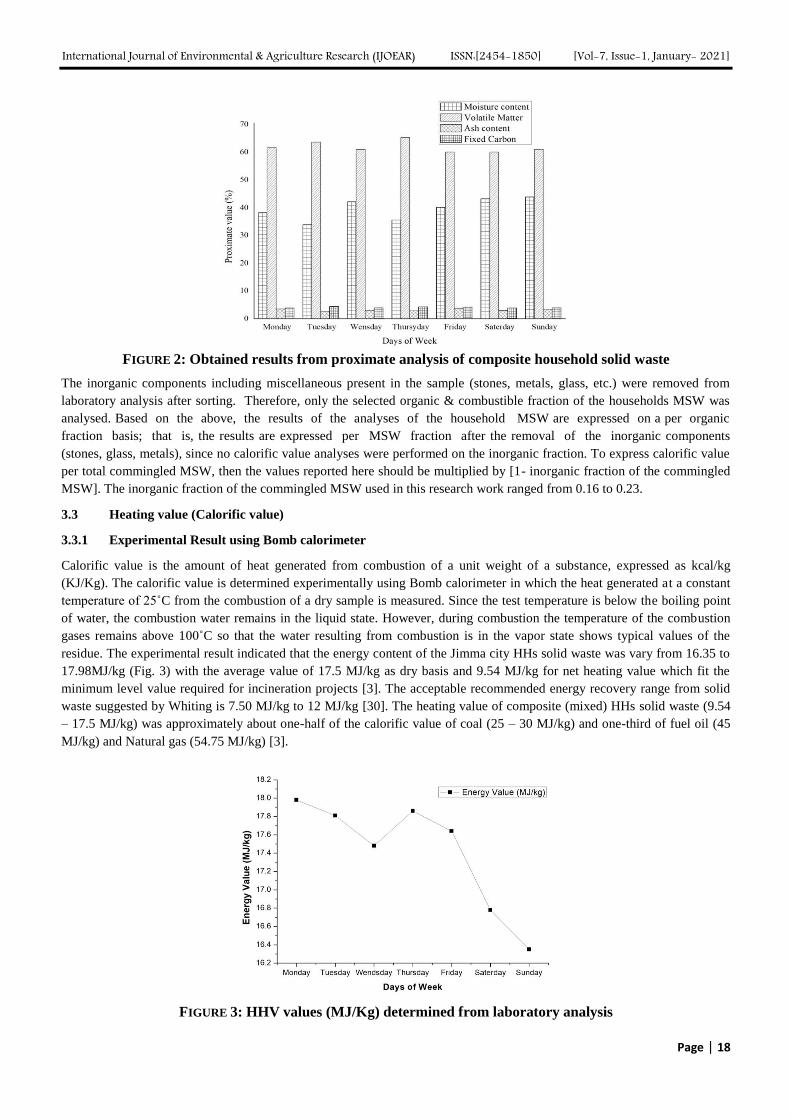
3.3 Heating value (Calorific value)
3.3.1 Experimental Result using Bomb calorimeter
Calorific value is the amount of heat generated from combustion of a unit weight of a substance, expressed as kcal/kg
(KJ/Kg). The calorific value is determined experimentally using Bomb calorimeter in which the heat generated at a constant
temperature of 25˚C from the combustion of a dry sample is measured. Since the test temperature is below the boiling point
of water, the combustion water remains in the liquid state. However, during combustion the temperature of the combustion
gases remains above 100˚C so that the water resulting from combustion is in the vapor state shows typical values of the
residue. The experimental result indicated that the energy content of the Jimma city HHs solid waste was vary from 16.35 to
17.98MJ/kg (Fig. 3) with the average value of 17.5 MJ/kg as dry basis and 9.54 MJ/kg for net heating value which fit the
minimum level value required for incineration projects [3]. The acceptable recommended energy recovery range from solid
waste suggested by Whiting is 7.50 MJ/kg to 12 MJ/kg [30]. The heating value of composite (mixed) HHs solid waste (9.54
– 17.5 MJ/kg) was approximately about one-half of the calorific value of coal (25 – 30 MJ/kg) and one-third of fuel oil (45
MJ/kg) and Natural gas (54.75 MJ/kg) [3].
FIGURE 3: HHV values (MJ/Kg) determined from laboratory analysis
International Journal of Environmental & Agriculture Research (IJOEAR) ISSN:[2454-1850] [Vol-7, Issue-1, January- 2021]
Page | 19
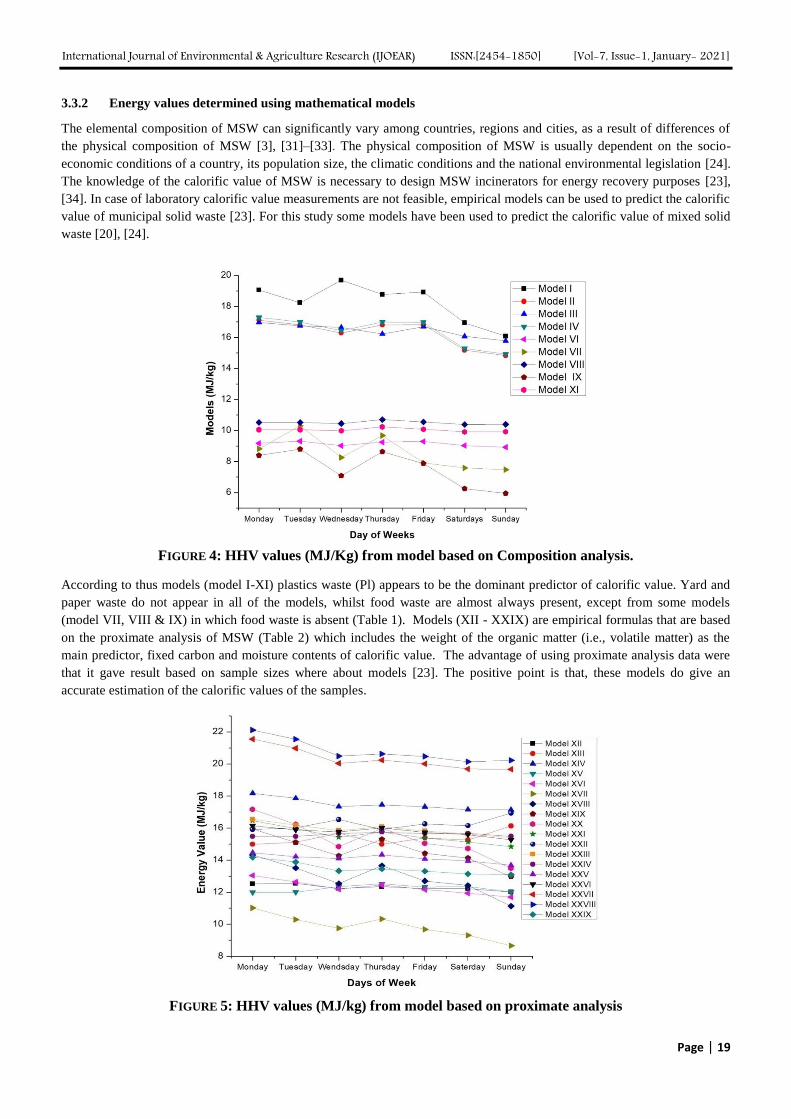
3.3.2 Energy values determined using mathematical models
The elemental composition of MSW can significantly vary among countries, regions and cities, as a result of differences of
the physical composition of MSW [3], [31]–[33]. The physical composition of MSW is usually dependent on the socio-
economic conditions of a country, its population size, the climatic conditions and the national environmental legislation [24].
The knowledge of the calorific value of MSW is necessary to design MSW incinerators for energy recovery purposes [23],
[34]. In case of laboratory calorific value measurements are not feasible, empirical models can be used to predict the calorific
value of municipal solid waste [23]. For this study some models have been used to predict the calorific value of mixed solid
waste [20], [24].
FIGURE 4: HHV values (MJ/Kg) from model based on Composition analysis.
According to thus models (model I-XI) plastics waste (Pl) appears to be the dominant predictor of calorific value. Yard and
paper waste do not appear in all of the models, whilst food waste are almost always present, except from some models
(model VII, VIII & IX) in which food waste is absent (Table 1). Models (XII - XXIX) are empirical formulas that are based
on the proximate analysis of MSW (Table 2) which includes the weight of the organic matter (i.e., volatile matter) as the
main predictor, fixed carbon and moisture contents of calorific value. The advantage of using proximate analysis data were
that it gave result based on sample sizes where about models [23]. The positive point is that, these models do give an
accurate estimation of the calorific values of the samples.
FIGURE 5: HHV values (MJ/kg) from model based on proximate analysis
International Journal of Environmental & Agriculture Research (IJOEAR) ISSN:[2454-1850] [Vol-7, Issue-1, January- 2021]
Page | 20
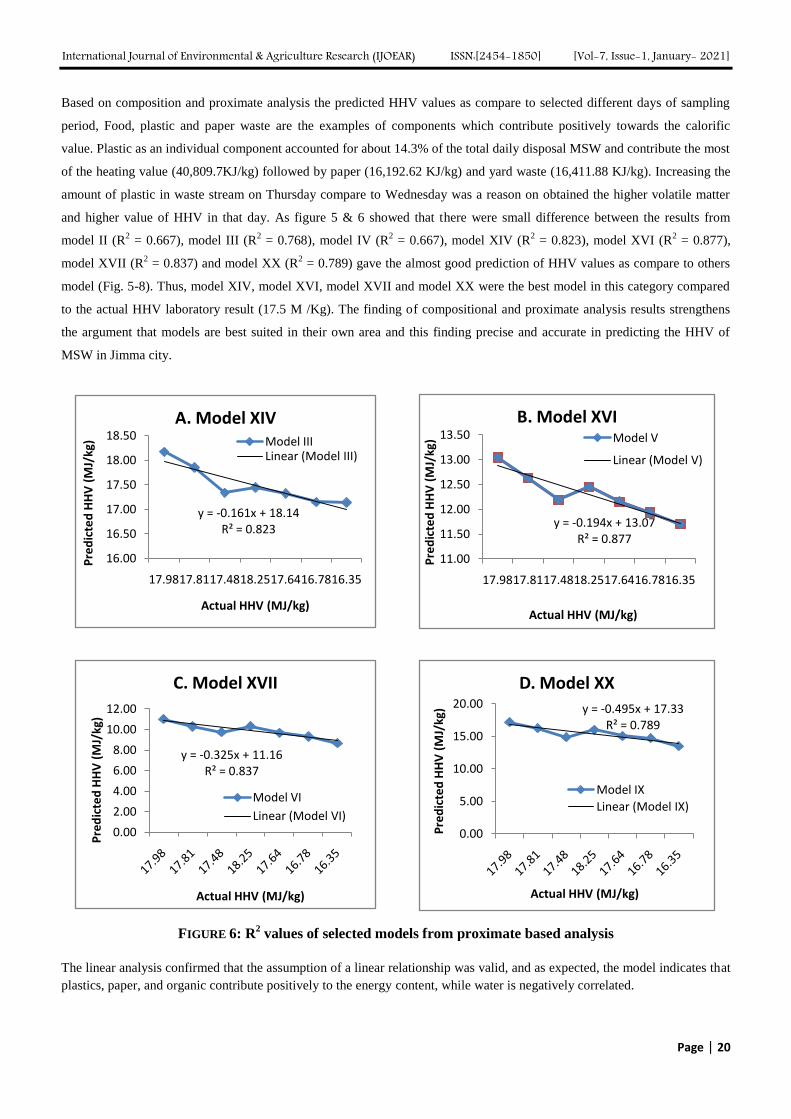
Based on composition and proximate analysis the predicted HHV values as compare to selected different days of sampling
period, Food, plastic and paper waste are the examples of components which contribute positively towards the calorific
value. Plastic as an individual component accounted for about 14.3% of the total daily disposal MSW and contribute the most
of the heating value (40,809.7KJ/kg) followed by paper (16,192.62 KJ/kg) and yard waste (16,411.88 KJ/kg). Increasing the
amount of plastic in waste stream on Thursday compare to Wednesday was a reason on obtained the higher volatile matter
and higher value of HHV in that day. As figure 5 & 6 showed that there were small difference between the results from
model II (R2 = 0.667), model III (R
2 = 0.768), model IV (R
2 = 0.667), model XIV (R
2 = 0.823), model XVI (R
2 = 0.877),
model XVII (R2 = 0.837) and model XX (R
2 = 0.789) gave the almost good prediction of HHV values as compare to others
model (Fig. 5-8). Thus, model XIV, model XVI, model XVII and model XX were the best model in this category compared
to the actual HHV laboratory result (17.5 M /Kg). The finding of compositional and proximate analysis results strengthens
the argument that models are best suited in their own area and this finding precise and accurate in predicting the HHV of
MSW in Jimma city.
FIGURE 6: R2 values of selected models from proximate based analysis
The linear analysis confirmed that the assumption of a linear relationship was valid, and as expected, the model indicates that
plastics, paper, and organic contribute positively to the energy content, while water is negatively correlated.
y = -0.161x + 18.14R² = 0.823
16.00
16.50
17.00
17.50
18.00
18.50
17.9817.8117.4818.2517.6416.7816.35
Pre
dic
ted
HH
V (
MJ/
kg)
Actual HHV (MJ/kg)
A. Model XIVModel IIILinear (Model III)
y = -0.194x + 13.07R² = 0.877
11.00
11.50
12.00
12.50
13.00
13.50
17.9817.8117.4818.2517.6416.7816.35
Pre
dic
ted
HH
V (
MJ/
kg)
Actual HHV (MJ/kg)
B. Model XVIModel V
Linear (Model V)
y = -0.325x + 11.16R² = 0.837
0.00
2.00
4.00
6.00
8.00
10.00
12.00
Pre
dic
ted
HH
V (
MJ/
kg)
Actual HHV (MJ/kg)
C. Model XVII
Model VI
Linear (Model VI)
y = -0.495x + 17.33R² = 0.789
0.00
5.00
10.00
15.00
20.00
Pre
dic
ted
HH
V (
MJ/
kg)
Actual HHV (MJ/kg)
D. Model XX
Model IX
Linear (Model IX)

International Journal of Environmental & Agriculture Research (IJOEAR) ISSN:[2454-1850] [Vol-7, Issue-1, January- 2021]
Page | 21
FIGURE 7: R2 values of selected models from Composition based analysis
IV. CONCLUSION
Physical characterization showed that a high combustible matter and organic waste consisting of food, yard, paper, plastic,
wood scrap, and textile waste comprised 91.24% of the total waste of Jimma city household solid waste, suggesting
concerting the waste to some economic and environmental characteristics. Estimates of the energy content of Jimma city's
household solid waste were made based on Experimental heating and mathematical models developed based on physical
composition and proximate analysis. Experimental values led to an estimation of 17.5 MJ/kg for gross heating value, and
9.54 MJ/kg for net heating value which fit the minimum level value required for incineration projects. Generally the heating
value of Jimma city household solid waste make it attractive feeds for clean energy production instead of fossil-based solid
fuels and can be alternative to the conventional fuels partially due to their high calorific value. The high heating values
estimated from selected models were found to be closely matched the value determined experimentally. Therefore, it is
concluded that the quantity of energy obtainable from a known amount and composition of solid waste can be estimated
without conducting laboratory calorimetric experiments.
ACKNOWLEDGEMENTS
The authors would like to thank Jimma University and administrative bodies of Jimma City. The authors also extend their
deepest gratitude to the study participants.
y = -0.173x + 17.13R² = 0.768
15.0 15.2 15.4 15.6 15.8 16.0 16.2 16.4 16.6 16.8 17.0 17.2
17.98 17.81 17.48 17.78 17.64 16.78 16.35
Pre
dic
ted
HH
V (
MJ/
kg)
Actual HHV (MJ/kg)
A. Model III
Model III
Linear (Model III)y = -0.356x + 17.83
R² = 0.677
13.50
14.00
14.50
15.00
15.50
16.00
16.50
17.00
17.50
18.00
17.98 17.81 17.48 17.78 17.64 16.78 16.35
Pre
dic
ted
HH
V (
MJ/
kg)
Actual HHV (MJ/kg)
B. Model IV
Model IV
Linear (Model IV)
y = -0.343x + 17.64R² = 0.677
13.50
14.00
14.50
15.00
15.50
16.00
16.50
17.00
17.50
17.98 17.81 17.48 17.78 17.64 16.78 16.35
Pre
dic
ted
HH
V (
MJ/
kg)
Actual HHV (MJ/kg)
C. Model II
Model II
Linear (Model II)
y = -0.192x + 8.192R² = 0.477
-
1.00
2.00
3.00
4.00
5.00
6.00
7.00
8.00
9.00
Pre
dic
ted
HH
V (
MJ/
kg)
Actual HHV (MJ/kg)
D. Model X
Model X
Linear (Model X)

International Journal of Environmental & Agriculture Research (IJOEAR) ISSN:[2454-1850] [Vol-7, Issue-1, January- 2021]
Page | 22
REFERENCES
[1] A. Kalantarifard and G. S. Yang, “Energy Potential from Municipal Solid waste in Tanjung Langsat Landfill, Johor, Malaysia,” Int.
J. Eng. Scienece Technol., vol. 3, no. 12, pp. 8560–8568, 2011.
[2] E. Akkaya and A. Demir, “Energy Content Estimation of Municipal Solid Waste By Multiple Regression Analysis,” in 5th
International Advanced Technologies Symposium (IATS’09), 2009, pp. 1–4.
[3] Y. Fetene, T. Addis, A. Beyene, and H. Kloos, “Valorisation of solid waste as key opportunity for green city development in the
growing urban areas of the developing world,” J. Environ. Chem. Eng., vol. 6, no. 6, pp. 7144–7151, 2018.
[4] M. Gunamantha, “Prediction of Higher Heating Value Bioorganic Fraction of Municipal Solid Waste from Proximate Analysis
Data,” Int. J. Eng. Res. Technlogy, vol. 5, no. 02, pp. 442–447, 2016.
[5] A. Ebrahimi, M. M. Amin, B. Bina, M. Mokhtari, and H. R. Alaghebandan, “Prediction of the energy content of the municipal solid
waste,” Int. J. Environ. Health Eng., vol. 1, no. 6, pp. 45–51, 2012.
[6] A. Demirbas and A. H. Demirbas, “Estimating the Calorific Values of Lignocellulosic Fuels,” Energy Explor. Exploit., vol. 22, no. 2,
pp. 135–143, 2004.
[7] X. Qian, S. Lee, A. Soto, and G. Chen, “Regression Model to Predict the Higher Heating Value of Poultry Waste from Proximate
Analysis,” MDPI, Resour., vol. 7, no. 39, 2018.
[8] C. Sheng and J. L. T. Azevedo, “Estimating the higher heating value of biomass fuels from basic analysis data,” Biomass and
Bioenergy, vol. 28, no. 5, p. 7009, 2005.
[9] H. Shu et al., “Prediction for Energy Content of Taiwan Municipal Solid Waste Using Multilayer Perceptron Neural Networks,” J.
Air Waste Manage. Assoc., vol. 56, no. 6, pp. 852–858, 2012.
[10] E. Gidarakos, G. Havas, and P. Ntzamilis, “Municipal solid waste composition determination supporting the integrated solid waste
management system in the island of Crete,” Waste Manag., 2005.
[11] T. Getahun et al., “Municipal solid waste generation in growing urban areas in Africa : Current practices and relation to
socioeconomic ...,” Environ. Monit. Assess., no. July, 2011.
[12] M. Gunamantha, “Prediction of Higher Heating Value Bioorganic Fraction of Municipal Solid Waste from Proximate Analysis
Data,” Int. J. Eng. Res. Technol., vol. 5, no. 02, pp. 442–447, 2016.
[13] K. Amin and Y. Go Su, “Identification of the Municipal Solid Waste Characteristics and Potential of Plastic Recovery at Bakri
Landfill, Muar, Malaysia. Journal of Sustainable Development , 1913-9071.,” J. Sustain. Dev., pp. 1913–9071, 2012.
[14] D. D. Gupte and P. G. Saptarshi, “Supply Chain Management as a Tool for Collection and Disposal of Organic Waste in Pune,”
Univers. J. Environ. Res. Technol., vol. 4, no. 2, pp. 261–268, 2012.
[15] A. Johari, H. Hashim, R. Mat, H. Alias, M. H. Hassim, and M. Rozainee, “Generalizatio, Formulation and Heat Contents of
Simulated MSW with High Moisture Content,” J. Eng. Sci. Technol., vol. 7, no. 6, pp. 701–710, 2012.
[16] S. Kumar, V. Subbaiah, P. Rao, M. Engineering, and S. C. R. Reddy, “Waste to Energy – A case study of Eluru city , Andhra
Pradesh,” Int. J. Environ. Sci., vol. 1, no. 2, pp. 151–162, 2010.
[17] J. S. Kumar, R. P. Prasada, and K. V. Subbaiah, “Waste to Energy– A case study of Eluru city, Andhra Pradesh,” Int. J. Environ. Sci.,
vol. 1, no. 2, pp. 151–162, 2010.
[18] R. Charles, J. S. Leander, B. Robert, and G. Mary, In Waste Management and Resource Recovery. Florida: CRC Press LLC, 1995.
[19] M. Z. A. Khan and Z. H. Abu-Ghararah, “New approach for estimating energy of municipal solid waste,” J. Environ. Engng, vol. 3,
pp. 376–380, 1991.
[20] S. Kathiravale, M. Yunus, K. Sopian, A. Samsuddin, and R. Rahman, “Modeling the heating value of Municipal Solid Waste,” Fuel,
vol. 82, pp. 1119–1125, 2003.
[21] L. Jiménez and F. González, “Study of the physical and chemical properties of lignocellulosic residues with a view to the production
of fuels,” Fuel, vol. 70, no. 8, pp. 947–950, 1991.
[22] A. Demirbas, “Relationships proximate analysis results and higher heating values of lignites,” Energy Sources, Part A Recover. Util.
Environ. Eff., vol. 30, no. 20, pp. 1876–1883, 2008.
[23] J. Liu, R. D. Paode, T. M. Holsen, and J. Liu, “Modeling the Energy Content of Municipal Solid Waste Using Multiple Regression
Analysis Modeling the Energy Content of Municipal Solid Waste Using Multiple Regression Analysis,” J. Air Waste Manage.
Assoc., vol. 46, no. 7, pp. 650–656, 2012.
[24] M. Abu-Qudais and H. Abu-Qdais, “Energy content of municipal solid waste in Jordan and its potential utilization,” Energy Convers.
Manag., vol. 41, pp. 983–991, 2000.
[25] A. Demirbas, “Calculation of higher heating values of biomass fuels,” Fuel, vol. 76, no. 5, pp. 431–4, 1997.
[26] T. Cordero, F. Marquez, J. Rodriquez-Mirasol, and J. J. Rodriguez, “Predicting heating values of lignocellulosic and carbonaceous
materials from proximate analysis,” Fuel, vol. 80, no. 2, pp. 1567–71, 2001.
[27] D. Dirba, “Household Solid waste generation rate, Composition and content analysis for disposal and resource recovery in two
selected kebeles of Hawassa Town.,” Addis Ababa University, 2009.
[28] S. Cheru, “Assessment of Municipal solid waste management service in Dessie town.,” Addis Ababa, 2011.
[29] K. Sapna, S., N. C., K. N. Arvind, and K. M. K., “Characterization of Municipal Solid Waste in Jalandhar City, Punjab, India,” J.
Hazardous, Toxic, Radioact. Waste, pp. 97–106, 2013.
[30] K. Whiting, “Large scale MSW incineration Technologies. Incineration of municipal Waste Report,. Leeds, UK: University of Leeds,
Department of Fuel and Energy.,” Leeds, UK, 2002.

International Journal of Environmental & Agriculture Research (IJOEAR) ISSN:[2454-1850] [Vol-7, Issue-1, January- 2021]
Page | 23
[31] M. Onifade, A. I. Lawal, A. E. Aladejare, S. Bada, and M. A. Idris, “Prediction of gross calorific value of solid fuels from their
proximate analysis using soft computing and regression analysis,” Int. J. Coal Prep. Util., pp. 1–15, 2019.
[32] H. Aslani and H. Taghipour, “Seasonal characterization and quantification of municipal solid waste: energy content and statistical
analysis,” J. Adv. Environ. Heal. Res., vol. 6, pp. 34–43, 2018.
[33] K. Haro, I. Ouarma, B. Nana, A. Bere, and J. Koulidiati, “Characterization and Potential Recovery of Household Solid Waste in the
City of Ouagadougou ( Burkina Faso ),” J. Environ. Prot. (Irvine,. Calif)., vol. 9, pp. 309–324, 2018.
[34] M. Rawat, A. L. Ramanathan, and T. Kuriakose, “Characterisation of Municipal Solid Waste Compost (MSWC) from Selected
Indian Cities: A Case Study for Its Sustainable Utilisation,” J. Environ. Prot. (Irvine,. Calif)., vol. 4, pp. 163–171, 2013.