characterization and mems applications of nanothermite materials a
TRANSCRIPT

CHARACTERIZATION AND MEMS APPLICATIONS OF NANOTHERMITE MATERIALS
A Dissertation Presented to the Faculty of the Graduate School
University of Missouri
In Partial Fulfillment
of the Requirements for the Degree
Doctor of Philosophy
by
STEVEN J. APPERSON
Dr. Shubhra Gangopadhyay, Dr. Luis Polo-Parada,
Dissertation Supervisors
JULY 2010

The undersigned, appointed by the dean of the Graduate School, have examined the dissertation entitled
CHARACTERIZATION AND MEMS APPLICATIONS OF NANOTHERMITE MATERIALS
presented by Steven J Apperson,
a candidate for the degree of doctor of philosophy of Electrical & Computer Engineering,
and hereby certify that, in their opinion, it is worthy of acceptance.
Professor Shubhra Gangopadhyay
Professor Luis Polo-Parada
Professor Scott Kovaleski
Professor Naz Islam
Professor Christopher Morris

ii
ACKNOWLEDGEMENTS
I would like to thank my advisor, Dr. Shubhra Gangopadhyay, and her husband,
Dr. Keshab Gangopadhyay, for their unwavering support during my studies. While doing
research as an undergraduate student, I got hooked on research, which led me to get a
PhD. I never thought I would come this far with my education, and I owe it to them for
motivating me as well as instilling the confidence in me to enter the Ph.D. program
directly after my undergraduate studies. They also let me progress to my fullest potential
by affording me significant independence in deciding the direction for certain projects,
and allowing me to do such things as give presentations at conferences, write proposals,
and interact closely with program directors. Additionally, I cannot express my gratitude
to them for setting a great example of how to do research in such a competitive field as
nanotechnology and maintain the utmost level of scientific integrity.
To back up a bit, I want to acknowledge and thank Dr. H. Rusty Harris for giving
me the opportunity to do undergraduate research back in 2003. If he hadn't picked me out
of class and offered me an undergraduate research position, I would not have had this
opportunity.
I would also like to thank the members of the Gangopadhyay Research Group
with whom I have had the honor and privilege of working over the years. Specifically,
the post-docs and research faculty members, Dr. Rajagopalan Thiruvengadathan, Dr.
Andrey Bezmelnitsyn, and Dr. Rajesh Shende for our partnership in synthesis and testing
of nanothermites. I would have not had such novel nanothermite materials to study but
for their efforts in synthesis and preparation of new materials.

iii
I would like to thank Dr. C. Joseph Mathai and Dr. Maruf Hossain as well as,
Madhuri Korampally, Daniel Bone, and Steven Hamm for their patience and assistance in
fabricating the vast number of MEMS devices required for this work.
I would like to thank my co-advisor, Dr. Luis Polo-Parada, for his hands-on
assistance in the biological aspects of this work and allowing me to use his lab as needed.
Without his expertise and guidance, it would have been impossible to make the amount
of progress that we did in the transfection project.
I would like to thank all my friends and family for their encouragement and
support. I would especially like to thank my wife, Kay, whom I met while we were both
PhD students. She provided valuable encouragement that helped me keep going, and was
very patient as I spent many evenings in the lab. She also helped me gain perspective and
build confidence in myself.
I would also like to thank my friend Kevin Rollins who is my patent attorney, and
one heck of a scientist/engineer. During our discussions about my research, it was his
unyielding loyalty to the scientific method and strong understanding of scientific logic
that helped strengthen my own scientific discipline and helped me recognize the
limitations on the conclusions that could be drawn from certain experiments.
I would also like to thank our program directors and collaborators at Picatinny
Arsenal, ONR, and ARL for their funding and support. I would like to acknowledge Dr.
Christopher Morris from ARL for many fruitful discussions, as well as a very enjoyable
and intellectually stimulating research experience at ARL. I would like to especially
thank Dr. Morris for his valuable review of my dissertation.

iv
TABLE OF CONTENTS
Acknowledgements.......................................................................................................... ii
List of Figures.................................................................................................................. vi
List of Tables................................................................................................................... x
Abstract............................................................................................................................ xi
CHAPTER 1: Introduction.............................................................................................. 1 1.1 Nanothermites................................................................................................ 1 1.2 Micro-Device Applications............................................................................ 4 1.3 Characterization of Nanothermites................................................................ 6 1.4 Energetics Research and Micro-Device Development.................................. 8 1.5 Summary of the Present................................................................................. 9 1.6 References...................................................................................................... 12
CHAPTER 2: Generation of Fast Propagating Combustion and Shock Waves with Copper oxide/Aluminum Nanothermite Composites.................................................. 16
2.1 Abstract.......................................................................................................... 16 2.2 Introduction.................................................................................................... 16 2.3 Experimental.................................................................................................. 18 2.4 Discussion...................................................................................................... 21 2.5 Conclusions.................................................................................................... 23 2.6 References...................................................................................................... 23 CHAPTER 3: Ignition Mechanisms in Thin-Film Pt Micro-Igniters for Nanothermite
Initiation...................................................................................................................... 25 3.1 Abstract.......................................................................................................... 25 3.2 Introduction.................................................................................................... 26 3.3 Igniter Design.................................................................................................27 3.4 Igniter Fabrication.......................................................................................... 29 3.5 Pt Bridgewire Electromechanical Characterization....................................... 30 3.6 Nanothermite Ignition Testing....................................................................... 34 3.7 Effect of Scaling Bridge Dimensions............................................................39 3.8 Conclusions.................................................................................................... 42 3.9 References...................................................................................................... 43 CHAPTER 4: Microchip-Based Shock Wave Generator for Particle Delivery and Cell Transfection..................................................................................................................... 45 4.1 Abstract.......................................................................................................... 45 4.2 Introduction.................................................................................................... 45

v
4.3 Tunable Nanothermites.................................................................................. 46 4.4 Microchip Design...........................................................................................48 4.5 Shock-Tube Characterization.........................................................................49 4.6 Modification of the Device for Biological Testing........................................ 52 4.7 Particle Delivery/Transfection Testing.......................................................... 57 4.7.1 Embryonic Cardiomyocyte Transfection........................................... 60 4.7.2 Transfection of T47-D Cell Line....................................................... 60 4.7.3 Variable Delivery of Dextran in T47-D............................................. 62 4.7.4 Transfection of Whole Tissues.......................................................... 65 4.8 Discussion & Future Work............................................................................ 65 4.9 Conclusion..................................................................................................... 66 4.10 References...................................................................................................... 67 CHAPTER 5: Characterization of Nanothermite Material for Solid Fuel Microthruster Applications..................................................................................................................... 69 5.1 Abstract.......................................................................................................... 69 5.2 Introduction.................................................................................................... 69 5.3 Experimental.................................................................................................. 71 5.3.1 Nanothermite Preparation.................................................................. 71 5.3.2 Thruster Prototype Design................................................................. 71 5.3.3 Thruster Test Stand............................................................................ 73 5.4 Results and Discussion.................................................................................. 74 5.4.1 Effect of Packing Density.................................................................. 74 5.4.2 Effect of Motor Length...................................................................... 79 5.4.3 Nozzle Design Effect......................................................................... 80 5.5 Future Work................................................................................................... 83 5.6 Conclusion..................................................................................................... 84 5.7 References...................................................................................................... 85 CHAPTER 6: Conclusions & Future Work.................................................................... 87 6.1 Conclusions.................................................................................................... 87 6.2 Future Work................................................................................................... 88
Vita................................................................................................................................... 91

vi
LIST OF FIGURES
Figure Page
1.1. Illustration of effect of mixing different size-scale particles.................................... 1
1.2. Peak pressure plotted against pressurization rate for various nanothermites. In the legend, AN stands for ammonium nitrate nanoparticles and SA means self-assembled fuel and oxidizer particles.................................................................. 2
1.3. Heat of reaction vs. thermal diffusivity for various types of energetic materials. The adiabatic reaction temperature of each energetic material is shown just below its name. Reproduced with permission from [13]. Copyright 2007 IEEE............... 3
1.4. (A) Schematic view of a horizontal microthruster. (B) Cross-sectional view of an energetic micro-pump.......................................................................................... 5
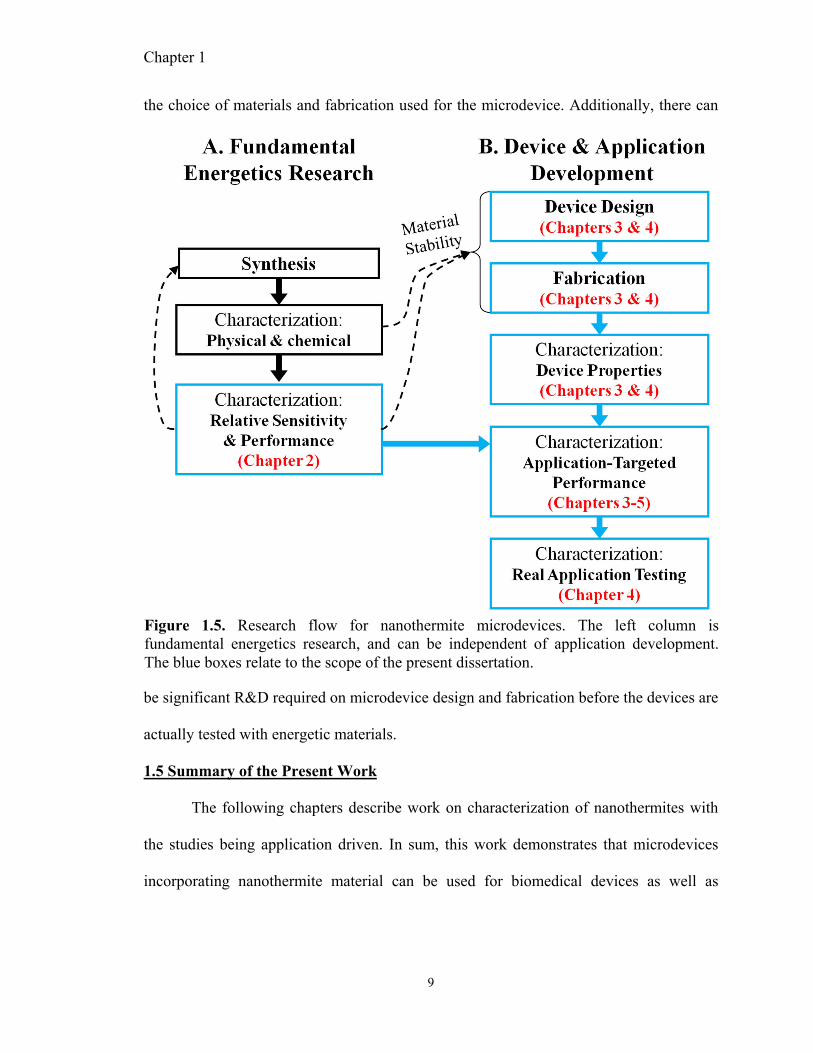
1.5. Research flow for nanothermite microdevices. The left column is fundamental energetics research, and can be independent of application development. The blue boxes are development steps that I directly researched. Other members of the research team group do the fundamental nanothermite research......................... 9
2.1. TEM Images of A) CuO nanorods and B) Self–Assembled composite of CuO nanorods/Al.......................................................................................................... 18
2.2. Schematic of the shock-tube set-up used for the measurements. The pressure sensors in the nanothermite section of the tube (bottom) were only installed for density experiments.......................................................................................................... 19
2.3 (A) Typical pressure-time history in the air-filled section of the tube, (B) Typical pressure-time trace in the nanothermite section.................................................. 20
2.4. Plot of combustion velocity, shock wave velocity, and peak pressure as a function of the density of physically mixed CuO/Al composite............................................ 21
2.5. Plot of CJ-pressure vs. ρD2 used to determine the experimental value for γ........... 22
3.1. Schematic of thin-film igniter design. It consists of a narrow heating element, or bridge, (dashed box) and two contact pads.......................................................... 27
3.2. Patterning process for igniters. A sacrificial layer of photoresist is used for lift-off patterning............................................................................................................. 29

vii
3.3. (A) Dimensions of igniters used in testing the effect of varying applied voltage. (B) Microscope image of a fabricated igniter............................................................ 31
3.4. High-speed video frames of bridgewire burst with (A) 6V, (B) 12V, and (C) 18V applied. Frame rate was 100kfps. The inter-frame time was 10µs...................... 31
3.5. Microscope images of different bridgewires after testing under different applied voltages................................................................................................................ 32
3.6. Ignition data for tests with the igniter design of 3.3. (A) Voltage-time history recorded for four tests with different voltages. (B) Burst energy vs. input power corresponding to different applied voltages......................................................... 33
3.7. Characteristic data recorded during nanothermite ignition testing. (A) High-speed video data. (B) Voltage-time record. A small periodic pulse exists due to some stray signal, but it is negligible............................................................................ 35
3.8. Current and voltage measurements taken during a bridge burst test. (Igniter design shown in 3.10).................................................................................................... 36
3.9. (A) Igniter design with bridgewire length and width denoted by L and W, respectively. (B) Plot of ignition delay and input energy vs. power.................... 39
3.10. (Left) Drawing of bowtie design of igniters with 50 µm bridge width. (Right) Microscope image of a fabricated bowtie bridgewire.......................................... 41
4.1. (A) Comparison of Pressure-time characteristics of thermite formulations using CuO and Al powders with different grain sizes (µ = micro-scale powder grains, n = nano-scale powder grains). (B) Comparison of pressure-time characteristics of various nanothermite formulations. In the legend, NC denotes nitrocellulose binder, and AN denotes ammonium nitrate nanoparticles................................... 47
4.2. (A) Schematic showing shock-wave generating platform. (B) Photograph of finished device before loading energetic material............................................................. 49
4.3. Pressure-distance characterization tube................................................................... 49
4.4. Typical pressure-Time record for the arrangement shown in figure 2.................... 50
4.5. (A) Pressure-time traces for the six pressure sensors used in the system. (B) Position-time plot for a microchip containing 10mg of CuO/Al nanothermite. (C) Time derivative of the quadratic curve shown in (B). (D) Peak pressure recorded at each sensor (Position)...................................................................................... 51
4.6. Shock wave velocity vs. mass of nanothermite in the microchip............................ 51
4.7. Modified system for filtering the reaction products out of the blast wave.............. 52
viii
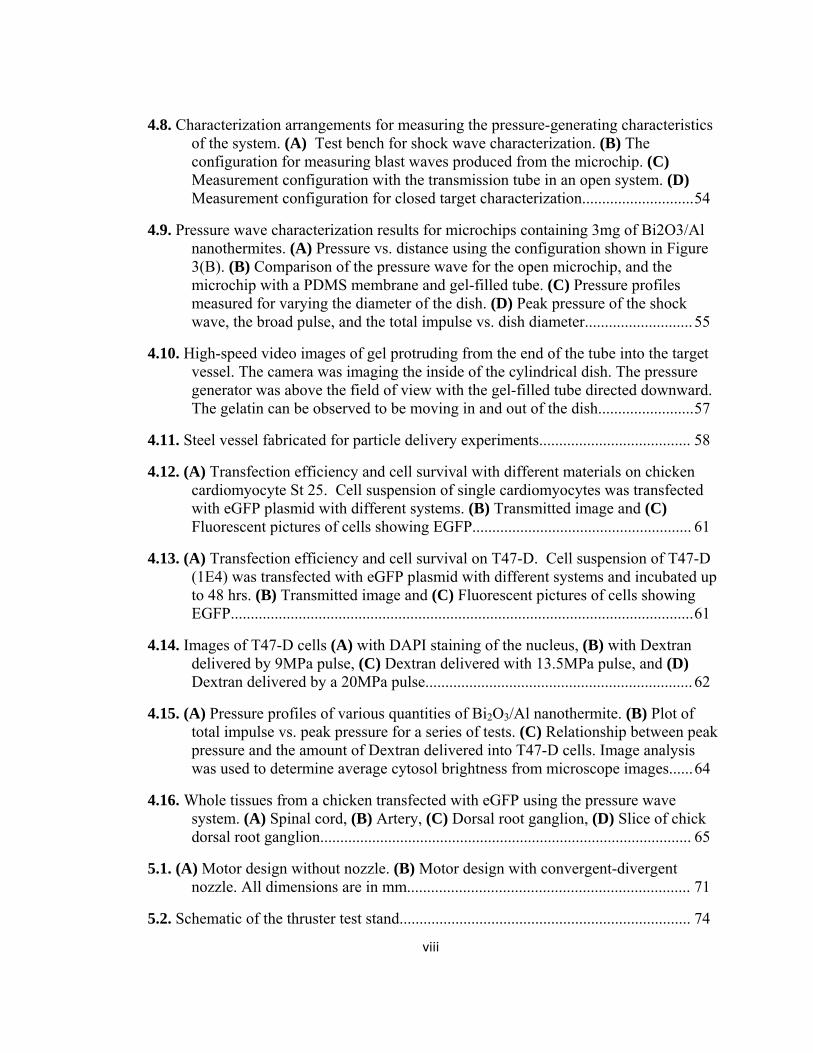
4.8. Characterization arrangements for measuring the pressure-generating characteristics of the system. (A) Test bench for shock wave characterization. (B) The configuration for measuring blast waves produced from the microchip. (C) Measurement configuration with the transmission tube in an open system. (D) Measurement configuration for closed target characterization............................ 54
4.9. Pressure wave characterization results for microchips containing 3mg of Bi2O3/Al nanothermites. (A) Pressure vs. distance using the configuration shown in Figure 3(B). (B) Comparison of the pressure wave for the open microchip, and the microchip with a PDMS membrane and gel-filled tube. (C) Pressure profiles measured for varying the diameter of the dish. (D) Peak pressure of the shock wave, the broad pulse, and the total impulse vs. dish diameter........................... 55
4.10. High-speed video images of gel protruding from the end of the tube into the target vessel. The camera was imaging the inside of the cylindrical dish. The pressure generator was above the field of view with the gel-filled tube directed downward. The gelatin can be observed to be moving in and out of the dish........................ 57
4.11. Steel vessel fabricated for particle delivery experiments...................................... 58
4.12. (A) Transfection efficiency and cell survival with different materials on chicken cardiomyocyte St 25. Cell suspension of single cardiomyocytes was transfected with eGFP plasmid with different systems. (B) Transmitted image and (C) Fluorescent pictures of cells showing EGFP....................................................... 61
4.13. (A) Transfection efficiency and cell survival on T47-D. Cell suspension of T47-D (1E4) was transfected with eGFP plasmid with different systems and incubated up to 48 hrs. (B) Transmitted image and (C) Fluorescent pictures of cells showing EGFP.................................................................................................................... 61
4.14. Images of T47-D cells (A) with DAPI staining of the nucleus, (B) with Dextran delivered by 9MPa pulse, (C) Dextran delivered with 13.5MPa pulse, and (D) Dextran delivered by a 20MPa pulse................................................................... 62
4.15. (A) Pressure profiles of various quantities of Bi2O3/Al nanothermite. (B) Plot of total impulse vs. peak pressure for a series of tests. (C) Relationship between peak pressure and the amount of Dextran delivered into T47-D cells. Image analysis was used to determine average cytosol brightness from microscope images...... 64
4.16. Whole tissues from a chicken transfected with eGFP using the pressure wave system. (A) Spinal cord, (B) Artery, (C) Dorsal root ganglion, (D) Slice of chick dorsal root ganglion............................................................................................. 65
5.1. (A) Motor design without nozzle. (B) Motor design with convergent-divergent nozzle. All dimensions are in mm....................................................................... 71
5.2. Schematic of the thruster test stand......................................................................... 74

ix
5.3. (A) Plot of nanothermite density vs. packing pressure. (B) Nanothermite mass and total impulse vs. packing pressure....................................................................... 75
5.4. (A) Plot of specific impulse vs. %TMD, and (B) plots of peak thrust and impulse duration vs. packing pressure. (C) Impulse profiles for 3 different packing pressures............................................................................................................... 76
5.5. (A) Video frames of exhaust plume from material pressed to 57.8% TMD (B) Force data for the same test. The red lines in the plot mark time stamps for the video frames in (A)........................................................................................................ 77
5.6. (A) Frame shots of exhaust plume from material pressed to 35.4% TMD. (B) Force data for the same test. The red lines in the plot mark the time stamp for the video frames in (A)........................................................................................................ 78
5.7. (A) Thrust profiles for different motor lengths at 34.3% TMD. (B) Thrust profiles for different motor lengths at 56.0% TMD.......................................................... 80
5.8. (A) Comparison of thrust with and without the nozzle in the fast regime. (B) Comparison of thrust with and without the nozzle in the slow regime............... 81
5.9. Sequence of high-speed video frames from a thruster tested in the fast-regime with the motor containing a convergent-divergent nozzle. There is 100 µsec between each image (Total time is 900 µsec).................................................................... 82
5.10. Sequence of high-speed video frames from a thruster tested in the fast-regime with the motor without a nozzle. There is 100 µsec between each image (Total time is 500 µsec).............................................................................................................. 82
x
LIST OF TABLES
Table Page
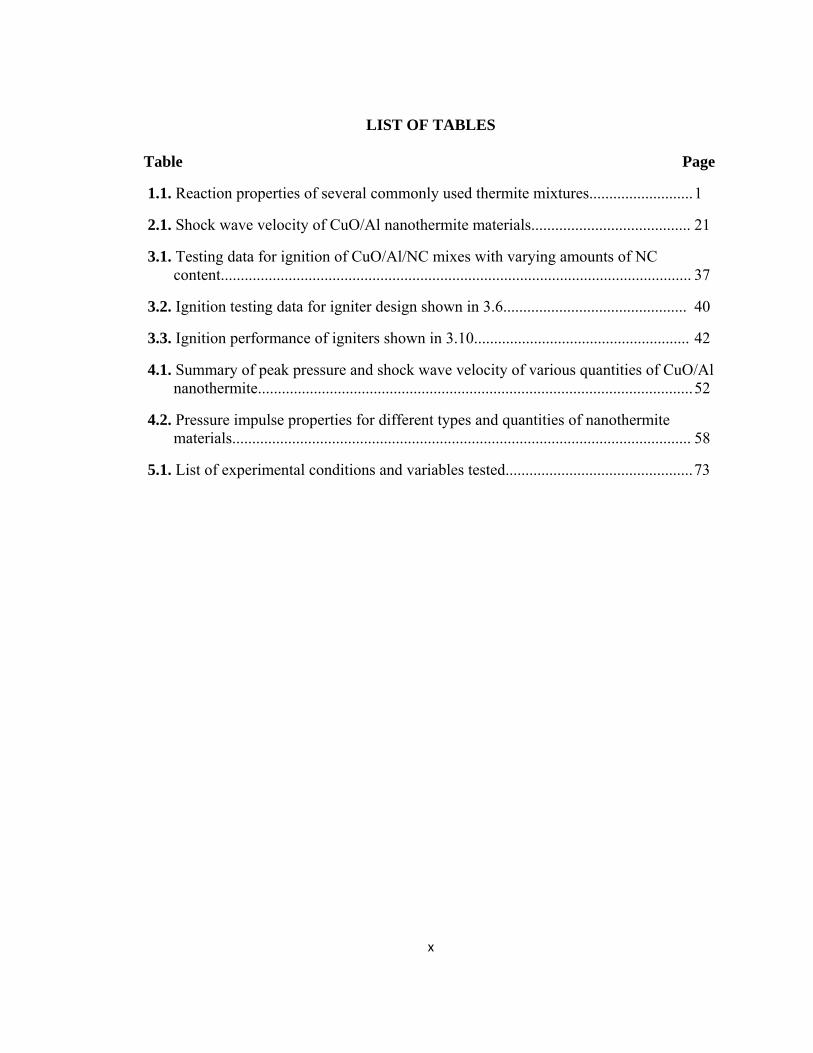
1.1. Reaction properties of several commonly used thermite mixtures.......................... 1
2.1. Shock wave velocity of CuO/Al nanothermite materials........................................ 21
3.1. Testing data for ignition of CuO/Al/NC mixes with varying amounts of NC content...................................................................................................................... 37
3.2. Ignition testing data for igniter design shown in 3.6.............................................. 40
3.3. Ignition performance of igniters shown in 3.10...................................................... 42
4.1. Summary of peak pressure and shock wave velocity of various quantities of CuO/Al nanothermite............................................................................................................. 52
4.2. Pressure impulse properties for different types and quantities of nanothermite materials................................................................................................................... 58
5.1. List of experimental conditions and variables tested............................................... 73

xi
ABSTRACT
The research described herein is on characterization of nanothermite materials and
development of nanothermite microdevices for shock wave generation, microthruster
propulsion, and intracellular particle delivery and cell transfection. The research
progressed from basic nanothermite combustion characterization to application specific
testing of microchip devices.
The nanothermite powders were initially characterized in a shock-tube system to
demonstrate the production of shock waves. Then a microchip platform was developed to
ignite the nanothermite on-chip. The microchips containing nanothermite were then
characterized in a shock-tube to compare the shock waves produced in the microchip
with those produced by nanothermite powders. The microchips were then modified for
safe application to bio-systems. Transfection is demonstrated in primary cells, a cancer
cell line, and in whole tissues. The ability to control the level of particle delivery is also
demonstrated. Finally, the nanothermites are characterized in a microthruster for
comparison of performance with other microthruster fuels.
The nanothermites showed generation of high-velocity (up to Mach 3) but low-
intensity (shock waves <1MPa), which are appealing for certain applications. The on-
chip igniters were capable of igniting nanothermite with very low energy (<100µJ). The
devices for cell transfection showed superior transfection rate and cell survival compared
with other transfection methods. The nanothermite also showed superior performance in

xii
generating high-amplitude short-duration thrust impulses compared with conventional
energetic materials used in microthrusters.

Chapter 1
1
Chapter 1:
Introduction
Nanotechnology has paved the way for new materials with unique properties to be
developed for applications ranging from weapons systems to biomedical devices. One
such area of nanotechnology is nanoenergetic materials. Nanoengineering has allowed
novel thermite materials to be synthesized with tunable combustion rate and pressure
generation [1-7].
1.1 Nanothermites
Nanothermites are a type of
nanoenergetic material made from
nanoscale metal (fuel) and metal-oxide
(oxidizer) particles, or powders. These are
different from conventional thermites in
that the grain size of the powders is nanoscale instead of micro-scale. The effect on
mixture is shown in figure 1.1. The interfacial contact area between fuel and oxidizer is
increased dramatically when going to nanoscale particles, and the reaction rate increases
by orders of magnitude as a result. The reaction rate can be enhanced further by using
specific particle morphologies and using surface chemistry to induce self-assembly of the
fuel and oxidizer particles [3, 5, 8, 9]. Reaction rates ranging from 1-2400m/s have been
achieved for various composites [1, 3, 8, 9]. For example, the composition consisting of
copper oxide (CuO) nanorods and aluminum (Al) nanoparticles has been shown to have
combustion velocities in the same range as the heavy-metal azides, including heavy metal
azides and fulminates [3, 4, 8-12]. However, these novel nanothermites produce
Figure 1.1. Illustration of effect of mixingdifferent size-scale particles.

Chapter 1
2
shockwaves at pressure levels much lower than the detonation pressure predicted by CJ
(Chapman-Jouguet) theory for solid explosives. This makes nanothermites useful for
generating low-intensity shock waves for non-destructive applications. Slow reaction
rates and high-pressure output can also be achieved by proper nanothermite formulation.
Figure 1.2 shows a graph of reaction velocity and pressure output for various
types of nanothermite mixtures. The velocity measurements were performed in a
generally accepted combustion tube system [1, 8, 9, 11, 14-20]. The pressure
measurements were performed in a small-scale closed-cell pressure setup [1]. It can be
seen that nanothermite materials can be designed to give any desired performance across
the entire range of energetic materials, from pyrotechnic to high explosive.
A unique property of nanothermites compared with conventional high-explosives
is the high thermal diffusivity [13]. Figure 1.3 is a plot of Heat of Reaction vs. Thermal
Diffusivity for various nanothermites and high explosives. Although the nanothermites
have somewhat lower energy output, their thermal diffusivity is significantly higher.
High thermal diffusivity results in stronger propagation in micro-scale geometries [21].
Figure 1.2. Peak pressure plotted against pressurization rate for various nanothermites. In thelegend, AN stands for ammonium nitrate nanoparticles and SA means self-assembled fueland oxidizer nanoparticles.
1 2 3 4 5 6 7 8 9 10 11 12 130.0
0.5
1.0
1.5
2.0
2.5
3.0
Vel
ocity
(km
/s)
Material Type
Combustion Velocity
101
102
103
Pre
ssur
e (M
Pa)
Peak Pressure
Material Type* 1. MoO3 Nanoparticle 2. Fe2O3 Mesoporous 3. MoO3 Nanorod Heat 400°C for 2hr 4. CuO Nanoparticle (Sigma) 5. CuO Nanorod Heat 400°C, 3hr 6. Bi2O3 Nanorod Heat 100°C, 16hr 7. CuO Nanorod Heat 400°C, 3hr - 10% AN 8. CuO Nanorod Heat 400°C, 3hr - SA 9. CuO Nanorod Heat 400°C, 1min
10. CuO Nanorod Heat 400°C, 3hr - 30% AN 11. CuO Nanorod Heat 100°C, 16Hr 12. CuO Nanorod Heat 400°C, 1min - SA 13. CuO Nanorod Vacuum Dried *All used 80nm Al nanoparticles as fuel.

Chapter 1
3
The reaction temperatures of thermites, nano- or micro-scale, are very high
(>2500K). Since conventional thermites have very slow reaction rates, the intense heat
has been used for welding and cutting applications. Table 1.1 shows flame temperature,
heat of reaction, density, and gas production of several commonly used thermite mixtures
[22]. Heat of reaction varies from 506cal/g to 1124cal/g, and percentage of gas
production varies from 7.7% to 89.4%. Therefore, different mixtures can have very
different combustion performance.
Table 1.1. Reaction properties of several commonly used thermite mixtures [22]. Thermite Reactions
Adiabatic Flame Temp. (K)
Heat of Reaction (cal/g)
Density (g/cc)
%Gas Production (g of gas per g)
2Al + Bi2O3 3253 506.1 7.188 89.4 2Al + 3AgO 3253 896.7 6.085 80.8 2Al + 3CuO 2843 974.1 5.109 34.3 2Al + 3Cu2O 2843 575.5 5.28 7.76 2Al + Fe2O3 3135 945.5 4.175 7.84 2Al + MoO3 3253 1124 3.808 24.7 2Al + WO3 3253 694.4 5.458 14.6
Figure 1.3. Heat of reaction vs. thermal diffusivity for various types of energeticmaterials. The adiabatic reaction temperature of each energetic material is shown justbelow its name. Reproduced with permission from [13]. Copyright 2007 IEEE.

Chapter 1
4
1.2 Micro-Device Applications
A field complimentary to nanotechnology is also emerging called
microelectromechanical systems (MEMS). Like nanotechnology, applications of MEMS
technology are very broad, and MEMS devices have unique properties and advantages
over conventional electronic or mechanical hardware. In general, MEMS devices are
small (<1cm3), and require very low power and energy to operate. The inherent nature of
MEMS fabrication techniques allows batch fabrication of tens to thousands of devices on
a single wafer simultaneously. Additionally, this batch fabrication process creates
extremely uniform devices resulting in high reliability. MEMS and nanotechnology often
merge because the scale of MEMS provides an intermediate scale for coupling nanoscale
materials and systems with macroscale materials and systems.
One area where MEMS meets nanotechnology is in energetic microdevices or
micropyrotechnic devices [13, 23]. These are devices that use the reaction of one or more
finite quantities of energetic material to perform a desired function. Military applications
for energetic microdevices include microthrusters, microactuators, microdetonators, pulse
power generators, propellant initiators, and multipoint initiators [1, 4, 13, 23-25]. Non-
military applications of energetic microdevices include airbag inflation initiators, electro-
thermal switches, needle-free syringes, powder injectors, transfection devices, and others
[13, 23, 26-43]. Researchers have been discovering that nanoenergetics, and specifically
nanothermites, are particularly well-suited for microdevice applications. The high level of
tunability and superior reaction performance in microscale systems makes nanothermites
a potential solution for a variety of applications requiring unique energetic properties on
the micro-scale [4, 13, 21, 26].

Chapter 1
5
In general, all energetic microdevices must contain an igniter, an energetic
material, a chamber to hold the energetic material, and some coupling structure. Figure
1.4(A) shows an example of a microthruster design. It consists of three wafers, and has a
micromachined igniter, chamber, and nozzle. Upon ignition of the energetic material,
reaction products exit the nozzle and produce a thrust force against the chip. The nozzle
is the coupling structure. In another application, a micro-fluidic pump (Figure 1.4(B)), an
elastic membrane is used to couple the energetic material to the reservoir [43]. The
energetic material reacts and expands. This stretches the membrane and pushes the fluid
in the other chamber out through the nozzle. This device also contains an igniter and a
chamber to hold the energetic material. The coupling structure is typically a solid or
liquid interface or a channel that transmits or directs the output pressure and/or gas flow
from the reaction.
The particular application of an energetic microdevice will dictate the
requirements for the igniter power consumption, the ignition sensitivity and combustion
performance requirements of the energetic material, and the type of coupling used
Figure 1.4. (A) Schematic view of a horizontal microthruster. (B) Cross-sectional view of an energetic micro-pump.
(A) (B)

Chapter 1
6
between the energetic material and surrounding medium. Chambers can be fabricated
from plastics, metals, or ceramics. Igniters are primarily constructed from metals or
semiconducting materials.
Different applications also require different characterization methods. In most
cases, each unique application will require a custom-built system for taking dynamic
measurements of parameters such as combustion pressure, propagation velocity, igniter
power consumption, etc. Referring to the two examples in Figure 1.4, the characterization
for a microthruster involves measuring the force generated in the direction opposite the
exhaust. However, the characterization of the micro-pump device would be measurement
of velocity and/or diameter of the fluid-jet that is ejected from the fluid chamber. In both
cases, the igniter characterization would be identical.
1.3 Characterization of Nanothermites
Research on novel energetic materials, such as nanothermites, requires extensive
characterization to fully understand their behavior, and predict suitable applications
toward which to apply effort. There are several levels of characterization from basic to
applied:
1. Physical and Chemical properties: Chemical composition, density, nanoscale morphology, particle specific surface area, heat of reaction, ignition temperature, % gas production, adiabatic flame temperature, etc.
2. Relative combustion performance: Combustion propagation velocity, output pressure, output temperature, etc.
3. Application/Environment specific performance: Thrust force, actuation velocity, underwater shock wave measurement, etc
Basic physical and chemical characterization is necessary to relate chemical and
physical properties of as-prepared material with its combustion performance. This guides
the future choice of materials and synthesis techniques. Basic characterization methods

Chapter 1
7
include Transmission Electron Microscopy (TEM), Scanning Electron Microscopy
(SEM), X-Ray Diffraction (XRD), Fourier Transform Infrared (FTIR) Spectroscopy,
Particle surface area (BET), Differential Scanning Calorimeter (DSC),
Thermogravimetric Analysis (TGA), and Closed-Bomb Calorimeter.
Electron microscopy (SEM & TEM) and its accompanying analysis techniques
such as Energy Dispersive Spectroscopy (EDS) provide information about the nanoscale
morphology and chemical elements present in a sample. XRD can provide information on
crystal structure and FTIR allows certain types of chemical bonds to be identified. DSC
and TGA provide information on reaction temperatures, heat flow, and mass flow during
an energetic reaction. This helps understand stages of reactions as they relate to phase-
change states of different ingredients. These provide comprehensive understanding of the
chemical and physical properties of a sample.
Relative combustion performance tests include electrostatic discharge (ESD),
friction and impact sensitivity, propagation velocity and output pressure. The results of
these types of tests are highly dependent on the surrounding environment. For example,
propellants are designed to deflagrate in rocket motors with an exhaust port, but some
propellants can detonate if ignited in a confined system with no exhaust. Therefore,
standard methods are defined for tests of relative performance [44]. These standards are
accepted not only for researchers to compare their materials, but they also allow
technology to be transferred to the military with minimal uncertainty.
The appeal of this type of test is that it is relatively low-cost, i.e. the equipment is
less complicated to operate and it is more robust. This type of test helps bridge the gap
between basic characterization and application specific testing. These test results allow

Chapter 1
8
one to narrow down candidates for particular applications. Metrics such as reaction
propagation rate and pressure output are more indicative of application performance than
metrics such as heat of reaction.
Beyond the basic energetic materials characterization, application-specific tests
must be designed each time a device is developed for a new application. A traditional
example of an application-specific test would be penetration depth of an anti-tank round
into a thick sheet of armor. The penetrating capability of the projectile depends on the
propellant used to fire the projectile. That is, the basic energetics properties of the
propellant such as heat of reaction and % of gas production will affect muzzle velocity,
which in turn will affect kinetic energy of the projectile and thereby penetrating depth.
1.4 Energetics Research and Microdevice Development
The description of the stages of nanothermite characterization is true for any
application of energetic materials beyond just microdevices. However, since MEMS
technology is relatively young, and since microdevices require more detailed
characterization, the development of microdevice applications requires significant
additional effort to design, fabricate, and test the non-energetic components of the
microsystem.
Figure 1.5 shows a flow chart for research and development (R&D) of
nanothermite microdevices. Fundamental R&D on energetic materials can be
independent of application development. Application R&D can be independent of the
fundamental R&D on energetic materials. However, when combining nanothermites and
microdevices, both of which are still in the R&D phase, their development must be
closely tied together. For example, the sensitivity of the nanothermite material will affect
Chapter 1
9
the choice of materials and fabrication used for the microdevice. Additionally, there can
be significant R&D required on microdevice design and fabrication before the devices are
actually tested with energetic materials.
1.5 Summary of the Present Work
The following chapters describe work on characterization of nanothermites with
the studies being application driven. In sum, this work demonstrates that microdevices
incorporating nanothermite material can be used for biomedical devices as well as
Figure 1.5. Research flow for nanothermite microdevices. The left column isfundamental energetics research, and can be independent of application development.The blue boxes relate to the scope of the present dissertation.

Chapter 1
10
weapons systems. Figure 1.5 indicates where the chapters fit within the energetic
materials and microdevices development process.
The description of research work begins in Chapter 2, with a basic shock-tube
characterization of CuO/Al nanothermite for its shock wave generating capabilities. The
velocity and intensity of pressure waves created by nanothermite reactions are measured
in a shock-tube. Combustion rate, combustion pressure, and output shock wave pressure
are measured. This is considered relative characterization of energetic materials, because
the configuration of the tests drastically affects the results. The use of this basic
characterization system was the first attempt to quantitatively prove that the pressure
waves generated by the nanothermite were supersonic. This opened the door for more
focused development of nanothermite microdevices for applications requiring fast
reacting materials and shock waves.
Chapter 3 describes the design and testing of Pt/Ti microigniters for on-chip
ignition of nanothermites. An in-depth study is performed on the mechanism of ignition
of the nanothermite by the platinum film. This work was the first step in developing
microchip-based shock wave generators. It includes device design, fabrication, and
characterization of the device properties and ignition performance (e.g. function delay,
energy consumption).
Chapter 4 describes work to further develop the micro-chip based shock wave
generator for shockwave-based drug/particle delivery into living cells and tissues, a
process also called transfection. This work was enabled by the basic shock wave
characterization and igniter development (Chapters 2 & 3). The microchip was
fabrication and tested in a small-scale shock tube. This gave some basic design trends for

Chapter 1
11
choosing nanothermite materials and microchip designs. The shock-tube was a
modification of the system described in Chapter 2, which allowed the microchips to be
tested in place of a tube filled with nanothermite.
Then the development of a system to allow the devices to cleanly deliver shock
waves to a biological target is described. Extensive characterization is performed on the
system to understand the effect of different design features, and then the system is
demonstrated by delivering plasmids and nanoparticles to a variety of cells and tissues.
Chapter 4 develops on the work done in Chapters 2 & 3 and extends the development
through to the final stage, which is real application testing.
In Chapter 5, CuO/Al nanothermite is evaluated for microthruster applications. A
thruster test stand was designed and implemented to measure thrust-time profiles in a
small thrust motor. The microthruster development is aimed at projectile guidance
applications. Chapter 5 does not directly follow from the work in Chapters 3 and 4.
Rather it was the first step in developing a new application. Based on the findings of
Chapter 2, microthruster applications were pursued. No microdevice development was
performed for the thruster testing. Rather, conventionally machined thrust motors were
utilized for characterization of the material. The reason for this was because the required
scale for the thruster motors (whether µm, mm, or cm) was unknown. Depending on the
required total impulse of each thruster, the size of the motors may or may not be
appropriate for fabrication using MEMS techniques. Therefore, before putting time and
resources into microdevice design, basic thruster performance was evaluated to establish
the magnitude of thrust and total impulse on the mm-scale.

Chapter 1
12
Finally, the research is summarized, and some future directions are outlined. The
overall intent of this research was not only to demonstrate the cycle for application
development, but it was also to show the true dual-use nature of nanotechnology. That is,
the exact same nanomaterial (CuO/Al nanothermites) is applicable for microthrusters
(weapons technology) as well as biomedical devices (life science technology). This is not
intuitive, and it is an interesting dichotomy to consider that the exact same technology
can be used for weapons or drug delivery devices.
1.6 References:
1. Bezmelnitsyn, A., et al., Modified Nanoenergetic Composites with Tunable Combustion Characteristics for Propellant Applications. Propellants, Explosives, Pyrotechnics, In Press. 9999(9999): p. NA.
2. Bulian, C.J., J.A. Puszynski, and J.J. Swiatkiewicz. Tunability of Nanoenergetic Materials. in The 2008 Annual Meeting of the AIChE. 2008. Philadelphia, PA.
3. Shende, R., et al., Nanoenergetic Composites of CuO Nanorods, Nanowires, and Al-Nanoparticles. Propellants, Explosives, Pyrotechnics, 2008. 33(2): p. 122-130.
4. Apperson, S., et al., Characterization of Nanothermite Material for Solid-Fuel Microthruster Applications. Journal of Propulsion and Power, 2009. 25(5): p. 1086-1091.
5. Mehendale, B., et al., Nanoenergetic Composite of Mesoporous Iron Oxide and Aluminum Nanoparticles. Journal of Energetic Materials, 2006. 24(4): p. 341 - 360.
6. Pantoya, M.L. and J.J. Granier, Combustion Behavior of Highly Energetic Thermites: Nano versus Micron Composites. Propellants, Explosives, Pyrotechnics, 2005. 30(1): p. 53-62.
7. Pantoya, M.L., et al., Effect of bulk density on reaction propagation in nanothermites and micron thermites. Journal of Propulsion and Power, 2009. 25(2): p. 465-470.
8. Shende, R., et al., Nanostructured Energetic Materials, Session M,. 25th Army Science Conference, Orlando, Fl., 2006.
9. Subramanian, S., et al., Self-assembled nanoenergetic composite. Mater. Res. Soc. Symp. Proc. , 2006: p. 5.1-5.6.

Chapter 1
13
10. Apperson, S., et al. On-Chip Initiation and burn rate measurements of thermite energetic reactions. in Mater. Res. soc. Symp. Proc. 2006.
11. Apperson, S., et al., Generation of fast propagating combustion and shock waves with copper oxide/aluminum nanothermite composites. Applied Physics Letters, 2007. 91(24): p. 243109-3.
12. Bhattacharya, S., et al., A Novel on-chip diagnostic method to measure burn rates of energetic materials. J. Energ. Mater, 2006. 24: p. 1-15.
13. Rossi, C., et al., Nanoenergetic Materials for MEMS: A Review. Microelectromechanical Systems, Journal of, 2007. 16(4): p. 919-931.
14. Bockmon, B.S., et al., Combustion velocities and propagation mechanisms of metastable interstitial composites. Journal of Applied Physics, 2005. 98(6): p. 1-7.
15. Pantoya Michelle, L., et al., Characterization of Metastable Intermolecular Composites, in Defense Applications of Nanomaterials. 2005, American Chemical Society: Washington, DC. p. 227-240.
16. Plantier, K.B., M.L. Pantoya, and A.E. Gash, Combustion wave speeds of nanocomposite Al/Fe2O3: the effects of Fe2O3 particle synthesis technique. Combustion and Flame, 2005. 140(4): p. 299-309.
17. Puszynski, J.A., C.J. Bulian, and J.J. Swiatkiewicz, Processing and ignition characteristics of aluminum-bismuth trioxide nanothermite system. Vol. 23. 2007, Reston, VA, ETATS-UNIS: American Institute of Aeronautics and Astronautics. 9.
18. Yarrington, C., et al. Instrumented Burn Tube: Experimental Observations and Analysis of Data. in 48th AIAA Aerospace Sciences Meeting Including the New Horizons Forum and Aerospace Exposition. 2010. Orlando, FL.
19. Sanders, et al., Reaction propagation of four nanoscale energetic composites (Al/MoO3, Al/WO3, Al/CuO, and Bi2O3). Vol. 23. 2007, Reston, VA, ETATS-UNIS: American Institute of Aeronautics and Astronautics. 8.
20. Yarrington, C., et al. Combustion Properties of Silicon/Teflon/Viton and Aluminum/Teflon/Viton Composites. in 47th AIAA Aerospace Sciences Meeting Including The New Horizons Forum and Aerospace Exposition. 2009. Orlando, FL: American Institute of Aeronautics and Astronautics, Inc.
21. Son, S.F., et al., Combustion of nanoscale Al/MoO3 thermite in microchannels. Journal of Propulsion and Power, 2007. 23(4): p. 715-721.

Chapter 1
14
22. Schniederjans, M.J., et al., A multi-objective modeling approach for energetic material evaluation decisions. European Journal of Operational Research, 2009. 194(3): p. 629-636.
23. Rossi, C. and D. Estève, Micropyrotechnics, a new technology for making energetic microsystems: review and prospective. Sensors and Actuators A: Physical, 2005. 120(2): p. 297-310.
24. A. Turano, et al., Exploding Thin Film Bridge Fracturing Fragment Detonator. 2001, Kaman Aerospace Corporation.
25. Rossi, C., et al., Final characterizations of MEMS-based pyrotechnical microthrusters. Sensors & Actuators A, 2005. 121: p. 508-514.
26. Apperson, S., et al., Nanothermite-based Microsystem for Drug Delivery and Cell Transfection, in 26th Army Science Conference. 2008: Orlando, FL.
27. Arora, A., et al., Needle-free delivery of macromolecules across the skin by nanoliter-volume pulsed microjets. Proceedings of The National Academy of Sciences, 2007. 104(11): p. 4255-4260.
28. Arora, A., M.R. Prausnitz, and S. Mitragotri, Micro-scale devices for transdermal drug delivery. International Journal of Pharmaceutics, 2008. 364(2): p. 227-236.
29. Doukas, A. and N. Kollias, Transdermal drug delivery with a pressure wave. Adv Drug Deliv Rev, 2004: p. 559-579.
30. Hosseini, S.H.R., Y. Kohno, and K. Takayama, Micro-explosives Induced Underwater Shock Waves for Biological Applications. Sci. Tech. Energetic Materials, 2005. 66(6): p. 411-415.
31. Jagadeesh, G. and K. Takayama, Novel Applications of Micro-shock Waves in Biological Sciences. J. Indian Inst. Sci., 2002. 82(1): p. 49-57.
32. Kendall, M., The delivery of particulate vaccines and drugs to human skin with a practical, hand-held shock tube-based system. Shock Waves, 2002. 12: p. 23-30.
33. Kodama, T., A.G. Doukas, and M.R. Hamblin, Shock wave-mediated molecular delivery into cells. Biochem Biophys Acta, 2002. 1542(1-3): p. 186-94.
34. Kodama, T., M.R. Hamblin, and A.G. Doukas, Cytoplasmic molecular delivery with shock waves: importance of impulse. Biophys J, 2000. 79(4): p. 1821-32.
35. Kodama, T., K. Takayama, and H. Uenohara, A new technology for revascularization of cerebral embolism using liquid jet impact. Phys Med Biol, 1997. 42(12): p. 2355-67.

Chapter 1
15
36. Lee, S., et al., In Vivo transdermal delivery using a shock tube. Shock Waves, 2000. 10: p. 307-311.
37. Menezes, V., Laser-Ablation-Assisted Microparticle Acceleration for Drug Deliver. Appl. Phys. Lett., 2005. 87: p. 1635-1640.
38. Rodríguez, G.A.A., C. Rossi, and D. Esteve, Design, fabrication and operation of a wireless and miniature ignition system. Sensors and Actuators A: Physical, 2006. 126(1): p. 201-210.
39. Pennarun, P., et al., Single use, robust, MEMS based electro-thermal microswitches for redundancy and system reconfiguration. Sensors and Actuators A: Physical, 2007. 136(1): p. 273-281.
40. Currano, L. and W. Churaman, Energetic Nanoporous Silicon Devices. Vol. 18. 2009, New York, NY, ETATS-UNIS: Institute of Electrical and Electronics Engineers. 9.
41. Churaman, W., L. Currano, and C. Becker, Initiation and reaction tuning of nanoporous energetic silicon. Journal of Physics and Chemistry of Solids, 2010. 71(2): p. 69-74.
42. Rodríguez, G.A.A., et al., A microactuator based on the decomposition of an energetic material for disposable lab-on-chip applications: fabrication and test. Journal of Micromechanics and Microengineering, 2009. 19(1): p. 015006.
43. Suhard, S., et al., When Energetic Materials, PDMS-Based Elastomers, and Microelectronic Processes Work Together: Fabrication of a Disposable Microactuator. Chemistry of Materials, 2009. 21(6): p. 1069-1076.
44. Defense, D.o., Safety and Performance Tests for The Qualification of Explosives (High Explosives, Propellants, and Pyrotechnics). 2001

Chapter 2
16
Chapter 2
Generation of Fast Propagating Combustion and Shock Waves with Copper oxide/Aluminum Nanothermite
Composites
2.1 Abstract
Nanothermite composites containing metallic fuel and inorganic oxidizer are gaining
importance due to their outstanding combustion characteristics. In this chapter, the
combustion behaviors of copper oxide/aluminum nanothermites are discussed. CuO
nanorods were synthesized using the surfactant-templating method, then mixed or self-
assembled with Al-nanoparticles. This nanoscale mixing resulted in a large interfacial
contact area between fuel and oxidizer. As a result, the reaction of the low density
nanothermite composite leads to a fast propagating combustion generating shock waves
with Mach numbers up to 3.
2.2 Introduction
Nanothermite materials are comprised of a physical mixture of inorganic fuel and
oxidizer nanoparticles. Non-homogenous distribution of fuel and oxidizer has been
observed in the microstructures [1]. This produces random hot spot density distribution
and decreases the propagation speed of the combustion wave front. It is, therefore,
important to achieve homogenous mixing of the oxidizer and fuel components for faster
reaction kinetics. This can be achieved by self-assembly of fuel around the solid
oxidizer. Enhancement in the combustion wave speed has already been reported for
composites containing porous oxidizers and fuel nanoparticles, and also for
electrostatically charged self-assembled composites [2-4].

Chapter 2
17
Recently, it was reported that higher combustion wave speeds were achieved for
the composites of ordered porous Fe2O3 oxidizer and Al-nanoparticles as compared with
the one containing porous oxidizer with no ordering of the pores and Al-nanoparticles
[5]. It has also been reported that the composite of CuO nanorods and Al-nanoparticles
exhibiting combustion wave speed of 1500±100 m/s, which enhances to 2200 m/s for the
self-assembled composites [6-8]. Interestingly, these higher combustion wave speeds are
comparable to the lower end values of the detonation velocities (e.g. 2000 m/s for
hydrocarbons/ alkylene-air mixtures, 1500-2700 m/s for metallic azides and fulminates,
and about 3000 m/s for ANFO (ammonium nitrate fuel oil)) for explosives [9-11].
In conventional explosives, the gases produced during the chemical reaction
develop turbulence due to a combined effect of high pressure and rapid shearing of
molecular layers generating a shock wave. In a process called deflagration-to-detonation
transition (DDT), the wave propagates in the reactive medium creating localized high
pressure at the hot spots and, after a certain run-up distance, rapid deflagration can
transition to full detonation [11]. This distance depends on the dimensions of the shock-
tube and also the level of confinement [11]. In the case of low density nanothermites, as
the adiabatic reaction temperatures are several thousand degrees, the reaction products
can volatilize rapidly resulting in an increased level of turbulence and high localized
pressures [12]. Because of the low density and multiphase nature of reaction materials,
the corresponding CJ (Chapman-Jouguet) pressure can be much lower than that of
conventional solid explosives. However, it is not evident from the present work whether a
DDT process is occurring in the case of nanothermites during self-propagation of
accelerated combustion wave. Further work is needed to confirm it.

Chapter 2
18
The generated shock waves with pressures well below the CJ pressures of solid
explosives have potential applications in many areas such as in geology, seismological
techniques, biomedical applications, bloodless scalpel, and permeabilization of cells for
drug and particle delivery [13-17].
2.3 Experimental
The precursors CuCl2, PEG-400 and NaOH for CuO nanorod synthesis were used
without purification [18]. Poly (4-vinyl pyridine) (P4VP) was utilized for assembling
CuO nanorods and Al nanoparticles of size 80 nm. The optimum combustion wave speed
was determined by performing a series of experiments varying the equivalence ratio, Φ
defined as,
( / )( / )
actual
stoichiometric
fuel oxidizerfuel oxidizer
Φ = (1)
between 0.6 (fuel-lean) - 1.8 (fuel rich). Details of these results are presented elsewhere
[7]. For this work, a Φ value of 1.6 was chosen as it produced maximum combustion
wave velocity. The TEM images of CuO nanorods and CuO nanorods assembled with Al
nanoparticles are shown in Figure 2.1 A and B respectively.
Pressure wave measurements were carried out in a shock-tube system as shown in
figure 2.2. The tube was
comprised of three
segments, each 10cm in
length. One segment
housed the nanothermite
material, and the other two Figure 2.1. TEM Images of A) CuO nanorods and B) Self–assembled composite of CuO nanorods/Al.

Chapter 2
19
sections contained ambient atmosphere. The section containing nanothermites had fiber-
optics (Thorlabs M21L01) coupling the inside of the tube to photodiodes (Thorlabs
DET210) for measuring the velocity of the combustion-front. This section of the tube was
separated from the other sections by an aluminum diaphragm (100µm thick). The latter
two segments each had pressure transducers (PCB models 113A03 & 119B12) mounted
along them for measurements of the pressure wave velocity. All three segments were
clamped together, and a confinement plate was placed over the end of the tube opposing
the nanothermite material. The output of the photodiodes was recorded using a Tektronix
oscilloscope TDS460A. The signal from the pressure transducers was measured using
National Instruments (NI) DAQ hardware, and LabVIEW control software.
For each experiment, a polycarbonate tube with 3.175mm inner diameter was
loaded with nanothermite material and inserted into the first segment. The energetic
reaction was triggered by a spark generator, and the leading photodiode was used to
trigger data acquisition on both the oscilloscope and NI DAQ. The combustion wave
speed of the energetic material was determined based on the time-of-arrival of the flame
at each optical fiber. Similarly, the pressure wave velocity was determined by the
Figure 2.2. Schematic of the shock-tube set-up used for the measurements. The pressuresensors in the nanothermite section of the tube (bottom) were only installed for densityexperiments.

Chapter 2
20
temporal response of the pressure transducers. The typical time-history for the pressure
sensors in the air-filled section is shown in Figure 2.3(A). Incident and reflected wave-
fronts are recorded since the pressure wave reflects off the confinement plate at the end
of the tube. The typical pressure-time trace in the nanoenergetic section of the tube is
shown in Figure 2.3(B).
In one set of experiments, two nanothermite compositions, the physically-mixed
and self-assembled samples, were compared. In another set of experiments, the %TMD
(theoretical maximum density) of physically-mixed CuO nanorods and Al nanoparticles
was varied by loading different amounts of powder into the tube. The volume of the
polycarbonate tubes used was 0.8cm3, and the TMD of the CuO/Al composites is 5.36
g/cc. As the mass of nanothermite material was varied from 100mg to 700mg, the %TMD
changed from 2.4 to 16.5%. An additional pressure measurement was made directly on
the tube containing the nanothermite. The sensors for this measurement are positioned
directly below the optical fibers as shown in Figure 2.2. From Table 2.1, it was observed
that the self-assembled composite produced a higher combustion rate and pressure wave
(A) (B) Figure 2.3 (A) Typical pressure-time histories in the air-filled section of the tube (twoyellow PCB113A03 sensors as drawn in Figure 2.2), (B) Typical pressure-time trace inthe nanothermite section (red PCB113A03 sensors as drawn in Figure 2.2).

Chapter 2
21
velocity compared to the
physically-mixed material due to
higher interfacial contact area. In
the other experiment, with an
increase in density, the combustion
wave velocity was found to
decrease from ~1400 m/s to
~700m/s; but the shock wave
velocity increased from ~500m/s to ~850m/s (Figure 2.4). It was also observed that the
pressure of the combustion zone increased with the increase in the density. At higher %
TMD, the gas inside the air column compressed to a higher density resulting in higher
shock wave speed.
Table 2.1. Shock wave velocity of CuO/Al nanothermite materials Mixing Method Flame Speed, m/s Pressure Speed, m/s Pressure Mach No. Physical Mixing 1500±250 766± 8.1 2.25 Self-Assembly 2200±300 831± 44.4 2.44
2.4 Discussion
In an attempt to explain the observed self-propagating reaction and generation of
shock waves for the nanothermites, one may consider the simplest model, CJ theory. For
typical nanorod composites, the density is usually low (%TMD varies from 2 to 16%)
and the combustion wave velocity is in the range of 1500 m/sec to 2300 m/sec [8]. From
the law of conservation and continuum mechanics, the CJ pressure (Pcj) in GPa can be
calculated using the relation
( )2
1cjDP ρ
γ= + (3)
Figure 2.4. Plot of combustion velocity, shockwave velocity, and peak pressure as a function ofthe density of physically mixed CuO/Al composite.

Chapter 2
22
where, γ is the negative slope of the isentrope, ρ is the density in gm/cm3 and D is the
detonation velocity in km/sec. For the nanothermites studied here, assuming that the
reaction products vaporize instantaneously at the very high temperature, one takes γ of
the gas-air mixture as 1.4, ρ as 0.00118 gm/cm3 and typical D as 2 km/sec; then, the CJ
pressure of 1.97 MPa is obtained, which is of the same order as the peak pressure
obtained experimentally (Figure 2.3(B)). It is understood that this assumption of instant
vaporization is not accurate, and development of an equation of state is needed for
numerical simulation studies of nanothermite materials. For solid explosives, the CJ
theory, although it assumes the chemical reaction to happen instantaneously, predicts the
experimental detonation velocity well.
Thus, an effort is made to correlate the peak pressure and detonation velocity for a
few samples of the nanothermites according to the CJ theory. Figure 2.5 shows a plot of
peak pressure P vs. (ρD2) for a range of densities for which the detonation velocity is
above 1 km/sec. Using the slope of the curve as m = 1/(γ+1), the approximate value of γ
is 59 according to the continuum theory. The discrepancy of this value from the solid
explosive, for which γ=3, may be attributed to low density multiphase nature of the
nanothermite materials and limitations of
continuum theory in the timescale of
interest. A more realistic numerical model
in suitable timescale based on molecular
dynamics simulation will be developed in
future.
Figure 2.5. Plot of CJ-pressure vs. ρD2 usedto determine the experimental value for γ.

Chapter 2
23
2.5 Conclusions
In conclusion, it has been demonstrated that the fast propagating combustion of
CuO/Al nanothermites could generate shock waves with potential applications in various
fields. In the future, an integrated analytical, experimental and numerical study will be
conducted to develop a realistic model for the combustion process with the use of both
continuum and molecular level approaches.
2.6 References
1. Miziolek, A.W., Nanoenergetics: An Emerging Technology Area of National Importance. The AMPTIAC Newsletter, 2002. 6(1): p. 43-48.
2. Gangopadhyay, S.C., MO, US), Shende, Rajesh (Columbia, MO, US), Subramanian, Senthil (San Diego, CA, US), Gangopadhyay, Keshab (Columbia, MO, US), Hasan, Shameem (Columbia, MO, US), Ordered nanoenergetic composites and synthesis method. 2007, The Curators of the University of Missouri: United States.
3. Granier, J.J. and M.L. Pantoya, Laser ignition of nanocomposite thermites. Combustion and Flame, 2004. 138(4): p. 373-383.
4. Kim, S.H. and M.R. Zachariah, Enhancing the Rate of Energy Release from NanoEnergetic Materials by Electrostatically Enhanced Assembly. Advanced Materials, 2004. 16(20): p. 1821-1825.
5. Mehendale, B., et al., Nanoenergetic Composite of Mesoporous Iron Oxide and Aluminum Nanoparticles. Journal of Energetic Materials, 2006. 24(4): p. 341 - 360.
6. Apperson, S., et al. On-Chip Initiation and burn rate measurements of thermite energetic reactions. in Mater. Res. soc. Symp. Proc. 2006.
7. Shende, R., et al., Nanoenergetic Composites of CuO Nanorods, Nanowires, and Al-Nanoparticles. Propellants, Explosives, Pyrotechnics, 2008. 33(2): p. 122-130.
8. Subramanian, S., et al., Self-assembled nanoenergetic composite. Mater. Res. Soc. Symp. Proc., 2006: p. 5.1-5.6.
9. Bowden, F.P. and H.T. Williams, Initiation and Propagation of Explosion in Azides and Fulminates. Proc. R. Soc. London, 1951. 208(1093): p. 176-188.
10. Souers, P.C., et al., The Effects of Containment on Detonation Velocity. Propellants, Explosives, Pyrotechnics, 2004. 29(1): p. 19-26.

Chapter 2
24
11. Wingerden, K.v., D. Bjerketvedt, and J.R. Bakke, Detonation in Pipes and in the Open, in Petro Chemical Congress. 1999: Bergen, Norway.
12. Fischer, S.H. and M.C. Grubelich, Theoretical energy release of thermites, intermetallics, and combustible metals, in Other Information: Supercedes report DE98005512; PBD: Jun 1998; PBD: 1 Jun 1998. 1998. p. Medium: ED; Size: 59 pages.
13. Chapelon, J.Y., et al., Treatment of localized prostate cancer with transrectal high intensity focused ultrasound. European Journal of Ultrasound, 1999. 9(1): p. 31-38.
14. Doukas, A. and N. Kollias, Transdermal drug delivery with a pressure wave. Adv. Drug Deliv. Rev., 2004: p. 559-579.
15. Kendall, M., The delivery of particulate vaccines and drugs to human skin with a practical, hand-held shock tube-based system. Shock Waves, 2002. 12: p. 23-30.
16. Sun, W.H., et al., In vivo cytokine gene transfer by gene gun reduces tumor growth in mice. Proceedings of the National Academy of Sciences of the United States of America, 1995. 92(7): p. 2889-2893.
17. Yuen, A.P.-W. and B.Y.-H. Wong, Ultrasonic glossectomy - simple and bloodless. Head & Neck, 2005. 27(8): p. 690-695.
18. Wang, W., et al., A simple wet-chemical synthesis and characterization of CuO nanorods. Applied Physics A: Materials Science & Processing, 2003. 76(3): p. 417-420.

Chapter 3
25
Chapter 3:
Ignition Mechanisms in Thin-Film Pt Micro-Igniters for Nanothermite Initiation1
3.1 Abstract
This chapter describes the design and ignition characteristics of micro-scale thin-
film bridgewires for initiating nanothermite reactions. The sputter-deposited bridgewires
are patterned on glass substrates using a lift-off photolithography process. The bridgewire
heating characteristics are analyzed using voltage measurements and high-speed video
recording. The effect of applying various voltages (3V to 18V) is tested. Also, the effect
of scaling bridge dimension is tested. The bridgewires were then tested for their ability to
ignite CuO/Al nanothermites with different quantities of nitrocellulose (NC). It is found
that the bridgewires generate a small burst similar to exploding bridgewire devices
(EBWs). As the voltage is varied, there is a visible change in the apparent size of the
generated burst. It is found that the bridge bursts and the ejected material most likely
ignites the nanothermite in contact with it. The efficiency of the burst process can be
increased by reducing the dimensions of the bridgewire, or by increasing the voltage or
current applied to the bridge. It is also found that it is more difficult to ignite
nanothermite mixtures of CuO/Al/NC as the concentration of NC increases. Up to 5%,
the material ignites reliably, but beyond 10% NC concentration, the ignition reliability is
reduced a significantly. When using a 6V DC battery, an igniter with a 50µm wide bridge
bursted and ignited CuO/Al/5% NC in an average time of ~8.2µs and it consumed an
average energy of ~118µJ. These findings provide useful information for understanding
1 A manuscript is being prepared for submission to a peer-reviewed journal.

Chapter 3
26
design parameters in nanothermite micro-igniters, and this low-energy operation allows
them to be incorporated into digital control circuitry.
3.2 Introduction
Miniaturized ignition systems based on microfabrication techniques are appealing
due to their small size, integrated circuit (IC) compatibility, low energy consumption, and
inexpensive batch fabrication [1]. These micro-devices find applications in initiation of
smart munitions and multi-point initiation. Other applications for pyrotechnic micro-
devices include micro-detonators, pneumatic and hydraulic microactuators, pulsed-power
microgenerators, and microthrusters [1-5]. These applications span a wide range of
industries including medical, automotive, mining, geological, and aerospace.
A new type of energetic material, known as nanoenergetics, has been under
development in recent years. Nanoenergetics, specifically nanothermites, exhibit unique
combustion performance and sensitivity characteristics that place them in a class of their
own. The main characteristic that sets them apart from conventional energetic materials
is the ability to fine-tune the formulations to resemble propellants, pyrotechnics, or high
explosives [6-9]. Because of the controllability of combustion properties of
nanothermites, and the potential range of applications, they have received a significant
amount of attention among the energetic materials community [5, 10]. Another aspect of
nanoenergetic materials that make them especially suited for micro-pyrotechnic
applications is that they exhibit strong propagation in micro-scale geometries. In other
words, their critical diameter is smaller than that of most conventional energetic materials
[11].

Chapter 3
27
A fundamental component of any micro-device that incorporates nanothermite
reactions is a suitable micro-igniter. One useful characteristic of a versatile micro-igniter
is the ability to trigger it using CMOS circuits, thus opening the possibility of digital
control for unique applications by use of simultaneous, or sequential, triggering of the
events with great precision. This requires low-energy operation of the device. In addition,
suitable fabrication and processing techniques are necessary to realize such micro-device
components.
In this chapter, metallic thin-film microigniters were fabricated and characterized
for nanothermite ignition performance. The igniters were tested without any nanothermite
present, and then their performance in igniting several different nanothermite
formulations was investigated. An understanding of the stages of ignition was gained, and
critical design parameters were determined.
3.3 Igniter Design
In order to initiate the nanoenergetic material reliably in a compact device, the
igniter should be capable of being integrated with on-chip control circuitry. This is
typically done through the use of compact electro-explosive devices (EED).
A thin-film version of an EED-type
igniter consists of two electrical contact
pads with a narrow path connecting the
contact pads. A schematic view of such an
igniter is shown in Figure 3.1. The narrow
portion is called the bridgewire, and it is
the area of highest current density. This
Figure 3.1. Schematic of thin-film igniter design. It consists of a narrow heating element, or bridge, (dashed box) and two contact pads.

Chapter 3
28
area is the focal point of the heat generation, which leads to ignition of the energetic
material.
Common EED designs include hot-wire, exploding bridgewire (EBW), exploding
foil initiator (EFI), and semiconductor bridge initiator (SCB) [12-17]. All three systems
(EBWs, EFIs, and SCBs) are designed to operate using large current/voltage pulses to
vaporize the bridge material producing small mechanical stress waves. For EBWs and
SCBs, the generated stress wave directly impacts the energetic material to initiate it [12,
18]. In EFI devices, the vaporized bridge accelerates an inert flier plate, which impacts
the energetic material to be initiated. Conversely, hot-wire igniters are designed to
function with relatively low DC voltage levels, and operate by Joule-heating of the
energetic material to its ignition temperature.
The ignition sensitivity of nanothermite material is comparable to that of
conventional pyrotechnics and primary explosive composites. They have similarly low
ignition temperatures, and are sensitive to friction, impact, and electrostatic discharge
(ESD) [19, 20]. Being that nanothermites are very sensitive to ignition, and low input
energy is a concern, the micro-scale bridgewire films with nanometer scale thickness are
suitable. The bridgewire in these devices is typically a metal.
The substrate would ideally have zero thermal conductivity because the
bridgewire must be in contact with the surface, and heat loss to the substrate is
undesirable. Some researchers have significantly reduced this effect in Si substrates by
backside etching the substrate to make it extremely thin in the area below the bridgewire
[14]. This reduces thermal mass of the substrate below the igniter, reducing heat

Chapter 3
29
conduction. However, the back-side etching step significantly complicates the
fabrication.
Instead, glass substrate was chosen over Si due to its relatively low thermal
conductivity and low cost. Platinum was chosen for the bridgewire material due to its
durability and corrosion resistance at high-temperatures [21-23]. Platinum is commonly
used in conventional hot-wire igniters due to its good corrosion resistance, high melting
point, and low electrical resistivity [18]. It is also used in conventional EBWs due to its
high electrical conductivity and high density [18].
3.4 Igniter Fabrication
The micro-heaters were fabricated using a combination of photolithography,
sputtering, and lift-off techniques. The heater fabrication sequence is shown
schematically in Figure 3.2. The glass substrates (Soda-lime glass microscope slides)
were pre-cleaned using acetone. A
photoresist mask was created by patterning
S1813 photoresist. A metallic bi-layer of
Ti (10nm) and Pt (90nm) was deposited by
sputtering. The function of the Ti was to
promote adhesion of Pt to the glass.
Finally, the photoresist was removed by
sonication in acetone, thereby causing lift-
off of the metallic bi-layer from the
unwanted areas.
A four-point-probe was used to Figure 3.2. Patterning process for igniters. A sacrificial layer of photoresist is used for lift-off patterning.
Fabrication Sequence: 1. Pattern Photoresist (S1813) 2. Sputter coat Pt/Ti films (90/15nm) 3. Lift-off photoresist (Acetone)

Chapter 3
30
measure the electrical resistivity of the films deposited for the igniters. The resistivity of
the Pt/Ti films was 11.6x10⁻⁶ Ω·cm. The increased resistivity of the sputtered Pt films
compared to that of bulk Pt (10.6x10⁻⁶ Ω·cm) may be attributed to defects in the crystal
structure resulting from the low-temperature vapor deposition process [23]. The total film
thickness was 100±5nm based on profilometer measurements.
Wires were then soldered to the contact pads on the igniters. A PDMS membrane
was temporarily placed over the heating elements of each row of heaters. This membrane,
which was held in place by Van der Waals forces with the glass surface, prevented solder
from flowing under it. Placing the edge straight along the edge of a row of heaters
allowed consistent edge control with the solder contacts. The soldering iron was
controlled at 280°C to ensure the low enough viscosity of the solder without causing
thermal stress large enough to crack the substrate.
3.5 Pt Bridgewire Electromechanical Characterization
Understanding the mechanism of energy transfer between the thin-film bridgewire
and the nanothermite is important for optimal design of the bridgewire. It was not certain
whether the igniters would behave like hot-wire devices, EBWs, or something in
between. The behavior of the bridgewires was studied without the presence of energetic
material. A high-speed camera was used to observe the bridgewires as electrical power
was applied. The camera was a Photron FastCam SA1.1. It was set to record at 100-200
kfps and resolution of 128x112. Additionally, voltage was recorded with an oscilloscope
during testing. The oscilloscope record and high-speed video were triggered
synchronously with the application of electrical power to the igniter, thereby facilitating
the calculation of ignition delay and classification of observable events. Microscope

Chapter 3
31
photos were also taken of the ignition element before and after testing to observe any
permanent physical effects.
Figure 3.3 shows the igniter design used for testing the effect of varying voltage.
The average resistance of these igniters measured across the bonded wires was
8.88±0.25Ω. The voltage was varied from 3V to 18V in increments of 3V.
In the range of 6-18V, the bridgewires appeared to "burst" similar to EBWs.
Figure 3.4 shows high-speed video frames of the burst action of bridge-wires under 6V,
12V, and 18V of applied voltage. Comparing the size of the glowing emission and
projected streaks under each load, it would seem that 18V gave the largest burst.
Figure 3.5 shows microscope images of the bridges after testing. When 3V was
applied, there was not a noticeable change in the appearance of the bridgewire. In the
50µm
(A) (B) Figure 3.3. (A) Dimensions of igniters used in testing the effect of varying applied voltage. (B) Microscope image of a fabricated igniter.
Figure 3.4. High-speed video frames of bridgewire burst with (A) 6V, (B) 12V, and (C) 18V applied. Frame rate was 100kfps. The inter-frame time was 10µs.
A
0µs 10µs 20µs
B
0µs 10µs 20µs 30µs
C
0µs 10µs 20µs 30µs 40µs 50µs 60µs

Chapter 3
32
tests with voltages greater than or equal to 6V, a portion of the bridgewire was missing
after testing. Furthermore, the size of the void in the bridgewire increases with increasing
applied voltage. The "streaky" nature of the bursts seen in Figure 3.4 (B) and (C)
suggests that the "burst" event was not full vaporization of the bridgewire material as in
conventional EBW devices.
There could be some solid/liquid particulates ejected by localized vaporization
events. In other words, the film could be getting "boiled" violently rather than truly
vaporized or "exploded." Additionally, the boiling point of Ti is 3287°C compared with
that of Pt, which is 3827°C. It is possible that evaporating Ti underneath the Pt could
alter, and possibly accelerate, the vaporization of the Pt. In EBWs, the main burst builds
up during the arcing/vaporization phase of the event. If the Ti film would expand
underneath the Pt, it could create local stress defects in the Pt film, leading to arcing at
the stress boundaries. This volatilization and expansion could cause the Pt film to burst
into fragments.
Figure 3.6A shows the voltage-time traces for 18V, 15V, 12V, and 9V tests.
There is a small spike of 1-2V when the burst is seen in the high-speed video. The delay
between switching the voltage on and the bridge burst increased with the decrease of the
voltage. Figure 3.6B is a plot of input energy until break vs. input power. The power was
Figure 3.5. Microscope images of different bridgewires after testing under different applied voltages.

Chapter 3
33
calculated by the expression (V2/R) using the steady-state input voltage and resistance
measured before testing. The resistance will increase during heating, making the
calculated power a slight overestimate. The value for input energy was obtained by
numeric integration of the power vs. time trace, which was calculated from the voltage
vs. time trace. The integration was performed from the time the power was turned on to
the peak in the voltage at burst. Again, due to the increasing resistance during heating, the
calculated energy is an overestimate.
The theoretical relationship between firing energy and input power is hyperbolic
such as that shown in Figure 3.6B. This relationship holds for all types of initiators,
electric and non-electric [18]. The vertical asymptote, i.e. minimum power, is the
condition wherein the rate of energy input balances with energy losses. Equilibrium is
reached before the energetic material is able to reach its ignition temperature. The
horizontal asymptote is minimum energy, and it is the minimum amount of energy
required to ignite the material the wire. In the minimum energy condition, the input
power is so large that the burst condition is reached before any energy is lost to the
Figure 3.6. Ignition data for tests with the igniter design of Figure 3.3. (A) Voltage-time history recorded for four tests with different voltages. (B) Burst energy vs. input power corresponding to different applied voltages.
(B) (A)
0 20 40 60 80 100 120 1406
9
12
15
18
21
Vol
tage
(V)
Time (μs)0 5 10 15 20 25 30 35 40
-1
0
1
2
3
4
5
6
7Experimental Data
6V 9V 12V 15V 18V Hyperbolic FitE
nerg
y (m
J)
Power (W)
Min
imum
Pow
er
Minimum Energy

Chapter 3
34
surrounding system. In other words, energy losses to the surrounding system are
negligible, and the system approaches 100% efficiency.
In the case of conventional electrical initiators, the energy-power curve shown in
Figure 3.6B would refer to the energy required for the igniter to initiate an explosive such
as PETN. For the data shown in Figure 3.6B, there was no energetic material present. The
relationship still holds for the bridge vaporization process because the same fundamental
thermodynamic processes dominate.
3.6 Nanothermite Ignition testing
After characterizing the behavior of the igniters without energetic material
present, the ignition of nanothermites containing CuO nanorods, Al nanoparticles, and
nitrocellulose (NC) was tested using the igniter design shown in Figure 3.3. The input
voltage was a constant 15V. A polycarbonate (Lexan) substrate containing through-holes
was bonded over the igniters. The Lexan substrate was aligned with the igniters such that
a hole was aligned over each igniter bridge creating a well into which nanothermite
powder was loaded.
Different concentrations of NC were tested, namely 0%, 5%, 10%, and 15%. The
materials were prepared by mixing slurries and then drying them to form powder that
could be applied to the igniter. The NC was dissolved in Acetone to form a solution.
Separately, 200mg CuO and 85mg Al nanomaterials were mixed for four hours in 2-
Propanol using ultrasonic agitation. The Al nanoparticles were 80nm average diameter
with a 2.2nm thick Al2O3 passivation shell. The CuO nanorods were prepared using an
in-house process [8]. The mixing ratio of 40:17 was the experimentally determined to be
optimum based on maximum combustion performance [8, 9]. After mixing, the CuO/Al

Chapter 3
35
slurry was dried in an oven at 100°C for 15 minutes. The resulting CuO/Al powder was
added to the NC solution, and the solution was sonicated for an additional four hours.
Finally, the mixed slurry was dried at 100°C to make powder. The powder was loaded
into the wells formed over the igniters. A layer of powder was deliberately pressed into
contact with igniter surface in each well.
It was not known whether the burst from the bridge would ignite the
nanothermite, or if the nanothermite would be heated to its ignition temperature before
the burst. The ignition temperature of nanothermite comprised of CuO nanorods and Al
nanoparticles, determined using DSC/TGA analysis, is ~550°C, and the boiling point of
Pt is 3825°C. Therefore, it was expected that the input energy and ignition delay for
igniting material would be smaller than that required to burst the Pt bridge.
However, it was observed that the bridge bursts first, which then ignites the
nanothermite. The evidence of this is shown in Figure 3.7. Figure 3.7(A) shows a
sequence of high-speed video frames from a test with CuO/Al/15% NC, and Figure
(B)
0 10 20 30 40 50 60 70 8012
13
14
15
16
17
Vol
tage
(V)
Time (μsec)
Figure 3.7. Characteristic data recorded during nanothermite ignition testing. (A) High-speed video data. (B) Voltage-time record. A small periodic pulse exists due to some stray signal, but it is negligible.
(A)

Chapter 3
36
3.7(B) shows voltage-time trace from the same test. In the video, there is a small flash
seen at ~15µs (frame: 3). Then there is weak glow for the next 30µs. At ~50µs (frame:
10), the glow gets brighter and the material can be seen building up to full combustion. A
response in the recorded voltage (Figure 3.7(B)) is seen corresponding in time with the
two events observed in the video (the flash at ~15µs and the take-off of combustion at
~50µs). The voltage spike at ~17µs has the same characteristic shape as the spike seen in
voltage during burst tests. This suggests that the flash seen in the video is the Pt bridge
bursting. The high-frequency fluctuation in voltage seen corresponding to the take-off of
combustion is likely due to some current generation as a result of the highly ionized
nanothermite reaction zone [24].
The next question was whether the nanothermite was ignited purely by the burst
of bridge material, or if there was still electrical energy being supplied to the system to
generate additional heat. In order to answer this, current measurement was added to the
characterization system. This was intended to show that current dropped off completely
after the burst event, i.e. no additional electrical energy was supplied after the bursting of
the bridge. Figure 3.8 shows the voltage
and current measurements of a test with no
material, showing the current drop to zero
after the bridge bursts. The igniter design
used is discussed below (Section 3.7 and
Figure 3.10). This means energy supplied
is dependent on the bridgewire properties,
which is independent of nanothermite
-5 0 5 10 15 20 25 30-2
0
2
4
6
8
10
Vol
tage
(V)
Time (μs)
Supply Voltage
-0.2
0.0
0.2
0.4
0.6
0.8
1.0
Supply Current C
urre
nt (A
)
Figure 3.8. Current and voltage measurements taken during a bridge burst test. (Igniter design shown in Figure 3.10)

Chapter 3
37
properties.
Considering the evidence, it seems that the process for igniting the nanothermite
is as follows: the electrical energy source is turned on the igniter. This causes the igniter
bridge to heat up rapidly until it bursts. The burst on the bridge ejects hot particulates
from the film. This material hits the nanothermite material causing local heating. If any
spot on the nanothermite reaches the ignition temperature of the nanothermite, then the
self-propagating reaction begins in the nanothermite.
This process requires that the ejected bridge material carry enough kinetic and
thermal energy to heat the nanothermite to its ignition temperature. Also, the energy
carried by the ejected material is limited by the input energy and efficiency of the igniter.
If operating the igniters in the minimum energy condition (high-power), then the
minimum ignition energy thresholds for different nanothermites can be determined.
Table 3.1 lists performance information for the igniters when tested on
CuO/Al/NC materials. The burst delay is the delay from when the power is turned on to
when the igniter vaporizes. The ignition delay is the delay from igniter vaporization to
when the material ignited. Success rate indicates the number of tests in which the
material successfully ignited. Input energy is calculated from the current and voltage
measured during testing. This calculation of energy agrees with the method described
above (V2/R using initial resistance) within the margin of error. What is notable from this
Table 3.1. Testing data for ignition of CuO/Al/NC mixes with varying amounts of NC content.
% NC Avg. Resist.
(Ω) Burst Delay
(µsec) Input
Energy (µJ) Ignition Delay
(µsec) Success
Rate 0 10.1 17.6±5.2 392±68 1.0±0.4 6/6 5 8.41 15.3±5.6 409±76 2.6±1.7 6/6
10 9.32 16.2±3.6 391±47 25±21 4/6 15 8.58 16.0±3.3 420±46 53±33 3/6

Chapter 3
38
data is that the spark delay and energy supplied to the igniter did not change when NC
concentration changed. This confirms that the burst event is independent of the type of
nanothermite. The high-speed video for all different materials also confirmed the delay
between bridgewire burst and nanothermite ignition. The ignition delay and rate of
success are drastically affected by the NC content though.
The materials with more NC were not ignited with as high of a success rate. The
ignition delay was also longer with materials containing more NC content. Since the
energy carried by the burst is highest at the instant it is created, it must ignite the material
immediately upon contact between the ejected material and the nanothermite. Therefore,
any difference in ignition delay and success rate must be because of some effect
independent of the initial energy of the burst. There could be a difference in proximity
between the bridgewire surface and nanothermite with different concentrations of NC.
Additionally, the nanothermite with higher NC content may have a larger critical
diameter, lower thermal conductivity/diffusivity, or larger heat capacity. All of these
would lead to an increase in the necessary time to reach ignition and combustion.
This suggests that these materials are less sensitive to ignition, and needed more
energy to guarantee that a self-propagating reaction is triggered immediately after the
burst impacts the nanothermite. Therefore, the igniter must be designed to vaporize with
enough energy to reliably ignite the nanothermite. Using more input power and/or a
bridgewire with larger mass but identical resistance would improve the rate of success of
igniting materials with more NC. Additionally, since successful ignition only requires
heating in a very small spot, increasing power density by reducing bridgewire dimensions
would create higher energy bursts concentrated on a smaller area.

Chapter 3
39
3.7 Effect of Scaling Bridge Dimensions
In order to increase the efficiency of the igniters, the length and width of the
bridgewire was scaled-down, without significantly changing the bridge resistance. This
was done by keeping the ratio of length to width of the bridgewire constant. By writing
the equation for resistance as, R=(ρ/T)*(L/W), where ρ is resistivity of the thin-film
metal, L is the bridge length, W is the bridge width, and T is the film thickness. It is seen
that by fixing the film resistivity and thickness as a constant, and if length and width are
changed proportionally such that the ratio L/W is constant, then the bridge resistance will
not change. This allows direct scaling of the heater surface area without changing the
electrical load, and thus the electrical power.
Igniters were fabricated with the design shown in Figure 3.9(A). A constant 6V
was applied to the films, and CuO/Al nanothermite was placed on the igniters. Each
igniter design was tested five times to get an average and standard deviation. The same
effect was seen in terms of the bridgewire burst action. There was no detectable delay
from bridge burst to CuO/Al ignition. Figure 3.9(B) shows a plot of ignition delay and
0 200 400 600 800 1000
0
3
6
9
12
15
Del
ay (m
s)
Power Density (W/cm2)
Delay
0
10
20
30
40
50
Input Energy In
put E
nerg
y (m
J)
(B) (A) Figure 3.9. (A) Igniter design with bridgewire length and width denoted by L and W, respectively. (B) Plot of ignition delay and input energy vs. power.

Chapter 3
40
input energy vs. power density. The igniters show the same trend as seen when voltage
was varied for a fixed geometry igniter. Table 3.2 shows the data for the series of tests
shown in Figure 3.9(B). With the exception of the igniter in the fourth row of Table 3.2
(8,500µm2 bridge area), the resistance of the igniters were all similar. By changing heater
dimensions without significantly changing resistance, the power density was varied but
the total power consumption did not change significantly.
Table 3.2. Ignition testing data for igniter design shown in Figure 3.6. Power Density (W/cm2)
Bridge Area (µm2)
Resistance (Ω)
Ignition Delay (ms)
Input Energy (mJ)
39.7 76,500 13.1±0.31 10.9±3.16 34.0±10.1 86.7 34,000 13.5±0.91 4.51±1.76 13.4±4.74 111.8 31,500 11.3±0.38 1.92±0.30 6.91±0.90 176.1 8,500 26.6±2.29 0.56±0.08 0.87±0.18 245.1 14,000 11.6±0.47 0.39±0.10 1.39±0.34 895.6 3,500 12.7±0.29 0.072±0.013 0.23±0.04
Lastly, an experiment was performed with smaller bridgewires and reduced
voltage input, with the goal of minimizing the burst delay and input energy required to
ignite CuO/Al nanothermite. The goal was to minimize the bridgewire surface area such
that resistance is reduced and power resistance. Having minimal resistance and surface
area, will give highest possible power density under a fixed voltage source.
The way to do this can be explained mathematically by writing power density
(volumetric) in terms of voltage input, bridge resistivity, and bridge dimensions. This is
summarized by the following relationship:
2
222
)( LV
LWT
LWTV
VolRV
VolPPD ρρ
=⎟⎟⎠
⎞⎜⎜⎝
⎛=
⋅== ,
where PD is power density, P is power, Vol is bridge volume, V is voltage, R is bridge
resistance, ρ is bridge resistivity, L is bridge length, W is bridge width, and T is bridge

Chapter 3
41
thickness. After simplifying, it is easy to see that the bridge length is the only thing that
affects power density. That is because increasing the width and/or thickness will reduce
resistance (increase power density), but also increase bridge volume (reduce power
density). The bridge length is the only dimension that has a net effect on power density.
Based on this analysis, the design used in figure 3.10 was used. The bridge length
was minimized by making the contact pads slope toward the center. The bridge width
was 50µm, which was the narrowest achievable with low-cost transparency photomasks
used for this work. The reason for minimizing the bridge width was to make the ignition
spot as small as possible, which would allow best control over ignition and subsequent
propagation on the micro-scale.
Ignition tests were performed with 9V and 6V power supplies. Each voltage was
tested five times to get an average and standard deviation. Table 3.3 summarizes two sets
of tests with each voltage source. Considering that the average voltage and power was
higher for the tests with 9V, but the input energy was the same within the margin of error
(average value of 109µJ vs. 118µJ) as that of the tests with 6V, it is possible that this is
close to the minimum energy required for achieving burst in these bridgewires. Also, the
CuO/Al must be capable of being ignited with less than or equal to ~75-143µJ, which are
the lowest and highest values obtained experimentally.
Figure 3.10. (Left) Drawing of bowtie design of igniters with 50 µm bridge width. (Right) Microscope image of a fabricated bowtie bridgewire.

Chapter 3
42
Table 3.3. Ignition performance of igniters shown in Figure 3.10.
Parameter Tests with 6V Tests with 9V Resistance (Ω) 13.0 ± 0.84 11.3 ± 0.47Voltage (V) 6.10 ± 0.01 9.3 ± 0.12Average Power (W) 3.34 ± 0.18 14.0 ± 1.55Delay (µs) 31.7 ± 9.30 8.24 ± 2.66Energy (µJ) 109 ± 34.0 118 ± 24.8
3.8. Conclusions
It has been shown that microigniters comprised of Pt/Ti behave more like EBW
devices than hot-wire igniter behavior. That is, the Pt/Ti bridges burst similar to and
EBW. This is important from the design stand-point. The target condition for an EBW is
that wherein the bridgewire is vaporized with enough energy to ignite the nanothermite.
The target condition for a hot-wire igniter would be to have the bridgewire reach the
ignition temperature of the nanothermite. These different target conditions require
different power circuit designs and bridgewire designs. For example, one may consider
fabricating an EBW with multi-layer bridgewire films that will have an exothermic
intermetallic reaction such as Ni/Al or Pt/Al [25]. Additionally, the circuit for an EBW
device would be a high-voltage, high-current pulse power source. However, for a hot-
wire it would be a relatively low voltage and low current, DC source.
In addition, ignition tests were performed on CuO/Al/NC nanothermites. It was
found that as NC content increased, the ignition delay increased with a decrease in the
rate of success. This suggests the materials with higher NC content require an igniter that
can deliver higher energy and/or power density to the material. An igniter designed with
a smaller bridgewire was tested and using a 9V source, it could ignite CuO/Al/5%NC
material with input energy of ~118 µJ and a total delay time of ~8µs. With minimum

Chapter 3
43
ignition energies on the order of 100µJ, digital control circuits can be feasibly designed
for miniature ignition systems.
References:
1. Rossi, C. and D. Estève, Micropyrotechnics, a new technology for making energetic microsystems: review and prospective. Sensors and Actuators A: Physical, 2005. 120(2): p. 297-310.
2. Apperson, S., et al., Characterization of Nanothermite Material for Solid-Fuel Microthruster Applications. Journal of Propulsion and Power, 2009. 25(5): p. 1086-1091.
3. Apperson, S., et al., Nanothermite-based Microsystem for Drug Delivery and Cell Transfection, in 26th Army Science Conference. 2008: Orlando, FL.
4. Hossain, M., et al., Crystallization of amorphous silicon by self propagation of nanoengineered thermites. Journal of Applied Physics, 2007. 101.
5. Rossi, C., et al., Nanoenergetic Materials for MEMS: A Review. Microelectromechanical Systems, Journal of, 2007. 16(4): p. 919-931.
6. Apperson, S., et al., Generation of fast propagating combustion and shock waves with copper oxide/aluminum nanothermite composites. Applied Physics Letters, 2007. 91(24): p. 243109-3.
7. Mehendale, B., et al., Nanoenergetic Composite of Mesoporous Iron Oxide and Aluminum Nanoparticles. Journal of Energetic Materials, 2006. 24(4): p. 341 - 360.
8. Shende, R., et al., Nanoenergetic Composites of CuO Nanorods, Nanowires, and Al-Nanoparticles. Propellants, Explosives, Pyrotechnics, 2008. 33(2): p. 122-130.
9. Shende, R., et al., Nanostructured Energetic Materials, Session M,. 25th Army Science Conference, Orlando, Fl., 2006.
10. Miziolek, A.W., Nanoenergetics: An Emerging Technology Area of National Importance. The AMPTIAC Newsletter, 2002. 6(1): p. 43-48.
11. Son, S.F., et al., Combustion of nanoscale Al/MoO3 thermite in microchannels. Journal of Propulsion and Power, 2007. 23(4): p. 715-721.
12. Kim, J.-U., et al., Characteristics of semiconductor bridge (SCB) plasma generated in a micro-electro-mechanical system (MEMS). Physics Letters A, 2002. 305(6): p. 413-418.

Chapter 3
44
13. Liew, L.-A., V.M. Bright, and R. Raj, A novel micro glow plug fabricated from polymer-derived ceramics: in situ measurement of high-temperature properties and application to ultrahigh-temperature ignition. Sensors and Actuators A: Physical, 2003. 104(3): p. 246-262.
14. Rodríguez, G.A.A., C. Rossi, and D. Esteve, Design, fabrication and operation of a wireless and miniature ignition system. Sensors and Actuators A: Physical, 2006. 126(1): p. 201-210.
15. Zhang, X., et al., Igniters and temperature sensors for a micro-scale combustion system. Sensors and Actuators A: Physical, 2003. 103(1-2): p. 253-262.
16. A. Turano, e.a., Exploding Thin Film Bridge Fracturing Fragment Detonator. 2001, Kaman Aerospace Corporation.
17. D. Thompson, e.a., Electrical Initiation System. 2005, The United States of America as represented by the Secretary of the Navy.
18. Cooper, P.W., Explosives Engineering. 1996, New York: VCH Publishers.
19. Evans, B.L. and A.D. Yoffe, Structure and Stability of Inorganic Azides. Proceedings of the Royal Society of London. Series A, Mathematical and Physical Sciences, 1957. 238(1215): p. 568-574.
20. Granier, J.J. and M.L. Pantoya, Laser ignition of nanocomposite thermites. Combustion and Flame, 2004. 138(4): p. 373-383.
21. Firebaugh, S.L., K.F. Jensen, and M.A. Schmidt, Investigation of high-temperature degradation of platinum thin films with an in situ resistance measurement apparatus. Vol. 7. 1998, New York, NY, ETATS-UNIS: Institute of Electrical and Electronics Engineers.
22. Joanni, E., et al., Simple Method for Crystallizing Ceramic Thin Films Using Platinum Bottom Electrodes as Resistive Heating Elements. Japanese Journal of Applied Physics, 2003. 42(Part 2, No. 7B): p. L863.
23. Mardare, A.I., C.C. Mardare, and E. Joanni, Effect of the deposition conditions of platinum electrodes on their performance as resistive heating elements. Materials Research, 2004. 7: p. 427-430.
24. Tasker, D.G., et al., Dynamic measurements of electrical conductivity in metastable intermolecular composites. Journal of Applied Physics, 2006. 99(2): p. 023705-7.
25. Morris, C.J., et al., Rapid initiation of reactions in Al/Ni multilayers with nanoscale layering. Journal of Physics and Chemistry of Solids, 2010. 71(2): p. 84-89.

Chapter 4
45
Chapter 4:
Microchip-Based Shock Wave Generator for Particle Delivery and Cell Transfection1
4.1 Abstract
There are many methods for generating shock waves for different biological
applications, and the type of shock waves produced depend on the method used for
generating them. Here, it is shown that the shock waves generated by controlled
nanothermite reactions can permeabilize cells allowing uptake of different materials with
high efficiency into primary cells and cell lines with minimal or no damage. For example,
embryonic cardiomyocyte transfection with a bioluminescent gene was ~99% with
similar cell survival. Additionally, it is shown that the peak pressure and total impulse of
the pressure-pulses can be adjusted by controlling the nanocomposite formulation, and
that the power of the pulse influences the level of fluorescence uptake and transfection
efficiency. These results show a new biological application of nanomaterials, specifically
nanothermites, which would normally be considered only for weapons applications.
4.2 Introduction
The most developed and widely-used biological application of shock waves is
treatment of kidney and gall stones. Other potential applications that have been
envisioned include cancer treatment, orthopedics, wood preservative delivery, and gene
delivery [1]. Different applications may require different types of shock waves based on
the desired effect and properties of the biological system. For example, peak pressure
threshold required to cause hemorrhaging in the rat brain is >10MPa, whereas threshold
for inducing neuronal apoptosis can be <1MPa [2]. Methods used for generation of shock 1 A manuscript is being prepared for submission to a peer-reviewed journal.

Chapter 4
46
waves for biological applications include electric discharge in water, piezoelectric
actuation, pulsed laser focusing, diaphragm rupture, and micro-explosions [1-5]. One
application that has been explored is cell permeabilization for molecular delivery.
However, the method of generating pressure waves by the reaction of energetic
materials has not been fully explored for drug delivery. This is mainly due to limited
categories of conventional energetic materials (e.g. propellants or high explosives) and
the limited ranges of performance tunability. The tunability of energetic output is
essential to optimize and increase the efficiency of delivery and minimize the cell
damage. A relatively new finding is that certain types of nanothermite materials are
capable of producing a unique pressure pulse when they are ignited. For example, certain
types of CuO/Al nanothermites have been shown to exhibit combustion velocities in the
same range as the heavy-metal azides, including heavy metal azides and fulminates [6-
12]. However, these novel nanothermites produce shockwaves at pressure levels much
lower than conventional explosives. This makes nanothermites useful for generating low-
intensity shock waves for non-destructive applications such as cell permeabilization.
4.3 Tunable Nanothermites
Thermites are pyrotechnic mixtures of metal and metal oxide powders, which
combust by an oxidation-reduction reaction. It is not an explosive reaction (i.e.
decomposition of monomolecular compound), but the reaction temperature of most
thermites is >3000 °K. The combustion velocity of thermites consisting of micron size
fuel and oxidizer are only in m/s range and do not have a fast enough rise time to produce
shock (see Figure 4.1(A)). The composites of oxidizer and fuel in the nanoscale, called
“nanothermites”, are capable of very fast reaction and production of shock waves- a

Chapter 4
47
behavior that is not exhibited by conventional thermites (Figure 4.1(A) & (B)) [8]. When
the fuel and oxidizer are distributed in nanoscale, the reaction mechanism is not
diffusion-limited due to the close proximity leading to high combustion rates. The high
temperatures cause the reaction products to vaporize and/or ionize, and the fast reaction
rates lead to very high pressure output over a very short period of time (Figure 4.1(B))
[13].
Figure 4.1(B) also illustrates a very important and novel aspect of nanothermites.
That is, nanothermite performance is highly tunable using additives such as polymeric
binders and explosive nanoparticles. As can be seen in Figure 4.1(B), the rise time and
peak pressure of the pulses can be readily tuned using different formulations. All the
pulses shown in Figure 4.1(B) are for 20mg of the nanoenergetic material. However, by
properly designing the formulation, and then adjusting the quantity of material, the rise
time and peak pressure can be tuned independently (rise time ranging from <1µsec to >25
µsec, and peak pressure ranging from <1MPa to >1Gpa). This is very useful for
Figure 4.1. (A) Comparison of Pressure-time characteristics of thermite formulations using CuO and Al powders with different grain sizes (µ = micro-scale powder grains, n = nano-scale powder grains). (B) Comparison of pressure-time characteristics of various nanothermite formulations. In the legend, NC denotes nitrocellulose binder, and AN denotes ammonium nitrate nanoparticles.
B A
0.0 0.1 0.2 0.3 0.4 0.5 0.6 0.7 0.8 0.9 1.00
10
20
30
40
50
0.0 0.1 0.2 0.3012345
Time (msec)
μ-CuO - μ-Al
n-CuO - μ-Al
μ-CuO - n-Al n-CuO - n-Al
Pre
ssur
e (M
Pa)
Pre
ssur
e (M
Pa)
Time (msec)
0 20 40 60 80 100 120 1400
100
200
300
400
500
Pre
ssur
e (M
Pa)
Time (μsec)
CuO/Al CuO/Al/5% NC CuO/Al/10% NC CuO/Al/10% AN CuO/Al/20% AN CuO/Al/30% AN Bi2O3/Al Bi2O3/Al/20% AN Bi2O3/Al/30% AN
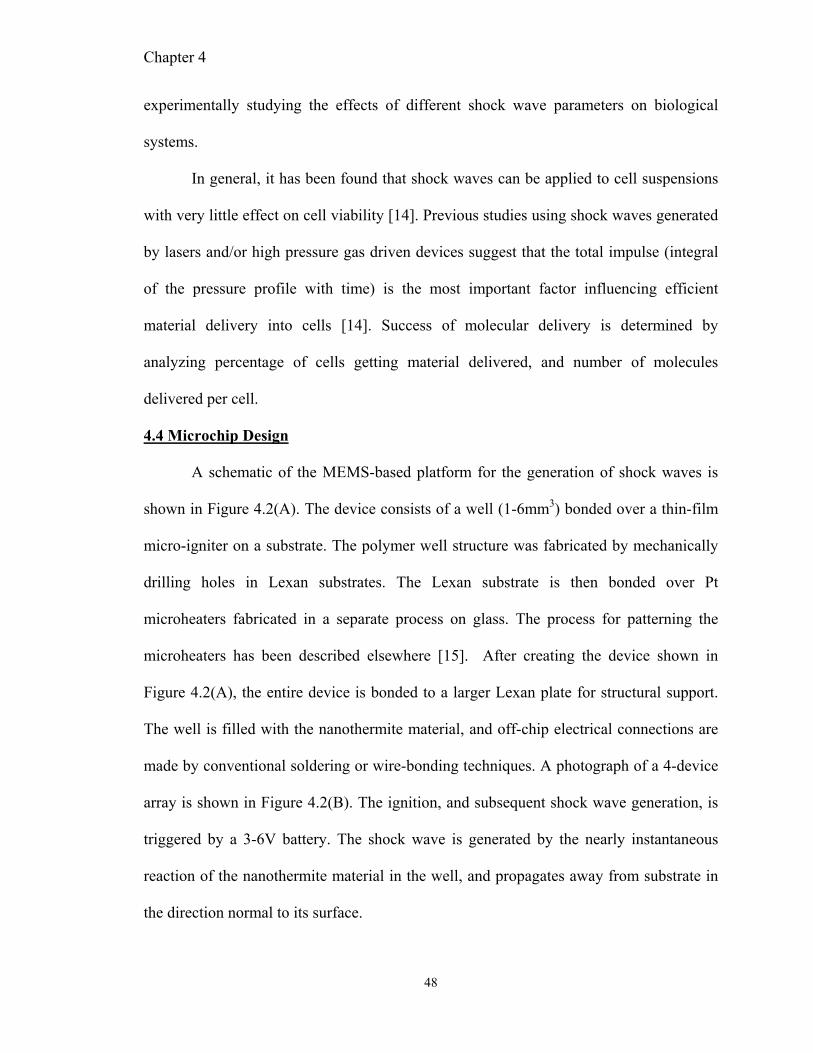
Chapter 4
48
experimentally studying the effects of different shock wave parameters on biological
systems.
In general, it has been found that shock waves can be applied to cell suspensions
with very little effect on cell viability [14]. Previous studies using shock waves generated
by lasers and/or high pressure gas driven devices suggest that the total impulse (integral
of the pressure profile with time) is the most important factor influencing efficient
material delivery into cells [14]. Success of molecular delivery is determined by
analyzing percentage of cells getting material delivered, and number of molecules
delivered per cell.
4.4 Microchip Design
A schematic of the MEMS-based platform for the generation of shock waves is
shown in Figure 4.2(A). The device consists of a well (1-6mm3) bonded over a thin-film
micro-igniter on a substrate. The polymer well structure was fabricated by mechanically
drilling holes in Lexan substrates. The Lexan substrate is then bonded over Pt
microheaters fabricated in a separate process on glass. The process for patterning the
microheaters has been described elsewhere [15]. After creating the device shown in
Figure 4.2(A), the entire device is bonded to a larger Lexan plate for structural support.
The well is filled with the nanothermite material, and off-chip electrical connections are
made by conventional soldering or wire-bonding techniques. A photograph of a 4-device
array is shown in Figure 4.2(B). The ignition, and subsequent shock wave generation, is
triggered by a 3-6V battery. The shock wave is generated by the nearly instantaneous
reaction of the nanothermite material in the well, and propagates away from substrate in
the direction normal to its surface.

Chapter 4
49
(A) (B)
Figure 4.2. (A) Schematic showing shock-wave generating platform. (B) Photograph of finished device before loading energetic material.
4.5 Shock-Tube Characterization
The shock waves produced by this device have been measured in a compact air-
filled shock-tube system. This setup is shown in Figure 4.3. The device is clamped
against the end of the tube such that the shock wave propagates directly from the device
into the tube. Pressure transducers mounted along the length of the tube record pressure-
time histories and allow analysis of shock wave intensity and propagation/acceleration.
The shock wave propagation is characterized by comparing the propagation velocity to
the speed of sound in air. The ratio of propagation rate to speed of sound is called Mach
number.
Figure 4.4 shows typical pressure-time traces recorded for the pressure sensors.
The data is analyzed several ways. Using time-of-arrival analysis, pressure wave position
and velocity vs. distance and time can be determined. Peak pressure vs. distance is
analyzed to compare attenuation rate of materials. Position is plotted vs. time and then
Figure 4.3. Pressure-distance characterization tube.
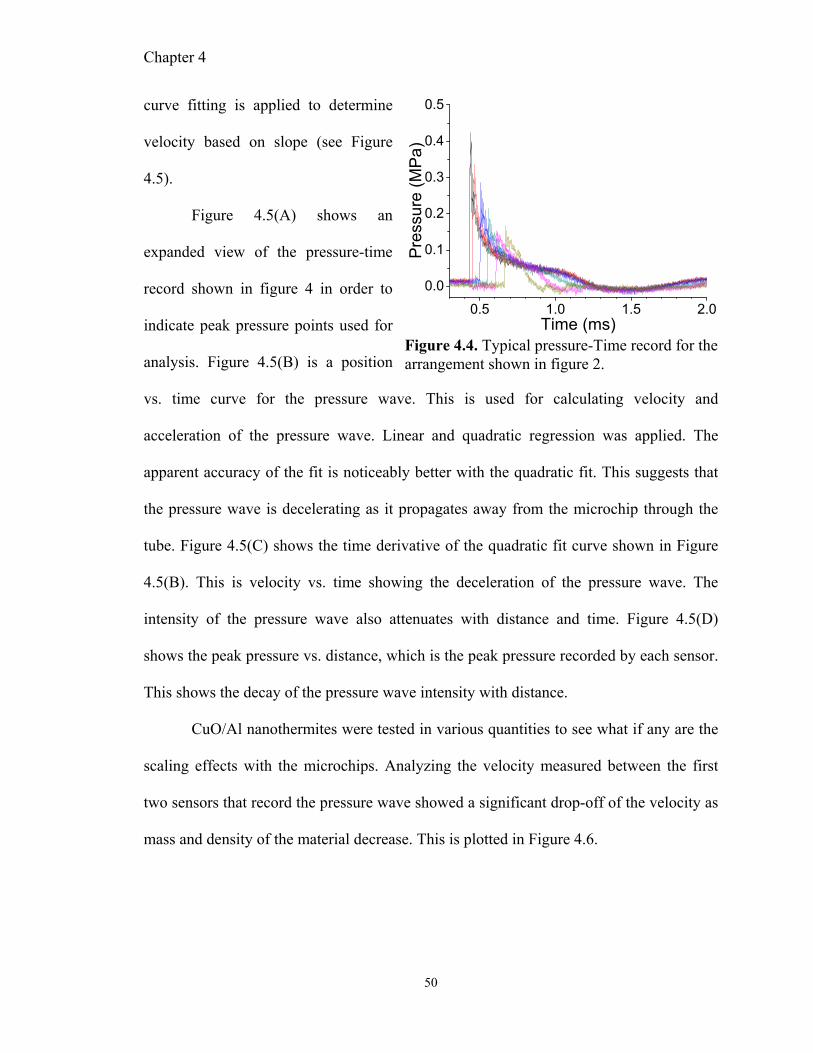
Chapter 4
50
curve fitting is applied to determine
velocity based on slope (see Figure
4.5).
Figure 4.5(A) shows an
expanded view of the pressure-time
record shown in figure 4 in order to
indicate peak pressure points used for
analysis. Figure 4.5(B) is a position
vs. time curve for the pressure wave. This is used for calculating velocity and
acceleration of the pressure wave. Linear and quadratic regression was applied. The
apparent accuracy of the fit is noticeably better with the quadratic fit. This suggests that
the pressure wave is decelerating as it propagates away from the microchip through the
tube. Figure 4.5(C) shows the time derivative of the quadratic fit curve shown in Figure
4.5(B). This is velocity vs. time showing the deceleration of the pressure wave. The
intensity of the pressure wave also attenuates with distance and time. Figure 4.5(D)
shows the peak pressure vs. distance, which is the peak pressure recorded by each sensor.
This shows the decay of the pressure wave intensity with distance.
CuO/Al nanothermites were tested in various quantities to see what if any are the
scaling effects with the microchips. Analyzing the velocity measured between the first
two sensors that record the pressure wave showed a significant drop-off of the velocity as
mass and density of the material decrease. This is plotted in Figure 4.6.
0.5 1.0 1.5 2.0
0.0
0.1
0.2
0.3
0.4
0.5
Pre
ssur
e (M
Pa)
Time (ms)Figure 4.4. Typical pressure-Time record for thearrangement shown in figure 2.
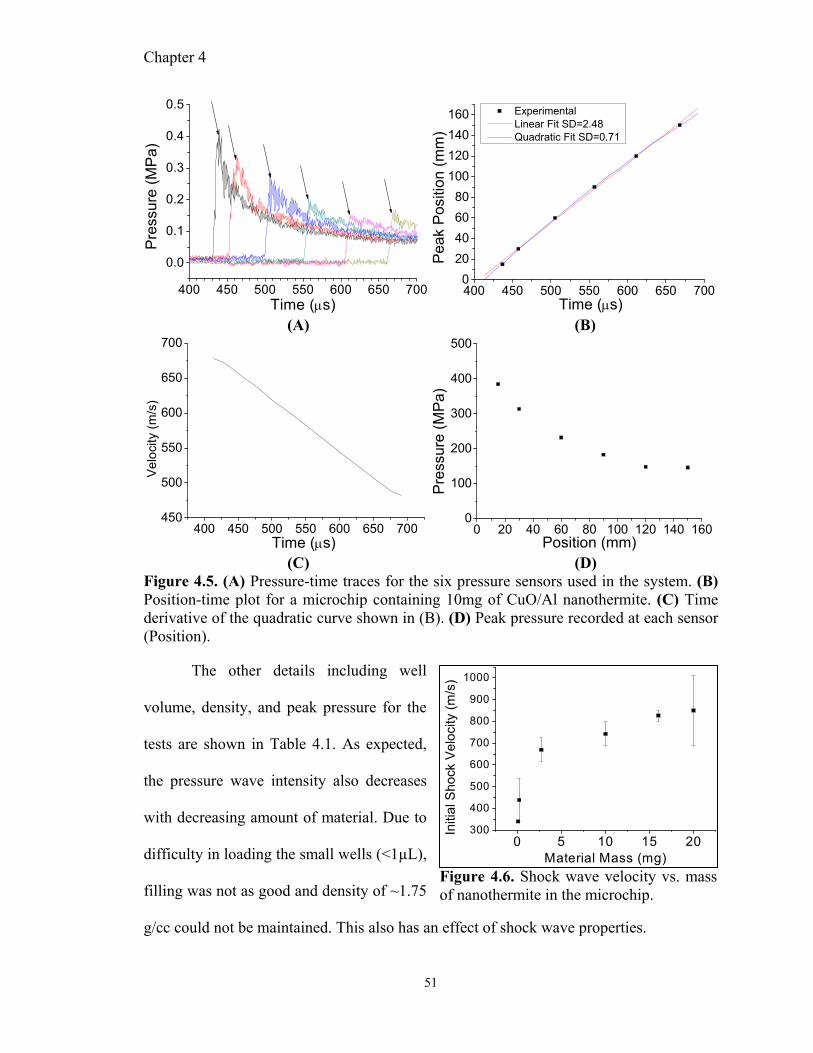
Chapter 4
51
400 450 500 550 600 650 700
0.0
0.1
0.2
0.3
0.4
0.5
Pre
ssur
e (M
Pa)
Time (μs)400 450 500 550 600 650 7000
20406080
100120140160
Time (μs)
Pea
k P
ositi
on (m
m)
Experimental Linear Fit SD=2.48 Quadratic Fit SD=0.71
(A) (B)
400 450 500 550 600 650 700450
500
550
600
650
700
Velo
city
(m/s
)
Time (μs) 0 20 40 60 80 100 120 140 160
0
100
200
300
400
500
Pre
ssur
e (M
Pa)
Position (mm) (C) (D)
Figure 4.5. (A) Pressure-time traces for the six pressure sensors used in the system. (B) Position-time plot for a microchip containing 10mg of CuO/Al nanothermite. (C) Time derivative of the quadratic curve shown in (B). (D) Peak pressure recorded at each sensor (Position).
The other details including well
volume, density, and peak pressure for the
tests are shown in Table 4.1. As expected,
the pressure wave intensity also decreases
with decreasing amount of material. Due to
difficulty in loading the small wells (<1µL),
filling was not as good and density of ~1.75
g/cc could not be maintained. This also has an effect of shock wave properties.
0 5 10 15 20300
400
500
600
700
800
900
1000
Initi
al S
hock
Vel
ocity
(m/s
)
Material Mass (mg)Figure 4.6. Shock wave velocity vs. mass of nanothermite in the microchip.

Chapter 4
52
Table 4.1. Summary of peak pressure and shock wave velocity of various quantities of CuO/Al nanothermite. Well Volume (µL)
Material Mass (mg)
Density (g/cc)
Pressure-Wave Velocity (m/s)
Pressure-Wave Intensity (kPa)
0.125 ~0.07 ~0.56 ~341 ~5 0.343 ~0.2 ~0.87 439±100 37±11 2.7 2.7 1.72 670±56 350±9 5.96 10.8 1.81 741±55 440±7 9.24 16.6 1.80 827±25 390±34 13.35 20.5 1.54 850±161 380±48
4.6 Modification of the Device for Biological Testing
Before applying the shock waves produced by the microchip, a system was
developed to allow the shock waves produced from the microchips to be applied to the
cells without exposing the cells to the nanothermite reaction products. A schematic of the
system is shown in Figure 4.7. The feature of the system that allows the reaction products
to be filtered from the blast wave is a tube filled with gelatin (20%, 300 Bloom) through
which the blast wave propagates. The shock wave is transmitted from the microchip
source through the gel in the tube to the
target medium, which would be a tissue
sample or an aqueous solution containing
cells. The gel catches the nanothermite
reaction products that come behind the
shock wave preventing them from pushing
through to the target cells or tissues.
The gelatin was chosen to match
the acoustic impedance of the target
medium (aqueous solution) to minimize Figure 4.7. Modified system for filtering thereaction products out of the blast wave.

Chapter 4
53
reflections at the interface. According to one-dimensional acoustic theory, the
transmission coefficient at a water-gelatin interface is ~99% for 20% gelatin
concentration [17]. Additionally, in certain circumstances in which the gel in the tube
could not contain the reaction products, a thin polydimethyl siloxane (PDMS) membrane
(~1mm) was bonded over the well after filling with the nanothermite material.
Additionally, a target vessel was designed to hold the cells/tissues in suspension, and to
allow the shock wave(s) transmitted from the end of the tube to enter the target medium
and hit the cells.
The blast waves (shock wave and expansion wave) generated by the nanothermite
microchips were characterized to understand how the system components (gel-tube,
PDMS membrane, and target vessel) affect the pressure impulse characteristics. The
system used for characterizing the pressure waves is shown in Figure 4.8(A). The test
vessel was a 4"x4"x3.5" polycarbonate box. It had a pressure transducer mounted on the
bottom surface for pressure measurements of the internal medium. The pressure
transducer, PCB-134A02 (PCB Piezotronics), has a tourmaline sensing element with a
diameter of ~3mm. It has a measurement range of up to 137.9 MPa, with resonance
frequency of 1.5 MHz, and a minimum rise time of <200 ns. Reverse-osmosis (RO)
water is used as a medium for pressure impulse characterization. The shock wave
microchip was suspended up-side-down above the box using optics mounting posts. This
fixture and the polycarbonate box were mounted on an aluminum optics breadboard. All
experimental conditions were tested five times to obtain averages and standard
deviations.

Chapter 4
54
The pressure generated by the device was measured in the configurations shown
in Figure 4.8 (B-D). First, the blast wave generated from the microchip was measured by
adjusting the distance between the microchip and pressure transducer (Figure 4.8(B)).
Then the effect of the PDMS membrane and gelatin-filled tube was analyzed by
measuring the output when those components are added to the device (Figure 4.8(C)).
Then the configuration shown in Figure 4.8(D) was used to measure the effect of
different sizes of the target cell vessel used for in vitro transfection tests.
Figure 4.9 shows results of the pressure measurements. The profiles shown in
Figure 4.9(A) are pressure profiles for the microchip placed at different distances from
Figure 4.8. Characterization arrangements for measuring the pressure-generatingcharacteristics of the system. (A) Test bench for shock wave characterization. (B) Theconfiguration for measurements of pressure wave production directly from the microchipin an open system. (C) Measurement configuration with the transmission tube in an opensystem. (D) Measurement configuration for closed target characterization.
(A)
(B)
pressure sensor
Water
Config. 1
Air
tube
(C)
Config. 2
microchip nanothermite
(D)
Config. 3

Chapter 4
55
the sensor. The sub-plot is pressure-distance relationships for CuO/Al and Bi2O3/Al
nanothermites. These are the normal pressure-distance trends for super-sonic blast waves
[18]. This is also pressure levels much lower than that for silver azide in the same
condition [19].
0 100 200 300 400 5000
1
2
3
4
Pre
ssur
e (M
Pa)
Time (μs)
35mm 18mm 10mm
10 20 30 40 50600.1
1
10
100 1.4mg (CuO/Al) 3mg (Bi2O3/Al) 10mg (AgN3)*
Pre
ssur
e (M
Pa)
Distance (mm)
0 200 400 600 800 1000
0.0
0.2
0.4
0.6
0.8
1.0
60 80 100 120-0.10.00.10.20.30.4
Open chip Chip with tube
Pres
sure
(MP
a)Time (μs)
(A) (B)
0.05 0.10 0.15 0.20 0.25 0.30-0.5
0.0
0.5
1.0
1.5
2.0
2.5
3.0
3.5
53mm
23mm
19mm
14mm
Pre
ssur
e (M
Pa)
Time (ms)
11mm
0.04 0.06 0.08
0.0
0.6
1.2
10 20 30 40 500
1
2
3
4
5
6
Pea
k P
ress
ure
(MP
a)
Dish Diameter (mm)
Shock Wave Broad Pulse
0
100
200
300
400
500
600
Total Impulse
Tot
al Im
puls
e (P
a-s)
(C) (D) Figure 4.9. Pressure wave characterization results for microchips containing 3mg of Bi2O3/Al nanothermites. (A) Pressure vs. distance using the configuration shown in Figure 4.8(B). (B) Comparison of the pressure wave for the open microchip, and the microchip with a PDMS membrane and gel-filled tube. (C) Pressure profiles measured for varying the diameter of the dish from 9mm to 53mm. (D) Peak pressure of the high-frequency (shock) component and the broad pulse component vs. dish diameter. Total impulse vs. dish diameter is also shown.
The profiles shown in Figure 4.9(B) are a comparison of the open microchip and
the microchip with the PDMS membrane and the gelatin-filled tube attached. The effect
of the PDMS membrane and gel-filled tube is the removal of the tailing end of the

Chapter 4
56
pressure wave, which is the expansion wave created by the reaction products and other
gases heated by the reaction. This travels behind the shock front in the blast wave. There
appears to be a small compression wave in front of the shock wave. This may be caused
by the finite propagation time of the reaction in the nanothermite, leading to
asymmetrical expansion of the shock wave [20]. Also, the second pulse seen in the
condition with the PDMS and gel-tube is a shock wave created by a cavitation bubble
present in the gel that protrudes from the end of the tube. The cavitation bubble is formed
by the vacuum created by the negative pressure cycle behind the shock front. The
cavitation bubble collapse could be observed in the high-speed video and was perfectly
synchronized with the second pulse.
The plot in Figure 4.9(C) is the profiles for varying dish diameters and the open
system. All the profiles contain the high-frequency shock wave component, observed in
open systems. However, as the dish size decreases, the second shock wave from the
cavitation bubble is no longer observed. Additionally, a broad pressure pulse is created
that is >100µsec in duration. For small dish diameters, the broad pulse becomes the
dominant energy that is seen by the sensor. The plot in Figure 4.9(D) is the peak intensity
of the shock wave component, broad pulse intensity, and total impulse vs. dish diameter.
There does not appear to be any correlation between the peak pressure value of the shock
pulse and the dish diameter, but the broad pulse clearly gets larger as the dish size
decreases. This system effect suggests that the shock component is truly supersonic, and
the broad pulse is likely a sub-sonic. The total impulse also varies consistently with the
diameter of the dish.

Chapter 4
57
Analysis of the high speed video may help explain the cause of the broad pressure
pulses in the smaller dishes. As shown in Figure 4.10, some of the gelatin in the tube
protrudes out of the end and into the target dish. In test configuration 3 (Figure 4.8(D)),
the volume filled with water in which pressure is measured is partially confined when the
gel-filled tube is inserted on the seating plate. This constricts the release of pressure.
Therefore, when the gelatin protrudes out of the tube, it compresses the target volume.
This is a sub-sonic pulse that is driven by the expansion of the nanothermite
reaction products against the other end of the tube. Another effect of the closed vessel is
that no secondary cavitation event occurs from bubble collapse. The cavitation bubble
cannot form in the closed vessel because the fluid in the vessel has no room for
displacement to allow the bubble to expand. Therefore, there is no second shock wave
seen in the closed vessel as there is in the open vessel.
4.7 Particle Delivery/Transfection Testing
An in vitro test system was fabricated. In the interest of maximizing total impulse,
the compressive effect of the gelatin was enhanced by fabricating the structure in
stainless steel instead of polycarbonate. This reduced the amount of force absorbed by the
vessel walls and enhanced the pressure in the medium.
Figure 4.10. High-speed video images of gel protruding from the end of the tube into thetarget vessel. The camera was imaging the inside of the cylindrical dish. The pressuregenerator was above the field of view with the gel-filled tube directed downward. Thegelatin can be observed to be moving in and out of the dish.

Chapter 4
58
The target vessel that contains the aqueous
medium is made from stainless steel, and a pressure
transducer is flush-mounted at the bottom (Figure 4.11).
For biological testing, the target vessel is filled with the
appropriate cell suspension solutions as well as the
cells/tissues and materials to be delivered (plasmids,
fluorophores, or nanoparticles).
In order to tune the pressure pulse in the device
shown in Figure 4.11, the nanothermite formulation was
modified using different fuel-oxidizer combinations, adding nano-particles of ammonium
nitrate, or adding polymer binders (as illustrated in Figure 4.3 and Table 4.2).
Additionally, the quantity of nanothermite was varied to control the overall power of the
pressure pulse.
Table 4.2. Pressure impulse properties for different types and quantities of nanothermite materials. Material Quantity
(mg) Peak Pressure (MPa)
Duration (FWHM) (µs)
Rising Slope (MPa/µs)
Total Impulse (Pa-s)
CuO/Al 1.6±0.3 8.5±0.13 51.3±2.3 1.2±0.4 392±35 CuO/Al 12.9±0.4 20.5±0.8 48.6±1.2 1.5±0.2 878±17 CuO/Al/5% NC 1.5±0.4 11.0±0.4 51.9±2.3 0.89±0.24 491±56 CuO/Al/10% NC 1.4±0.3 10.4±2.7 48.8±3.7 0.62±0.15 477±137 Bi2O3/Al 1.9±0.1 7.6±1.4 52.7±6.4 1.5±0.4 351±46 Bi2O3/Al 8.0±0.4 13.6±2.2 50.0±2.1 1.2±0.4 618±116 Bi2O3/Al 16.0±0.5 22.5±1.8 55.7±1.6 1.2±0.2 1174±105 Bi2O3/Al 27.0±0.4 28.8±2.6 55.3±1.5 1.4±0.2 1619±162 Bi2O3/Al/30%AN 13.0±0.3 37.4±3.2 41.2±2.2 5.8±0.8 1274±70
To test the effectiveness of the system for delivering materials into cells, plasmid
containing the information to express EGFP (enhanced green fluorescent protein) or RFP
(red fluorescent protein) under the control of CMV (Human cytomegalovirus immediate
Figure 4.11. Steel vessel fabricated for particle delivery experiments.

Chapter 4
59
early gene) promoter (CMV-EGFP plasmid) was used. This plasmid, when properly
inserted and expressed into cells, carries the production of EGFP or RFP making the cells
easily distinguishable by turning them fluorescent green (EGFP) or red (RFP). To prevent
any degradation of plasmid by DNAses present in serums used in cell/tissue culture
media, tests were performed in the presence of serum-free media. After the transfection
procedure the cells/tissues were incubated in culture media including their corresponding
serum type.
Transfection of naked plasmids into primary cells (embryonic chicken heart cells)
and cell lines like T47-D (Breast cancer cell) were tested, and the results were compared
with the literature and other chemical and physical transfection methods Several different
liposomal agents such as siPNF(siPortNeoFx, Ambion, Inc ), siPAM (siPortAmine,
Ambion, Inc ), lipofectamine 2000 (Invitrogen, US), lipofectamine LTX (Invitrogen,
US), T-LT1 (Mirus, US), Fugene (Roche) were used for chemical transfection tests.
To evaluate the number of dead or dying cells in all the cells and tissues tested,
before and after transfection the vital dye - Trypan Blue (this chromopore does not
interact with the cell unless the membrane is damaged; therefore, all the cells which
exclude the dye are viable), Orange Nucleic Acid Stain (SYTOX-is a high affinity
nucleic acid stain that easily penetrates cells with compromised plasma membranes),
Hoechst 33258 (which stains the condensed chromatin of apoptotic cells brighter than the
chromatin of normal cells), and YO-PRO-1 (which passes through the plasma membrane
of both apoptotic and necrotic cells) were used.

Chapter 4
60
4.7.1 Embryonic Cardiomyocyte Transfection
Primary cells, in particular cardiomyocyte are well known to be difficult to
transfect with diverse non-viral methods/materials [21-23]. In general transfection of
chick cardiomyocyte with different non-viral transfection methods induces limited
transfection efficiency with very large mortality. In a recent study using rat neonatal
cardiomyocytes, the best transfection rate of 8.1% was obtained with lipofectamine 2000
reagent [21]. In the same study, it was shown that the use of adeno-associated viral vector
(AAV) produced highly efficient transfection of 88.1%. [21]. However, reports of
successful transfection of embryonic cardiomyocytes in the literature are infrequent.
After ~22 hrs in post-transfection culture media, it was found that the system
induced large transfection of ~ 99% (Figure 4.12) at all the embryonic stages of
development (St 12-34). All cell viability tests show that the system produced very high
survivability rates (greater than 99%) of the cardiac cells (Figure 4.12), without any
obvious morphological and/or functional alteration. This is superior to results obtained
with other methods. Although these analyses were performed 24 hrs after transfection, a
few specimens were stored and viable healthy cells were observed a month after
transfection.
4.7.2 Transfection of T47-D Cell Line
To test transfection of other cell types, T47-D (breast cancer) cell line was chosen
as a model. T47-D cells are widely used in many experiments for transfection with
widely available publications on transfection efficiency and survivability [24, 25]. A
transfection protocol used in this case is similar to that of cardiomyocytes. It was found
that the system has modest transfection efficiency, compared with the other systems.

Chapter 4
61
Figure 4.12. (A) Transfection efficiency and cell survival with different materialson chicken cardiomyocyte St 25. Cell suspension of single cardiomyocytes wastransfected with eGFP plasmid with different systems. (SiPNF = SiPortNeoFx,SiPAm = SiPortAmine, Lip-2000 = Lipofectamine 2000, Lip-LTX =Lipofectamine LTX, T-LT1-Transit LT1, Electro = Electroporation, SW = Shockwave). (B) Transmitted image and (C) Fluorescent pictures of cells showingEGFP. Pressure wave properties: Peak Pressure = 23.8 MPa, Total Impulse =1,258 Pa-s.
A B
C
Figure 4.13. (A) Transfection efficiency and cell survival on T47-D. Cellsuspension of T47-D (1E4) was transfected with eGFP plasmid with differentsystems and incubated up to 48 hrs. (SiPNF=SiPortNeoFx, SiPAm=SiPortAmine,Lip-2000=Lipofectamine 2000, Lip-LTX=Lipofectamine LTX, T-LT1-TransitLT1, Electro=Electroporation, SW=Shock wave). (B) Transmitted image and (C)Fluorescent pictures of cells showing EGFP. Pressure wave properties: PeakPressure = 7.5 MPa, Total Impulse = 390 Pa-s.

Chapter 4
62
More importantly however, the system showed the highest survival rate compared to
other systems (see Figure 4.13).
4.7.3 Variable Delivery of Dextran in T47-D
The relatively lower cell transfection efficiency in T47-D cells compared to
chicken cardiomyocytes may be attributed to differences in cell properties such as cell
membrane stiffness, cell cycle etc. One way to improve cell transfection in cells like T47-
D is by increasing the total impulse. To this end, tests were performed to see the effect of
varying the nanothermite quantity on the particle delivery (i.e. percent of delivered cells,
brightness of each cell and cell viability). The experiment tested delivery of Dextran
(Fluorescein isothiocyate-dextran average MW 59-77 kDa) into T47-D cell line with
different quantities of Bi2O3/Al nanothermite material.
ImageJ software was used to determine gray-scale intensity of the cells. For each
tested culture, four images were captured on different areas of the plated cells, and 25
individual cells were counted from each image. Additionally, a control sample of cells
(not treated with the system) was analyzed to compare autofluorescence of normal cells
with the fluorescence of transfected cells.
Figure 4.14 shows images of the cells from a few tests. Figure 4.14(A) is an
image of normal T47-D cells with DAPI staining. This shows the difference between the
nucleus and cytoplasm of the cells. The nuclei are the bright blue ovals. The cytoplasm of
the cells is the darker fringe around the cluster of nuclei. Figure 4.14(B-D) shows
fluorescence images of cells having Dextran delivered. What is noticeable comparing
Figures 4.14(B-D) is that the cytoplasm and nuclei get brighter with more intense impulse
applied. The cells having the lowest pressure applied (Figure 4.14(B)) do not have very
bright nuclei or cytoplasm indicating a low concentration of Dextran delivered. The cells

Chapter 4
63
from the test with 13.5MPa (Figure 4.14(C)) have significantly brighter cytoplasm, and
somewhat brighter nuclei. The cells from the test with 20MPa (Figure 4.14(D)) have very
bright nuclei and cytoplasm indicating high concentration of Dextran in both regions.
Figure 4.15(A) shows the pressure-time trace of various Bi2O3/Al quantities
measured in the transfection vessel. Figure 4.15(B) shows total impulse vs. peak pressure.
The total impulse is the numerical integration of the entire pressure pulse. There appears
to be an approximately linear relationship between peak pressure and total impulse.
A plot of the average fluorescence intensity of the cells vs. the peak impulse
pressure is shown in Figure 4.15(C). The cell brightness was taken inside the nucleus.
The horizontal line in the plot indicates the autofluorescence level. The data points with
red circles correspond to the images in Figure 4.14.
There does seem to be a direct correlation between peak pressure (nanothermite
mass) and the average cell intensity. Additionally, since there is an approximately linear
relationship between peak pressure and total impulse, it may not be concluded whether
the peak pressure or total impulse has a larger role on the amount of material delivered.
Figure 4.14. Images of T47-D cells (A) with DAPI staining of the nucleus, (B) with Dextran delivered by 9MPa pulse, (C) Dextran delivered with 13.5MPa pulse, and (D) Dextran delivered by a 20MPa pulse. Color was added to the original gray-scale images to represent the actual colors of the DAPI (blue) and Dextran (orange). This was only done for the present illustration, not during actual analysis.
(A) (B) (C) (D)

Chapter 4
64
What is seen in Figure 4.15(A) is primarily the broad-pulse caused by gel protrusion from
the tube. The shock wave component is difficult to discern. However, it is reasonable to
assume that a chip with larger quantity of nanothermite will not only increase the broad
pulse intensity, it will increase the shock wave intensity as well. Therefore, the shock
wave intensity and total impulse of the shock wave component are also parameters that
may be important to particle delivery. It can be said that a larger number of Dextran
particles can be delivered into the cells by using a larger quantity of nanoenergetic
materials to generate the shock wave.
The fact that a more powerful impulse (with larger quantity of nanothermite
material) delivered a larger number of Dextran particles into the cells could explain low
transfection seen in T47-D. In order to get GFP expression, at least one copy of the
Figure 4.15. (A) Pressure profiles of various quantities of Bi2O3/Al nanothermite. (B) Plot of total impulse vs. peak pressure for a series of tests. (C) Relationship between peak pressure and the amount of Dextran delivered into T47-D cells. Image analysis was used to determine average cytosol brightness from microscope images.
(A) (B)
0 20 40 60 80 100 1200
10
20
30
40 Bi2O3/Al (1.9mg) Bi2O3/Al (7.9mg) Bi2O3/Al (15.8mg) Bi2O3/Al (27.1mg)
Pre
ssur
e (M
Pa)
Time (μsec)5 10 15 20 25 30 35
0.2
0.4
0.6
0.8
1.0
1.2
1.4
1.6
1.8
2.0 Total Impulse Linear Fit (R2=0.987)
Tota
l Im
puls
e (k
Pa-
s)
Peak Pressure (MPa)
(C)
5 10 15 200.0
5.0k
10.0k
15.0k
20.0k
25.0k
30.0k
35.0k Experimental Data Linear Fit (R2=0.9861)
Cel
l Brig
htne
ss (C
ount
s)
Peak Pressure (MPa)

Chapter 4
65
plasmid must be delivered to the cell nucleus. Therefore, with weaker impulses, not as
many cells may get plasmid delivered to their nuclei.
4.7.4 Transfection of Whole Tissues
To further evaluate the efficiency of the system, transfection of several tissues
including chick spinal cord, arteries, and dorsal root ganglion (DRG) was tested in vitro.
The spinal cord was chosen because of its fragile nature in order to test whether the
pressure waves produce any damage to the tissue, and the deepness of the cells
transfected. The arteries and DRGs were selected because they are notoriously difficult to
transfect. Fluorescence images of transfected tissues are shown in Figure 4.16. It was
found that, similar to the single cell transfection, cells in the semi intact tissues were
efficiently transfected in vitro with minimal apparent damage. Fluorescent microscope
images of the tissues are shown in Figure 4.16.
4.8 Discussion & Future Work
Since each shock wave source generates a different shock waveform it is not clear
which shock wave parameters are precisely important for delivery of drugs. In this case,
by use of nanothermites, better tunability of pressure pulses (rise time, peak pressure and
impulse) has been achieved. There are two distinguishable components of the pressure
pulse, the fast rising component due to the shock and a broad pulse following the shock.
A C D B
Figure 4.16. Chicken tissues transfected with eGFP using the pressure wave system. (A)Chick spinal cord (Pressure = 11.6MPa, Impulse = 546Pa-s), (B) Artery (Pressure =10.3MPa, Impulse = 455Pa-s), (C) Dorsal root ganglion (Pressure = 20.5MPa, Impulse =1010Pa-s), (D) Slice of chick dorsal root ganglion.

Chapter 4
66
This second component occurs when the target medium undergoes uniform compression
from the gelatin protruding into the target vessel. It is hypothesized that both components
of the pressure pulse are important, the first component contributing in cell
permeabilization, and the second component, integrated effect of broad pulse over time,
effecting delivery of materials into cells.
Future work will be performed to understand these effects more precisely. The
system should be re-designed to allow the two components of the impulse to be generated
independently. This will allow comparisons of pressure profile and particle delivery with
just a shock wave, just the broad pulse, and both shock wave and broad pulse.
4.9 Conclusion
It has been demonstrated that fast-reacting nanothermites can be used to generate
shock waves for particle delivery and cell transfection. The ability to tune the impulse
generated by the device allows the transfection to be optimized for different types of cells
and tissues. This is the only known transfection system that uses energetic material to
produce shock waves for cell permeabilization. Transfection rates available in the
existing literature vary widely. In many cases, the nanothermite-based device produces
significantly better transfection efficiency, although in a few cases, some other systems
exhibit better transfection rates. The present system out-performs other systems by
exhibiting a far superior survival rate though. Since this system does not damage
permeabilized cells/tissue, there remains space for improvement of transfection rate.
The present results look very encouraging. Further work is required to understand
the effects of the chip design on the impulse produced, and how the characteristics of the
impulses affect the transfection rate.
Chapter 4
67
4.10 References
1. Jagadeesh, G. and K. Takayama, Novel Applications of Micro-shock Waves in Biological Sciences. J. Indian Inst. Sci., 2002. 82(1): p. 49-57.
2. Kato, K., et al., Pressure-dependent effect of shock waves on rat brain: induction of neuronal apoptosis mediated by a caspase-dependent pathway. J Neurosurg, 2007. 106(4): p. 667-76.
3. Wilbert, D.M., A comparative review of extracorporeal shock wave generation. BJU Int, 2002. 90(5): p. 507-11.
4. Yao, C.-P., et al., Laser-Based Gene Transfection and Gene Therapy. IEEE TRANSACTIONS ON NANOBIOSCIENCE, 2008. 7(2): p. 111-119.
5. Kodama, T., A.G. Doukas, and M.R. Hamblin, Delivery of ribosome-inactivating protein toxin into cancer cells with shock waves. Cancer Lett, 2003. 189(1): p. 69-75.
6. Apperson, S., et al., Characterization of Nanothermite Material for Solid-Fuel Microthruster Applications. Journal of Propulsion and Power, 2009. 25(5): p. 1086-1091.
7. Apperson, S., et al. On-Chip Initiation and burn rate measurements of thermite energetic reactions. in Mater. Res. soc. Symp. Proc. 2006.
8. Apperson, S., et al., Generation of fast propagating combustion and shock waves with copper oxide/aluminum nanothermite composites. Applied Physics Letters, 2007. 1.
9. Bhattacharya, S., et al., A Novel on-chip diagnostic method to measure burn rates of energetic materials. J. Energ. Mater, 2006. 24: p. 1-15.
10. Shende, R., et al., Nanostructured Energetic Materials, Session M. 25th Army Science Conference, Orlando, Fl., 2006.
11. Shende, R., et al., Nanoenergetic Composites of CuO Nanorods, Nanowires, and Al-Nanoparticles. Propellants, Explosives, Pyrotechnics, 2006.
12. Subramanian, S., et al., Self-assembled nanoenergetic composite. Mater. Res. Soc. Symp. Proc., 2006: p. 5.1-5.6.
13. Thiruvengadathan, R., et al., Combustion Behavior of Nanoenergetic Material Systems, in Energetic Materials: Thermophysical Properties, Predictions, and Experimental Measurements, V. Boddu and P. Redner, Editors. 2010, CRC Press.
14. Kodama, T., M.R. Hamblin, and A.G. Doukas, Cytoplasmic molecular delivery with shock waves: importance of impulse. Biophys J, 2000. 79(4): p. 1821-32.

Chapter 4
68
15. Gangopadhyay, S., et al., On-Chip Igniter and Method of Manufacture. 2007.
16. Mitra, A., et al., Nanocarriers for nuclear imaging and radiotherapy of cancer. Curr Pharm Des, 2006. 12(36): p. 4729-49.
17. Kodama, T. and Y. Tomita, Cavitation bubble behavior and bubble-shock wave interaction near a gelatin surface as a study of in vivo bubble dynamics. Applied Physics B: Lasers and Optics, 2000. 70(1): p. 139-149.
18. Kleine, H., et al., Studies of the TNT equivalence of silver azide charges. Shock Waves, 2003. 13(2): p. 123-138.
19. Saito, T., et al., Experimental and numerical studies of underwater shock wave attenuation. Shock Waves, 2003. 13(2): p. 139-148.
20. Hosseini, S.H.R., Y. Kohno, and K. Takayama, Micro-explosives Induced Underwater Shock Waves for Biological Applications. Sci. Tech. Energetic Materials, 2005. 66(6): p. 411-415.
21. Djurovic, S., et al., Comparison of nonviral transfection and adeno-associated viral transduction on cardiomyocytes. Mol Biotechnol, 2004. 28(1): p. 21-32.
22. Muramatsu, T., et al., Comparison of three nonviral transfection methods for foreign gene expression in early chicken embryos in ovo. Biochem Biophys Res Commun, 1997. 230(2): p. 376-80.
23. Kott, M., et al., A new efficient method for transfection of neonatal cardiomyocytes using histone H1 in combination with DOSPER liposomal transfection reagent. Somat Cell Mol Genet, 1998. 24(4): p. 257-61.
24. Arrick, B.A., R.L. Grendell, and L.A. Griffin, Enhanced translational efficiency of a novel transforming growth factor beta 3 mRNA in human breast cancer cells. Mol Cell Biol, 1994. 14(1): p. 619-28.
25. Cullen, K.J., et al., Insulin-like growth factor expression in breast cancer epithelium and stroma. Breast Cancer Res Treat, 1992. 22(1): p. 21-9.

Chapter 5
69
Chapter 5
Characterization of Nanothermite Material for Solid Fuel Microthruster Applications
5.1 Abstract
Nanothermite composites containing metallic fuel and inorganic oxidizer have
unique combustion properties that make them potentially useful for microthruster
applications. The thrust-generating characteristics of copper oxide/aluminum
nanothermites have been investigated. The mixture was tested in various quantities (9-38
mg) by pressing the material over a range of densities. The testing was done in two
different types of thrust motors: one with no nozzle, and one with a convergent-divergent
nozzle. As the packing density was varied, it was found that the material exhibits two
distinct impulse characteristics. At low packing pressure, the combustion was in the fast
regime, and the resulting thrust forces were ~75 N with duration < 50 µsec Full-width at
half-maximum (FWHM). At high density, the combustion was relatively slow and the
thrust forces were 3-5 N with duration 1.5-3 ms. In both regimes, the specific impulse
generated by the material was 20-25 sec. The specific impulse and short thrust duration
created by this unique nanothermite material makes it promising for micro-propulsion
applications, where space is limited.
5.2 Introduction
Recent research has demonstrated that microthrusters can be designed to reliably
create thrust impulses in the impulse range defined as microthrusters (~10 µN to 10 N
ranges) [1-7]. The fuels used in such systems include lead styphnate, glycidyl azide
polymer (GAP) composites, double-base/ black-powder (DB/BP) composites, BTATZ

Chapter 5
70
and DAATO3.5 [1-6]. A microthruster containing ~7mg of DB+30%BP produced a
measured thrust of 1 mN, a duration of 1.15 s, and total impulse of 1.13 mN-s [3].
Another recent work reported on a quartz thruster containing DAATO3.5 capable of
producing 100 mN of peak thrust over a duration of ~80 ms, and a total impulse of ~20
mN-s [1]. These propellants have combustion rates ranging from 5-100 mm/s. Another
set of work has demonstrated thrusters utilizing gun-powder based propellants that
produced up to 0.38N of peak thrust in a duration of ~0.4 ms [5].
Certain applications of solid-propellant microthrusters, such as course correction
of high-velocity projectiles or microsatellites, require that the actuation time be as short
as possible. For example, lateral guidance of spin-stabilized projectiles requires short
duration thrust to avoid rotation of the thrust vector as the projectile spins. Considering a
projectile rotating at >200 Hz, thrust duration of 0.4 ms would correspond to a projectile
rotation of ~29°. For such applications, the fuel should be chosen to have highest
possible combustion rate, thereby minimizing movement of the thrust vector. However,
the thrust fuel should not detonate leading to damage of the projectile.
The fast-reaction, but low pressure levels created by nanothermites makes them a
promising candidate for fast-impulse microthruster applications. In this chapter, the thrust
performance of a nanothermite composite (CuO nanorods & Al nanoparticles) in a simple
prototype thruster motor is presented. This composite was tested at a wide range of
packing densities in a motor without any nozzle, as well as a motor with a convergent-
divergent nozzle.

Chapter 5
71
5.3 Experimental
5.3.1 Nanothermite Preparation
The nanothermite composition consisted of CuO nanorods and Al nanoparticles.
The CuO nanorods were synthesized using the surfactant templating process described
elsewhere [8]. The aluminum nanoparticles were purchased from Novacentrix, with
average diameter 80 nm with average Al2O3 shell thickness of 2.2 nm. First, a slurry was
prepared by dispersing CuO nanorods in 2-propanol by sonication for 30 minutes. Then,
the aluminum nanoparticles were added to the slurry, and it was sonicated for 4 hours.
The sonication was carried out using a Cole-Parmer ultrasonic cleaning bath. After
mixing, the slurry was dried in an oven at 90° C until all the 2-propanol was removed.
The mixing ratio of the composite was 17:40 (Al:CuO) by weight. This ratio had been
previously optimized for maximum combustion rate [8]. The optimized equivalence ratio
will lead to the maximum conversion of the reactants into products.
5.3.2 Thruster Prototype Design
The thrust motors designed for testing the nanothermite was fabricated by boring
out stainless steel bolts. The inner diameter of the chamber was 1/16 in. (1.59 mm). Three
motors were fabricated with different chamber lengths (3.5 mm, 6 mm, and 8.5 mm). In
addition, one motor was fabricated with a convergent-divergent nozzle. A schematic of
Figure 5.1. (A) Motor design without nozzle. (B) Motor design with convergent-divergent nozzle. All dimensions are in mm.

Chapter 5
72
the motor designs is shown in Figure 5.1.
The fabrication was carried out using a precision lathe. The diameter of the
chambers was defined by the diameter of the drill-bit used for boring out the chambers.
The thruster with no nozzle was fabricated by drilling in a set depth from one side, and
then bottoming out the base of the chamber. The thruster with the convergent divergent
nozzle was fabricated by boring in from both sides. The chamber was bored out from one
direction (from the left as oriented in Figure 5.1(B)) using a drill bit with a 60° taper.
Then the divergence of the nozzle was created by drilling in from the other direction
(from the right as oriented in Figure 5.1(B)) using a drill-bit with a 30° taper. The depth
of drilling from each side was controlled using the calibrated hand-wheels on the
carriage. This fabrication method resulted in the chamber being open at the base. This
was sealed shut using a threaded plug coated with epoxy.
The motors were loaded using a hydraulic press. This allowed precise loading
with a desired packing pressure. The material was loaded incrementally in 2-3 mg
iterations (estimated from total loaded mass and number of loading iterations) and
pressed each time. This ensured uniform pressing and therefore uniform density of the
fully loaded composite. The material was loaded until the chamber was completely filled;
therefore, at higher pressure, more material was loaded into the chamber. Seven different
packing pressures were tested from 1.26 MPa (~183 psi) up to 630 MPa (~91,000 psi)
using the motor with 3.5 mm length chamber and no nozzle. The resulting percentage of
theoretical maximum density (%TMD) for this range of pressures was 28.0% to 64.9%.
The %TMD is based on a calculated TMD of 5.36 g/cc for the present CuO/Al
nanothermite mixture.

Chapter 5
73
In addition to comparing the effect of different packing densities, the three
different lengths of chamber were tested, and the motor with a convergent-divergent
nozzle (Figure 5.1(B)) was compared to the motor with no nozzle. The motor with no
nozzle was loaded through the top, and the motor with the convergent-divergent nozzle
was loaded through the bottom, and then sealed using a plug as described above. All of
the different motors with and without the convergent-divergent nozzle were tested at both
high packing pressure (315 MPa) and low packing pressure (6.3 MPa). All the motors
were re-usable, because they were able to be re-loaded after each use. The motors were
weighted in between each test to verify that there was no loss in mass (erosion of the
thrust chamber or nozzle). Every experimental condition was tested four times to obtain
an average. A list of experiments performed and the variables is shown in Table 5.1.
Table 5.1. List of experimental conditions and variables tested. Packing Pressure (MPa) Chamber Length (mm) Nozzle Design
Variable (1.26-630) 3.5 No Nozzle 6.30 Variable (3.5, 6.0, 8.5) No Nozzle
315.00 Variable (3.5, 6.0, 8.5) No Nozzle 6.30 6.0 Convergent-Divergent
315.00 6.0 Convergent-Divergent
5.3.3 Thruster Test Stand
A schematic of the test stand is shown in Figure 5.2. The thrust motor was
mounted vertically on a force sensor (Kistler Type 9222). The ignition was triggered
using a fuse-wire coated with the nanothermite composite. The fuse wire was not in
physical contact with the thrust motor, but it was within 2 mm to allow the reaction to
jump from the fuse-wire to the material in the motor. The exhaust plume was recorded
with a high-speed camera (Photron Fastcam SA-1.1). The resolution was 192×512, the
frame rate was 40,000 fps, and the shutter speed was 370 ns. The fuse-wire ignition, force

Chapter 5
74
sensor DAQ, and camera recording were triggered synchronously using a DC battery and
a push-button switch. The sensor (Kistler Type 9222) was plugged into a charge amplifier
(Kistler Type 5010B), and the amplifier output signal was sent to a National Instruments
Data Acquisition (DAQ) Board (PCI-6110).
Figure 5.2. Schematic of the thruster test stand.
5.4 Results and Discussion
5.4.1 Effect of Packing Density
The percentage of theoretical maximum density versus packing pressure is shown
in Figure 5.3(A). An approximately linear relationship between the Logarithm of packing
pressure and %TMD is expected for cold-pressing of powders [9]. Since the volume of
the chamber was constant in this series of tests, the mass of the nanothermite varied
directly with the packing density. The total impulse and mass, versus packing pressure
are shown in Figure 5.3(B). The total impulse varied similarly to the mass, which
indicates the thrust efficiency was almost constant.

Chapter 5
75
1 10 100 1k0
20
40
60
80
100
Experimental Linear Fit
%TM
D
Packing Pressure (MPa)1 10 100 1k
1
2
3
4
5
6
7
8
5
10
15
20
25 Total Impulse
Tota
l Im
puls
e (m
N-s
)
Packing Pressure (MPa)
Loaded Mass
Mas
s (m
g)
(A) (B) Figure 5.3. (A) Plot of nanothermite density vs. packing pressure. (B) Nanothermite mass and total impulse vs. packing pressure.
The thrust efficiency is measured by the specific impulse (ISP) defined by equation (1).
( )SP PI F dt W= ⋅∫ (1)
where, F is the measured thrust force, and WP is the propellant weight. There did not
appear to be any discernable correlation between the specific impulse and %TMD (Figure
5.4(A)). More interestingly however, when the pressing density was varied, two distinct
reaction regimes were observed. Figure 5.4(B) is a plot of the peak thrust and impulse
duration vs. packing pressure. It can be seen from Figure 5.4(B) that the peak thrust and
impulse duration change by more than 1 order of magnitude when the reaction crosses
from one regime to the other. At low densities (<44.4% TMD) the material had very fast
combustion speed, and the resulting thrust was less than ~50µsec in duration (FWHM)
with >40N peak thrust. At high pressure (>44.4% TMD) the material had very slow
combustion rate, and the resulting thrust force was much lower (4-5 N).

Chapter 5
76
25 30 35 40 45 50 55 60 65 700
10
20
30
40
50
Spe
cific
Impu
lse
(sec
)
% TMD25 30 35 40 45 50 55 60 65 70
10
100
Forc
e (N
)
% TMD
Peak Thrust (N)
0.1
1
Duration (FWHM) (ms)
Tim
e (m
s)
(A) (B)
0.5 1.0 1.5 2.0 2.5-10
010203040506070
Forc
e (N
)
Time (ms)
Density = 34.3% TMD Density = 44.4% TMD Density = 64.9% TMD
(C)
As the packing density was varied from 28.0% TMD to 64.9% TMD, the
transition between regimes was not gradual. At 44.4% TMD, the reaction regime
transition was observed. The event began slowly, and then almost instantaneously all the
remaining material reacted, producing a very large spike in thrust force. Figure 5.4(C)
shows example thrust pulses for each regime. This inverse relationship between packing
density and reaction propagation rate has been observed for various nanothermites in
other systems [9-12]. In particular, an abrupt combustion rate transition of more than an
order of magnitude has been observed when comparing pressed pellets of WO3/Al pellets
with loose powder [12].
Figure 5.4. (A) Plot of specific impulse vs. %TMD, and (B) plots of peak thrust and impulse duration vs. packing pressure. (C) Impulse profiles for 3 different packing pressures.

Chapter 5
77
The slow and fast reaction behaviors are also evident in the high-speed video
recorded during the experiments. In the slow regime, the high-speed video shows that the
material is ejected uniformly from the chamber. Figure 5.5(A) shows a sequence of
frames from one test performed with material pressed to a %TMD of ~56.0%, and Figure
5.5(B) shows the thrust profile for the same test. The exhaust plume in Figure 5.5(A) is a
homogenous plume during the duration of the thrust shown in Figure 5.5(B). This thrust
profile resembles a neutral burn, which is characteristic of an end-burning propellant
grain, in which burn rate, temperature, and pressure remain almost constant during
combustion [13].
Figure 5.5. (A) Video frames of exhaust plume from material pressed to 57.8% TMD (B) Force data for the same test. The red lines in the plot mark time stamps for the video frames in (A).
(A)
82.5 83.0 83.5 84.0
0
2
4
6
8
10
Forc
e (N
)
Time (ms)(B)

Chapter 5
78
On the other hand, in the fast regime, all the reaction products appear to be
ejected almost simultaneously. Figure 5.6(A) shows a sequence of frames for a test with
material pressed to 35.4% TMD. Figure 5.6(B) shows the force data corresponding to the
video in Figure 5.6(A). It appears that most of the material has burned and been ejected
by the fifth frame (74.7 ms). It is believed that the rapid ejection of material may be
caused by super-sonic combustion behavior. If the combustion front propagates at
supersonic velocity, then it would reach the bottom of the chamber before the material
could be ejected. Then it would reflect off the bottom of the chamber, and rapidly eject
the rest of the material as a single mass. The ejected material most likely does not travel
Figure 5.6. (A) Frame shots of exhaust plume from material pressed to 35.4% TMD. (B) Force data for the same test. The red lines in the plot mark the time stamp for the video frames in (A).
(A)
74.4 74.5 74.6 74.7 74.8 74.9
0
20
40
60
80
100
Forc
e (N
)
Time (ms)(B)

Chapter 5
79
at supersonic rates at the thruster exit plane, but the combustion front leads to the
collective ejection of the reaction products. These products are most likely in mixed-
phases of some solid, liquid, and vapor. The ejection of material by reflected wave-fronts
has been seen in combustion tubes when the ignition end is open, and the opposite end is
closed [14].
A possible explanation of two distinct reaction behaviors is that reaction
propagation is dominated by conductive energy transfer in the slow reaction regime, and
the reaction propagation is dominated by convective energy transfer in the fast regime
[12]. The density at which the transition occurs is related to the energetic material
properties such as particle size and type of fuel and oxidizer. Additionally, in a small-
scale system such as the present thruster, there will likely be external effects that
influence this transition density. For example, the diameter and wall material of the
chamber will affect energy losses, and hence probably affect the density at which
combustion regime transition occurs.
5.4.2 Effect of Motor Length
After discovering that there were two distinct regimes of behavior, the effect of
motor length was tested in each regime. The low density regime was tested at 34.3%
TMD and the high density regime was tested at 56.0% TMD. Figure 5.7(A) shows the
profile for each motor in the low density regime, and Figure 5.7(B) shows the profiles for
the high density regime. Each profile in Figure 5.7(A) and (B) is a point-by-point average
of profiles from four independent tests. The comparison in Figure 5.7 shows the expected
relationship when the length of the motor is increased. The duration of the thrust
increases almost linearly for each reaction regime. In the slow reaction regime (high

Chapter 5
80
%TMD), this indicates nearly constant reaction rate. In the fast reaction regime (low
%TMD), the relationship between motor length and thrust duration indicates that the
material may be getting ejected at a nearly constant rate. Thrust is produced during
momentum transfer (ejection of propellant). Therefore, in the low %TMD regime the
longer the motor, the longer it will take for the material to be ejected and thus the longer
the duration of thrust. The initial spike in the thrust profiles in Figure 5.7(B) is from the
reaction of the nanothermite coating on the fuse-wire.
1.0 1.1 1.2 1.3 1.4 1.5
0
20
40
60
80
100
Forc
e (N
)
Time (ms)
Motor Length (Energetics Mass) 3.5mm (~11.4mg) 6mm (~17.8mg) 8.5mm (~27.5mg)
0.0 0.5 1.0 1.5 2.0 2.5 3.0 3.5 4.0-2
0
2
4
6
8
10
Forc
e (N
)
Time (ms)
Motor Length (Energetics Mass) 3.5mm (~18.6mg) 6mm (~28.9mg) 8.5mm (~43.5mg)
(A) (B) Figure 5.7. (A) Thrust profiles for different motor lengths at 34.3% TMD. (B) Thrust profiles for different motor lengths at 56.0% TMD.
5.4.3 Nozzle Design Effect
The convergent divergent nozzle design shown in Figure 5.1(B) was tested for
comparison with the thruster without a nozzle. This was tested in both the fast regime (at
34.3% TMD), and the slow regime (at 56.0% TMD). The thrust profile for the
convergent-divergent nozzle compared with no nozzle in the fast regime is shown in
Figure 5.8(A). The nozzle comparison for the slow regime is shown in Figure 5.8(B).
It is apparent from the data in Figure 5.8(A) that the convergent-divergent nozzle
reduces the amplitude (from ~65 N to ~54 N) and increases the duration (from 55.0 µs to

Chapter 5
81
83.4 µs FWHM) of the thrust profile in the fast regime. The specific impulse changes
from 24.81±0.41 sec to 26.68±0.82 sec. In the slow regime, the nozzle increases the
thrust (from ~4.2 N to ~8 N) and reduces the duration (~1.22 ms to ~0.55 ms FWHM) as
shown in Figure 5.6(B). The specific impulse changes from 28.27±0.95 sec to 24.82±0.79
sec.
In the slow reaction regime, the convergent-divergent nozzle design increases the
thrust force and reduces the thrust duration as predicted by the rocket nozzle design
theory [13]. The thrust force increases because the exhaust flow is accelerated through
the diverging portion of the nozzle increasing the exhaust velocity at the nozzle exit
plane. In contrast, in the fast reaction regime, the nozzle reduces the thrust force slightly,
and increases the duration (full-width). However, from the plot in Figure 5.8(A), with the
convergent-divergent nozzle, the thrust duration (FWHM) is narrower than without a
nozzle. Then there is a tail-off of the thrust pulse that makes the total duration longer than
without a nozzle.
Figure 5.9 and Figure 5.10 show high-speed images of the fast reaction regime
with and without a convergent-divergent nozzle, respectively. Each of the images in
0.0 0.5 1.0 1.5-10
0
10
20
30
40
50
60
70
For
ce (N
)
Time (ms)
No Nozzle Con.-Div. Nozzle
1.0 1.5 2.0 2.5 3.0-2
0
2
4
6
8
10
Forc
e (N
)
Time (ms)
No Nozzle Con.-Div. Nozzle
(A) (B) Figure 5.8. (A) Comparison of thrust with and without the nozzle in the fast regime. (B) Comparison of thrust with and without the nozzle in the slow regime.

Chapter 5
82
Figure 5.9 and Figure 5.10 are separated by 100 µsec. Both sequences show a rapid
ejection of hot material, followed by the ejection of particulate material. However, based
on the total time from start to finish of particle ejection, the convergent-divergent nozzle
seems to prolong this process. The prolonging of the fluid ejection may be the reason for
the reduction in peak thrust amplitude.
Figure 5.9. Sequence of high-speed video frames from a thruster tested in the fast-regime with the motor containing a convergent-divergent nozzle. There is 100 µsec between each image (Total time is 900 µsec).
Figure 5.10. Sequence of high-speed video frames from a thruster tested in the fast-regime with the motor without a nozzle. There is 100 µsec between each image (Total time is 500 µsec).
More insight into the reason that the nozzle slows the ejection of material in the
fast reaction regime may be gained by considering some of the conditions for ideal nozzle
performance. One condition is that there is no friction or drag forces between the working
fluid and the walls [13]. However, in the scale of the microthruster structure in this work,
it is likely that friction between the working fluid and the thruster walls is not negligible.

Chapter 5
83
Another condition for ideal rocket performance is that the working fluid does not
contain any solid or liquid particles with significant size and/or mass [13]. It is evident
from the images in Figure 5.9 and Figure 5.10, that there is a significant amount of
solid/liquid particulates being ejected behind the main exhaust plume. It is possible that
there are frictional forces between the particulates and the walls, and the convergent-
divergent nozzle may enhance the effect of these forces.
In other words, the net effect of the nozzle may be to decrease the mass flow rate
and/or exit velocity of the reaction products. Considering the general formula for thrust
force:
( )0e e eF mV p p A= + −& (2)
where m& is the mass flow rate, Ve is flow velocity at the nozzle exit plane, pe is the
pressure at the nozzle exit plane, p0 is the ambient pressure, and Ae is the cross-sectional
area at the nozzle exit plane, the nozzle may decrease the thrust force by reducing the
first term of Eqn. 2.
A further condition for ideal rocket performance is that the fluid flow is steady
and continuous, and the fluid expansion is uniform without shocks or discontinuities [13].
Again, this condition may not be met in the current system. It has been demonstrated that
CuO/Al nanothermite composites can exhibit shockwave-like behavior [10, 14]. In
particular, it has been demonstrated previously that the formulation of CuO nanorods and
Al nanoparticles are capable of producing shock waves when they are loaded at low
packing densities, suggesting that such conditions will exist in the case of the fast-
reaction regime of the current system; however, it is not fully understood how the
presence of shock waves will change the function of the nozzle [10].

Chapter 5
84
5.5 Future Work
It appears that nanothermites have great potential for microthruster applications
that require short duration and high-amplitude thrust. Various nanothermite formulations
need to be tested to understand the effect of gas production, reaction rate (including sub-
sonic vs. super-sonic combustion), and reaction temperature on microthruster
performance. Further work is also needed to understand the relationship between packing
density and reaction regime shift. It will improve motor efficiency if material can be
loaded at higher density, but still exhibit fast-reaction performance. Additionally, other
system effects such as motor dimensions and structural material should be studied to
determine the significance of energy transfer with the chamber walls. It appears from this
work, that the nozzle may only cause increased friction between the fluid and the walls;
however, different nozzle designs, such as simple converging or diverging nozzles,
should also be tested to attempt to confirm this understanding. Eventually, a MEMS
process will need to be developed that can incorporate the loading of the nanothermite
fuel into the thruster and packaging of the device. In addition to improving the control
over device geometry, it will also allow the effect of different ignition locations to be
investigated. In the present system, ignition was triggered at the “nozzle-end” of the
thruster; however, there will likely be vastly different performance if the ignition is
triggered at the end of the chamber opposite to the exit-plane.
5.6 Conclusion
It has been demonstrated that CuO/Al nanothermites are capable of generating
large amplitude thrust compared with other fuels used in microthrusters. It has also been
shown that the packing density of the composite can be chosen to control whether the

Chapter 5
85
regime of reaction (either fast or slow regimes), without significantly affecting the
specific impulse that the material produces. Loading the material at relatively low %
TMD causes the material to react in the fast regime, which results in short duration high
amplitude thrust pulses. Additionally, in the fast reaction regime a convergent-divergent
nozzle may not be necessary due to significant deviations from ideal rocket performance
conditions. This unique behavior of nanothermites in a microthruster is attributed to the
unique characteristics of these nanopowder materials synthesized and self-assembled in
the nanoscale.
5.7 References
1. Ali, A., Son, S. F., Hiskey, M., Naud, D., Novel High Nitrogen Propellant Use in Solid Fuel Micropropulsion. Journal of Propulsion and Power, 2004. 20(1): p. 120-126.
2. Lewis, D.H., Janson, S. W., Cohen, R. B., Antonsson, E. K., Digital Micropropulsion. Sensors & Actuators A, 2000. 80: p. 143-154.
3. Chaalane, A., Rossi, C., Este've, D., The formulation and testing of new solid propellant mixture (DB + x%BP) for a new MEMS-based microthruster. Sensors & Actuators A, 2007. 138: p. 161-166.
4. Zhang, K.L., Chou, S. K., Ang, S. S., Development of a solid propellant microthruster with chamber and nozzle etched on a wafer surface. Journal of Micromechanics and Microengineering, 2004. 14: p. 785–792.
5. Zhang, K.L., Chou, S. K., Ang, S. S., Development of a low-temperature co-fired ceramic solid propellant microthruster. Journal of Micromechanics and Microengineering, 2005. 15: p. 944-952.
6. Rossi, C., Larangot, B., Lagrange, D., Chaalane, A., Final characterizations of MEMS-based pyrotechnical microthrusters. Sensors & Actuators A, 2005. 121: p. 508-514.
7. Groot, W.d. and S. Oleson, Chemical Microthruster Options, in NASA Contractor Report. 1996, NYMA, Inc. p. 19.
8. Shende, R., Subramanian, S., Hasan, S., Apperson, S., Thiruvengadathan, R., Gangopadhyay, K., et al., Nanoenergetic Composites of CuO Nanorods, Nanowires, and Al-Nanoparticles. Propellants, Explosives, Pyrotechnics, 2008. 33(2): p. 122-130.

Chapter 5
86
9. Pantoya, M.L., Granier, J. J., Combustion Behavior of Highly Energetic Thermites: Nano versus Micron Composites. Propellants, Explosives, Pyrotechnics, 2005. 30(1): p. 53-62.
10. Apperson, S., Shende, R., Subramanian, S., Tappmeyer, D., Gangopadhyay, S., Chen, Z.,, et al., Generation of fast propagating combustion and shock waves with copper oxide/aluminum nanothermite composites. Applied Physics Letters, 2007. 91(24): p. 243109-3.
11. Sanders, V.E., Asay, B. W.,Foley, T. J., Tappan, B. C., Pacheco, A. N., Son, S. F., Reaction Propagation of Four Nanoscale Energetic Composites (Al/MoO3, Al/WO3, Al/CuO, and Bi2O3). Journal of Propulsion and Power, 2007. 23(4): p. 707-714.
12. Prentice, D., M.L. Pantoya, and A.E. Gash, Combustion Wave Speeds of Sol-Gel-Synthesized Tungsten Trioxide and Nano-Aluminum: The Effect of Impurities on Flame Propagation. Energy & Fuels, 2006. 20: p. 2370-2376.
13. Sutton, G.P., Rocket Propulsion Elements. 5th ed. 1986, New York: John Wiley & Sons.
14. Bulian, C.J., Smith, S., Puszynski, J. A. Experimental and Modeling Studies of Self-Sustaining Reactions between Nanopowders. in The 2006 Annual Meeting of the AIChe. 2006. San Francisco, CA.

Chapter 6
87
Chapter 6
Conclusions and Future Work
6.1 Conclusions
The research described herein was aimed at characterization of nanothermite
materials and subsequent identification and development of microdevice applications of
those materials. The research started with shock-tube characterization of CuO/Al
nanothermites. It was found that the materials produced shock waves with high velocity,
but relatively low pressure. Based on this result, non-destructive applications of shock
waves and fast-reacting energetic materials were pursued.
An effort that was undertaken in-parallel with the shock-tube characterization was
development of an on-chip igniter for nanothermites. Design, fabrication, and detailed
characterization of the operation and performance of the igniters were performed. This
research resulted in Pt microigniters that operated with low energy (~100µJ). They
behaved similarly to exploding bridgewire devices. This work was a necessary first step
in developing the microdevice for drug delivery as the igniter is a fundamental
component of all energetic materials systems. From there, the microdevice was
developed for controlled shock wave generation for usage in shockwave induced drug
and particle delivery into living cells and tissues. The energetic performance of the
devices was characterized at every stage of design modification until the devices were
characterized in an actual drug delivery system. The initial results of this project are very
promising, and warrant more research.
Finally, development of another application (fast-impulse microthrusters) was
initiated. The thrust-generating capabilities of nanothermites were characterized using a

Chapter 6
88
simple thrust test stand. It was found that the nanothermite materials can exhibit either
sub-sonic or super-sonic reaction propagation rates based on the density to which they are
packed in the motor. A very unique finding is that the fastest impulse thrusters, which use
nanothermites configured for super-sonic reaction, may be best designed without any
convergent-divergent nozzle. Eliminating the nozzle from a thruster design simplifies the
design and fabrication of the motors, as well as reduces the cost of manufacturing.
The overall goal of this work was to develop technologies with real-world
applications. Additionally, a goal was to show that nanothermite microdevices can be
useful for both weapons (defense) applications and biomedical applications.
6.2 Future Work
Since the majority of this work was focused on bridging the gap between
nanothermite research and microdevice research, the microdevices are relatively
primitive, and certainly not completely optimized. Additionally, since the science behind
shockwave induced particle delivery and cell transfection is still not fully understood, and
the system has many variables, extensive research is required to understand the system
more completely and optimize the system design.
The materials used in the microchips were not ideal. The glass substrates on
which the igniters were patterned tended to shatter when more powerful energetic
materials were used. This presents safety concerns in certain applications because without
proper safety measures, the shattered glass fragments can become projectiles that can
cause injury. A process for fabricating the devices on polymer or metal substrates will
eliminate the fracture problem. Additionally, the wells that hold the nanothermite in the
microchips were fabricated by drilling holes one-by-one in a polycarbonate substrate. A

Chapter 6
89
batch technique such as hot-embossing should be employed to allow all the wells to be
formed in the substrate simultaneously.
The technique used for loading the nanothermite into the wells was primitive as
well. The nanothermites were manually loaded into the wells in powder form. This
method is not only labor intensive, it presents safety risks associated with handling
sensitive powders. An automated fluid dispensing system, which can handle nanothermite
slurry, needs to be employed to automatically drop discrete quantities of nanothermite
into each well. This will reduce the human labor required for loading the wells, and it
increases safety because the loading does not involve a person handling loose powder.
The transfection system had shortcomings that led to inconsistent transfection
results. Each of the system components introduces many variables into the experiments.
The main variables related to the microchips include the nanothermite formulation, the
density to which it is loaded, and the materials used for fabricating the wells. Variables
related to the coupling include the PDMS thickness, and the length, diameter and material
from which the gel-tube is made, as well as the consistency of the gelatin itself. Variables
related to the target vessel include its dimensions and shape, the material from which it is
made, and whether completely confined, or if there are openings that can relieve the
internal pressure build-up. Those are just the variables relating to the physical design.
The biochemistry behind gene transfer is very complex and successful gene
transfer is very sensitive to all the chemical and biological materials introduced into the
cell culture/medium. For example, the plasmid delivered for transfection must be
prepared to carry the gene to be transferred, and it must have a promoter that will induce
the incorporation of the gene in the target cells. The promoter must be chosen such that it

Chapter 6
90
is compatible with the target cells. Therefore, this research requires a biology expert to be
dedicated to that aspect of the work.
In order to further develop the microthrusters, specific guidance applications must
be identified (i.e. performance requirements must be defined). Once the required
performance is known, the device fabrication can be developed to make the devices low-
cost and able to be integrated with the rest of the guidance system. If the required total
impulse is low (mN-s range), then a MEMS thruster can be developed to generate the
required impulse. However, if the required impulse is too large (N-s range) then the
thrusters will likely need to be fabricated using conventional manufacturing techniques.
Additionally, the nanothermite formulations will need to be modified in order to meet
sensitivity and stability requirements for a particular application environment.

91
VITA
Steven Apperson was born on December 30, 1982 in St. Louis, Missouri. He grew
up in St. Louis County, and graduated from Eureka Senior High School in 2001. He
received his B.S degree in Electrical Engineering from the University of Missouri -
Columbia, in Columbia, Missouri in 2005. He went directly into the direct Ph.D program
at the University of Missouri - Columbia, and recently completed said degree program in
2010. His research interests include nanomaterials and micro-electromechanical systems.