characterization and modeling of o -specular neutron ... · characterization and modeling of o...
TRANSCRIPT

Characterization and Modeling of Off-Specular Neutron
Scattering for Analysis of Two Dimensional Ordered Structures
Metting, C.J. and Briber, R.M.
Materials Science and Engineering,
University of Maryland, College Park, MD
Maranville, B.B., Kienzle, P., Majkrzak, C.F., and Dura,J.A.
NIST Center for Neutron Research, NIST, Gaithersburg, MD
(Dated: February 27, 2012)
Abstract
With high flux neutron sources like the Spallation Neutron Source coming on-line around the
world, new possibilities for neutron instrumentation are being realized as the limitations imposed by
low flux sources are lifted. This is especially true in the case of off-specular neutron reflectometry
where higher intensities will allow for a more in-depth study of the in-plane structure of thin
film samples. To interpret off-specular reflectometry data effectively, robust modeling tools are
required. Although much progress has been made in developing the mathematics required to model
such scattering data, no versatile, open-source software package for the modeling of off-specular
neutron reflectometry exists. Such software, in which the mechanics of calculations are exposed
and reviewable by the larger scientific community, is essential for reliable off-specular neutron
reflectometry data analysis. Here we present results from the current software. We also compare
theory functions created with different mathematical approximations to data taken from a system
of Au pillars to evaluate the modeling capabilities of each approximation under real scattering
conditions.
1

I. INTRODUCTION
Neutron reflectometry provides a scattering length density (SLD) depth profile of thin film
samples with sub-angstrom accuracy [1] [2] by measuring reflected neutron beam intensity
as a function of Qz; defined as:
Qz = 4π/λsin(θ) (I.1)
where θ is the glancing angle between the incident beam and the sample and λ is the
neutron beam wavelength. The SLD, ρ, is defined as:
ρ(z) =M∑j=1
N(z)jbj (I.2)
where N is the number density, b is the coherent nuclear isotopic scattering length, and
the sum is taken over all isotopes, j, for a given depth, z. Specular NR is not sensitive
to in-plane structures and interacts with a SLD which is averaged over any compositional
variations within that plane. The atomic dependence through bj allows the SLD profile
to be interpreted as a compositional profile when the constituent materials are known.
Furthermore, the isotopic dependence of bj allows for specific atoms in a system to be
tagged and traced using isotope substitution.
Due to a lack of neutron phase information, NR data cannot be directly inverted to de-
termine a SLD profile. To interpret NR data, theoretical reflectivity versus Qz is calculated
from model systems and compared to real data. Neutrons reflected from each interface in
multilayered thin films interfere constructively and destructively as a function of Q, resulting
in oscillating reflected amplitude with various periods versus Qz that are inversely propor-
tional to the thickness of the layers that caused them. Simple structures can be modeled as
single layers of constant SLD for each film in the system. More complicated profiles, such as
compositional gradients, can be modeled as a stack of arbitrarily thin layers to approximate
any SLD profile. The resulting interference fringes are highly dependent on SLD, thickness,
and interfacial roughness of the layers in the sample which lead to high structural sensitivity.
Specular NR is not sensitive to in-plane structures and interacts with a SLD which is
averaged over any compositional variations within that plane.The specular scattering can
be analytically solved for by either the Parratt[3] or matrix [4] method, but contains no
2

detailed interpretation of scattering that results in a wave vector transfer with components
in the in-plane directions, which occurs when there is scattering contrast variation within
the plane of the film which is smaller than the projected neutron beam coherences length.
For nominally smooth films, diffuse scattering is treated as background scattering and is
removed from the specular curve[4]. When variations are corrolated, more robust treatments
of the diffuse scattering are required. Formalisms have been developed for special types of
roughness by Sinha et al.[5], which use a distorted wave Born approximation (DWBA) to
represent the diffuse scattering and allow for the extraction of information about in-plane cor-
related roughnesses. Work has also been carried out on the formulation of a DWBA, which
can model correlated nuclear and magnetic structures[6, 7] in two-dimensional reciprocal
space plots. The results of this approximation compare quite well with scattering data[8].
Despite these advancements, a well structured, user-friendly, and open source off-specular
neutron reflectometery modeling software has yet to be developed. The development, and
dissemination of, such software would help both foster and streamline new theoretical treat-
ments and facilitate discoveries in new areas of research where off-specular reflectometry
could uniquely contribute materials charactorization.
The software development process focused on producing a well compartmentalized, ob-
ject oriented modeling software package which utilizes distributed programming to accom-
modate more complicated and computationally expensive algorithms. The software was also
developed in the python programming language, which has software libaries to support the
complicated mathematical algorithms required for off-specular theory function calculations.
Finally, because the formalism and modeling capabilities must be open and verifiable, the
source code for this software is publicly available for review.
Here, results from the formalism implemented in the off-specular neutron reflectometry
software are presented. This implementation utilizes a finite element process with formalisms
derived from a variety of sources [9] [7]. In section II, the mathematical formalism available
in the current software as well as the conditions under which each approximation is valid
is discussed. Section III discusses the fabrication and measurement of a well-charactorized,
well-ordered samples, which were used as standards for evaluating computed theory func-
tions. Section IV analyzes the theory functions produced by the modeling software and
evaluates their capabilities by modeling the data acquired from the standard sample. This
section will also highlight features in both the data and theory functions which are important
3

FIG. 1. Schematic representation of the off-specular scattering geometry. Specular scattering
geometry occurs when θi = θf so that qx = 0 and therefore Q = qz.
FIG. 2. Schematic representation of the two mathematical components used to calculate the
scattering from the sample. The form factor is a matrix of scattering length density values which
represents the single unit which is repeating across the sample. The structure factor contains
information about how the unit is repeating across a sample.
for accurately modeling experimental systems. Finally, section V will discuss requirements
which must be implemented for a more robust modeling software.
II. THEORETICAL BACKGROUND
The geometry of the off-specular reflectometry technique is shown in figure 1. Because
no closed-form formalism exists for the calculation of off-specular neutron scattering, the
theories being utilized in this software package are based on the Born approximation and
perturbations on it. For periodically repeating features, the system may be divided into two
components. These components are illustrated in figure 2 and in equation II.1
Intensity = |form factor|2 ∗ |structure factor|2 (II.1)
The formalism implemented in this software only solves for the coherent scattering and
can only model systems which contain features that are significantly smaller than the co-
4

herence length of the neutron beam where the coherent scattering dominates.
The first component in this equation, the form factor, is the Fourier transform of a single
repeated unit. This repeat unit is represented by a three-dimensional finite element matrix
of scattering length density (SLD) values with a discretization size that is commencerate
with the desired qx and qz range. This approch is valid for unit discretization sizes that
are smaller than the real space value of the maximum q in each direction respectively. The
second component, the structure factor, is the Fourier transform of the two-dimentional
in-plane repeat structure. Conceptually, this component could be eliminated if the finite
element matrix represented the entire coherently scattering surface area; however, the size
of a matrix which would describe the total sample volume would be prohibitively large. In
all of the approximations implemented in this software, the modeling is solved using form
factor and structure factor calculations.
A. Structure Factor
The structure factor is the Fourier transform of the repeating lattice structure in a model
system. The Fourier transform of a two dimensional lattice results in a delta function at
the Bragg conditions. Because the neutrons coherently scatter over a finite space, these
delta functions must be convolved with the coherence structure of the neutron. In this
work, the coherence length is treated as a Gaussian. The Fourier transform for the structure
factor is calculated by convolving the delta function Bragg peaks resulting from the in-plane
diffraction with the coherence length of the neutron beam as seen in equation II.2.
S = e−2π2q2σ2
FT (Vlattice) (II.2)
The Gaussian envelope applied to the neutron wave packet suppresses artifacts that result
from assuming a sharp cut-off. Figure 3 illustrates the difference between a square and a
Gaussian envelope.
B. Resolution Correction
The neutron beam resolution has a strong effect on the scattering. To account for these
resolution effects, a broadening function is applied to the theory function. There are two
5

FIG. 3. A comparison of calculations carried out in the Born approximation for a beam coherence
length with A) a square envelope and B) a Gaussian envelope.
main contributors to the neutron beam resolution. The first is wavelength distribution from
the monochromator, which exposes the sample to a finite distribution of energies. The
second is the angular divergence in the incoming beam, θ. The resolution is approximated
as the uncorrelated convolution of these effects.
The resolution correction applied is:
(δq
q
)2
=
(δλ
λ
)2
+
(δθi
tan (θi)
)2
(II.3)
and the results are shown in figure 4.
C. Born Approximation (BA)
The kinematic approximation for calculating the theory function for a model assumes
that the reflected intensity of the plane wave impinging on a surface is so small that the
transmitted wave can be approximated as the original plane wave. This assumption is appli-
6

FIG. 4. A comparison of the Born Approximation results with A) no resolution correction and B)
resolution correction
cable at high q values where the reflectivity, and thus the probability of multiple reflections,
is small; however, in reflectometry scattering is inherently measured at low q values where
the kinimatic approximation is invalid. Theory functions calculated with the BA will not
represent distortions to the scattering resulting from multiple scattering effects, which con-
tribute significantly to the scattering at low q. The formalism for this approximation can
be written as:
qzS‖4π|r|2 =
∣∣∣∣∫∫∫ Vunit
0
ρ (r) eiqrunit
∣∣∣∣2︸ ︷︷ ︸Form Factor
∗
(e−2π2q2σ2 ∗ FT (Vlattice)
)2
︸ ︷︷ ︸Structure Factor
(II.4)
whereqzS‖4π
is a normalization factor, S‖ is the surface area covered by the probing beam, r
is the reflectivity, σ is the coherence length of the beam,Vlattice are the delta function lattice
points, and ρ is the SLD. The form factor of this calculation can be approximated as:
7

FF =
∣∣∣∣ 1
iq
(1− eiq∆runit
)∗ FT (ρ (r))
∣∣∣∣2 (II.5)
where FT is the Fourier transform of the SLD matrix. This is then multiplied with
the modulus squared of the structure factor. This variation is much less computationally
expensive. The calculation can be made even more efficient by substituting the FT with a
chirp-z transform [10]:
FF =
∣∣∣∣ 1
iq
(1− eiq∆runit
)∗ CZT (ρ (r))
∣∣∣∣2 (II.6)
which has a lower machine memory requirement because only the q-space region of interest
is calculated.
D. Substrate Modified Born Approximation (SMBA)
Although the theory functions calculated using the BA provides a scattering profile that
relates to the sample, the reflection geometry is susceptible to effects caused by perturbation
of the wave as it interacts with the sample, which cannot be captured using the kinomatic
approch. In the case of samples with a sparse array of features on a substrate where the dom-
inant contributor to dynamic scattering is the substrate, two corrections can be applied to
the BA. The algorithm which uses these corrections will be referred to as the substrate mod-
ified born approximation (SMBA). Because the dominant contributor to dynamic scattering
is the substrate/incident media interface, the scattering can be perturbed by the solution
to the wavefunction of the incident and scattered wave as it interacts with this interface. A
second correction is applied to scattering occurs below the angle at which the incident or
scattered beam enter or leave the substrate nearly orthogonal to the substrate sidewall. In
this case, the beam refracts resulting in the shift illustrated in figure 5. The scattering shifts
in the positive qx direction at qx > 0.0 and below θf < 0.0 and in the negative at qx < 0.0
and below θf < 0.0. Figure 5 illistrates this shift.
The form factor for the SMBA can then be written as:
FF =
∣∣∣∣∣−iq (1− eiq∆runit)
[Ψin
r∑n=0
{ρ (r) ∗ eiqr}Ψout
]∣∣∣∣∣2
(II.7)
8

FIG. 5. Data taken on AND/R which illustrate. A) the refractive shift caused by the substrate and
B) the ’horizons’ calculated through the perturbation of the scattering along with an illustration
of the scattering angles for i) negative qx and positive θi, ii)positive qx and positive θi, iii) negative
qx and negative θi, and iv) positive qx and negative θi.
The solution to the wavefunction is solved by first calculating the reflected and trans-
mitted beam resulting from the substrate/incident media interface. The reflected beam
is:
r =M1,1 + (i ∗ n0 ∗M0,1) + −i
nf∗ (−M1,0 − i ∗ n0 ∗M0,0)
−M1,1 + i ∗ n0 ∗M0,1−inf
(M1,0 − i ∗ n0 ∗M0,0)(II.8)
and the transmitted beam is:
t = 1.0− r (II.9)
Now the appropriate solutions can be calculated based on where the scattering occures
in q-space. For an incoming plane wave the solution can be calculated as:
9

FIG. 6. Schematic of the interactions accounted for in the SMBA.
Ψin =
t ∗ e−ik‖in∆qz if kin < 0.0
1 ∗ e−ik‖in∆qz + r ∗ e−ik
‖in∆qz if kin ≥ 0.0
(II.10)
and likewise, for the scattered wave the solution can be calculated as:
Ψout =
1 ∗ e−ik‖out∆qz + r ∗ e−ik
‖out∆qz if kout ≥ 0.0
t ∗ e−ik‖out∆qz if kout < 0.0
(II.11)
The process is illustrated in figure 6.
The qx that effect from the substrate refraction can now be applied to the finete element
matrix. The effective qx is:
qeffx =
qx − λρsub if qx < 0.0, θi < 0.0
qx + λρsub if qx > 0.0, θf < 0.0(II.12)
E. Distorted Wave Born Approximation (DWBA)
The distorted wave Born approximation is similar to the SMBA discussed previously. In
this approximation, the scattering is distorted by each change in scattering potential that the
beam encounters as it traverses the sample depth. The formalism applied in this calculation
is derived from that presented by Kentzinger [7]. In this treatment, the solution to the
wavefunction is obtained by assuming the in-plane interaction can be approximated as the
interaction between the wave and an in-plane averaged scattering profile. This solution is
then used to perturb the in-plane scattering results. Rather than using the lateral correlation
function discussed by Kentzinger, the structure factor described in equation II.2 is applied.
10

In this work only the off-specular scattering cross-section is calculated by taking the modulus
squared of the scattering amplitude, which is written as:
Ffi =∑
l
∫dzSfl(z)Fl(Q‖)Sil(z) (II.13)
where Fl(Q‖) is the lateral Fourier transform of the difference between the scattering
potential and the laterally averaged scattering potential and the S are the propagator func-
tions determined from the laterally averaged scattering potential. The specular scattering
must be calculated separately and can be empirically scaled to the data [7].
III. EXPERIMENTAL RESULTS
To validite the computational models against a known system, reference samples were
fabricated and their scattering profiles measured. Sample material and patterning were
optimized to provide high scattering intensity where the off-specular reflectometry technique
is most sensitive. For the non-magnetic sample, a 75mm diameter 5mm thick silicon wafer
was fully patterned with Au pillars on a Cr/Si substrate. The Si 5 mm thick substrate was
chosen to reduce the possibility of sample warping. Au was chosen for its large scattering
cross-section. The thin Cr layer was used as an adhesion layer and was left thin to reduce
its contribution to the scattering.
A. Sample Fabrication
The Au parallelepiped features were produced by sputter deposition of Cr followed by
Au onto a Si substrate using a Denton Discovery 22 sputtering system at the Center for
Nanoscale Science and Technology(CNST). The Au was patterned using standard lithogra-
phy techniques with a Suss Microtec MA8 Front Side Aligner also at the CNST. The Au
was etched using room temperature dilute aqua regia (HNO3 : 3HCl : 20H2O) until the Cr
was visible.
Systematic width variation of the features across the sample was found by optical mi-
croscopy to be almost 32% relative to the center feature size. This is due to the variation
in wet etch rate across the sample, which is generally observed with wet etch processes. Al-
though the full sample is, for most incident angles, not probed by the beam, this variation is
11

FIG. 7. A) a schematic of the fabricated sample, B) an optical microscopy image of the sample,
and C) the reduced data in qx/qz coordinates.
expected to have an effect on the neutron scattering. Sidewall roughness was also observed.
Although the mask contained a square pattern with sharp corners, the wet etching process
caused these corners to round, resulting in a more cylindrical feature.
Figure 7 shows the fabricated sample with the scattering.
B. Data Acquisition
Measurements were taken with the Advanced Neutron Diffractometer/Reflectometer
(AND/R) at the NIST Center for Neutron Research (NCNR) [11]. Due to the relaxed
collimation in the y direction, reflectometry measurements have no y and consequently no
qy resolution. This broadly divergent beam increases the amount of flux on the sample
without losing resolution along the x and z axis. The main beam was blocked using an
absorbing beam-stop. Data was acquired on a Position Sensitive Detector (PSD) [12].
Each data point contains multiple θf angles for a given θi. An example of data for a
given angle is shown in figure 8A. Because of the poor y resolution, no information can be
obtained from the y scattering and the data is integrated along the y-axis for each θi. The
x-axis is then converted to thetaf values. The collection of θi data is concatenated into one
data set to build a θ/2θ plot as seen in figure 8B. Because θ space plots can be difficult to
12

FIG. 8. A) a single data point from the PSD. B)A stack of multiple data points integrated over
the y-direction to form a θ/2θ plot. C) Transformation of the data into qx/qz space.
interpret, the data can be converted to different spacial coordinates [13]. In this work, qx/qz
plots are used; calculated using equation (III.1)
q = kf − ki =2π
λ
(cos(θf )− cos(θi))x
(sin(θf ) + sin(θi))z
(III.1)
Due to the q-space angular dependence, the rebinning process can be challenging and
requires sub-sampling the data matrix to reduce errors introduced by the spacial transform.
The result of this process are shown in figure 8.
IV. MODELING
The dataset obtained in section III can now be modeled using the approximations de-
scribed in section II. The the modeling results are shown in figure 9.
Figure 9 shows a comparison of the BA and SMBA results. The Bragg peaks are located
along the qx axis and correspond to the in-plane feature spacing. The beating pattern along
13

FIG. 9. Modeling a subset of data(B) collected from III with parameters(A), using the Born
approximation(C) and the substrate modified Born approximation(D)
the qz are the fringes corresponding to the sample’s depth profile [13]. This comparison
illustrates some improvement of the SMBA over the BA. In scattering data, the scattered
intensity is observed to be attenuated at θin = 0 and θout = 0, referred to in this paper
as the ’horizons’, which is primarally due to the substrate. This attenuation is observed in
the SMBA, but not in the BA. Also, below the ’horizons’, the neutron beam passes into
the substrate at a nearly orthogonal incident angle. This results in neutron beam refraction
which is also reproduced by the SMBA. The results for the SMBA still contain some of
the inaccuracies inherent to the BA. The approximation is still inaccurate at low q values,
especially toward the critical edge. The fringes are also slightly shifted in the qz direction as
is generally observed with the first order BA. Still, the SMBA shows improvement over the
general BA and, for the case of large structures below the coherence length of the probing
beam and at q-space values far away from 0, information about both the in-plane and depth
structure can be obtained.
Figure 10 shows the results from the DWBA calculation. The integrated slices show
remarkable qualitative agreement. These models do not take into account sample disorder
14
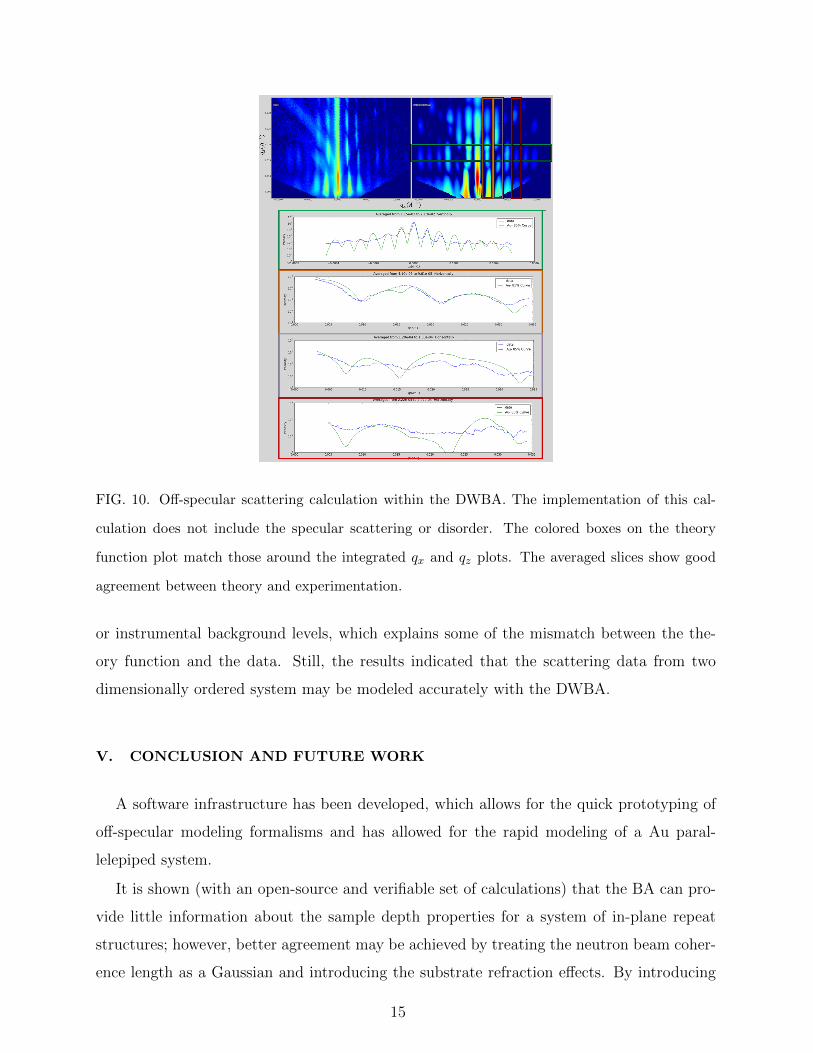
FIG. 10. Off-specular scattering calculation within the DWBA. The implementation of this cal-
culation does not include the specular scattering or disorder. The colored boxes on the theory
function plot match those around the integrated qx and qz plots. The averaged slices show good
agreement between theory and experimentation.
or instrumental background levels, which explains some of the mismatch between the the-
ory function and the data. Still, the results indicated that the scattering data from two
dimensionally ordered system may be modeled accurately with the DWBA.
V. CONCLUSION AND FUTURE WORK
A software infrastructure has been developed, which allows for the quick prototyping of
off-specular modeling formalisms and has allowed for the rapid modeling of a Au paral-
lelepiped system.
It is shown (with an open-source and verifiable set of calculations) that the BA can pro-
vide little information about the sample depth properties for a system of in-plane repeat
structures; however, better agreement may be achieved by treating the neutron beam coher-
ence length as a Gaussian and introducing the substrate refraction effects. By introducing
15

perturbation effects to the wave function from the substrate/incident media interface, a
more accurate theory function can be calculated at and below the horizons. By perturb-
ing the wavefuntion by interactions at each interface in the sample, much of the scattering
features are capture; however, combining the specular and off-specular scattering results
is challenging due to the nature of the approximation. Further work will implement the
ability to combine the specular and off-specular data within the framework of this software
infrastructure.
VI. ACKNOWLEDGMENTS
Research was performed in part at the NIST Center for Nanoscale Science and Technology
and at the NIST Center for Neutron Research. This project was funded by NSF Grant #:
DMR-0529547
[1] J. A. Dura, C. A. Richter, C. F. Majkrzak, and N. V. Nguyen, Applied Physics Letters 73,
2131 (1998).
[2] M. P. Seah, S. J. Spencer, F. Bensebaa, I. Vickridge, H. Danzebrink, M. Krumrey, T. Gross,
W. Oesterle, E. Wendler, B. Rheinlander, Y. Azuma, I. Kojima, N. Suzuki, M. Suzuki,
S. Tanuma, D. W. Moon, H. J. Lee, H. M. Cho, H. Y. Chen, A. T. Wee, T. Osipowicz,
J. S. Pan, W. A. Jordaan, R. Hauert, U. Klotz, C. van der Marel, M. Verheijen, Y. Tam-
minga, C. Jeynes, P. Bailey, S. Biswas, U. Falke, N. V. Nguyen, D. Chandler-Horowitz, J. R.
Ehrstein, D. Muller, and J. A. Dura, Surface and Interface Analysis 36, 1269 (2004).
[3] L. G. Parratt, Physical Review 95, 359 (1954), copyright (C) 2010 The American Physical
Society Please report any problems to [email protected] PR.
[4] Y. Zhu, Modern techniques for characterizing magnetic materials (Kluwer Academic Publish-
ers, Boston, 2005).
[5] S. K. Sinha, E. B. Sirota, S. Garoff, and H. B. Stanley, Physical Review B 38, 2297 (1988).
[6] B. P. Toperverg, Physica B-Condensed Matter 297, 160 (2001).
[7] E. Kentzinger, U. Ruecker, B. Toperverg, F. Ott, and T. Bruckel, Physical Review B 77
(2008).
16

[8] B. Toperverg, V. Lauter-Pasyuk, H. Lauter, O. Nikonov, D. Ausserre, and Y. Gallot, Physica
B 276, 355 (2000).
[9] T. Chatterji, (2006).
[10] L. RABINER, R. SCHAFER, and C. RADER, IEEE TRANSACTIONS ON AUDIO AND
ELECTROACOUSTICS AU17, 86 (1969).
[11] J. A. Dura, D. J. Pierce, C. F. Majkrzak, N. C. Maliszewskyj, D. J. McGillivray, M. Losche,
K. V. O’Donovan, M. Mihailescu, U. Perez-Salas, D. L. Worcester, and S. H. White, Review
of Scientific Instruments 77 (2006).
[12] B. Yu, Z. Zojceski, J. Harder, A. Hrisoho, V. Radeka, and G. Smith, NUCLEAR INSTRU-
MENTS & METHODS IN PHYSICS RESEARCH SECTION A-ACCELERATORS SPEC-
TROMETERS DETECTORS AND ASSOCIATED EQUIPMENT 485, 645 (2002).
[13] S. V. Kozhevnikov and F. Ott, Physics of the Solid State 52, 1561 (2010).
17