characterization of a liquid-core waveguide cell for
TRANSCRIPT

Analyst
PAPER
Cite this: Analyst, 2021, 146, 3197
Received 12th February 2021,Accepted 30th March 2021
DOI: 10.1039/d1an00272d
rsc.li/analyst
Characterization of a liquid-core waveguide cellfor studying the chemistry of light-induceddegradation†
Iris Groeneveld, *a Suzan E. Schoemaker,a Govert W. Somsen,a Freek Ariese b
and Maarten R. van Bommelc,d
Many organic compounds undergo changes under the influence of light. This might be beneficial in, for
example, water purification, but undesirable when cultural-heritage objects fade or when food ingredients
(e.g., vitamins) degrade. It is often challenging to establish a strong link between photodegradation pro-
ducts and their parent molecules due to the complexity of the sample. To allow effective study of light-
induced degradation (LID), a low-volume exposure cell was created in which solutes are efficiently illumi-
nated (especially at low concentrations) while simultaneously analysed by absorbance spectroscopy. The
new LID cell encompasses a gas-permeable liquid-core waveguide (LCW) connected to a spectrograph
allowing collection of spectral data in real-time. The aim of the current study was to evaluate the overall
performance of the LID cell by assessing its transmission characteristics, the absolute photon flux
achieved in the LCW, and its capacity to study solute degradation in presence of oxygen. The potential of
the LID set-up for light-exposure studies was successfully demonstrated by monitoring the degradation
of the dyes eosin Y and crystal violet.
1. Introduction
Light-induced degradation (LID) or photodegradation takesplace almost everywhere light reaches. After absorbing light, amolecule is prone to react with other molecules to form newproducts or degrade, losing particular structural properties.This can be a beneficial process, for instance for production ofdrinking water when photodegradation is used for the removalof unwanted chemicals by applying ultra-violet (UV) radiationto surface water. However, in some cases, this might lead tothe formation of unknown compounds which may be toxic oraffect the environment. In addition, chemical degradationafter light exposure is unwanted in, for example, cultural heri-tage or the food industry where properties such as colour and
structure or smell and taste should remain stable as long aspossible.
A straight-forward method for studying photodegradation isirradiation of a solution of the sample in a vial or cell for afixed time, followed by analysis of solution aliquots by e.g.liquid chromatography (LC). Using such an approach, forexample, Confortin studied the degradation of the dye crystalviolet (CV), Toohey investigated the effect of iron in presenceof UV light on the sweetener rebaudioside A, and Hora exam-ined the degradation of pharmaceutical compounds inwastewater.1–3 Similar approaches have been applied to e.g.,pharmaceuticals,4–9 pesticides,10,11 foodstuffs,12 andpolymers.13,14
These approaches mostly work well if a single, fairly purecompound is studied and a limited number of degradationproducts is formed. However, if the sample is a (complex)mixture and potentially contains unknown components,interpretation of the results becomes very difficult. This com-plexity increases when multiple types of molecules degradeand/or start to react with other sample components or formedfragments. A major challenge in such photodegradationstudies is, therefore, to distinguish which degradation pro-ducts arise from which (parent) molecule.
A way to decrease sample complexities that are met in LIDstudies, might be to carry out a separation of the sample com-ponents prior to light exposure. This preferably would be done
†Electronic supplementary information (ESI) available. See DOI: 10.1039/d1an00272d
aDivision of Bioanalytical Chemistry, Amsterdam Institute of Molecular and Life
Sciences, Vrije Universiteit Amsterdam, De Boelelaan 1108, 1081 HZ Amsterdam,
The Netherlands. E-mail: [email protected]; Tel: +31 (0) 20 59 86 892bLaserLaB, Vrije Universiteit Amsterdam, The NetherlandscAnalytical Chemistry Group, van ‘t Hoff Institute for Molecular Sciences, University
of Amsterdam, Science Park 904, 1098 XH Amsterdam, The NetherlandsdConservation and Restoration of Cultural Heritage, Amsterdam School for Heritage,
Memory and Material Culture, University of Amsterdam, P.O. Box 94552, 1091 GN
Amsterdam, The Netherlands
This journal is © The Royal Society of Chemistry 2021 Analyst, 2021, 146, 3197–3207 | 3197
Ope
n A
cces
s A
rtic
le. P
ublis
hed
on 0
7 A
pril
2021
. Dow
nloa
ded
on 1
/20/
2022
6:5
8:15
AM
. T
his
artic
le is
lice
nsed
und
er a
Cre
ativ
e C
omm
ons
Attr
ibut
ion-
Non
Com
mer
cial
3.0
Unp
orte
d L
icen
ce.
View Article OnlineView Journal | View Issue

in an on-line fashion where a separation technique like LC iscoupled to a low-volume irradiation cell in which isolated com-ponents can be exposed to light. Ideally, such a cell would alsoallow real-time spectroscopic monitoring of the content. Afterexposure, the cell content could be transferred on-line toanother LC system for separation and analysis of the degra-dation products. On-line post-column photoreactors have beenreported for reaction detection of target compounds,15–18
however, these reactors are less suited for on-line LID studies.The continuous flow reactors have relatively large volumes, theactual illumination of the sample is hard to control, and theydo not allow in situ monitoring of photochemical reactions.
Liquid core waveguides (LCWs) are tubes of small internaldiameter that are based on the principle of total internalreflection (TIR) and are typically made of low refractive index(RI) materials, which behave as an optical fibre once filledwith a liquid of higher RI. They might offer a solution to theabovementioned challenges faced in on-line coupling ofphotoreactors. The possibility of coupling LCWs with LC hasalready been proven to be possible in earlier work where theLCW was used as a post-column (chemically-active) detectioncell.19–21 Therefore, we anticipate that on-line coupling of anLCW as an LID cell to LC in a pre- or post-column fashion willbe feasible. LCWs facilitate axial illumination of its entirecontent and the possibility to detect the transmitted light,making the optical path length of an LCW quite significant(up to 1 m), which is an advantage when concentrations ofexposed components are low. Furthermore, since the lightsource is focused inside the capillary, the light dose can beeasily controlled. Because of these properties, Teflon AF capil-laries or coatings have been used for sensitive UV-Visabsorbance,22,23 fluorescence,24,25 mid-IR,26 and Raman spec-troscopic detection.27–31
LCWs are typically made of Teflon AF, which is an amor-phous and translucent polymer of tetrafluoroethylene (TFE)and 2,2-bis(trifluoromethyl)-4,5-difluoro-1,3-dioxole (PDD)with an RI of 1.29–1.31. This makes it suitable as an LCWwhen using core solvents such as water (RI≈1.33), methanol(RI≈1.333) and acetonitrile (RI≈1.34), which all are frequentlyused in LC eluents. There are currently two types of LCWs thatare fabricated using Teflon AF. Type I is a tube entirely madeof such a polymer, whereas type II is a silica capillary coatedexternally with Teflon AF.32 For a type II LCW, TIR occurs bothat the core/silica and the silica/polymer interface, making itless suited as LID cell because a significant fraction of thelight will travel through the capillary wall rather than throughthe liquid core where the sample will be located. For type ILCWs, TIR occurs at the core/polymer interface, providingoptimal light-exposure of the total content in the LCW. Anadditional benefit of the use of type I LCWs made of Teflon AFis their permeability to gases, allowing diffusion of e.g. oxygeninto the cell required for photooxidation processes.33,34
This study investigates the potential of a Teflon AF2400LCW as an LID cell coupled to a spectrograph allowingefficient illumination together with collection of real-timetransmission and absorption spectra of the cell content. The
light transmission characteristics of LCWs of different lengthwere studied as a function of wavelength. The effects of fillingprocedures and stability throughout the measurements wereevaluated, and the diffusion of oxygen gas through the cellwalls was verified using methylene blue as indicator. Theabsolute photon flux in the cell was determined by actinome-try. The basic performance of the new LID cell was evaluatedby monitoring the degradation of eosin Y (EY) and crystalviolet (CV) in the LCW and subsequent analysis of the contentof the LID by LC. To the best of our knowledge, the use of anLCW cell for studying photodegradation has not been reportedbefore.
2. Materials and methods2.1 Chemicals
For the preparation of LC eluents, Ultrapure Milli-Q water(MQ), methanol (MeOH) (Biosolve, UPLC/MS grade), formicacid (FA) (Sigma-Aldrich), sodium hydroxide (NaOH) (Sigma-Aldrich) and triethylamine (TEA) (Sigma-Aldrich) were used.Actinometry experiments were performed using 1,2-bis(2,4-dimethyl-5-phenyl-3-thienyl)-3,3,4,4,5,5-hexafluoro-1-cyclopen-tene (DAE) obtained from TCI Chemicals (Tokyo, Japan) dis-solved in hexane (Sigma-Aldrich). In order to assess gasdiffusion, methylene blue hydrate (Sigma-Aldrich, ≥97%purity), NaOH and glucose (Sigma) were used. Degradationexperiments were executed using solutions of eosin Y (Sigma-Aldrich, ≥99% purity) and crystal violet (Sigma-Aldrich, ≥90%purity) dissolved in MQ.
2.2 LID cell set-up and detection system
A schematic overview of the LID set-up is shown in Fig. 1.Illumination was performed with a Xenon lamp purchased
Fig. 1 Schematic overview of the design of the LID cell. From left toright: (a) connection with solvent pump, (b) sample delivery by syringe,(c) gas inlet, (d) gas outlet, (e) waste channel.
Paper Analyst
3198 | Analyst, 2021, 146, 3197–3207 This journal is © The Royal Society of Chemistry 2021
Ope
n A
cces
s A
rtic
le. P
ublis
hed
on 0
7 A
pril
2021
. Dow
nloa
ded
on 1
/20/
2022
6:5
8:15
AM
. T
his
artic
le is
lice
nsed
und
er a
Cre
ativ
e C
omm
ons
Attr
ibut
ion-
Non
Com
mer
cial
3.0
Unp
orte
d L
icen
ce.
View Article Online

from Hamamatsu. When only a specific part of the spectrumof the Xenon lamp was required, bandpass filters were placedinside the lamp housing. The light from the lamp was guidedthrough an optical fibre (core diameter, 1500 µm) into the LIDcell via a coupling piece (Fig. A.1, ESI†). An identical couplingpiece was used at the end of the LID cell to measure the trans-mitted light. The coupling pieces were made of PEEK anddesigned with three threaded inlets: one in the axial face forfitting the LID cell, and two side inlets at a 45° angle. Theback of the pieces were sealed with a quartz window to allowintroduction or collection of light. The two side inlets at thefirst coupling piece can be used for introduction of the sampleand (if necessary) another solvent or reagent e.g., a catalyst orinhibitor; details of sample introduction are provided insection 2.3. The side inlets of the coupling piece at the end ofthe LCW were used for waste or for sample collection.
The LID cell consisted of a type I LCW made of TeflonAF2400 (ID, 800 µm; OD, 1000 µm), obtained from CambridgeReactor Design (Cottenham, United Kingdom), which wasplaced inside an outer tubing made of high-density polyethyl-ene (HDPE), creating a tube-in-tube design. T-pieces made ofPEEK were glued into the outer tubing to permit addition ofgases, such as nitrogen or oxygen (see Fig. 1). Both ends of theLID cell were glued into standard chromatographic finger-tightfittings with Valco thread facilitating the connection of theLID cell to the coupling pieces. To study the effect of gas per-meability of the type I LCW, type II LCWs were also usedwhich are not gas permeable. These were made of fused-silica,coated externally with ±15 µm Teflon AF2400 (ID, 100 µm; OD,363 µm), obtained from CM Scientific Ltd (Silsden, UnitedKingdom). The type II LCW was fitted with two chromato-graphic finger-tight fittings using micro sleeves to preventleaking.
Transmitted light was collected by use of an optical fibre atthe other end of the cell that was connected to an SR-163 spec-trograph equipped with a DV420A CCD camera, both fromAndor Technologies (Belfast, UK). The distance of the opticalfibre from the cell could be varied to either increase ordecrease the intensity of the measured signal. Generally, a 1%transmission filter was placed in between the end of the LIDcell and the optical fibre to reduce the signal and to avoid over-loading the detector response. The spectrograph was equippedwith a grating of 600 lines per mm blazed at 300 nm, a lightentrance slit with adjustable width, and a back illuminatedCCD chip of 256 × 1024 pixels with a pixel size of 26 µm2 fordetection of the dispersed transmitted light. The spectralrange covered by the CCD camera in non-scanning mode wasabout 263 nm and was calibrated using a Hg calibration lamp.The CCD chip was cooled at −60 °C. Unless stated differently,detection settings used for transmission measurements were:slit width, 10 µm; exposure time, 0.1 s; vertical shift speed,8.25 µs; horizontal read-out, 33 kHz at 16-bit. Acquired spectrawere collected using the Full Vertical Binning mode and werebackground corrected in the case of absorption measure-ments. Data acquisition was performed using Solis softwarefrom Andor Technologies.
2.3 Injection/filling
The LID cells were filled and flushed with solvent by means ofa K-500 solvent pump (Knauer, Berlin, Germany) at a flow rateof 200 µL min−1. The pump was connected to one of the sideinlets of the first coupling piece, unless specified otherwise.Samples of EY and CV were directly introduced using asyringe, which was connected to the second inlet, while thesolvent pump was turned off. The cell was cleaned in betweensamples by flushing with 300 µL of MeOH followed by 300 µLof MQ using the solvent pump.
2.4 LC system
In order to prepare the LC eluent, a buffer was made byadding FA and NaOH to 1 L of MQ at a final concentration of0.1 M and 0.02 M respectively, to obtain a pH of 3. The eluentwas prepared by mixing buffer and MeOH in ratios of 95/5 [v/v]respectively for mobile phase A, and 5/95 [v/v] for B. TEA wasadded as an ion pairing agent to both A and B at a final con-centration of 5 mM. All analyses were carried out on an Agilent1100 series LC system equipped with a quaternary solventdelivery system, a column oven, an autosampler and a photo-diode array detector (PDA). A ZORBAX Eclipse RRHD C18column (2.1 × 150 mm; particle size, 1.8 µm) and a securityguard column (2.1 × 5 mm) containing the same C18 packingwere both obtained from Agilent. Gradient elution was per-formed going linearly from 5% to 95% B in 10 min. After5 min at 95% B, the mobile phase changed back to 5%B. Including 15 min of equilibration time, the total analysistime was 30 min. The flow rate was set at 150 µL min−1 andthe column oven at 40 °C. Spectral data were recorded from250 to 800 nm with a resolution of 1.0 nm, a sampling rate of144 Hz, and analysis monitoring was set at detection the wave-lengths 254, 400, 515, 550, and 595 nm. The equipment wascontrolled by ChemStation Chromatography Data Softwarefrom Agilent.
3. Results & discussion
The performance of the LCW is first characterized with respectto parameters affecting its transmittance. We then evaluate thephoton flux and gas permeability of the Teflon AF2400 LCW.Finally, we demonstrate the applicability of the LCW in aproof-of-concept experiment studying the light-induced degra-dation of EY and CV.
3.1 LCW transmittance
The light transmittance of the LCW inside the LID cell is acritical property: it determines both the photodegradation rateas well as the detection limit when used in combination withspectroscopy. Preferably, light losses should be minimized toachieve a consistent illumination of the entire solution.Transmittance of the LCW can be dependent on, or influencedby several parameters, such as length of the LCW, concen-tration and molar absorption coefficient of the sample com-ponents, scattering losses inside the LCW, pressure applied on
Analyst Paper
This journal is © The Royal Society of Chemistry 2021 Analyst, 2021, 146, 3197–3207 | 3199
Ope
n A
cces
s A
rtic
le. P
ublis
hed
on 0
7 A
pril
2021
. Dow
nloa
ded
on 1
/20/
2022
6:5
8:15
AM
. T
his
artic
le is
lice
nsed
und
er a
Cre
ativ
e C
omm
ons
Attr
ibut
ion-
Non
Com
mer
cial
3.0
Unp
orte
d L
icen
ce.
View Article Online

the LCW, and temperature. Furthermore, it has recently beenreported that when transmittance is sufficient, small internalLCW diameters (<1 mm) allow higher and a more homo-geneous irradiance resulting in shorter reaction times ofphotochemical reactions.35 For this study we used LCWs withan ID of 800 µm and the effects of the above-mentioned para-meters were studied.
3.1.1 Length of LCW. The use of an LCW as LID cell allowsexposure of the entire sample and the increased optical pathlength results in a higher overall absorbance, enhancingphotodegradation efficiency.31 However, the length of the LCWshould be chosen carefully, as light transmittance is expectedto decrease exponentially with the optical path length when anabsorbing compound is present. Overall absorbance shouldnot be too high, as light should still reach the detector toobtain spectral information and molecules at the end of theLCW should still be exposed sufficiently.
The influence of the cell length was tested by fabricatingfour LID cells using type I LCWs of 12 cm (cell volume∼60 µL), 20 cm (∼100 µL), 40 cm (∼200 µL) and 60 cm(∼300 µL) long.
These were filled with water and the intensity of the trans-mitted light was measured for each cell at different wave-lengths using specific bandpass filters. The intensities fol-lowed from power measurements in triplicate (each time afterrealignment, RSD <9%), where the sensor of the power meterwas positioned at the excitation fibre outlet or at the exit of theLCW filled with MQ. The light transmittance was calculated bycomparing the intensity at the end of the LCW (I) with theintensity at the exit of the excitation fibre (I0). Fig. 2 shows theaverage (n = 3) transmittance of the four LCWs at differentwavelengths, normalized to the highest transmittance valuemeasured for the 12 cm LCW at 630 nm. Fig. 2a shows that the
transmittance decreases significantly with increasing length.Light losses are most probably due to reflection losses causedby pores and imperfections in the Teflon capillary surface, asalso indicated by Altkorn et al.31 The number of reflectionsincreases with the length of the capillary, causing more lightto be lost. Apparently, this effect is strongest in the first part ofthe LCW; the difference between LCWs of 40 and 60 cm wasfound to be negligible in our experiment.
The light absorbance by a compound inside the cell is apoint of consideration. Increased analytical sensitivity due to along optical path length might be beneficial, however, fromthe viewpoint of analyte degradation, the formation of a stronglight-intensity gradient inside the LID cell is not favoured.Therefore, for LID studies of samples showing significant lightabsorbance at the applied wavelength, medium-lengthLCWs are preferred over very long ones. Another reason tolimit the length of the LCWs, is to increase compatibility withLC. LCW volumes larger than LC peak volumes would causeloss of LC resolution when using the cell in a post-columnsetup.
3.1.2 Wavelength of light. The LID cell should ideallyprovide adequate light transmittance over a broad wavelengthrange. Its wavelength dependency was tested by measuring thelight transmittance of an LCW filled with MQ using bandpassfilters of 450, 500, 532, 580 and 633 nm (nominal values)(Fig. 2b). The LCW can be used over this entire range, but thetransmittance increases with increasing wavelength. The poro-sity and imperfections of the polymer surface might causelight losses by scattering, which will be stronger for photons ofshorter wavelength. The observed wavelength dependencies ofthe light transmittance, although not very large, should beconsidered when using polychromatic light sources forphotodegradation.
Fig. 2 (a) The relative transmittance for light of 450 nm as function of LCW length calculated by comparing the transmitted (I) with the input power(I0); (b) the relative transmittance for light of different wavelengths using LCW lengths of 12, 20, 40 and 60 cm.
Paper Analyst
3200 | Analyst, 2021, 146, 3197–3207 This journal is © The Royal Society of Chemistry 2021
Ope
n A
cces
s A
rtic
le. P
ublis
hed
on 0
7 A
pril
2021
. Dow
nloa
ded
on 1
/20/
2022
6:5
8:15
AM
. T
his
artic
le is
lice
nsed
und
er a
Cre
ativ
e C
omm
ons
Attr
ibut
ion-
Non
Com
mer
cial
3.0
Unp
orte
d L
icen
ce.
View Article Online
3.1.3 Variation due to filling procedure. The performanceof Teflon AF2400 cells, e.g. for absorbance spectroscopy, mightbe sensitive to changes in liquid pressure caused by solventinjection or filling of the cell.36 Therefore, the light throughputof the LID cell was measured after filling a type I LCW in tripli-cate using an HPLC pump at flow rates of 50, 100, 150, 200and 250 µL min−1. The average transmitted light intensitieswith corresponding spread (standard error) are shown inFig. B.1 (left) in the ESI.† The average measured intensities atthe applied flow rates did not differ significantly. The standarderror, however, decreased going from 50 up to 200 µL min−1,but increased again at 250 µL min−1. It is hypothesized thatflow rate and pressure may affect to what extent the liquidpenetrates air-filled pores in the Teflon material and thiswould affect the TIR properties of the LCW.37 We also observedthat filling the LCW manually by syringe results in variabilityof the transmittance, which is most likely caused by irregulari-ties in the applied pressure. When the same experiment wasperformed using a type II LCW, the effect of different flowrates on transmittance and spread was negligible (Fig. B.1,†right). Therefore, we conclude that the porous Teflon AF wallis more susceptible to pressure fluctuations and that it isimportant to choose a well-reproducible filling or injectionmethod using a stable pump which transfers the sample fromthe autosampler to the LID cell.
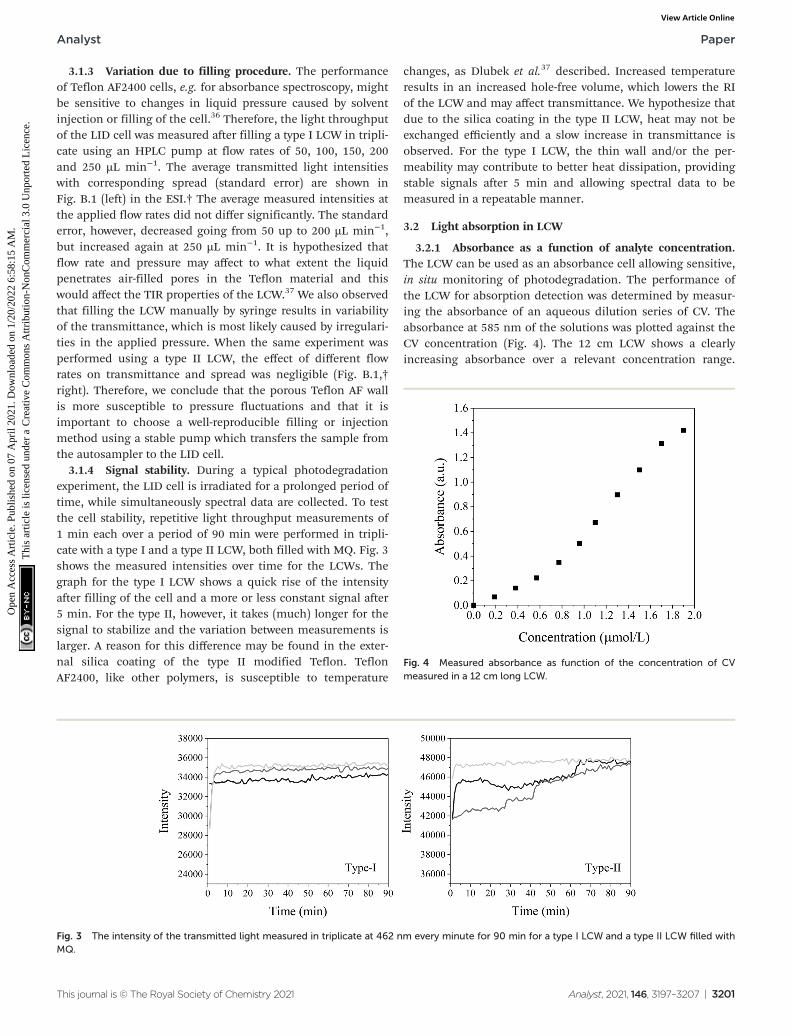
3.1.4 Signal stability. During a typical photodegradationexperiment, the LID cell is irradiated for a prolonged period oftime, while simultaneously spectral data are collected. To testthe cell stability, repetitive light throughput measurements of1 min each over a period of 90 min were performed in tripli-cate with a type I and a type II LCW, both filled with MQ. Fig. 3shows the measured intensities over time for the LCWs. Thegraph for the type I LCW shows a quick rise of the intensityafter filling of the cell and a more or less constant signal after5 min. For the type II, however, it takes (much) longer for thesignal to stabilize and the variation between measurements islarger. A reason for this difference may be found in the exter-nal silica coating of the type II modified Teflon. TeflonAF2400, like other polymers, is susceptible to temperature
changes, as Dlubek et al.37 described. Increased temperatureresults in an increased hole-free volume, which lowers the RIof the LCW and may affect transmittance. We hypothesize thatdue to the silica coating in the type II LCW, heat may not beexchanged efficiently and a slow increase in transmittance isobserved. For the type I LCW, the thin wall and/or the per-meability may contribute to better heat dissipation, providingstable signals after 5 min and allowing spectral data to bemeasured in a repeatable manner.
3.2 Light absorption in LCW
3.2.1 Absorbance as a function of analyte concentration.The LCW can be used as an absorbance cell allowing sensitive,in situ monitoring of photodegradation. The performance ofthe LCW for absorption detection was determined by measur-ing the absorbance of an aqueous dilution series of CV. Theabsorbance at 585 nm of the solutions was plotted against theCV concentration (Fig. 4). The 12 cm LCW shows a clearlyincreasing absorbance over a relevant concentration range.
Fig. 3 The intensity of the transmitted light measured in triplicate at 462 nm every minute for 90 min for a type I LCW and a type II LCW filled withMQ.
Fig. 4 Measured absorbance as function of the concentration of CVmeasured in a 12 cm long LCW.
Analyst Paper
This journal is © The Royal Society of Chemistry 2021 Analyst, 2021, 146, 3197–3207 | 3201
Ope
n A
cces
s A
rtic
le. P
ublis
hed
on 0
7 A
pril
2021
. Dow
nloa
ded
on 1
/20/
2022
6:5
8:15
AM
. T
his
artic
le is
lice
nsed
und
er a
Cre
ativ
e C
omm
ons
Attr
ibut
ion-
Non
Com
mer
cial
3.0
Unp
orte
d L
icen
ce.
View Article Online

Although not perfectly linear, the observed relation will enableus to correlate absorbance changes to changes in molecularcomposition of the sample due to photodegradation. Notably,the design of the LCW LID cell is very suitable for measuringlow concentrations, for instance after sample pre-separationwith LC, where the concentration of minor components can berather low.
3.2.2 Photon flux in LCW determined by actinometry. Inorder to assess photodegradation processes, the photon flux(photons/sec) inside the LID cell should be known. This wasdetermined using a chemical actinometer: a compound thatundergoes a light-induced reaction for which the quantumyield (Q) is known. The actinometer of choice was DAE, a diary-lethene derivate known for its photoisomerization reaction.The colour change of DAE between violet and colourless is aresult of a ring-closing and -opening reaction, which takesplace upon irradiation with either UV or Vis light and is revers-ible up to 3000 times (Fig. C.1†).38–40 This compound isespecially suitable as an actinometer in closed systems, suchas the LID cell, as the change in the absorption spectrum canbe measured in real-time, so that sampling of the solution isnot required. Furthermore, in contrast to e.g., ferrioxalateactinometers, DEA remains in solution throughout the reac-tion, making it compatible in combination with microchan-nels, such as the LCW.
A 20 cm LCW was filled with a solution of DAE in hexaneand was irradiated with the Xenon lamp. Since this is a poly-chromatic light source, an equilibrium between the open andclosed form will be reached after a certain period of time.Therefore, a UV shortpass filter (<350 nm) was used to turnDAE into the violet closed form (DAE-c), and a bandpass filterof (nominal value) 580 nm was used to allow DAE to turn intothe colourless open form (DAE-o). This wavelength was chosenbecause it is close to the absorption maximum of DAE-c. Theactual maximum transmitted wavelength of the bandpass filterwas determined to be 578 nm and was taken into account.Calculations and technical aspects regarding the measuredphoton flux are further elaborated in the ESI.†
Fig. 5 shows the decrease in absorbance in real-time for thereaction from DAE-c to DAE-o at 578 nm. The linear part of thedecrease in absorption was plotted and used to calculate theaverage rate of the conversion. From this, the photon flux at578 nm was calculated. This was compared to the flux calcu-lated from power measurements, obtained by placing thepower meter behind the end of the LID cell filled with water.Using actinometry, a photon flux of 10.3 × 10¹² photons per swas calculated, compared to 9.49 × 10¹² photons per sobtained from power measurements. The similarity betweenthe obtained results with both methods indicate that thepower measurements are a good estimate of the photon fluxpassing the LCW. However, the power meter measures thenumber of photons reaching the end of the LID cell, whereasthe actinometer measures the effective intensity inside theLCW. Therefore, we presume that the DAE actinometer gives abetter representation of the real photon flux inside the LIDcell.
3.3 Gas diffusion through LCW wall
Oxygen gas plays an important role in many photodegradationreactions. The Teflon AF LCW comprises a gas permeable wall,which offers the possibility to influence the photodegradationprocess by adding or removing oxygen gas to or from theexposed solution. Oxygen diffusion was tested by using methyl-ene blue (MB) as an indicator for oxygen. The LID cell wasfilled with an aqueous solution of MB, glucose and sodiumhydroxide. In the presence of oxygen, MB is oxidized and thesolution will turn blue, resulting in absorption of visible lightby MB. When oxygen is removed or consumed, MB will bereduced by the sodium hydroxide and the solution turns col-ourless, resulting in a reduced visible absorbance. The deco-lourization reaction of MB by oxygen was recorded in real-timeby measuring the transmitted light intensity of the LCW at theabsorption maximum of MB (668 nm).
Fig. 6 shows the LCW light transmittance in real-time(yellow curve) while the outer tubing of the LID cell, whichinitially contained air, was flushed with nitrogen gas. During
Fig. 5 Actinometry of the LCW. (a) Measured change in absorbance in real-time during the isomerization reaction of DAE-c to DAE-o at 578 nminside a 20 cm long LID cell. (b) Linear part of the decrease in absorbance is plotted; slope was used to determine the photon flux (ESI†).
Paper Analyst
3202 | Analyst, 2021, 146, 3197–3207 This journal is © The Royal Society of Chemistry 2021
Ope
n A
cces
s A
rtic
le. P
ublis
hed
on 0
7 A
pril
2021
. Dow
nloa
ded
on 1
/20/
2022
6:5
8:15
AM
. T
his
artic
le is
lice
nsed
und
er a
Cre
ativ
e C
omm
ons
Attr
ibut
ion-
Non
Com
mer
cial
3.0
Unp
orte
d L
icen
ce.
View Article Online
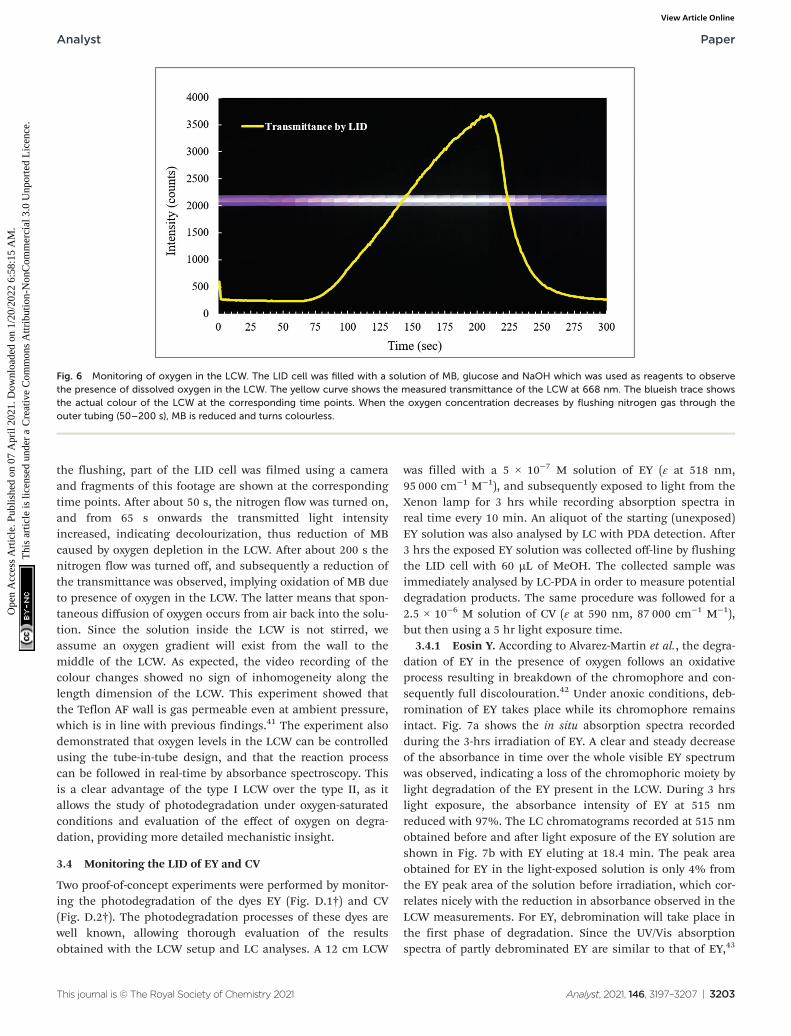
the flushing, part of the LID cell was filmed using a cameraand fragments of this footage are shown at the correspondingtime points. After about 50 s, the nitrogen flow was turned on,and from 65 s onwards the transmitted light intensityincreased, indicating decolourization, thus reduction of MBcaused by oxygen depletion in the LCW. After about 200 s thenitrogen flow was turned off, and subsequently a reduction ofthe transmittance was observed, implying oxidation of MB dueto presence of oxygen in the LCW. The latter means that spon-taneous diffusion of oxygen occurs from air back into the solu-tion. Since the solution inside the LCW is not stirred, weassume an oxygen gradient will exist from the wall to themiddle of the LCW. As expected, the video recording of thecolour changes showed no sign of inhomogeneity along thelength dimension of the LCW. This experiment showed thatthe Teflon AF wall is gas permeable even at ambient pressure,which is in line with previous findings.41 The experiment alsodemonstrated that oxygen levels in the LCW can be controlledusing the tube-in-tube design, and that the reaction processcan be followed in real-time by absorbance spectroscopy. Thisis a clear advantage of the type I LCW over the type II, as itallows the study of photodegradation under oxygen-saturatedconditions and evaluation of the effect of oxygen on degra-dation, providing more detailed mechanistic insight.
3.4 Monitoring the LID of EY and CV
Two proof-of-concept experiments were performed by monitor-ing the photodegradation of the dyes EY (Fig. D.1†) and CV(Fig. D.2†). The photodegradation processes of these dyes arewell known, allowing thorough evaluation of the resultsobtained with the LCW setup and LC analyses. A 12 cm LCW
was filled with a 5 × 10⁻⁷ M solution of EY (ε at 518 nm,95 000 cm−1 M−1), and subsequently exposed to light from theXenon lamp for 3 hrs while recording absorption spectra inreal time every 10 min. An aliquot of the starting (unexposed)EY solution was also analysed by LC with PDA detection. After3 hrs the exposed EY solution was collected off-line by flushingthe LID cell with 60 µL of MeOH. The collected sample wasimmediately analysed by LC-PDA in order to measure potentialdegradation products. The same procedure was followed for a2.5 × 10−6 M solution of CV (ε at 590 nm, 87 000 cm−1 M−1),but then using a 5 hr light exposure time.
3.4.1 Eosin Y. According to Alvarez-Martin et al., the degra-dation of EY in the presence of oxygen follows an oxidativeprocess resulting in breakdown of the chromophore and con-sequently full discolouration.42 Under anoxic conditions, deb-romination of EY takes place while its chromophore remainsintact. Fig. 7a shows the in situ absorption spectra recordedduring the 3-hrs irradiation of EY. A clear and steady decreaseof the absorbance in time over the whole visible EY spectrumwas observed, indicating a loss of the chromophoric moiety bylight degradation of the EY present in the LCW. During 3 hrslight exposure, the absorbance intensity of EY at 515 nmreduced with 97%. The LC chromatograms recorded at 515 nmobtained before and after light exposure of the EY solution areshown in Fig. 7b with EY eluting at 18.4 min. The peak areaobtained for EY in the light-exposed solution is only 4% fromthe EY peak area of the solution before irradiation, which cor-relates nicely with the reduction in absorbance observed in theLCW measurements. For EY, debromination will take place inthe first phase of degradation. Since the UV/Vis absorptionspectra of partly debrominated EY are similar to that of EY,43
Fig. 6 Monitoring of oxygen in the LCW. The LID cell was filled with a solution of MB, glucose and NaOH which was used as reagents to observethe presence of dissolved oxygen in the LCW. The yellow curve shows the measured transmittance of the LCW at 668 nm. The blueish trace showsthe actual colour of the LCW at the corresponding time points. When the oxygen concentration decreases by flushing nitrogen gas through theouter tubing (50–200 s), MB is reduced and turns colourless.
Analyst Paper
This journal is © The Royal Society of Chemistry 2021 Analyst, 2021, 146, 3197–3207 | 3203
Ope
n A
cces
s A
rtic
le. P
ublis
hed
on 0
7 A
pril
2021
. Dow
nloa
ded
on 1
/20/
2022
6:5
8:15
AM
. T
his
artic
le is
lice
nsed
und
er a
Cre
ativ
e C
omm
ons
Attr
ibut
ion-
Non
Com
mer
cial
3.0
Unp
orte
d L
icen
ce.
View Article Online
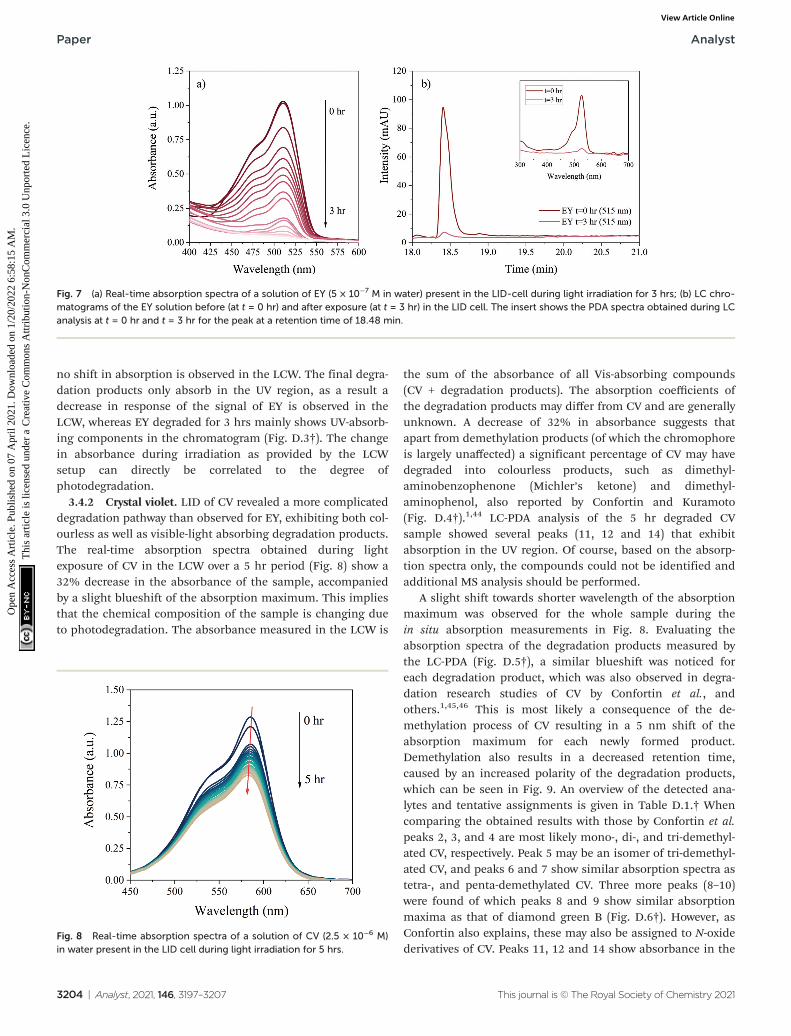
no shift in absorption is observed in the LCW. The final degra-dation products only absorb in the UV region, as a result adecrease in response of the signal of EY is observed in theLCW, whereas EY degraded for 3 hrs mainly shows UV-absorb-ing components in the chromatogram (Fig. D.3†). The changein absorbance during irradiation as provided by the LCWsetup can directly be correlated to the degree ofphotodegradation.
3.4.2 Crystal violet. LID of CV revealed a more complicateddegradation pathway than observed for EY, exhibiting both col-ourless as well as visible-light absorbing degradation products.The real-time absorption spectra obtained during lightexposure of CV in the LCW over a 5 hr period (Fig. 8) show a32% decrease in the absorbance of the sample, accompaniedby a slight blueshift of the absorption maximum. This impliesthat the chemical composition of the sample is changing dueto photodegradation. The absorbance measured in the LCW is
the sum of the absorbance of all Vis-absorbing compounds(CV + degradation products). The absorption coefficients ofthe degradation products may differ from CV and are generallyunknown. A decrease of 32% in absorbance suggests thatapart from demethylation products (of which the chromophoreis largely unaffected) a significant percentage of CV may havedegraded into colourless products, such as dimethyl-aminobenzophenone (Michler’s ketone) and dimethyl-aminophenol, also reported by Confortin and Kuramoto(Fig. D.4†).1,44 LC-PDA analysis of the 5 hr degraded CVsample showed several peaks (11, 12 and 14) that exhibitabsorption in the UV region. Of course, based on the absorp-tion spectra only, the compounds could not be identified andadditional MS analysis should be performed.
A slight shift towards shorter wavelength of the absorptionmaximum was observed for the whole sample during thein situ absorption measurements in Fig. 8. Evaluating theabsorption spectra of the degradation products measured bythe LC-PDA (Fig. D.5†), a similar blueshift was noticed foreach degradation product, which was also observed in degra-dation research studies of CV by Confortin et al., andothers.1,45,46 This is most likely a consequence of the de-methylation process of CV resulting in a 5 nm shift of theabsorption maximum for each newly formed product.Demethylation also results in a decreased retention time,caused by an increased polarity of the degradation products,which can be seen in Fig. 9. An overview of the detected ana-lytes and tentative assignments is given in Table D.1.† Whencomparing the obtained results with those by Confortin et al.peaks 2, 3, and 4 are most likely mono-, di-, and tri-demethyl-ated CV, respectively. Peak 5 may be an isomer of tri-demethyl-ated CV, and peaks 6 and 7 show similar absorption spectra astetra-, and penta-demethylated CV. Three more peaks (8–10)were found of which peaks 8 and 9 show similar absorptionmaxima as that of diamond green B (Fig. D.6†). However, asConfortin also explains, these may also be assigned to N-oxidederivatives of CV. Peaks 11, 12 and 14 show absorbance in the
Fig. 7 (a) Real-time absorption spectra of a solution of EY (5 × 10⁻⁷ M in water) present in the LID-cell during light irradiation for 3 hrs; (b) LC chro-matograms of the EY solution before (at t = 0 hr) and after exposure (at t = 3 hr) in the LID cell. The insert shows the PDA spectra obtained during LCanalysis at t = 0 hr and t = 3 hr for the peak at a retention time of 18.48 min.
Fig. 8 Real-time absorption spectra of a solution of CV (2.5 × 10⁻⁶ M)in water present in the LID cell during light irradiation for 5 hrs.
Paper Analyst
3204 | Analyst, 2021, 146, 3197–3207 This journal is © The Royal Society of Chemistry 2021
Ope
n A
cces
s A
rtic
le. P
ublis
hed
on 0
7 A
pril
2021
. Dow
nloa
ded
on 1
/20/
2022
6:5
8:15
AM
. T
his
artic
le is
lice
nsed
und
er a
Cre
ativ
e C
omm
ons
Attr
ibut
ion-
Non
Com
mer
cial
3.0
Unp
orte
d L
icen
ce.
View Article Online

UV, but remain unidentified as the concentration was too lowto obtain well defined absorption spectra and are therefore notshown. Peak 13, however, showed an absorption maximum of546 nm, which is similar to that of pararosaniline, which iscompletely demethylated CV. This was later confirmed by theanalysis of a pararosaniline standard. The relative peakareas (derived from the LC-PDA signals) of CV and its degra-dation products, before and after irradiation, are shown inFig. 10.
To make final conclusions about the identity of the above-mentioned peaks, additional MS analyses should be per-
formed. However, the most important result shown here isthat a >30% reduction of the main component CV wasobtained after 5 hrs of degradation. Weyermann andConfortin, who performed off-line degradation of CV in solu-tion, reported near complete degradation after 25 and 115 hrs,respectively.1,45 For simple degradation processes, such as forEY, the decrease in absorbance is a straightforward measurefor the degradation rate. For compounds like CV, however, forwhich the degradation products also absorb in the same wave-length range as the parent compound, it is slightly more com-plicated to use the absorbance for this purpose.
Fig. 9 Normalized LC-PDA chromatograms (at 595 nm) of the CV solution before (at t = 0 hr) and after exposure (at t = 5 hr) in the LID cell. Theinsert shows a zoom of the chromatogram obtained at t = 5 hr revealing the peaks of degradation products (2–13).
Fig. 10 Relative peak areas of CV and degradation products obtained by LC-PDA before (0 hr) and after (5 hr) exposure in the LID-cell. Peak areasare extracted at 595 or 254 nm (*) if absorbance was in the UV.
Analyst Paper
This journal is © The Royal Society of Chemistry 2021 Analyst, 2021, 146, 3197–3207 | 3205
Ope
n A
cces
s A
rtic
le. P
ublis
hed
on 0
7 A
pril
2021
. Dow
nloa
ded
on 1
/20/
2022
6:5
8:15
AM
. T
his
artic
le is
lice
nsed
und
er a
Cre
ativ
e C
omm
ons
Attr
ibut
ion-
Non
Com
mer
cial
3.0
Unp
orte
d L
icen
ce.
View Article Online

4. Conclusions
This study has shown that it is possible to initiate photodegra-dation of EY and CV while collecting real-time spectral datausing an LID cell based on an LCW made of Teflon AF2400.The LCW is an efficient tool for illumination of the wholesample and is able to guide the light towards a detector. Theresults from the degradation experiments showed that real-time absorbance spectroscopy is useful for acquiring infor-mation on the stage of degradation. Changes in the shape ofthe absorption spectrum as well as the absorbance intensityare indicative for the extent of degradation. The results of thephotodegradation of EY and CV are in line with previousstudies, and the high photodegradation rate compared to con-ventional ‘in-beaker’ degradations looks promising.1,42,45,46
Clearly, the potential for on-line coupling of the cell to LC forfurther characterization of the degradants, comes as an advan-tage here.
There is also room for improvement. The speed of photode-gradation could be enhanced by improving the efficiency oflight coupling into the cell, and automation of the injectionsystem may result in more reproducible spectral data as vari-ation in applied pressure is reduced. The long path length ofthe LCW is beneficial for (diluted) samples with low absor-bances. The transmittance by the LCW, however, decreaseswith the length of the capillary, caused by pores and imperfec-tions in the material. As a result, the intensity of the lightinside the LCW also decreases with length. Therefore, for LIDstudies, medium-length LCW are preferred over very long onesto prevent the formation of a strong light-intensity gradientinside the LID cell.
Author contributions
I. Groeneveld: conceptualization, methodology, investigation,resources, writing – original draft and editing; SuzanE. Schoemaker: methodology, investigation; GovertW. Somsen: writing – review and editing, supervision; FreekAriese: writing – review and editing, supervision; MaartenR. Van Bommel: writing – review and editing, fundingacquisition.
Conflicts of interest
The authors declare that there is no conflict of interests.
Acknowledgements
We thank the Precision Mechanics and Engineering group atthe Vrije Universiteit Amsterdam, and Dick van Iperen in par-ticular, for the close collaboration towards designing andbuilding the LID cells. This work is part of the TooCOLDproject (Toolbox for studying the Chemistry of Light-inducedDegradation; project number 15506) carried out in the TTW
Open Technology Programme and is (partly) financed by theNetherlands Research Council (NWO).
References
1 D. Confortin, H. Neevel, M. Brustolon, L. Franco,A. J. Kettelarij, R. M. Williams and M. R. Van Bommel,J. Phys. Conf. Ser., 2010, 231, 1–9.
2 M. J. Toohey and L. N. Bell, J. Food Process. Preserv., 2019,43, 1–5.
3 P. I. Hora, P. J. Novak and W. A. Arnold, Environ. Sci. WaterRes., 2019, 5, 897–909.
4 M. Shamsipur, B. Hemmateenejad, N. J. Jahani andK. M. Majd, J. Photochem. Photobiol., A, 2015, 299,62–68.
5 V. G. Bório, A. U. Fernandes and L. Silveira, Instrum. Sci.Technol., 2016, 44, 189–198.
6 R. Salgado, V. J. Pereira, G. Carvalho, R. Soeiro, V. Gaffney,C. Almeida, V. V. Cardoso, E. Ferreira, M. J. Benoliel,T. A. Ternes, A. Oehmen, M. A. M. Reis and J. P. Noronha,J. Hazard. Mater., 2013, 244–245, 516–527.
7 A. Y. C. Lin and M. Reinhard, Environ. Toxicol. Chem., 2005,24, 1303–1309.
8 A. Y. C. Lin, X. H. Wang and W. N. Lee, Environ. Sci.Technol., 2013, 47, 4104–4112.
9 F. Gosetti, M. Bottaro, V. Gianotti, E. Mazzucco,P. Frascarolo, D. Zampieri, C. Oliveri, A. Viarengo andM. C. Gennaro, Environ. Pollut., 2010, 158, 592–598.
10 A. Kiss, S. Rapi and C. Csutorás, Microchem. J., 2007, 85,13–20.
11 K. Sivagami, R. R. Krishna and T. Swaminathan, Sol.Energy, 2014, 103, 488–493.
12 V. T. Trang, Y. Kurogi, S. Katsuno, T. Shimamura andH. Ukeda, Int. Dairy J., 2008, 18, 344–348.
13 G. J. M. Fechine, P. A. Christensen, T. A. Egerton andJ. R. White, Polym. Degrad. Stab., 2009, 94, 234–239.
14 E. Yousif, N. Salih and J. Salimon, J. Appl. Polym. Sci., 2011,120, 2207–2214.
15 D. A. Volmer, J. Chromatogr. A, 1998, 794, 129–146.16 P. J. Harman, G. L. Blackman and G. Phillipou,
J. Chromatogr. B: Biomed. Sci. Appl., 1981, 225, 131–138.17 S. X. Peng and S. M. Dansereau, J. Chromatogr. A, 2001,
914, 105–110.18 T. Pérez-Ruiz, C. Martínez-Lozano and M. D. García-
Martínez, J. Pharm. Biomed. Anal., 2009, 50, 315–319.19 A. F. Kadjo, P. K. Dasgupta and C. P. Shelor, Anal. Chem.,
2020, 92, 6391–6400.20 L. Ganranoo, S. K. Mishra, A. K. Azad, A. Shigihara,
P. K. Dasgupta, Z. S. Breitbach, D. W. Armstrong,K. Grudpan and B. Rappenglueck, Anal. Chem., 2010, 82,5838–5843.
21 D. Kottke, B. B. Burckhardt, J. Breitkreutz and B. Fischer,Talanta, 2021, 226, DOI: 10.1016/j.talanta.2021.122145.
22 K. Bescherer, J. A. Barnes and H. P. Loock, Anal. Chem.,2013, 85, 4328–4334.
Paper Analyst
3206 | Analyst, 2021, 146, 3197–3207 This journal is © The Royal Society of Chemistry 2021
Ope
n A
cces
s A
rtic
le. P
ublis
hed
on 0
7 A
pril
2021
. Dow
nloa
ded
on 1
/20/
2022
6:5
8:15
AM
. T
his
artic
le is
lice
nsed
und
er a
Cre
ativ
e C
omm
ons
Attr
ibut
ion-
Non
Com
mer
cial
3.0
Unp
orte
d L
icen
ce.
View Article Online

23 T. Rubles, D. Paige and C. Anastasio, Rev. Sci. Instrum.,2006, 77, 1–4.
24 Z. Liu and J. Pawliszyn, Anal. Chem., 2003, 75, 4887–4894.25 A. Datta, I. Y. Eom, A. Dhar, P. Kuban, R. Manor, I. Ahmad,
S. Gangopadhyay, T. Dallas, M. Holtz, H. Temkin andP. K. Dasgupta, IEEE Sens. J., 2003, 3, 788–795.
26 K. Flavin, H. Hughes and P. McLoughlin, Int. J. Environ.Anal. Chem., 2007, 87, 29–42.
27 B. J. Marquardt, P. G. Vahey, R. E. Synovec andL. W. Urgess, Anal. Chem., 1999, 71, 4808–4814.
28 S. Tanikkul, J. Jakmunee, M. Rayanakorn, K. Grudpan,B. J. Marquardt, G. M. Gross, B. J. Prazen, L. W. Burgess,G. D. Christian and R. E. Synovec, Talanta, 2003, 59, 809–816.
29 R. J. Dijkstra, A. N. Bader, G. P. Hoornweg,U. A. T. Brinkman and C. Gooijer, Anal. Chem., 1999, 71,4575–4579.
30 Y. Tian, L. Zhang, J. Zuo, Z. Li, S. Gao and G. Lu, Anal.Chim. Acta, 2007, 581, 154–158.
31 R. Altkorn, I. Koev and M. J. Pelletier, Appl. Spectrosc., 1999,53, 1169–1176.
32 R. Altkorn, I. Koev, R. P. Van Duyne and M. Litorja, Appl.Opt., 1997, 36, 8992–8998.
33 M. Brzozowski, M. O’Brien, S. V. Ley and A. Polyzos, Acc.Chem. Res., 2015, 48, 349–362.
34 S. Ponce, H. Christians, A. Drochner and B. J. M. Etzold,Chem. Ing. Tech., 2018, 90, 1855–1863.
35 C. Sambiagio and T. Noël, Trends Chem., 2020, 2, 92–106.36 WPI, 4000 Series Liquid Waveguide Capillary Cell,
Instruction Manual, 2014.37 G. Dlubek, J. Pionteck, K. Rätzke, J. Kruse and F. Faupel,
Macromolecules, 2008, 41, 6125–6133.38 A. Roibu, S. Fransen, M. E. Leblebici, G. Meir, T. Van
Gerven and S. Kuhn, Sci. Rep., 2018, 8, 1–10.39 M. Irie, K. Sakemura, M. Okinaka and K. Uchida, J. Org.
Chem., 1995, 60, 8305–8309.40 T. Sumi, Y. Takagi, A. Yagi, M. Morimoto and M. Irie,
Chem. Commun., 2014, 50, 3928–3930.41 M. O’Brien, I. Baxendale and S. Ley, Synfacts, 2010, 2010,
1199–1199.42 A. Alvarez-Martin, S. Trashin, M. Cuykx, A. Covaci, K. De
Wael and K. Janssens, Dyes Pigm., 2017, 145, 376–384.43 B. W. J. Pirok, G. Moro, N. Meekel, S. V. J. Berbers,
P. J. Schoenmakers and M. R. van Bommel, J. Cult. Herit.,2019, 38, 29–36.
44 N. Kuramoto and T. Kitao, Dyes Pigm., 1982, 3, 49–58.45 C. Weyermann, D. Kirsch, C. Costa-Vera and B. Spengler,
J. Forensic Sci., 2009, 54, 339–345.46 G. Favaro, D. Confortin, P. Pastore and M. Brustolon,
J. Mass Spectrom., 2012, 47, 1660–1670.
Analyst Paper
This journal is © The Royal Society of Chemistry 2021 Analyst, 2021, 146, 3197–3207 | 3207
Ope
n A
cces
s A
rtic
le. P
ublis
hed
on 0
7 A
pril
2021
. Dow
nloa
ded
on 1
/20/
2022
6:5
8:15
AM
. T
his
artic
le is
lice
nsed
und
er a
Cre
ativ
e C
omm
ons
Attr
ibut
ion-
Non
Com
mer
cial
3.0
Unp
orte
d L
icen
ce.
View Article Online