characterization of agroforestry systems in the state of ... · characterization of agroforestry...
TRANSCRIPT

1
UNIVERSIDAD AUTÓNOMA DE SAN LUIS POTOSÍ
FACULTADES DE CIENCIAS QUÍMICAS, INGENIERÍA Y MEDICINA
PROGRAMAS MULTIDISCIPLINARIOS DE POSGRADO EN CIENCIAS AMBIENTALES
AND
COLOGNE UNIVERSITY OF APPLIED SCIENCES
INSTITUTE FOR TECHNOLOGY AND RESOURCES MANAGEMENT IN THE TROPICS AND SUBTROPICS
Characterization of Agroforestry Systems in the State of Rio de Janeiro, Brazil and their
Potential in the Carbon Market
THESIS TO OBTAIN THE DEGREE OF
MAESTRÍA EN CIENCIAS AMBIENTALES
DEGREE AWARDED BY
UNIVERSIDAD AUTÓNOMA DE SAN LUIS POTOSÍ
AND
MASTER OF SCIENCE
TECHNOLOGY AND RESOURCES MANAGEMENT IN THE TROPICS AND SUBTROPICS
IN THE SPECIALIZATION: RESOURCES MANAGEMENT
DEGREE AWARDED BY COLOGNE UNIVERSITY OF APPLIED SCIENCES
PRESENTS:
Carlos Matias Figueroa
CO-DIRECTOR OF THESIS PMPCA
Dr. Juan Antonio Reyes Agüero
CO-DIRECTOR OF THESIS ITT:
Dr. Sabine Schlüter
ASSESSOR:
Dr. Juan Carlos Torrico Albino
SAN LUIS POTOSÍ, MÉXICO FEBRUARY 2014

2
UNIVERSIDAD AUTÓNOMA DE SAN LUIS POTOSÍ
FACULTADES DE CIENCIAS QUÍMICAS, INGENIERÍA Y MEDICINA
PROGRAMAS MULTIDISCIPLINARIOS DE POSGRADO EN CIENCIAS AMBIENTALES
AND
COLOGNE UNIVERSITY OF APPLIED SCIENCES
INSTITUTE FOR TECHNOLOGY AND RESOURCES MANAGEMENT IN THE TROPICS AND SUBTROPICS
Characterization of Agroforestry Systems in the State of Rio de Janeiro, Brazil and their
Potential in the Carbon Market
THESIS TO OBTAIN THE DEGREE OF
MAESTRÍA EN CIENCIAS AMBIENTALES
DEGREE AWARDED BY
UNIVERSIDAD AUTÓNOMA DE SAN LUIS POTOSÍ
AND
MASTER OF SCIENCE
TECHNOLOGY AND RESOURCES MANAGEMENT IN THE TROPICS AND SUBTROPICS
IN THE SPECIALIZATION: RESOURCES MANAGEMENT
DEGREE AWARDED BY COLOGNE UNIVERSITY OF APPLIED SCIENCES
PRESENTS:
Carlos Matias Figueroa
DR. JUAN ANTONIO REYES AGÜERO
DR. SABINE SCHLÜTER
DR. JUAN CARLOS TORRICO ALBINO
SAN LUIS POTOSÍ, MÉXICO FEBRUARY 2014
3
PROYECTO REALIZADO EN:
PROGRAMA MULTIDISCIPLINARIO DE POSGRADO EN CIENCIAS AMBIENTALES
UNIVERSIDAD AUTÓNOMA DE SAN LUIS POTOSÍ
CON EL APOYO DE:
DEUTSCHER AKADEMISCHER AUSTAUSCH DIENST (DAAD)
CONSEJO NACIONAL DE CIENCIA Y TECNOLOGÍA (CONACYT)
EL MAESTRO EN CIENCIAS AMBIENTALES RECIBE APOYO A TRAVÉS DEL PROGRAMA NACIONAL DE
POSGRADOS (PNPC - CONACYT)
4
Erklärung / Declaración
Name / Nombre: Carlos Matías Figueroa
Matri.-Nr. / N° de matricula: 11090032 (CUAS)., 0123246 (UASLP)
Ich versichere wahrheitsgemäß, dass ich die vorliegende Masterarbeit selbstständig verfasst und
keine anderen als die von mir angegebenen Quellen und Hilfsmittel benutzt habe. Alle Stellen,
die wörtlich oder sinngemäß aus veröffentlichten und nicht veröffentlichten Schriften entnommen
sind, sind als solche kenntlich gemacht.
Aseguro que yo redacté la presente tesis de maestría independientemente y no use referencias ni
medios auxiliares a parte de los indicados. Todas las partes, que están referidas a escritos o a
textos publicados o no publicados son reconocidas como tales.
Die Arbeit ist in gleicher oder ähnlicher Form noch nicht als Prüfungsarbeit eingereicht worden.
Hasta la fecha, un trabajo como éste o similar no ha sido entregado como trabajo de tesis.
San Luis Potosí, den /el 10 de Febrero de 2014
Unterschrift / Firma: ______________
Ich erkläre mich mit einer späteren Veröffentlichung meiner Masterarbeit sowohl auszugsweise,
als auch Gesamtwerk in der Institutsreihe oder zu Darstellungszwecken im Rahmen der
Öffentlichkeitsarbeit des Institutes einverstanden.
Estoy de acuerdo con una publicación posterior de mi tesis de maestría en forma completa o
parcial por las instituciones con la intención de exponerlos en el contexto del trabajo
investigatición de las mismas.
Unterschrift / Firma: __________________

5
Acknowledgements
This thesis would not be posible without the support and laughter of Adriana Gonzalez, Andrea Giraldo,
Andrea Teran, Diana Isabel, Douglas Oswaldo, Paola Ordoñez and Viridiana Velazquez.
Thank you for all the help provided by the staff of the Superintendência de Desenvolvimento Sustentável
of the Secretaria de Agricultura of the State of Rio de Janeiro; especially Herval Lopez, Marcelo Costa and
Vera Camara. Also the help and kindness of Robertinho was most appreciated.
Lastly, but most important, this thesis could not be written without the infinite and selfless support of
my mom.

6
Index
Abstract 12
Introduction 16
2. Systems Thinking 19
3. Farming Systems as Socioecological Systems 22
4. Agroforestry Systems 26
5. Microwatershed Methodology 31
5.1. The Brazilian Experience 33
5.2. Rio Rural 34
6. Environmental Services 36
6.1. Carbon Sequestration 37
6.2. Payment for Environmental Services 39
6.3. Carbon Market 42
7. Paradigm Shift 48
8. Research Questions 50
9. Methodology 50
10. Study Area 53
11. Results 56
11.1. Overview 56
11.2. Potential of Agroforestry Systems in the Voluntary Carbon Market 61
12. Discussion 66
13. Conclusions 69
14. References 70
15. Annex 1 79
16. Annex 2 87

7
Index of Figures
Figure 1. Environmental Services Classification 36
Figure 2.Carbon Cycle 38
Figure 3. Terrestrial Carbon Sequestration 38
Figure 4. Environmental Services and their Potential Audience 41
Figure 5. Market Share by Buyer Type 44
Figure 6. Voluntary Carbon Markets Value Chain 45
Figure 7. Market Share by Project Category 46
Figure 8. Market Share by Project Standard 46
Figure 9. Localization of Araruama within the State of Rio de Janeiro, Brazil 54
Figure 10. Localization of the Piri-Piri microwatershed within the municipality of Araruama 55
Figure 11. Climograph of Araruama 55
Figure 12. Aerial view of the farm 58

8
Index of Tables
Table 1. Summary AFS results. 60
Table 2. Summary carbon potential. 65
Table 3. Carbon project description. 79
Table 4. Grassland baseline. 79
Table 5. Grassland results for baseline and potential scenarios. 79
Table 6. Livestock in grassland baseline. 80
Table 7. Nitrous Oxide emissions from manure management. 81
Table 8. Results from the livestock module. 82
Table 9. Agroforestry C-stock absorption coefficients and description. 83
Table 10. Mitigation potential results from the agroforestry system. 84
Table 11. Gross results from the agroforestry system in Araruama. 85
Table 12. Final balance from the agroforestry system in Araruama. 86
Table 13. Cost-benefit analysis for the carbon sequestration project. 87
Table 14. Cost-benefit analysis for the AFS. 87
Table 15. Cost-benefit analysis including carbon and AFS costs. 88

9
Acronyms and Abbreviations
A/R Afforestation and Reforestation
AFOLU Agriculture, Forestry and Land Use
AFS Agroforestry System
CAR Climate Action Reserve
CBA Cost Benefit Analysis
CCB Climate, Conservation and Biodiversity Standards
CCX Chicago Climate Exchange
CDM Clean Development Mechanism
CER Certified Emission Reduction
CLD Causal Loop Diagrams
DGH Deutsche Gesellschaft für Humanökologie
EIT Economy in Transition
EMATER Technical Assistance and Rural Extension Enterprise
EPA Environmental Protection Agency
ES Environmental Services
EX-ACT Ex-ante Appraisal Carbon- Balance Tool
GDP Gross Domestic Product
GEF Global Environment Facility
GHG Greenhouse Gas
GMO Genetically Modified Organism
GS Gold Standard
GST General Systems Theory
IFM Improved Forest Management
IPCC Intergovernmental Panel on Climate Change

10
IWM Integrated Watershed Management
MEA Millennium Ecosystem Assessment
NGO Non-governmental Organization
OTC Over the Counter
PES Payment for Environmental Services
SALM Sustainable Agricultural Land Management
SDS Superintendence of Sustainable Development
SES Socioecological System
UN United Nations
UNESCO United Nations Educational, Scientific and Cultural Organization
UNFCCCC United Nations Framework Convention on Climate Change
VCM Voluntary Carbon Market
VCS Verified Carbon Standard
VER Voluntary Emission Reduction

11

12
Abstract
Since the Portuguese colonization, 500 years ago, the state of Rio de Janeiro has been the motor of
Brazil´s development. Through different kinds of exploitation its natural resource base has been slowly
eroded. As a result the Atlantic Forest, one of the most diverse ecosystems in the planet, has shrunk to
7% of its original extension. To stop environmental degradation and restore it to previous states the
government of the state of Rio de Janeiro implemented the Rio Rural program to improve the quality of
life of rural population while stopping environmental degradation locally and globally. Rio Rural has
encouraged the adoption of farming systems more attuned with the original ecosystem, such as
agroforestry systems. Agroforestry systems have been established under technical assistance and
funding of the state of Rio de Janeiro but without understanding their full potential. Agroforestry
systems are input and labor intensive and demand technical support. The carbon market has been
proposed as a congruent alternative to finance farmers and to overcome barriers in the initial stages of
agroforestry systems. This study has as objective the characterization of such systems to examine their
potential in the voluntary carbon market as a way to dilute the barriers for their adoption,
implementation and long term sustainability.
.
Keywords: Rio de Janeiro, environmental degradation, land use, agroforestry systems, sustainability,
voluntary carbon market.

13
Resumen
Desde la colonización portuguesa, hace 500 años, el estado de Río de Janeiro ha sido el motor del
desarrollo de Brasil. A través de diferentes tipos de explotación su capital natural se ha erosionado
lentamente. Como resultado de la Mata Atlántica, uno de los ecosistemas más diversos del planeta, se
ha reducido a 7% de su extensión original. Para detener la degradación del medio ambiente el gobierno
de Río de Janeiro puso en práctica el programa Río Rural para mejorar la calidad de vida de la población
rural y simultáneamente detener la degradación ambiental local y mundial. Río Rural ha alentado la
adopción de sistemas agrícolas más en sintonía con el ecosistema original, tales como los sistemas
agroforestales. Los sistemas agroforestales se han establecido con la asistencia técnica y la financiación
del estado de Río de Janeiro, pero sin entender su potencial completamente. Los sistemas agroforestales
demandan insumos, mano de obra intensiva y el apoyo técnico de la demanda; por lo que sus altos
costos de implementación resultan poco atractivos para los agricultores. El mercado de carbono se ha
propuesto como una alternativa congruente para financiar a los agricultores y para superar las barreras
en las etapas iniciales de los sistemas agroforestales. Este estudio tiene como objetivo la caracterización
de este tipo de sistemas para examinar su potencial en el mercado voluntario de carbono como una
manera de diluir las barreras para su adopción, implementación y sostenibilidad a largo plazo.
.
Palabras clave: Río de Janeiro, degradación ambiental, uso de la tierra, sistemas agroforestales,
sustentabilidad, mercado voluntario de carbono.

14
Zusammenfassung
Seit der portugiesischen Kolonisation vor 500 Jahren, fungiert der Staat Rio de Janeiro als der Motor der
Entwicklung Brasiliens. Durch verschiedene Arten von Ausbeutung, haben sich die natürlichen
Ressourcen in Rio de Janeiro langsam vermindert. Der Atlantische Regenwald, einer der artenreichsten
Ökosysteme der Erde, ist demzufolge auf 7 % seiner ursprünglichen Ausdehnung geschrumpft. Um diese
lokale und globale Umweltzerstörung zu stoppen und die Lebensqualität der ländlichen Bevölkerung zu
verbessern, hat die Regierung des Bundesstaates das Programm „Rio Rural“ gegründet. Rio Rural hat
Landwirtschaftssysteme, wie beispielsweise Agroforstsysteme gefördert und integriert, um die
gefährdeten ursprünglichen Ökosysteme weniger zu schädigen. Agroforstsysteme sind nun im Rahmen
der technischen Unterstützung und Finanzierung des Bundesstaates Rio de Janeiro etabliert, ohne aber
gänzlich ihr Potenzial zu verstehen und vollständig auszuschöpfen. Agroforstsysteme sind Einsatz- und
arbeitsintensiv und benötigen technische Unterstützung. Der Kohlenstoffmarkt hat sich deckungsgleich
als Alternative bewiesen, um die betroffenen Landwirte zu finanzieren und Barrieren in der
Anfangsphase von Agroforstsystemen zu überwinden. Diese Studie hat das Ziel, das Potential solcher
Systeme im freiwilligen Kohlenstoffmarkt zu charakterisieren, als eine Möglichkeit um die Hindernisse für
die Annahme an Agroforstsystemen zu verringern und die Umsetzung sowie eine langfristige
Nachhaltigkeit zu untersuchen.
Schlüsselwörter: Rio de Janeiro , Umweltzerstörung , Landnutzung, Agroforstsysteme, Nachhaltigkeit,
freiwilligen Kohlenstoffmarkt

15
Resumo
A partir da colonização Português, há 500 anos, o estado do Rio de Janeiro tem sido o motor do
desenvolvimento no Brasil. Através de diferentes tipos de exploração o capital natural do estado tem
corroído lentamente. Como resultado a Mata Atlântica, um dos ecossistemas mais diversos do planeta,
foi reduzida a 7% de sua extensão original. Para parar a degradação do meio ambiente, o governo do Rio
de Janeiro implementou o programa Rio Rural para melhorar a qualidade de vida da população rural e,
simultaneamente, impedir a degradação ambiental local e global. Rio Rural tem incentivado a adoção de
sistemas agrícolas mais de acordo com o ecosistema original, como sistemas agroflorestais. Os sistemas
agroflorestais têm sido estabelecidos com assistência técnica e financiamento do estado do Rio de
Janeiro, mas sem entender o seu potencial plenamente. Sistemas agroflorestais requerem insumos, mao
de obra intensiva e assistência técnica, portanto seus altos custos de implementação são pouco
atractivos para os produtores. O mercado de carbono tem sido proposto como uma alternativa de
financiamento consistente para os agricultores e para superar barreiras em estágios iniciais de sistemas
agroflorestais. Este estudo tem por objetivo caracterizar estes sistemas para examinar o seu potencial no
mercado voluntário de carbono como uma forma de diluir as barreiras para a adoção, implementação e
sustentabilidade a longo prazo.
Palavras-chave: Rio de Janeiro, degradação do meio ambiente, uso da terra, sistemas agroflorestais,
sustentabilidade, mercado voluntário de carbono.

16
Introduction
“A mosaic is made up of many unique pieces
that can be valued as a whole and for the
uniqueness that each piece contributes to the
bigger picture (Peters-Stanley, et al., 2013).”
Since humans learned how to use ecosystems to their benefit and shifted from hunter-gatherers to
agriculturalists (Davis, 1995), the distinctive characteristic of the human kind has been the ability to
modify ecosystems (McNeil, 1996). Ecosystems all over the globe have been profoundly modified to
follow human needs; leading us to the verge, in some cases, of a point of no return (von Bertalanffy,
1978; Crutzen, 2002; Glaser et al., 2008)). Human thinking has adopted a productivist approach towards
nature and for most of human history it has been perceived as a bottomless pool of resources which has
led to excess and squandering. Such behavior guided us to the present environmental crisis jeopardizing
entire ecosystems.
Humankind is facing food and water insecurity, climate change, biodiversity loss and extreme climatic
events and all due to its productivist linear way of thinking (von Bertalanffy, 1976; Glaser, et al., 2012). It
is now, that human rationality is realizing the necessity of systemic approaches to deal with the
unparalleled dimensions of the problems at hand. The most affected ecosystems can be found in Europe
because of its longer human occupation and its exploitation intensity but exploitation migrated to
tropical settings since 500 years ago affecting rich and highly complex ecosystems, this is the case of the
Atlantic Forest in Brazil(McNeil, 1996).
The Atlantic Forest in the state of Rio de Janeiro, Brazil, a hotspot of biodiversity and endemism (Myers,
et al., 2000), has undergone forestry exploitation, replacement to croplands and pasture and mining
activities for the last 500 years (McNeil, 1996; Nehren et al., 2009). This has led to a significant reduction
of the Atlantic Forest´s original cover, remaining only 7% (Ferreira Lino, et al., 2011; WWF, 2013), soil
degradation and loss of environmental services. Human colonization and mismanagement have
deteriorated the biome and put human residents into a critical housing situation because of
unsustainable agricultural practices. The natural capital of the region has always been high and it has
nurtured the economic growth of the country. Even after 300 years of exploitation European scientists
were astonished by its splendor and it was described by Darwin in his The Voyage of the Beagle… “After
passing through some cultivated country, we entered a forest, which in the grandeur of all its parts could
not be exceeded…”, “overlooking the cultivated ground, and surrounded on every side by a wall of dark
green luxuriant forest…” and “Before seeing them, I had no idea that any trees could cast so black a
shade on the ground…” (Darwin, 1839).
Being a tropical rainforest in its climax, the Atlantic Forest is a complex and efficient ecosystem,
however, from the standpoint of human satisfier production is extremely poor, and humans can only use
a fraction of their biomass as satisfiers (Mejía & Cuanalo, 1981). The ecological determinants of the
Atlantic Forest are nor the best nor the adequate for common farming systems. Steep slopes, high
salinity and restricted drainage are not the appropriate conditions for most farming systems, not even
the most fertile area can sustain continuous farming, and the only way this has been happening for the

17
last 500 years is thanks to material subsidies that humans inject into the ecosystems (IBIO, 2013). Recent
experiences show that the application of agricultural technology based on the intensive use of fertilizers
and pesticides does not increase agricultural productivity (FAO, 2011). On the contrary, these models
induce technological exponential costs, lead to a waste of already scarce resources and generate
technological dependence (Leff, 1981).
Due to demand of resources from a growing population, like that of Rio de Janeiro and Brazil itself, this
mature and complex ecosystem has been replaced with a humanized landscape, like artificial grassland,
husbandry, and annual and perennial monocultures. In the last century, new ways of communication
have been opened and new population centers have been established using the natural capital of the
state of Rio de Janeiro (Nehren, et al., 2009), but it has been done without coupling the environmental,
social and economic systems and the sustainability of the region has been jeopardized.
As in many countries, the way Brazil deals with multidimensional issues have changed and in order to
respond to disengagement of economic, social and environmental systems, Brazil developed a more
attuned planning methodology. Watershed management was developed since the 70s as a response to
ecosystem loss and to future human population vulnerability (Darghouth, et al., 2008). Following the
evolution of this methodology and pressed by current environmental issues, the state of Rio de Janeiro
developed the “Sustainable Rural Development in Micro-Watersheds Program” (Rio Rural). The program
aims to promote self-management of natural resources by rural communities through sustainable
practices, contributing to reduce threats to biodiversity, to reverse the process of land degradation and
increase carbon stocks in the Atlantic Forest (Governo do Rio de Janeiro, 2012).
Watershed management methodology introduces system thinking to address multivariable and
transboundary problems by joining the social, economic and environmental dimensions circumscribed
within a watershed. It can be said that watershed management observes farming systems as
socioecological systems in an unspoken sense since it recognizes the influence between man and his
environment and vice versa (Mejía & Cuanalo, 1981; Glaser, et al., 2012). Treating farming systems as
socioecological systems provides a solid, but flexible, framework to comprehend the inner working of its
subsystems and the emergence of new properties as the system is integrated (Glaser, et al., 2012).
One of the objectives of Rio Rural program is the development and adoption of sustainable farming
systems to tackle poverty and environmental degradation. Agroforestry systems (AFS) have proven to be
a sound alternative to most mainstream industrial farming systems. AFSs have the potential to be
profitable and at the same time increase social and environmental benefits. AFSs foster improvements in
key environmental services like biodiversity, carbon sequestration and nutrient cycling. AFSs are present
in the state of Rio de Janeiro but they have rarely been examined from all their facets (Debois, 2006;
May et al., 2008)
Given the environmental and socio-economic benefits that AFSs provide to local communities it is vital to
encourage the adoption of such systems. Unfortunately, AFSs have steep costs when it comes to
adoption and implementation. Among their peculiarities, they have high input costs and are labor
demanding in their initial stages and throughout their lifespan, without mentioning their demand for
seasoned technical assistance. The inclusion of these systems in the thriving carbon markets is
imperative as incentive for farmers and as leverage to overcome their barriers.

18
The carbon markets started with the ratification of the Kyoto Protocol in 1997 (UN, 2012); since the
instauration of the Kyoto protocol and its mechanisms, there has been a growing market for this new
commodity. Governments, private companies and individuals have gotten involved in these markets to
comply with international or regional regulation, as a way to differentiate themselves from others or to
promote sustainable development. By doing so, they have created a considerable source of capital that
support the implementation of sustainable projects overcoming economic barriers that in the past
discouraged the development of such projects.
Incorporating AFSs into the carbon markets is one of the objectives of Rio Rural, since it synergistically
encourages the accomplishment of other objectives of the program by promoting the development and
adoption of sustainable agricultural practices which protect biodiversity, restore soil conditions and help
farming families to overcome economic difficulties (Governo Do Rio de Janeiro, 2013). If there is a clear
understanding of AFSs functioning is possible to couple them to the appropriate payment for
environmental services scheme.
The present study, as part of Rio Rural program, has as its main objectives to understand the functioning
of AFSs in the state of Rio de Janeiro with a systemic perspective and explore their potential in the
carbon markets, accomplishing Rio Rural´s goals through the socioecological systems approach and the
micro-watershed methodology.
To accomplish these two objectives, this analysis will follow a deductive approach and will cover system
theory, socioecological systems revising agricultural systems with special emphasis in agroforestry
systems, the microwatershed methodology followed by Rio Rural and the concept of environmental
services to latter address payment for environmental services to then aboard the carbon market.
19
2. Systems Thinking
Since humankind leaped through evolution from being an animal that endured its environment to one
that actively managed it, the main human trade has been rationality. This rationality showed humans
how to control their environment by understanding the relationship between their actions and the
consequences in the environment to make it beneficial. For most of human history the scale of human
action did not have the potential to disrupt natural cycles and intellect sorted problems with only a small
set of variables, allowing human to simplify the world to linear relationships. Within this simplification of
the world; human knowledge flourished and divided each element in different fields of science, leaving
out the analysis of the relationships between them (von Bertalanffy, 1976; Davis, 1995; Haraldsson,
2000; Glaser et al., 2008).
To understand and facilitate their lives, humans construct representations of the world but with a
tendency to strip it from variables and dimension during this recreation (Haraldsson, 2000). For example,
in economics one of the most used assumptions is “ceteris paribus”, which basically means "all other
things being equal", helps economic models to isolate variables to understand their individual behavior.
It is also used to freeze a model in time to study step by step the function of reality. Human models
normally work in this manner and render inefficient when the problem at hand exceeds in complexity.
Real world problems, especially development and environmental problems are composed by more than
a few variables and they are dynamic. Linear representations leave out this dynamic behavior and
variable feedbacks that affect and reshape variables. And under this linear assumption human
knowledge has been developed.
It is now with sustainable development and global environmental problems that such rich knowledge
and scientific experience are faced to multifactorial and complex issues. Since the development boom
experienced by humans with the industrial revolution and its later progress during the 20th century the
way to respond to multifactor issues, like pollution or environmental degradation, was to attack the
symptoms rather than the cause (Haraldsson, 2000). This was the typical “end of the pipe” ideology
which reflected human thinking linearity. It was thought to be an economically viable solution, but in the
long run it was demonstrated to be more costly. Modern sustainable development issues comprehend a
great variety of variables, incorporating multilevel, multidisciplinary artfulness. Human thinking is forced
to manage complexity, emergence, hierarchies, dynamic relationships and feedback (Glaser et al., 2012;
von Bertalanffy, 1976).
The only way to produce pertinent scientific solutions is by finding common ground between disciplines
and merge different fields, which are capable of dealing with systems rather than with isolated elements.
The first hints of a systemic approach can be traced back to the 14th century to Ibn Kaldun with his
historical studies, in which he outlined systems dynamics and how low level variables can affect higher
levels by accumulating potential and he also shallowly reviewed resilience and thresholds. He wasn´t the
only one; Nicolas de Cusa with his “Docta ignorantia”; Theophrastus Paracelsus, who depicted
equifinality, homeostasis and resilience in his treaties about medicine, and finally with Marx and Hegel
with their “Dialectic” where they began to grasp notions of emergence in social systems (von Bertalanffy,
1976). Systems theory began to be properly approached since 100 years ago by Wolfgang Köhler and
Alfred J. Lotka, who provided the foundations of the General Systems Theory (von Bertalanffy, 1976).

20
The first with his “Physischen Gestalten” (physical forms) which explains human mind elements as
components of a whole (system), and the later with his contributions to systems dynamics
(Encyclopaedia Britannica, 1994; Baigent, 2010). But it was until the late 60s and early 70s with the work
of von Bertanlanffy and the early Information Age that the development of “systems” as a science and as
a way to tackle problems was properly developed. The publication of von Bertanlanffy “General Systems
Theory (GST)” in 1968 responded to the mechanistic approach of science that led to highly specialized
sub branches of disciplines, but that at the same time were making similar general findings (von
Bertalanffy, 1976).
GST attempts to consolidate knowledge about a community of elements coming from a general
definition of such community, and from that stand comprehends aspects like emergence, constitutive
characteristics, complexity, interaction, feedback, organization, resilience, hierarchy, potential and
equifinality. Classical science only dealt with a small number of variables in a mechanistic, linear way,
without understanding the importance of the emergent features from interactive relationships among
variables (von Bertalanffy, 1976; Haraldsson, 2000). Social and natural sciences encountered closed
alleys when they try to model or reproduce reality without an approach capable to manage multivariate
dynamic realities (Glaser et al., 2008).
It is necessary to study not only the isolated elements but also the “whole” at the same time. As Aristotle
once said, “the whole is greater than the sum of its parts” (Aristotle, 350 BC) pointing out the necessity
to understand organization, hierarchies and feedbacks resulting from interacting dynamic relationships.
Otherwise if only elements are studied, constitutive characteristics are left out of the analysis (von
Bertalanffy, 1976). Von Bertalanffy defined “constitutive characteristics” as those embedded only to the
system as a whole and as a result from the interaction of its parts, rendering the study of individual
elements insufficient. These constitutive characteristics are the focal point in systems analysis (von
Bertalanffy, 1976).
GST provides the theoretical framework to develop ground level approach. Systems thinking is an
approach which encompasses several quantitative and qualitative tools to model and simulate reality. It
is focused on complexity and the dynamic relationships that sprout out of such complexity. Its
fundaments come out of control theory, cybernetics and non-linear dynamics (Glaser, et al., 2012).
Systems thinking allows to study elements and relationships between them. We can find its origin in
systems dynamics developed by Jay Forester, and it was intended to manage complexity issues.
Haraldsson (2000) defines it as “understanding relationships and patterns between components in a
network of relationships”. The main component of systems thinking is the concept of “feedback”,
understood as the effect of a variable over another one in a constantly dynamic setting. Haraldsson
(2000) defines it as “any reciprocal flow of influence”.
As said before current environmental and sustainability issues are composed by variables from the
social, economic and environmental fields demand multidisciplinary approaches capable of examining
this trifecta as a whole. As point out by Glaser, et al (2012), systems thinking change the emphasis from
“knowing more” to “understanding better”, rendering more efficient information on which decision can
be taken. Currently vast amounts of information are being produced but without coupling different
fields, solutions towards sustainability won’t be achieved. It is of the highest importance to approach

21
sustainability in an integrated way, leaving closed systems behind and understanding the world as an
opened one or as Glaser mentioned:
“Sustainability would benefit from a better understanding of systems thinking … in order to understand
processes that take place in our economies, environment and societies. This involves time lags, non-
linear behavior and feedback loops, and other patterns of behavior that are typical of complex systems.”
(Glaser, et al., 2012).
To apply systems thinking there are several methodologies but the most used and illustrative is causal
loop diagrams (CLD), which allows us to visualize the interaction of elements, their feedbacks and also to
conceptualize our problems (Haraldsson, 2000). CLD is the first approximation to modeling later on
agent-based models and quantitative models depict more profoundly the system´s inner working (Glaser
et al., 2008).
As this study continues and more deep concepts are boarded, these methods will be more thoroughly
examined. Since our AFSs encompass economic, social and environmental factors; systems thinking will
be regarded from a more specialized departure and will now aboard the perspective of socioecological
systems.
22
3. Farming Systems as Socioecological Systems
Agriculture has been a turning point in human history, since its origins it has carried major changes to
human way of life; it has allowed the flourishing of many civilizations and our current technological
achievements (Davis, 1995). It encompasses a great deal of processes and it is defined as:
"…all forms of activities connected with foraging, growing, harvesting and primary processing of all types
of crops, with the breeding, raising and caring for animals, and with tending gardens and nurseries"
(ILO/WHO, 1963).
Agriculture encompasses a vast array of productive systems and human life depends on it. It comprehends foraging, cropping, animal breeding, forestry or fishery production and combinations of all of them. This produces interacting systems with intricate relation within its many elements (FAO, 2011). Agriculture is the most evident melting pot for human and nature systems, there are many approaches to analyze this merger and its variety of systems; it can be seen through the scope of biology, economy, sociology, agronomy or other sciences but without covering fully all the involving aspects of agriculture. To analyze the specificities on the wide spectrum of agriculture, the systemic approach has also been used, not only by considering them SESs but as proper farming systems. A farming system is “…a material process that a particular society performs for food and raw materials managing plant and animal populations as a means of their own production, and soil, as object and means of labor “ (González Estrada, 2010). Studying farming systems do not only portraits what is being produce but also how and why, providing insights about social and environmental condition on which they take place and about the farmer goals, preferences and available resources (Behera & Sharma, 2007; González Estrada, 2010). When talking about a farming system its necessary to think in interrelated productive enterprises, that is to say, the whole farm rather than an individual activity. As Behera & Sharma (2007) said, “to describe a farming systems its structure and functioning must be fully comprehended”. The four main factors of a farming system are management, labor, capital and land; the farmers allocate differents amount of these factors to accomplish their goals taking in account their limitations. These limitants are natural resources and climate, technology, institutions, policies, human capital, information and economic environment (Behera & Sharma, 2007); they circumscribe a farming system depicting its reach and inherent characteristics. Since the last century, the global system has experienced high level of interconnectedness thanks to the
uprising human systems and economic growth. Humans have interwoven dense and deep connections
between social and natural systems without even realizing it and they have also increased the
complexity with which science has to deal with. Examples of such interconnectedness are farming
systems, in which human societies based their most primal needs and in which humans show the most
expertise in how to influence nature. In these boundary objects is possible to see how humans depend
on nature and how nature depend on human actions, fusing social and natural science in one place and
time (Glaser, et al., 2012).
Farming systems are the perfect example of a boundary object between social and natural sciences. Nor
the social can explain biotic and abiotic aspects, nor natural sciences can assess the complexity of human
behavior, to study them is necessary to utilize an adequate holistic framework. Scientists of different
backgrounds agree that classic unilateral approaches are coming short to current challenges (Glaser et
al., 2008).

23
Social sciences study information fluxes of society through qualitative lenses and natural sciences study
energy and matter fluxes with a quantitative perspective. To understand farming systems is necessary to
use a framework that encompasses both, in this coupling the goal is not just to summon tools or
methodologies in a single analysis but to use a hybrid approaches capable of handling hybrid systems like
farming systems and to place complexity as the center of their study (Jahn, et al., 2009).
Thus the challenge here is to integrate fields that think differently, have opposite approaches and are
traditionally separated. The development of a hybrid framework owes its birth to similar findings in both
sides, to the need of each other tools and especially to sustainable development issues. The challenge
has been tackled by several scholars since the 20s when the Chicago School of Sociology coined the term
“human ecology” referring to social, human and environmental border issues. Later it was revisited by
the Deutsche Gesellschaft für Humanökologie or “German Society for Human Ecology” (DGH) founded in
1975 which focused its research to interdisciplinary sustainability issues. One of the most prominent
thrusts to the development of socioecological integration was the one made by Paul Crutzen and his
“anthropocene” (Crutzen, 2002). According to Crutzen the influence of human has been so profound in
nature that is necessary to incorporate human beings as a new geological force, calling the period since
the 18th century the anthropocene. This conceptualization renders an outspoken demand for a new way
of thinking towards human-nature relationships.
Based on this advances is that Teuton and Nordic “think tanks” have developed “socioecological
systems” (SES) as a cross-sector approach that manage human-nature interaction across all possible
nexus fields. Socioecological system approach focuses on, as said by Norman (2002) “the emphasis
placed on designing interventions that improve current and future productivity, reduce poverty, and
protect the environment, without weakening and strengthening the coping and adaptive strategies of
the most vulnerable groups in the community”. The objectives of the approach are: increase farmers
flexibility, adapt the production to stochastic shocks, create resilience, reduce risk and promote
enterprise diversification (Behera, 2007; Glaser, et al., 2012). With knowledge on AFSs is possible to have
economic growth based on conservation and on wise use of natural resources available to humans. Thus,
tropical countries can base their economic and cultural development in their characteristics and natural
competitive advantages and can reverse their situation of backwardness, subordination and dependence
(Leff, 1981).
Resilience Alliance, a Swedish institute based in Stockholm, develops concepts and aims of SES with a
unique tendency towards resilience in the context of global change and sustainability (Resilience
Alliance, 2004). The new Frankfurt School of Social Ecology also contributes to the development of SES
providing concepts but also by shining light over them in a different way. They consider SES more as
patterns of relationships between humans and nature than as entities; that is to say, they consider more
important the flux of information. And the new Vienna School of Social Ecology takes Anthropocene to
an extreme and considers all Earth-bound systems as social systems given the magnitude of human
action (Glaser, et al., 2008).
The philosophical debate over what is a SES has produced many definitions of what it is but none of
them generated a working definition of what a SES was, Glaser (2008) took that step and enunciated SES
as:

24
“A social-ecological system is a complex, adaptive system consisting of a bio-geophysical unit and its
associated actors and institutions. The spatial and functional boundaries of the systems delimit a
particular ecosystem and its problem context.”
This definition provides us a more graspable framework when tackling SES, and it tries to be as wide as
possible to comprehend all SES examples, but also sets limits so the focus won´t be so wide that the
resulting analysis loses its relevance. From this definition is understandable that the main focus of SES
analysis is complexity and by introducing “adaptive” to the definition it includes resilience, homeostasis,
dynamic and panarchy. It encompasses social and natural elements and puts an emphasis on the context
as a way to avoid deviations through over generalization. It also places emphasis on the importance of
studying the structure and inner working of the relationships between systems´ elements. It gives
importance to concepts like networks, feedback loops, and causal chains, and to the potential emergent
characteristics coming from dynamic relationships (Glaser, et al., 2008; Jahn, et al., 2009).
Since the 90s SESs have experienced 3 main approaches towards their analysis. The first one was a very
regular approach and quantitative/ formal approaches were applied, then complexity theory applied its
tools to SESs focusing on nonlinear dynamic systems and information exchange (Glaser, et al., 2008). The
last one was proposed by the new Frankfurt School of Social Ecology which especially studies nature –
social interactions that produce human satisfiers (Glaser, et al., 2008; Jahn, et al., 2009). This last
approach is the one that will be follow on this particular study.
Redman, et al. (2004) mentions that there are five interface systems on which SES focuses its study:
land-use decisions, changes in land cover, land surface, biodiversity, production systems, consumption
patterns and disposal networks; encompassing all of the components in a farming system.
Much have this study brought up concepts like complexity and emergence. All of them have a consistent
background in systems theory and is necessary to elaborate explicitly on that background to fully
understand what the reaches of SES are.
Commonly “complex” or “complexity” refers to something difficult or not easy to attain, but in systems
theory it refers to systems composed either by a high number of elements or very diverse elements. It is
especially applied to relations; relations can be complex by the heterogeneity among elements causing
intricate behaviors or they can be complex simply because of a large amount of elements, one is
behavioral complexity and the other structural (Ratter, 2012). In the case of AFSs, they present both
structural and behavioral complexity given the high interconnectedness between a large array of
elements.
In the heart of complexity lie two very important notions: non-linearity and cause-effect relationships. If
there were not non-linearity, we would face simple and predictable systems. With the help of these
concepts and complexity shown by systems, emergence is explained. Emergence ascribes all not
expected features arising from elements´ non-linear and dynamic relationships (Ratter, 2012).
Emergence can be traced as back Aristotle in his Metaphysics… “The whole is something over and above
its parts and not just the sum of them all” (Aristotle, 350 BC). It is the occurrence of novel features only
attributable to the system but not to isolated elements (Glaser, et al., 2008). Emergence sprouts from
the self-organization trade of complex systems and their dynamic relations.

25
Based on these concepts, SES develops “panarchy” to analyze change in the system through time taking
into account its hierarchical structure and emergence of new features. Panarchy is built under the
assumption of a hierarchical structure not based on importance or relevance. The hierarchy is based on
speed cycles and reach of system´s elements. For example, an individual would be in a lower hierarchy
compared with an institution, not because of its importance but because the reach of action of an
individual is restricted but at the same time within an individual lays the potential to generate change in
an institution. With panarchy, it can be explained how the relation of elements in lower level of a system
foster potential to produce emergence in higher hierarchies and how a system has a constant internal
change thanks to complexity, non-linear relations and emergence, making SES a distinguishable cohesive
cumulus of elements with constant features that quietly changes overtime. This gives us the opportunity
to not only depict a SES in a particular time and space, but capable of appreciate transitions. With such
information is possible to identify when and where, within this transitional cycles, is possible to interfere
and produce positive contributions to SES (Holling, 2001).It can be said that SES manages complexity
through panarchy.
The finality of SESs, or of any systemic approach, is the development of models to understand, improve
or predict a problem. SESs pose difficult issues given the above mentioned features, mainly the ones
boarded by panarchy. The constant evolution of SESs, or in this case AFSs, renders precise calculations
for simulations or models useless. Von Foerster (2002) boarded this issue when he defined SESs as “non-
trivial”. According to him, trivial systems are those that can be predicted, are deterministic and are
independent from their historical context. In the other hand, non-trivial systems are determined by their
context and history and they cannot be predicted precisely. This is because, as von Foerster also said,
SESs have a “transcomputational” number of states and calculations are theoretically ineffective (Glaser,
et al., 2012; von Foerster, 2002); behavioral and structural complexity, dynamic relationships and
multilevel elements make SESs “trendable” but not predictable.
To study SESs is necessary to use methodologies capable of doing it. Depending on the deepness of the
study many methodologies can be followed. In a first approximation, a “causal loop diagram” approach is
the best way of understanding the fluxes within SESs (Haraldsson, 2000). This approach delimits SESs in
space and time and includes the relevant system elements, their dynamic relations and feedbacks, but it
rests as a first approximation since it only manages fluxes´ direction but not quantities or qualities
(Achinelli, 2003). For deeper analysis, one proposal has been “agent-based modeling”. It regards
elements as agents with limited knowledge and leverage, only affecting agents near its sphere. Similar
agents create clusters generating new levels within the system allowing potential emergence to jump
from micro to macro levels (Glaser, et al., 2012; Ratter, 2012).
This kind of models study an individual element within its context and then proceeds to analyze its
relationships with surrounding elements and feedbacks of their dynamic relationships. Agent-based
modeling has been the preferred tool when approaching SESs but as said before the non-trivial status of
SESs makes models more a heuristic object of high value than a trustworthy prediction (von Foerster,
2002; Glaser, et al., 2012).

26
4. Agroforestry Systems
Farming systems approach was developed to improve agriculture in its many faces and to promote better land uses. This came in useful when the transition from mono-produce intensive and extensive farming to a multi-produce farming is required due to growing demand and environmental issues. One of the alternatives with the most success are agroforestry systems (AFS). Nowadays, the great challenge in agriculture is to find economically viable and environmentally sustainable farming systems. AFSs can be a good land use alternative that not only is sustainably productive but also able to enhance the available resources. AFSs are practices that combine foraging, crop production, husbandry and forestry in the same land unit, sequentially or simultaneously, to harness the benefits of ecologic and economic interactions (FAO, 2006; Francia et al., 2007; Ribeiro & Guerra, 2008). AFSs are not a new kind of land management but it has been attracted much attention since the 70s in developing countries as a path to restore lost environmental quality, to decrease deforestation, to escape land scarcity and to satisfy a growing agricultural demand. AFSs, theoretically, maximize land usage by using every possible place to generate a benefit or a produce, they make profit of the entire canopy gradient, so it is possible to plant as many crops as possible in the same space while land degradation is minimized by mimicking natural environments and simulating natural energy and matter fluxes (Martin et al., 2007). AFSs seek to apply agroecological principles. Agroecology is understood as a scientific, theoretical, practical and methodological multidiscipline approach focused on problems generated by conventional industrial agriculture models established with the green revolution (Embrapa Hortaliças, 2013). It proposes to study developmental processes from an ecological and socio-cultural perspective and from a systemic approach, adopting the agroecosystem as unit of analysis integrating ecological sustainability (maintaining or improving the quality of natural resources and ecological relationships of each ecosystem), economical (potential for income generation, employment , market access) , social (inclusion of the poorest populations and food security), cultural (respect for traditional knowledge), political and ethical (transcendent moral values) dimensions to promote the transition from conventional agriculture models to sustainable agriculture (May et al., 2008; UFRJ, 2012). Since its origin, agroecology promotes a strong and serious critique to the current political and development model; also shows that conservation and reproduction of the agrarian systems are strongly related to the type of society and that the relationships within it are established between different social groups. It contains the theoretical basis and methodological principles to design and manage agroecosystems sustainably contributing to agrobiodiversity and biodiversity conservation while transforming them into, economically and ecologically, sustainable systems (Caporal & Costabeber, 2004; Embrapa Hortaliças, 2013) AFSs elements can be spatially arranged in different manners and in time they can be managed
simultaneously or sequentially. They have a great variety and are adapted to any scale, from subsistence
to commercial, depending on technological and managerial capabilities. The inherent land heterogeneity
makes impossible to develop a guide applicable in every case, each AFS is different and farmers must
manage them individually according to each onsite requirements. Crop diversity allows farmers to have a
wider produce offer and to avoid dependence on a particular crop, promoting farm resilience (Ribeiro
Lamônica & Guerra Barroso, 2008; Calle et al., 2009). AFSs are a cleaner technology based on
agroecology principles to simulate natural nutrient cycling making land fertile, profitable and
sustainable; through a wider produce offer farmers minimize risk due pest or market conditions.

27
Farmers tend to remain on their land when their labor is better paid and when a secure and lasting
income is assured. Among other benefits, AFSs reduce pressure over conservation areas and can act as
buffer areas to them while being productive and promoting high biodiversity.
AFSs can be arranged on a great array of permutations, but they possess similar characteristics that allow
them to be classified spatially, temporally, by their components and productive purpose (Debois, 2006;
May et al., 2008).
By components AFSs can be classified into silvoagricultural systems, silvopastoral systems and
agrosilvopastoral systems (Debois, 2006; May et al., 2008); silvoagricultural systems are those that
combine trees, shrubs or palms with crops; silvopastoral systems are composed by trees, shrubs or
palms combined with herbaceous forage plants and livestock. Agrosilvopastoral systems are
characterized by husbandry within a silvoagricultural system (May et al., 2008).
Temporally AFSs can be simultaneous, when all elements interact at the same time or cycle; and
sequential, when there is a chronologic relation between system components. Sequential AFSs rotate
crops in order to accomplish their productive purpose. There are AFSs in which certain components are
planted first to improve environment conditions for the actual productive component (Martin et al.,
2007; May et al., 2008).
Spatially there is a plurality of arrangement, the most typical are: irregular when components do not
follow a specific arrangement (typical of managed secondary forests); uniform when each component
has a predetermined place to accomplish certain purpose; mixed, which encompasses uniform and
irregular arrangements where certain components are placed on specific locations and other are left to
be naturally allocated. This can be the case of silvopastoral systems in which grassland incorporates
conglomerates of shrubs or small forests without a specific location. In bands arrangements consist of
bands or strips of components one next to the other, for example, a tree species providing shadow to
shrubs like cacao; and mosaic, where a farm is divided into quadrant in which components are placed
(May et al., 2008).
AFSs vegetative components have different purposes or roles; they can be classified as priority species or
service species. Priority species are the productive component of an AFS in cases where husbandry is not
the ultimate productive purpose. Service species accompany priority species and enhance their
environment; they can be subclassified as fertilizers, repellents and indicators. The purpose of services
species is to bring co benefits with their present such as better soil conditions, nutrient fixation, reduce
erosion and evapotranspiration, provide organic matter or shadow (Debois, 2006; Calle et al., 2009).
Service species can be arranged in particular manners to protect or improve performance of priority
species. They can act as live fences to reduce erosion and delimitate farm boundaries; as wind breakers
to protect priority species from strong or cold winds; and also they can be used as a live tutor, replacing
stakes for trees or shrubs which could ameliorate soil condition or provide shadow depending on the
case (May et al., 2008).
Many other benefits other than crop and animal production are the cause of a wide dissemination and
adoption of AFSs. Such benefits cover a wide range of fields, from additional farm products to
environmental services. Economically, AFSs do not only produce crops or animal products; they also
provide construction materials, fuelwood, fibers, timber and manure. These extra products help farmers
28
to improve their income in two ways, they can sell these materials or they help the farmer to avoid
expenditure in such items. Productively AFSs increase overall production, for example, trees providing
shade boost animal production (milk and meat) reducing cattle heat stress (Calle et al., 2009); tree and
shrub components in AFSs aid with soil retention and erosion control and improve fertility (improving
fixation of nitrogen, carbon and water) (FAO, 2006;Martin et al., 2007) which reduces usage of fertilizers
and off-farm water and boosting rural income. They also produce fodder to feed livestock (reducing
husbandry costs); also they protect delicate crops from extreme conditions like frosts or sun radiation
heightening production (FAO, 2006; Ribeiro Lamônica & Guerra Barroso, 2008). Because of AFSs
productive diversification, income is not only ameliorated by reducing costs and augmenting the offer
but it also remains constant over the whole year avoiding seasonal income lows. This encourages
adherence of farmers to their land (Dagang & Nair, 2003; Martin et al., 2007).
Managerially, AFSs aid farmers to decrease the risk and to improve rural resilience. AFSs inner diversity allows a wider range of action to the farmer and limits dependency on specific products. Farms are less prone to policy changes, market fluctuations or stochastic shocks (FAO, 2006). Aesthetically, AFSs are more appealing to tourism than ordinary rural landscape and to a specific sector of society is appealing to visit areas where farmers use environmentally friendly practices such as AFSs, leading to rural ecotourism (Calle et al., 2009). On the environmental side, AFSs promote important environmental services (ES) that if harnessed can be used as an incentive for their adoption or as a tool to bridge AFSs barriers. The main ESs are carbon sequestration, in the form of aboveground and belowground biomass and soil carbon (FAO, 2007); biodiversity, referring to both on-farm and off-farm biodiversity; trees and shrubs allocation (depending on the patterns) has shown to serve as crossing paths between forest remnants or as restored habitats to pollinators, birds and small mammals; and watershed protection, AFSs create “green barriers” around waterways and bodies, they also reduce water pollution while avoiding erosion and eutrophication. AFSs also improve underground water bodies due to improved infiltration through trees roots and lower soil compaction and retaining pollutants on near surface soil horizons (Calle et al., 2009). AFSs are in vogue because its elements interaction (people, soil, plants and animals) generate economic profit while protecting the natural capital. All of these benefits are difficult to classify as social, economic or environmental benefits since all are synergic and non-exclusive. It is important to note that all of the above benefits are possible only if proper management is conducted. Local social and environmental conditions are of the most importance and cannot be neglected if an AFS is to be profitable. Otherwise, affectations can occur. The most common is competition for nutrients, space or solar radiation; it happens when elements of AFSs are misallocated in quantity or space and sound technical knowledge is necessary to avoid it. In the same sense, allelopathy can be present if certain elements are misplace or overused, for example, some trees can produce natural compounds like tannins, alkaloids, phenolics or terpenoids to inhibit the growth of surrounding crops. By mimicking natural environments, trees and shrubs in AFSs can also host transmittable plagues and endanger crops, is important to notice that biodiversity makes AFSs less prone to plagues than monocultures. Lastly, AFSs are labor intensive, not only during implementation and management phases but also harvesting can demand large amounts of labor when dealing with delicate perennial crops (Ribeiro Lamônica & Guerra Barroso, 2008). Balancing advantages and disadvantages results obvious why AFSs are a viable option to many settings, but is necessary to not lose sight of the many barriers that impede their spread. There are two main barriers that block access to these systems. First, their implementation costs are high and financial aid or

29
tools to overpass them are rare or reduced. And the second, the delayed benefits from them, AFSs have long lag times to be productive and start producing dividends (Calle et al., 2009). But these are only the main barriers which farmers perceive before any other one. As introduced in the disadvantages, limited access to information can render entire programs useless by sabotaging the inner working of AFSs. Farmers need to have access to proper technical assistance in order to make work an AFS successfully (FAO, 2007) and even in some cases farmers need to know that AFSs are an option to their land. Rural traditions tend to be strong and that is reflected on production systems, many farmers only know monoculture farming. Also rural cultural values and traditional aesthetic conceptions about land uses can discourage farmers to adopt AFSs, Calle et al. (2009) found evidence in Quindio, Colombia of farmers not using AFSs due to cultural believes that dictate them to keep certain landscape through a defined crop. Subsidies play a major role on AFSs development, not only supporting them but also by holding them back when a subsidy is misallocated. For example, is not uncommon to find subsidies for fertilizer or genetically modified organisms (GMOs) that undermine AFSs benefits (FAO, 2011). Lack of market access is a big problem to AFSs, infrastructure and market channels need to be aligned so differentiated products coming from them can harness the added value gain through intensive labor. Calle et al. (2009) also found that previous failed government programs gave a bad fame to AFSs or to any new farming system; they increased the natural risk aversion many farmers have towards new unknown systems.
As said before, AFSs present themselves in a great variety and to propose a general classification would
be merely to present a list of possibilities. They present a high heterogeneity depending social, economic
and environmental factors that preclude a conclusive classification, its necessary to use site specific
approaches to escape heuristic objects and attain concrete information. Watershed approaches have
rendered positive results focusing research efforts to specific areas with semi-homogeneous conditions.
With the previously mentioned heterogeneity of the Atlantic Forest, the region presents a wide variety of AFSs, and there are not two AFSs following the same recipe. Nevertheless, there are a group of AFSs used traditionally and mentioned by May et al., (2008):
a) Traditional forest fallow “uso tradicional do pousio florestal”. Farmers allow fallow periods ranging from two to three years in which a natural restoration is allow until it reaches a “capoeira” (initial phase of forest cover restoration).
b) Family home gardens “quintais agroflorestais familiares”. Small orchards comprising some perennial fruit and husbandry of small animal like poultry or swine.
c) Shadowed cacao plantation “cacauais arborizados”. Present on the state of Bahia, it consists on a managed forest in which farmers thin secondary forests leaving only large trees and replacing the lower forest canopy with cacao. This system is colloquially called “Sistema Cacau – Cabruca”.
d) Shadowed coffee plantation “cafezais sombreados”. Similar to shadowed cacao, this system incorporates large trees as service species helping coffee plantation to resist winds, improve fertility and avoid pests and diseases. In this case, farmers prefer to keep a low tree density to maintain coffee production.
e) Forested banana system “sistema silvibananeiro”. It is a traditionally method used by remnants of caiçaras and quilombolas communities which is a managed forest incorporates banana trees within it.
f) AFS of yerba mate “SAF de erva-mate”. Yerba mate is widely consumed in Brazil as an infusion and it has been traditionally produced on the states of Paraná, Santa Catarina and Rio Grande do Sul. This system used wood producer species as live tutors to yerba mate or it establishes it on “caopeiras” for shadow.

30
g) Taungya system. This system cheapens the costs of commercial forest plantations or restoration areas. Crops are interwoven into the forest plantation for the initial stages and after a few years only the forest is preserved.
h) Silvopastoral systems. On the Atlantic Forest region, the most bred animals are cattle, chickens, pigs, sheep and goats; also scattered presence of frogs, ostriches, silkworm, ducks, geese, capybara and peccary have been found. In these systems, farmers have introduced trees and shrubs to reduce effects of husbandry over open grasslands.
i) Box system. It protects light demanding crops like vegetables from winds, fire and diseases by establishing surrounding strips of trees. This system brings the co benefit of encouraging agrobiodiversity and biodiversity.

31
5. Microwatershed Methodology
Traditionally human kind has divided the land into territories to manage it; this delimitation commonly
follows cultural, political and geographic differences. In many cases, humankind has used natural
landmarks to recognize as limits or borders and in many other cases delimitation was done disregarding
any natural reference. In some cases, landmarks were rivers, lakes, seas and ranges; this landmark
delimitation propitiated sharing natural resources. For centuries, due to inexistent population pressures,
management of these shared resources was regulated with relax or vague treaties between neighbors.
With the advent of preindustrial and industrial periods pressure over natural resources grew and use and
management demanded cooperation between neighbors and the development of transboundary
management and agreements.
Current land use, natural resources, and environmental issues require people, institutions and
governments to work across jurisdictional lines and other boundaries, transcending the legal and
geographic reach of existing institutions (McKinney & Essington, 2006). The people affected by such
issues have interdependent interests but lack of sufficient power or authority to address the issues on
their own. Given that no single entity can address these types of trans-boundary issues, there is a gap in
governance.
Developing projects using a watershed as the planning unit has rendered many benefits since there is a
clear geographic delimitation and is easy to find cooperation among communities that share resources
and problems. Watershed planning can be used at different transboundary levels; it can comprehend
watershed shared by regions, countries, states, municipalities and communities. According to the
Mexican National Institute of Ecology and Cotler (2007) integrated watershed management (IWM) is a
“process of planning, implementation and evaluation of actions and measures aimed to control negative
externalities, which can be achieved through appropriate exploitation of environmental resources having
in mind productive purposes, ecosystem conservation or control and prevention of environmental
degradation within the context of a watershed as a territorial unit”. This supposes social participation
and the existence of institutional and technical capacities to take action appropriated to each watershed.
A simple definition of watershed is as an area in which all water flows in the same direction, but it will
consider as John Wesley Powell presented it to the EPA (2012):
“…that area of land, a bounded hydrologic system, within which all living things are inextricably linked by
their common water course and where, as humans settled; simple logic demanded that they become
part of a community” (EPA, 2012)(Fig. 1).
As rivers flow, they deliver water and environmental services throughout the watershed. These services
are the bases for human productive activities such as agriculture and fish production. Thus, changes or
excessive use by upstream or downstream communities will impact the other (Thapa, 2000). Upstream-
downstream bidirectional ties are the main focus of watershed planning and at the same time its
strongest advantage, without common interests the approach would fail to reach its objectives.
IWM is based on the analysis of human-environment interactions rendering it as an ideal planning unit
for environmental management. IWM has many advantages like having a general territorial perspective,

32
understanding watershed dynamic and facilitating coordination between different institution and
stakeholders with similar goals. The main advantage of using watersheds is to increase or promote rural
development improving the collective use of natural resources without degrading them (Álvarez Icaza &
Muñoz Piña, 2008; Governo Do Rio de Janeiro, 2013).
During its 40 years of life, watershed planning has undergone drastic changes to adapt to a variety of
situations and to the complex links within watersheds. The first implementations of watershed as
planning units took off in the 70s and 80s in developing countries like Brazil, Indonesia and India where
the first havocs of mismanagement were observed (Darghouth et al., 2008).
The focus of these interventions was to solve issues upstream to avoid losses downstream disregarding
deeper and fine underlying linkages. The aim was to solve effects but not causes. Planning did not go
beyond the construction of infrastructure in a very engineering conception. “Targets were fixed in
relation to physical outputs rather than economic and natural resource outcomes, and a top-down
planning approach was generally adopted (Darghouth et al., 2008)”. The involvement of the local
communities was not strongly considered in any of the development phases and was saw just as a source
of labor during construction, preventing population to generate ownership of the projects and reducing
the life expectancy of the infrastructure.
With poor results and limited solutions, watershed planning was reevaluated to incorporate both
socioeconomic and natural variables and shifted from the engineering perspective to a more holistic
systemic one. As said by Darghouth, et al (2008) the shift went from concentrate in soil, water or
vegetation management to more holistic approaches were the social factors and the productive systems
were included generating a sustainable atmosphere.
The paradigm changed from resource management to rural income improvement; governments realized
the need to tackle causes and not effects. The main driver for degradation of watersheds and therefore
cause of problems downstream were land use systems and resource management upstream. The
proposed approaches were then changed to adopt sustainable land use practices that would be
economically feasible and lucrative, and at the same time would propitiate environmentally sound
management.
A turning point can be identified in the 90s when new socioeconomic inclusive approaches were taken,
especially after the 1992 Earth Summit (Rhoades, 1999). The new features were the adoption of
participatory approaches focused on demands of stakeholders, decentralized management, integrated
farming systems and the inclusion of international organizations. Darghouth, et al. (2008) mention 2
innovations in this second watershed approach generation. One, the identification and execution of
complementary land use systems up and downstream. The second innovation was the adoption of
emerging theories like “farmer first” (Darghouth et al., 2008). The local inhabitants have the last word
and their demands drive the development of the projects. This second generation empowered local
formal and informal institutions and social arrangements to promote the ownership of the projects and
guarantee the long term sustainability of it.
The main factors that promote the implementation of watershed-level management are the need for
integrated land and water management, the link between upstream and downstream, the nexus in

33
upland areas between resource depletion and poverty, and the multiplicity of stakeholders (Darghouth
et al., 2008).
The size of the watershed is one of the most important variables to be considered since it will affect the
whole scope for planning efforts. Size will affect how many stakeholder will be involved, how many area
will be covered; the amount of capital required and will exponentially increase the relationships to be
understood. Three level of watersheds can be distinguished, macro, meso and micro (Thapa, 2000).
Micro watershed level comprehends small catchments or subsidiaries of catchments. It is the most
utilized approach since is a manageable size and it has shown stakeholder support and implemented
programs have succeeded and achieved sustainability. This approach requires strong commitment and
strong political willing from the proposing party (governmental or NGO). It also requires changes in the
institutional arrangements to allow communication between top and down in a bidirectional way. Even if
this level demands considerable input many cases show evidence of remarkable success.
5.1. The Brazilian experience
Since the colonization, Brazil has experience extensive agriculture. After almost 500 years of continuous
agriculture exploitation, the effect started to be obvious. Thanks to intensive mechanization,
unrestricted use of fertilizers and herbicides, expanding deforestation and soil compaction problems,
erosion, silting, flooding, declining farming and negatives impacts on fauna and flora; began to arise
(McNeil, 1996; Debois, 2006; Breathe Foundation, 2009; Nehren et al., 2009).
In the mid-70s, the Brazilian government started remediation interventions which were focused on soil
conservation with mechanical approaches, approaches that match the first generation of watershed
planning. They had temporary positive results but with a limited lifespan, high costs and generic
solutions (Lituma et al., 2003).
After unflattering results in the 90s, Brazil chose micro-watershed as their planning unit and advanced to
the second generation of watershed planning, going from soil conservation to soil management and rural
poverty reduction. The objective was:
“Increase agricultural productivity to improve community income and well-being, while conserving
natural resources” (Lituma et al., 2003).
The new interventions were based on five components. Capacity building, referring to technical
assistance and local institutional building. Participatory approaches to involve inhabitant since the first
steps. Adaptive research to profit from the knowledge of stakeholders and to deliver tailored strategies.
Economic incentives to propitiate the adoption of new practices. And institutional strengthening in all
level to plan, monitor and evaluate the new strategies (Lituma et al., 2003).
As a result in the states of Paraná, Santa Catarina, Rio Grande do Sul and Sao Paolo improved rural
quality of life while sustainably managing natural resources. These positive experiences set ground to
future micro watershed interventions such as Rio Rural.

34
5.2. Rio Rural
Agriculture is an enterprise that makes use of several systems at once; all agriculture activities impact, in
one way or another, biotic and abiotic components. By controlling such elements, agriculture commands
over key natural resources like water, air and soil; easily degrading or ameliorating environmental
conditions. At the same time, agriculture satisfies human needs and determines social and economic
conditions for a large part of society, especially the poorest. For such reasons, the integration of social en
environmental programs into a single thrust through agriculture can produce win-win scenarios.
Given the junction that agriculture is, it has become both the cause and solution of environmental and
sustainability issues. It generates erosion, land depletion, land and water contamination, greenhouse
gases, poverty and hunger. Payment for environmental services integrates social and environmental
components and enables synergies improving both parts and lately they have been taken in with great
acceptance. This acceptance has presented itself with the thriving development of a carbon market
(compliance or voluntary). This market takes carbon sequestration as its banner searching to create
synergies that would transform agriculture from a source of negative externalities to a solution for the
same. The carbon market seeks to encourage farmers to adopt sustainable agricultural practices that
with it could not be implemented due to economic barriers.
The Sustainable Rural Development Program in Micro-watersheds of the State of Rio de Janeiro, Rio
Rural, is a program developed by the state of Rio de Janeiro to improve rural conditions in all their
aspects. Through Rio Rural, the state of Rio de Janeiro seeks to reduce environmental degradation and
restore degraded areas while improving the quality of life of rural population in a sustainable manner. To
produce such results Rio Rural has adopted the microwatershed methodology. This methodology has
been developed in Brazil since 1970, as previously mentioned, and encompasses both social and
environmental factors (Governo Do Rio de Janeiro, 2013).
The project is implemented by the Secretariat of Agriculture, Livestock, Fisheries and Supplying of the
State of Rio de Janeiro, through its Sustainable Development Superintendence and is being financed by
the World Bank through the Global Environment Facility (GEF) (Governo Do Rio de Janeiro, 2013). Rio
Rural promotes the adoption of rural sustainable practices in 270 microwatersheds. The finality of
improving rural practices is to enhance the environmental services allocated and produced in the
Atlantic Forest. Since the Atlantic Forest is one of them most endangered biomes and a biodiversity
hotspot (Myers et al., 2000), Rio Rural avoids the loss of natural capital.
By using microwatershed methodology, Rio Rural places farmers as the protagonist of rural development
and boards social and environmental problems with a bottom-up approach in which the farmer is always
involved. Rio Rural also improves urban population by providing sustainable food and water supply, and
by improving environmental conditions like quality air. A multisectoral program like Rio Rural does not
only boost rural sector, but it also boosts health, energy, infrastructure, tourism and employment, and it
affects local, regional, national and international scales.
One of the goals of Rio Rural is to prove that, by improving the rural sector, not only all other economic
sectors can be ameliorated, but also that regional and global ecosystem services can benefited. Through
the implementation of PES in rural settings, Rio Rural attempts to create farmers environmental

35
conscience and to provide economic incentives for sustainable farming practices. Rio Rural is focusing on
carbon sequestration and biodiversity conservation.
Some of Rio Rural´s main goals are:
32,000 ha of sustainably managed land
50% reduction of erosion and sedimentation rates
4,000 family farmers benefited
2,400 family farmers encouraged to adopt sustainable practices
100 teachers trained for environmental education
4,000 students of municipal schools involved in 25 projects of environmental educational
270 micro-watersheds adopting sustainable rural practices
37 thousand family farmers benefited
1300 km of local roads repaired and environmentally appropriate
7200 Individual sewage systems and 3 Collective Sanitation Pilot Unities implemented
Economical Sustainability System established
Network Research System established and developing 42 participatory research projects
To achieve its goals, Rio Rural tackles them with several innovations: Clean Development Mechanism
(CDM) and Fundraising; through carbon sequestration Rio Rural attempts to include private partners to
contribute to rural development and at the same time aid to reduce land degradation and biodiversity
loss. Within this component, Rio Rural developed the Ex-ante Appraisal Carbon-balance Tool (EX-ACT) in
coordination with FAO to calculate how much carbon can various land uses sequester (FAO, 2011). Rio
Rural has also developed a Micro-watersheds Simulator to help decision makers and the general public
to understand and project how different land uses impact the environment. Biodiversity is also tackled
with participatory monitoring and by restoring and protecting the Atlantic Forest. To develop its
measures, Rio Rural is based on capacity building of all stakeholders; from farmers to institutional
representatives, to help the understanding of the program´s aim and to help implement sustainable
practices. The program also encompasses participatory research, continuing with the microwatershed
methodology, that combines technical knowledge from institutions and universities with farmer first-
hand knowledge. By doing this knowledge merges in specific locations to generate local-based
technologies and technics that empower farmers. To adapt and react appropriately to an ever dynamic
environment, monitoring is a key component of Rio Rural and is made by both the institutional
stakeholders and farmers. This makes the program more sustainable by reducing costs and involving
active participation from every stakeholder. And based on the collected information the program can
react and be redesigned to respond with better solutions (Governo Do Rio de Janeiro, 2013).
In the social part, Rio Rural follows a bottom-up approach to diagnose, design, implement and monitor
program´s intervention. Farmers conform Watershed Committees to realize all of those tasks; these
committees develop “executive plans of watersheds” where they depict every action to be taken and by
who. And to keep a truthful behavior the same committees develop a “Community Code of Conduct”
where the own community designs and decides the rules under which every farmer or community
member will obey (Governo Do Rio de Janeiro, 2013).

36
6. Environmental Services
The only source of satisfiers and satisfactions for human beings are the ecosystems, human beings get
everything from the Earth, whether they are biotic, abiotic or even metaphysical. They depend on the
quality and quantity of those satisfiers that Earth produces. These benefits are called environmental
services (ES) (MEA, 2005) and without them any kind of life could not be sustained and they are the
result of the complex interactions of living organisms and their environment (FAO, 2007). All human
developments are based on these services and their continuous misuse leads to decrements of human
well-being.
The Millennium Ecosystem Assessment (2005) has classified these services in four categories:
provisioning services, regulating services, cultural services and supporting services. Provisioning services
are those that supply goods such as food, water, timber, fuels, fibers, minerals and genetic resources.
Regulating services are responsible for climate regulation, erosion control, disease control, water
purification, air quality, pollution control and risk reduction. Cultural services are intangible benefits that
human perceive from their environment like spiritual enrichment, artistic and spiritual fulfillment,
cognitive development, recreation, aesthetic and cultural values. Supporting services are those that
maintain essential condition for life like nutrient cycling, polinization, soil formation, oxygen production
and primary production (MEA, 2005; Mohar & Rodríguez Aldabe, 2008)(Figure 1.)
Figure 1. Environmental Services Classification (MEA, 2005; FAO, 2007)

37
The symbiotic relationship between humans and environmental services poses a great challenge when
the management of the latter is necessary. They can be easily produced or degraded by individual
decisions (FAO, 2007). Many of these decisions have led to diminishment of several environmental
services. Without proper understanding of the Earth systems they can be thrown overboard and
endanger not only human well-being but also planetary life. These decisions are affected by direct and
indirect drivers (MEA, 2005).
The MEA (2005) has identified five indirect drivers of change in ecosystem services: population change, change in economic activity, sociopolitical factors, cultural factors, and technological change. This factors can increase or change the way humans make use of environmental resources in very different and complex ways (MEA, 2005). For example, an increase in population could lead to more demand of certain environmental services but if it comes with technological improvements and positive sociopolitical changes it could also lead to decreased demand. Or in the contrary, a population decrease could lead to an augmented demand if economic prosperity promotes greater consumption. All five drivers interact with each other and cannot be regarded individually or expect complete influence from a single driver. The direct drivers are habitat change, overexploitation, invasive alien species, pollution and climate change (MEA, 2005). All of them are, as direct drivers, are synergic and on the contrary of the indirect drivers, an increase in any direct driver must certainly increase another one. Overexploitation increases habitat change since land depletion from overexploitation demands more land to be exploited. Increased demand experienced since the last century has put great pressure over almost every environmental service. The conversion of ecosystems to agriculture land is the most evident change and one of the most influential ones. To reverse current degradation and overexploitation is necessary to not only change all direct drivers but also indirect drivers.
6.1. Carbon Sequestration One of the main chemical components of life on Earth is carbon (NOAA, 2013); every carbon atom has
been recycled infinitely since the origin of Earth and has been part of countless life forms, creating the
carbon biogeocycle (Figure 2.). Carbon atoms are exchange freely between sources called sinks; which
are the atmosphere, hydrosphere and lithosphere, by the abiotic part of ecosystems and biosphere. The
uncontrolled release of carbon from one sink to another disrupts the carbon cycle and generates
unbalances in global systems (NASA, 2011). These unbalances in turn affect global temperature, ocean
acidity and plant growth (NASA, 2011). Carbon sequestration is the attempt to transfer carbon from the
atmosphere to hydrosphere, lithosphere and biosphere (EPA, 2013), taking advantage of the carbon
cycle, mainly in soil and vegetation (Environmental Protection Agency , 2012). Through biological
processes, like photosynthesis, active CO2 is fixated in terrestrial ecosystems to avoid climate change
(GreenFacts, 2013; Oilgae, 2013). There are three ways to sequester CO2 from the atmosphere: oceanic,
geologic and terrestrial sequestration. Oceanic sequestration is pumping CO2 into deep ocean basins to
stabilize it and then be disolved into the water (Daniels, 2013), this approach could potentially acidificate
oceanic waters and have negative impacts to aquatic ecosystems. Geologic Sequestration is the injection
of CO2 from fixed sources, industrial ones, to geological formations or to places formerly occupied by
natural gas or oil (EPA, 2013). The technology to accomplish this kind of sequestration is being developed
and poses doubts regarding leakage and aquifer contamination. The only proven way to sequester
atmospheric carbon is terrestrial sequestration. It is the storage of CO2 in soil and vegetation through the

38
carbon cycle and photosynthesis. Changes in land use like afforestation and reforestation, AFSs and zero
tillage can lead to increases of ecosystem stocks of CO2 (FAO, 2007; Daniels, 2013)(Figure 3.).
Figure 2.Carbon Cycle. (Connexions, 2013)
Figure 3. Terrestrial Carbon Sequestration. (FAO, 2007)

39
Agriculture is a significant source of GHG; 14% of GHG emissions can be attributable to agriculture (CCAFS, 2013) and 20% to land use change (deforestation and forest degradation) (van der Werf et al., 2009). Therefore, agriculture has an estimated emission mitigation potential of 2.3 billion tons of CO2e (FAO, 2007). The advantage from terrestrial sequestration via agriculture is the relative low cost and the contributions that it makes to biodiversity conservation, watershed protection and to social issues.
6.2. Payment for Environmental Services
Despite the great importance of environmental services to human life and well-being it is noticeable
their continuous and progressive degradation (FAO, 2007). As the MEA (2005) reports 60% of the ES
analyzed are being degraded or exploited unsustainably. 20 of 24 ES monitored have experienced an
increase in usage and some of them have declined due to overexploitation (MEA, 2005).
From an economic standpoint, degradation constitutes a decrement of present and future capital. This loss is not considered by traditional macroeconomic accounting and gross domestic product (GDP) does not reflect its value (MEA, 2005). Externalities generated by the agriculture, industry or services sectors are not considered within the GDP. The main reasons for this are that most ES are free-access and the future value of them is difficult to be estimated given the uncertain demand and use of many goods and services. Despite ES degradation per capita income has improved in many countries; China, i.e. has experience a rapid economic growth in the last decade and has taken a prime place in global economy (World Bank, 2013) but at the cost of great land degradation. The alteration and destruction of ecosystems providing ES are attributable to the lack of an incentive to
protect such ecosystems (Gobbi, 2011). An attempt to include these externalities to mainstream
economy and to decrease ecosystem degradation has been the market-based payment for
environmental services (PES) approach (FAO, 2011). PESs encompass a large array of economic tools that
encourage environmental awareness and sustainable development. PES is defined by Wunder (2005)
and FAO (2011) as:
“A voluntary transaction where a well-defined ecosystem service (ES) is ‘bought’ by a minimum of one ES
beneficiary from a minimum of one ES provider if and only if the ES provider continually secures the ES
provision (i.e. with an element of conditionality)”.
PES compensate providers for the supply of ES to society and there are two ways in which they can be
delivered; one is by augmenting the amount of an ES (i.e. planting trees for carbon sequestration) or by
reducing or avoiding ES degradation (biodiversity conservation) (FAO, 2011).
Generally land uses (i.e. AFSs) that produce ES are more profitable in the long term but they have high
implementation cost compared to other land uses. If land users are to convert their lands to ES sources is
necessary to help them cross the gap of technology, implementation and labor costs. So the logic of PES
is simple, to provide extra income or pay to ES providers to supply ES through alternative practices (FAO,
2007; Gobbi, 2011) sending the appropriate signals to the market and promote the general adoption of
sustainable practices.
The services more commonly commercialized are carbon sequestration, biodiversity conservation, watershed protection and scenic beauty (FAO, 2011; Gobbi, 2011). PES are paid by area and the logic behind this is to attribute certain amount of ES provided to a specific area unit or by the implementation of specific environmental friendly practices (ecolabelling)(Figure 4.),.

40
Carbon sequestration is the fixation of atmospheric CO2 in terrestrial sinks. Carbon markets operate at a global scale and are divided into compliance markets and voluntary markets. Compliance markets are those enforce by national governments or international institution like the UN with its CDM market, these markets are ruled by laws and treaties and encourage decrements of GHG emissions and increases of carbon stocks. Voluntary markets operate without the enforcement of any party and as its name says the participation in it is completely voluntary. Biodiversity conservation protects genetic and species biodiversity; it is traded globally to foundations, NGOs and individual consumers. Biodiversity conservation is measured through different indexes and depends on what is the main objective of the consumer. Watershed protection is the protection of water bodies like rivers and lakes, and its scale is local or regional. Beneficiaries include private companies (bottling water companies), governments representing people, farmers, etc. Scenic beauty is integrated to PES through ecotourism and adventure tourism. In this approach, the goal is to conserve landscapes with cultural or historic relevance. Scenic beauty is the most difficult to value since its value is based on subjective perceptions. It can be easily perceived that one ES cannot be supplied without incurring in the generation of any of the others. To harness the whole potential of some areas, “bundle” ES have been presented as a solution (Gobbi, 2011). Bundle ES is the consolidation of all ES that an area is able to produce to provide better incentives to inhabitants of the area. It has also been discussed that bundle ES could help reduce inequity when distributing PES income (Francia C. Campello et al., 2007; FAO, 2011), but increased transaction cost and difficulties to value all ES in a single PES scheme has rendered bundle ES ineffective.
There are many approaches when paying for ES without considering public policy efforts. Command and
control (Cap and Trade), voluntary PES and ecolabelling are the three main schemes used depending on
who is funding the programme. They can be implemented by the public or private sectors. Public sector
funded programmes are the most common way to tackle PES. Governments make use of taxes revenues
and international resources, i.e. GEF, to encourage certain practices. Private sector programmes are
those developed with support of private capital or assistance to develop ES
conscience and sustainable practices (FAO, 2007).
Command and control is the governmental approach to PES, in this case a government enforces limits of
pollution or established desire conditions to certain productive sectors. Governments promote PES by
privatizing externalities; this is to impose the ownership of externalities to private entities whether they
are positive or negative. Privatization of externalities gives bases to “Cap and Trade” programmes,
governments issue permits to pollute and allows the trade of such permits (FAO, 2007; EPA, 2012), the
vast majority of this programmes are based on carbon sequestration.
Ecolabelling consists in certification of ES producers who use determined practices. Certifying entities verify that producers follow environmental friendly practices and award them with a label that distinguishes them in the market. Consumers with differentiated preferences will pay an extra prime for products with such labels and encourage producers to follow good practices. It is a direct way to send market signals to both ends of the productive chain.

41
Figure 4. Environmental Services and their Potential Audience. (FAO, 2007)
The most crucial detail in any market is price, to incite an ES provider to participate in a PES scheme they need to receive, at least, the conservation cost and the opportunity cost to change his land uses. Within this price is necessary to include the risk of the provider to participate in PES and to change his known and proven practices (Gobbi, 2011). One of the great challenges in any PES scheme are the transaction costs incurred during all phases of a PES project; costs of design, capacity building, negotiation, implementation, verification, certification, monitoring and commercialization of ES (FAO, 2011) which need to be considered while analyzing the profitability of a PES. Generally, the final price falls between the opportunity cost and the real value of the ES minus the transaction costs. To determine the “real value” of ES, FAO (2007) has proposed the use of the “total economic value” which emcompasses direct use value, inderect use value, option value (value attributed to the possibility of future use of any given good or service) and non use value (value to an individual simply by the conscious of the existance of a good or service) (FAO, 2007). PES enclose many components and the complexity inherent in them make the whole an entanglement.
Since PESs obey their own rules and external ones, several barriers need to be surpassed in order to
complete a successful project and attain benefits to all involved parties. As mention before, transaction
costs are a great barrier to most PES programmes and sometimes these are so high that absorb the
profitability of the programme, up to 90 percent of the benefits can be taken by transaction costs (Niles
et al., 2002). The main cause for them is uncertainty perceived in negotiations, insurance, certification,
verification, monitoring and legal processes (FAO, 2007; FAO, 2011).

42
Another great barrier to PES is “additionality”. Additionality is a requirement placed to avoid trade of inexistent benefits. That is to say, provided ES need to be additional to a “business as usual” scenario. A natural reserve cannot be considered for a PES scheme since it does not produce additional ES, it would produce them whether a PES scheme is implanted or not. Or, if farmers have as a usual practice to abandon the land and leave it to natural reforestation this land would not eligible for PES since there is no additional benefit, reforestation would occur with or without PES. Lag time between implementation and actual income from PES is a great problem. Many ES providing
activities need substantial amounts of time to be implemented and then certified, during this period is
difficult for some providers to maintain project costs without external financial support (FAO, 2007).
For last leakage, associated to additionality, is to transfer ecosystem degradation to neighboring properties. Leakage has to be as reduced as possible in every PES implementation (FAO, 2011). If a farmers changes to organic farming reducing his output and transfers that increased demand to non-organic systems the benefit is lost when other farmers augment the use of agrochemicals, therefore the first generates leakage. Many of these approaches are focused on agriculture since farmers are “the largest group of natural
resources manager on Earth (FAO, 2007)” and agriculture has a large potential to reverse land
degradation. Farmers have a symbiotic relationship with their land, they depend on it to produce goods
and the land depends on how it is manage by farmers. Many agricultural practices encourage land
degradation to satisfy an ever increasing demand. And it is precisely here where PES take action, many of
the sustainable management possibilities are not economically feasible to small and poor farmers and
PESs help to bridge economic challenges (FAO, 2007) and adopt environmentally friendly practices.
Agriculture can improve the three mainly commercialized ES, carbon sequestration, biodiversity
conservation and watershed protection.
6.3. Carbon Market
The carbon market is the place where certificates, representing the emission of one ton of CO2 or a ton
of other GHG equaled to one CO2 ton (tCO2e), are traded. Carbon trading started on 1990 with the IPCC
and the signing of the UNFCCC after scientific evidences linked GHG with global warming (Vinícius da
Costa, 2008).
The purpose of the UNFCCC is the “stabilization of greenhouse gas concentrations in the atmosphere at
a level that would prevent dangerous anthropogenic interference with the climate system. Such a level
should be achieved within a time-frame sufficient to allow ecosystems to adapt naturally to climate
change, to ensure that food production is not threatened and to enable economic development to
proceed in a sustainable manner (UNFCCC, 2013)”.
There are 3 groups in which countries are classified, developed countries (Annex I); developed countries
who assist, financially and technically, economies in transition (EIT´s) and developing countries to reduce
their emission (Annex II); and developing countries (Non-Annex I) (Vinícius da Costa, 2008). By signing
the Kyoto Protocol, Annex I countries agreed to reduce their GHG emission to pre-1990 emission levels
(UNFCCC, 2013). This document created the carbon market by developing “certified emission reduction”
(CER). CERs represent one ton of CO2 or CO2 equivalent and they allow to trade GHG emissions between
Annex I countries or to acquire them from “Clean Development Mechanism” (CDM) developed in Non-

43
Annex I countries. CDMs are projects developed in cooperation between Annex I and Non-Annex I
countries to avoid GHG emissions or to increase carbon stocks (UNFCCC, 2013). This functions as a
technology transfer and it gives incentives to developing countries to adopt sustainable practices.
The trade of CERs (Kyoto Protocol Article 17) allows Annex I countries that achieved their goal of emissions without getting to their limits to sell those “excess” CERs to other Annex I countries. And Article 12 also allows Annex I countries to buy CERs generated in CDM projects implemented in Non-Annex I countries (FAO, 2007; Vinícius da Costa, 2008). From these bases is that carbon markets were born but there are also markets not fostered by the UN like national and regional trading schemes and global markets like the Voluntary Carbon Market (VCM). There are two kinds of carbon markets, compliance markets and voluntary markets. Compliance markets are based on cap and trade schemes and are enforced by national, regional or international institutions under treaties or laws. The classic example is the previously mentioned market of CERs by the UN. It is the biggest carbon market but it does not foster all kind of projects. CDM projects follow specific and detailed methodologies and only recognized CERs from specific sectors, the advantage of this market is it aversion to risk and the confidence that provides, but on the downside it does not allow the implementation of a project in certain fields, like agriculture. Agriculture is left out of CDM project because it does not contemplate reduced emissions from deforestation in developing countries or carbon sequestration in soils, the transaction cost are high and the process complex and CERs prices are low rendering CDM unprofitable for farmers (FAO, 2007; Peters-Stanley et al., 2013). Voluntary markets on the contrary are small but flexible and include almost all activities capable of producing “Voluntary Emissions Reduction” (VER), the counterparts of CERs (Peters-Stanley et al., 2013). VCM participants are enterprises and individuals interested in reducing their carbon footprint; differentiate themselves from their competition, or parties anticipating the implementation of compliance market hoping to have lower prices before its operation. This market is highly differentiated and seeks to harness the potential of carbon sequestration to impact social and biodiversity aspects. Voluntary market is the trading floor for offsets transacted between private parties (Montagnini & Finney, 2011) and its public are companies, individuals and entities wishing to reduce their carbon emissions but without being under an mandatory reductions scheme. Participation under this market is strictly voluntary and participation responds to ethical concerns towards emissions, market differentiation, and precompliance readiness or to gain carbon-trading expertise (Peters-Stanley et al., 2013). There are various standards with their own certification processes and some emission registry services without having a universally accepted one; nonetheless, some standards have seized considerable shares of the market (Green Markets International, 2007). (Figure 5.). From the supply standpoint, VCM has 3 main actors and can be operated at two levels. There are project developers, brokers and retailers (Peters-Stanley et al., 2013). Project developers can be owners of the project or entities developing carbon projects for the owner. Brokers help producers and consumers to find each other; their work is to bridge informational gaps between the extremes of the market without taking ownership of offsets, only a commission over the value of the operation. And retailers are those that buy offsets from project developer to resell them to consumers. They have deep knowledge about the market and consumer preferences and tailor VERs baskets according to consumer tastes.

44
Figure 5. Market Share by Buyer Type (Peters-Stanley et al., 2013)
These 3 actors operate at different levels with the consumers; retailers operate on the secondary market; that is to say, they are an extra step between developer and consumer. Direct transaction between consumers and developers are called primary market operations or “over the counter” operations (OTC) (Peters-Stanley et al., 2013). Brokers fall into gray areas of this level; they represent an extra step but do not directly operate the transaction (Figure 6). To understand how the VCM works is necessary to comprehend what a standard is, they are a strong influence to many specificities of the VCM. There are entities, like NGOs or governments, that generate frameworks for the design, verification, monitoring, certification and general operation of offset producing projects, this frameworks are called standards (CCBA, 2013; VCSA, 2013). Standards are sets of rules for the development of a VCM project. They provide certainty to consumers; they assure consumers that their investments are truly generating changes in the real world and that they are signaling correctly the market about their preferences. There is a great variety of standards, each of them focusing on different particularities of the offset producing process. This array incited the evolution of a gourmet VCM; each buyer consumes the specific kind of offset that satisfies its palate. For example, CCB standards pay their attention to biodiversity aspects of the carbon business while Gold Standard focuses more on the quality of the offset with rigorous methodologies that ensure delivery of an actually produced offset (Gold Standard, 2011; CCBA, 2013). To add extra seasoning to this gourmet market there are “add-on” standards. These standards do not account for carbon offsets but instead to the co benefits that carbon sequestration brings along. They repair if a project develops social or biodiversity features along with carbon offsetting (SocialCarbon, 2003). These standards specify precisely what the consumers are willing to support even at an extra cost. In 2012 a VERs from a pure VCS project had a minimum price of $1 USD but a VCS + SocialCarbon had a minimum price of $4 USD (Peters-Stanley et al., 2013).

45
Figure 6. Voluntary Carbon Markets Value Chain. (Peters-Stanley et al., 2013)
One advantage of VCM over CDM is its flexibility and the ability to encompass all kinds of projects. In 2012, the prevailing sector was renewable energy with 34% of the market and it was closely followed by forest and land use projects with 32% of the market (Peters-Stanley et al., 2013). This is understandable since VCM does contemplate forestry and agriculture activities as sources of offsets and standard developers have generated sound methodologies for this sector. Another advantage is the discussed gourmet quality of VCM, reaching higher prices per offset. CDM paid less than $1 USD per offset in 2012, while the average price for VER´s is $5,9 USD with a maximum price of $46 USD (Peters-Stanley et al., 2013)(Figure 7.). The positioning of two standards as the major players in the market shows the confidence consumers have on them, not only to sequester carbon but to impact biodiversity and social goals. Standard developers have heard consumer demands and have focused on these sectors creating partnerships among them, the case of VCS and CCBA, and the acquisition of well established brands like CarbonFix by the Gold Standard (Peters-Stanley et al., 2013). The main standards are VCS, The Gold Standard and the CCB standards (Figure 8.). VCS has the lead because of the partnerships it has secured with CCB, SocialCarbon and Fairtrade; but also by developing methodologies to include soil carbon in afforestation / reforestation and land change projects (Peters-Stanley et al., 2013).

46
Figure 7. Market Share by Project Category. (Peters-Stanley et al., 2013)
Standards are integrating “non-carbon” project´s attributes like vulnerability reduction via adaptation, water quality, biodiversity, women’s empowerment, and public health. For reduced vulnerability, there is the Higher Ground Foundation, for incorporating the women´s role in the carbon market and included activities it was developed the Women’s Carbon Standard, for the water component the Water Benefit Partners and for biodiversity the Business and Biodiversity Offsets Program is being developed (Peters-Stanley et al., 2013). It needs to be said that, not only cobenefits are being developed but also ecolabels like Fairtrade, FSC and Rainforest Alliance are being aligned to harness as much resources as possible to boost VCM and ultimately encourage positive changes against climate change (Gold Standard, 2012).
Figure 8. Market Share by Project Standard. (Peters-Stanley et al., 2013)
As said before, the VCM has turned “gourmet” and consumers are getting more knowledgeable about the projects themselves and their tastes requirements. Consumers prefer small socially strong backgrounded projects rather than faceless mega projects. To harness co benefits through additional

47
standards is not enough, to develop a good offset producing project is necessary to differentiate it with solid bases and precise information about the specific details for a given project. In a sea of projects and consumers it is necessary to link the appropriate match. Consumers are willing to pay more for a “custom-made” project than for a generic one, rendering good benefits for small but charismatic projects. The characteristics of the VCM and its advantages present it as a perfect choice for small rural projects seeking to give incentives to farmers other than the own profitability of sustainable practices or seeking to bridge the gap posed by high implementation costs.
48
7. Paradigm Shift
The linear thinking that classical science and economics have followed since from the XVI century led the World to an unknown development in all sectors with the Industrial Revolution. Since its beginning on the second half of the XVIII century, human population sprouted from less than a billion to the actual seven billion, putting pressure on all Earth´s systems (US Census Bureau, 2012; WorldoMeter, 2013). Malthus was right to notice that population growth would one day make, seemingly infinite, Earth´s resources scarce (Malthus, 1798). The last century was an idyllic period for human kind, technological advancements and new energetic sources boosted economic growth bathing most sectors of society with unseen benefits and unprecedented levels of quality of life. This idyllic period not only proved Malthus right, but it also carried new consumption patterns but with
the old preconception of infinite natural resources, planting the seed for current environmental
degradation (Holling, 2001). With continuous technological advancement; the trust on science and
technology that humans have had since the Renaissance was reaffirmed in the population´s psyche,
making it believe that any future problem would be solved through science and technology. The problem
was that science, technology and economics had the same old linear perspective, linking one effect to
one variable and tackling problems by curing the symptoms rather than the causes.
Productively there was a shift from rural economies to industrialized ones, generating high amounts of
wealth (MEA, 2005). Increased but unequal wealth generated a polarized society; where differences
between social classes grew more than anticipated, leaving the poorest without many opportunities and
leading them to famine. To eradicate famine, initiatives like the “Green Revolution” were put in place.
Again linear thinking was used and famine and poverty were solved by adding oil based inputs to fields
and other activities. Use of natural resources was not made considering them as capital and without
considering availability of such resources to future generations. Also externalities from their degradation
and overexploitation have never been included, current economic accounting does not incorporate the
value of natural resources in its GDP methodology (Mohar & Rodriguez Aldabe, 2008). Linear thinking
was vouched by governments and justified by affirming that development had a price to be paid, in this
case Earth´s system would have to suffer for human development.
This general preconception of how the World works led to a schism between the rural and the urban.
Continuous improvements in urban quality of life appealed to most population and rural-urban
migrations took place. During these migrations; contact between human and nature, and between rural
and urban was lost. Ignorance about the symbiotic relationships between cities and farms aggravated
pressure over natural resources, the new dichotomist relationship between urban and rural dwellers
enabled careless squandering of precious resources (MEA, 2005; Mohar & Rodriguez Aldabe, 2008)
Disregard for environmental degradation and pollution reached the limit when reports like “Silent
Spring” were publicly known (Carson, 1962). Pollution and diminishment in urban quality of life were so
evident that governments and international entities reacted and took advantage of approaches like GST
and IWM to integrate non-linear thinking to solution and to abate environmental problems (von
Bertalanffy, 1976; Cotler, 2007).
As Vitousek et al (1997) mentioned it years later:

49
“We are changing Earth more rapidly than we are understanding it…”
A system approach was necessary; environmental problems demanded approximations that could
consider all components involved in such complex issues and to understand causes and effects of ever-
changing systems instead of treating the symptoms. Awareness of environmental problems was the first
step governments took from there they formulated institutional actions reflected on international
efforts.
The first international efforts were the United Nations Conference on the Human Environment in 1972
focused on the effects of pollution over human health and the Man and the Biosphere programme by
the UNESCO to reduce and avoid biodiversity loss (Mohar & Rodriguez Aldabe, 2008). After those first
attempts, a noticeable international emerged and gave the first step towards an integration of economic
development and environmental conscience when the Brundtland Commission in 1983 defined what
“sustainable development” was.
“Sustainable development is development that meets the needs of the present without compromising
the ability of future generations to meet their own needs (Brundtland Commission, 1987)".
After this schism, the World changed and as further efforts to achieve “sustainable development” the
UNFCCC and the Agenda 21 were developed (Mohar & Rodriguez Aldabe, 2008). As discussed in previous
chapters the UNFCCC sets the bases for the reduction and avoidance of GHG´s through a tradable
permits scheme and the Agenda 21 provides a framework for the implementation of action capable to
revert environmental degradation and attain sustainable development (Agenda 21, 1992; UNFCCC,
2013).
Since this point on, many attempts to match environment with economy have been made. One of them
is the development of a methodological philosophy to merge social and natural systems into one single
study object. SESs are that tool that crosses interdisciplinary capabilities to deliver sound result involving
all possible components (Glaser et al., 2008; Mohar & Rodriguez Aldabe, 2008). Another effort through
social awareness is “green economy” which tries to be materially and energetically efficient making
better use of limited resources and also tries to revert environmental degradation (FAO, 2011). The most
important of this approach is the conscience acquired by a large mass of the population. Is more and
more evident how this “green” trend infiltrates all aspects of human life.
The most radical attempt is “circular economy”, this approach promulgates the idea of recycle energy
and mater used in any product mimicking nature biogeophysical cycles. To do so, the concept of
ownership is modified to shift from owning a product to having access to it; it also promotes intelligent
design of products to allow maximum recycling of every element (Ellen McArthur Foundation, 2012;
Circle Economy , 2013; Wrap, 2013).
If a linear economy was capable elevate nominal quality of life and twentyfold global GDP, what can a
“green” or “circular” economy with an environmentally conscious population can do? (Ellen McArthur
Foundation, 2013)

50
8. Research questions
As said before the focuses of this research are two points:
How does a certain agroforestry system works? This is considering the general basis of systems thinking
and the more specific details portrayed by the socioecological systems approach; the objective is to
portray the agroforestry system itself and the social, economic and environmental reality in which it lies.
After depicting the agroforestry system, the next research question is: Does this agroforestry system
have potential in the voluntary carbon market? The objective is to know if such agroforestry system can
be included on a carbon market scheme to procure additional funds for small farmers and to increase
the interest in this kind of rural systems.
9. Methodology
To understand the subtleties of a farming system, of an AFS for the matter; a literature review, contained
in the previous section of this research, was developed. This framework provided the basis for
understanding systems theory, environmental services, payment for environmental services and carbon
market needed to answer the research questions.
To answer the first research question it was necessary to select a particular AFS within the great variety
present on the state of Rio de Janeiro. To select an AFS, a field research to the state of Rio de Janeiro
with a duration of three months was conducted. Experts from the State Department of Agriculture and
Livestock of Rio de Janeiro were consulted to know the presence of AFSs within the state. A list of all
known AFSs was elaborated and located on a map of the state of Rio de Janeiro. The parameters
followed to select the AFS were: proximity to the city of Rio de Janeiro, availability of information,
farmers willingness to assist the research, farmers expertise, carbon related information availability,
VCM requirements and social or environmental unique features. Three locations were selected
considering first their proximity to Rio de Janeiro capital. The selected locations were on the
municipalities of Cachoeiras de Macacu, Araruama and Casimiro de Abreu. With the help of the
Superintendence of Sustainable Development (Superintendência de Desenvolvimento Sustentável - SDS)
of the State Department of Agriculture and Livestock of Rio de Janeiro a series of exploratory trips were
conducted with the intention to determine the region and AFS more attuned with the objectives of this
research. After these three preliminary visits the AFS present in Araruama was chosen. Its closeness to
the city of Rio de Janeiro facilitated information recollection, the AFS also had information ready to be
used since it has been followed closely by personnel from the Technical Assistance and Rural Extension
Enterprise (Empresa de Assistência Técnica e Extensão Rural – EMATER). The owner of the property was
willing to facilitate information and to participate during the visits to the site, adding that he had long-life
expertise regarding AFSs and the community, where the AFS is located, possesses a particularly historic
ethnic background, differentiating the AFS from similar systems.
Before collecting firsthand information on the selected AFS, experts from the Superintendence of
Sustainable Development were consulted for the elaboration of the questionnaire to be applied during
posterior visits. To develop the questionnaire, prior work from the SDS was taken as a basis and more

51
specific questions were added. Additionally, a carbon market specialist was consulted to recollect carbon
market related information.
Once on the field the methodology proposed by Aguirre (1979 and 1983) for the registration of
traditional knowledge, regarding the use of natural resources, through the detailed description and
explanation of phenomena was used as a guideline. The objective is to define the different forms of use
of natural resources within the AFS in their natural and social context. The general sequence of this
methodology is the following:
• Development of a list of the phenomena of interest.
• Selection of informants.
• Description of the observed facts.
• Record in a field-book and on an audio recorder the descriptions and explanations of events.
• Transcription of each interview
• Synthesis of information about each fact.
• Integration of a final report from the synthesis of the facts. This allows development of a
monograph that explains the phenomenon under study.
These monographs are the first step toward understanding the causal relationships between the social,
economic and environmental aspects of the AFS. This understanding is essential to establish the
principles and practices upon which management can use conservation of resources (Levy & Aguirre,
1999). From the information derived from these monographs, the characterization of AFS present on
Araruama was made.
To answer the second research question it was needed to determine which VCM standard fitted for rural
activities and to land use changes. Because VCM is based on the reputation of the standard and trust
placed by consumer on the standard certifying carbon offsets only the standards with the most market
share were considered (Peters-Stanley et al., 2013). After selecting the main standards, a matrix was
developed to compare strengths and weaknesses, project costs and market appeal; identifying the most
appropriate standard and the one which would offer the best cost-benefit ratio.
After knowing that the Verified Carbon Standard (VCS) is best fit to the specific AFS in Araruama, a cost –
benefit analysis was conducted. This shows if the implementation of a carbon sequestration project
under a VCS scheme is worth the trouble of the farmer. After this initial cost-benefit analysis, it was also
analyzed if the addition of social or environmental co benefits certification has a palpable impact on the
price for produced offsets. Social or environmental co benefits differentiate projects and help them gain
extra primes in the carbon market (Peters-Stanley et al., 2013). The common add-on certifications for
VCS are the Climate, Community and Biodiversity Standards (CCB) and SocialCarbon. However, VCS is
currently working on the development of alliances with the Forest Stewardship Council and FairTrade to
incorporate non-carbon benefits of land uses like agroforestry (Peters-Stanley et al., 2013).

52
To conduct the analysis both costs and benefits were brought to present value applying the following
formulas:
Where PVB is present value of benefits, Bt represents total benefits, i represents the interest rate and t
represents time.
Where PVC is present value of costs, Ct represents total benefits, i represents the interest rate and t
represents time.
CBA represents the coefficient between PVB and PVC.

53
10. Study Area
The study area is in the community of Tapinoã, in the municipality of Araruama on the state of Rio de
Janeiro (Figure 9.). This falls in the southeast region of Brazil, heart of Brazil, which is the most populated
area of the country and responsible for 55% of the Brazilian GDP (Granell Pérez, 2004; IBGE, 2010)
despite being the second smallest region of the country. The state of Rio de Janeiro is the second biggest
economy of Brazil, contributes with 10.8% of the national GDP and it is the largest producer of oil and
natural gas of the country (IBGE, 2010). The state has undergone human productive systems since before
European colonization (Nehren et al., 2009). Since Portuguese settlers arrived, the state underwent
exploitation through forestry and different farming systems, reducing the original vegetation cover to
nearly 7% of its original extent (McNeil, 1996; IESB, 2007; IBIO, 2013).
The original biome of the region is the Atlantic Forest. This semideciduos tropical forest goes along the
Brazilian Atlantic coast from the state of Rio Grande do Norte to the state of Rio Grande do Sul for
almost 4000 km with a width of approximately 700 km., its core area occurs in the mountain ranges of
Serra Do Mar and Serra da Mantiqueira (Mendonca-Santos et al., 2003). Throughout its extension, the
Atlantic Forest contains microbiomes going from dense rainforests to savannahs (CIDE, 1998; Mallea et
al., 2011) caused by the variety of geomorphic formations like mountain ranges, plateaus, valleys and
coastal planes (IESB, 2007). Its ecological importance resides on the fact that it is a biodiversity hotspot
and nearly 50% of its species are endemic (Myers et al., 2000; Granell Pérez, 2004).
The state of Rio de Janeiro is one of the economic poles of Brazil and houses a population of 16.4 million
(IBGE, 2010). Its main economic activities are industry, tourism, services and mineral exploitation; only
1% of the GPD of the state is produced by agriculture (Mendonca-Santos et al., 2003; IBGE, 2004). The
state is composed by 92 municipalities divided into 8 governmental regions. The division helps planning
efforts to be more applicable and more attuned to the regions necessities.
The region “Baixadas Litorâneas” (Coastal Lowlands) has been known for its salt and orange production,
its fishery and husbandry activities; in more recent years the region has experienced a touristic boom
with the consequences of land division and real estate speculation. Touristic development has put
pressure on regional ecosystems; especially on the lacustrine ecosystems that characterize the region
due to poor domestic waste management and housing proliferation near natural reserves (CEPERJ ,
2013). The study case is located on the municipality of Araruama, known for being the main salt and
citrus producer of the state. The municipality belongs to the watershed of the São João River
characterized by cities and rural areas; the reigning vegetation covers are pastures and remnants of
different types of native vegetation. The mesowatershed of the Bacaxá River is in which the Tapinoã
community falls, within the Bacaxá river watershed lays the microwatershed of the Piri-Piri river that
flows over the community of Tapinoã (Figure 10.).
The climate on the region of Araruama is tropical with dry winters with an average annual temperate of
23° C and average annual rainfall of 993 mm. Under the Köppen classification, it is considered as an Aw
climate (Figure 9.) (Climate Data, 2013). The vegetation, within the Atlantic Forest, that flourishes on the
region is a semideciduous tropical forest (CIDE, 1998; Lumbreras et al., 2001.
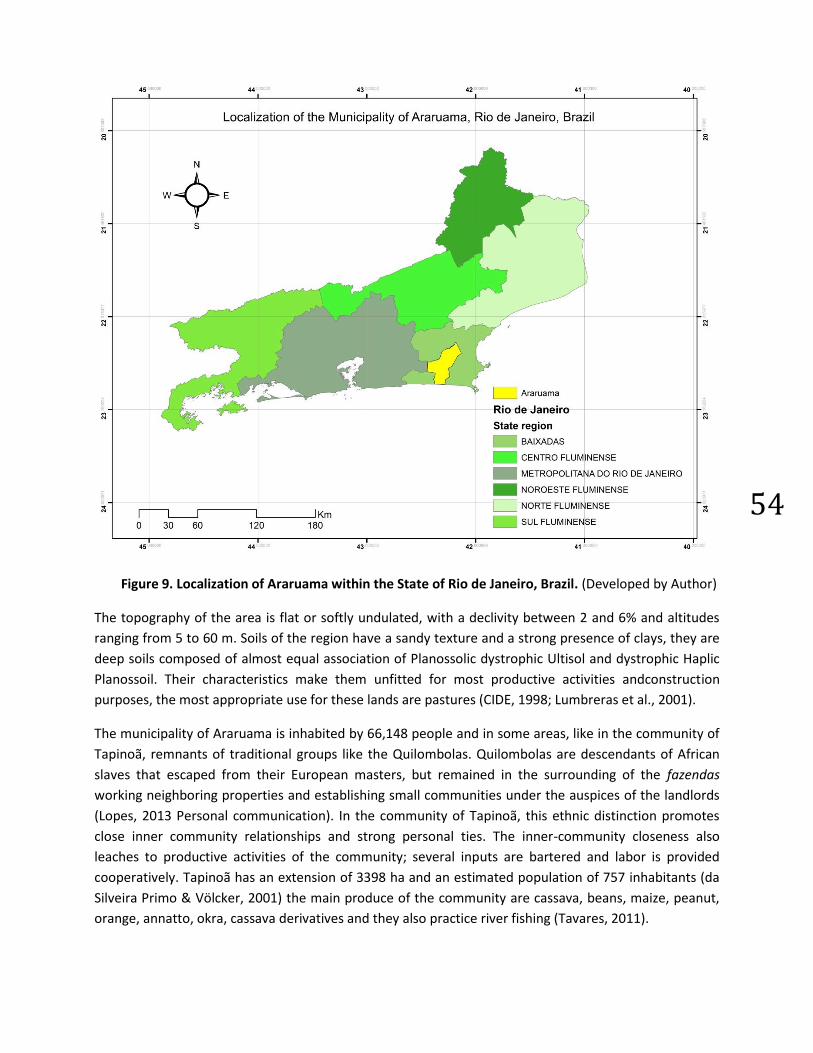
54
Figure 9. Localization of Araruama within the State of Rio de Janeiro, Brazil. (Developed by Author)
The topography of the area is flat or softly undulated, with a declivity between 2 and 6% and altitudes
ranging from 5 to 60 m. Soils of the region have a sandy texture and a strong presence of clays, they are
deep soils composed of almost equal association of Planossolic dystrophic Ultisol and dystrophic Haplic
Planossoil. Their characteristics make them unfitted for most productive activities andconstruction
purposes, the most appropriate use for these lands are pastures (CIDE, 1998; Lumbreras et al., 2001).
The municipality of Araruama is inhabited by 66,148 people and in some areas, like in the community of
Tapinoã, remnants of traditional groups like the Quilombolas. Quilombolas are descendants of African
slaves that escaped from their European masters, but remained in the surrounding of the fazendas
working neighboring properties and establishing small communities under the auspices of the landlords
(Lopes, 2013 Personal communication). In the community of Tapinoã, this ethnic distinction promotes
close inner community relationships and strong personal ties. The inner-community closeness also
leaches to productive activities of the community; several inputs are bartered and labor is provided
cooperatively. Tapinoã has an extension of 3398 ha and an estimated population of 757 inhabitants (da
Silveira Primo & Völcker, 2001) the main produce of the community are cassava, beans, maize, peanut,
orange, annatto, okra, cassava derivatives and they also practice river fishing (Tavares, 2011).

55
Figure 10. Localization of the Piri-Piri microwatershed within the municipality of Araruama. (Developed
by Author)
Figure 11. Climograph of Araruama (Climate Data, 2013)

56
11. Results 11.1. Overview
The case study AFS is located on the point with the UTM coordinates 23 K 775607 7483653. The property
is located on the rural community of Tapinoã and it has extension of 4.84 ha. The AFS is a demonstrative
unit implanted in cooperation between the Enterprise Technical Assistance and Rural Extension
(EMATER-RIO) and the Brazilian Service for Support of Micro and Small Enterprises (SEBRAE-RJ) to
showcase agroecological practices capable of adding environmental, social and cultural values to rural
production. The finality of the project is to educate regional population on agroecological principles and
to establish sustainable rural development strategies (Tavares, 2011).
The community of Tapinoã has been participating with EMATER-RIO since 2009 to promote
agroecological principles, it has served as a showcase for good agricultural practices to neighboring
communities and also as a place to exchange experiences and expertise. The owner of the property is a
seasoned farmer who actively participates with EMATER-RIO on the development and spread of
agroecological practices and on the conservation of native cultivars of beans. He has divided his property
to continue regular production and to implement the demonstrative unit. The owner falls into the
classification of small familiar farmer and operates the system himself with help of his wife. His land was
inherited; he has lived in the community for 52 years and manages the property for the last 20 years. In
average, they spend ten days a month maintaining the AFS with 8 hours working days. Zero tillage
practices are used, reducing labor to watering the unit, weed removal, application of organic fertilizers
(from the plant genus Gliricidia spp.) and pesticides (cow urine) and avoid the appearance or
proliferation of any pest or disease. The AFS, virtually, does not produce waste since it reintegrates all
available biomass to the system; it only requires labor and pesticides obtained by barter. Domestic waste
is also integrated to the system, excluding human waste managed into a standard septic tank.
The demonstrative unit has an extension of 1 ha and it was implemented in September 2010, having
been running three years until this study was made (Figure 12.). It can be classified as a forested banana
plantation and at the beginning of the implementation more than eleven species were planted: lemon
(Citrus latifolia), banana of the Prata-Anã cultivar (Musa sp.), pineapple (Ananas comusus), heliconea
(Heliconea sp.), alpinia (Alpinia sp.), mango (Mangifera indica sp.), inga (Inga sp.), pumpkin (Cucurbita
sp.), pigeon pea (Cajanus cajan), maize (Zea mays), cowpea (Vigna unguiculata sp.) , neem (Azadirachta
indica), rows grass (Brachiaria sp.) and gliricidia (Gliricidia sp.); but as the AFS developed seven cultivars
were pulled out from the AFS unit to a secondary productive unit that the owner has on the same
property due to bad performance. The priority species of the AFS are lemon and banana; pineapple did
not respond well and only remnants remain on the property.
Banana trees were expected to produce fruits after three years but diseases have reduced the number of
individuals on site and the amount of harvestable bananas. Lemon tree have grown normally and it is
expected to have the first harvest the first months of 2014. All trees on the unit are three years old,
bananas are supposed to be reap between the months of September and March every year; lemons will
be harvestable every three months.

57
Heliconea and Alpinia are ornamental plants and were added to the AFS as a way to increase income but
inflorescences resulted defective leaving them without commercial value and they can only be used as
seeds for sale. Inga, pumpkin, pigeon pea, maize and cowpea were also transferred to the secondary unit
because of poor performance.
Maize, pigeon pea and cowpea were used as service species of the AFS to improve soil quality. As stated
before, soil conditions on site are not ideal for agriculture due to its sand and clay contents but with the
help of maize and beans it was possible to ameliorate it enough to support banana and lemon. Neem
and gliricidia are used as insects repellant and as green fertilizer, respectively; neem has properties to
alter insect reproduction and foliage from gliricidia is cut and left on field to increase soil humidity and
edafologic quality (Pereyra et al., 2012). The owner continues to produce beans as part of his
participation on the program to conserve and reproduce native varieties of beans but on his secondary
productive unit. During the elapsed time of the AFS, 72 kg of beans have been produced allocating them
to consumption re-seeding and to a seed bank fostered by the community.
Within the unit, banana and lemon trees can be found in a band arrangement with interleaved rows
(lemon-banana-lemon) and within banana trees lemon trees are interleaved; in between rows grass
(Brachiaria sp.), gliricidia and plant residues can be found. The unit is surrounded by a live fence in its
South and East side and by secondary forest on its North and West border. The live fence prevents
erosion and runoff while, the secondary forest has a triple purpose: it serves as a buffer zone between
the AFS and neighboring properties which do not follow agroecological o “bio” practices, it also serves as
small private conservation reserve and to protect a small waterhole inside the property.
This waterhole provides water to all farm activities, after deviating the small creek formed by the
waterhole to two artificial ponds; water is pumped to the AFS unit and to the house of the owner.
Irrigation for the AFS was installed before implementation of this demonstrative unit and it operates by
dripping; unfortunately, the amount of water used cannot be measure since it is applied by the “rule of
thumb” depending to precipitations quantity and on the season.
Secondary forest on the property can be classified into a less disturbed secondary forest, which is at least
50 years old and into a more disturbed secondary forest with 20 years old. During visits to the site, both
secondary forests were sampled to know forest density and richness of species. On average from three
samples, the less disturbed fragment contains 3000 trees per hectare and the more disturbed fragment
contains 3800 trees; differences on richness are noticeable. On the less disturbed fragment only five
trees could be identified; Anadenanthera colubrina (cambuí angico), Serjania erecta Radlk (cinco folha),
Plathymenia foliolosa (vinhatico), Bixa Orellana (Urucum da mata) and Filicium decipiens (samambaia).
On the more disturbed fragment seven species were identified; Guatteria australis (imbiu), Tibouchina
Granulosa (cuaresmera), Couratari asterotricha (imbirema), Campomanesia guazumifolia (sete-capas),
Rapanea guyanensis (pororoca), Lithraea brasiliensis (aruera) and cambuapamerí. It is important to
explain that more species were present on both fragments but both the owner and the technical escort
from EMATER could not identify all of them; nevertheless richness of trees differences were noticeable
on field.
As mention before, secondary forests serve also as small reserves; several wild animals have been
sighted. Property owner listed wildcats, lizards, monkeys, snakes, birds, porcupine, wild rabbits, raccoon,
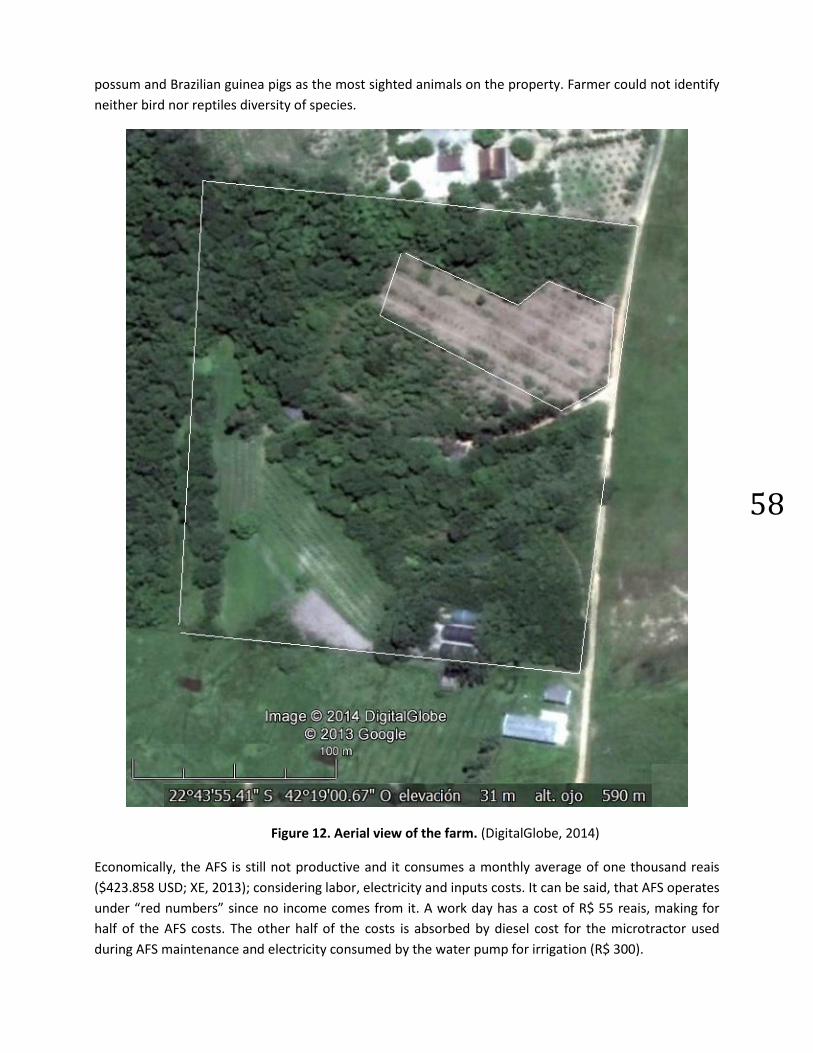
58
possum and Brazilian guinea pigs as the most sighted animals on the property. Farmer could not identify
neither bird nor reptiles diversity of species.
Figure 12. Aerial view of the farm. (DigitalGlobe, 2014)
Economically, the AFS is still not productive and it consumes a monthly average of one thousand reais
($423.858 USD; XE, 2013); considering labor, electricity and inputs costs. It can be said, that AFS operates
under “red numbers” since no income comes from it. A work day has a cost of R$ 55 reais, making for
half of the AFS costs. The other half of the costs is absorbed by diesel cost for the microtractor used
during AFS maintenance and electricity consumed by the water pump for irrigation (R$ 300).

59
AFS implementation costs were R$ 26,123 total (11,063.68 USD), including all supplies needed, labor and
seedlings. 328 trees were planted, 128 lemon trees and 200 banana trees; with an expected production
of 7680 kg of lemon after three years with a market price of one real per kilo and 4800 kg of banana, also
after the third year, with a market price of 1 real per kilo. Considering the one real price per kilo, AFS
would generate a yearly income of R$ 12,480 (5,286.13 USD).
Current farm income comes from services provided by the owner of the farm as a consultant to EMATER-
RIO and from selling part of his bean production. His estimated monthly gross income is R$ 2000, minus
AFS maintenance cost which leaves R$ 1000 as his monthly net income.
As mentioned before, the Tapinoã community is composed by a Quilombola group which promotes inner
community trust and cooperation. It was also stated that most of the AFS inputs are bartered so costs
are reduced in a traditional financial way but this same sense of inner trust makes difficult to sell AFS
production. AFS owner mentioned that he rarely goes to an established market since he can acquire
almost every good in his own community through barter. AFS production cannot reach regional markets
since every good in the community is bartered and only a small fraction is actually sold.
In summary, it is a three years old simultaneous forested banana plantation accompanied by citrus trees
and three service species to maintain good soil quality (May et al., 2008). It is arranged in interwoven
rows of banana trees and lemon trees surrounded by a live fence and secondary forest. Zero tillage and
agroecological technics have been followed and it requires ten labour days of two people. The AFS is
located on a Quilombola community with a sound background on this kind of systems (May et al., 2008)
that is used by rural extension institution to showcase agroecological practices. Since the AFS is an
experimental unit, economic performance has not been followed as closely as ecological and social
performance.

60
Table 1. Summary AFS results

61
11.2. Potential of Agroforestry Systems in the Voluntary Carbon Market.
The selection of the best fitting offset standard to the case at hand was done by sifting among all major
offset standards. Confidence and certainty are key attributes that VCM consumers seek when buying
offsets (Peters-Stanley et al., 2013). This confidence comes from offset standards reputation;
accordingly, offset standards with the most market share are those which have proven their integrity and
methods to certify actual and real carbon reductions or emissions avoided. Only the four offset
standards with more market share, according with Peters-Stanley et al., (2013) in their State of the
Voluntary Carbon Market 2013, were considered. The selection consisted on the Verified Carbon
Standard (VCS), the Gold Standard/CarbonFix (GS), the Chicago Climate Exchange Standard (CCX) and the
Climate Action Reserve Standard (CAR). To discern from these standards, aspects like applicability,
available methodology, offset price, inclusion of non-carbon benefits and certification costs were
examined (Peters-Stanley et al., 2013; Peters-Stanley et al., 2013).
Flexibility, applicability and credibility were the main focus while scrutinizing these standards.
Methodologies needed to be able to adapt to different settings but with a solid background.
Methodologies based on the CDM framework were preferred given that it is the most trusted framework
currently available and this would allow offsets to be placed not only with buyers on the VCM but with
buyers facing pre-compliance regional markets. Secondly, price was a major factor since AFS projects
tend to have high implementation costs as discussed earlier. And finally, inclusion of the marketable
non-carbon benefits had a special consideration.
Climate Action Reserve focuses on conservation through Improve Forest Management (IFM), REDD and
Afforestation/Reforestation projects with good prices ranging $8.9 USD per offset (Peters-Stanley et al.,
2013). The downside of this standard is its restricted applicability to the U.S. and Mexico. Also, currently
it is undergoing restructuration due to the upcoming California Cap and Trade program and new
methodologies to include AFOLU projects are still under development (Peters-Stanley et al., 2013).
The CCX methodologies are the remainders of the extinguished Chicago Climate Exchange but still being
used, mainly in North America. It was dismissed because of its low price per offset, .1 USD on 2012, due
to its usage of ISO methodologies, obsolescence and decline on market (Peters-Stanley et al., 2013). CCX
would have been a good alternative since its methodologies were mainly applied to projects focused on
Sustainable Agricultural Land Management (SALM) and agroforestry.
Gold Standard was focused mainly on renewable energy projects, to bridge the gap and enter on
Agriculture, Forestry and Land Use (AFOLU) projects it acquired the CarbonFix Standard (CarbonFix,
2012). In 2012, CarbonFix / Gold Standard certified offsets with an average price of $11.4 USD, which
would have rendered it as a profitable option (Peters-Stanley et al., 2013). The Gold Standard has
initiated the creation of alliances with non-carbon certification entities like Fairtrade and the Forest
Stewardship Council to add all possible value to their offsets and differentiate themselves from the
competion while improving life quality of farmers. But due to the Gold Standard /CarbonFix merger, it is
a standard on transition generating uncertainty and their methodologies for AFOLU projects are under
development (The Gold Standard , 2013); rendering this standard unfeasible.
62
The Verified Carbon Standard (VCS) was selected as the best fit to the AFS present on Araruama, Brazil.
Adding all of its variants, it is the lead standard with 45% of the whole VCM and 71% of market focused
on land use projects (Peters-Stanley et al., 2013; Peters-Stanley et al., 2013). VCS certifies carbon offsets
from a great array of possibilities, but until recent years it has only focused on pure carbon benefits
leaving non-carbon benefits out. To incorporate biodiversity benefits from AFOLU projects it forged an
alliance with the Climate, Community and Biodiversity Alliance (VCS, 2013). VCS also incorporates other
non-carbon certifications like SocialCarbon to incorporate the social benefits that farmer communities
experience with the development of a VCS project. VCS was chosen due to its reliability, credibility,
available and applicable methodologies based on CDM frameworks, offset prices consistent with the
market average ($7.8 USD) (Peters-Stanley et al., 2013)and its continuing development of new
methodologies incorporating non-carbon benefits (VCS, 2013).
After selecting VCS as the best choice for the AFS in Tapinoã, the EX-ACT tool was used to calculate the
possible amount of carbon sequester by the AFS. The EX-ACT tool uses default NGGI-IPCC-2006 factors to
make its emission and stock calculations (FAO; IRD, 2013), but it also allows to enter factors to specific
crops or vegetation types. Unfortunately, the stock factors for the two main crops (lemon and banana) of
the AFS are not yet available. To overcome the lack of such factors and have a more accurate calculation,
factors from crops of the same genus were used. For the banana it was considered the factor calculated
by Lasco et al. (2010) of 114. tCO2e/ha/year for a mixed system of Abaca/Banana and for the lemon was
considered the average factor (23.99 tCO2e/ha/year for young trees and 109 tCO2e/ha/year for mature
trees) by Mwamba (2012) of 66.495 tCO2e/ha/year for sweet orange (Citrus sinensis L.). 60% of the
hectare was attributed to banana and the remaining 40% to lemon, considering the number of trees
planted for each species (200 banana trees and 128 lemon trees).
Many of the neighboring properties of the studied AFS were converted to grassland to feed cattle and
they were used as baseline with the default factors of EX-ACT. Emission factors for both grassland and
cattle were considered. EX-ACT calculates both the baseline or “business as usual” scenario and the
scenario with the project. To calculate them, EX-ACT requires emission or stock factors, land use
practices to be established and the crediting period of the project. The crediting period is the lapse of
time in which the project will produce carbon offsets. VCS establishes a minimum crediting period of 20
years for AFOLU and ALM projects (PCC, 2014). Considering this period and the above mention factors,
the baseline accounted emissions for 6 tCO2e/ha/year. The AFS on the contrary accounted carbon
sequestration for 89.6 tCO2e/ha/year.
Considering an average price for AFOLU and ALM projects under the VCS for 2012 of $7.8 USD/tCO2e,
the simultaneous forested banana plantation accompanied by citrus trees has the potential to generate
698.88 USD/ha/year. To proceed to the cost-benefit analysis, the implementation costs of a carbon
project were required. From elaboration of the project description to registering the project and issuing
carbon offset, every step of the cycle represents costs. Unfortunately each project and each
verifying/certifying body has different costs and prices, depending on the size and kind of project. There
is no average amount to be considered. VCS does not provide this information and verifying/certifying
bodies consider this kind of information as sensible and are reluctant to share it. For the purpose of this
study, the costs from a competing standard (Gold Standard) will be used to carry out the cost-benefit
analysis (circa $ 55,000 USD per AFOLU-ALM project) (Gold Standard, 2013).
63
The cost-benefit analysis considers the opportunity costs of shifting from husbandry to agroforestry. The
neighbor properties are extensive cattle producer with one head per hectare with a return of $242 USD
per head. This number considers the average national price of $3.29 USD per kilo paid by packing plants
and an average carcass weight of 233 kg and a 40 to 30 percent producer margin (ABIEC, 2011;
Domingues et al., 2011; TheBeefSite, 2011). The $242 USD was also calculated based on the information
developed by FNP, an agricultural consultancy firm (ANUALPEC, 2011).
Three simple cost-benefit analyses were conducted; one was done only considering costs and benefits
from the implementation of a carbon project, and another considering cost and benefits from the AFS
and a last analysis considering costs and benefits from the carbon project and AFS.
The interest rates used were the SELIC rate for the benefits and the average banking interest rate in
Brazil for rural credits for the costs. The SELIC rate is the rate used by the Central Bank of Brazil for its
open market operation; that is to say, is the interest rate that the Central Bank of Brazil pays for its debt.
Currently this rate is placed at 10.5% (Banco Do Brasil, 2014) and the interest rate for rural credits is
place at 5.5% (Brandesco, 2013). In the case where only costs and benefits from the carbon project were
considered the cost-benefit relation obtained was 0.1003. The standard decision rule in a cost-benefit
analysis dictates that if the relation obtained is greater than the unit (1) the project is beneficial and in
the case it is lower the investment will not be recovered (FHWA, 2013). As can be seen, the obtained
value is well below the unit, which means that the costs surpass the benefits greatly.
It is necessary to emphasize that this result are only considering a 1 hectare property. To break even,
only 10.26 ha would be needed. If the whole community of Tapinoã were to be converted to the studied
AFS it would produce 6,089,216 tCO2e in the 20 years of crediting period, representing benefits for
$6,447,783.14 USD with costs of only $648,362.58 USD (the before mentioned numbers are in present
value). These costs represent the highest average values for the certification process published by Gold
Standard plus the levy of $0.10 USD that VCS charges for per offset issued. In the real world the cost
would be much higher accordingly to the size of the project. The CBA coefficient resulting under these
considerations is 28.33, showing the great potential that the studied AFS has in the carbon market.
The analysis just considering costs and benefits from the AFS showed the unprofitability of the system,
the CBA coefficient was 0.371. This means that the AFS revenue would only cover 37.1% of the costs; the
reason for this are the high maintenance costs of the AFS, they are almost as high as the estimated
revenue and the low agricultural prices.
In the case in which the cost and benefits of the AFS are added to those of the carbon project the CBA
was of 0.2822 asseverating what was found in the first case; as stated before, these results are low
because of the small plot, low revenue and high costs of the AFS. When considering the entire
community of Tapinoã the CBA was 0.4196 (under the same assumptions before mentioned). These
results show that, even with steep costs, the studied AFS has the potential in the carbon market and that
it could alleviate, to some extent, financial needs.
Unfortunately, as the results show, the AFS established in Araruama is not financially feasible. The three
scenarios show that in none of them the revenue compensates the costs. The reasons for these are high
maintenance costs, low prices for the banana and lemon and due to adverse effects of macroeconomic

64
variables that disturb cost-benefit analysis. This plot functions only thanks to the continuous inflow of
financial inputs and to the absorption of implementation costs by EMATER.
The previous analysis should only be regarded as an exercise and an attempt to show the potential of
AFSs in the carbon market. The lack of clear and available information regarding certification costs makes
extremely difficult to produce a proper analysis. Uncertainty coming from heterogeneous projects and
verifying/certifying bodies render performance prediction unfruitful. Also is important to mention that
the price to which an offset can be sold can range from $.1 USD to $95 USD depending on size, kind of
project, included cobenefits, location, negotiations between producer and customer, marketing and the
stage in which the project is (Peters-Stanley et al., 2013). This last point is important; it is a common
practice for AFOLU or ALM project to sell their offsets before they are produce, this is done to bridge the
gap of high AFS implementation cost. Offset prices vary substantially depending on the stage in which
the offsets are purchased when the project is still under development or if it is already issuing, it can vary
from $5 USD to $16 USD (Peters-Stanley et al., 2013).
One of the objectives of this research was to include cobenefit standards but, as mentioned above, price
variation render further analysis speculative. The price variation experienced each year and by each
standard reduces the value of any assessment. The average price for VCS plus Social Carbon offsets is
virtually the same as the average market price (Peters-Stanley et al., 2013) and only differences among
projects set differences on prices.
In summary, the cost-benefit analysis shows that the studied AFS has potential in the carbon market and
that, as could be expected; an analysis performed on one single hectare would never be profitable.
Economically, the AFS resulted unfeasible, it would need to be more productive or get better prices for
its production. Socially, this particular community has potential for this kind of projects considering its
social background, its closeness and willingness to participate with governmental institutions make it a
perfect candidate to expand experimental interventions and their inclusion on alternative sources of
income. Showcasing successful communities would lay an important precedent to future interventions.
And environmentally, the implementation of agroecological principles and the maintenance of a
considerable area as a reserve promote the presence of a considerable amount of wild fauna and the
avoidance of soil and ecosystem degradation.
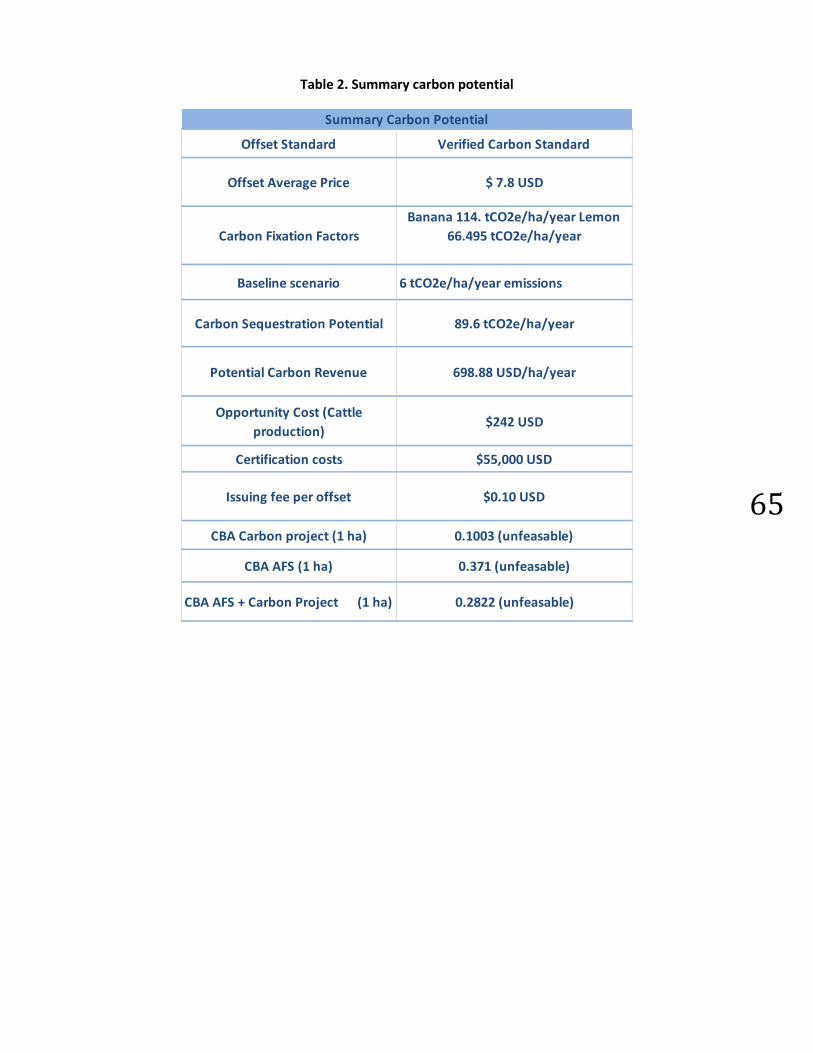
65
Table 2. Summary carbon potential
Offset Standard Verified Carbon Standard
Offset Average Price $ 7.8 USD
Carbon Fixation Factors
Banana 114. tCO2e/ha/year Lemon
66.495 tCO2e/ha/year
Baseline scenario 6 tCO2e/ha/year emissions
Carbon Sequestration Potential 89.6 tCO2e/ha/year
Potential Carbon Revenue 698.88 USD/ha/year
Opportunity Cost (Cattle
production)$242 USD
Certification costs $55,000 USD
Issuing fee per offset $0.10 USD
CBA Carbon project (1 ha) 0.1003 (unfeasable)
CBA AFS (1 ha) 0.371 (unfeasable)
CBA AFS + Carbon Project (1 ha) 0.2822 (unfeasable)
Summary Carbon Potential
66
12. Discussion
Agroforestry systems have shown potential to improve farm productivity without compromising future
performance and avoiding expenditure on external inputs. Cases like the one presented on this study
help to shift misconception about inner working of AFSs and to expose their benefits and advantages. It
is most important to understand all aspects of AFSs to harness all possible beneficial synergies and try to
develop sustainable close loop farming systems. Two major points will be made on this discussion; one
the gap existing between what is theoretically developed regarding AFSs and what is used in practice and
second, the difficulties posed by lack of information and transparency from offset standard developers.
To finalize some suggestions will be done to increase the potential of AFSs in the carbon market.
Many misconceptions about AFSs have been introduced by unilateral approaches. The introduction of
systemic approaches like Socioecological systems could render new insights about AFSs. During this
research was palpable the lack of a systemic approach when characterizing AFSs; the most common
during the literature review were agronomic and ecological approaches mentioning the ecological
benefits or their agroecological characteristics of AFSs. Previous studies have left out social background
and/or economic aspects of AFSs, virtually dismissing two thirds of them. This lack of systemic vision has
left AFSs out of new sources of income that have the potential to bridge their financial gaps. The studied
case possesses great potential, even if carbon markets are ignored, but without proper characterization
and attention the investment done for this experimental unit will be lost. Literature developed for the
region vaguely depicts the existing AFSs without explaining their social, economic or environmental
backgrounds deeply. The reports for the studied case just state chronologically the process that lead to
the implementation of the AFS but they never make mention of particular background of the community
of Tapinoã, the kind of property in which the AFS is situated, the experience of the farmer/owner, the
reason to implement this experimental unit, nor the expected revenues.
There are great theoretical bases describing AFSs permutations, inner working, benefits, the positive
synergies generates among their subsystems and contributions to farm sustainability. But in reality
agronomic or ecological visions predominate and the systemic theoretical framework is left out. There is
a big gap between what is theoretical developed and what is used in practice.
The Secretary of Agriculture of the State of Rio de Janeiro has pursued multidisciplinary approaches but
in practice many field technicians fail to appreciate the whole picture, leaving single discipline
approaches as the answer to most problems.
The Rio Rural projects seeks to encourage the adoption of AFSs but with demonstrative units, like the
one studied, characterized partially does not allow farmers to fully understand what can they win by
adopting AFSs. Rio Rural has just shallowly showed what AFSs are and the benefits that farmers can gain
due to short reviews. For farmers, the bottom line will always be the economic benefits they can gain
with certain farming system; even if they recognize the aesthetic, cultural or ecological values of their
land, their economic security will always be their compass when decision about land use are in question.
Rio Rural needs to conduct research with a systemic perspective and abandon purely agronomic
perspectives and it has done. The characterization of AFSs understanding them as socioecological
systems has the potential to generate useful and conclusive information about the performance and

67
interaction of their subsystems. If the information generated by Rio Rural is decoupled in several
segments or miscommunicated to farmers, it will not have the looked after results.
To understand and exploit all positive synergies of a studied AFS is necessary to study it from an uncut
perspective; by knowing all possible specificities about an AFS, all possible benefits can be properly
harnessed.
Another important issue found during the development of this research was the lack of transparency and
information from some offset standards regarding certification costs. Is understandable that costs
change from one project to another, but without such financial information investments would be made
negligently and farmers would have to gamble part of their income until the development of a carbon
project is already being carried out. Studies like this one render unfruitful without clear and transparent
information regarding carbon certification costs.
On a related regard; standard developers vaunt about the straightforwardness of the certification
process but the multiplicity of entities involved make it an overwhelming journey. The participation of
third party entities during the development and certification process is understandable due to trust of
consumers but it turns the process into a maze for a small farmer. As previously discussed; standard
developers are focusing on carbon sequestration from diverse land uses, nonetheless they seem to
forget that many farmers where AFOLU or ALM projects can be developed are small farmers and they do
not possess the experience or resources to carry out a development and certification process by
themselves. It can be said that the efforts made by standard developers addressing carbon from land
uses and on the certification of ecological and social cobenefits will be unfruitful unless their
methodologies are developed for small farmers.
A recommendation to deal with the multiplicity of entities involved and with the complex development
and certification processes would the creation of a governmental entity, in this case within the structure
of Rio Rural, that guides and grooms small farmers throughout the entire AFS project and its
accompanying carbon project. It would also be beneficial to create partnerships with carbon project
developers; this would create transparency and confidence on the offsets produce by AFSs. The before
mentioned government entity, could act as liaison between project developers and small farmers
associations ensuring smooth and direct communication. All of this would create trust and confidence
for buyers, sound and verifiable offsets empowering small farmers, supported by local governments and
developed by a third party would be very appealing in the VCM.
It is also advisable to wait for the new methodologies being developed by standards developers, the
integration of labels like FairTrade and FSC would be great partners for projects based on AFSs. The price
of a “labeled” offset has shown a better performance than an average offset, like is the case of VCS +
CCB offsets (Peters-Stanley et al., 2013); making any project under double certification more profitable.
It is also important to point out that if the government of the state of Rio de Janeiro wants to accomplish
the objectives of Rio Rural, it needs to also address bigger farmers. In this regard, it will be difficult to
attract medium and big farmers while interest rates, like the SELIC rate, offers attractive returns. This
study was distorted by the SELIC rate, as so will studies performed by private enterprises. A high SELIC
rate will drive private investments away from this kind of projects and will perpetuate unsustainable
industrial farming systems. Is understandable that Brazil seeks to control its inflation rate but mixed

68
signals on the financial market can tear down efforts made on the primary sector of its economy. A
complete analysis about the effects of macroeconomic policy on rural development is out of the scope of
this research, but without a doubt it would render interesting insights and would aid decision makers to
design better economic policy. The development and application of integral economic policies is key to
the development of a strong Brazilian economy, neglecting the cascading effects of economic policies on
the productive sectors will only undermine any kind of developing efforts.
As mentioned before, the benefits of the AFS are not being fully harness; and as the results showed on
the different scenarios; the AFS is not financially feasible due to high maintenance costs and low
revenue. The used agroecological practices and the characterized close-loop agroforestry system could
make the system a perfect candidate for organic certification. This option could potentially increase
revenue by adding an extra prime to the banana and lemon production. The city of Rio de Janeiro is a big
consumer of organic produce and since the majority of the production is intended for local and regional
markets it would not be difficult to allocated produce of the AFS in such market, creating a sustained
demand for the AFS. Is also important to consider that the increase on the offset price if the AFS is
certified by an organic label. Buyers appreciate and are willing to pay an extra prime if the offset they are
buying is produced by an organic farmer.
A more simple solution could be to increase tree density within the AFS, increasing production and
carbon sequestration. Also the inclusion of trees for timber or wood production could increase revenue
and carbon sequestration potential without augmenting maintenance costs significantly. These
recommendations are easy and possible solution to turn the AFS feasible without incurring in further
costs; they would attribute the real value produce by the AFS.
Even if the studied AFS resulted unfeasible with the support of carbon offsets is important to notice the
financial improvement they create when bigger areas adopt the AFS. Carbon offsets can help bridging
implementation costs and avoid dependency from the government financial aid.
The state of Rio de Janeiro need to harness the interest it will draw with the upcoming FIFA World cup
and Olympic Games; as social discontent has been broadly advertised worldwide the proper showcasing
of rural projects could have the potential to portray Rio de Janeiro as a state that cares for its population
with innovative programs. It could also attract agroecotourism to the region in the long term, benefiting
its population way beyond these events. Agroecotourism is already encouraged on the state of Rio de
Janeiro, there are websites where international tourist can visit and experience rural life while they stay
on farms helping with everyday activities. By implementing AFSs and harnessing their biodiversity
benefits it could be possible to attract ecotourism looking for fauna or landscape enjoyment.
Much can be done on the state of Rio de Janeiro when talking about rural development, the
development of farming systems attuned to the heterogeneous conditions is primordial. Such
heterogeneity can only be tackled with a systemic perspective, SES have the capacity to handle it and to
produce farming systems that will not erode the natural capital of the state while improving the
livelihood of Rio de Janeiro. The adoption of agroforestry systems have the potential to be a great
stepping stone to accomplish the goals set by Rio Rural and to show innovative approaches from the
fluminense agriculture.

69
13. Conclusions
As the results showed, the characterized AFS is not economically feasible in any of the proposed
scenarios. The reason is high maintenance costs and low revenue due to the lack of exploitation of the
AFS characteristics. Also, the influence of the macroeconomics variables affected the cost benefit
analysis; from a pure economic perspective is more profitable to invest on government bonds that to
invest on this particular agroforestry system. It is important to notice the use of a blunt tool to calculate
the C-Stock potential and a more refined methodology could show a higher potential, EX-ACT
contemplates C-Stocks on the soil but in a very broad way and this could truncate the full potential of the
AFS on the carbon market.
It is clear that this systems works only because of the constant inflow of artificial financial inputs and
because it is used as an example to promote agroecological practices by governmental entities. The high
implementations costs were absorbed by the government and without this the system may have not
been adopted by the farmer as it is.
Even if the with the incorporation of carbon offset production the AFS was not feasible is important not
to lose sight of the increase in the CBA coefficient and, as mentioned before, the sale of future offsets
could diminish the steep slope of implementation costs. This would make AFS a more attractive
alternative to farmers, to make the system profitable the system could be later be adjusted to perform
better.
The AFS is not economically feasible but it does generate non-traditionally value; biodiversity, soil and
watersheds are protected by the practices followed in the AFS and the quality of life of the owner has
been improved. The AFS may not be quantitatively beneficial but it is qualitatively, and it accomplishes
the long term objectives of the Rio Rural program. The AFS improves the quality of life of farmers while
avoiding environmental degradation; the addition of a carbon market scheme has the potential to
encourage the adoption of AFSs by fill the financial gaps they present. A more detailed analysis is
needed; future studies should put more attention to carbon present on soils, they should develop
precise tree carbon fixation coefficients and consider the qualitative benefits of the AFS.

70
14. References
Achinelli, M., 2003. Poverty, coffee cultivation and deforestation in the brazilian Atlantic Forest:
Achieving a sustainable livelihood through education and public participation. Lund: Lunds Universitet.
Agenda 21, 1992. Agenda 21. Rio de Janeiro: United Nations United Nations.
Álvarez Icaza, P. & Muñoz Piña, C., 2008. Instrumentos Territoriales y Económicos que Favorecen la
Conservación y el Uso Sustentable de la Biodiversidad. In J. Sarukhán, ed. Capital Natural de México III.
Políticas Públicas y Perspectivas de Sustentabilidad. México D.F.: CONABIO. pp.229-58.
Aristotle, 350 BC. Metaphysics.
Baigent, S., 2010. Lotka-Volterra Dynamics - An introduction. London: UCL.
Behera, U.K. & Sharma, A.R., 2007. Modern concepts of agriculture. New Delhi: Indian Agricultural
Research Institute.
Branca, G., Hissa, H. & Medeiros, K., 2010. Estimating Mitigation Potential of Agricultural Porjects: an
Application of EX-Ante Carbon-balance Tool (EX-ACT) in Brazil. Roma: FAO FAO.
Breathe Foundation, 2009. The Atlantic Rainforest Institute. [Online] Available at:
http://www.breathefoundation.org/partners/organisations/the-atlantic-rainforest-institute.html
[Accessed 16 Mayo 2012].
Brundtland Commission, 1987. Our Common Future: Towards Sustainable Development. London: Oxford
University Press Brundtland Commission.
Calle, A., Montagnini, F. & Zuluaga, A.F., 2009. Farmer’s perceptions of silvopastoral system promotion in
Quindío, Colombia. Bois et Forets des Tropiques, 2(300), pp.79-94.
Capra, F., 2007. Complexity and Life. Systems Research and Behavioral Science, 24(5), pp.475-79.
Carabias, J., de la Maza, J. & Provencio, E., 2008. Concepciones acerca del uso y la conservacion de la
biodiversidad y sus servicios ambientales. In J. Sarukhán, ed. Capital Natural de México III: Políticas
públicas y perspectivas de sustentabilidad. México, D.F.: Conabio. pp.27-42.
Carson, R., 1962. Silent Spring. Fourteenth ed. New York: Mariner Book.
CCAFS, 2013. Global agricultural emissions. [Online] Available at: http://ccafs.cgiar.org/bigfacts/global-
agriculture-emissions/ [Accessed 30 September 2013].
CCBA, 2013. The Climate, Community and Biodiversity Alliance. [Online] Available at:
http://www.climate-standards.org/about-ccba/ [Accessed 4 October 2013].
CDC Climat Research, 2012. The EU ETS carbon price:To intervene, or not to intervene? Paris: Caisse des
Dépôts.

71
CEPERJ , 2013. Estado do Rio de Janeiro: Regiões de Governo. [Online] Available at:
http://www.ceperj.rj.gov.br/ceep/info_territorios/divis_regional.html [Accessed 1 December 2013].
CIDE, 1998. Terrotirio: Estado do Rio de Janeiro. 2nd ed. Rio de Janeiro: Secretaria de Estado de
Planejamento e Controle.
Cilia, G., 2008. Etnobotánica de heliopsis longipes. Boletín de la Sociedad Botánica de México, pp.83-89.
Circle Economy , 2013. Circle Economy: Make it happen from start to start. [Online] Available at:
http://www.circle-economy.com/ [Accessed 6 October 2013].
Climate Data, 2013. Clima: Araruama. [Online] Available at: http://es.climate-data.org/location/4056/
[Accessed 2 December 2013].
Connexions, 2013. Biogeochemical Cycles. [Online] Available at: http://cnx.org/content/m44889/1.6/
[Accessed 30 September 2013].
Cotler, H., 2007. El manejo integral de cuencas en México. Estudios y reflexiones para orientar la política
ambiental. México, D.F.: Semarnat Instituto Nacional de Ecología.
Crutzen, P.J., 2002. Geology of mankind. Nature, 415(23), p.23.
da Silveira Primo, P.B. & Völcker, C.M., 2001. Bacias Hidrográficas dos rios Sao Joao e das Ostras: Águas,
terras e conservacao ambiental. 1st ed. Araruama: Consórcio Intermunicipal Lagos Sao Joao.
Dagang, A.B.K. & Nair, P.K.R., 2003. Silvopastoral research and adoption in Central America: recent
findings and recommendarions for future directions. Agroforestry Systems, (59), pp.149-55.
Daniels, J., 2013. Carbon Sequestration, in Brief. Columbus: Ohio State University School of Earth
Sciences.
Dantas de Paula, M. & Pereira Filho, W., 2009. Estimativa de Carbono em um Fragmento de Floresta
Madura na Mata Atlantica Nordestina com o Uso de Índices Espectrais. Natal: XVI Simpósio Brasileiro de
Sensoriamento Remoto.
Darghouth, S. et al., 2008. Watershed Management Approaches, Policies and Operations: Lessons for
Scaling Up. Washington, D.C.: World Bank.
Darghouth, S. et al., 2008. Watershed Management Approaches, Policies and Operations: Lessons for
Scaling Up. Washington, D.C.: World Bank.
Darwin, C., 1839. The Voyage of the Beagle. The Internet Wiretap. pp.7 - 15.
Davis, E.W., 1995. Ethnobotany: an old practice, a new discipline. In Ethnobotany: evolution of a new
discipline. Chapman & Hall. pp.40-51.
Debois, J., 2006. Monoculturas - modelo predatório e modelos sustentáveis na Mata Atlantica. Rio de
Janeiro: REBRAF.

72
Drinking Water Source Protection, 2013. Watershed Components. [Online] Available at:
http://www.waterprotection.ca/water/w-watershed.htm [Accessed 9 February 2013].
Ellen McArthur Foundation, 2012. The Ellen MacArthur Foundation: Rethink the future. [Online] Available
at: ellenmacarthurfoundation [Accessed 6 October 2013].
Ellen McArthur Foundation, 2013. Towards the Circular Economy. London: Ellen McArthur Foundation.
Encyclopaedia Britannica, 1994. Psicología de la Gestalt. In Enciclopedia Hispánica. Versailles:
Encyclopaedia Britannica Publishers, Inc. pp.92-93.
Environmental Protection Agency , 2012. Glossary. [Online] Available at:
http://www.epa.gov/wastes/conserve/materials/paper/resources/glossary.htm [Accessed 29 September
2013].
EPA, 2012. What is a Watershed. [Online] Available at: http://water.epa.gov/action/adopt/defn.cfm
[Accessed 6 February 2013].
EPA, 2013. Carbon Dioxide Capture and Sequestration. [Online] Available at:
http://www.epa.gov/climatechange/ccs/ [Accessed 29 September 2013].
FAO, 1999. Pisoteo Animal. [Online] Available at:
http://www.fao.org/ag/againfo/programmes/es/lead/toolbox/Grazing/Animtram.htm [Accessed 23
Marzo 2012].
FAO, 2006. State of the World´s Forests 2005. Roma: FAO.
FAO, 2007. The State of Food and Agriculture. Rome: Electronic Publishing Policy and Support Branch
/Communication Division / FAO Food and Agriculture Organization of the United Nations.
FAO, 2011. Ferramenta Ex-Act (Ex Ante Carbon Balance Tool) para o balanco de carbono. Roma: FAO.
FAO, 2011. Payments for Ecosystem Services and Food Security. Rome: Food and Agriculture Organization
of the United Nations Natural Resources Management and Environment Department, FAO.
Ferreira Lino, C., Dias, H. & Alburquerque, J.R., 2011. The Mata Atlantica Biosphere Reserve: review and
update of the limits and the zoning of the Mata Atlantica Biosphere Reserve in digital carthographic base:
phase VI. Sao Paolo : UNESCO Reserva da Biosfera de MAta Atlantica.
Francia C. Campello, E. et al., 2007. Sistemas Agroflorestais na Mata Atlantica: a experiencia da Embrapa
Agrobiologia. Seropedica: EMBRAPA EMBRAPA.
Glaser, M., Krause, G., Ratter, B. & Welp, M., 2008. Human / Nature Interaction in the Anthropocene:
Potential of Social-Ecological System Analysis. Zürich: GAiA Ecological Perspectives for Science and
Society.
Glaser, M., Krause, G., Ratter, B. & Welp, M., 2012. Human-Nature Interaction in the Anthropocene:
Potential of Social-Ecological System Analysis. 1st ed. New York: Routledge.

73
Gobbi, J.A., 2011. Pago por servicios ambientales ¿Que son y cómo funcionan?. In P. Laterra, E.B.
Jobbágy & J.M. Paruelo, eds. Valoración de servicios ecosistémicos: conceptos, herramientas y
aplicaciones para el ordenamiento territorial. Buenos Aires: INTA. pp.293-314.
Gold Standard, 2011. Why Gold Standard? [Online] Available at:
http://www.cdmgoldstandard.org/about-us/why-gs [Accessed 4 October 2013].
Gold Standard, 2012. Smallholders to benefit from carbon finance: Fairtrade and Gold Standard
collaboration opens up new opportunities for farming communities in developing countries. Qatar: The
Gold Standard.
González Estrada, A., 2010. Principios para la Clasificación de los Sistemas Agrícolas. México, D.F.:
Instituto Nacional de Investigaciones Forestales, Agrícolas y Pecuarias SAGARPA.
Governo do Rio de Janeiro, 2012. Rio Rural. [Online] Available at:
http://www.rj.gov.br/web/mapa/exibeconteudo?article-id=565859 [Accessed 16 Febrero 2012].
Governo Do Rio de Janeiro, 2013. Rio Rural. [Online] Available at:
http://www.microbacias.rj.gov.br/en/programa_rio_rural.jsp [Accessed 14 May 2013].
Granell Pérez, M.d.C., 2004. Nuevos Recursos para la Mata Atlantica. Papeles de Geografia, (39), pp.211-
13.
Green Markets International, 2007. The Voluntary Carbon Market: Status & Potential to Advance
Sustainable Energy Activities. Arlington.
GreenFacts, 2013. Carbon sequestration. [Online] Available at:
http://www.greenfacts.org/glossary/abc/carbon-sequestration.htm [Accessed 29 September 2013].
Hamilton, K. et al., 2008. Offsetting Emissions: A Business Brief on the Voluntary Carbon Market. Business
for Social Responsability.
Haraldsson, H.V., 2000. Introduction to Systems and Causal Loop Diagrams. Lund: Lund University.
Holling, C.S., 2001. Understanding the Complexity of Economic, Ecological, and Social Systems.
Ecosystems, (4), pp.390-405.
IBGE, 2004. Estado do Rio de Janeiro. [Online] Available at:
http://www.suapesquisa.com/estadosbrasileiros/estado_rio_de_janeiro.htm [Accessed 30 November
2013].
IBGE, 2010. Estados @. [Online] Available at: http://www.ibge.gov.br/estadosat/perfil.php?sigla=rj
[Accessed 30 November 2013].
IBGE, 2010. PIB e participação das Grandes Regiões e Unidades da Federação. Manaus: IBGE IBGE.
IBIO, 2013. GeoAtlântica. [Online] Available at: https://www.geoatlantica.org.br/map [Accessed 23 July
2013].

74
Ibrahim, M., Guerra, L., Casasola, F. & Neely, C., 2009. Importance of silvopastoral systems for mitigation
of climate change and harnessing of environmental benefits. In M. Abberton, R. Conant & C. Batello, eds.
Grassland carbon sequestration: management, policy and economics. Rome: FAO. pp.189-96.
IESB, 2007. Levantamento da Cobertura Vegetal Nativa do Bioma Mata Atlantica. Rio de Janeiro: PROBIO
Instituto de Estudos Socioambientais do Sul da Bahia.
ILO/WHO, 1963. Occupational health problems in agriculture. United Nations.
Jahn, T., Becker, E., Keil, F. & Schramm, E., 2009. Understanding Social-Ecological Systems: Frontier
Research for Sustainable Development. Implications for European Research Policy. Frankfurt: Institute for
Social-Ecological Research.
Leff, E., 1981. Concepto de agrosistema y su relacion con el uso de los recursos naturales. In Hernandez,
E. Agroecosistemas de México: contribuciones a la enseñanza, investigación y divulgación agrícola.
Chapingo: Colegio de Postgraduados. pp.151-55.
Levy, T.S. & Aguirre, J.R., 1999. Conceptuación Etnobotanica: Experiencia de un Estudio en la Lacandona.
Geografía Agrícola, pp.98-99.
Lincoln Institute of Land Policy, 2013. Regional Collaboration: Principles. [Online] Available at:
http://www.lincolninst.edu/subcenters/regional-collaboration/principles.asp [Accessed 6 February
2013].
Lituma, G., Braga, M.I. & Soler, A., 2003. Scaling Up Watershed Management Projects: The Experience of
Southern Brazil. Washington: World Bank.
Loaiza, T., 2010. Potential assessment of land use, land use change and forestry (LULUCF) projects under
the clean development mechanism in the Mata Atlantica, municipality of Cachoeiras de Macacu, RJ –
Brazil. UASLP.
Lumbreras, J.F., de Carvalho Filho, A., Calderano Filho, B. & dos Santos, R.D., 2001. Levantamento
Pedológico, Vulnerabilidade e Potencialidade ao Uso das Terras: Quadrículas de Silva Jardim e Rio das
Ostras, Estado do Rio de Janeiro. Rio de Janeiro: Embrapa Embrapa Solos.
Lumbreras, J.F., de Carvalho Filho, A., Calderano Filho, B. & dos Santos, R.D., 2001. Levantamiento
Pedologico, Vulnerabilidade e Potencialidade ao Uso Das Terras: Quadrílas de Silva Jardim e Rio das
Ostras, Estado do Rio de Janeiro. Rio de Janeiro: EMBRAPA Embrapa Solos.
Mallea, M.I., Torrico, J.C., Janssens, M.J.J. & Gease, H., 2011. Aptitud y Potencial de Especies Forestales
para la Implementación en Sistemas Silvopastoriles en la Region de la Mata Atlantica, Subregion Sudeste
-Brasil. Köln: Dinario ITT Köln.
Malthus, T.R., 1798. An Essay on the Principle of Population. London: Oxford University Press.
Martin, F., Sherman, S. & Motis, T., 2007. Agroforestry Principles. North Fort Myers: ECHO.
McKinney, M. & Essington, K., 2006. Learning to Think and Act Like a Region. Land Lines, pp.8-13.

75
McNeil, J.R., 1996. Agriculture, Forests and Ecological History: Brazil, 1500 - 1984. Environmental Review,
10(2), pp.122-33.
McNeill, J.R., 1986. Agriculture, Fores, and Ecological History: Brazil, 1500 - 1984. Environmental Review,
10(2), pp.122-33.
MEA, 2005. Ecosystems and Human Well-being: Synthesis. Washington, DC.: Island Press World
Resources Institute.
Mejía, A. & Cuanalo, H., 1981. Avances sobre el estudio de la alteración de un ecosistema de selva alta
perennifolia. In Hernandez, E. Agroecosistema de México: Contribuciones a la enseñanza, investigación y
divulgacioón agrícola. Chapingo: Colegio de Postgraduados. pp.71-83.
Mendonca-Santos, M.d.L. et al., 2003. Mapeamento do Uso Atual e Cobertura Vegetal dos Solos do
Estado do Rio de Janeiro. 2003: EMBRAPA.
Misra, R.P. & Achyutha, R.N., 1990. Micro-Level Rural Planning Principles Methods And Case Studies.
Concept Publishing Company.
Mohar, A. & Rodríguez Aldabe, Y., 2008. El papel de la ciudades en los procesos causales que determinan
el uso y la conservacion de la biodiversidad. In Capital natural de México, vol. III: Políticas públicas y
perspectivas de sustentabilidad. México, D.F.: CONABIO. pp.43-84.
Mohar, A. & Rodriguez Aldabe, Y., 2008. El papel de las ciudades en los procesos causales que
determinan el uso y conservación de la biodiversidad. In J. Sarukhán, ed. Capital Natural de México III:
Políticas públicas y perspectivas de sustentabilidad. México, D.F.: Conabio. pp.43-84.
Montagnini, F. & Finney, C., 2011. Payments for Environmental Services in Latin America for Restoration
and Rural Development. AMBIO, (40), pp.285-97.
Myers, N. et al., 2000. Biodiversity Hotspots for Conservation Priorities. Nature, 403, pp.853-58.
Myers, N. et al., 2000. Biodiversity Hotspots for Conservation Priorities. Nature, 403, pp.853-58.
NASA, 2011. The Carbon Cycle. [Online] Available at:
http://earthobservatory.nasa.gov/Features/CarbonCycle/ [Accessed 30 September 2013].
Nehren, U., Alfonso de Nehren, S. & Heinrich, J., 2009. Forest Fragmentation in the Serra Dos Organos:
Historical and Landscape Ecological Implications. In H. Gaese, J.C. Torrico Albino, J. Wesenberg & S.
Schlüter, eds. Biodiversity and Land Use Systems in the Fragmented Mata Atlantica of Rio de Janeiro. 1st
ed. Göttingen: Cuvillier. pp.39-66.
Niles, J.O. et al., 2002. Potential carbon mitigation and income in developing countries from changes in
use and management of agricultural and forest lands. London: FirstCite The Royal Society.
Niño, E., 1981. Las interrelaciones sociales para el desarrollo. In Hernandez, E. Agroecosistemas de
México: contribiciones a la enseñanza, investigación y divulgación agrícola. Chapingo: Colegio de
Postgraduados. pp.151-55.

76
NOAA, 2013. Carbon Cycle Science. [Online] Available at:
http://www.esrl.noaa.gov/research/themes/carbon/ [Accessed 30 September 2013].
Norman, D.W., 2002. The Farming System Approach: A historical Perspective. Lake Buena Vista, Florida:
Kansas State University.
Oilgae, 2013. CO2 Sequestration - Definition, Glossary, Details - Oilgae. [Online] Available at:
http://www.oilgae.com/ref/glos/co2_sequestration.html [Accessed 29 September 2013].
Ortiz, J., 1981. Clasificacion tecnologica de los sistemas de produccion agricola (agrosistemas) segun los
ejes espacio y tiempo. In Hernandez, E. Agroecosistemas de México: contribuciones a la enseñanza,
investigación y divulgación agrícola. Chapingo: Colegio de Postgraduados. pp.255-75.
Pennington, T. & Sarukhán, J., 2005. Arboles tropicales de México, Manual para la identificación de las
principales especies. México, D.F.: Fondo de Cultura Economica.
Pereyra, P.J., Rossini, G.B. & Darrigran, G., 2012. Toxicity of Neem´s oil, a Potential Biocide against the
Invasive Mussel. Anais da Academia Brasileira de Ciencias, 4(84), pp.1065-71.
Peters-Stanley, M. et al., 2013. State of the Voluntary Carbon Market 2013. Washington, DC: Bloomberg
New Energy Finance Forest Trends´ Ecosystem Marketplace.
Ponce, R. & Cuanalo, H., 1981. La regionalización del ambiente basada en la fisiografia y su utilidad en la
produccion agropecuaria. In Hernandez, E. Agroecosistemas de México: contribuciones a la enseñanza,
investigación y divulgación agrícola. Chapingo: Colegio de Postgraduados. pp.41-69.
Public Polcy Research Institute, 2008. Lincoln Institute of Land Policy. [Online] Available at:
http://www.lincolninst.edu/subcenters/regional-collaboration/problem-responses.asp [Accessed 6
February 2013].
Queiroz, S. & Sabatinelli, T., 2006. Desenvolvimento Rural Sustentável. Rio de Janeiro: Governo do Estado
de Rio de Janeiro Empresa de Pesqiusa Agropecuria do Estado do Rio de Janeiro.
Ratter, B.M.W., 2012. Complexity and Emergence: Key concepts in Non-Linear Dynamic Systems. In
Human-Nature Interactions in the Anthropocene: Potentials of Social-Ecological Systems Analysis. New
York: Routledge. pp.90-104.
Redman, C.L., Grove, M. & Kuby, L.H., 2004. Integrating Social Science into the Long-Term Ecological
Research (LTER) Network: Social Dimensions of Ecological Change and Ecological Dimensions of Social
Change. Ecosystems, 7(2), pp.161-71.
Resilience Alliance, 2004. Resilience Alliance. [Online] Available at: http://www.resalliance.org/
[Accessed 27 August 2013].
Rhoades, R.E., 1999. Participatory Watershed Research and Management: Where the Shadow Falls.
London: International Institute for Environment and Development.
Ribeiro Lamônica, K. & Guerra Barroso, D., 2008. Sistemsa Agroflorestais: Aspectos básicos e
recomendações. Niterói: Rio Rural Superintendencia de Desenvolvimento Sustentavel.

77
Sandoval Estrada, M. et al., 2003. El secuestro de Carbono en la Agricultura y su Importancia con el
Calentamiento Global. Theoria, pp.65-71.
Sandwith, T., Shine, C. & Hamilton, L., 2001. Transboundary Protected Areas for Peace and Cooperation.
Wales: World Commission on Protected Areas.
SocialCarbon, 2003. SocialCarbon. [Online] Available at: http://www.socialcarbon.org/who-we-
are/ecologica-institute/ [Accessed 4 October 2013].
T.S., L. & R, J.R.A., 1999. Conceptuación Etnobotanica: Experiencia de un Estudio en la Lacandona.
Geografía Agrícola, pp.98-99.
Tavares, V.R., 2011. Relatorio de Execucao e Aviliacao Projeto Agroecologico : Implantacao de Unidade
Agroecológica Comunidade de Tapinoa. Araruama: EMATER-RIO SEBRAE-RJ.
Thapa, G.B., 2000. Integrated Watershed Management: Basic Concepts and Issues. Paris: UNESCO.
UN, 2012. United Nations Framework Convention on Climate Change. [Online] Available at:
http://UNFCCCc.int/kyoto_protocol/items/2830.php [Accessed 16 January 2013].
UNFCCC, 2013. UNFCCC Article 2. [Online] Available at:
http://UNFCCCc.int/essential_background/convention/background/items/1353.php [Accessed 3 October
2013].
US Census Bureau, 2012. Historical Estimates of World Population. [Online] Available at:
http://www.census.gov/population/international/data/worldpop/table_history.php [Accessed 6 October
2013].
van der Werf, G.R. et al., 2009. CO2 emissions from forest loss. Nature Goescience, 2, pp.737-38.
VCS, 2013. The VCS AFOLU Program: Crediting GHG emission reductions from Agriculture, Forestry, and
Other Land Use projects. Washington, D.C.: Verified Carbon Standard.
VCSA, 2013. Verified Carbon Standard. [Online] Available at: http://www.v-c-s.org/who-we-are
[Accessed 4 October 2013].
Vinícius da Costa, T., 2008. Perspectivas do Mercado de Crédito de Carbono para o Brasil. Londrina:
Universidade Estadual de Londrina.
Vitousek, P.M., Mooney, H.A., Lubchenco, J. & Melillo, J.M., 1997. Human Domination of Earth's
Ecosystems. Science, 277(5325), pp.494-99.
von Bertalanffy, L., 1976. General System Theory: Foundations, Development, Applications. Primera ed.
México, D.F.: Fondo de Cultura Económica.
World Bank, 2013. China Overview. [Online] Available at:
http://www.worldbank.org/en/country/china/overview [Accessed 29 September 2013].

78
WorldoMeter, 2013. World Population: Past, Present, and Future. [Online] Available at:
http://www.worldometers.info/world-population/ [Accessed 6 October 2013].
Wrap, 2013. WRAP and the circular economy. [Online] Available at:
http://www.wrap.org.uk/content/wrap-and-circular-economy [Accessed 6 October 2013].
WWF, 2013. WWF Global. [Online] Available at:
http://wwf.panda.org/what_we_do/where_we_work/atlantic_forests/ [Accessed 19 August 2013].
XE, 2013. XE Currency Converter. [Online] Available at:
http://www.xe.com/currencyconverter/convert/?Amount=1000&From=BRL&To=USD [Accessed 5
December 2013].

79
15. Annex 1. Carbon sequestration calculations
with the EX-ACT Tool
Table 3. Carbon project description. (FAO, 2011)
Table 4. Grassland baseline. (FAO, 2011)
Table 5. Grassland results for baseline and potential scenarios. (FAO, 2011)

80
Table 6. Livestock in grassland baseline. (FAO, 2011)

81
Table 7. Nitrous Oxide emissions from manure management. (FAO, 2011)

82
Table 8. Results from the livestocks module. (FAO, 2011)

83
Table 9. Agroforestry C-stock absorption coefficients and description. (FAO, 2011)

84
Table 10. Mitigation potential results from the agroforestry system. (FAO, 2011)
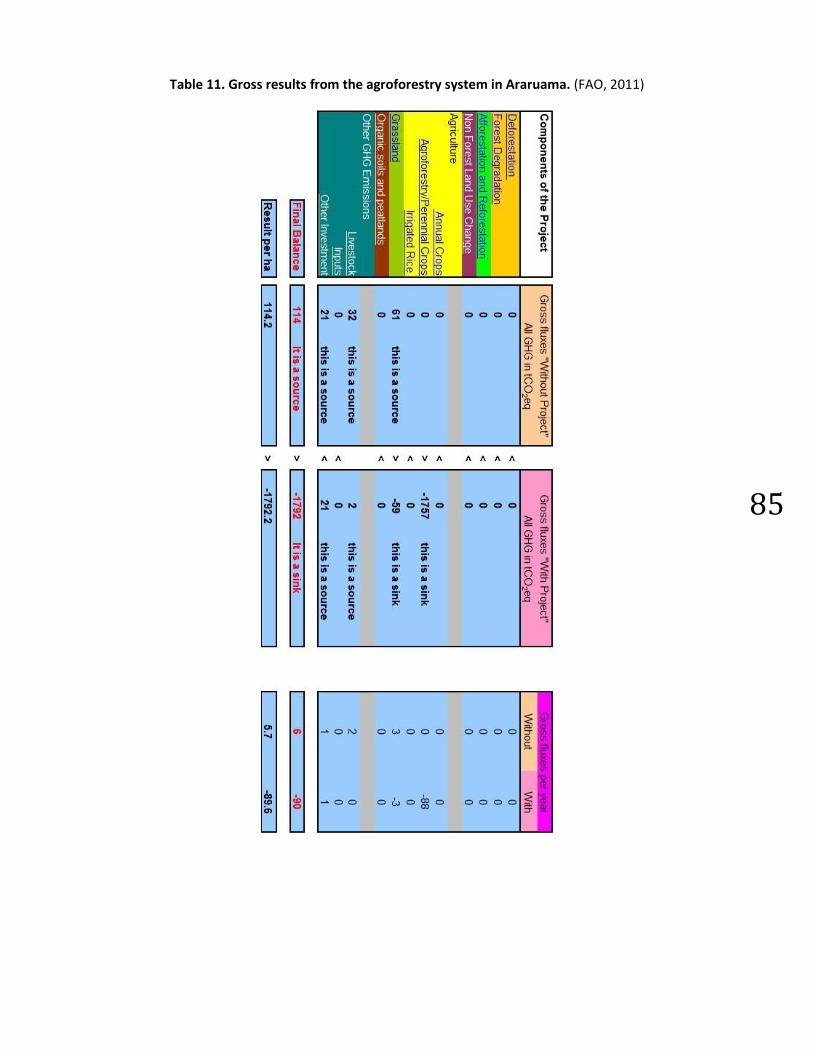
85
Table 11. Gross results from the agroforestry system in Araruama. (FAO, 2011)

86
Table 12. Final balance from the agroforestry system in Araruama. (FAO, 2011)

87
16. Annex 2. Cost-benefit analysis
Table 13. Cost-benefit analysis for the carbon sequestration project. (Author, 2014)
Table 14. Cost-benefit analysis for the AFS. (Author, 2014)
Hectare 1 3398 11
CO2/ha 89.6 89.6 89.6
Price 7.8 7.8 7.8
Years 20 20 20
Certification Costs $55,000.00 $55,000.00 $55,000.00
Issuing Costs $179.20 $608,921.60 $1,971.20
Total Carbon Benefits $13,977.60 $47,495,884.80 $153,753.60
Total Carbon Costs $55,179.20 $663,921.60 $56,971.20
Benefits Present Value $1,897.52 $6,447,783.14 $20,872.75
Costs Present Value $18,911.51 $227,545.16 $19,525.68
Cost-Benefit Coefficient 0.10033694 28.33627878 1.068989792
Carbon Project
Cost-Benefit Analysis
Experimenta
l Unit
Tapinoa
Community
Optimal
Minimum
Area
Hectare 1 3398
Years 20 20
Opportunity Cost (Cattle) 242.00$ 822,316.00$
Total Benefits AFS 105,722.60$ 359,245,394.80$
Fix Costs AFS 11,063.68$ 37,594,384.64$
Variable Costs AFS 101,725.92$ 345,664,676.16$
Total Costs AFS 112,789.60$ 383,259,060.80$
Total Benefits 105,722.60$ 359,245,394.80$
Total Costs 113,031.60$ 384,081,376.80$
Benefits Present Value 14,352.33$ 48,769,201.97$
Costs Present Value 38,739.20$ 131,635,812.10$
Cost-Benefit Coefficient 0.370485821 0.370485821
AFS Cost-Benefit AnalysisExperimental
UnitTapinoa Community

88
Table 15. Cost-benefit analysis including carbon and AFS costs. (Author, 2014)
Hectare 1 3398
CO2/ha 89.6 89.6
Offset Price 7.8 7.8
Years 20 20
Certification Costs 55,000.00$ 55,000.00$
Opportunity Cost (Cattle) 242.00$ 822,316.00$
Issuing Costs 179.20$ 608,921.60$
Total Carbon Benefits 13,977.60$ 47,495,884.80$
Total Carbon Costs 55,421.20$ 1,486,237.60$
Total Benefits AFS 105,722.60$ 359,245,394.80$
Fix Costs AFS 11,063.68$ 37,594,384.64$
Variable Costs AFS 101,725.92$ 345,664,676.16$
Total Costs AFS 112,789.60$ 383,259,060.80$
Total Benefits 119,700.20$ 406,741,279.60$
Total Costs 168,210.80$ 384,745,298.40$
Benefits Present Value 16,249.85$ 55,216,985.11$
Costs Present Value 57,650.71$ 131,863,357.27$
Cost-Benefit Coefficient 0.281867259 0.418743965
AFS and Carbon Project Cost-
Benefit Analysis
Experimental
Unit
Tapinoa
Community