characterization of complex coronary artery stenosis morphology by coronary computed tomographic...
TRANSCRIPT
Characterization of Complex Coronary Artery Stenosis Morphology by Coronary
Computed Tomographic Angiography
Brett M. Wertman, Victor Y. Cheng, Saibal Kar, Heidi Gransar, Ryan A. Berg, Hursh Naik,
Rajendra Makkar, John D. Friedman, Jay N. Schapira, Daniel S. Berman
Cedars-Sinai Medical Center, Los Angeles, CA

CT detection of complex stenosis morphology
Disclosures
• Funding from the Lincy Foundation (Beverly Hills, California)
• Conflicts of interest: None

CT detection of complex stenosis morphology
Background 1
• Contemporary clinical trials1-4 have adopted ≥ 70% diameter stenosis on invasive coronary angiography (ICA) as threshold to qualify for randomization to revascularization
1 RITA-2 trial participants. RITA-2. Lancet 1997;350:461-8.
2 Hueb W, et al. MASS-II. J Am Coll Cardiol 2004;43:1743-51.
3 McFalls EO, et al. N Engl J Med 2004;351:2795-804.
4 Boden, WE, et al. COURAGE. N Engl J Med 2007;356:1503-16.

CT detection of complex stenosis morphology
Background 2
• Stenosis morphology is an important determinant in PCI complication rate1,2
1 Ellis SG, et al. Circulation 1990;82:1193–1202.
2 Ellis SG, et al. Circulation 1991;84:644–653.
• Published experience of CCTA performance in complex coronary lesions undergoing PCI have primarily focused on total occlusions3-5
3 Yokoyama N, et al. Catheter Cardiovasc Interv 2006;68:1-7.
4 Soon KH, et al. J Interv Cardiol 2007;20:359-66.
5 Mollet NR, et al. Am J Cardiol 2005 Jan 15;95(2):240-3.

CT detection of complex stenosis morphology
Aims
1 Determine capability of CCTA in characterizing complex stenosis morphologies
2 Determine utility of complex stenosis morphology on CCTA in predicting PCI procedure duration and contrast use

CT detection of complex stenosis morphology
Methods
• 85 consecutive patients who underwent ICA within 30 days after CCTA
• CCTA on a Siemens DSCT scanner1 PO/IV metoprolol for HR > 70
2 Sublingual NTG
3 Gated, noncontrast CCS
4 Gated, contrast enhanced (92 ml), helical acquired angiography

CT detection of complex stenosis morphology
Methods: CCTA
Reconstruction– 0.6 mm thickness, 0.3 mm increment
– End-systole: 40% of R-R
– Diastole: 65%, 70%, 75%, 80% or R-R
– Manual ECG editing for arrhythmic artifact
– Sharp kernel if stent present or CCS > 100

CT detection of complex stenosis morphology
Methods: CCTA
CCTA Interpretation– Consensus by 2 blinded readers
– Vital Images workstation
– Native segments ≥ 2.0 mm in diameter
– Stented and bypassed segments excluded
– Oblique multiplanar reformation and oblique maximal intensity projection preferred

CT detection of complex stenosis morphology
Methods: CCTA
CCTA InterpretationSevere stenosis defined by ≥ 70% diameter stenosis on
long-axis visual evaluation (see example figures)
Quantification of stenosis severity performed independently
Proximal LCX Mid RCA

CT detection of complex stenosis morphology
Methods: CCTA
CCTA InterpretationComplex stenosis defined by any ACC/AHA
Type-C morphology criteria (Ellis SG, et al.)
1) Ostial involvement
2) Major branch involvement
3) Marked vessel tortuosity proximal to lesion
4) > 90º angle at lesion site
5) > 20 mm lesion length
6) Total occlusion

CT detection of complex stenosis morphology
Methods: ICA
Acquisition– Standard technique
– GE digital X-ray, AGFA Heartlab workstation
Data collection– Occurrence of PCI
– PCI duration (minutes)
– Total contrast use (ml)
CT detection of complex stenosis morphology
Methods: ICA
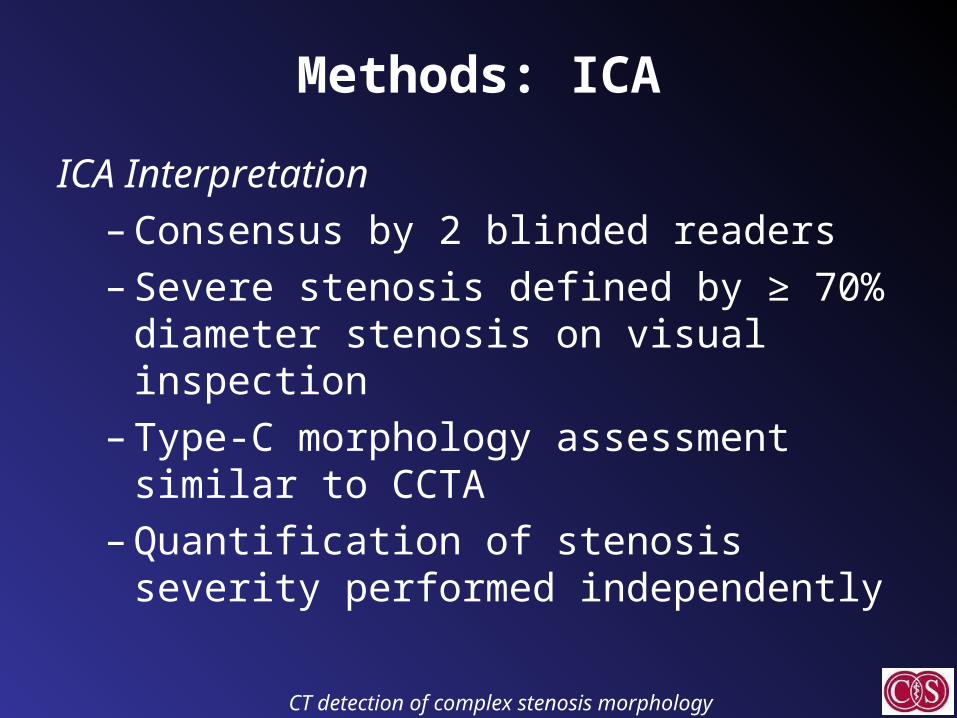
ICA Interpretation
– Consensus by 2 blinded readers
– Severe stenosis defined by ≥ 70% diameter stenosis on visual inspection
– Type-C morphology assessment similar to CCTA
– Quantification of stenosis severity performed independently

CT detection of complex stenosis morphology
Methods: Statistics
• Continuous variables– Means ± Standard Dev
– Ranges
• Comparing PCI time and contrast use:– Analysis of covariance (ANCOVA) with
adjustments for age and BMI
– Analysis of log-transforms performed to satisfy ANCOVA assumptions

CT detection of complex stenosis morphology
Results
Population– 74% men
– 84% referred either to follow-up on prior SPECT (44%) or for symptoms (40%)
– Mean age: 67 ± 11 years
– Mean BMI: 27.7 ± 4.6 kg/m2
– Mean Agatston calcium score: 734 ± 873
– Mean heart rate at CCTA: 59 (39 to 112)

CT detection of complex stenosis morphology
Results
• 940 segments in 328 arteries were evaluated
• 93 segments had ≥ 70% stenosis on ICA by visual inspection– Median stenosis severity 73.3%
• 101 segments had ≥ 70% stenosis on CCTA by visual inspection– Median stenosis severity 77.3%

CT detection of complex stenosis morphology
Results
CCTA performance in ≥ 70% stenoses
• Detected 84 of 93 lesions (90%)
• Detected 49 of 52 patients (94%)
• False positive in 17 segments and 8 patients
CT detection of complex stenosis morphology
Results
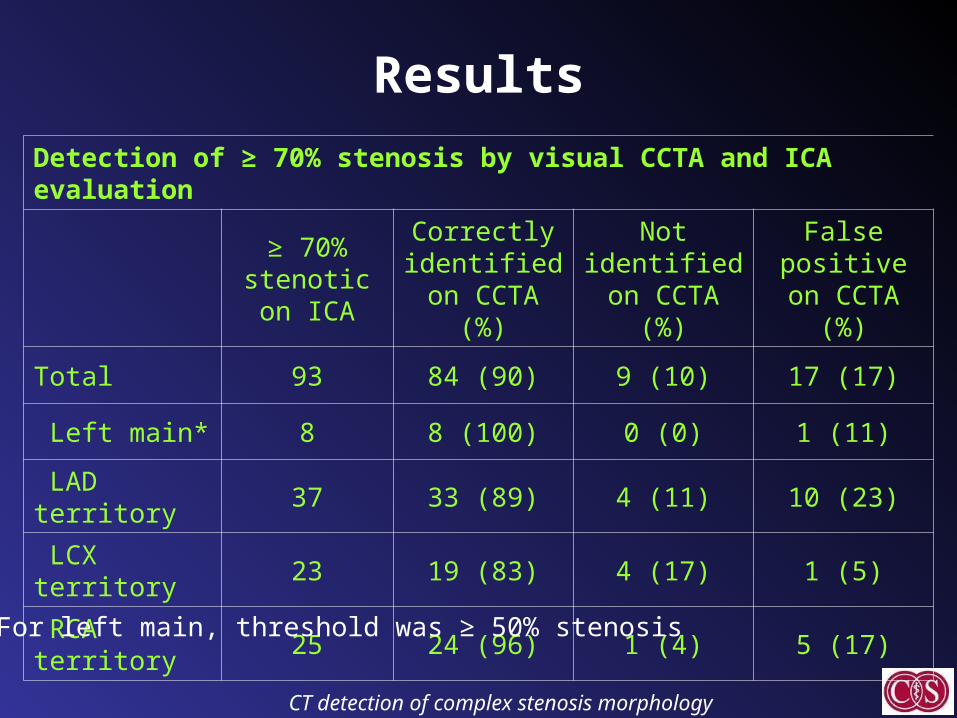
Detection of ≥ 70% stenosis by visual CCTA and ICA evaluation
≥ 70%
stenotic on ICA
Correctly identified on CCTA (%)
Not identified on CCTA (%)
False positive on CCTA (%)
Total 93 84 (90) 9 (10) 17 (17)
Left main* 8 8 (100) 0 (0) 1 (11)
LAD territory 37 33 (89) 4 (11) 10 (23)
LCX territory 23 19 (83) 4 (17) 1 (5)
RCA territory 25 24 (96) 1 (4) 5 (17)
* For left main, threshold was ≥ 50% stenosis

CT detection of complex stenosis morphology
Results
CCTA performance in ≥ 70% stenotic Type-C stenoses
• Detected 42 of 53 lesions (79%)
• Detected 31 of 35 patients (89%)
• False positive in 7 segments and 3 patients

CT detection of complex stenosis morphology
Results
CCTA detection of specific Type-C morphologies
• Correctly identified 46 of 62 lesions (74%)
• Most frequent false positive: branch involvement (12 cases)
• Most frequent miss: lesion length > 20 mm (7 cases)

CT detection of complex stenosis morphology
Results
Correct and incorrect characterization of Type-C lesions by CCTA
n (on ICA)
Correctly identified on CCTA (%)
Not identified on CCTA (%)
False positive on CCTA (%)
Total 62 46 (74) 16 (26) 22 (32)
Ostial 20 15 (75) 5 (25) 2 (12)
Crosses major branch 15 13 (93) 2 (7) 12 (48)
Total occlusion 9 7 (78) 2 (22) 3 (30)
> 20 mm in length 18 11 (61) 7 (39) 4 (26)
Proximal vessel tortuosity 0 0 (0) 0 (0) 1 (100)
> 90° angle at lesion 0 0 (0) 0 (0) 0 (0)
Ostial LAD involvement
Proximal RCA total occlusion
Left main plaque crossing LCX and involving ostial LAD
LCX
LAD
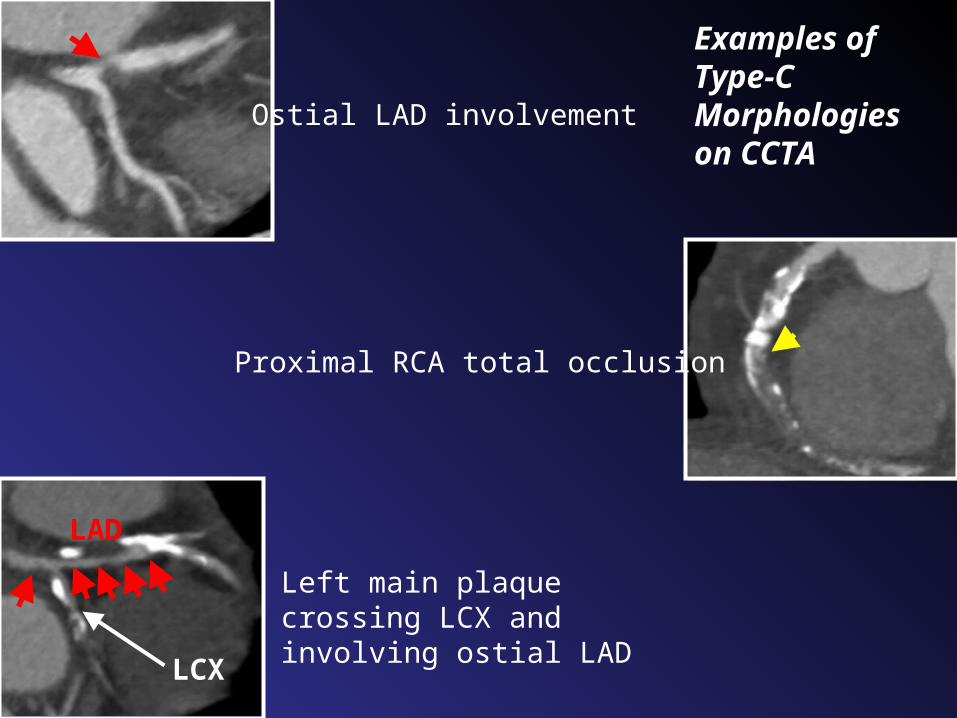
Examples of Type-C Morphologies on CCTA

Ostial LAD involvement
Proximal RCA total occlusion
Left main plaque crossing LCX and involving ostial LAD
LCX
LADLAD

CT detection of complex stenosis morphology
Results
PCI, Procedure Time, and Contrast Use
• PCI performed in 36 patients for 46 lesion (none for total occlusion)
• Procedure time available in 34 patients• Contrast use available in 31 patients• Type-C morphology on CCTA was associated
with significantly increased procedure duration and contrast use

CT detection of complex stenosis morphology
Results
Mean PCI time and contrast use in patients with and without a Type-C lesion on ICA and CCTA
ICA with no Type-C ICA with Type-C p-value*
Mean PCI time (min) 21.6 ± 12.8 43.7 ± 25.20.005 (0.003)†
Mean contrast use (ml) 137.1 ± 39.2 275.1 ± 152.30.003 (0.01)†
CCTA with no Type-C CCTA with Type-C P-value*
Mean PCI time (min) 21.5 ± 13.3 42.4 ± 24.70.009 (0.003)†
Mean contrast use (ml) 139.7 ± 47.4 262.6 ± 150.00.001 (0.02)†
* Adjusted for age and body-mass index† p-values obtained after log-tranforming PCI time and contrast use.

CT detection of complex stenosis morphology
Main Discussion Points
• Step-wise assessment of ≥ 70% stenosis followed by presence of Type-C morphology on CCTA emulates real-life evaluation during ICA
• Our data showed CCTA detects ≥ 70% stenosis with additional value of identifying Type-C features

CT detection of complex stenosis morphology
Main Discussion Points
• Why did CCTA miss long lesions?– Underestimation of true lesion length by
standard oblique displays of CCTA
• Why did CCTA overcall branch involvement?– Limitations of spatial resolution– ICA underestimated lesion complexity?

CT detection of complex stenosis morphology
Main Discussion Points
• Type-C morphology on CCTA was significantly associated with longer PCI procedural time and contrast use
– Alerts clinician to higher risk of contrast-induced nephropathy from PCI
– Interventionalist may better plan PCI with advanced knowledge of lesion complexity
CT detection of complex stenosis morphology
Limitations
• Modest sample size
• Referral bias
– Severe stenosis on CCTA more ICA referral
– Severe noncalcified lesions more ICA referral
– Contributed to high prevalence of disease
• Proximal tortuosity and highly angular lesions not represented
• Consensual reading not community practice
• Visual assessment has propensity for overestimation

CT detection of complex stenosis morphology
Conclusions
• Using a visual cut-off of ≥ 70% diameter stenosis in vessels segments ≥ 2 mm in diameter, CCTA can predict lesions likely to reach ≥ 70% stenosis on ICA and discern associated complex morphologies
• Presence of complex, severely obstructive lesions on CCTA predicts greater contrast use and longer procedure duration during PCI
CT detection of complex stenosis morphology
Recommendation
• CCTA readers should routinely describe the morphology of each detected severe stenosis