characterization of disease-related cd8+ t cells from ... · 1.1 basics of the mammalian immune...
TRANSCRIPT

Aus dem Institut für Klinische Neuroimmunologie
der Ludwig-Maximilians-Universität München
Direktor: Prof. Dr. med. Reinhard Hohlfeld
Characterization of Disease-Related CD8+ T Cells and
their Antigens from Patients with Multiple Sclerosis
Dissertation
zum Erwerb des Doktorgrades der Naturwissenschaften
an der medizinischen Fakultät
der Ludwig-Maximilians-Universität München
vorgelegt von
Anna Gabriele Niedl
aus München
2013


Gedruckt mit der Genehmigung der medizinischen Fakultät
der Ludwig-Maximilians-Universität München
Betreuer: PD Dr. rer. nat. Klaus Dornmair
Zweitgutachterin: Prof. Dr. Elfriede Nößner
Dekan: Prof. Dr. med. Dr. h. c. Maximilian Reiser, FACR, FRCR
Tag der mündlichen Prüfung: 22.08.2014


DANKSAGUNG
V
Danksagung
Ich möchte mich bei allen bedanken, die zum Gelingen dieser Arbeit beigetragen haben.
An erster Stelle möchte ich meinem Betreuer PD Dr. Klaus Dornmair für die Bereitstellung des
interessanten und anspruchsvollen Themas, die intensive Betreuung, ständige Diskussionsbereitschaft
und das begeisterte Interesse an meinem Projekt danken.
Ich danke Prof. Dr. Reinhard Hohlfeld für das ebenfalls sehr große Interesse an meiner Arbeit Sie
haben so manchen Tag im abgeschotteten Sterilraum durch einen netten Plausch und auch mal einen
Keks danach erheitert.
Besonders möchte ich mich bei den Kollaboratoren Prof. Dr. Lars Fugger, Dr. Kathrine Attfield, Dr.
Wolfgang Klinkert, Dr. Stefan Pinkert und Dr. Peer-Hendrik Kuhn für die vielen, langen Gespräche
und die fruchtbare Zusammenarbeit bedanken.
Ich danke allen Mitarbeitern für die angenehme Atmosphäre und die freundliche Aufnahme in beiden
Abteilungen für Neuroimmunologie. Ein sehr großer Dank geht an Ingrid Eiglmeier, Joachim Malotka
und Reinhard Mentele für die Einweisung in viele unterschiedliche Technologien und Geräte.
Insbesondere bedanke ich mich auch bei Katherina und Jessica für das geduldige Erklären neuer
Techniken und bei Simone für erfolgreiche Platz- und Geräteteilung. Außerdem bedanke ich mich bei
Angelika, Kathrin, Judy, Latika, Makbule, Eduardo, Geraldine, Gintare, Birgit, Wakiro, Aline,
Qingqing und Matea für die ständige Diskussionsbereitschaft und hilfreiche Kritik.
Abschließend möchte ich mich bei meiner Familie und meinen Freunden bedanken. Ohne euch wären
gerade die letzten zwei Jahre nicht zu stemmen gewesen.
ZUSAMMENFASSUNG
VI
Zusammenfassung
Multiple Sklerose ist wahrscheinlich eine autoimmunvermittelte, entzündliche Erkrankung des
zentralen Nervensystems. An verschiedenen Stellen im Gehirn und Rückenmark kommt es zu einer
Zerstörung der Markscheiden und Axone. Diese Schädigung führt zu neurologischen Symptomen. Der
Krankheits-verlauf ist nicht vorhersehbar und zugrundeliegende Mechanismen sind weitgehend
unbekannt. Sowohl Umwelteinflüsse als auch genetische Prädisposition werden in diesem
Zusammenhang diskutiert.
Vor kurzem wurde CD8+ T Lymphozyten eine entscheidende Rolle bei der autoimmunvermittelten
Pathogenese zugesprochen. Sie übertreffen deutlich die Anzahl an CD4+ T Zellen in aktiven Läsionen
aber Zielzellen oder erkannte Antigene sind bisher unbekannt. Schon sehr früh konnte eine genetische
Verknüpfung zwischen der Wahrscheinlichkeit an Multipler Sklerose zu erkranken und dem humanen
Leukozyten Antigen Genlocus festgestellt werden. Dabei wird das Risiko durch den Besitz des
HLA-A*0301 Allels erhöht und des HLA-A*0201 Allels gesenkt. Demnach wurden in der
vorliegenden Arbeit folgende zwei Fragestellungen bearbeitet:
1. Welche CD8+ T Lymphozyten sind an dem Autoimmunangriff auf das zentrale Nervensystem
beteiligt und welche Rezeptoren tragen sie zur Antigenerkennung?
2. Wie vermindert die Expression von HLA-A2 Molekülen das Erkrankungsrisiko?
Im ersten Teil wurden T Zell Rezeptoren von potentiell krankheitsrelevanten CD8+ Einzelzellen aus
gefrorenem Patientengewebe charakterisiert. Krankheitsrelevanz wurde durch Zugehörigkeit zu einer
klonal expandierten Zellpopulation oder durch die Expression von Aktivierungsmarkern definiert. In
einem klonspezifischen Ansatz wurden die T Zell Rezeptor beta Ketten von voruntersuchten, klonal
expandierten T Zell Populationen analysiert. Zudem wurde eine neue, von Voruntersuchungen unab-
hängige Methode zur Charakterisierung von T Zell Rezeptor beta Ketten entwickelt.
Im zweiten Teil wurde die Antigenerkennung des möglicherweise krankheitsrelevanten T Zell
Rezeptors 2D1 untersucht. Dieser Rezeptor wurde aus einem Multiple Sklerose Patienten isoliert. Der
T Zell Rezeptor 2D1 erkennt ein Peptid, welches aus der Myelinscheide stammt und auf HLA-A3
Molekülen präsentiert wird. In einem Mausmodell entwickelten doppelt transgene Mäuse, die HLA-
A3 und den T Zell Rezeptor 2D1 exprimierten, der Multiplen Sklerose ähnliche Symptome nach
Immunisierung mit dem Myelinpeptid. Dreifach transgene Mäuse hingegen, die HLA-A3, den T Zell
Rezeptor 2D1 und HLA-A2 exprimierten, blieben gesund. Die 2D1 T Zellen wurden in diesen Mäusen
bereits im Thymus deletiert.
Um herauszufinden, welche HLA-A2 gebundenen Peptide diesen schützenden Effekt vermitteln,
wurde eine neu entwickelte Methode angewandt, mit welcher Antigene von HLA Klasse I
restringierten T Zellen identifiziert werden können. Dabei wurden 28 Peptide isoliert, welche von dem
T Zell Rezeptor 2D1 auf HLA-A2 Molekülen erkannt werden. Diese Peptide wiesen hohe
Sequenzähnlichkeiten auf. Acht Proteine aus der Maus – davon vier auch im Menschen vorhanden –
kamen als Quellprotein in Frage. Schließlich wurden diese acht Proteine näher analysiert und
Versuche zur Antigenprozessierung in unterschiedlichen antigenpräsentierenden Zellen durchgeführt.
SUMMARY
VII
Summary
Multiple Sclerosis is most probably an autoimmune inflammatory disease of the central nervous
system. Demyelination of neurons and axonal loss occur in temporal and spatial resolution in multiple
areas of the brain and spinal cord. This impairment manifests in neurological symptoms. The course of
disease varies between individuals and the causing mechanisms still remain elusive. Environmental
factors as well as genetic predispositions are widely discussed.
Recent studies stressed the prominent role of CD8+ T lymphocytes in the autoimmune
pathomechanism. They notably exceed the amount of CD4+ T cells in acute lesions yet target cells and
activating antigens remain elusive. A genetic linkage between the human leukocyte antigen gene locus
and disease susceptibility was observed. Carrying the HLA-A*0301 allele or the HLA-A*0201 allele
correlates with a risk factor or protective effect for Multiple Sclerosis susceptibility, respectively. Thus
during this thesis two main questions were followed:
1. Which CD8+ T lymphocytes participate in the autoimmune attack on central nervous system
tissue and what are their receptors for antigen recognition?
2. How does the expression of HLA-A2 molecules lead to a decreased disease susceptibility?
In the first part, the T cell receptor molecules of potentially disease-related single CD8+ T cells from
frozen patient tissue samples were characterized. T lymphocytes were considered disease-related when
they either belonged to a clonally expanded T cell population or expressed an activation marker on
their cell surface. In a clone-specific approach, the T cell receptor beta chains of pre-analyzed, clonally
expanded T cell populations were investigated. Further an unbiased approach independent of pre-
analyses was established.
In the second part, antigen recognition of the probably disease-related T cell receptor 2D1 was
investigated. This receptor was isolated from a Multiple Sclerosis patient and was known to be
activated by a myelin-derived peptide presented on HLA-A3 molecules. In an animal model double-
transgenic mice expressing HLA-A3 and the 2D1 T cell receptor developed a Multiple Sclerosis-like
disease after immunization with the known peptide. Surprisingly not a single triple-transgenic mouse
expressing HLA-A3, the T cell receptor 2D1 and HLA-A2 showed symptoms after immunization. In
these mice 2D1 T lymphocytes were shown to be depleted in the thymus.
To characterize HLA-A2-bound peptides which mediate this protective effect a novel technology for
unbiased identification of antigenic peptides recognized by human leukocyte antigen class I-restricted
T lymphocytes was employed. 28 peptides presented on HLA-A2 molecules were found to be
recognized by the T cell receptor 2D1. Those peptides displayed very closely related sequences. Eight
possible parent proteins existing in mouse, therefrom even four equally expressed in humans were
identified. Finally those putative parent proteins were further characterized and first investigations of
antigen processing in different antigen presenting cell lines were performed.

TABLE OF CONTENTS
VIII
Table of Contents
1 Introduction ................................................................................................................................... 1
1.1 Basics of the Mammalian Immune System .............................................................................. 1
1.2 T Lymphocytes ......................................................................................................................... 1
1.2.1 Structure of the Alpha Beta T Cell Receptor ....................................................................... 2
1.2.2 Generation of the T Cell Receptor Diversity ....................................................................... 3
1.2.3 Antigen Recognition of CD8+ T Lymphocytes ................................................................... 4
1.2.4 T Cell Selection and Development ...................................................................................... 5
1.2.5 T Cell Receptor Cross- and Alloreactivity .......................................................................... 6
1.3 Autoimmunity........................................................................................................................... 7
1.4 Multiple Sclerosis ..................................................................................................................... 7
1.4.1 Pathomechanism of Multiple Sclerosis ............................................................................... 8
1.4.2 T Lymphocytes in Multiple Sclerosis.................................................................................. 8
1.4.3 HLA Class I-Related Genetic Predisposition for Multiple Sclerosis .................................. 8
1.5 Current Knowledge Regarding the Characterization of Molecular Targets of Disease-Related
T Lymphocytes ......................................................................................................................... 9
1.5.1 Identification of Disease-Related TCR Molecules .............................................................. 9
1.5.2 Antigen Identification of Putatively Disease-Related T Lymphocytes ............................. 10
1.6 Objective................................................................................................................................. 12
2 Materials and Methods ................................................................................................................ 13
2.1 Materials ................................................................................................................................. 13
2.1.1 Devices .............................................................................................................................. 13
2.1.2 Consumables and Chemicals ............................................................................................. 13
2.1.3 Kits and Specific Reagents ................................................................................................ 14
2.1.4 Buffers, Solutions and Media ............................................................................................ 15
2.1.5 Primers .............................................................................................................................. 18
2.1.6 Plasmids ............................................................................................................................ 23
2.1.7 Peptides ............................................................................................................................. 24
2.1.8 Antibodies ......................................................................................................................... 25
2.1.9 Eukaryotic Cell Lines and Escherichia coli Strains .......................................................... 26
2.1.10 Human Tissue Samples and Blood Cells ........................................................................... 27
2.2 Analysis of Nucleic Acids ...................................................................................................... 28
2.2.1 RNA isolation from Tissue Samples ................................................................................. 28
2.2.2 Determination of DNA and RNA Concentration .............................................................. 28
2.2.3 Analysis of RNA Quality in Human Tissue Blocks .......................................................... 28
2.2.4 Quantitative PCR ............................................................................................................... 29
2.2.5 Agarose gel electrophoresis ............................................................................................... 30
2.2.6 Sequencing of DNA Samples ............................................................................................ 30

TABLE OF CONTENTS
IX
2.3 Generation of diverse Plasmids .............................................................................................. 30
2.3.1 Plasmid-Encoded Combinatorial Peptide Libraries .......................................................... 30
2.3.2 Peptide-Coding Plasmids .................................................................................................. 32
2.3.3 Truncated Proteins Coding Plasmid pcDNA6/V5-HisA ................................................... 33
2.3.4 Truncated Proteins Coding Plasmid pQE-30 .................................................................... 35
2.4 Handling of E. coli Cultures ................................................................................................... 37
2.4.1 Culture Conditions ............................................................................................................ 37
2.4.2 Determination of Cell Numbers ........................................................................................ 37
2.4.3 Freezing and Thawing of E. coli Cultures ......................................................................... 37
2.4.4 Plasmid Transformation in E. coli Cells ........................................................................... 37
2.4.5 Plasmid Isolation from E. coli Cells .................................................................................. 38
2.5 Handling of Eukaryotic Cells ................................................................................................. 38
2.5.1 Cultivation of Eukaryotic Cell Lines................................................................................. 38
2.5.2 Counting of Eukaryotic Cells ............................................................................................ 39
2.5.3 Freezing and Thawing of Eukaryotic Cells ....................................................................... 39
2.5.4 Fluorescence-Activated Cell Sorting of CD3+ Blood Lymphocytes ................................. 40
2.5.5 FuGENE Transfection of Eukaryotic Cells ....................................................................... 40
2.5.6 Generation of the Stably Transfected Cell Lines 2D1-NFAT-sGFP and B7-NFAT-sGFP
........................................................................................................................................... 40
2.5.7 Generation of the Stably Transfected Cell Line COS-7-A3 .............................................. 41
2.5.8 CD3 Activation of NFAT-sGFP T Hybridoma Cells ........................................................ 43
2.5.9 Fluorescence Microscopy for Detection of sGFP Expression in Eukaryotic Cells ........... 43
2.5.10 Flow Cytometry Analysis of sGFP Expression in Eukaryotic Cells ................................. 43
2.5.11 Flow Cytometry Analysis of HLA-A2 Expression ........................................................... 43
2.6 Analysis of Peptides and Proteins .......................................................................................... 44
2.6.1 Determination of Protein Concentration ........................................................................... 44
2.6.2 Peptide and Protein Lyophilization ................................................................................... 44
2.6.3 Mass Spectrometry of Peptides and Proteins .................................................................... 44
2.6.4 SDS Polyacrylamide Gel Electrophoresis ......................................................................... 44
2.6.5 Western Blot ...................................................................................................................... 45
2.6.6 Coupling of IgG Antibodies to Protein G Dynabeads ....................................................... 46
2.6.7 Preparation of Proteins from Eukaryotic Cell Lines ......................................................... 46
2.6.8 Preparation of Peptides Presented on HLA-A2 by ConA 4B Chromatography................ 47
2.6.9 Preparation of Peptides Presented on HLA-A2 by Lentil-Lectin Chromatography .......... 47
2.6.10 Production and Purification of Soluble Proteins in E. coli ................................................ 48
2.6.11 Production and Purification of the HLA-A2 alpha Chain in E. coli ................................. 49
2.6.12 Refolding of Peptide:HLA-A2 Complexes ....................................................................... 50
2.6.13 Enzymatic Biotinylation of Peptide:HLA-A2 Complexes ................................................ 51
2.7 Characterization of Potentially Autoaggressive T Cells from Frozen Tissue Sections of MS
Patient FE ............................................................................................................................... 51
TABLE OF CONTENTS
X
2.7.1 Establishment of Immunofluorescent Staining ................................................................. 51
2.7.2 Laser Microdissection of Single Cells from Tissue Sections of MS Patient FE ............... 52
2.7.3 RT-PCR of TCR Alpha- and Beta Chains ......................................................................... 52
2.7.4 Basic Protocol of Clone Specific TCR Beta Chain PCR................................................... 53
2.7.5 Basic Protocol of Unbiased TCR Beta Chain PCR ........................................................... 56
2.7.6 TCR Alpha Chain PCR ..................................................................................................... 58
2.8 Characterization of Mimotopes Recognized by the TCRs 2D1 and B7 ................................. 59
2.8.1 Peptide Assays with NFAT-sGFP-Expressing T Hybridoma Cells or IL-2 ELISA as
Read-Out System ............................................................................................................... 59
2.8.2 Assays with Peptide-Coding Plasmids .............................................................................. 59
2.8.3 In Vitro Peptide:HLA-A2 Tetramer Recognition Assay ................................................... 60
2.8.4 Assays with Plasmid-Encoded Combinatorial Peptide Libraries ...................................... 60
2.8.4.1 Isolation of Positive APCs ......................................................................................... 60
2.8.4.2 Plasmid Recovery PCR and Recloning of PCR Products .......................................... 62
2.8.4.3 Reactivation Assay and Subpool Enrichment ............................................................ 63
2.8.4.4 Final Enrichment and Sequencing of the Mimotope-Coding Plasmid ....................... 63
2.8.5 Database Search for Parent Proteins .................................................................................. 63
3 Results ......................................................................................................................................... 64
3.1 Characterization of Matching TCR Alpha and Beta Chains from Human Blood T Cells ...... 64
3.2 Optimization of the Methods to Identify Matching TCR Alpha and Beta Chains from Human
Brain Tissue ............................................................................................................................ 65
3.2.1 Effects of Different Tissue Treatment on RNA Quality.................................................... 65
3.2.2 Liquid Cover Glass ............................................................................................................ 68
3.2.3 Optimization of the Clone-Specific TCR Beta Chain PCR Protocol ................................ 69
3.3 Establishment of a Semi-Biased TCR Beta Chain PCR Protocol .......................................... 71
3.4 Characterization of TCR Beta Chains from Brain Tissue of MS Patient FE ......................... 72
3.5 Preliminaries to Mimotope Searches of the TCR 2D1 on HLA-A2 Molecules ..................... 74
3.5.1 Cell Lines 2D1-NFAT-sGFP and B7-NFAT-sGFP .......................................................... 75
3.5.2 Cell Lines COS-7-A2 and COS-7-A3 ............................................................................... 75
3.5.3 Generation of Plasmid-Encoded Combinatorial Peptide Libraries ................................... 76
3.5.4 Investigation of Endogenous Antigens on Different Cell Lines ........................................ 77
3.5.5 Position Screening for Contacts of TCR 2D1 and PLP45-53:HLA-A3 Complex ................ 78
3.5.6 Peptide recognition of TCR 2D1 and TCR B7 on HLA-A2 and HLA-A3 Molecules ...... 79
3.6 Mimotope Search with TCR 2D1 on HLA-A2 Molecules ..................................................... 80
3.6.1 Mimotope Search with Plasmid-Encoded Combinatorial Peptide Libraries ..................... 81
3.6.2 Database Searches and Identification of Mimotope Peptides with Peptide-Coding
Plasmids ............................................................................................................................ 82
3.6.3 Search for Human Candidate Peptides in the Endogenous Repertoire of HLA-A2+ EBV-
Transducted B Cells .......................................................................................................... 84
3.7 Characterization of Mouse Peptides recognized by TCR 2D1 on HLA-A2 Molecules ......... 86

TABLE OF CONTENTS
XI
3.7.1 Expression of Potential Parent Proteins in Mouse Tissue ................................................. 86
3.7.2 Recognition of Mouse and Human Mimotopes on HLA-A2 Tetrameres by the TCR 2D1
........................................................................................................................................... 87
3.7.3 Investigation of Protein Processing in COS-7-A2 Cells ................................................... 88
3.7.4 Investigation of Protein Cross-Presentation in EBV-Transducted B Cells ....................... 90
4 Discussion.................................................................................................................................... 93
4.1 Identification of Disease-Related Alpha-Beta TCRs from CD8+ T Cells in MS Patient FE .. 93
4.1.1 Technical Obstacles........................................................................................................... 94
4.1.1.1 Positioning of Cells in Tissue Sections ...................................................................... 94
4.1.1.2 Image Quality ............................................................................................................ 95
4.1.1.3 RNA Quality .............................................................................................................. 96
4.1.2 The Clone-Specific PCR Method for TCR Identification ................................................. 97
4.1.3 The Unbiased PCR Method for TCR Identification .......................................................... 98
4.2 Future Prospects (I) ................................................................................................................ 99
4.3 Mimotope Identification of the MS-Related TCR 2D1 on HLA-A2 Molecules .................. 100
4.3.1 First Evidence for Allo- and Crossreactivity of the TCR 2D1 ........................................ 101
4.3.2 Identification of Mimotopes Recognized by the TCR 2D1 on HLA-A2 Molecules ....... 102
4.3.2.1 Unbiased Identification of Antigenic Peptides ........................................................ 102
4.3.2.2 Motif-Based Database Search .................................................................................. 103
4.3.3 Viral Association with Pathogenesis of Multiple Sclerosis ............................................ 105
4.3.4 Application of Mimotopes as Synthetic Peptides ............................................................ 105
4.4 In Vitro Processing of Potential Parent Proteins .................................................................. 106
4.5 Future Prospects (II) ............................................................................................................. 107
5 Supplements .............................................................................................................................. 109
5.1 Position of Primers for Clone-Specific TCR Beta Chain PCR ............................................ 109
5.2 Position of Primers in the TCR Beta Chain Constant Gene Segment .................................. 110
5.3 Library Sequencing .............................................................................................................. 111
5.4 Second Matrix for Database Search Based on TCR 2D1-HLA-A2 Mimotopes and
Candidates ............................................................................................................................ 112
5.5 Primers and Plasmids for Peptide-Coding Plasmids ............................................................ 113
5.6 Primer Position for Quantitative PCR of Potential Parent Mouse Proteins.......................... 117
5.7 Plasmid Information ............................................................................................................. 120
5.7.1 pcDNA6/V5-HisA ........................................................................................................... 120
5.7.2 pQE-30 ............................................................................................................................ 122
5.7.3 pcDNA™3.1D/V5-His-TOPO® ...................................................................................... 124
5.7.4 13AAG64P_Ncan-V5_pMA-RQ .................................................................................... 125
5.8 Protein Truncation ................................................................................................................ 126
5.9 Mass Spectrometry of the Protein Sequences His6-DMXL2748-926-V5, His6-EML5897-1038-V5,
His6-GPCPD11-118-V5 and His6-NCAN156-359-V5 ................................................................. 140
List of Abbreviations ........................................................................................................................... 150

TABLE OF CONTENTS
XII
List of References ................................................................................................................................ 151

INTRODUCTION
1
1 Introduction
1.1 Basics of the Mammalian Immune System
The mammalian immune system is responsible for the integrity of living organisms by protecting them
from external pathogens like viruses, bacteria, fungi or multicellular parasites, as well as from harmful
alterations of the body’s own elements such as tumors (Chaplin 2010). Two main systems work
together:
The innate immune defense consists of physical barriers, the complement system and immune cells
such as granulocytes, monocytes and natural killer cells. These components recognize common
features of many pathogens with genetically coded, invariant receptors. The main purpose is to keep
reactions local and to mediate a fast response against common intruders.
The adaptive immune defense evolved in vertebrates and consists of the humoral and the cellular
immunity. With highly variable receptors the cells of the adaptive immune system are able to
specifically recognize distinct pathogenic structures, so called antigens. Further they provide enhanced
protection against reinfection with the same pathogen by establishing immunological memory.
B lymphocytes (B cells) express immunoglobulin molecules as antigen receptors on their surface.
Following activation, they secrete these receptors as antibodies which neutralize toxins and viruses or
mark extracellular pathogens for other immune cells. T lymphocytes (T cells) express
immunoglobulin-like molecules as antigen receptors on their surface, the so called T cell receptor
(TCR). They react against intracellular pathogens and altered-self structures or control a further
immune response by secreting mediators.
1.2 T Lymphocytes
T cells originate from lymphatic precursor cells in the bone marrow and migrate into the thymus
where they mature and rearrange their TCRs (Section 1.2.2., p. 3). The majority of T cells express a
TCR consisting of an alpha and a beta chain. They are further subdivided according to their co-
receptors into CD4 and CD8 expressing T lymphocytes.
CD4+ T cells mainly coordinate the immune response by secreting mediators that attract other immune
cells or influence their differentiation (Nakayamada et al., 2012). They recognize antigens in the
context of human leukocyte antigen (HLA) class II molecules on specific antigen presenting cells
(APC) such as dendritic cells, B lymphocytes or macrophages.
CD8+ T cells mainly serve to eliminate infected or altered-self cells after direct cell contact and the
release of granzyme B and perforin or signaling via the fas ligand CD95L (Harty et al., 2000). They
recognize antigens in the context of HLA class I molecules that are expressed on all cells in the body
containing a nucleus (Section 1.2.3, p. 4).

INTRODUCTION
2
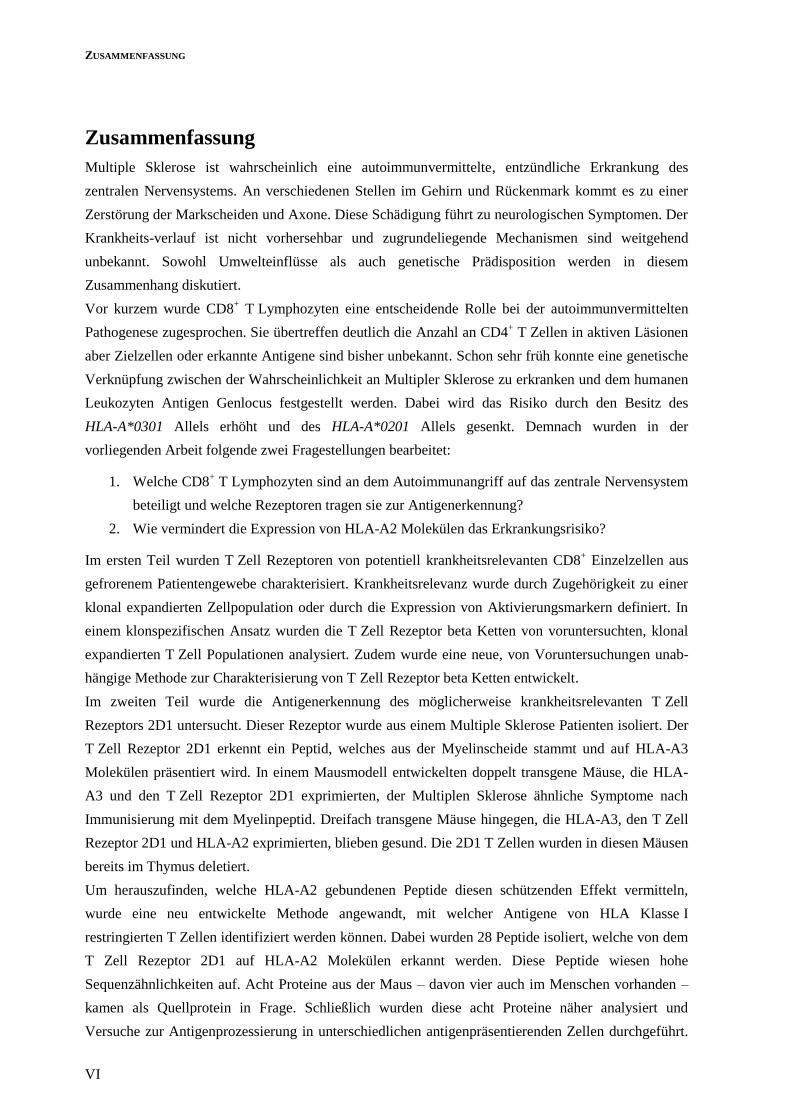
1.2.1 Structure of the Alpha Beta T Cell Receptor
As CD8+ T lymphocytes are the main subject of this thesis, the structure of TCR molecules is
explained regarding the alpha beta TCR complex and CD8 co-receptor (Figure 1, p. 2). The alpha and
beta chains of the TCR molecule consist of an amino-terminal extracellular region, a hydrophobic
transmembrane domain and a short intracellular carboxy-terminus (Kronenberg et al., 1986). The
extracellular regions of both chains are composed of a variable and an immunoglobulin-like constant
domain. Antigen recognition happens in the binding groove of both variable domains.
Due to the very short transmembrane region, the TCR dimer needs stabilization and cannot transduce
signaling information on its own. These tasks are accomplished by the accessory CD3 complex
(Clevers et al., 1988). It consists of epsilon-delta and epsilon-gamma heterodimers and a zeta-zeta
homodimer. The first step in TCR signaling (Love and Hayes, 2010) is the phosphorylation of
immunoreceptor tyrosine-based activation motifs that are located at the intracellular domains of the
CD3 complex. After several steps the nuclear factor of activated T cells (NFAT) regulates the
expression of activation-associated genes, such as the interleukin 2 (IL-2) locus.
The co-receptor CD8 may consist of an alpha-alpha homodimer or an alpha-beta heterodimer. CD8
reinforces and multiplies TCR signaling by laterally binding to HLA class I molecules and
intracellular signal transduction (Gáspár et al., 2001). CD8 alpha-alpha homodimers are not only
expressed on CD8+ T lymphocytes but additionally on CD4
+ T lymphocytes, dendritic cells,
macrophages and microglial cells of the central nervous system (CNS) (Gangadharan and Cheroutre,
2004).
Figure 1: Alpha beta TCR complex.
The chains of the alpha beta TCR dimer (blue) consist of a variable amino-terminal and a constant carboxy-terminal region
which ends in a short transmembrane domain. Antigen recognition takes place in the binding groove (white semicircle) at the
variable region. The TCR is stabilized by the CD3 complex (red to yellow) which is responsible for signal transduction into
the cell after antigen recognition. The co-receptor CD8 (green) may be composed of an alpha-alpha homodimer (not shown)
or an alpha-beta heterodimer. Stabilizing disulphide bonds are depicted in black (modified from Backes, 2010).

INTRODUCTION
3
1.2.2 Generation of the T Cell Receptor Diversity
T lymphocytes must recognize a broad spectrum of antigens. The variety of antigen recognition sites
in the binding grooves of the variable domains is generated by somatic recombination of genetic
segments. The rearrangements of TCR gene segments happen during T cell development in the
thymus. TCR alpha chains consist of a variable (V), a joining (J) and a constant (C) gene segment
whereas TCR beta chains contain additionally a diversity (D) segment.
Figure 2: Generation of TCR diversity and crystal structure of an alpha beta TCR.
A: Rearrangement of the TCR beta gene locus. The human TCR beta gene locus consists of 52 V beta (BV, green), 2 D beta
(BD, yellow), 13 J beta (BJ, red) and 2 C beta (BC, blue) gene segments. In a first step BV, BD and BJ segments are
combined at the DNA level via somatic recombination, then the BC segment is added at the mRNA level via splicing. The
TCR alpha gene locus is rearranged the same way but missing D gene segments. It consists of 70 to 80 V alpha (AV), 61
J alpha (AJ) and 1 C alpha (AC) gene segments (Arden et al., 1995; Rowen et al., 1996). B: Crystal structure of an alpha-beta
TCR. The TCR alpha- (pink) and TCR beta chain (blue) consist each of a variable (V alpha and V beta) and constant
(C alpha and C beta) domain. The chains are connected through disulphide bonds (yellow). CDR loops are numbered serially
(modified from Murphy et al., 2008). C: Top view crystal structure of an alpha-beta TCR. CDR loops of the TCR alpha and
beta chain are indicated (modified from Murphy et al., 2008).
First the TCR beta chain is generated by randomly joining a BD with a BV segment and then adding
both to a BJ segment. Afterwards the TCR alpha chain is generated by joining an AV and AJ segment.
These rearrangements occur on the DNA level. The rearrangements that produce a complete TCR beta
chain are shown in Figure 2-A (p. 3) and further described in Krangel (2009). During this somatic

INTRODUCTION
4
recombination random nucleotides are added or removed at the junctions between the V, D (only in
TCR beta chains) and J gene segments. The resulting highly variable nucleotide sequence is called
N(D)N. After transcription the V(D)J segments are combined with the C segment via splicing.
The antigen binding site of the variable domains consists at both TCR chains of three complementarity
determining regions (CDR) (Figure 2-B and -C, p. 3). The CDR1 and CDR2 lie within the germline-
coded V gene segments. However, the CDR3, which is mainly responsible for antigen recognition
(Davis et al., 1998), is coded by the highly variable N(D)N sequence.
1.2.3 Antigen Recognition of CD8+ T Lymphocytes
CD8+ T cells with an alpha beta TCR do not recognize antigens in their native state like antibodies do,
but recognize a composite ligand of an antigenic peptide bound to self-HLA class I molecules: the
peptide:self-HLA complex.
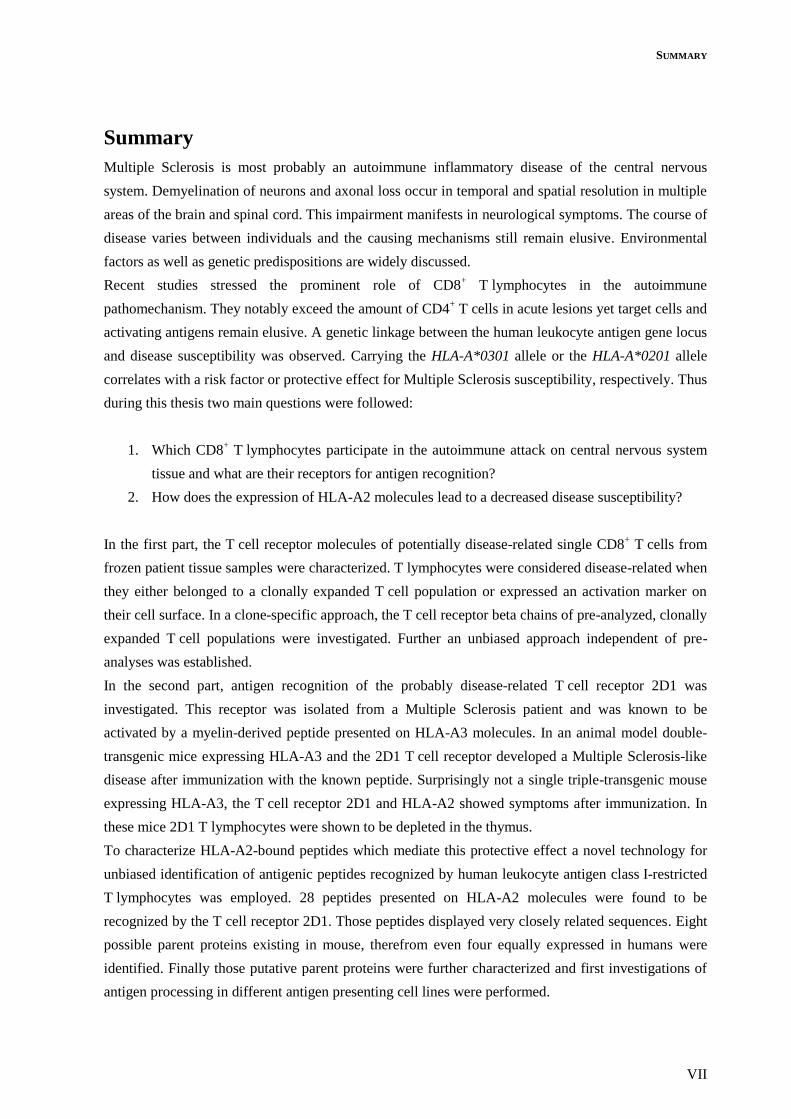
HLA class I molecules consist of two distinct chains (Figure 3-A, p. 5). The alpha chain contains three
extracellular domains and a fourth short transmembrane and intracellular domain. It is associated with
a shorter non-polymorphic chain, the β2-microglobulin. The alpha3 domain and the β2-microglobulin
are immunoglobulin-like domains. The alpha1 and alpha2 domains together form the peptide-binding
groove. The HLA gene locus is polygenic and highly polymorphic. Each gene locus codes three HLA
class I molecules called HLA-A, HLA-B and HLA-C which are co-dominantly expressed on the cell
surface (Murphy et al., 2008). According to the IMGT (http://www.ebi.ac.uk/ipd/imgt/hla/stats.html)
1,695 HLA-A, 2,277 HLA-B and 1,321 HLA-C proteins are known to exist in the human population.
The polymorphisms are mainly located in the peptide-binding groove which allows presentation of
many different peptides (Falk et al., 1991).
HLA class I molecules usually present peptides of 8 to 10 amino acids (AA) in length (Madden et al.,
1993) but in some cases bulging and consequently the presentation of peptides with up to 14 AAs in
length is possible (Figure 3-D, p. 5; Speir et al., 2001). Peptides presented by one HLA variant usually
consist of similar AAs at two or three positions, the anchor residues. The side chains of these AAs
insert deep into pockets of the peptide-binding groove. The homepage http://www.syfpeithi.de/
home.htm provides a huge database of HLA molecules, their anchor residues and confirmed binding
peptides.
The peptides principally originate from intracellular proteins. These proteins are cleaved by the
immunoproteasome and transported into the endoplasmatic reticulum where they are loaded onto the
HLA class I molecule (Yewdell et al., 2003). CD8+ T lymphocytes are provided degradation products
of intracellular pathogens or aberrant self-peptides deriving from for example cancer cells amongst a
huge pool of normal self-peptides. Thus, the pathogenic antigen recognition skills of T cells must be
very sensitive. Few or even single contacts to pathogenic-peptide:self-HLA class I complexes suffice
for T cell activation (Irvine et al., 2002).
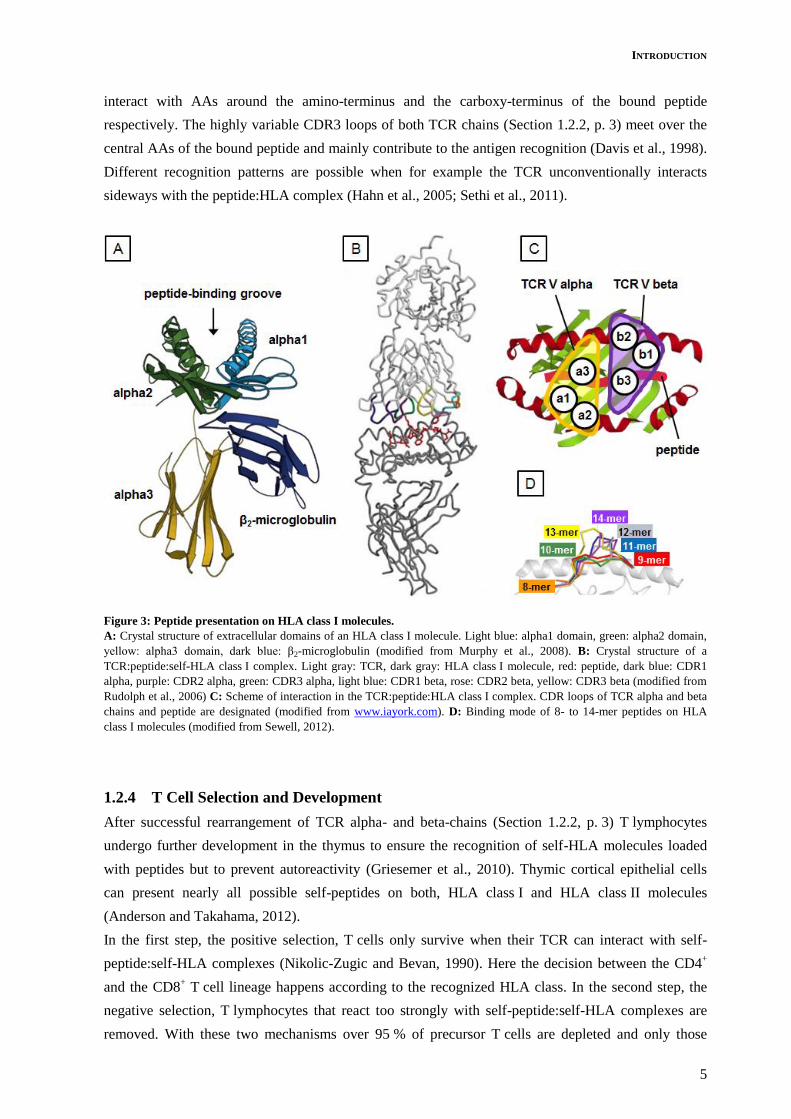
Commonly the TCR lies slightly diagonal over the peptide:self-HLA class I complex and interacts
with both the HLA molecule and the bound peptide (Figure 3-B and –C, p. 5) (Wang and Reinherz,
2012, Garcia and Adams, 2005). The CDR1 and CDR2 loops of the TCR alpha and beta chains
INTRODUCTION
5
interact with AAs around the amino-terminus and the carboxy-terminus of the bound peptide
respectively. The highly variable CDR3 loops of both TCR chains (Section 1.2.2, p. 3) meet over the
central AAs of the bound peptide and mainly contribute to the antigen recognition (Davis et al., 1998).
Different recognition patterns are possible when for example the TCR unconventionally interacts
sideways with the peptide:HLA complex (Hahn et al., 2005; Sethi et al., 2011).
Figure 3: Peptide presentation on HLA class I molecules.
A: Crystal structure of extracellular domains of an HLA class I molecule. Light blue: alpha1 domain, green: alpha2 domain,
yellow: alpha3 domain, dark blue: β2-microglobulin (modified from Murphy et al., 2008). B: Crystal structure of a
TCR:peptide:self-HLA class I complex. Light gray: TCR, dark gray: HLA class I molecule, red: peptide, dark blue: CDR1
alpha, purple: CDR2 alpha, green: CDR3 alpha, light blue: CDR1 beta, rose: CDR2 beta, yellow: CDR3 beta (modified from
Rudolph et al., 2006) C: Scheme of interaction in the TCR:peptide:HLA class I complex. CDR loops of TCR alpha and beta
chains and peptide are designated (modified from www.iayork.com). D: Binding mode of 8- to 14-mer peptides on HLA
class I molecules (modified from Sewell, 2012).
1.2.4 T Cell Selection and Development
After successful rearrangement of TCR alpha- and beta-chains (Section 1.2.2, p. 3) T lymphocytes
undergo further development in the thymus to ensure the recognition of self-HLA molecules loaded
with peptides but to prevent autoreactivity (Griesemer et al., 2010). Thymic cortical epithelial cells
can present nearly all possible self-peptides on both, HLA class I and HLA class II molecules
(Anderson and Takahama, 2012).
In the first step, the positive selection, T cells only survive when their TCR can interact with self-
peptide:self-HLA complexes (Nikolic-Zugic and Bevan, 1990). Here the decision between the CD4+
and the CD8+ T cell lineage happens according to the recognized HLA class. In the second step, the
negative selection, T lymphocytes that react too strongly with self-peptide:self-HLA complexes are
removed. With these two mechanisms over 95 % of precursor T cells are depleted and only those
INTRODUCTION
6
which are both self-HLA restricted and self-tolerant enter into the blood and lymphoid system
(Huesmann et al., 1991). These T lymphocytes interact at low affinity with self-peptide:self-HLA
complexes but at high affinity with foreign antigens loaded onto self-HLA molecules (Morris and
Allen, 2012).
Naïve T cells leave the thymus and circulate through the blood and lymphoid system until
encountering a pathogenic antigen with their specific TCR. This encounter activates the naïve T cell
(Smith-Garvin et al., 2009), which starts to divide and daughter cells maturate into effector cells
fulfilling their role in the immune response. Other daughter cells maturate into memory cells that may
be reactivated by the same pathogenic structure and then induce a fast, specific immune reaction even
years after the first encounter with the antigen (Arens and Schoenberger, 2010).
1.2.5 T Cell Receptor Cross- and Alloreactivity
But one T cell may not only be activated by one specific peptide presented one specific HLA molecule.
Crossreactivity describes the ability of T lymphocytes to recognize more than one distinct
peptide:HLA ligand. To ensure sufficient efficiency of T cell mediated immunity in humans about 1015
distinct antigenic peptides need to be recognized (Davis and Bjorkman, 1988; Mason, 1998). 1015
single T lymphocytes would weigh more than 500 kg (Sewell, 2012). Studies have estimated that only
about 108 different TCRs exist in the human naïve T cell pool (Arstila et al., 1999). Consistently
Wooldridge et al. (2012) demonstrated that one single CD8+ T lymphocyte may be activated by more
than 1.3 x 10⁶ different 10-mer peptides in the context of one distinct HLA molecule.
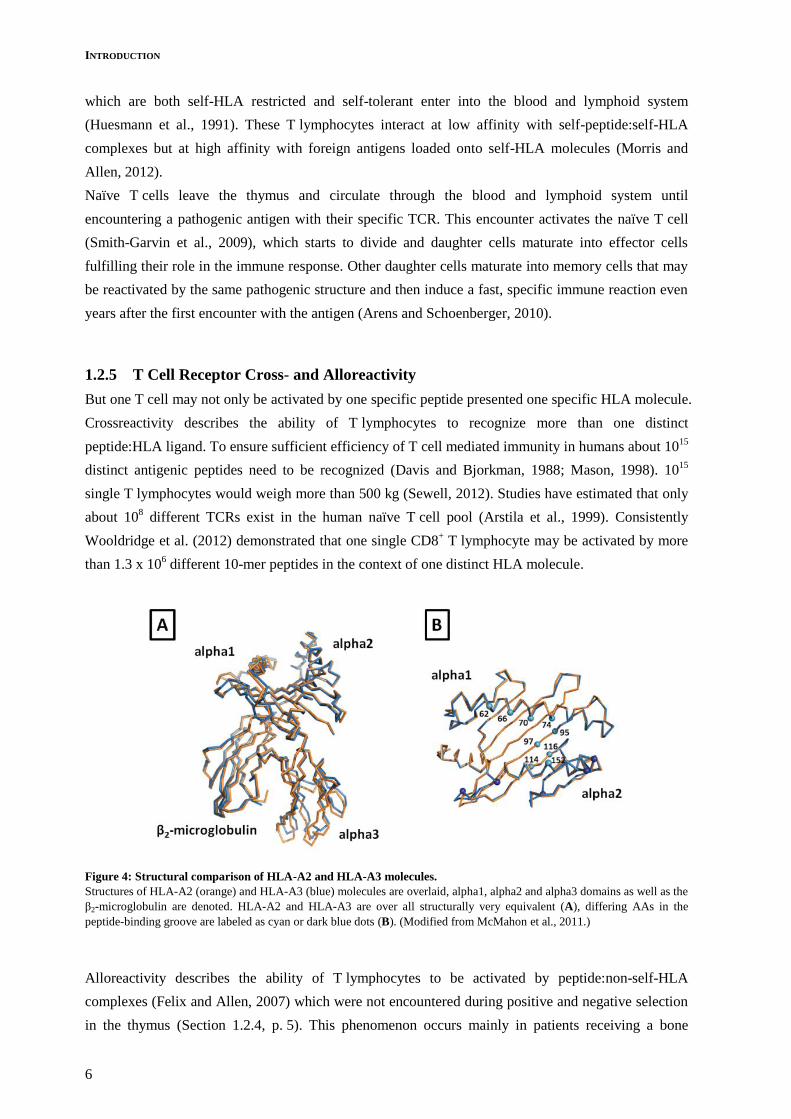
Figure 4: Structural comparison of HLA-A2 and HLA-A3 molecules.
Structures of HLA-A2 (orange) and HLA-A3 (blue) molecules are overlaid, alpha1, alpha2 and alpha3 domains as well as the
β2-microglobulin are denoted. HLA-A2 and HLA-A3 are over all structurally very equivalent (A), differing AAs in the
peptide-binding groove are labeled as cyan or dark blue dots (B). (Modified from McMahon et al., 2011.)
Alloreactivity describes the ability of T lymphocytes to be activated by peptide:non-self-HLA
complexes (Felix and Allen, 2007) which were not encountered during positive and negative selection
in the thymus (Section 1.2.4, p. 5). This phenomenon occurs mainly in patients receiving a bone

INTRODUCTION
7
marrow transplant that does not completely match the recipient’s HLA repertoire. Donor T cells
recognize peptides presented on recipient cells resulting in graft-versus-host disease (MacDonald et al,
2013). In solid organ transplantation recipient T cells recognize peptides presented on donor cells
leading to graft rejection (Ibrahim et al., 1995).
The molecular mechanism of alloreactivity is widely discussed (D’Orsogna et al., 2013; Colf et al.,
2007). One possible reason might be that most HLA alleles code for HLA molecules with only few
different AAs. The resulting HLA molecules might for example differ in the peptide-binding groove
but present very similar surfaces to the TCR like the HLA-A2 and HLA-A3 molecules (Figure 4, p. 6;
McMahon et al., 2011). Thus the TCR that was selected in the thymus to interact with one specific
type of HLA molecule can equally interact with the foreign HLA molecule but encounters a
completely different set of bound peptides.
1.3 Autoimmunity
Unfortunately, during the generation of the adaptive receptor repertoire (Section 1.2.2, p. 3) reactivity
against self-structures may arise. Despite many mechanisms eliminating or inactivating autoreactive
immune cells like negative selection of T lymphocytes in the thymus (Section 1.2, p. 1), still some
may escape and cause autoimmune diseases (Wekerle, 1992). Maybe selective pressure to establish an
effective immune response against pathogenic structures causes self-tolerance inducing mechanisms to
be limited and prone to failure.
Autoimmune diseases are generally characterized by the attack of adaptive immune cells against
healthy structures of the body without previous demonstrable pathogenic infection. Autoimmune
diseases may be classified into those that affect a single organ, such as type 1 diabetes or myositis, and
those that affect tissues throughout the body such as systemic lupus erythematosus. In a third group of
diseases such as multiple sclerosis (MS), it is still unknown whether autoimmunity or other
pathological processes are the causation for illness.
The mechanisms causing autoimmune diseases are still largely unidentified. Environmental factors,
molecular mimicry as well as genetic predisposition are discussed (Cusick et al., 2012; Rose and Bell,
2012).
1.4 Multiple Sclerosis
MS is most probably an autoimmune inflammatory disease of the CNS and one of the most common
neurological diseases in young adults. Worldwide approximately 2.5 million people are affected. MS
is more prevalent in females and gender likewise affects progression as well as treatment (Greer and
McCombe, 2011). In the temperate zones of the northern and southern hemisphere MS prevalence
exceeds that of equatorial regions. Environmental influences seem to play a crucial role as relocation
to areas with less risk at young age reduces the risk of MS (Ebers, 2008) but also genetic
predispositions may contribute to an elevated or reduced disease risk (Section 1.4.3, p. 8). The course
of disease is not predictable for individuals and only symptomatic treatment is available. Recently

INTRODUCTION
8
intense research rendered more specific treatment possible but still no cure is available (Ehling et al.,
2010).
1.4.1 Pathomechanism of Multiple Sclerosis
During the course of disease, demyelination of neurons and axonal loss occur in temporal and spatial
resolution in multiple areas of the brain and spinal cord (Brück and Stadelmann, 2003). This
impairment manifests in neurological symptoms. The course of disease varies between individuals
(Lucchinetti et al., 2000). Mostly patients first show relapse remitting MS with symptoms recovering
after the relapse. Later the disease changes to secondary progressive MS leading to progressive
accumulation of disability (Compston and Coles, 2008; Miller, 2012). Histologically four types of MS
can be distinguished (Hu and Lucchinetti, 2009), yet the main characteristics are inflammatory plaques
(lesions) and formation of scars in the CNS (Frohmann et al., 2006).
Previous findings indicate an autoimmune-mediated pathomechanism of MS. However, the inducing
incident is not yet illuminated. MS is discussed as a latent or persistent viral infection, as a
neurodegenerative and as an autoimmune disease (Owens et al., 2011; Trapp and Nave, 2008;
Hohlfeld and Wekerle, 2001).
1.4.2 T Lymphocytes in Multiple Sclerosis
Despite varying inflammatory infiltrates, in almost all patients T lymphocytes, B cells and
macrophages but also in lower amounts antibodies and complement deposits can be detected (Booss et
al., 1983; Prineas and Wright, 1978; Lassmann et al., 2001). It was supposed that autoreactive CD4+
T cells enter the CNS via the distorted blood brain barrier and provoke an inflammatory reaction
(Noseworthy et al., 2000). The release of cytokines may harm the oligodendrocytes. Unfortunately
patients who are treated with antibodies against CD4 did not show significant recovery even though
depletion was successful (van Oosten et al., 1997).
Recent studies stressed the prominent role of CD8+ T cells which probably harm the oligodendrocytes
and neurons through direct cytotoxicity and release of cytokines (Mars et al., 2010; Friese and Fugger,
2009). In acute and chronic lesions the amount of CD8+ T lymphocytes exceeds the number of CD4
+
T cells (Hauser et al., 1986; Babbe et al., 2000; Junker et al., 2007). Moreover mouse models studying
the pathogenic role of CD8+ T cells better reflect many aspects of MS than mouse models
concentrating on CD4+ T lymphocytes (Goverman et al., 2005; Mars et al., 2010).
1.4.3 HLA Class I-Related Genetic Predisposition for Multiple Sclerosis
Disease prevalence increases within family members of MS patients and the concordance rate in
monozygotic twins is higher than in dizygotic twins (Baranzini et al., 2010; Dyment et al. 2004).
According to the IMSGC and WTCCC2 genetic predisposition may play a key role in MS disease
susceptibility. Many analyses have been performed and in 2011 the latest results of genome-wide
association studies for MS were published. Besides many different gene loci, primarily different HLA

INTRODUCTION
9
alleles are linked to disease susceptibility (http://www.well.ox.ac.uk/wtccc2/ms). Notably a risk factor
is carrying the HLA-A*0301 allele and a protective effect correlates with carrying the HLA-A*0201
allele (Silva et al., 2009).
Honma et al. (1997) isolated an autoreactive CD8+ T lymphocyte from an MS patient carrying both,
the alleles HLA-A*0201 and HLA-A*0301. This T cell clone was named 2D1 and proven to recognize
the myelin sheath derived nine AA residues 45 to 53 of the proteolipid protein 1 (PLP) presented on
HLA-A3. Friese et al. (2008) generated double-transgenic humanized mice expressing HLA-A3 and
the TCR 2D1 as well as triple-transgenic humanized mice expressing HLA-A3, the TCR 2D1 and
HLA-A2. 4 % of the double-transgenic mice showed mild spontaneous motor deficits and 25 %
developed an MS-like disease after immunization with PLP45-53 peptide. Strikingly not a single triple-
transgenic mouse showed symptoms even after immunization. Further investigations revealed negative
selection of 2D1 T cells in the thymus which indicates cross-recognition of unknown peptide(s)
presented on HLA-A2 molecules. As HLA-A2 and HLA-A3 molecules display a very similar surface
to TCR molecules but present different peptides (Section 1.2.5, p. 6) this theory seems very likely. So
far neither the cross-recognition of HLA-A2 molecules nor any other recognized peptide than PLP45-53
could be determined.
1.5 Current Knowledge Regarding the Characterization of Molecular
Targets of Disease-Related T Lymphocytes
1.5.1 Identification of Disease-Related TCR Molecules
To better understand T cell mediated autoimmunity in MS the characterization of underlying
pathogenic and possibly also protective mechanisms is crucial. In early studies the germline TCR beta
chain repertoire was analyzed by restriction fragment length polymorphisms (Biddison et al., 1989)
and reverse transcription of RNA from frozen MS brain tissue (Wucherpfennig et al., 1992). These
methods were limited as they could not distinguish TCR sequences of disease-related T lymphocytes
from the oligoclonal background.
Disease-related T cells should meet at least one of the following three criteria: First, the T lymphocyte
carries a TCR belonging to a clonally expanded population, as T cells start to divide and proliferate
upon activation. Second, the T lymphocyte expresses activation markers. Third, the T lymphocyte lies
in direct contact with the target cell.
CDR3 spectratyping allows the identification of TCR beta chain sequences from clonally expanded
T cell populations (Pannetier et al., 1995; Matsumoto et al., 2003). The development of monoclonal
antibodies that recognize several TCR beta chains allows the staining of potentially disease-related
T lymphocytes in tissue samples. Combining those two techniques, single expanded T cell clones
around muscle fibers of patients with polymyositis were stained and isolated by laser microdissection.
Subsequently clone-specific PCRs verified the sequences of TCR beta chains. Following multiplex
PCRs revealed the sequences of corresponding TCR alpha chains (Seitz et al., 2006). This “clone-
specific approach” is employed on MS brain tissue in this study.
INTRODUCTION
10
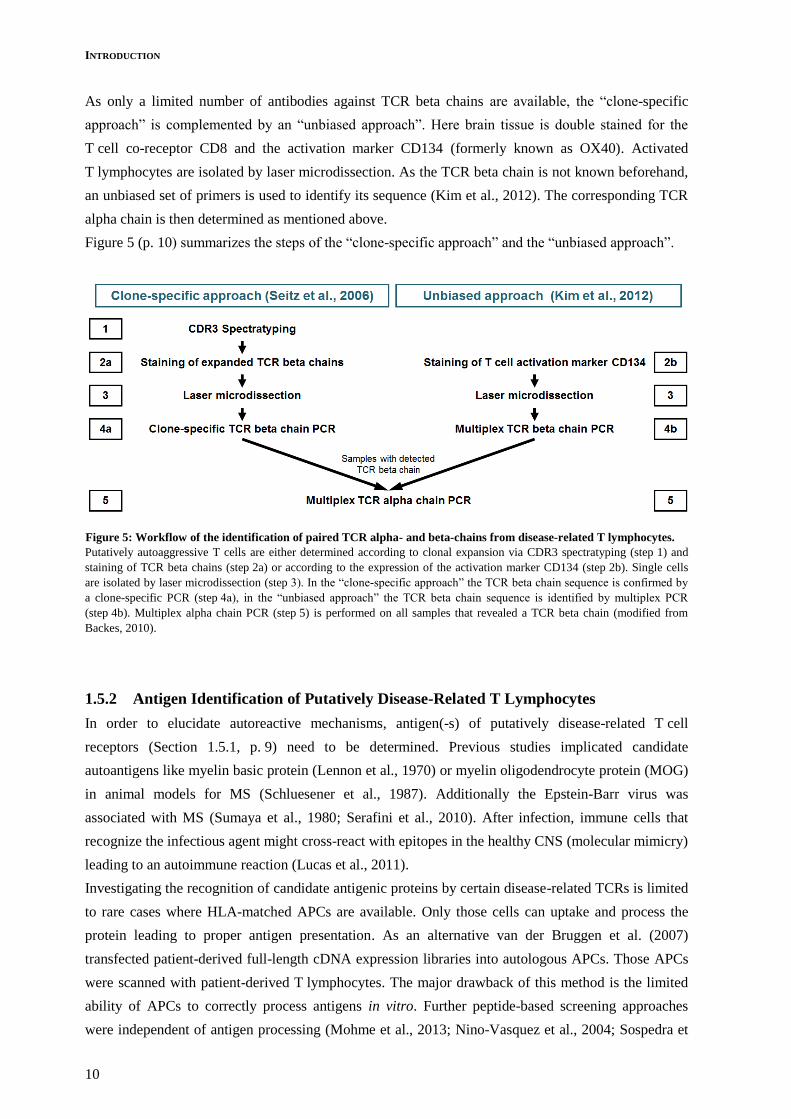
As only a limited number of antibodies against TCR beta chains are available, the “clone-specific
approach” is complemented by an “unbiased approach”. Here brain tissue is double stained for the
T cell co-receptor CD8 and the activation marker CD134 (formerly known as OX40). Activated
T lymphocytes are isolated by laser microdissection. As the TCR beta chain is not known beforehand,
an unbiased set of primers is used to identify its sequence (Kim et al., 2012). The corresponding TCR
alpha chain is then determined as mentioned above.
Figure 5 (p. 10) summarizes the steps of the “clone-specific approach” and the “unbiased approach”.
Figure 5: Workflow of the identification of paired TCR alpha- and beta-chains from disease-related T lymphocytes.
Putatively autoaggressive T cells are either determined according to clonal expansion via CDR3 spectratyping (step 1) and
staining of TCR beta chains (step 2a) or according to the expression of the activation marker CD134 (step 2b). Single cells
are isolated by laser microdissection (step 3). In the “clone-specific approach” the TCR beta chain sequence is confirmed by
a clone-specific PCR (step 4a), in the “unbiased approach” the TCR beta chain sequence is identified by multiplex PCR
(step 4b). Multiplex alpha chain PCR (step 5) is performed on all samples that revealed a TCR beta chain (modified from
Backes, 2010).
1.5.2 Antigen Identification of Putatively Disease-Related T Lymphocytes
In order to elucidate autoreactive mechanisms, antigen(-s) of putatively disease-related T cell
receptors (Section 1.5.1, p. 9) need to be determined. Previous studies implicated candidate
autoantigens like myelin basic protein (Lennon et al., 1970) or myelin oligodendrocyte protein (MOG)
in animal models for MS (Schluesener et al., 1987). Additionally the Epstein-Barr virus was
associated with MS (Sumaya et al., 1980; Serafini et al., 2010). After infection, immune cells that
recognize the infectious agent might cross-react with epitopes in the healthy CNS (molecular mimicry)
leading to an autoimmune reaction (Lucas et al., 2011).
Investigating the recognition of candidate antigenic proteins by certain disease-related TCRs is limited
to rare cases where HLA-matched APCs are available. Only those cells can uptake and process the
protein leading to proper antigen presentation. As an alternative van der Bruggen et al. (2007)
transfected patient-derived full-length cDNA expression libraries into autologous APCs. Those APCs
were scanned with patient-derived T lymphocytes. The major drawback of this method is the limited
ability of APCs to correctly process antigens in vitro. Further peptide-based screening approaches
were independent of antigen processing (Mohme et al., 2013; Nino-Vasquez et al., 2004; Sospedra et

INTRODUCTION
11
al., 2003) but not all types of peptides may reach the HLA molecules on APC. For example
hydrophobic candidates might accumulate and precipitate in aqueous cell culture media or disappear
into cell membranes.
Siewert et al. (2012) solved these obstacles by stably transfecting COS-7 cells with plasmids encoding
the patient’s HLA class I alleles. Such COS-7 cells now can serve as APCs. In a next step those cells
are transfected with plasmids coding for short peptides of random sequences but defined lengths, so
called plasmid-encoded combinatorial peptide libraries (PECP libraries). In parallel T hybridoma cells
are generated expressing the putatively disease-related TCR, human CD8 and sGFP under the control
of the NFAT promoter. During co-culture T hybridoma cells that interact with an APC presenting an
antigenic peptide are activated and fluoresce green. Now the underlying APC can be isolated under a
fluorescence microscope. After several steps the antigen-coding plasmid can be determined. Figure 6
(p. 11) gives a schematic overview over this method, for detailed experimental procedures consult
Section 2.8.4 (p. 60) and Figure 9 (p. 61).
With this novel technique one activating antigenic peptide out of a pool of millions can be detected in
vitro circumventing the problems of defined antigen-processing in APCs. Consequentially for
subsequent analysis of probable parent proteins no information regarding antigen-processing is
available.
Figure 6: Identification of antigens from putatively disease-related TCR molecules.
As APC adherent COS-7 cells are stably transfected with plasmids coding for human HLA class I molecules and transiently
transfected with PECP library-coding plasmids. As detector TCR-deficient mouse T hybridoma cells 58α-/β- are stably
transfected with plasmids coding for a human putatively disease-related TCR and human CD8 as well as a plasmid coding for
sGFP under the control of the NFAT promoter. When an APC presents a potentially autoantigen the T hybridoma cells above
get activated and fluoresce green. All plasmids inside the APC are then purified and the potentially autoantigen can be
identified by PCR and serial dilution experiments (modified from Backes, 2010).
INTRODUCTION
12
1.6 Objective
Recent data have stressed the prominent role of CD8+ T lymphocytes in the autoimmune pathomecha-
nism of MS, yet the underlying mechanisms still remains elusive. Many of these results were based on
immunohistochemistry and TCR repertoire studies. Moreover it is known for long that a genetic
linkage between the HLA gene locus and disease susceptibility exists: Carrying the HLA-A*0301
allele or the HLA-A*0201 allele correlates with a risk factor or protective effect for disease
susceptibility respectively. During this thesis therefore two main questions will be investigated:
1. Which CD8+ T lymphocytes participate in the autoimmune attack on CNS tissue and what are
their receptors for antigen recognition?
2. How does the expression of HLA-A2 lead to a decreased disease susceptibility?
To answer those questions first putatively disease-related single CD8+ T cells will be isolated from
frozen brain tissue of an MS patient by laser microdissection. Employing the clone-specific and the
unbiased PCR techniques, their TCR molecules will be analyzed. In parallel, these PCR methods will
be further optimized.
In the second part, antigen recognition of the probably disease-related TCR 2D1 will be investigated.
It was shown to recognize the myelin-derived peptide PLP45-53 presented on HLA-A3 molecules. In a
model system double-transgenic mice expressing HLA-A3 and the TCR 2D1 developed an MS-like
disease after immunization with the PLP45-53 peptide. Surprisingly, when triple-transgenic mice
expressing HLA-A3, the TCR 2D1 and HLA-A2 were created, not a single animal showed symptoms
after immunization and 2D1 T lymphocytes were already depleted in the thymus of these mice.
An obvious question therefore is, which specific antigen(s) TCR 2Dq might recognize in the context
of the protective HLA-A2 molecules. Therefore the antigen recognition properties of the TCR 2D1
will be characterized. To this end a novel technology for unbiased identification of antigenic peptides
recognized by HLA class I-restricted T lymphocytes will be used. Then peptides presented on HLA-
A2 molecules activating the TCR 2D1 will be investigated and probable parent proteins will be
identified and further characterized.

MATERIALS AND METHODS
13
2 Materials and Methods
2.1 Materials
2.1.1 Devices
Cell Disruptor Sonifier 450 Branson (Danbury, USA)
Centrifuges Avanti® J-26 XP Beckman Coulter (Krefeld, D)
Centrifuge 5417 R Eppendorf (Hamburg, D)
Heraeus® Megafuge 1.0 R Thermo Fisher Scientific (Schwerte, D)
OPTIMA XE90 Ultracentrifuge Beckman Coulter
Sprout Mini-centrifuge Biozym (Hess, Oldendorf, D)
Cryotom LEICA CM 3050 Leica Microsystems (Wetzlar, D)
Electroporator Gene Pulser Bio-Rad
Flow Cytometer FACS Calibur Becton Dickinson (Heidelberg, D)
FACSVantage SE Becton Dickinson
FACSVerse Becton Dickinson
Gel Electrophoresis Power Supply LKB ECPS 3000/150 Pharmacia Biotech (Munich, D)
Gel camera Universal Hood Bio-Rad (Munich, D)
Gel Doc XR Bio-Rad
Microscopes and Accessories Microscope Axioplan 2 Zeiss (Oberkochen, D)
Microscope Axiovert 200M Zeiss
Robo-Mover P.A.L.M. Microlaser Technologies (Bernried, D)
Microinjector CellTram Vario Eppendorf
Micromanipulator LN25 Mini Luigs und Neumann (Ratingen, D)
PCR Cyclers GeneAmp PCR System 9600 Perkin Elmer
T3 Thermocycler Biometra (Göttingen, D)
7900HT Fast Real-Time PCR System Applied Biosystems (Foster City, USA)
Spectrophotometers Nanodrop ND-1000 Thermo Fisher Scientific
UV-VISIBLE Recording Spectrophotometer Shimadzu (Duisburg, D)
VICTOR² 1420 Multilabel Counter Perkin Elmer (Wellesley, USA)
RNA Quality Analysis 2100 Bioanalyzer Agilent (Santa Clara, USA)
Water Preparation Milli Q Advantage Millipore (Schwalbach, D)
2.1.2 Consumables and Chemicals
Consumables like pipet tips, reaction tubes, cell culture material and centrifugation tubes were
purchased from Biozym, Eppendorf and Becton Dickinson. If necessary special sterile pipet tips and
reaction tubes made of polypropylene from Biozym and Eppendorf were used to minimize adsorption
of nucleic acids and proteins. Cell culture dishes were obtained from the companies BD Falcon
(Heidelberg, D), Nunc (Langenselbold, D) and Corning (Wiesbaden, D). Chemicals were generally
purchased from Merck (Darmstadt, D) or Sigma-Aldrich (St. Louis, USA).

MATERIAL AND METHODS
14
2.1.3 Kits and Specific Reagents
Table 1: Kits and specific reagents.
Product Company Application
AatII Restriction Enzyme (20,000 U/mL) New England Biolabs
(Frankfurt a. M., D)
DNA digestion
AscI Restriction Enzyme (10,000 U/mL) New England Biolabs DNA digestion
BamHI-HF Restriction Enzyme (20,000 U/mL) New England Biolabs DNA digestion
BirA500 Biotin-Protein Ligase Avidity (Aurora, USA) protein biotinylation
Cut SmartTM Buffer (10x) New England Biolabs DNA digestion
Complete Protease Inhibitors Roche (Mannheim, D) protein experiments
dNTP (10 mM each) Qiagen (Hilden, D) PCR
Dynabeads® Protein G Life Technologies (Oslo, N) coupling of antibodies
Easy Pure® DNA-Purification Kit Biozym DNA purification from agarose gels
EB Buffer Qiagen DNA experiments
EcoRI-HF Restriction Enzyme (20.000 U/mL) New England Biolabs DNA digestion
FuGENE® HD Transfection Reagent Promega (Madison, USA) plasmid transfection in eukaryotic
cells
Full Range RainbowTM Recombinant Protein Molecular Weight Marker
Sigma-Aldrich SDS-PAGE
Glycogen (20 mg/mL) Roche precipitation of nucleic acids
HiSpeed Plasmid Maxi Kit Qiagen library preparation
iProofTM High-Fidelity Master Mix (2x) Bio-Rad plasmid recovery PCR
MiniElute Gel Extraction Kit Qiagen DNA purification from agarose gels
NEB BSA (100x) New England Biolabs DNA digestion
NEB Buffer 4 (10x) New England Biolabs DNA digestion
NotI-HF Restriction Enzyme (20,000 U/mL) New England Biolabs DNA digestion
One-Step-RT-PCR-Kit Qiagen single cell PCR
pcDNA3.1TMDirectional TOPO® Expression Kit Invitrogen (Karlsruhe, D) cloning of PCR products
PCR Buffer (10x) Roche PCR
Pellet Paint® Coprecipitant Novagen EMD Chemicals,
San Diego (USA)
DNA precipitation
Pierce® BCA Protein Assay Kit Thermo Scientific (Rockford,
USA)
determination of protein
concentration
Protector RNase Inhibitor Roche single cell isolation
QIAprep Spin Miniprep Kit Qiagen plasmid isolation
QIAquick® Gel Extraction Kit Qiagen DNA purification from agarose gels
QIAquick® PCR-Purification Kit Qiagen purification of PCR-products
Random Primers Invitrogen RT-PCR
Rapid DNA Dephos & Ligation Kit Roche DNA Dephosphorylation
RNA 6000 Pico Assay Reagent Kit Agilent quality analysis of RNA
RNase OUTTM Ribonuclease Inhibitor Invitrogen PCR
SalI-HF Restriction Enzyme (20,000 U/mL) New England Biolabs DNA digestion
See Blue® Plus 2 Prestained Standard Life Technologies SDS-PAGE
Sodium Acetate pH 5.2 (3 M) Novagen DNA precipitation
SuperScript® III Reverse Transcriptase Kit Invitrogen RT-PCR

MATERIALS AND METHODS
15
Product Company Application
T4 Ligase (1 U/µL) Invitrogen DNA ligation
T4 Ligase Buffer (5x) Invitrogen DNA ligation
Taq-DNA-Polymerase (5 U/µL) Roche PCR
TaqMan® Gene Expression Master Mix Applied Biosystems qPCR
ToPro®-3 Iodide 642/661 (1 mM) Invitrogen FACS analysis
Wide Range Sigma MarkerTM Sigma-Aldrich SDS-PAGE
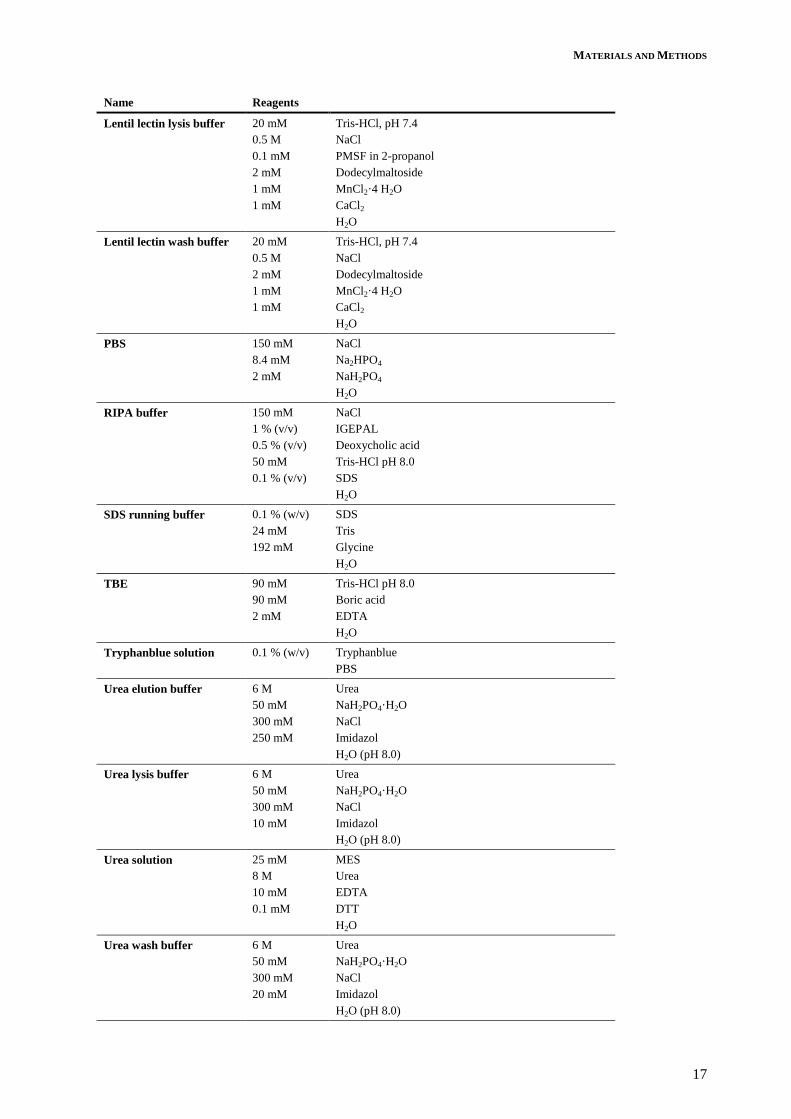
2.1.4 Buffers, Solutions and Media
Table 2: Buffers and solutions.
Name Reagents
3x reducing SDS loading
buffer
0,15 M
15 % (w/v)
45 % (v/v)
6 % (v/v)
0.01 % (w/v)
Tris-HCl pH 6,8
Sodium dodecyl sulfate (SDS)
Glycerine
β mercaptoethanol
Bromphenol blue
H2O
5x SDS loading buffer 0.2 M
7.5 % (w/v)
20 % (v/v)
0.02 % (w/v)
Tris-HCl pH 6.8
SDS
Glycerine
Bromphenol blue
H2O
6x DNA loading buffer 50 % (v/v)
0.02 % (m/v)
0.02 % (m/v)
10 mM
Glycerine
Bromphenol blue
Xylenblue
Tris-HCl, pH 7.5
H2O
Anode buffer 50 mM
20 % (v/v)
Boric acid
Methanol
H2O (pH 9.0)
Biotinylation buffer 100 mM
200 mM
5 mM
0.2 mM
Tris-HCL, pH 7.5
NaCl
MgCl2
Phenylmethanesulfonyl fluoride (PMSF) in 2-propanol
H2O
Cathode buffer 50 mM
5 % (v/v)
Boric acid
Methanol
H2O (pH 9.0)
ConA 4B binding buffer 1 % (v/v)
20 mM
0.5 M
1 mM
1 mM
IGEPAL
Tris-HCl, pH 7.4
NaCl
MnCl2·4 H2O
CaCl2
H2O
ConA 4B elution buffer 1 % (v/v)
20 mM
0.5 M
0.3 M
IGEPAL
Tris-HCl, pH 7.4
NaCl
Methyl-α-D-mannopyranoside
H2O

MATERIAL AND METHODS
16
Name Reagents
ConA 4B lysis buffer 1 % (v/v)
0.1 mM
IGEPAL
PMSF in 2-propanol
PBS
Coomassie® staining
solution
0.1 % (w/v)
40 % (v/v)
10 % (v/v)
Coomassie® Brilliant-Blue R-250
Methanol
Acidic acid
H2O
DEPC treated water Dissolve 0.1 % diethylpyrocarbonate (DEPC) in H2O, incubate at room
temperature over night, autoclave.
Destaining solution 40 % (v/v)
10 % (v/v)
Methanol
Acidic acid
H2O
Dynabead conjugation
buffer
20 mM
0.15 M
NaH2PO4
NaCl
H2O (pH 8.6)
ECL-A 0.25 % (w/v)
1 M
Luminol
Tris-HCL, pH 8.6
H2O
ECL-B 0.11 % (w/v) Para-hydroxycoumaric acid
Dimethyl sulfoxide (DMSO)
Folding buffer 100 mM
0.4 M
2 mM
Tris-HCl (pH 8.0)
L-arginine
EDTA
H2O
IB detergent buffer 0.2 M
1 % (w/v)
1 %(v7v)
20 mM
2 mM
NaCl
Sodium deoxycholate
IGEPAL
Tris-HCl, pH 7.5
EDTA
H2O
IB lysis buffer 50 mM
25 % (w/v)
1 mM
Tris-HCl, pH 8.0
Sucrose
EDTA
H2O
IB wash buffer 0.5 % (v/v)
1 mM
Triton X-100
EDTA
H2O
Injection buffer 3 mM
10 mM
10 mM
Guanidine HCl
Sodium acetate
EDTA
H2O (pH 4.2)
Lentil lectin elution
buffer
2 mM
20 mM
0.5 M
0.3 M
Dodecylmaltoside
Tris-HCl, pH 7.4
NaCl
Methyl-α-D-mannopyranisode
H2O
Lentil lectin equilibration
buffer
20 mM
0.5 M
0.1 mM
1 mM
1 mM
Tris-HCl, pH 7.4
NaCl
PMSF in 2-propanol
MnCl2·4 H2O
CaCl2
H2O
MATERIALS AND METHODS
17
Name Reagents
Lentil lectin lysis buffer 20 mM
0.5 M
0.1 mM
2 mM
1 mM
1 mM
Tris-HCl, pH 7.4
NaCl
PMSF in 2-propanol
Dodecylmaltoside
MnCl2·4 H2O
CaCl2
H2O
Lentil lectin wash buffer 20 mM
0.5 M
2 mM
1 mM
1 mM
Tris-HCl, pH 7.4
NaCl
Dodecylmaltoside
MnCl2·4 H2O
CaCl2
H2O
PBS 150 mM
8.4 mM
2 mM
NaCl
Na2HPO4
NaH2PO4
H2O
RIPA buffer 150 mM
1 % (v/v)
0.5 % (v/v)
50 mM
0.1 % (v/v)
NaCl
IGEPAL
Deoxycholic acid
Tris-HCl pH 8.0
SDS
H2O
SDS running buffer 0.1 % (w/v)
24 mM
192 mM
SDS
Tris
Glycine
H2O
TBE 90 mM
90 mM
2 mM
Tris-HCl pH 8.0
Boric acid
EDTA
H2O
Tryphanblue solution 0.1 % (w/v) Tryphanblue
PBS
Urea elution buffer 6 M
50 mM
300 mM
250 mM
Urea
NaH2PO4·H2O
NaCl
Imidazol
H2O (pH 8.0)
Urea lysis buffer 6 M
50 mM
300 mM
10 mM
Urea
NaH2PO4·H2O
NaCl
Imidazol
H2O (pH 8.0)
Urea solution 25 mM
8 M
10 mM
0.1 mM
MES
Urea
EDTA
DTT
H2O
Urea wash buffer 6 M
50 mM
300 mM
20 mM
Urea
NaH2PO4·H2O
NaCl
Imidazol
H2O (pH 8.0)

MATERIAL AND METHODS
18
Name Reagents
Western Blot blocking
buffer
0.05 % (v/v)
5 % (w/v)
Tween-20
Blotting Grade Blocker Non-Fat Dry Milk (Bio-Rad)
PBS
Table 3: Media for pro- and eukaryotic cell culture.
Name Reagents Company
FACS buffer 1 % (v/v) Fetal calf serum (FCS)
PBS
Invitrogen
Freezing medium 10 % (v/v) DMSO
FCS
Invitrogen
Luria Bertani medium
(with ampicillin: LBamp)
0.1 % (w/v)
0.05 % (w/v)
0.1 % (w/v)
(100 µg/mL
Bacto-Trypton
Yeast extract
NaCl
Ampicillin)
H2O
Becton Dickinson
Becton Dickinson
RPMI/complete 10 % (v/v)
100 U/mL
100 µg/mL
1x
1 mM
FCS
Penicillin
Streptomycin
MEM non-essential amino acids
MEM sodium pyruvate
RPMI 1640 + L-Glutamine
Biochrom AG (Berlin, D)
Invitrogen
Invitrogen
Invitrogen
Invitrogen
Invitrogen
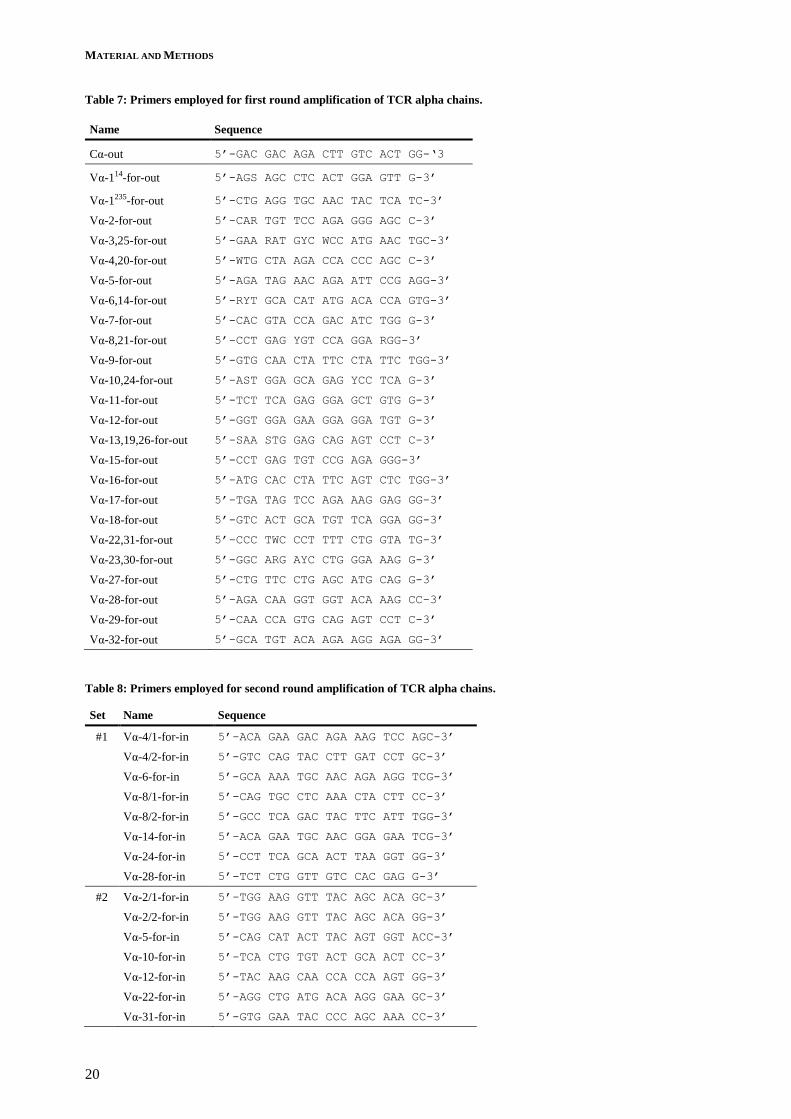
2.1.5 Primers
All primers were purchased in a concentration of 100 pmol/µL and HPLC purified from Metabion
(Martinsried, D). Primers designated with “for”(ward) elongate the coding strand and primers
designated with “rev”(erse) elongate the non-coding strand of DNA. The appendages “out” or “in”
refer to the position of primers in nested PCRs.
Table 4: Primers employed for RT-PCR of laser-captured single cells.
Name Sequence
Cα-out 5’-GCA GAC AGA CTT GTC ACT GG-3’
Cα-RT-imp 5’-GCC ACA GCA CTG TTG C-3’
Cβ-out 5’-TGG TCG GGG WAG AAG CCT GTG-3’
Cβ-RT-2 5’-GWA GAA GCC TGT GGC C-3’
Table 5: Primers employed for clone specific amplification of BV13S1+BJ2.3+ and BV22+BJ2.1+ TCR sequences.
Name Sequence
Cβ-mid1 5’-GTG GCC TTT TGG GTG TGG-3’
Cβ-mid2 5’-GGT GTG GGA GAT CTC TGC-3’
Cβ-in 5’-TCT GAT GGC TCA AAC ACA GC-3’
BV13S1-BJ2.3_for1 5’-AGG CTG ATT CAT TAC TCA GTT GG-3’
BV13S1-BJ2.3_rev1 5’-CGA GCA CTG TCA GCC GGG TGC-3’
BV13S1-BJ2.3_for2 5’-GTG CTG GTA TCA CTG ACC AAG G-3’
BV13S1-BJ2.3_rev2 5’-GTG CCT GGG CCA AAA TAC TGC-3’
BV13S1-BJ2.3_for3 5’-GTC TCC AGA TCA ACC ACA GAG G-3’
BV13S1-BJ2.3_rev3 5’-CCA AAA TAC TGC GTA TCT GCT CC-3’

MATERIALS AND METHODS
19
Name Sequence
BV13S1-BJ2.3_for1-new 5’-CTG ATT CAT TAC TCA GTT GG-3’
BV13S1-BJ2.3_rev1-new 5’-CAC TGT CAG CCG GGT GC-3’
BV13S1-BJ2.3_for2-new 5’-CTG GTA TCA CTG ACC AAG G-3’
BV13S1-BJ2.3_rev2-new 5’-CCT GGG CCA AAA TAC TGC-3’
BV13S1-BJ2.3_for3-new 5’-ATC AAC CAC AGA GGA TTT CC-3’
BV13S1-BJ2.3_rev3-new 5’-AAT ACT GCG TAT CTG CTC C-3’
BV13S1-for1 5’-TCC TGG TAT CGA CAA GAC C-3’
BV13S1-for2 5’-GAT TCA TTA CTC AGT TGG TGC-3’
BV13S1-for3 5’-ACT GAC CAA GGA GAA GTC C-3’
FE13S1-2.3-rev3 5’-AAA TAC TGC GTA TCT GCT CC-3’
BV22-BJ2.1_for1 5’-CTA TTG GTA CAG ACA AAT CTT GG-3’
BV22-BJ2.1_rev1 5’-CTA GCA CGG TGA GCC GTG TCC-3’
BV22-BJ2.1_for2 5’-AGA AGT CTG AAA TAT TCG ATG ATC-3’
BV22-BJ2.1_rev2 5’-AGC CGT GTC CCT GGC CCG AAG-3’
BV22-BJ2.1_for3 5’-GAT GAT CAA TTC TCA GTT GAA AGG-3’
BV22-BJ2.1_rev3 5’-AAG AAC TGC TCA TTG TGT TCT CC-3’
BV22-BJ2.1_for1-new 5’-TTG GTA CAG ACA AAT CTT GG-3’
BV22-BJ2.1_rev1-new 5’-CAC GGT GAG CCG TGT CC-3’
BV22-BJ2.1_for2-new 5’-CAG AGA AGT CTG AAA TAT TCG-3’
BV22-BJ2.1_rev2-new 5’-CTG GCC CGA AGA ACT GC-3’
BV22-BJ2.1_for3-new 5’-GAT CAA TTC TCA GTT GAA AGG-3’
BV22-BJ2.1_rev3-new 5’-ACT GCT CAT TGT GTT CTC C-3’
Table 6: Primers employed for unbiased amplification of TCR sequences.
Name Sequence
Cβ-in 5’-TCT GAT GGC TCA AAC ACA GC-3’
UP 5’-ACA GCA CGA CTT CCA AGA CTC A-3’
UP-new 5’-AGC ACG ACT TCC AAG ACT CA-3’
VP1 5’-TSY TTT GTC TCC TGG GAG CA-3’
VP2 5’-CCT GAA GTC GCC CAG ACT CC-3’
VP3 5’-GTC ATS CAG AAC CCA AGA YAC C-3’
VP4 5’-GGW TAT CTG TMA GMG TGG AAC CTC-3’
VP5 5’-ATG TAC TGG TAT CGA CAA GAY C-3’
VP6 5’-CAC TGT GGA AGG AAC ATC AAA CC-3’
VP7 5’-TCT CCA CTC TSA AGA TCC AGC-3’
VP8 5’-CAG RAT GTA RAT YTC AGG TGT GAT CC-3’
VP9 5’-CCA GAC WCC AAR AYA CCT GGT CA-3’
VP1+ 5’-ACA GCA CGA CTT CCA AGA CTC ACY TTT GTC TCC TGG GAG CA-3’
VP2+ 5’-ACA GCA CGA CTT CCA AGA CTC ACC TGA TGT CGC CCA GAC TCC-3’
VP3+ 5’-ACA GCA CGA CTT CCA AGA CTC AGT CAT SCA GAA CCC AAG AYA CC-3’
VP4+ 5’-ACA GCA CGA CTT CCA AGA CTC AGG WTA TCT GTM AGM GTG GAA CCT C-3’
VP5+ 5’-ACA GCA CGA CTT CCA AGA CTC AAT GTA CTG GTA TCG ACA AGA YC-3’
VP6+ 5’-ACA GCA CGA CTT CCA AGA CTC ACA CTG TGG AAG GAA CAT CAA ACC-3’
VP7+ 5’-ACA GCA CGA CTT CCA AGA CTC ATC TCC ACT CTS AAG ATC CAG C-3’
VP8+ 5’-ACA GCA CGA CTT CCA AGA CTC ACA GRA TGT ARA TYT CAG GTG TGA TCC-3’
VP9+ 5’-ACA GCA CGA CTT CCA AGA CTC ATC AGA CWC CAA RAY ACC TGG TCA-3’
MATERIAL AND METHODS
20
Table 7: Primers employed for first round amplification of TCR alpha chains.
Name Sequence
Cα-out 5’-GAC GAC AGA CTT GTC ACT GG-‘3
Vα-114-for-out 5’-AGS AGC CTC ACT GGA GTT G-3’
Vα-1235-for-out 5’-CTG AGG TGC AAC TAC TCA TC-3’
Vα-2-for-out 5’-CAR TGT TCC AGA GGG AGC C-3’
Vα-3,25-for-out 5’-GAA RAT GYC WCC ATG AAC TGC-3’
Vα-4,20-for-out 5’-WTG CTA AGA CCA CCC AGC C-3’
Vα-5-for-out 5’-AGA TAG AAC AGA ATT CCG AGG-3’
Vα-6,14-for-out 5’-RYT GCA CAT ATG ACA CCA GTG-3’
Vα-7-for-out 5’-CAC GTA CCA GAC ATC TGG G-3’
Vα-8,21-for-out 5’-CCT GAG YGT CCA GGA RGG-3’
Vα-9-for-out 5’-GTG CAA CTA TTC CTA TTC TGG-3’
Vα-10,24-for-out 5’-AST GGA GCA GAG YCC TCA G-3’
Vα-11-for-out 5’-TCT TCA GAG GGA GCT GTG G-3’
Vα-12-for-out 5’-GGT GGA GAA GGA GGA TGT G-3’
Vα-13,19,26-for-out 5’-SAA STG GAG CAG AGT CCT C-3’
Vα-15-for-out 5’-CCT GAG TGT CCG AGA GGG-3’
Vα-16-for-out 5’-ATG CAC CTA TTC AGT CTC TGG-3’
Vα-17-for-out 5’-TGA TAG TCC AGA AAG GAG GG-3’
Vα-18-for-out 5’-GTC ACT GCA TGT TCA GGA GG-3’
Vα-22,31-for-out 5’-CCC TWC CCT TTT CTG GTA TG-3’
Vα-23,30-for-out 5’-GGC ARG AYC CTG GGA AAG G-3’
Vα-27-for-out 5’-CTG TTC CTG AGC ATG CAG G-3’
Vα-28-for-out 5’-AGA CAA GGT GGT ACA AAG CC-3’
Vα-29-for-out 5’-CAA CCA GTG CAG AGT CCT C-3’
Vα-32-for-out 5’-GCA TGT ACA AGA AGG AGA GG-3’
Table 8: Primers employed for second round amplification of TCR alpha chains.
Set Name Sequence
#1 Vα-4/1-for-in 5’-ACA GAA GAC AGA AAG TCC AGC-3’
Vα-4/2-for-in 5’-GTC CAG TAC CTT GAT CCT GC-3’
Vα-6-for-in 5’-GCA AAA TGC AAC AGA AGG TCG-3’
Vα-8/1-for-in 5’-CAG TGC CTC AAA CTA CTT CC-3’
Vα-8/2-for-in 5’-GCC TCA GAC TAC TTC ATT TGG-3’
Vα-14-for-in 5’-ACA GAA TGC AAC GGA GAA TCG-3’
Vα-24-for-in 5’-CCT TCA GCA ACT TAA GGT GG-3’
Vα-28-for-in 5’-TCT CTG GTT GTC CAC GAG G-3’
#2 Vα-2/1-for-in 5’-TGG AAG GTT TAC AGC ACA GC-3’
Vα-2/2-for-in 5’-TGG AAG GTT TAC AGC ACA GG-3’
Vα-5-for-in 5’-CAG CAT ACT TAC AGT GGT ACC-3’
Vα-10-for-in 5’-TCA CTG TGT ACT GCA ACT CC-3’
Vα-12-for-in 5’-TAC AAG CAA CCA CCA AGT GG-3’
Vα-22-for-in 5’-AGG CTG ATG ACA AGG GAA GC-3’
Vα-31-for-in 5’-GTG GAA TAC CCC AGC AAA CC-3’

MATERIALS AND METHODS
21
Set Name Sequence
#3 Vα-7-for-in 5’-CTC CAG ATG AAA GAC TCT GC-3’
Vα-13-for-in 5’-TTA AGC GCC ACG ACT GTC G-3’
Vα-17-for-in 5’-CTG TGC TTA TGA GAA CAC TGC-3’
Vα-18-for-in 5’-CC TTA CAC TGG TAC AGA TGG-3’
Vα-21-for-in 5’-TGC TGA AGG TCC TAC ATT CC-3’
Vα-23-for-in 5’-GTG GAA GAC TTA ATG CCT CG-3’
Vα-32-for-in 5’-TCA CCA CGT ACT GCA ATT CC-3’
#4 Vα-3-for-in 5’-TTC AGG TAG AGG CCT TGT CC-3’
Vα-11-for-in 5’-AGG GAC GAT ACA ACA TGA CC-3’
Vα-15-for-in 5’-CCT CCA CCT ACT TAT ACT GG-3’
Vα-19-for-in 5’-CCT GCA CAT CAC AGC CTC C-3’
Vα-25-for-in 5’-AGA CTG ACT GCT CAG TTT GG-3’
Vα-26-for-in 5’-CCT GCA TAT CAC AGC CTC C-3’
Vα-29-for-in 5’-ACT GCA GTT CCT CCA AGG C-3’
#5 Vα-1235-for-in 5’-AAG GCA TCA ACG GTT TTG AGG-3’
Vα-114-for-in 5’-CTG AGG AAA CCC TCT GTG C-3’
Vα-9-for-in 5’-ATC TTT CCA CCT GAA GAA ACC-3’
Vα-16-for-in 5’-TCC TTC CAC CTG AAG AAA CC-3’
Vα-20-for-in 5’-ACG TGG TAC CAA CAG TTT CC-3’
Vα-27-for-in 5’-ACT TCA GAC AGA CTG TAT TGG-3’
Vα-30-for-in 5’-CTC TTC ACC CTG TAT TCA GC-3’
Cα-rev-in 5’-AGT CTC TCA GCT GGT ACA CG-3’
Table 9: Primers employed for the generation of plasmid-encoded combinatorial peptide libraries.
Name Sequence
Lib-rev-new 5’-TAG TTT AGC GGC CGC TCA-3’
Lib-rev 5’-ATA GTT TAG CGG CCG CTC A-3’
N24-Lib-for 5‘-CAG GGA AGG CGC GCC ACC ATG NNK NNK NNK NNK NNK NNK NNK NNK TGA GCG
GCC GCT AAA CTA T-3’
8L-Lib-for 5’-CAG GGA AGG CGC GCC ACC ATG NNK NNK NNK NNK NNK NNK NNK CTG TGA GCG
GCC GCT AAA CTA T-3’
N30-Lib-for 5‘-CAG GGA AGG CGC GCC ACC ATG NNK NNK NNK NNK NNK NNK NNK NNK NNK NNK
TGA GCG GCC GCT AAA CTA T-3’
10L-Lib-for 5’-CAG GGA AGG CGC GCC ACC ATG NNK NNK NNK NNK NNK NNK NNK NNK NNK CTN
TGA GCG GCC GCT AAA CTA T-3’
N39-Lib-for 5‘-CAG GGA AGG CGC GCC ACC ATG NNK NNK NNK NNK NNK NNK NNK NNK NNK NNK
NNK NNK NNK TGA GCG GCC GCT AAA CTA T-3’
Table 10: Primers employed for the recovery of antigen-coding plasmids.
Name Sequence
pcDNA-for-1 5’-CAC TGC TTA CTG GCT TAT CG-3’
pcDNA-2nd-for-TOPO 5’-CAC TCC GGC GCG CCA CCA TG-3’
pcDNA-rev-1 5’-ACT AGA AGG CAC AGT CGA GG-3’
pcDNA-rev-3 5’-TGG TGA TGG TGA TGATGA CC-3’

MATERIAL AND METHODS
22
Table 11: Primers employed for the generation of truncated protein coding plasmids.
Name Sequence
Prot-V5-rev 5’-ATC ATG TCG ACC TAC GTA GAA TCG AGA CCG A-3’
DMXL2-out-for 5’-TGG AGG AGT GTC AGA ATT GG-3’
DMXL2-out-rev 5’-CAG ACT GTC AGA TGA GAT GC-3’
exp-DMXL2-for 5’-GAG CAG AAT TCC ACC ATG AAC TCT TTA CAT ACC TCA GCC-3’
DMXL2-V5-rev 5’-TGA GCG GCC GCC TAC GTA GAA TCG AGA CCG AGG AGA GGG TTA GGG ATA
GGC TTA CCT GCA GCT TTG GCT AAG CAC G-3’
Prot-Dmxl2-for 5’-CTA TTG GAT CCA ACT CTT TAC ATA CCT CAG CC-3’
EML5-out-for 5’-TGT GTG CAT CTG GAG AGA TG-3’
EML5-out-rev 5’-CTT TTT CAG TTT CCG GAC TGC-3’
exp-EML5-for 5’-GAG CAG AAT TCC ACC ATG AAA ACA GTT AAA GCC CAT GAT G-3’
EML5-V5-rev 5’-TGA GCG GCC GCC TAC GTA GAA TCG AGA CCG AGG AGA GGG TTA GGG ATA
GGC TTA CCT TTC CGG ACT GCC AAC ATA C-3’
Prot-Eml5-for 5’-CTA TTG GAT CCA AAA CAG TTA AAG CCC ATG ATG-3’
GPCPD1-for 5’-CAG AAT GAC ACC TTC TCA GG-3’
GPCPD1-out-rev 5’-AGT GTT TCA ACA CCA TTG TGG-3’
exp-GPCPD1-for 5’-GAG CAG AAT TCC ACC ATG ACA CCT TCT CAG GTC AC-3’
GPCPD1-V5-rev 5’-TGA GCG GCC GCC TAC GTA GAA TCG AGA CCG AGG AGA GGG TTA GGG ATA
GGC TTA CCA CCA TTG TGG ATG CCA AAC TG-3’
Prot-Gpcpd1-for 5’-CTA TTG GAT CCA TGA CAC CTT CTC AGG TCA C-3’
Prot-Ncan-for 5’-CTA TTG GAT CCG TGA CAG GCG TCG TGT TCC-3’
Table 12: Primers and probes employed for qPCR.
Primers were designed to span introns and mimotopes, probes were labeled with 5’ 6-FAM and 3’ Tamra.
Name Sequence
ALOX12B-for 5’-CAA CAT GAT GCC CAT CGC C-3’
ALOX12B-rev 5’-GCA GGT TCC TCA GGA GGG-3’
ALOX12B-probe 5’-GAG TGG GAC TGG CTG TTG GCT AAA-3’
AP5S1-for 5’-TGC TGA CAC CAG TTT GTC C-3’
AP5S1-rev 5’-AGG CAG ATG CCA CAC TTC C-3’
AP5S1-probe 5’-CAG ACA AAG AGC GAG GGT AAA GGT T-3’
DMXL2-for 5’-ATT AGA TGA ACT GTC AGA CCC-3’
DMXL2-rev 5’-CAG TAG CTG TGT ATT TGA TCC-3’
DMXL2-probe 5’-AGA AGT GTT TAA CAT TGT GAG CCA ACA-3’
EML5-for 5’-AAT CAC TCT TCT GGT CCA GG-3‘
EML5-rev 5’-TGC CAA CAT ACA ATG ACT AGG-3‘
EML5-probe 5’-GTT TGG CCA CAC ATC CTT ACC TGC-3‘
EML6-for 5‘-TAA GAG TGG CCC GAT GAC C-3‘
EML6-rev 5‘-TAA GTT TCC GTA CAG CCA GC-3‘
EML6-probe 5‘-AGT GAT GAC AAA ACA CTT CGG ATC TG-3‘
GAPDH-for 5‘-TCA CCA CCA TGG AGA AGG C-3‘
GAPDH-rev 5‘-ATG CCC CCA TGT TTG TGA TGG GTG T-3‘
GAPDH-probe 5‘-GCT AAG CAG TTG GTG GTG CA-3‘
GPCPD1-for 5‘-CAG AAT GAC ACC TTC TCA GG-3‘
GPCPD1-rev 5‘-AGA GCC ACA GCA TTT TGA GG-3‘
GPCPD1-probe 5‘-CTT TGC AAT ATG TGG AAG CTG TGA TG-3‘

MATERIALS AND METHODS
23
Name Sequence
KLHL28-for 5‘-CTC TCG GAG TGG CAG TGC-3‘
KLHL28-rev 5‘-ACT CGG ATC GTA ACG CTC C-3‘
KLHL28-probe 5‘-GAA TGC TAT ACG CCA TTG GAG GCT A-3‘
MDH1b-for 5‘-ACC ATG AAA GAT CTC ATC AGC-3‘
MDH1b-rev 5‘-CTG ATC TCT GTG TGC ATC CC-3‘
MDH1b-probe 5‘-TAC TTA CGT GTG CTG CCA CTT AAT TC-3‘
NCAN-for 5‘-ACG ATG TCT ACT GCT TTG CC-3‘
NCAN-rev 5‘-ACC GAG GCC AGC GCT GC-3‘
NCAN-probe 5‘-AAG TCT TTT ACG TGG GCC CGG CC-3‘
2.1.6 Plasmids
Table 13: Plasmid constructs.
Plasmid Size Resistance
Genes
Application Reference
pcDNA6-NFAT-sGFP 7.4 kb ampR, blsR Stably transfected into B7
and 2D1 T hybridoma cells,
activation marker for T hybridoma cells
D. Hackl, M. Ackmann,
Katherina Siewert, Klaus Dornmair
pHSE3’-neo-B8 8.7 kb ampR, neoR Backbone plasmid for
pHSE3’-HLA-A3
Klaus Dornmair, Katherina
Siewert
pHSE3’-HLA-A2 9.2 kb ampR, neoR Expression of human HLA-
A*0201 in COS-7 cells
Klaus Dornmair, Wakiro
Sato
pHSE3’-HLA-A3‡ 9.2 kb ampR, neoR Expression of human HLA-
A*0301 in COS-7 cells
Section 2.5.7 (p. 41)
pRSVneo-HLA-A2 6.2 kb ampR, neoR Expression of human HLA-
A*0201 in COS-7 cells
Katherina Siewert
pRSVneo-HLA-A3 6.2 kb ampR, neoR Expression of human HLA-
A*0301 in COS-7 cells
Klaus Dornmair, Geraldine
Rühl
pcDNA6/V5-HisA 5.1 kb ampR, blsR Backbone plasmid for
truncated protein expression
Invitrogen, Supplements
5.7.1 (p. 120)
pcDNA6-DMXL2748-926-V5‡ 5.6 kb ampR, blsR Expression of mouse
DMXL2748-926 with V5 tag
in COS-7 cells
Section 2.3.3 (p. 33), Supplements 5.7.1 (p. 120)
pcDNA6-EML5897-1038-V5‡ 5.5 kb ampR, blsR Expression of mouse
EML5897-1038 with V5 tag in COS-7 cells
Section 2.3.3 (p. 33),
Supplements 5.7.1 (p. 120)
pcDNA6-GPCPD11-118-V5‡ 5.2 kb ampR, blsR Expression of mouse
GPCPD11-118 with V5 tag in COS-7 cells
Section 2.3.3 (p. 33),
Supplements 5.7.1 (p. 120)
pcDNA6-NCAN156-359-V5‡ 5.7 kb ampR, blsR Expression of mouse
NCAN156-359 with V5 tag in COS-7 cells
Section 2.3.3 (p. 33),
Supplements 5.7.1 (p. 120)
pQE-30 3.4 kb ampR Backbone plasmid for
truncated protein production
Jessica Bruder, Qiagen,
Supplements 5.7.2 (p. 122)
pQE-30-His6-DMXL2748-926-
V5‡
3.9 kb ampR Production of mouse
DMXL2748-926 with His6 and V5 tag in E. coli
Section 2.3.4 (p. 35),
Supplements 5.7.2 (p. 122)
pQE-30-His6-EML5897-1038-
V5‡
3.8 kb ampR Production of mouse
EML5897-1038 with His6 and V5 tag in E. coli
Section 2.3.4 (p. 35),
Supplements 5.7.2 (p. 122)
pQE-30-His6-GPCPD11-118-
V5‡
3.5 kb ampR Production of mouse
GPCPD11-118 with His6 and V5 tag in E. coli
Section 2.3.4 (p. 35),
Supplements 5.7.2 (p. 122)

MATERIAL AND METHODS
24
Plasmid Size Resistance
Genes
Application Reference
pQE-30-His6-NCAN156-359-
V5‡
4.0 kb ampR Production of mouse
NCAN156-359 with His6 and V5 tag in E. coli
Section 2.3.4 (p. 35),
Supplements 5.7.2 (p. 122)
pcDNArc-spacer 7.6 kb ampR, blsR Backbone plasmid for
PECP libraries and peptide-
coding plasmids
Katherina Siewert,
Geraldine Rühl
N24‡ 5.1 kb ampR, blsR PECP library, coding for
random eightmer peptides
Section 2.3.1 (p. 30)
8L‡ 5.1 kb ampR, blsR PECP library, coding for
eightmer peptides with leucine at position 8
Section 2.3.1 (p. 30)
N27 5.1 kb ampR, blsR PECP library, coding for
random nonamer peptides
Katherina Siewert
9L 5.1 kb ampR, blsR PECP library coding for
nonamer peptides with leucine at position 9
Katherina Siewert
N30‡ 5.1 kb ampR, blsR PECP library, coding for
random decamer peptides
Section 2.3.1 (p. 30)
10L‡ 5.1 kb ampR, blsR PECP library, coding for
decamer peptides with leucine at position 10
Section 2.3.1 (p. 30)
N39‡ 5.1 kb ampR, blsR PECP library, coding for
random tridecamers peptides
Section 2.3.1 (p. 30)
A2269 5.1 kb ampR, blsR PECP library, coding for
nonamer peptides with I, V
and L at the positions 2, 6
and 9, respectively
Katherina Siewert
pcDNA™3.1D/V5-His-
TOPO®
5.5 kb ampR, neoR Recloning of peptides
coded on PECP libraries for mimotope search
Invitrogen, Supplements
5.7.3 (p. 124)
13AAG64P_Ncan-V5_pMA-
RQ
3.0 kb ampR Cloning of NCAN156-359-V5 Invitrogen, Supplements
5.7.4 (p. 125) ‡ The plasmid was constructed during this thesis.
2.1.7 Peptides
Peptides listed in Table 14 (p. 24) were synthesized by Thermo Fisher Scientific and purified by
preparative HPLC to a final purity of >70% unless stated differently. Their sequences were verified by
mass spectrometry. The peptides TAX11-19 and PLP45-53 were kindly provided by Prof. Dr. Lars Fugger,
John Radcliffe Hospital (Oxford, GB). All peptides were delivered lyophilized and then dissolved in
DMSO to a final concentration of 10 mg/mL.
Table 14: Peptides employed in TCR 2D1 and B7 antigen search experiments.
Name Sequence Parent Protein Source Organism Reference
PLP45-53 KLIETYFSK Proteolipid protein 1 (PLP) Homo sapiens CAM26805.1
- YLIETYFRL Hypothetical protein Haemophilus influenzae YP_005829445.1
- KLIEKYFSK Transcriptional regulator Bacillus cereus ZP_04220391.1
- KLIEPYFSK Protein MurG2 Clostridium kluyveri YP_001397075.1
- KLIGTYFSK Oligoketide cyclase/lipid transport protein
Rickettsia slovaca YP_005065446.1

MATERIALS AND METHODS
25
Name Sequence Parent Protein Source Organism Reference
- KLIDTYFTK Oligoketide cyclase/lipid
transport protein
Rickettsia philipii YP_005300289.1
- KLIDTYFSN Borrelia ORF-A superfamily
protein
Borrelia burgdorferi YP_002455216.1
- KLIQTYLSK Cell wall surface anchor family protein
Staphylococcus epidermidis
AEU10801.1
- KLIDTYFSG Hypothetical protein
LmonocyFSL_16611
Listeria monocytogenes ZP_05296661.1
- KLIETYFKK Chain C, Crystal Structure Of A
HLA Class I-Peptide Complex
Homo sapiens 2XPG_C
- KMIETYFTT GTP-binding protein YihA Bacillus thuringiensis ZP_04080665.1
- KMLETYLSK A/G-specific adenine glycosylase
Streptococcus equi AEJ24562.1
- KLIDTYFKK Fe-S assembly protein, SufD Flavobacteria bacterium ZP_03702432.1
TAX11-19 LLFGYPVYV Tax Human T-lymphotropic
virus 1
BAB20130.1
- PLFGYTVYG Hypothetical protein Homo sapiens CAD28520.1
- NLFGNPVYF Solute carrier organic anion
transporter family member 1C1 isoform 2
Macaca mulatta AFE70069.1
- IGFGYPAYI Receptor accessory protein 5 Mus musculus EDK97087.1
- ALYGCPVYV Diaminopimelate decarboxylase Capnocytophaga
gingivalis
ZP_04057540.1
- IGFGYPAYI Receptor accessory protein 5 Mus musculus EDK97087.1
- SEFSYPVYR RCC1 and BTB domain-
containing protein 2
Macaca mulatta AFE71435.1
- SLFAFPVYQ Glucosidase Homo sapiens AAO14993.1
ALOX12B404-411 LIGEAFCL Arachidonate 12-lipoxygenase,
12R-type
Mus musculus EDL10482.1
AP5S1185-192 LLGEVWHL AP-5 complex subunit sigma-1 Mus musculus NP_081405.2
DMXL2813-820 LIGEVFNI Rabconnectin-3 Homo sapiens / Mus
musculus
AAL93215.1 /
CAQ12130.1
EML5/6997-1004 MEGEVWGL Echinoderm microtubule-associated protein-like 5 / -6
Homo sapiens / Mus musculus
AAQ62653.1,
NP_001034842.2 /
AAI58138.1,
NP_666128.2
GPCPD115-22 LPGEVFAI Glycerophosphocholine
phosphodiesterase 1
Homo sapiens / Mus
musculus
NP_062539.1 /
NP_083078.3
KLHL28384-391 LAGEVFAL Kelch-like protein 28 Mus musculus NP_079983.1
MDH1B152-159 LSGEVFGM Malate dehydrogenase 1B Mus musculus AAH50786.1
NCAN257-264 LGGEVFYV Neurocan Homo sapiens / Mus
musculus
AAC80576.1 /
P55066.1
2.1.8 Antibodies
Table 15: Primary antibodies.
Apart from different notation all antibodies are directed against human antigens.
Specificity Conjugate Clone Species/Isotype Concentration Company
CD8 alpha† Cy3 LT8 Mouse / IgG1 - AbD Serotec
CD8 beta - 2ST8.5H7 Mouse / IgG2a 5.15 mg/mL Beckman Coulter
CD8 beta†‡ Cy3 2ST8.5H7 Mouse / IgG2a - Beckman Coulter
CD134 FITC ACT35 Mouse / IgG1 50 µg/mL BD Pharmingen
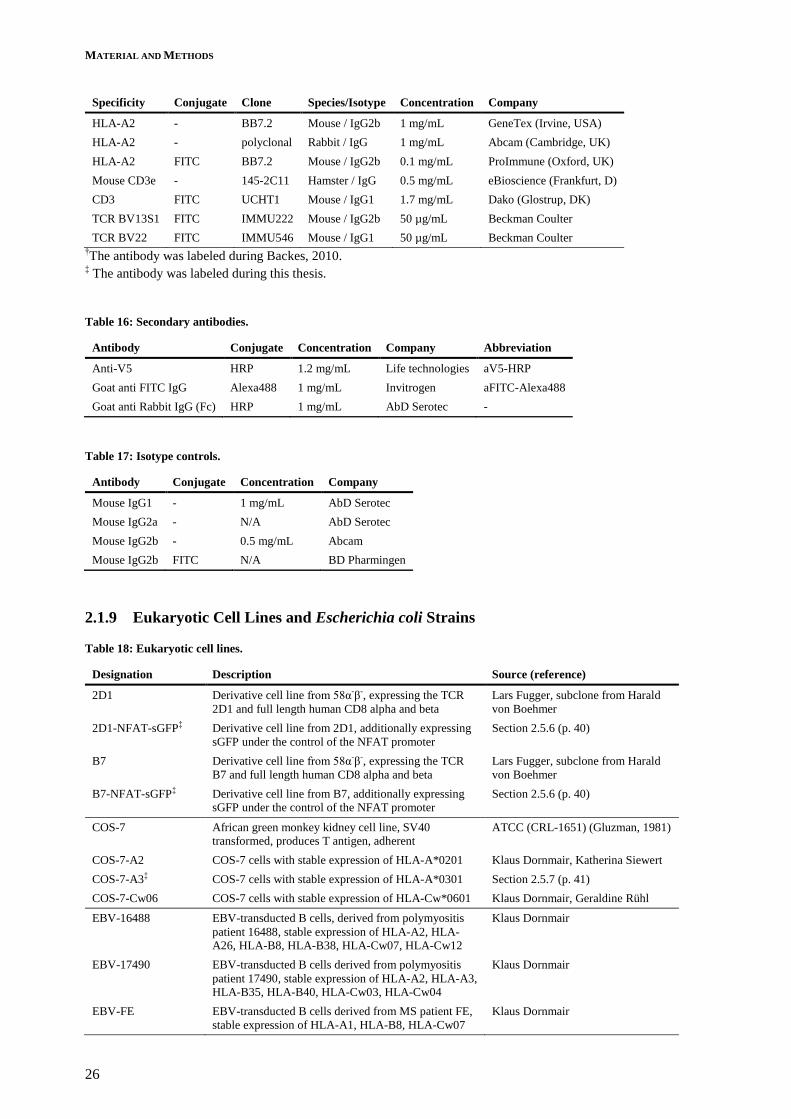
MATERIAL AND METHODS
26
Specificity Conjugate Clone Species/Isotype Concentration Company
HLA-A2 - BB7.2 Mouse / IgG2b 1 mg/mL GeneTex (Irvine, USA)
HLA-A2 - polyclonal Rabbit / IgG 1 mg/mL Abcam (Cambridge, UK)
HLA-A2 FITC BB7.2 Mouse / IgG2b 0.1 mg/mL ProImmune (Oxford, UK)
Mouse CD3e - 145-2C11 Hamster / IgG 0.5 mg/mL eBioscience (Frankfurt, D)
CD3 FITC UCHT1 Mouse / IgG1 1.7 mg/mL Dako (Glostrup, DK)
TCR BV13S1 FITC IMMU222 Mouse / IgG2b 50 µg/mL Beckman Coulter
TCR BV22 FITC IMMU546 Mouse / IgG1 50 µg/mL Beckman Coulter †The antibody was labeled during Backes, 2010.
‡ The antibody was labeled during this thesis.
Table 16: Secondary antibodies.
Antibody Conjugate Concentration Company Abbreviation
Anti-V5 HRP 1.2 mg/mL Life technologies aV5-HRP
Goat anti FITC IgG Alexa488 1 mg/mL Invitrogen aFITC-Alexa488
Goat anti Rabbit IgG (Fc) HRP 1 mg/mL AbD Serotec -
Table 17: Isotype controls.
Antibody Conjugate Concentration Company
Mouse IgG1 - 1 mg/mL AbD Serotec
Mouse IgG2a - N/A AbD Serotec
Mouse IgG2b - 0.5 mg/mL Abcam
Mouse IgG2b FITC N/A BD Pharmingen
2.1.9 Eukaryotic Cell Lines and Escherichia coli Strains
Table 18: Eukaryotic cell lines.
Designation Description Source (reference)
2D1 Derivative cell line from 58α-β-, expressing the TCR
2D1 and full length human CD8 alpha and beta
Lars Fugger, subclone from Harald
von Boehmer
2D1-NFAT-sGFP‡ Derivative cell line from 2D1, additionally expressing
sGFP under the control of the NFAT promoter
Section 2.5.6 (p. 40)
B7 Derivative cell line from 58α-β-, expressing the TCR
B7 and full length human CD8 alpha and beta
Lars Fugger, subclone from Harald
von Boehmer
B7-NFAT-sGFP‡ Derivative cell line from B7, additionally expressing sGFP under the control of the NFAT promoter
Section 2.5.6 (p. 40)
COS-7 African green monkey kidney cell line, SV40 transformed, produces T antigen, adherent
ATCC (CRL-1651) (Gluzman, 1981)
COS-7-A2 COS-7 cells with stable expression of HLA-A*0201 Klaus Dornmair, Katherina Siewert
COS-7-A3‡ COS-7 cells with stable expression of HLA-A*0301 Section 2.5.7 (p. 41)
COS-7-Cw06 COS-7 cells with stable expression of HLA-Cw*0601 Klaus Dornmair, Geraldine Rühl
EBV-16488 EBV-transducted B cells, derived from polymyositis
patient 16488, stable expression of HLA-A2, HLA-A26, HLA-B8, HLA-B38, HLA-Cw07, HLA-Cw12
Klaus Dornmair
EBV-17490 EBV-transducted B cells derived from polymyositis
patient 17490, stable expression of HLA-A2, HLA-A3, HLA-B35, HLA-B40, HLA-Cw03, HLA-Cw04
Klaus Dornmair
EBV-FE EBV-transducted B cells derived from MS patient FE,
stable expression of HLA-A1, HLA-B8, HLA-Cw07
Klaus Dornmair
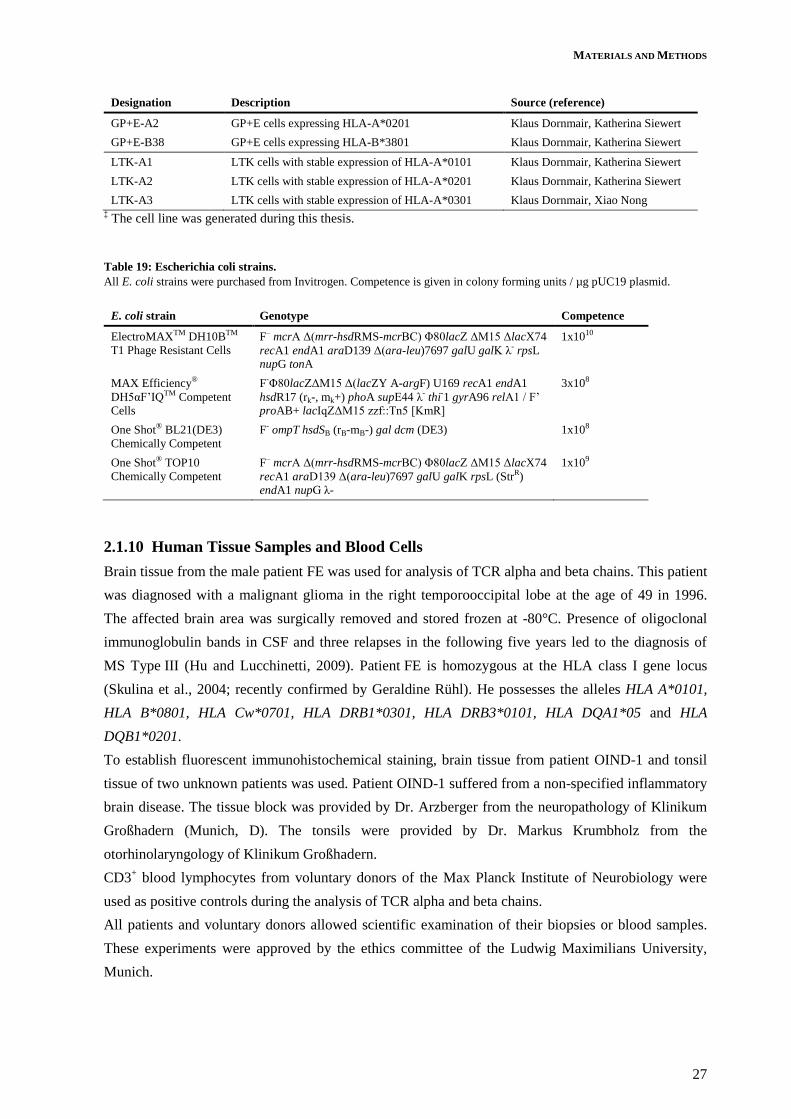
MATERIALS AND METHODS
27
Designation Description Source (reference)
GP+E-A2 GP+E cells expressing HLA-A*0201 Klaus Dornmair, Katherina Siewert
GP+E-B38 GP+E cells expressing HLA-B*3801 Klaus Dornmair, Katherina Siewert
LTK-A1 LTK cells with stable expression of HLA-A*0101 Klaus Dornmair, Katherina Siewert
LTK-A2 LTK cells with stable expression of HLA-A*0201 Klaus Dornmair, Katherina Siewert
LTK-A3 LTK cells with stable expression of HLA-A*0301 Klaus Dornmair, Xiao Nong ‡ The cell line was generated during this thesis.
Table 19: Escherichia coli strains.
All E. coli strains were purchased from Invitrogen. Competence is given in colony forming units / µg pUC19 plasmid.
E. coli strain Genotype Competence
ElectroMAXTM DH10BTM
T1 Phage Resistant Cells
F– mcrA Δ(mrr-hsdRMS-mcrBC) Φ80lacZ ΔM15 ΔlacX74
recA1 endA1 araD139 Δ(ara-leu)7697 galU galK λ- rpsL nupG tonA
1x10¹⁰
MAX Efficiency®
DH5αF’IQTM Competent Cells
F-Φ80lacZΔM15 Δ(lacZY A-argF) U169 recA1 endA1
hsdR17 (rk-, mk+) phoA supE44 λ- thi-1 gyrA96 relA1 / F’ proAB+ lacIqZΔM15 zzf::Tn5 [KmR]
3x10⁸
One Shot® BL21(DE3)
Chemically Competent
F- ompT hsdSB (rB-mB-) gal dcm (DE3) 1x10⁸
One Shot® TOP10
Chemically Competent
F– mcrA Δ(mrr-hsdRMS-mcrBC) Φ80lacZ ΔM15 ΔlacX74
recA1 araD139 Δ(ara-leu)7697 galU galK rpsL (StrR) endA1 nupG λ-
1x10⁹
2.1.10 Human Tissue Samples and Blood Cells
Brain tissue from the male patient FE was used for analysis of TCR alpha and beta chains. This patient
was diagnosed with a malignant glioma in the right temporooccipital lobe at the age of 49 in 1996.
The affected brain area was surgically removed and stored frozen at -80°C. Presence of oligoclonal
immunoglobulin bands in CSF and three relapses in the following five years led to the diagnosis of
MS Type III (Hu and Lucchinetti, 2009). Patient FE is homozygous at the HLA class I gene locus
(Skulina et al., 2004; recently confirmed by Geraldine Rühl). He possesses the alleles HLA A*0101,
HLA B*0801, HLA Cw*0701, HLA DRB1*0301, HLA DRB3*0101, HLA DQA1*05 and HLA
DQB1*0201.
To establish fluorescent immunohistochemical staining, brain tissue from patient OIND-1 and tonsil
tissue of two unknown patients was used. Patient OIND-1 suffered from a non-specified inflammatory
brain disease. The tissue block was provided by Dr. Arzberger from the neuropathology of Klinikum
Großhadern (Munich, D). The tonsils were provided by Dr. Markus Krumbholz from the
otorhinolaryngology of Klinikum Großhadern.
CD3+ blood lymphocytes from voluntary donors of the Max Planck Institute of Neurobiology were
used as positive controls during the analysis of TCR alpha and beta chains.
All patients and voluntary donors allowed scientific examination of their biopsies or blood samples.
These experiments were approved by the ethics committee of the Ludwig Maximilians University,
Munich.

MATERIAL AND METHODS
28
2.2 Analysis of Nucleic Acids
2.2.1 RNA isolation from Tissue Samples
Tissue samples were homogenized in TRIzol LS reagent by pipetting (10 µm tissue slides) or
mechanical grinding (mouse thymus and brain). After adding 200 µL of chloroform per mL tissue
suspension the samples were shaken for 15 seconds, incubated for 5 minutes at room temperature and
centrifuged in the 5417 R Centrifuge (Eppendorf) at 4°C and 14,000 rpm (20,800 g). The upper,
aqueous phase containing RNA was transferred into a new reaction tube. After adding 10 µL of
glycogen (Novagen, final concentration of 200 µg) and 700 µL 70 % 2-propanol the samples were
incubated for 20 minutes at -20°C and then centrifuged for 20 minutes at 4°C and 14,000 rpm
(20,800 g). Subsequently the samples were washed with 1 mL 80 % ethanol via 5 minutes of
centrifugation at 4°C and 14,000 rpm (20,800 g). The RNA pellet was air-dried, resuspended in 22 µL
of DEPC-water (Invitrogen) and stored at -20°C. RNA concentration was determined as described in
Section 2.2.2 (p. 28).
2.2.2 Determination of DNA and RNA Concentration
DNA and RNA concentration was measured at the spectrophotometer Nanodrop ND-1000 (Thermo
Fisher Scientific) with the software “ND-1000 V3.2.1” according to the manufacturer’s instructions at
a wavelength of 260 nm.
2.2.3 Analysis of RNA Quality in Human Tissue Blocks
Human tissue blocks were stored at -80°C and warmed to -20°C for the generation of 10 µm thick
cryostat tissue sections. Before usage, the cryotom was cleaned with RNase ZAP (Sigma-Aldrich),
H2O/DEPC and 80 % ethanol to provide an RNase-free working area. PET Membrane slides 1.0
(Zeiss) were baked 4 hours and 30 minutes at 180°C and coated 1 hour with 100 mL of a 2 µg/µL
poly-L-lysine-hydrobromide solution inside a wet chamber. After rinsing with H2O/DEPC the slides
were dried and sterilized for 30 minutes through UV irradiation.
10 µm tissue sections were either collected directly after cutting in 1 mL TRIzol LS reagent or
mounted on the prepared membrane slides and stored at -80°C. After different treatment of the stored
slides (Section 3.2.1, p. 65), the tissue was collected by washing it with TRIzol LS reagent into 2 mL
reaction tubes. TRIzol LS-tissue suspensions could be stored several days at -20°C. RNA isolation was
performed as described in Section 2.2.1 (p. 28).
RNA quality analysis was performed in a chip at the 2100 Bioanalyzer (Agilent) using the “RNA 6000
Pico Assay” kit (Agilent). RNA samples were diluted 1:10 and 1:100 in DEPC-water (Invitrogen),
denatured for 2 minutes at 70°C and then processed as described in the user manual. The data were
obtained as gel-like images and electropherograms. For analyzing the data the software “Agilent
Technologies 2100 Bioanalyzer 2100 Expert, VB.02.06.SI418” (Agilent) was employed. RNA quality
was given as “RNA integrity number” (RIN). The RIN-value represented the ratio between 28S rRNA

MATERIALS AND METHODS
29
and 18S rRNA offset against further factors. Values from 8 to 10 indicated good RNA quality, lower
values meant less and higher values better quality, respectively.
2.2.4 Quantitative PCR
cDNA was transcribed from isolated RNA (Section 2.2.1, p. 28) using the SuperScript® III Reverse
Transcriptase Kit (Invitrogen). First the reverse transcription PCR (RT-PCR) pre-mix was prepared
according to the manufacturer’s instructions:
Volume Reagent Final Concentration
10 µL 5x FS Buffer 1x
2.5 µL dNTP-mix (10 mM each) 0.5 mM each
2.5 µL DTT (0.1 M) 5 mM
2.5 µL RNase OUT (40 U/µL) 100 U
2 µL Random Primer 600 ng
2 µL SuperScript III RT (200 U/µL) 500 U
1.5 µL DMSO 3 %
x µL total RNA 2.5 µg
50 µL
The RT-PCR was performed in the T3 Thermocycler (Biometra) heating to 25°C for 5 minutes, to
50°C for 60 minutes and to 70°C for 15 minutes. cDNA samples were diluted to 50 ng/µL, aliquoted
and stored at -20°C.
For quantitative PCR (qPCR) the primers were designed to span at least one intron and the region of
interest in particular genes (Supplement 5.5, p. 113). Probes were labeled at 3’ with 6-FAM and 5’
with Tamra. Primers and probes for qPCR are listed in Table 12 (p. 22). Each qPCR was performed in
96-well optical reaction plates with 250 ng, 50 ng and 0 ng of template cDNA in triplets with the
following mix:
Volume Reagent Final Concentration
10 µL 2x TaqMan gene expression master mix 1x
0.5 µL x-for (10 µM) 0.25 µM
0.5 µL x-rev (10 µM) 0.25 µM
0.5 µL x-probe (5 µM) 0.125 µM
1 µL cDNA x ng
ad 20 µL H2O/DEPC
qPCR was performed in the 7900HT Fast Real-Time PCR System (Applied Biosystems) under
following conditions:
50°C 2 min
95°C 10 min
95°C 15 sec denaturation 40 cycles
60°C 1 min hybridization and elongation

MATERIAL AND METHODS
30
Data were acquired and analyzed with the software SDS Version 2.4.1 (Applied Biosystems). For
calculation of ΔCt values Ct values of the house keeping gene Gapdh were subtracted from Ct values
of genes of interest.
2.2.5 Agarose gel electrophoresis
According to the expected length of DNA 0.9 % to 2 % agarose gels were prepared in TBE buffer
containing 0.5 µg/mL ethidium bromide. The samples were mixed with 6x DNA loading buffer to a
final concentration of 1x. To determine the lengths of running DNA fragments 50 bp, 100 bp or 1 kb
DNA markers (New England Biolabs) were used. The samples were run in TBE buffer at 180 V for
250 mL gels and 90 V for 35 mL gels. Ethidium bromide intercalates in DNA strands and absorbs UV
light. Thus gels were documented at the Geldoc XR (Bio-Rad) device using the software “Quantity
One V 4.6.5” (Bio-Rad). All buffers are given in Table 2 (p. 15).
2.2.6 Sequencing of DNA Samples
Sequencing analyses were performed at the sequencing service at the faculty of biology of the Ludwig
Maximilians University, Munich employing the protocol “Cycle, Clean & Run BigDye v3.1”.
Resulting sequences were analyzed with the software “Chromas Lite V2.01” (Griffith University, AU)
and “ApE - A plasmid Editor V2.0.44” (M. Wayne Davis).
2.3 Generation of diverse Plasmids
2.3.1 Plasmid-Encoded Combinatorial Peptide Libraries
First the primers N24-Lib-for, 8L-Lib-for, N30-Lib-for, 10L-Lib-for, N39-Lib-for and Lib-rev or Lib-
rev-new (Table 9, p. 21) were denatured for 5 minutes at 99°C in the following setup in the T3
Thermocycler (Biometra):
Volume Reagent Final Concentration
5 µL x-Lib-for (100 µM) 20 μM
5 µL x-Lib-rev(-new) (100 µM) 20 μM
10 µL 10x PCR buffer 1x
ad 100 µL H2O/DEPC
After cooling to room temperature the following PCR mix was added:
Volume Reagent Final Concentration
4 µL dNTP-mix (10 mM each) 0.2 mM
10 µL 10x buffer 1x
2 µL Taq-DNA-Polymerase (5 U/µL) 10 U
ad 100 µL H2O/DEPC
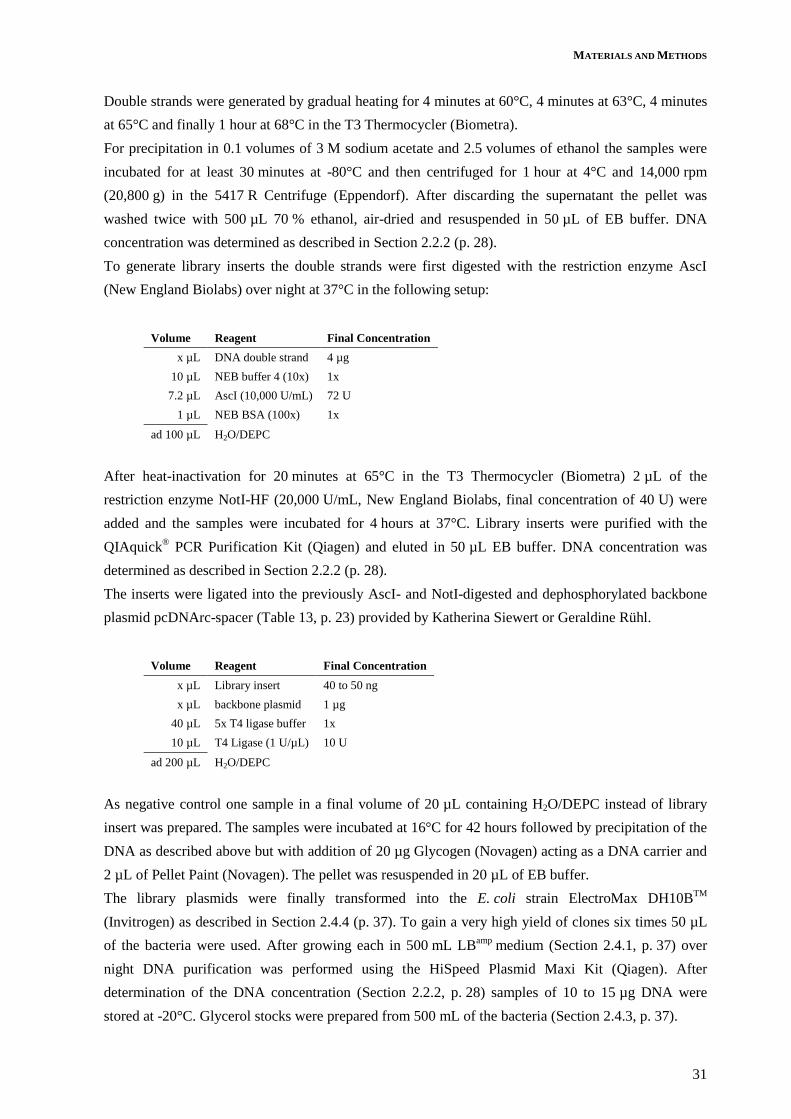
MATERIALS AND METHODS
31
Double strands were generated by gradual heating for 4 minutes at 60°C, 4 minutes at 63°C, 4 minutes
at 65°C and finally 1 hour at 68°C in the T3 Thermocycler (Biometra).
For precipitation in 0.1 volumes of 3 M sodium acetate and 2.5 volumes of ethanol the samples were
incubated for at least 30 minutes at -80°C and then centrifuged for 1 hour at 4°C and 14,000 rpm
(20,800 g) in the 5417 R Centrifuge (Eppendorf). After discarding the supernatant the pellet was
washed twice with 500 µL 70 % ethanol, air-dried and resuspended in 50 µL of EB buffer. DNA
concentration was determined as described in Section 2.2.2 (p. 28).
To generate library inserts the double strands were first digested with the restriction enzyme AscI
(New England Biolabs) over night at 37°C in the following setup:
Volume Reagent Final Concentration
x µL DNA double strand 4 µg
10 µL NEB buffer 4 (10x) 1x
7.2 µL AscI (10,000 U/mL) 72 U
1 µL NEB BSA (100x) 1x
ad 100 µL H2O/DEPC
After heat-inactivation for 20 minutes at 65°C in the T3 Thermocycler (Biometra) 2 µL of the
restriction enzyme NotI-HF (20,000 U/mL, New England Biolabs, final concentration of 40 U) were
added and the samples were incubated for 4 hours at 37°C. Library inserts were purified with the
QIAquick® PCR Purification Kit (Qiagen) and eluted in 50 µL EB buffer. DNA concentration was
determined as described in Section 2.2.2 (p. 28).
The inserts were ligated into the previously AscI- and NotI-digested and dephosphorylated backbone
plasmid pcDNArc-spacer (Table 13, p. 23) provided by Katherina Siewert or Geraldine Rühl.
Volume Reagent Final Concentration
x µL Library insert 40 to 50 ng
x µL backbone plasmid 1 µg
40 µL 5x T4 ligase buffer 1x
10 µL T4 Ligase (1 U/µL) 10 U
ad 200 µL H2O/DEPC
As negative control one sample in a final volume of 20 µL containing H2O/DEPC instead of library
insert was prepared. The samples were incubated at 16°C for 42 hours followed by precipitation of the
DNA as described above but with addition of 20 µg Glycogen (Novagen) acting as a DNA carrier and
2 µL of Pellet Paint (Novagen). The pellet was resuspended in 20 µL of EB buffer.
The library plasmids were finally transformed into the E. coli strain ElectroMax DH10BTM
(Invitrogen) as described in Section 2.4.4 (p. 37). To gain a very high yield of clones six times 50 µL
of the bacteria were used. After growing each in 500 mL LBamp
medium (Section 2.4.1, p. 37) over
night DNA purification was performed using the HiSpeed Plasmid Maxi Kit (Qiagen). After
determination of the DNA concentration (Section 2.2.2, p. 28) samples of 10 to 15 µg DNA were
stored at -20°C. Glycerol stocks were prepared from 500 mL of the bacteria (Section 2.4.3, p. 37).
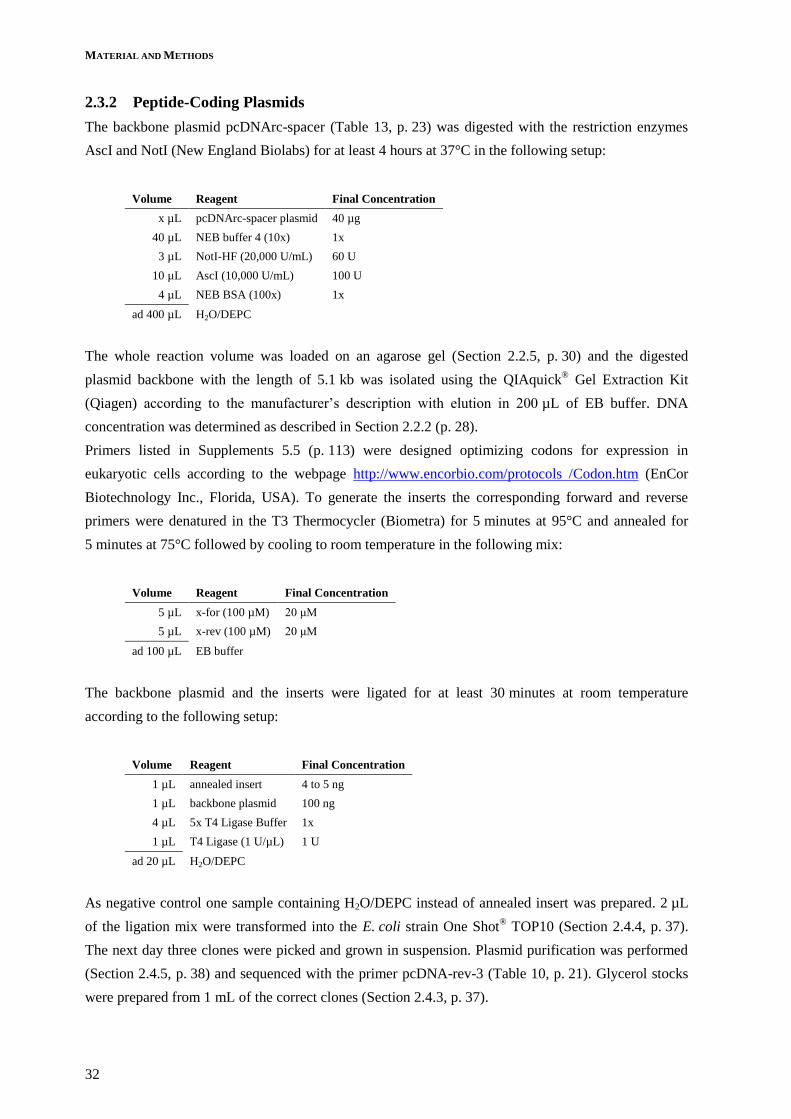
MATERIAL AND METHODS
32
2.3.2 Peptide-Coding Plasmids
The backbone plasmid pcDNArc-spacer (Table 13, p. 23) was digested with the restriction enzymes
AscI and NotI (New England Biolabs) for at least 4 hours at 37°C in the following setup:
Volume Reagent Final Concentration
x µL pcDNArc-spacer plasmid 40 µg
40 µL NEB buffer 4 (10x) 1x
3 µL NotI-HF (20,000 U/mL) 60 U
10 µL AscI (10,000 U/mL) 100 U
4 µL NEB BSA (100x) 1x
ad 400 µL H2O/DEPC
The whole reaction volume was loaded on an agarose gel (Section 2.2.5, p. 30) and the digested
plasmid backbone with the length of 5.1 kb was isolated using the QIAquick® Gel Extraction Kit
(Qiagen) according to the manufacturer’s description with elution in 200 µL of EB buffer. DNA
concentration was determined as described in Section 2.2.2 (p. 28).
Primers listed in Supplements 5.5 (p. 113) were designed optimizing codons for expression in
eukaryotic cells according to the webpage http://www.encorbio.com/protocols /Codon.htm (EnCor
Biotechnology Inc., Florida, USA). To generate the inserts the corresponding forward and reverse
primers were denatured in the T3 Thermocycler (Biometra) for 5 minutes at 95°C and annealed for
5 minutes at 75°C followed by cooling to room temperature in the following mix:
Volume Reagent Final Concentration
5 µL x-for (100 µM) 20 μM
5 µL x-rev (100 µM) 20 μM
ad 100 µL EB buffer
The backbone plasmid and the inserts were ligated for at least 30 minutes at room temperature
according to the following setup:
Volume Reagent Final Concentration
1 µL annealed insert 4 to 5 ng
1 µL backbone plasmid 100 ng
4 µL 5x T4 Ligase Buffer 1x
1 µL T4 Ligase (1 U/µL) 1 U
ad 20 µL H2O/DEPC
As negative control one sample containing H2O/DEPC instead of annealed insert was prepared. 2 µL
of the ligation mix were transformed into the E. coli strain One Shot® TOP10 (Section 2.4.4, p. 37).
The next day three clones were picked and grown in suspension. Plasmid purification was performed
(Section 2.4.5, p. 38) and sequenced with the primer pcDNA-rev-3 (Table 10, p. 21). Glycerol stocks
were prepared from 1 mL of the correct clones (Section 2.4.3, p. 37).

MATERIALS AND METHODS
33
2.3.3 Truncated Proteins Coding Plasmid pcDNA6/V5-HisA
Domain-based truncation of the mouse proteins DMXL2, EML5, GPCPD1 and NCAN was conducted
taking domain regions from http://www.uniprot.org/uniprot/Q8BPN8, http://www.uniprot.org/uniprot/
Q8BQM8, http://www.uniprot.org/uniprot/Q8C0L9 and http://www.uniprot.org/uniprot/P55066
(Supplements 5.8, p. 126).
To generate adequate backbones, the plasmid pcDNA6/V5-HisA (Table 13, p. 23) was first digested
with the restriction enzyme EcoRI-HF (New England Biolabs) for 2 hours at 37°C in the following
setup:
Volume Reagent Final Concentration
x µL pcDNA6/V5-HisA plasmid 4 µg
2 µL NEB buffer 4 (10x) 1x
1 µL EcoRI-HF (20,000 U/mL) 20 U
ad 20 µL H2O/DEPC
After heat inactivation for 20 minutes at 65°C the following mix for the second digestion with the
restriction enzyme NotI-HF was added:
Volume Reagent Final Concentration
1 µL NEB buffer 4 (10x) 1x
1 µL NotI-HF (20,000 U/mL) 20 U
0.3 µL NEB BSA (100x) 1x
ad 10 µL H2O/DEPC
The sample was incubated at 37°C for 2 hours. Subsequently the whole reaction volume was loaded
on an agarose gel (Section 2.2.5, p. 30). The digested plasmid backbone with a length of 5.1 kb was
isolated using the QIAquick® Gel Extraction Kit (Qiagen) according to the manufacturer’s description
with elution in 20 µL of EB buffer. DNA concentration was determined as described in Section 2.2.2
(p. 28). Afterwards 500 ng of digested plasmid were dephosphorylated using the Rapid DNA Dephos
& Ligation Kit (Roche) according to the manufacturer’s instructions.
To generate inserts coding for the truncated mouse proteins DMXL2748-926, EML5897-1038 and
GPCPD11-118 cDNA from mouse thymus (Section 2.2.4, p. 29) was used as template for the following
pre-amplification PCR with outer primers listed in Table 11 (p. 22):
Volume Reagent Final Concentration
2.0 µL 10x PCR buffer 1x
0.5 µL dNTP-mix (10 mM each) 0.25 mM
0.5 µL x-out-for (10 µM) 0.25 µM
0.5 µL x-out-rev (10 µM) 0.25 µM
0.5 µL Taq DNA Polymerase (5 U/µL) 2.5 U
1.0 µL cDNA 50 ng
ad 20 µL H2O/DEPC

MATERIAL AND METHODS
34
The PCR was run in the T3 Thermocycler (Biometra) using the following conditions:
95°C 2 min
95°C 30 sec denaturation
56°C 1 min hybridization 40 cycles
72°C 1 min elongation
72°C 10 min
4°C ∞
The whole reaction volume was loaded on an agarose gel (Section 2.2.5, p. 30). The PCR products of
expected lengths were isolated using the QIAquick® Gel Extraction Kit (Qiagen) according to the
manufacturer’s description with elution in 20 µL of EB buffer. DNA concentration was determined
(Section 2.2.2, p. 28) and the products were sent for sequencing (Section 2.2.6, p. 30).
Next the actual gene region was amplified using the same protocol as mentioned above with 1 µL of
the outer PCR product as template. The primers exp-x-for and x-V5-rev (Table 11, p. 22) were
employed. They introduced 5’ extensions with a restriction site for EcoRI, the Kozak sequence
CCACC as well as the start codon ATG and 3’ extensions with the V5 tag, the stop codon TAG and a
restriction site for NotI. The products were sent for sequencing (Section 2.2.6, p. 30).
The required region of NCAN156-359 was synthesized by GeneArt® Gene Synthesis (Invitrogen). The
PCR products for DMXL2748-926-V5, EML5897-1038-V5 and GPCPD11-118-V5 and the plasmid
13AAG64P_Ncan-V5_pMA-RQ (Table 13, p. 23) containing NCAN156-359-V5 were double digested
for 2 hours at 37°C with the restriction enzymes EcoRI-HF and NotI-HF (New England Biolabs):
Volume Reagent Final Concentration
6 µL PCR product / plasmid
4 µL NEB buffer 4 (10x) 1x
1 µL NotI-HF (20,000 U/mL) 20 U
1 µL EcoRI-HF (20,000 U/mL) 20 U
0.4 µL NEB BSA (100x) 1x
ad 40 µL H2O/DEPC
The whole reaction volume for DMXL2748-926, EML5897-1038 and GPCPD11-118 was purified using the
QIAquick® Gel Extraction Kit (Qiagen) according to the manufacturer’s description with elution in
20 µL of EB buffer. The whole reaction volume for NCAN156-359-V5 was loaded on an agarose gel
(Section 2.2.5, p. 30). The DNA fragment of the expected length was isolated using the QIAquick®
Gel Extraction Kit (Qiagen) according to the manufacturer’s description with elution in 20 µL of EB
buffer. DNA concentration was determined (Section 2.2.2, p. 28).
The dephosphorylated backbone plasmid pcDNA6/V5-HisA and the inserts coding for the truncated
mouse proteins DMXL2748-926-V5, EML5897-1038-V5, GPCPD11-118-V5 and NCAN156-359-V5 were
ligated for at least 30 minutes at room temperature according to the following setup:
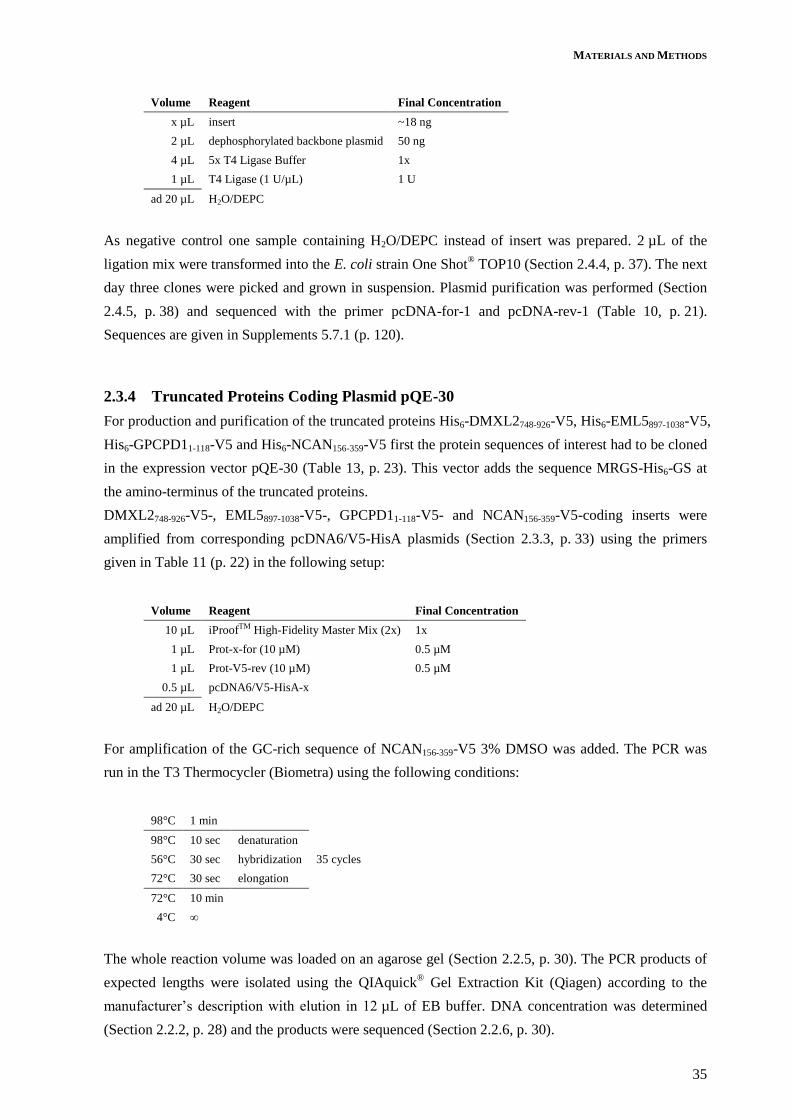
MATERIALS AND METHODS
35
Volume Reagent Final Concentration
x µL insert ~18 ng
2 µL dephosphorylated backbone plasmid 50 ng
4 µL 5x T4 Ligase Buffer 1x
1 µL T4 Ligase (1 U/µL) 1 U
ad 20 µL H2O/DEPC
As negative control one sample containing H2O/DEPC instead of insert was prepared. 2 µL of the
ligation mix were transformed into the E. coli strain One Shot® TOP10 (Section 2.4.4, p. 37). The next
day three clones were picked and grown in suspension. Plasmid purification was performed (Section
2.4.5, p. 38) and sequenced with the primer pcDNA-for-1 and pcDNA-rev-1 (Table 10, p. 21).
Sequences are given in Supplements 5.7.1 (p. 120).
2.3.4 Truncated Proteins Coding Plasmid pQE-30
For production and purification of the truncated proteins His6-DMXL2748-926-V5, His6-EML5897-1038-V5,
His6-GPCPD11-118-V5 and His6-NCAN156-359-V5 first the protein sequences of interest had to be cloned
in the expression vector pQE-30 (Table 13, p. 23). This vector adds the sequence MRGS-His6-GS at
the amino-terminus of the truncated proteins.
DMXL2748-926-V5-, EML5897-1038-V5-, GPCPD11-118-V5- and NCAN156-359-V5-coding inserts were
amplified from corresponding pcDNA6/V5-HisA plasmids (Section 2.3.3, p. 33) using the primers
given in Table 11 (p. 22) in the following setup:
Volume Reagent Final Concentration
10 µL iProofTM High-Fidelity Master Mix (2x) 1x
1 µL Prot-x-for (10 µM) 0.5 µM
1 µL Prot-V5-rev (10 µM) 0.5 µM
0.5 µL pcDNA6/V5-HisA-x
ad 20 µL H2O/DEPC
For amplification of the GC-rich sequence of NCAN156-359-V5 3% DMSO was added. The PCR was
run in the T3 Thermocycler (Biometra) using the following conditions:
98°C 1 min
98°C 10 sec denaturation
56°C 30 sec hybridization 35 cycles
72°C 30 sec elongation
72°C 10 min
4°C ∞
The whole reaction volume was loaded on an agarose gel (Section 2.2.5, p. 30). The PCR products of
expected lengths were isolated using the QIAquick® Gel Extraction Kit (Qiagen) according to the
manufacturer’s description with elution in 12 µL of EB buffer. DNA concentration was determined
(Section 2.2.2, p. 28) and the products were sequenced (Section 2.2.6, p. 30).

MATERIAL AND METHODS
36
Correct PCR products were double digested for 3 hours at 37°C with the restriction enzymes BamHI-
HF and SalI-HF (New England Biolabs):
Volume Reagent Final Concentration
6 µL PCR product 300 ng
4 µL Cut SmartTM buffer (10x) 1x
1 µL BamHI-HF (20,000 U/mL) 20 U
1 µL SalI-HF (20,000 U/mL) 20 U
ad 40 µL H2O/DEPC
Digested PCR products were purified using the QIAquick® PCR-Purification Kit according to the
manufacturer’s instructions with elution in 12 µL of EB buffer. DNA concentration was determined
(Section 2.2.2, p. 28).
The plasmid backbone pQE-30 was kindly provided by Jessica Bruder and digested for 3 hours at
37°C with the restriction enzymes BamHI-HF and SalI-HF (New England Biolabs):
Volume Reagent Final Concentration
7 µL pQE-30 plasmid 4.9 µg
5 µL Cut SmartTM buffer (10x) 1x
1.5 µL BamHI-HF (20,000 U/mL) 30 U
1.5 µL SalI-HF (20,000 U/mL) 30 U
ad 50 µL H2O/DEPC
The whole reaction volume was loaded on an agarose gel (Section 2.2.5, p. 30). The digested plasmid
backbone with length of 3.4 kb was isolated using the QIAquick® Gel Extraction Kit (Qiagen)
according to the manufacturer’s description with elution in 12 µL of EB buffer. DNA concentration
was determined (Section 2.2.2, p. 28). 500 ng of digested plasmid were dephosphorylated using the
Rapid DNA Dephos & Ligation Kit (Roche) according to the manufacturer’s instructions.
The dephosphorylated backbone plasmid pQE-30 and the inserts coding for the truncated mouse
proteins DMXL2748-926-V5, EML5897-1038-V5, GPCPD11-118-V5 and NCAN156-359-V5 were ligated for
2 hours at room temperature according to the following setup:
Volume Reagent Final Concentration
x µL insert ~90 ng
2 µL dephosphorylated pQE-30 plasmid 50 ng
4 µL 5x T4 Ligase Buffer 1x
1 µL T4 Ligase (1 U/µL) 1 U
ad 20 µL H2O/DEPC
4 µL of the ligation mixes or non-digested pQE-30 plasmid were transformed into the E. coli strain
MAX Efficiency® DH5αF’IQ (Section 2.4.4, p. 37). The next day five clones each were picked and
grown in suspension. Plasmid purification was performed (Section 2.4.5, p. 38) and sequenced with

MATERIALS AND METHODS
37
the primer pQE-for (5’-CCC GAA AAG TGC CAC CTG-3’) and pQE-rev (5’-GTT CTG AGG TCA
TTA CTG G-3’). Sequences are given in Supplements 5.7.2 (p. 122).
2.4 Handling of E. coli Cultures
2.4.1 Culture Conditions
As selection antibiotic ampicillin was used and added at a concentration of 0.1 mg/mL to either LB
medium (Table 3, p. 18) or LB plates (LB medium supplemented with 0.15 % Bacto-Agar). E. coli
bacteria were cultured in LBamp
medium or grown on LBamp
plates at 37°C. Suspension cultures shook
at 225 rpm in receptacles containing 5x the culture volume of air to ensure sufficient aeration.
2.4.2 Determination of Cell Numbers
Cell numbers of E. coli bacteria were determined by measurement of the optical density (OD) at a
wavelength of 600 nm. The OD was either measured in cuvettes with 1 cm of diameter at the UV-
VISIBLE Recording spectrophotometer (Shimadzu) or at the spectrophotometer Nanodrop ND-1000
(Thermo Fisher Scientific) with the software “ND-1000 V3.2.1” (Thermo Fisher Scientific) in a 1 mm
drop according to the user manual. At an OD of 1 or 0.1 respectively the culture was assumed to
contain 1x10⁹ bacteria/mL.
Exact clone numbers were determined by spreading defined volumes of bacteria cultures on LBamp
plates (Section 2.4.1, p. 37), incubating them over night at 37°C and counting the clones at the next
day.
2.4.3 Freezing and Thawing of E. coli Cultures
To store and preserve transformed E. coli cultures 50 % (v/v) of glycerol were added to LBamp
cultures
and frozen at -80°C.
For thawing two times the volume of LB medium (Table 3, p. 18) was added. The bacteria were
centrifuged for 15 minutes at 3000 g and 4°C and resuspended in at least five times the original
volume of LBamp
medium (Section 2.4.1, p. 37). After shaking the cells for 1 hour at 225 rpm and
37°C they were diluted 1:8 and shook again for about 5 hours followed by plasmid isolation (Section
2.4.5, p. 38).
2.4.4 Plasmid Transformation in E. coli Cells
E. coli One Shot® TOP10 bacteria (Table 19, p. 27) were transformed by heat shock. The bacteria
were thawn on ice. After adding 2 µL containing 10 pg to 100 ng of DNA sample the bacteria were
incubated for 30 minutes on ice. As negative control samples containing pUC19 DNA were prepared
which was provided by the manufacturer. The cells were heat-shocked for 30 seconds at 42°C in a
water bath and cooled again for 2 minutes on ice. After adding 250 µL of pre-warmed S.O.C. medium
(Invitrogen) the bacteria were shaken horizontally for 1 hour at 37°C and 225 rpm. Thereupon bacteria
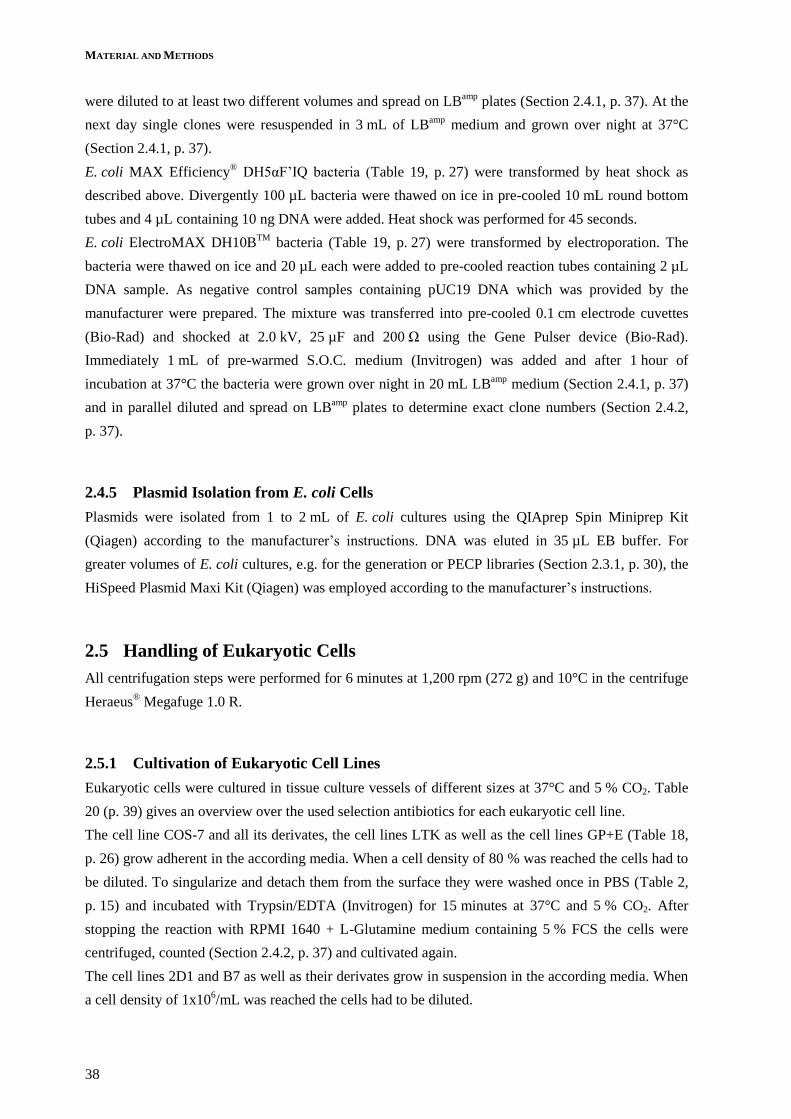
MATERIAL AND METHODS
38
were diluted to at least two different volumes and spread on LBamp
plates (Section 2.4.1, p. 37). At the
next day single clones were resuspended in 3 mL of LBamp
medium and grown over night at 37°C
(Section 2.4.1, p. 37).
E. coli MAX Efficiency® DH5αF’IQ bacteria (Table 19, p. 27) were transformed by heat shock as
described above. Divergently 100 µL bacteria were thawed on ice in pre-cooled 10 mL round bottom
tubes and 4 µL containing 10 ng DNA were added. Heat shock was performed for 45 seconds.
E. coli ElectroMAX DH10BTM
bacteria (Table 19, p. 27) were transformed by electroporation. The
bacteria were thawed on ice and 20 µL each were added to pre-cooled reaction tubes containing 2 µL
DNA sample. As negative control samples containing pUC19 DNA which was provided by the
manufacturer were prepared. The mixture was transferred into pre-cooled 0.1 cm electrode cuvettes
(Bio-Rad) and shocked at 2.0 kV, 25 µF and 200 Ω using the Gene Pulser device (Bio-Rad).
Immediately 1 mL of pre-warmed S.O.C. medium (Invitrogen) was added and after 1 hour of
incubation at 37°C the bacteria were grown over night in 20 mL LBamp
medium (Section 2.4.1, p. 37)
and in parallel diluted and spread on LBamp
plates to determine exact clone numbers (Section 2.4.2,
p. 37).
2.4.5 Plasmid Isolation from E. coli Cells
Plasmids were isolated from 1 to 2 mL of E. coli cultures using the QIAprep Spin Miniprep Kit
(Qiagen) according to the manufacturer’s instructions. DNA was eluted in 35 µL EB buffer. For
greater volumes of E. coli cultures, e.g. for the generation or PECP libraries (Section 2.3.1, p. 30), the
HiSpeed Plasmid Maxi Kit (Qiagen) was employed according to the manufacturer’s instructions.
2.5 Handling of Eukaryotic Cells
All centrifugation steps were performed for 6 minutes at 1,200 rpm (272 g) and 10°C in the centrifuge
Heraeus® Megafuge 1.0 R.
2.5.1 Cultivation of Eukaryotic Cell Lines
Eukaryotic cells were cultured in tissue culture vessels of different sizes at 37°C and 5 % CO2. Table
20 (p. 39) gives an overview over the used selection antibiotics for each eukaryotic cell line.
The cell line COS-7 and all its derivates, the cell lines LTK as well as the cell lines GP+E (Table 18,
p. 26) grow adherent in the according media. When a cell density of 80 % was reached the cells had to
be diluted. To singularize and detach them from the surface they were washed once in PBS (Table 2,
p. 15) and incubated with Trypsin/EDTA (Invitrogen) for 15 minutes at 37°C and 5 % CO2. After
stopping the reaction with RPMI 1640 + L-Glutamine medium containing 5 % FCS the cells were
centrifuged, counted (Section 2.4.2, p. 37) and cultivated again.
The cell lines 2D1 and B7 as well as their derivates grow in suspension in the according media. When
a cell density of 1x10⁶/mL was reached the cells had to be diluted.

MATERIALS AND METHODS
39
EBV-transduced B cells grow clotted in suspension in RPMI/complete medium (Table 3, p. 18)
without antibiotic supplementation. Suspended single cells were removed and clots were downsized
by soft shaking of the incubation bottle.
Table 20: Selection antibiotics for eukaryotic cell lines.
All cell lines (Table 18, p. 26) were cultivated in RPMI/complete medium (Table 3, p. 18) and the addition of according
antibiotics. Concentrations of antibiotics for selection / normal cell culture are given in µg/mL.
Cell Line Stable Transfection
Concentrations of
Antibiotics Antibiotics
2D1 TCR 2D1 - / 800 G418 (Invitrogen)
2D1-NFAT-sGFP‡ TCR 2D1,
NFAT-sGFP
- / 800
2 to 6 / 3
G418
Blasticidin (Invitrogen)
B7 TCR B7 - / 800 G418
B7-NFAT-sGFP‡ TCR B7,
NFAT-sGFP
- / 800
2 to 6 / 3
G418
Blasticidin
COS-7 - -
COS-7-A2 HLA-A*0201 - / 1500 G418
COS-7-A3‡ HLA-A*0301 3000 to 7000 / 1500 G418
COS-7-Cw06 HLA-Cw*0601 - / 1500 G418
GP+E-A2 HLA-A*0201 - / 500 G418
GP+E-B38 HLA-B*3801 - / 500 G418
LTK-A1 HLA-A*0101 - / 500 G418
LTK-A2 HLA-A*0201 - / 500 G418
LTK-A3 HLA-A*0301 - / 500 G418 ‡ The cell line was generated during this thesis.
2.5.2 Counting of Eukaryotic Cells
Singularized adherent cells and cells growing in suspension were counted with an improved Neubauer
counting chamber. Tryphanblue solution (Table 2, p. 15) was used as counter stain for dead cells as
their perforated membranes allow transmigration of the colorant. Living cells in the four quadrants
were counted under a light microscope, the average of this value was multiplied by the dilution factor
of cell suspension with tryphanblue solution and the counting chamber constant of 10,000. The
resulting value gave the number of cells per mL in the original suspension.
2.5.3 Freezing and Thawing of Eukaryotic Cells
For long term storage singularized adherent cells and cells growing in suspension were counted
(Section 2.4.2, p. 37), centrifuged and resuspended in freezing medium (Table 3, p. 18) to a final
concentration of 2x10⁶ cells/mL. 1.5 mL were filled in 1.8 mL cell freezing tubes and stored for 2 days
at -80°C in freezing boxes (Thermo Scientific Nalgene, Langenselbold, D), allowing a temperature
reduction of 1°C per hour. Then the tubes were transferred into liquid nitrogen tanks.
For thawing the cells were quickly warmed to 37°C, transferred in a 50 mL centrifugation tube filled
with 40 mL RPMI 1640 + L-Glutamine medium and centrifuged. Freshly thawed cells were first
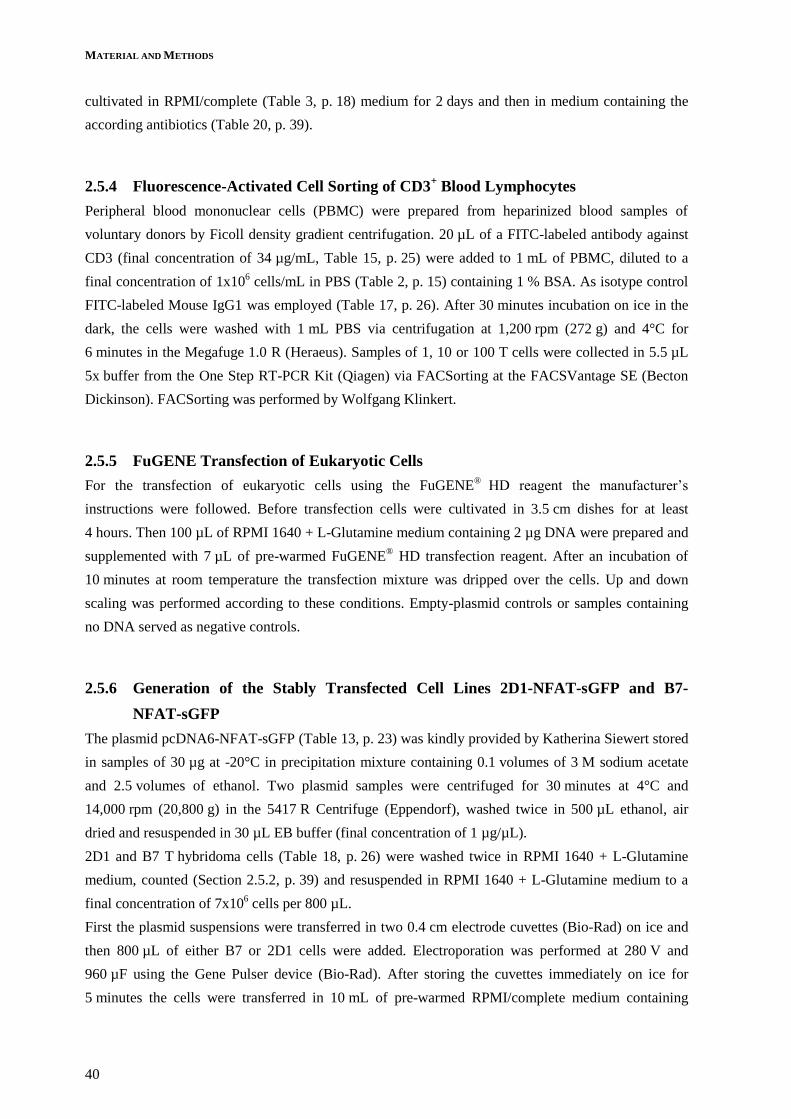
MATERIAL AND METHODS
40
cultivated in RPMI/complete (Table 3, p. 18) medium for 2 days and then in medium containing the
according antibiotics (Table 20, p. 39).
2.5.4 Fluorescence-Activated Cell Sorting of CD3+ Blood Lymphocytes
Peripheral blood mononuclear cells (PBMC) were prepared from heparinized blood samples of
voluntary donors by Ficoll density gradient centrifugation. 20 µL of a FITC-labeled antibody against
CD3 (final concentration of 34 µg/mL, Table 15, p. 25) were added to 1 mL of PBMC, diluted to a
final concentration of 1x10⁶ cells/mL in PBS (Table 2, p. 15) containing 1 % BSA. As isotype control
FITC-labeled Mouse IgG1 was employed (Table 17, p. 26). After 30 minutes incubation on ice in the
dark, the cells were washed with 1 mL PBS via centrifugation at 1,200 rpm (272 g) and 4°C for
6 minutes in the Megafuge 1.0 R (Heraeus). Samples of 1, 10 or 100 T cells were collected in 5.5 µL
5x buffer from the One Step RT-PCR Kit (Qiagen) via FACSorting at the FACSVantage SE (Becton
Dickinson). FACSorting was performed by Wolfgang Klinkert.
2.5.5 FuGENE Transfection of Eukaryotic Cells
For the transfection of eukaryotic cells using the FuGENE®
HD reagent the manufacturer’s
instructions were followed. Before transfection cells were cultivated in 3.5 cm dishes for at least
4 hours. Then 100 µL of RPMI 1640 + L-Glutamine medium containing 2 µg DNA were prepared and
supplemented with 7 µL of pre-warmed FuGENE® HD transfection reagent. After an incubation of
10 minutes at room temperature the transfection mixture was dripped over the cells. Up and down
scaling was performed according to these conditions. Empty-plasmid controls or samples containing
no DNA served as negative controls.
2.5.6 Generation of the Stably Transfected Cell Lines 2D1-NFAT-sGFP and B7-
NFAT-sGFP
The plasmid pcDNA6-NFAT-sGFP (Table 13, p. 23) was kindly provided by Katherina Siewert stored
in samples of 30 µg at -20°C in precipitation mixture containing 0.1 volumes of 3 M sodium acetate
and 2.5 volumes of ethanol. Two plasmid samples were centrifuged for 30 minutes at 4°C and
14,000 rpm (20,800 g) in the 5417 R Centrifuge (Eppendorf), washed twice in 500 µL ethanol, air
dried and resuspended in 30 µL EB buffer (final concentration of 1 µg/µL).
2D1 and B7 T hybridoma cells (Table 18, p. 26) were washed twice in RPMI 1640 + L-Glutamine
medium, counted (Section 2.5.2, p. 39) and resuspended in RPMI 1640 + L-Glutamine medium to a
final concentration of 7x10⁶ cells per 800 µL.
First the plasmid suspensions were transferred in two 0.4 cm electrode cuvettes (Bio-Rad) on ice and
then 800 µL of either B7 or 2D1 cells were added. Electroporation was performed at 280 V and
960 µF using the Gene Pulser device (Bio-Rad). After storing the cuvettes immediately on ice for
5 minutes the cells were transferred in 10 mL of pre-warmed RPMI/complete medium containing

MATERIALS AND METHODS
41
0.8 mg/mL G418 (Table 20, p. 39). After leaving the cells at room temperature for 30 minutes they
were incubated in total volumes of 30 mL in T75 cell culture flasks.
The next day the transfected cells were each separately cultivated in 48 wells of 24-well plates in
RPMI/complete medium containing 0.8 mg/mL G418 and 2, 4 or 6 µg/mL blasticidin (Table 20, p. 39).
To prevent evaporation of the medium the plates were stacked and wrapped in cling film. After
10 days grown single clones were isolated from wells containing 4 or 6 µg/mL blasticidin and further
cultivated in 24-well plates in 1.5 mL RPMI/complete medium with 0.8 mg/mL G418 and 3 µg/mL
blasticidin (Table 20, p. 39).
CD3 activation was performed from one tenth of each grown clone after 3 days (Section 2.5.8, p. 43).
Clones that appeared green under the microscope (Section 2.5.9, p. 43) were analyzed by flow
cytometry (Section 2.5.10, p. 43). The best clones were further cultivated in continuously greater
volumes.
2.5.7 Generation of the Stably Transfected Cell Line COS-7-A3
The pRSV plasmid (Long et al., 1991) contains an SV40 origin of replication (ori) which allows
replication in T antigen producing COS-7 cells. The plasmid pRSV-HLA-A3 (Table 13, p. 23) was
kindly provided by Klaus Dornmair and purified by Geraldine Rühl. For stable transfection of COS-7
cells the HLA-A*0301 DNA fragment had to be inserted into the non-replicating plasmid backbone
pHSE’-neo-B8 (Pircher et al., 1989, Table 13, p. 23). That would leave more replication capacity for
later co-transfection with SV40 ori containing PECP library plasmids. Katherina Siewert kindly
provided the backbone, which was digested with BamHI and SalI as well as dephosphorylated.
To obtain HLA-A*0301 DNA fragments pRSV-HLA-A3 plasmids were digested with the restriction
enzymes BamHI and SalI (New England Biolabs) for 1 hour at 37°C:
Volume Reagent Final Concentration
2 µL pRSV-HLA-A3 plasmid 5 µg
5 µL NEB buffer 4 (10x) 1x
1 µL BamHI-HF (20,000 U/mL) 20 U
1 µL SalI-HF (20,000 U/mL) 20 U
ad 50 µL H2O/DEPC
The whole reaction volume was loaded on an agarose gel (Section 2.2.5, p. 30) and the digested HLA-
A*0301 DNA fragment with the length of 1.1 kb was isolated using the MinElute Gel Extraction Kit
(Qiagen) according to the manufacturer’s description with elution in 12 µL of EB buffer. DNA
concentration was determined (Section 2.2.2, p. 28).
The backbone plasmid pHSE’-neo-B8 and the HLA-A*0301 DNA fragments were ligated for at least
30 minutes at room temperature according to the following setup:

MATERIAL AND METHODS
42
Volume Reagent Final Concentration
x µL HLA-A*0301 DNA fragments 25 ng
x µL pHSE’-neo-B8 backbone plasmid 50 ng
4 µL 5x T4 ligase buffer 1x
1 µL T4 Ligase (1 U/µL) 1 U
ad 20 µL H2O/DEPC
As negative control one sample containing H2O/DEPC instead of HLA-A*0301 DNA fragments was
prepared. 2 µL of the ligation mix were transformed into the E. coli strain One Shot® TOP10 (Section
2.4.4, p. 37). The next day 5 clones were picked and grown in suspension. Plasmid purification was
performed and sequenced with the primers pHSE3’-for (3’-CGC AGC CCG CAG AAC TCA
GAA-5’) and pHSE3’-rev (3’-AAA ACA TCA AGG GTC CCA TA-5’). DNA concentration was
determined (Section 2.2.2, p. 28) and glycerol stocks were prepared from 1 mL of 2 colonies (Section
2.4.3, p. 37).
As transfection with linearized plasmids might render better stable transfectants pHSE3’-HLA-A3
plasmids were linearized from two colonies using the restriction enzyme AatII (New England Biolabs)
according to the following setup:
Volume Reagent Final Concentration
x µL pHSE3’-HLA-A3 plasmid 2 µg
2 µL NEB buffer 4 (10x) 1x
1 µL AatII (20,000 U/mL) 20 U
ad 20 µL H2O/DEPC
Linearized as well as supercoiled plasmids of these two colonies were precipitated by adding
0.1 volumes of 3 M sodium acetate and 2.5 volumes of ethanol, incubation for at least 30 minutes
at -80°C and centrifugation for 1 hour at 4°C and 14,000 rpm (20,800 g) in the 5417 R Centrifuge
(Eppendorf). After discarding the supernatant the pellet was washed twice with 500 µL 70 % ethanol,
air-dried and resuspended in 10 µL of EB buffer. DNA concentration was determined (Section 2.2.2,
p. 28).
In 4 wells of a 24-well plate each 150,000 COS-7 cells were cultured (Section 2.5.1, p. 38) and
transfected with either supercoiled or linearized pHSE3’-HLA-A3 plasmids using the FuGENE®
transfection reagent (Section 2.5.5, p. 40). One additional well served as negative control.
After cultivation for 48 hours the transfected and non-transfected cells were singularized (Section
2.5.1, p. 38) and further cultivated in each 16 wells of 24-well plates containing 1.5 mL
RPMI/complete medium with 3, 5 and 7 mg/mL G418 (Table 20, p. 39). To prevent evaporation of the
medium the plates were stacked and wrapped in cling film. After 10 days, single clones were isolated
and further cultivated in 1.5 mL RPMI/complete medium with 1.5 mg/mL G418 (Table 20, p. 39).
To verify the expression of HLA-A3 molecules one tenth of the best grown clones were resuspended
in 100 µL of RPMI/complete medium (Table 3, p. 18), transferred in single wells of a 96-well plate
and cultivated for 3 hours. Next 1 µL of PLP45-53 peptide (Table 14, p. 24) was loaded onto the cells,
which is known to be presented on HLA-A3 and recognized by the TCR 2D1. After 3 hours to each

MATERIALS AND METHODS
43
well 30,000 of 2D1-NFAT-sGFP T hybridoma cells (Table 18, p. 26) in 50 µL of RPMI/complete
medium (Table 3, p. 18) were added. The next day expression of sGFP was analyzed under the
fluorescence microscope Axiovert 200M (Section 2.5.9, p. 43). The best clones of the original 24-well
plate were further cultivated in continuously greater volumes.
2.5.8 CD3 Activation of NFAT-sGFP T Hybridoma Cells
First the surface of different plates for cell cultures was coated with 1:500 in PBS diluted antibody
against mouse CD3e (Table 15, p. 25) for 3 hours at 37°C. Then the supernatant was removed and
NFAT-sGFP expressing T hybridoma cells were added (Section 2.5.6, p. 40). The next day sGFP
expression in activated T hybridoma cells was analyzed at the fluorescence microscope (Section 2.5.9,
p. 43) or by flow cytometry (Section 2.5.10, p. 43).
2.5.9 Fluorescence Microscopy for Detection of sGFP Expression in Eukaryotic Cells
Activated NFAT-sGFP expressing T hybridoma cells (Section 2.5.6, p. 40) were analyzed at the
inverse fluorescence microscope AxioVert 200M (Zeiss). The expression of sGFP with an emission at
498/516 nm was detected with different Zeiss objectives (5x, NA 0.15; ∞/0, Epiplan-NEOFLUAR;
10x, NA 0.45 Plan Apochromat; 20x, NA 0.4; ∞/0-1.5 Achroplan, Korr Ph2), the CCD-camera
CoolSNAP-HQ (Roper Scientific) and the fluorescence lamp HXP 120 (Visitron). To counter-check
for autofluorescence a Cy3-filter (excitation/emission: 545(25)/605(70) nm, Zeiss) and to detect the
sGFP expression a GFP-filter (excitation/emission at 472(30)/520(35) nm, BrightLine (Semrock,
Rochester, USA)) were used. Light microscopy was performed with phase contrast illumination while
the illumination times were 600 ms for the 5x and 20x objectives and 100 ms for the 10x objective.
Pictures were taken in all three channels using the software “MetaMorph V6.3r6” from Visitron
(Puchheim, D) and edited using the software “ImageJ 1.45s”(Wayne Rasband, National Institutes of
Health, USA).
2.5.10 Flow Cytometry Analysis of sGFP Expression in Eukaryotic Cells
In single wells of a 96-well point button plate 1x10⁵ to 1x10
6 cells were distributed (for cell counting
Section 2.5.2, p. 39) and washed twice with 200 µL PBS (Table 2, p. 15). Next the cells were
resuspended in 200 µL FACS buffer (Table 3, p. 18) containing 2 µg/mL of the dead cell stain
ToPro-3 Iodide. 10,000 cells per sample were analyzed at the FACSCalibur device with excitation
lasers for 488 nm and 633 nm. The data were analyzed using the software CellQuest V3.3 (Becton
Dickinson) or FlowJo V7.6 (Tree Star, Ashland USA)
2.5.11 Flow Cytometry Analysis of HLA-A2 Expression
In single wells of a 96-well point button plate 1x10⁵ to 1x10
6 cells (for cell counting Section 2.5.2,
p. 39) were distributed and washed twice with 200 µL PBS (Table 2, p. 15). The cells were stained for

MATERIAL AND METHODS
44
30 minutes on ice with either the FITC-conjugated antibody against HLA-A2 (Table 15, p. 25) or the
FITC-conjugated isotype control (Table 17, p. 26) diluted 1:50 in FACS buffer (Table 3, p. 18). Next
the cells were resuspended in 200 µL FACS buffer containing 0.17 µM of the dead cell stain ToPro-3
Iodide. 10,000 cells per sample were analyzed at the FACSVerse (BD Biosciences) with excitation
lasers for 488 nm and 633 nm. The data were analyzed using the software FACSuite Version
1.0.4.2650 (BD Biosciences) and FlowJo V7.6 (Tree Star).
2.6 Analysis of Peptides and Proteins
2.6.1 Determination of Protein Concentration
Quick determination of protein concentration was performed at the spectrophotometer Nanodrop ND-
1000 (Thermo Fisher Scientific) with the software “ND-1000 V3.2.1” according to the user manual at
a wavelength of 280 nm. Final concentration was determined by multiplying the proteins molecular
weight with the quotient of Nanodrop data and the extinction coefficient given by
http://web.expasy.org/protparam/.
For determination of concrete protein concentration the Pierce® BCA Protein Assay Kit (Thermo
Fisher Scientific) was employed according to the manufacturer’s instructions. Right before use one
tablet of Complete Protease Inhibitors (Roche) was added to 50 mL of RIPA buffer (Table 2, p. 15).
Protein probes were measured in diluted series. Plates were analyzed at 540 nm wavelength with the
VICTOR² 1420 Multilabel Counter (Perkin Elmer).
2.6.2 Peptide and Protein Lyophilization
For longtime storage peptides and proteins were lyophilized using the Scan Speed 40 centrifuge for
speed vacuum concentration (Labogene, Lynge, DK). Lyophilization occurred after approximately 2
to 3 hours of centrifugation at 2,000 rpm and 37°C. In some cases centrifugation over night was
necessary.
2.6.3 Mass Spectrometry of Peptides and Proteins
For rough sequence confirmation of proteins matrix-assisted laser desorption ionization - time of flight
mass spectrometry (MALDI-TOF-MS) was performed. Probes were prepared from Coomassie-stained
SDS polyacrylamide gels (Section 2.6.4, p. 44) and measured by Reinhard Mentele (Max Planck
Institute of Biochemistry, Martinsried, D).
Peptide sequences were determined by electrospray ionization mass spectrometry (ESI-MS) by Peer-
Hendrik Kuhn (German Center of Neurodegenerative Diseases, Munich, D).
2.6.4 SDS Polyacrylamide Gel Electrophoresis
For protein analysis SDS polyacrylamide gel electrophoresis (SDS-PAGE) was performed. Under
reducing conditions samples were mixed with 3x reducing SDS loading buffer (Table 2, p. 15) and
MATERIALS AND METHODS
45
incubated at 95°C for 5 minutes. Under non-reducing conditions, samples were mixed with 5x SDS
loading buffer (Table 2, p. 15). After 3 minutes of centrifugation at 14,000 rpm (20,800 g) in the
5417 R Centrifuge (Eppendorf) up to 20 µL were loaded onto ready-to-use SDS gels.
For Novex® 4-20 % Tris-Glycine Mini Gels (Invitrogen) electrophoresis was performed in a “Mighty
Small” device (Hoefer, San Francisco, USA) with SDS running buffer (Table 2, p. 15) for 90 minutes
at 120 V. Either the molecular weight standard Wide Range Sigma MarkerTM
or the Sigma Full Range
RainbowTM
Marker when subsequent Western Blot analysis should be performed (Section 2.6.5, p. 45)
were used.
For Novex® NuPAGE 12 % Bis-Tris Gels (Life Technologies) electrophoresis was performed in a
Mighty Small device with 1x NuPAGE® MOPS SDS running buffer (Life Technologies) for
60 minutes and 150 V. As molecular weight standard the See Blue® Plus 2 Prestained Standard (Life
Technologies) was employed.
After running the gels they were either blotted (Section 2.6.5, p. 45) or directly swiveled in Coomassie
staining solution for 30 minutes. Subsequently unspecific background staining was removed through
washing in destaining solution for 1 hour (solutions see Table 2, p. 15). To gain even clearer stainings,
the gels were swiveled over night at 4°C in 10 % acidic acid. SDS gels were shrink-wrapped and
stored at 4°C.
For low amounts of protein silverstaining according to Shevchenko et al. (1996) was performed.
Coomassie-stained SDS gels were shaken for 10 minutes each first in 50 % methanol supplemented
with 5 % acidic acid, second in 50 % methanol and third in H2O. After 1 minute of incubation in
0.02 % sodium thiosulfate the gel was washed three times for 1 minute in H2O. Next the gel was
shaken for 20 minutes in pre-cooled 0.1 % silver nitrate at 4°C. After washing twice for 1 minute in
H2O the staining was developed in freshly prepared 2 % sodium carbonate supplemented with 0.04 %
formaldehyde. The staining reaction was stopped with 5 % acidic acid.
2.6.5 Western Blot
During Western Blot analysis proteins were transferred electrophoretically from SDS gels onto PVDF
membranes for detection of specific proteins. Buffers are listed in Table 2 (p. 15).
An 8.5x8.5 cm square of PVDF membrane (HybondTM
-P, GE Healthcare) was activated in methanol
and rinsed in H2O. In a semi-dry apparatus the following layers from bottom (anode) to top (cathode)
were placed: two 9x9 cm squares of anode buffer-soaked Whatman paper (GE Healthcare), the
activated 8.5x8.5 cm square of PVDF membrane, the SDS gel (Section 2.6.4, p. 44) and two 9x9 cm
squares of cathode buffer-soaked Whatman paper. During 3 hours of electrophoresis at 35 mA per gel
proteins, that are surrounded by negatively charged SDS, were transferred onto the positively charged
PVDF membrane.
Subsequently the SDS gel was stained with Coomassie (Section 2.6.4, p. 44). The PVDF membrane
was shaken for 1 hour at room temperature or over night at 4°C in Western Blot blocking buffer. After
rinsing the blocking buffer, the membrane was stained for 1 hour with a protein-specific primary
antibody diluted in Western Blot blocking buffer. After 3x washing for 5 minutes in 0.05 %

MATERIAL AND METHODS
46
Tween-20/PBS the membrane was incubated for 1 hour with a secondary HRP-conjugated antibody
diluted in Western Blot blocking buffer. Next the membrane was washed 3x for 5 minutes in 0.05 %
Tween-20/PBS and placed on a piece of cling film. The membrane was covered with 10 mL enhanced
chemiluminescence-A (ECL-A) solution complemented with 100 µL of ECL-B solution and 3.1 µL of
H2O2. After rinsing the membrane was placed in a film cassette and developed on an Amersham
HyperfilmTM ECL high performance chemiluminescence film at the x-ray developer machine
OPTIMAX® (Protec, Oberstenfeld, D).
2.6.6 Coupling of IgG Antibodies to Protein G Dynabeads
For the purification of HLA-A2 molecules from cell lysates the anti-HLA-A2 antibody BB7.2 (Table
15, p. 25) was coupled to Protein G Dynabeads (Life Technologies).
After washing 3 mL (= 90 mg) of Protein G Dynabeads with 10 mL PBS (Table 2, p. 15) 720 µL (=
720 µg) anti-HLA-A2 antibody were added in a total amount of 10 mL PBS. The antibody was bound
to Protein G during 1 hour of incubation at room temperature with shaking. Next the Dynabeads were
washed once with 10 mL PBS and twice with Dynabead conjugation buffer (Table 2, p. 15) and
coupled chemically to the antibody shaking for 30 minutes at room temperature in 12.6 mL Dynabead
conjugation buffer containing 5 mM bis(sulfsuccinimidyl)suberate (BS³). After washing the
Dynabeads once in 10 mL of Dynabead conjugation buffer the coupling was repeated with fresh
12.6 mL of conjugation buffer containing 5 mM BS³. The reaction was stopped by adding 600 µL 1 M
Tris-HCl (pH 7.5). After washing the coupled Dynabeads three times with PBS they were stored at
4°C.
2.6.7 Preparation of Proteins from Eukaryotic Cell Lines
In each two wells of 6-well plates 500,000 COS-7-A2 cells were seeded (Table 18, p. 26) and
transfected with pcDNA6-DMXL2748-926-V5, pcDNA6-EML5897-1038-V5, pcDNA6-GPCPD11-118-V5,
pcDNA6-NCAN156-359-V5 or empty pcDNA6/Vh-HisA plasmids (Section 2.3.3, p. 33) using the
FuGENE® transfection reagent (Section 2.5.5, p. 40). After 24 and 48 hours one well each was
singularized and centrifuged for 6 minutes at 1,200 rpm (272 g) and 10°C in the centrifuge Heraeus®
Megafuge 1.0 R. The supernatants were removed and the cell pellets frozen at -20°C.
As lysis buffer one tablet Complete Protease Inhibitors (Roche) was solved in 50 mL PBS and stored
in aliquots of 500 µL at -20°C. After thawing the cell pellets were resuspended in 500 µL of
PBS/Complete, transferred in protein low-binding 1.5 mL reaction tubes (Eppendorf) and disrupted
with 30 ultrasound pulses using the Sonifier 450 (Branson). Subsequently all samples were centrifuged
for 30 minutes at 14,000 rpm (20,800 g) and 4°C in the 5417 R Centrifuge (Eppendorf). The
supernatants were transferred in new protein low-binding 1.5 mL reaction tubes. Pellets and
supernatants were stored at -20°C for further experiments.

MATERIALS AND METHODS
47
2.6.8 Preparation of Peptides Presented on HLA-A2 by ConA 4B Chromatography
Peptides presented on HLA-A2 molecules were obtained from EBV-transducted B cells (Table 18,
p. 26). EBV-16488 and EBV-17490 cells express human HLA-A2, EBV-FE cells served as negative
control. All buffers are given in Table 2, p. 15.
1.5 x 10⁹ of each EBV cell line were collected in PBS containing 0.05 % EDTA and stored at -20°C
until further analysis. Cells were thawed on ice and washed twice with 20 mL PBS by centrifugation
for 6 minutes and 1,200 rpm (272 g) at 4°C in the centrifuge Heraeus® Megafuge 1.0 R. After lysis in
100 mL of EBV lysis buffer freshly supplemented with two tablets of Complete protease inhibitors
(Roche) for 30 minutes at 4°C the cells were centrifuged for 5 minutes at 4°C and 300 g in the Avanti®
J-26 XP Centrifuge (Beckman Coulter) using the JA-10 rotor. The supernatants were transferred in
38.5 mL Ultra-ClearTM
tubes (Beckman Coulter) and centrifuged for 30 minutes at 150,000 g and 4°C
in the OPTIMA XE90 ultracentrifuge (Beckman Coulter).
After filtration of the supernatants through 45 µm filter units the contents of 1 mL HiTrapTM ConA
4B columns, 1 mM MnCl2 and 1 mM CaCl2 were added. To allow sufficient binding of glycosylated
proteins in the batch procedure the suspensions of beads and samples were shaken on ice at 4°C for
1 hour. Following centrifugation for 5 minutes at 4°C and 1,200 rpm (272 g) in the centrifuge
Heraeus® Megafuge 1.0 R the HiTrapTM ConA 4B column material was washed three times with
10 mL of EBV binding buffer freshly supplemented with Complete protease inhibitors (Roche). After
centrifugation for 10 minutes at 1,200 rpm (272 g) and 4°C in the centrifuge Heraeus® Megafuge
1.0 R bound glycosylated proteins were eluted for 5 minutes in 2 mL EBV elution buffer freshly
supplemented with Complete protease inhibitors (Roche). Centrifugation and elution were repeated,
the total amount of 4 mL eluate was pooled and incubated with 1 mL (= 30 mg) anti-HLA-A2-coupled
Protein G Dynabeads® (Section 2.6.6, p. 46) for 1 hour at room temperature.
The Dynabeads were washed 3x with 6 mL EBV elution buffer, twice with 6 mL PBS containing
2 mM dodecylmaltoside, twice with PBS and 11x with H2O. The HLA-A2 alpha chain, the β2-
microglobulin and the bound peptides were denatured and eluted for 30 minutes in 2 mL of 0.2 %
formic acid. The eluates were filtered for 90 minutes in 3 K Amicon® Ultra centrifugal filters
(Millipore). The peptide-containing flow-through was additionally filtered through 0.22 µm filter units
and 100 µL were cleaned using 0.5 mL Pierce® Detergent Removal spin columns according to the
manufacturer’s instructions with PBS as washing reagent.
All steps of the HLA-A2 purification were monitored by SDS-PAGE (Section 2.6.4, p. 44) and
subsequent HLA-A2-specific western blot analysis (Section 2.6.5, p. 45). The peptides were analyzed
by ESI mass spectrometry (Section 2.6.3, p. 44).
2.6.9 Preparation of Peptides Presented on HLA-A2 by Lentil-Lectin Chromatography
Peptides presented on HLA-A2 molecules were obtained from EBV-transducted B cells (Table 18,
p. 26). EBV-16488 and EBV-17490 cells express human HLA-A2, EBV-FE cells served as negative
control. All buffers are given in Table 2, p. 15.
MATERIAL AND METHODS
48
1.5 x 10⁹ of each EBV cell line were collected in PBS containing 0.05 % EDTA and stored at -20°C
until further analysis. Cells were thawed on ice and washed twice with 20 mL PBS by centrifugation
for 6 minutes and 1,200 rpm (272 g) at 4°C in the centrifuge Heraeus® Megafuge 1.0 R. After washing
the pellets in 20 mL of lentil lectin equilibration buffer they were resuspended in 20 mL of lentil lectin
lysis buffer freshly supplemented with Complete protease inhibitors (Roche) and disrupted for
15 minutes on ice with ultrasound pulses using the Sonifier 450 (Branson). The lysates were
centrifuged for 5 minutes at 4°C and 300 g in the Avanti® J-26 XP Centrifuge (Beckman Coulter)
using the JA-10 rotor. The supernatants were transferred in 38.5 mL Ultra-ClearTM
tubes (Beckman
Coulter) and centrifuged for 30 minutes at 150,000 g and 4°C in the OPTIMA XE90 ultracentrifuge
(Beckman Coulter).
After filtration of the supernatants through 45 µm filter units they were loaded with a flow rate of
1 mL/min onto 1.5 x 10 cm Luer-Lock columns with flow adapters (Sigma-Aldrich) containing 1 mL
lentil lectin agarose that were equilibrated with lentil lectin equilibration buffer and lentil lectin lysis
buffer. The columns were washed with 15 mL of lentil lectin wash buffer freshly supplemented with
Complete protease inhibitors (Roche). Glycosilated proteins were eluted in 4 mL of lentil lectin
elution buffer and incubated with 1 mL (= 30 mg) anti-HLA-A2-coupled Protein G Dynabeads®
(Section 2.6.6, p. 46) for 1 hour at room temperature.
Dynabeads were washed twice with 6 mL of lentil lectin elution buffer and 4x with H2O. The HLA-A2
alpha chain, the β2-microglobulin and the bound peptides were denatured and eluted for 30 minutes in
2 mL of 0.2 % formic acid. The eluates were filtered for 60 minutes in 3 K Amicon® Ultra centrifugal
filters (Millipore). The peptide-containing flow-through was additionally filtered through 0.22 µm
filter units and 100 µL were cleaned using 0.5 mL Pierce® Detergent Removal spin columns according
to the manufacturer’s instructions with PBS as washing reagent.
All steps of the HLA-A2 purification were monitored by SDS-PAGE (Section 2.6.4, p. 44) and
subsequent HLA-A2-specific western blot analysis (Section 2.6.5, p. 45). The peptides were analyzed
by ESI mass spectrometry (Section 2.6.3, p. 44).
2.6.10 Production and Purification of Soluble Proteins in E. coli
Truncated protein His6-DMXL2748-926-V5-, His6-EML5897-1038-V5-, His6-GPCPD11-118-V5- and His6-
NCAN156-359-V5-coding bacteria and bacteria carrying empty pQE-30 plasmids (Section 2.3.4, p. 35)
were grown over night in 400 mL of LBamp
medium (Table 3, p. 18) containing 1 % glucose. Transport
of glucose into the bacterial cell blocks activity of the lac operon.
To remove the glucose, bacteria were centrifuged for 10 minutes at 4,000 rpm (2,844 g) and 4°C in the
Avanti® J-26 XP Centrifuge (Beckman Coulter) using the JA-10 rotor. The pellet was resuspended in
2 L LB medium and grown to an OD at 600 nm of 0.4 to 0.6. Protein production was induced by
adding 1 mM isopropyl β-D-1-thiogalactopyranoside (IPTG). After 4 hours the 2 L of bacteria culture
were centrifuged for 10 minutes at 4,000 rpm (2,844 g) and 4°C in the Avanti® J-26 XP Centrifuge
(Beckman Coulter) using the JA-10 rotor. Bacterial pellets were transferred into 50 mL reaction tubes,
weighed and stored at -20°C.

MATERIALS AND METHODS
49
Soluble proteins containing a His6 tag were purified by nickel chelate affinity chromatography
according to the QIAexpressionistTM
system of Qiagen. All steps in solutions containing 6 M urea
were performed at room temperature. Buffers are given in Table 2 (p. 15).
About 3.3 g of bacterial pellet were thawed, resuspended in 100 mL of urea lysis buffer and disrupted
for 15 minutes with ultrasound pulses using the Sonifier 450 (Branson). The lysate was centrifuged for
1 hour at 10,000 g and 20°C in the Avanti® J-26 XP Centrifuge (Beckman Coulter) using the JA-10
rotor. Pellets were stored at -20°C and the target protein-containing supernatant was loaded with a
flow rate of 1 to 1.5 mL/min onto 5 mL Ni-NTA agarose in 1.5 x 10 cm Luer-Lock columns with flow
adapters (Sigma-Aldrich). Imidazol in the urea lysis buffer should block unspecific binding of proteins
to the Ni-NTA agarose. Columns were washed with 50 mL urea wash buffer.
The truncated proteins His6-DMXL2748-926-V5, His6-EML5897-1038-V5, His6-GPCPD11-118-V5 and His6-
NCAN156-359-V5 as well as the negative control from bacteria carrying the empty pQE-30 plasmid
were eluted from the Ni-NTA columns at a fast protein liquid chromatography (FPLC) system. It
contains a LCC-501 Plus controller that operates two pumps and an Uvicord SD UV-detector
monitoring protein elution at 277 nm. Both pumps were first flushed with H2O and then loaded with
urea wash buffer and urea elution buffer. One Ni-NTA column was connected and washed with urea
wash buffer until no more unspecific proteins were detected. Then the truncated protein His6-
DMXL2748-926-V5, His6-EML5897-1038-V5, His6-GPCPD11-118-V5 and His6-NCAN156-359-V5 or the
negative control from bacteria carrying the empty pQE-30 plasmid were eluted with urea elution
buffer.
The protein peaks were collected, concentrated in Ultracel® 10 K Amicon
® Ultra Centrifugal Filters
(Millipore) to an amount of 3 mL and dialyzed against H2O over night in Novagen® D-Tube
TM
Dialyzer Maxi 3.5 kDa tubes (EMD Chemicals, San Diego, USA). Protein purity was analyzed by
SDS-PAGE (Section 2.6.4, p. 44) and the dialyzed samples were lyophilized (Section 2.6.2, p. 44).
Protein amount was determined using the Pierce® BCA Protein Assay Kit (Section 2.6.1, p. 44).
2.6.11 Production and Purification of the HLA-A2 alpha Chain in E. coli
Production and purification of the inclusion body (IB)-forming HLA-A2 alpha chain was performed
according to the protocols in Altman and Davis (2003) and Nagai and Thøgersen (1987). All buffers
are given in Table 2 (p. 15).
Geraldine Rühl kindly provided BL21(DE3) E. coli bacteria transformed with pET21c(+) plasmid
coding for the avidin tagged HLA-A2 alpha chain. Bacteria were pre-cultured at 37°C over night in
100 mL LBamp
medium (Table 3, p. 18) containing 1% glucose. Transport of glucose into the bacterial
cell blocks activity of the lac operon.
To remove the glucose 60 mL of the pre-culture were centrifuged for 5 minutes at 4,000 rpm (2,844 g)
in the centrifuge Heraeus® Megafuge 1.0 R and resuspended in 3 L of LB
amp medium. After 3 to
4 hours the cells reached an OD of 0.6 to 1.0 at 600 nm and protein production was induced by adding
0.4 mM IPTG. After additional 4 hours of incubation the cells were centrifuged for 30 minutes at

MATERIAL AND METHODS
50
4,000 rpm (2,844 g) and 4°C in the Avanti® J-26 XP Centrifuge (Beckman Coulter) using the JA-10
rotor. Bacterial pellets were transferred into 50 mL reaction tubes, weighed and stored at -80°C.
Cells (approximately 10 g) were thawed on ice and suspended in 12 mL of IB lysis buffer freshly
supplemented with 20 mg of lysozyme. After incubation for 30 minutes on ice MgCl2, MnCl2 and
DNase I were added to final concentrations of 10 mM, 1 mM and 10 µg/mL respectively. After
incubation for 30 minutes on ice 20 mL of IB detergent buffer were added. The lysated cells were
centrifuged twice for 10 minutes at 5,000 g in the Avanti® J-26 XP Centrifuge (Beckman Coulter)
using the JA-10 rotor. The supernatant was removed and the pellet washed three times in 20 mL of IB
wash buffer by centrifugation for 10 minutes at 5,000 g in the Avanti® J-26 XP Centrifuge (Beckman
Coulter) using the JA-10 rotor.
Pellets were resuspended in 15 mL urea solution. After centrifugation of the solubilized IBs for
30 minutes at 150,000 g and 20°C in the OPTIMA XE90 ultracentrifuge (Beckman Coulter) and
38.5 mL Ultra-ClearTM
tubes (Beckman Coulter) the supernatant was transferred into a 50 mL reaction
tube. Protein concentration was measured using the Nanodrop ND-1000 (Section 2.6.1, p. 44) and
aliquots of 1 mL were stored at -80°C.
2.6.12 Refolding of Peptide:HLA-A2 Complexes
Refolding of peptide:HLA-A2 complexes using the peptides TAX11-19 (LLFGYPVYV), DMXL2813-820
(LIGEVFNI), EML5/6997-1004 (MEGEVWGL), GPCPD115-22 (LPGEVFAI) and NCAN257-264
(LGGEVFYV) was performed as described in Altman and Davis (2003). All buffers are given in
Table 2 (p. 15).
5 mM reduced glutathione, 0.5 mM oxidized glutathione and 0.2 mM PMSF in 2-propanol were added
to folding buffer at 4°C. Vials of 620 ng HLA-A2 alpha chain (Section 2.6.11, p. 49) and 480 ng β2-
microglobulin (kindly provided by Geraldine Rühl) were thawn and filled up to 500 µL each by
adding injection buffer. 20 mL of freshly supplemented folding buffer were stirred at high speed and
4°C. 200 ng of peptide dissolved in 40 µL DMSO were added drop wise. Next 500 µL β2-
microglobulin followed by 500 µL HLA-A2 alpha chain were injected forcefully close to the stirring
rod. After 24 hours again 620 ng of HLA-A2 alpha chain were filled up to 500 µL with injection
buffer and injected forcefully. The refolding reactions were stirred at 4°C for 16 hours.
Subsequently the refolding reactions were transferred in 38.5 mL Ultra-ClearTM
tubes (Beckman
Coulter) and centrifuged for 1 hour at 4°C and 200,000 g in the OPTIMA XE90 ultracentrifuge
(Beckman Coulter). The supernatants were concentrated to a final volume of 1 mL in Ultracel® 10 K
Amicon® Ultra Centrifugal Filters (Millipore).
The refolded peptide:HLA-A2 complexes were dialyzed for 60 hours against 1 L of biotinylation
buffer using 4 Spectra/Por® Dialysis Membranes with a molecular weight cut-off of 12 to 14 kDa
(Spectrum Laboratories, Rancho Dominguez, USA). The dialyzed samples were concentrated to a
final volume of 150 µL using Ultracel® 10K Amicon
® Centrifugal Filters (Millipore) at 4°C.

MATERIALS AND METHODS
51
2.6.13 Enzymatic Biotinylation of Peptide:HLA-A2 Complexes
For enzymatic biotinylation of peptide:HLA-A2 complexes (Section 2.6.12, p. 50) the following setup
was incubated over night at room temperature:
Volume Reagent Final Concentration
100 µL 1 M Tris-HCl (pH 7.5) 100 mM
40 µL 5 M NaCl 200 mM
5 µL 1 M MgCl2 5 mM
4 µL 100 mM biotin in 200 mM Tris base 0.4 mM
50 µL 100 mM ATP 5 mM
2 µL 100 mM PMSF in 2-propanol 0.2 mM
100 µL Peptide:HLA-A2 complex
1.5 µL BirA500 Biotin-Protein Ligase (1 mg/mL)
ad 1 mL H2O
Precipitated material was removed via 15 minutes of centrifugation at 14,000 rpm (20,800 g) and 4°C
in the 5417 R Centrifuge (Eppendorf). The supernatants were concentrated to 100 µL in Ultracel®
10 K Amicon® Ultra Centrifugal Filters (Millipore). Finally the samples were washed six times in the
centrifugal concentrator by adding 100 µL of 20 mM Tris-HCl (pH 8.0).
2.7 Characterization of Potentially Autoaggressive T Cells from Frozen
Tissue Sections of MS Patient FE
TCR alpha- and beta-chains were generally designated according to IMGT nomenclature (Lefranc and
Lefranc, 2001) but the V segments were named according to Arden et al., 1995.
2.7.1 Establishment of Immunofluorescent Staining
For the establishment of immunofluorescent staining 10 µm tissue sections of tonsil and an inflamed
brain area of patient OIND-1 on glass slides (P.A.L.M. Microlaser Technologies) were employed. The
customized bovine serum albumin (BSA)-free antibody anti-CD8 beta (Table 15, p. 25) (Beckman
Coulter) was labeled with the Cy3TM
mAb Labeling Kit (Amersham, Freiburg, D) according to the
manufacturer’s instructions. Final concentration of labeled antibody was not determined.
Prior to staining, the slides were thawed, fixed 5 minutes in pre-cooled 100 % acetone and blocked at
room temperature for 5 minutes in PBS (Table 2, p. 15) containing 2 % BSA (Sigma-Aldrich) inside a
wet chamber. Subsequently the sections were incubated in a dark, wet chamber for 5 minutes in
100 µL of primary antibody (Table 15, p. 25) diluted in PBS, then rinsed with 2 mL of PBS and
incubated again in a dark, wet chamber for 5 minutes in 100 µL of secondary antibody (Table 16,
p. 26) diluted in PBS. Negative controls were incubated in 100 µL of secondary antibody (Table 16,
p. 26) diluted in PBS. After rinsing the slices again with 2 mL of PBS, one drop of “Fluorescent
Mounting Medium” (Dako) and a cover glass were applied. The stainings were analyzed under an
Axioplan 2 microscope (Zeiss).
MATERIAL AND METHODS
52
2.7.2 Laser Microdissection of Single Cells from Tissue Sections of MS Patient FE
All steps needed strict RNase-free conditions. Therefore the laser microdissection was performed in a
separate, UV-irradiated room, wearing protective clothing. The working surfaces and devices were
cleaned with RNase ZAP (Sigma-Aldrich), H2O/DEPC and 80 % ethanol before and after usage.
PET Membrane slides 1.0 (Zeiss) were prepared as described in Section 2.2.3 (p. 28) but were
incubated for 1 min in RNase ZAP and washed twice with H2O/DEPC between baking and coating.
10 µm thick cryostat sections from frozen tissue blocks of MS patient FE were mounted on the slides
and stored them at -80°C.
For laser microdissection the slides were thawed, dried 1 minute in vacuum and dipped shortly in pre-
cooled acetone. After rehydration with 100 µL PBS/DEPC (Table 2, p. 15) the slides were blocked
3 minutes in 100 µL PBS/DEPC containing 2 % BSA inside a wet chamber. Then the sections were
co-incubated for 5 minutes in a wet, dark chamber with a 1:100 diluted, Cy3-labeled antibody against
CD8 beta and either a 1:25 diluted, FITC-labeled antibody against TCR BV13S1, or a 1:25 diluted,
FITC-labeled antibody against TCR BV22, or a 1:100, diluted FITC-labeled antibody against CD134
(Table 15, p. 25). After washing with 1 mL of PBS/DEPC the slides were incubated for 3 minutes
inside a wet, dark chamber with the 1:100 diluted aFITC-Alexa488 antibody (Table 16, p. 26). Finally
the slides were washed with 1 mL of PBS/DEPC, covered with 300 µL 1-propanol and analyzed
immediately under the Axiovert 200M microscope (Zeiss).
Therefore the LD Plan-NEOFLUAR objective 40x/0.6 Korr, ∞/0-1.5 (Zeiss), the CCD-camera
CoolSNAP-HQ (Roper Scientific, Martinsried, D), the fluorescence lamp HXP 120 (Visitron,
Puchheim, D), the Robo Mover and the software “P.A.L.M. Robo Software V3.2.0.11” (P.A.L.M.
Microlaser Technologies) were employed.
After evaporation of the 1-propanol, cells that were either double positive for CD8 beta and
TCR BV13S1, TCR BV22 or CD134 or that were single positive for CD8 beta were marked and
catapulted by laser pressure into mineral oil coated lids of single 200 µL reaction tubes. Single isolated
cells were instantly stored on dry ice until reverse transcription PCR (RT-PCR) was performed
(Section 2.7.3, p. 52).
2.7.3 RT-PCR of TCR Alpha- and Beta Chains
Two different approaches were employed for either unbiased (microdissected CD8 beta single positive
or CD8 beta and CD134 double positive cells) or TCR-biased experiments (microdissected CD8 beta
and TCR BV13S1 as well as CD8 beta and TCR BV22 double positive cells). The One Step RT-PCR
kit (Qiagen) was used for both. Consecutively sets of six single isolated cells were transferred from
dry-ice on ice before adding the RT-PCR mix and then directly put into the pre-cooled centrifuge.
For the “unbiased approach” 12.5 µL of RT-PCR reaction mix containing 0.625 µM of the Cα-out and
Cβ-out primers (Table 4, p. 18) were added:

MATERIALS AND METHODS
53
Volume Reagent Final Concentration
2.5 µL 5x buffer 1x
1 µL dNTP-mix (10 mM each) 8 mM
0.078 µL Cα-out (100 µM) 0.625 µM
0.078 µL Cβ-out (100 µM) 0.625 µM
1 µL enzyme mix N/A
ad 12.5 µL RNase-free H2O
For the TCR-biased “clone-specific approach” 20 µL of RT-PCR reaction mix containing 0.625 µM of
the Cα-RT-imp and Cβ-RT-2 primers (Table 4, p. 18) were added:
Volume Reagent Final Concentration
4 µL 5x buffer 1x
0.8 µL dNTP-mix (10 mM each) 4 mM
0.125 µL Cα-RT-imp (100 µM) 0.625 µM
0.125 µL Cβ-RT-2 (100 µM) 0.625 µM
0.8 µL enzyme mix N/A
ad 20 µL RNase-free H2O
As microdissected cells stuck to the mineral oil coated lids of the reaction tubes (Section 2.7.2, p. 52),
RT-PCR mixes had to be added into the lids and centrifuged down for 5 minutes at 4°C and
14,000 rpm (20,800 g) in the 5417 R Centrifuge (Eppendorf). RT-PCR was performed for 35 minutes
at 50°C. Mineral oil-coated reaction tubes without microdissected cells served as negative control.
When RT-PCR was performed on FACS-sorted CD3+ blood lymphocytes (Section 2.5.4, p. 40) or
RNA samples, the volumes of the reaction mixes were adjusted to the mentioned final concentrations.
Later during the course of this thesis 0.2 U/µL of RNase OUTTM
Ribonuclease Inhibitor (Invitrogen)
were added into both RT-PCR reaction mixes for enhanced RNA preservation.
2.7.4 Basic Protocol of Clone Specific TCR Beta Chain PCR
Figure 7 (p. 54) gives an overview over all PCR steps of the TCR-biased “clone specific approach” to
characterize TCR beta chains.

MATERIAL AND METHODS
54
Figure 7: Relative positions of primers for the clone-specific amplification of TCR beta chains.
In the RT-PCR mRNA for TCR alpha- and beta-chains from single T cells was transcribed into cDNA via the primers Cα-
RT-imp and Cβ-RT-2 which bind in the C-regions. In the PCR 1 the TCR alpha- and beta-chains were pre-amplified. For the
TCR alpha chain a set of primers for all V alpha segments and the reverse primer Cα-out (closer to the J-segment) were used.
For the TCR beta chain the first pair of V beta- and J beta-specific primers was used (BV13S1-BJ2.3_for1 and BV13S1-
BJ2.3_rev1 or BV22-BJ2.1_for1 and BV22-BJ2.1_rev1).In the following nested PCRs (PCR 2 and PCR 3) we used the
primers BV13S1-BJ2.3_for2 and BV13S1-BJ2.3_rev2 or BV22-BJ2.1_for2 and BV22-BJ2.1_rev2 and the primers BV13S1-
BJ2.3_for3 and BV13S1-BJ2.3_rev3 or BV22-BJ2.1_for3 and BV22-BJ2.1_rev3 respectively. The third reverse primers
reached into the clone-specific NDN-region. (gray: AV, light blue: AN, orange: AJ, black: AC, light green: BV, dark blue:
BNDN, dark red: BJ, dark green: BC; figure modified from Backes, 2010)
A combined pre-amplification PCR (PCR 1 in Figure 7, p. 54) was performed for TCR alpha- and
beta-chains on the product from the TCR-biased RT-PCR (Section 2.7.3, p. 52). 5 µL of PCR mix
from the One Step RT-PCR kit (Qiagen) containing 0.6 µM Valpha primers (Vα-x-for-out in Table 7
(p. 20) and Seitz et al., 2006) and 0.6 µM of the primers Cα-rev-out, BV13S1-BJ2.3_for1 and
BV13S1-BJ2.3_rev1 or BV22-BJ2.1_for1 and BV22-BJ2.1_rev1 (Table 5, p. 18 and Table 7, p. 20),
respectively were added in the previous tubes to gain a final volume of 25 µL. A pre-mix of all the
Valpha primers called “Vα-mix” was prepared.
Volume Reagent Final Concentration
1 µL 5x buffer 1x
0.2 µL dNTP-mix (10 mM each) 4 mM
0.15 µL Cα-rev-out (100 µM) 0.6 µM
0.45 µL Vα-mix 0.062 µM each
0.15 µL BVx-BJx_for1 (100 µM) 0.6 µM
0.15 µL BVx-BJx_rev1 (100 µM) 0.6 µM
0.2 µL enzyme mix N/A
ad 5 µL RNase-free H2O
MATERIALS AND METHODS
55
Due to the huge amount of primers the pre-amplification PCR was performed as touch-down PCR in
the GeneAmp PCR System 9600 (Perkin Elmer) with the following conditions:
95°C 15 min
94°C 1 min denaturation
61°C 1 min hybridization 4 cycles
72°C 1 min elongation
94°C 1 min denaturation
58°C 1 min hybridization 4 cycles
72°C 1 min elongation
94°C 1 min denaturation
56°C 1 min hybridization 4 cycles
72°C 1 min elongation
94°C 1 min denaturation
53°C 1 min hybridization 30 cycles
72°C 1 min elongation
72°C 10 min
4°C ∞
Next followed two nested PCRs for the TCR beta chains (PCR 2 and PCR 3 in Figure 7, p. 54). For
the primers consult Table 5 (p. 18). Samples containing 1 µL of H2O/DEPC instead of previous PCR
product served as negative controls.
Volume Reagent Final Concentration
2 µL 10x PCR buffer 1x
0.2 µL dNTP-mix (10 mM each) 1 mM
0.1 µL BVx-BJx_for2 or BVx-BJx_for3 (100 µM) 0.5 µM
0.1 µL BVx-BJx_rev2 or BVx-BJx_rev3 (100 µM) 0.5 µM
0.3 µL Taq-DNA-Polymerase (5 U/µL) 1.5 U
1 µL product of previous PCR
ad 20 µL H2O/DEPC
The reactions were performed in the GeneAmp PCR System 9600 (Perkin Elmer) with the following
conditions:
94°C 2 min
94°C 1 min denaturation
53°C 1 min hybridization 40 cycles
72°C 1 min elongation
72°C 10 min
4°C ∞
The PCR products of PCR 2 and PCR 3 were analyzed by agarose gel electrophoresis (Section 2.2.5,
p. 30). Relevant bands were cut out, cleaned up with either the Easypure® DNA Purification kit

MATERIAL AND METHODS
56
(Biozym, 10 μL elution volume) or the QIAquick Gel Extraction kit (Qiagen, 30 μL elution volume)
and sent for sequencing (Section 2.2.6, p. 30) with a corresponding primer.
2.7.5 Basic Protocol of Unbiased TCR Beta Chain PCR
Figure 8 (p. 57) gives an overview over all PCR steps for the “unbiased approach” to characterize
TCR beta chains.
The multiplex PCR to pre-amplificate TCR alpha- and beta-chains (PCR 1, Figure 8, p. 57) was
performed directly after RT-PCR (Section 2.7.3, p. 52). 12.5 µL PCR mix from the OneStep RT-PCR
kit (Qiagen) containing 3 µM Valpha- and Vbeta primers (Vα-x-for-out in Table 7 (p. 20) and Seitz et
al., 2006, Vp-x in Table 6 (p. 19) and Kim et al., 2012) were added in the previous tubes to gain a final
volume of 25 µL. A pre-mix of all the primers called “V primers” was prepared.
Volume Reagent Final Concentration
2.5 µL 5x buffer 1x
0.5 µL dNTP-mix (10 mM each) 6 mM
0.6 µL V primers 0.3 µM each
0.5 µL enzyme mix N/A
ad 12.5 µL RNase-free H2O
The pre-amplification PCR was run as touch-down PCR in the PCR System 9600 (Perkin Elmer) due
to the amount of primers using the following conditions:
95°C 15 min
94°C 30 sec denaturation
60°C 1:30 min hybridization 10 cycles
68°C 1 min elongation
94°C 30 sec denaturation
53°C 1:30 min hybridization 30 cycles
68°C 1 min elongation
68°C 15 min
4°C ∞
The subsequent run-off PCR elongated the TCR beta chains for a 22 nucleotide “UP” segment (PCR 2,
Figure 8, p. 57). A mix of all elongated primers Vp-x+ (Table 6, p. 19) called “V
+-primers” was
prepared. The PCR was run in the GeneAmp PCR System 9600 (Perkin Elmer) for 2 minutes at 94°C,
2:30 minutes at 53°C and 15 minutes at 68°C. Samples containing 1 µL of H2O/DEPC instead of
previous PCR product served as negative controls.

MATERIALS AND METHODS
57
Figure 8: Relative positions of primers for the unbiased amplification of TCR beta chains.
In the RT-PCR mRNA for TCR alpha- and beta-chains from single T cells was transcribed into cDNA via the primers Cα-out
and Cβ-out which bind in the C-regions. In the PCR 1 the TCR alpha- and beta-chains were pre-amplified. For the TCR alpha
chain a set of primers for all AV segments and for the TCR beta chain a set of primers for all BV segments were used. No
further reversed primers were added. The run-off PCR 2 elongates the TCR beta chain fragments for a 22 nucleotide “UP”
sequence. In the PCR 3 TCR beta chains were amplified by the universal primer UP and the inner reverse primer Cβ-in.
(gray: AV, light blue: AN, orange: AJ, black: AC, light green: BV, dark blue: BNDN, dark red: BJ, dark green: BC; figure
modified from Backes, 2010)
Volume Reagent Final Concentration
2 µL 10x PCR buffer 1x
0.4 µL dNTP-mix (10 mM each) 2 mM
0.2 µL V+-primers 0.062 µM each
0.1 µL Taq-DNA-Polymerase (5 U/µL) 0.25 U
1 µL product of PCR 1
ad 20 µL H2O/DEPC
Finally the products of the run-off PCR were amplified in the PCR 3 (Figure 8, p. 57) with universal
primers. Samples containing 0.5 µL of H2O/DEPC instead of previous PCR product served as negative
controls.
Volume Reagent Final Concentration
2 µL 10x PCR buffer 1x
0.4 µL dNTP-mix (10 mM each) 2 mM
2 µL Cβ-in (10 µM) 1 µM
2 µL UP (10 µM) 1 µM
0.2 µL Taq-DNA-Polymerase (5 U/µL) 0.5 U
0.5 µL product of PCR 2
ad 20 µL H2O/DEPC

MATERIAL AND METHODS
58
The universal PCR 3 was run in the PCR System 9600 (Perkin Elmer) using the following conditions:
94°C 2 min
94°C 30 sec denaturation
56°C 1 min hybridization 35 cycles
68°C 1 min elongation
68°C 15 min
4°C ∞
The final PCR products were analyzed by agarose gel electrophoresis (Section 2.2.5, p. 30). Relevant
bands were cut out, cleaned up with either the Easypure® DNA Purification kit (Biozym, 10 μL elution
volume) or the QIAquick Gel Extraction kit (Qiagen, 30 μL elution volume) and sent for sequencing
(Section 2.2.6, p. 30) with the primer Cβ-in.
2.7.6 TCR Alpha Chain PCR
PCR experiments to characterize TCR alpha chains were only performed on samples of PCR 1 which
had yielded sequences of TCR beta chains in earlier experiments (Section 2.7.4, p. 53 and Section
2.7.5, p. 56). Mixes of the Vα-in primers listed in Table 8 (p. 20) called “Set 1” to “Set 5” were
prepared. Samples containing 1 µL of H2O/DEPC instead of the product of a PCR 1 served as negative
controls.
Volume Reagent Final Concentration
2 µL 10x PCR buffer 1x
0.4 µL dNTP-mix (10 mM each) 2 mM
2 µL Vα-in Set-x 0.5 µM each
2 µL Cα-rev-in (5 µM) 0.5 µM
0.2 µL Taq-DNA-Polymerase (5 U/µL) 1 U
1 µL product of PCR 1
ad 20 µL H2O/DEPC
Because of the huge amount of primers the TCR alpha chain PCR was performed as touch-down PCR
in the GeneAmp PCR System 9600 (Perkin Elmer) with the following conditions:
94°C 2 min
94°C 30 sec denaturation
61°C 1 min hybridization 4 cycles
68°C 1 min elongation
94°C 30 sec denaturation
58°C 1 min hybridization 4 cycles
68°C 1 min elongation
94°C 30 sec denaturation
56°C 1 min hybridization 4 cycles
68°C 1 min elongation

MATERIALS AND METHODS
59
94°C 30 sec denaturation
53°C 1 min hybridization 40 cycles
68°C 1 min elongation
68°C 15 min
4°C ∞
The PCR products were analyzed by agarose gel electrophoresis (Section 2.2.5, p. 30). Relevant bands
were cut out, cleaned up with either the Easypure® DNA Purification kit (Biozym, 10 μL elution
volume) or the QIAquick Gel Extraction kit (Qiagen, 30 μL elution volume) and sent for sequencing
(Section 2.2.6, p. 30) with the primer Cα-rev-in.
2.8 Characterization of Mimotopes Recognized by the TCRs 2D1 and B7
2.8.1 Peptide Assays with NFAT-sGFP-Expressing T Hybridoma Cells or IL-2 ELISA
as Read-Out System
COS-7 cells were seeded in 96-well plates and transfected with pRSVneo-HLA-A2 or pRSVneo-
HLA-A3 (Table 13, p. 23) using the FuGENE® HD transfection reagent (Section 2.5.5, p. 40). After
24 hours 10 µg of peptides (Table 14, p. 24) were loaded onto the cells. After incubation for 3 hours
2D1, B7, 2D1-NFAT-sGFP or B7-NFAT-sGFP T hybridoma cells (Section 2.5.6, p. 40 and Table 18,
p. 26) were added. Later the stably transfected cell lines COS-7-A2 and COS-7-A3 (Section 2.5.7,
p. 41) were employed. The next day the plates were either analyzed under the fluorescence microscope
Axiovert 200M (Section 2.5.9, p. 43) or an IL-2 ELISA was performed.
Therefore the Mouse IL-2 ELISA Ready-SET-Go!® kit (eBioscience) and 96-well MaxiSorb
® flat-
bottom plates (Nunc) were employed according to the manufacturer’s instructions. One well coated
with 1:500 in PBS (Table 2, p. 15) diluted antibody against mouse CD3e (Table 15, p. 25) served as
positive control. For the standard curves concentrations of IL-2 ranging from 5 to 500 pg/mL were
used. The plates were analyzed at 450 nm wavelength with the VICTOR² 1420 Multilabel Counter
(Perkin Elmer).
2.8.2 Assays with Peptide-Coding Plasmids
COS-7-A2 or COS-7-A3 cells (Table 18, p. 26) were seeded in 96-well or 24-well plates and
transfected using the FuGENE® transfection reagent (Section 2.5.5, p. 40) with the peptide-coding
plasmids listed in Table 13 (p. 23), which were prepared as described in Section 2.3.2 (p. 32). After
4 hours 2D1-NFAT-sGFP or B7-NFAT-sGFP T hybridoma cells were added (Section 2.5.6, p. 40 and
Table 18, p. 26). The next day the plates were analyzed under the fluorescence microscope Axiovert
200M (Section 2.5.9, p. 43).

MATERIAL AND METHODS
60
2.8.3 In Vitro Peptide:HLA-A2 Tetramer Recognition Assay
Pierce® High Sensitivity Streptavidin Coated Plates (Thermo Scientific) were washed tree times with
wash buffer from the Mouse IL-2 ELISA Ready-SET-Go!® kit (eBioscience). After addition of
100 µL 1x PBS and 1 µL of biotinylated peptide:HLA-A2 complexes (Section 2.6.13, p. 51) the plates
were incubated for 30 minutes at room temperature and then for 6 hours at 37°C. 2D1-NFAT-sGFP or
B7-NFAT-sGFP T hybridoma cells were added (Section 2.5.6, p. 40 and Table 18, p. 26). The next
day the plates were analyzed under the fluorescence microscope Axiovert 200M (Section 2.5.9, p. 43).
2.8.4 Assays with Plasmid-Encoded Combinatorial Peptide Libraries
The procedure was performed as described in Siewert et al., 2012. Figure 9 (p. 61) shows the
workflow of the succeeding experiments.
2.8.4.1 Isolation of Positive APCs
COS-7-A2 (Table 18, p. 26) serving as APCs were seeded in 3.5 cm dishes in RPMI/complete
medium (Table 3, p. 18) and transfected with PECP library plasmids (Table 13, p. 23) using the
FuGENE® transfection reagent (Section 2.5.5, p. 40). After 48 hours of incubation 2D1-NFAT-sGFP
T hybridoma cells (Section 2.5.6, p. 40 and Table 18, p. 26) were added in RPMI/complete medium
(Table 3, p. 18). The next day the plates were analyzed under the fluorescence microscope Axiovert
200M (Section 2.5.9, p. 43).
When clusters of green fluorescing T hybridoma cells were observed, the underlying COS-7 cells were
isolated using customized flexible capillaries with an inner diameter of 15 µm (custom-tips,
Eppendorf) which were inserted into the LN25 Mini micromanipulator allowing movements in the
range of micrometers. The latter device was connected to the CellTram Vario microinjector via an oil-
filled tube that allowed applying very slight changes of pressure. The COS-7 cells were sucked into
the capillary with some microliters of the surrounding medium and then expelled into pre-cooled
200 µL reaction tubes containing 7 µL H2O/DEPC. The cells were shortly centrifuged in the Sprout
Mini-centrifuge and stored on ice until the following plasmid recovery PCR could be performed. The
capillaries were used for the consecutive isolation of COS-7 cells during one day’s experiments.

MATERIALS AND METHODS
61
Figure 9: Workflow of mimotope search with PECP libraries.
The identification of antigen-coding plasmids using PECP libraries was performed as shown in this illustration. COS-7-A2
cells were transfected with PECP libraries (Section 2.5.5, p. 40 and Section 2.3.1, p. 30). After co-cultivation with 2D1-
NFAT-sGFP T hybridoma cells underlying, activating COS-7-A2 cells were isolated (Section 2.8.4.1, p. 60). The peptide-
coding region of the PECP library plasmids were amplified cloned and transformed in E. coli bacteria (Section 2.8.4.2, p. 62).
After several rounds of reactivation and plasmid enrichment in subpools (Section 2.8.4.3, p. 63) the antigen-coding plasmid
was sequenced (Section 2.8.4.4, p. 63).

MATERIAL AND METHODS
62
2.8.4.2 Plasmid Recovery PCR and Recloning of PCR Products
The peptide-coding regions of intracellular plasmids from isolated COS-7 cells (Section 2.8.4.1, p. 60)
were amplified using the following PCR setup with primers listed in Table 10 (p. 21):
Volume Reagent Final Concentration
50 µL 2x iProofTM High-Fidelity Master Mix 1x
0.5 µL pcDNA-2nd-for-TOPO (100 µM) 0.5 µM
0.5 µL pcDNA-rev-3 (100 µM) 0.5 µM
ad 100 µL H2O/DEPC
The PCR was run in the T3 Thermocycler (Biometra) under the following conditions:
98°C 3 min
98°C 20 sec denaturation
56°C 20 sec hybridization 40 cycles
72°C 30 sec elongation
72°C 10 min
4°C ∞
Subsequently 10 µL of the PCR products were analyzed by agarose gel electrophoresis (Section 2.2.5,
p. 30). Then 80 µL of the PCR products with visible bands were purified using the QIAquick® PCR-
Purification kit (Qiagen) according to the manufacturer’s instructions with elution in 30 µL EB buffer.
DNA concentration was determined (Section 2.2.2, p. 28).
Next the samples were diluted to a final concentration of 1 ng/µL and ligated into the vector
pcDNA3.1TM
D/V5-His-TOPO® using the pcDNA3.1
TM Directional TOPO
® Expression kit
(Invitrogen):
Volume Reagent Final Concentration
1 µL product of plasmid recovery PCR 1 ng
1 µL salt solution (1.2 M NaCl, 0.06 M MgCl2) 0.2 M NaCl, 0.01 M MgCl2
0.5 µL pcDNA3.1D/V5-His-TOPO® vector (15 to 20 ng/µL) 7.5 to 10 ng
ad 6 µL H2O/DEPC
The ligation samples were incubated at room temperature for 30 minutes and then over night at 16°C.
The next day the samples were precipitated in 0.1 volumes of 3 M sodium acetate and 2.5 volumes of
ethanol with the addition of 20 µg Glycogen (Novagen) acting as a DNA carrier and 2 µL of Pellet
Paint (Novagen) for at least 30 minutes at -80°C. After centrifugation for 1 hour at 4°C and
14,000 rpm (20,800 g) in the 5417 R Centrifuge (Eppendorf) the supernatant was discarded. The pellet
was washed twice with 200 µL 70 % ethanol, air-dried and resuspended it in 2 µL of EB buffer.
Thereafter the probes were transformed into the E. coli strain ElectroMax DH10BTM
(Invitrogen)
(Section 2.4.4, p. 37). Plasmid purification was performed from 2 mL of the E. coli culture (Section
2.4.5, p. 38).

MATERIALS AND METHODS
63
2.8.4.3 Reactivation Assay and Subpool Enrichment
COS-7-A2 cells (Table 18, p. 26) were seeded in 24-well plates in RPMI/complete medium (Table 3,
p. 18) and transfected as duplicates with the previously purified plasmids (Section 2.8.4.2, p. 62) using
the FuGENE® transfection reagent (Section 2.5.5, p. 40). After 24 or 48 hours of incubation 2D1-
NFAT-sGFP T hybridoma cells (Section 2.5.6, p. 40 and Table 18, p. 26) were added in
RPMI/complete medium (Table 3, p. 18). The next day the plates were analyzed under the
fluorescence microscope Axiovert 200M (Section 2.5.9, p. 43). When reactivation was observed, the
procedure to enrich the mimotope-coding plasmid was started.
Therefore the frequency of the mimotope-coding plasmid amongst bystander plasmids was estimated
as 1 in the number of obtained clones after the transformation into the E. coli bacteria (Section 2.8.4.2,
p. 62). 30 probes originating from the prior E. coli culture containing 1/10 of the previous clone
number were cultivated in a volume of 1.25 mL in 96-well deep well plates and plasmid purification
was performed from 1 mL of these E. coli cultures (Section 2.4.5, p. 38). Reactivation assays were
performed as described above but in a single setup with incubation for 24 hours. This procedure was
repeated until a dilution of the mimotope-coding plasmid of 1:300 or lower was obtained.
2.8.4.4 Final Enrichment and Sequencing of the Mimotope-Coding Plasmid
For the final dilutions E. coli bacteria of the last enriched culture were plated on agar plates (Section
2.4.1, p. 37). 30 streets of 30 colonies each were marked, picked individually with autoclaved
toothpicks and cultivated over night in a volume of 20 mL LBamp
medium (Section 2.4.1, p. 37) in
50 mL reaction tubes. Reactivation assays were performed as described in Section 2.8.4.3 (p. 63) but
in a single setup with incubation for 24 hours.
The colonies of positive streets were then analyzed individually and the final plasmid purification was
sequenced (Section 2.2.6, p. 30) with the primer pcDNA-for-1or pcDNA-rev-3 (Table 10, p. 21).
2.8.5 Database Search for Parent Proteins
With all peptide sequences that were shown to activate T hybridoma cells protein BLAST search was
performed using the webpage http://blast.ncbi.nlm.nih.gov/Blast.cgi and the database “non-redundant
protein sequences” to identify possible parent proteins. Additionally a motif-based matrix search was
accomplished in the case when more than one activating peptide was identified. In cooperation this
search was performed by Stefan Pinkert, Max Planck Institute of Biochemistry (Martinsried, D).

RESULTS
64
3 Results
3.1 Characterization of Matching TCR Alpha and Beta Chains from
Human Blood T Cells
Many autoimmune diseases such as MS or Psoriasis are characterized by tissue infiltrating CD8+
T lymphocytes. These cells recognize so far unknown antigens with their TCR molecules and lead to
destruction of target tissue structures.
A PCR method to identify TCR beta and matching alpha chains from putatively disease-related single
cells was published (Seitz et al., 2006). This method allows cloning of TCR chains from cells
belonging to expanded populations. T cell clones that contain a TCR V beta segment against which
antibodies are available can be analyzed.
Based on this clone-specific approach a new PCR method to identify TCR beta chains in an unbiased
manner was established. Song-Min Kim (Ludwig Maximilians University, Munich, department of
dermatology) designed a set of primers that allows amplification of all possible human TCR beta
chains originating from single T lymphocytes. The protocol and primers of Song-Min Kim were tested
on human blood T cells.
Table 21: TCR beta (and matching alpha) chains from single sorted human blood T cells.
The unbiased method to identify human TCR beta- and subsequently alpha-chain sequences was tested on single human
CD3+ blood T lymphocytes. From 52 samples 2 TCR alpha- and beta-chain pairs as well as 5 single TCR beta chains were
detected. Blue: amino acid sequence, green: V region, red: N(D)N, black: J region.
TCR chain Sequence
BV8S1-BJ1.1
AV20S1-AJ16.1
C A S T Q G W G D T E A F F G
5’-TGT GCC AGC ACC CAA GGG TGG GGA GAT ACT GAA GCT TTC TTT GGA-3’
C V L L P R E V S D G Q K L L
5’-TGT GTA CTA CTG CCT CGT GAG GTC TCA GAT GGC CAG AAG CTG CTC-3’
BV12S3-BJ2.7
AV1S3-AJ56.1
Y F C A S S T G T Y E Q Y F G
5’-TAT TTC TGC GCC AGT TCG ACA GGG ACC TAC GAG CAG TAC TTC GGG-3’
Y F C A V S P G A N S K L T F
5’-TAC TTC TGT GCT GTG AGT CCC GGA GCC AAT AGT AAG CTG ACA TTT-3’
BV4S1-BJ2.3 Y L C S G S S F T S T D T Q Y
5’-TAT CTC TGC AGC GGT TCA TCG TTT ACT AGC ACA GAT ACG CAG TAT-3’
BV5S1-BJ1.1 L C A S S L V A D G E A F F G
5’-CTT TGC GCC AGC AGC TTG GTT GCG GAT GGC GAA GCT TTC TTT GGA-3’
BV12S1-BJ2.7 C A I S E S S L S Y E Q Y F G
5’-TGT GCC ATC AGT GAG TCA AGC CTT TCC TAC GAG CAG TAC TTC GGG-3’
BV13S2-BJ2.7 F C A S R P D R T L Y E Q Y F
5’-TTC TGT GCC AGC AGG CCG GAC AGG ACC CTC TAC GAG CAG TAC TTC-3’
BV22S1-BJ2.1 Y F C A S S L K A E Q F F G P
5’-TAC TTC TGT GCC AGC AGT TTG AAG GCT GAG CAG TTC TTC GGG CCA-3’
Human blood lymphocytes were isolated by gradient centrifugation and subsequent FACS-sorting into
single reaction tubes using an anti-CD3 antibody. Samples were analyzed according to the protocol
described in Section 2.7.5 (p. 56) and Section 2.7.6 (p. 58). From 52 sorted single CD3+ blood
lymphocytes 7 different TCR beta chains were identified (yield: 13.5 %). Of these seven samples two
matching TCR alpha chains were detected (yield: 28.6 %) (Table 21, p. 64). All TCR alpha- and beta-

RESULTS
65
chains in this study are denoted according to Arden et al., 1995. The method including this experiment
was published in Kim et al., 2012.
3.2 Optimization of the Methods to Identify Matching TCR Alpha and
Beta Chains from Human Brain Tissue
The autoimmune mediated disease MS is characterized by demyelination, axonal loss, glial cell
activation and the infiltration of immune cells into the CNS. Amongst all infiltrating cell populations
CD8+ T lymphocytes predominate and perform the direct autoimmune attack on CNS tissue structures
(Friese and Fugger, 2009). Thus the identification of TCR molecules originating from disease-related
T cells may provide further insights into the pathomechanisms of MS.
A clone-specific and an unbiased PCR method to characterize matching human TCR alpha- and beta-
chains were established (Seitz et al., 2006; Kim et al., 2012). Here these methods were optimized for
the use on human brain tissue samples. First the effects of different tissue treatment on the RNA
quality were examined (Section 3.2.1, p. 65). Next liquid cover glass was tested for laser
microdissection experiments (Section 3.2.2, p. 68). Finally the clone-specific PCR protocol was
adapted to the use on human brain tissue samples (Section 3.2.3, p. 69).
3.2.1 Effects of Different Tissue Treatment on RNA Quality
During my Diploma thesis all available brain tissue blocks from MS patient FE were investigated
according to MS lesions and T lymphocyte infiltrates. The blocks 9a, 10a and 11b appeared most
promising for T cell analyses. Now the initial state of RNA quality in these brain tissue blocks was
determined.
RNA was isolated from fresh cryosections and analyzed (Section 2.2.3, p. 28). Signals of 18S and 28S
rRNA from all blocks were visible in the densitometry plot (Figure 10-A, p. 66) and
electropherograms (Figure 10-B, p. 66). Despite detection of degradation products the RNA quality
was considered well enough for single cell PCR experiments.
In the second experiment the loss of RNA quality in the brain tissue 9a and 11b was monitored from
cutting cryosections until the end of the staining procedure for laser microdissection. To this end RNA
was isolated from fresh cryosections, from each two sections stored on PET Membrane slides at -80°C
and from each two sections on PET Membrane slides after storage at -80°C and the staining procedure
for laser microdissection (Section 2.7.2, p. 52). Resulting RNA quality was analyzed (Section 2.2.3,
p. 28).
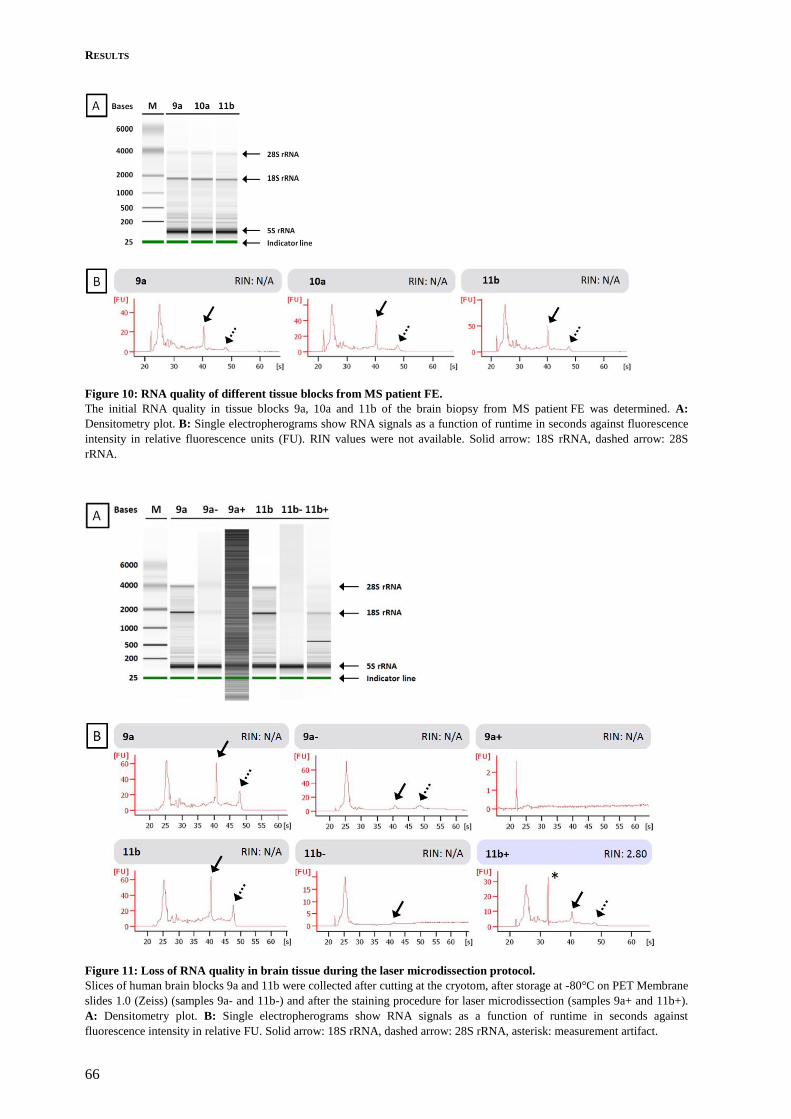
RESULTS
66
Figure 10: RNA quality of different tissue blocks from MS patient FE.
The initial RNA quality in tissue blocks 9a, 10a and 11b of the brain biopsy from MS patient FE was determined. A:
Densitometry plot. B: Single electropherograms show RNA signals as a function of runtime in seconds against fluorescence
intensity in relative fluorescence units (FU). RIN values were not available. Solid arrow: 18S rRNA, dashed arrow: 28S
rRNA.
Figure 11: Loss of RNA quality in brain tissue during the laser microdissection protocol.
Slices of human brain blocks 9a and 11b were collected after cutting at the cryotom, after storage at -80°C on PET Membrane
slides 1.0 (Zeiss) (samples 9a- and 11b-) and after the staining procedure for laser microdissection (samples 9a+ and 11b+).
A: Densitometry plot. B: Single electropherograms show RNA signals as a function of runtime in seconds against
fluorescence intensity in relative FU. Solid arrow: 18S rRNA, dashed arrow: 28S rRNA, asterisk: measurement artifact.

RESULTS
67
Fresh cryosections from block 9a and 11b yielded both comparable initial RNA quality as seen in the
first experiment above. Signals of 18S and 28S rRNA were visible in the densitometry plot (Figure
11-A, p. 66). Storage at -80°C led to RNA degradation, but faint signals of 18S and 28S rRNA were
detectable. After subsequent staining RNA was completely lost in the sections from block 9a. RNA
quality in the stained sections of block 11b was better as in the sections stored at -80°C. This result
might be due to the fact that different sections were used and that those for analysis after staining
might have already had better initial RNA quality (Figure 11-B, p. 66).
Figure 12: RNA quality after incubation in different solutions.
Each 500 ng RNA were left at room temperature for 2 hours in water, 2 % BSA/PBS of different batches or PBS, each with
and without RNase inhibitor. Untreated RNA stored on dry ice served as positive control. A: Densitometry plot. B: Single
electropherograms show RNA signals as a function of runtime in seconds against fluorescence intensity in FU. Solid arrow:
18S rRNA, dashed arrow: 28S rRNA, BSA-1: SIGMA Albumin from Bovine Serum (Sigma-Aldrich), BSA-2:
Protease/DNase free Powder BSA (Equitech-Bio, Inc.).
As complete RNA degradation was observed in the stained sections of block 9a, the influence of
different reagents on RNA quality which were used in the staining procedure was examined. It was

RESULTS
68
hypothesized that BSA samples might contain RNases. Therefore 500 ng of RNA that was isolated
from T hybridoma cells, were left at room temperature for 2 hours in 10 µL H2O/DEPC, PBS/DEPC
or 2 % BSA/PBS/DEPC of two different batches. BSA-1 was SIGMA Albumin from Bovine Serum
(Sigma-Aldrich), BSA-2 was Protease/DNase free Powder BSA (Equitech-Bio, Inc.; Kerreville, USA).
Each approach was performed with and without the addition of 1 U/µL Protector RNase Inhibitor
(Roche). An untreated RNA sample which was stored on dry-ice served as positive control. The
resulting RNA quality was analyzed (Figure 12, p. 67; Section 2.2.3, p. 28).
As expected, the untreated RNA yielded very good quality with an RIN value of 9.20 and strong
signals of 18S as well as 28S rRNA. Even the RNA incubated with H2O/DEPC or PBS/DEPC in
absence of RNase inhibitor yielded good qualities with RIN values of 8.10 and 9.50 and still strong
signals of 18S and 28S rRNA. The addition of RNase inhibitor ameliorated these RNA qualities to
RIN values of even 9.50 and 9.60 respectively.
Incubation with 2 % BSA/PBS/DEPC led to massive RNA degradation. Treatment with BSA batch 1
degraded RNA completely. The densitometry plot (Figure 12-A, p. 67) shows many unspecific signals
of fractionized RNA in the sample of BSA batch 2. In both samples no signals of 18S and 28S rRNA
could be detected. The addition of RNase inhibitor improved or completely restored RNA quality in
the samples incubated with BSA batch 2 and BSA batch 1 respectively. The sample treated with BSA
batch 2 and RNase inhibitor yielded an RIN value of 4.20 and detectable signals of 18S and 28S rRNA.
The sample treated with BSA batch 1 and RNase inhibitor yielded a good RIN value of 7.90 and
strong signals of 18S as well as 28S rRNA.
For later laser microdissection experiments the addition of Protector RNase Inhibitor (Roche) to each
staining and washing solution was essential. SIGMA Albumin from Bovine Serum (Sigma-Aldrich)
was used for blocking and staining solutions. In the timeframe of 2 hours RNA quality could be
preserved well enough for subsequent PCR experiments.
3.2.2 Liquid Cover Glass
Image quality at conditions of laser microdissection is very poor (Section 2.7.2, p. 52; Figure 14-A
to -D, p. 69). For microscopy usually tissue is covered with a glass cover slip. This allows light to pass
straightly through the two layers of glass with tissue and aqueous solution in between (Figure 13-left,
p. 69). Covering the tissue is not possible during microdissection experiments, catapulting tissue
fragments into a reaction tube using a laser beam. In order to sustain RNA quality, so far the stained
tissue was covered with a drop of fast evaporating 1-propanol. The alcohol covers the tissue but adapts
to its surface formations. Thus light rays get refracted in various directions, rendering the image
blurred (Figure 13-middle, p. 69).
To solve this problem Liquid Cover Glass introduced by the company Zeiss was tested. The reagent is
claimed to embed the tissue and to smoothen rough surface structures. This should result in high
resolution of even minute details such as nuclei and cell boundaries comparable to coverslipped
specimens (Figure 13-right, p. 69). The reagent is dissolved in 1-propanol so RNA quality should not
be affected. According to the manufacturer detection of fluorescence staining should be enhanced.

RESULTS
69
Figure 13: Refraction of light in different media.
Light rays (arrows) pass almost straightly through tissue specimens in aqueous solution covered with a glass cover slip (left)
but are refracted at the rough surface of tissue covered with 1-propanol (middle). Liquid Cover Glass (Carl Zeiss
MicroImaging) should embed tissue and smooth the surface to reduce refraction (right). Illustration modified from Backes
(2010).
Hence brain tissue slides of MS patient FE were stained with the primary antibodies anti-CD8b-Cy3
and BV13S1-FITC and the secondary antibody aFITC-Alexa488 under the conditions of laser
microdissection (Section 2.7.2, p. 52). One slide was covered with 1-propanol, the other with Liquid
Cover Glass as recommended by the manufacturer. Unfortunately the Liquid Cover Glass emitted
intense autofluorescence. Thus no fluorescence staining could be detected. Even the tissue structure
and single cells were better detectable in the slide covered with 1-propanol (Figure 14, p. 69). In
conclusion, Liquid Cover Glass was no option for our stainings under laser microdissection conditions.
Figure 14: Test staining for Liquid Cover Glass.
Brain tissue slides were stained with the primary antibodies anti-TCR BV13S1-FITC (1:25) and anti-CD8b-Cy3 (1:100) as
well as the secondary antibody aFITC-Alexa488 (1:100). A-D: coverage with 1-propanol, red circle: CD8 beta+ cell, yellow
circle: CD8 beta+/BV13S1+ cell; E-H: coverage with Liquid Cover Glass.
3.2.3 Optimization of the Clone-Specific TCR Beta Chain PCR Protocol
In MS patient FE the TCR beta chains BV13S1-BJ2.3 and BV22-BJ2.1 belong to clonally expanded
T lymphocyte populations (Skulina et al., 2004, Backes, 2010). The sequences of the TCR beta chains
were therefore known, but the corresponding TCR alpha chains still needed to be identified. Thus
single CD8+BV13S1
+ and CD8
+BV22
+ T cells were isolated by laser microdissection from brain tissue.
Then the already known sequences of the TCR beta chains had to be confirmed before the PCR for
identification of the TCR alpha chain could be performed. The protocol for clone-specific
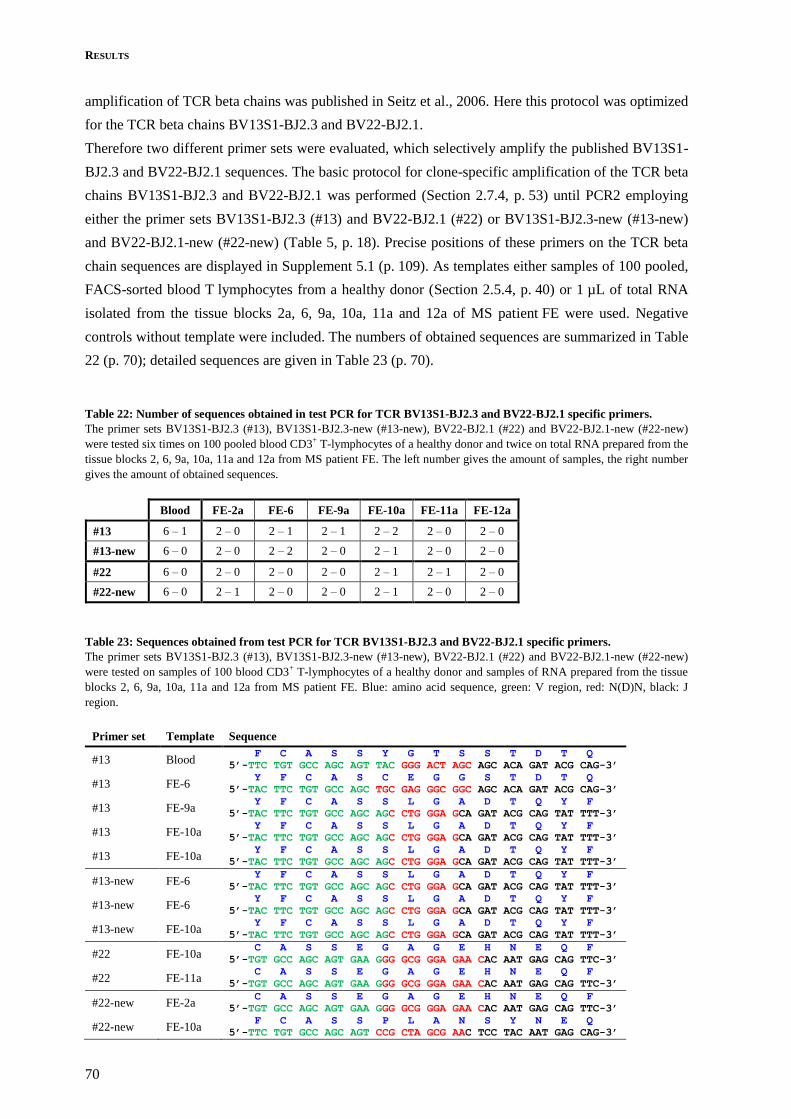
RESULTS
70
amplification of TCR beta chains was published in Seitz et al., 2006. Here this protocol was optimized
for the TCR beta chains BV13S1-BJ2.3 and BV22-BJ2.1.
Therefore two different primer sets were evaluated, which selectively amplify the published BV13S1-
BJ2.3 and BV22-BJ2.1 sequences. The basic protocol for clone-specific amplification of the TCR beta
chains BV13S1-BJ2.3 and BV22-BJ2.1 was performed (Section 2.7.4, p. 53) until PCR2 employing
either the primer sets BV13S1-BJ2.3 (#13) and BV22-BJ2.1 (#22) or BV13S1-BJ2.3-new (#13-new)
and BV22-BJ2.1-new (#22-new) (Table 5, p. 18). Precise positions of these primers on the TCR beta
chain sequences are displayed in Supplement 5.1 (p. 109). As templates either samples of 100 pooled,
FACS-sorted blood T lymphocytes from a healthy donor (Section 2.5.4, p. 40) or 1 µL of total RNA
isolated from the tissue blocks 2a, 6, 9a, 10a, 11a and 12a of MS patient FE were used. Negative
controls without template were included. The numbers of obtained sequences are summarized in Table
22 (p. 70); detailed sequences are given in Table 23 (p. 70).
Table 22: Number of sequences obtained in test PCR for TCR BV13S1-BJ2.3 and BV22-BJ2.1 specific primers.
The primer sets BV13S1-BJ2.3 (#13), BV13S1-BJ2.3-new (#13-new), BV22-BJ2.1 (#22) and BV22-BJ2.1-new (#22-new)
were tested six times on 100 pooled blood CD3+ T-lymphocytes of a healthy donor and twice on total RNA prepared from the
tissue blocks 2, 6, 9a, 10a, 11a and 12a from MS patient FE. The left number gives the amount of samples, the right number
gives the amount of obtained sequences.
Blood FE-2a FE-6 FE-9a FE-10a FE-11a FE-12a
#13 6 – 1 2 – 0 2 – 1 2 – 1 2 – 2 2 – 0 2 – 0
#13-new 6 – 0 2 – 0 2 – 2 2 – 0 2 – 1 2 – 0 2 – 0
#22 6 – 0 2 – 0 2 – 0 2 – 0 2 – 1 2 – 1 2 – 0
#22-new 6 – 0 2 – 1 2 – 0 2 – 0 2 – 1 2 – 0 2 – 0
Table 23: Sequences obtained from test PCR for TCR BV13S1-BJ2.3 and BV22-BJ2.1 specific primers.
The primer sets BV13S1-BJ2.3 (#13), BV13S1-BJ2.3-new (#13-new), BV22-BJ2.1 (#22) and BV22-BJ2.1-new (#22-new)
were tested on samples of 100 blood CD3+ T-lymphocytes of a healthy donor and samples of RNA prepared from the tissue
blocks 2, 6, 9a, 10a, 11a and 12a from MS patient FE. Blue: amino acid sequence, green: V region, red: N(D)N, black: J
region.
Primer set Template Sequence
#13 Blood F C A S S Y G T S S T D T Q
5’-TTC TGT GCC AGC AGT TAC GGG ACT AGC AGC ACA GAT ACG CAG-3’
#13 FE-6 Y F C A S C E G G S T D T Q
5’-TAC TTC TGT GCC AGC TGC GAG GGC GGC AGC ACA GAT ACG CAG-3’
#13 FE-9a Y F C A S S L G A D T Q Y F
5’-TAC TTC TGT GCC AGC AGC CTG GGA GCA GAT ACG CAG TAT TTT-3’
#13 FE-10a Y F C A S S L G A D T Q Y F
5’-TAC TTC TGT GCC AGC AGC CTG GGA GCA GAT ACG CAG TAT TTT-3’
#13 FE-10a Y F C A S S L G A D T Q Y F
5’-TAC TTC TGT GCC AGC AGC CTG GGA GCA GAT ACG CAG TAT TTT-3’
#13-new FE-6 Y F C A S S L G A D T Q Y F
5’-TAC TTC TGT GCC AGC AGC CTG GGA GCA GAT ACG CAG TAT TTT-3’
#13-new FE-6 Y F C A S S L G A D T Q Y F
5’-TAC TTC TGT GCC AGC AGC CTG GGA GCA GAT ACG CAG TAT TTT-3’
#13-new FE-10a Y F C A S S L G A D T Q Y F
5’-TAC TTC TGT GCC AGC AGC CTG GGA GCA GAT ACG CAG TAT TTT-3’
#22 FE-10a C A S S E G A G E H N E Q F
5’-TGT GCC AGC AGT GAA GGG GCG GGA GAA CAC AAT GAG CAG TTC-3’
#22 FE-11a C A S S E G A G E H N E Q F
5’-TGT GCC AGC AGT GAA GGG GCG GGA GAA CAC AAT GAG CAG TTC-3’
#22-new FE-2a C A S S E G A G E H N E Q F
5’-TGT GCC AGC AGT GAA GGG GCG GGA GAA CAC AAT GAG CAG TTC-3’
#22-new FE-10a F C A S S P L A N S Y N E Q
5’-TTC TGT GCC AGC AGT CCG CTA GCG AAC TCC TAC AAT GAG CAG-3’

RESULTS
71
Using the primer set #13 a TCR beta chain was obtained from one out of six blood cell samples. The
primer sets #13-new, #22 and #22-new did not yield any sequence from blood cell samples.
Employing the primer set #13 on RNA samples from MS patient FE further four sequences were
detected. The primer set #13-new yielded three TCR beta chains. Of these in total seven sequences six
were identical, originating from the clonal expanded T cell population which was described in Skulina
et al. (2004) and Backes (2010). Using the primer set #22 on RNA samples from MS patient FE two
sequences were detected. The primer set #22-new yielded further two TCR beta chains. Of these in
total four sequences three were identical, originating from the clonal expanded T cell population
which was described in Skulina et al. (2004) and Backes (2010).
In summary, for both TCR beta chains both primer pairs rendered comparable results. For later
experiments the primer sets #13-new and #22-new were employed since their Tm was better suited to
the applied PCR conditions (Supplement 5.1, p. 109).
3.3 Establishment of a Semi-Biased TCR Beta Chain PCR Protocol
So far tissue specimens from MS patient FE were stained with antibodies against CD8 beta and
TCR BV13S1 or TCR BV22. Double positive cells were isolated via laser microdissection and
analyzed using the clone-specific PCR protocol for the TCR beta chains BV13S1-BJ2.3 and BV22-
BJ2.1. It was presumed that all TCR BV13S1 and TCR BV22 positive cells possess the already
described TCR beta chains containing the BJ segment 2.3 and 2.1 respectively (Skulina et al., 2004).
Through this assumption all TCR beta chain sequences which contain any of the other possible twelve
BJ segments were neglected.
Table 24: Primer combinations for establishment of the semi-biased TCR beta chain PCR.
Setup Pre-Amplification PCR 1st Nested PCR 2nd Nested PCR
#1 BV13S1-BJ2.3_for1
BV13S1-BJ2.3_rev1
BV13S1-BJ2.3_for2
BV13S1-BJ2.3_rev2
BV13S1-BJ2.3_for3
BV13S1-BJ2.3_rev3
#2 BV13S1-for1
BV13S1-BJ2.3_rev1-new
BV13S1-for2
BV13S1-BJ2.3_rev2-new
BV13S1-for3
FE13S1-2.3-rev3
#3 BV13S1-for1
Cβ-mid1
BV13S1-for2
Cβ-in
-
-
#4 BV13S1-for1
Cβ-mid2
BV13S1-for2
Cβ-in
-
-
#5 BV13S1-for1
Cβ-mid1
BV13S1-for3
Cβ-in
-
-
#6 BV13S1-for1
Cβ-mid2
BV13S1-for3
Cβ-in
-
-
Thus a semi-biased TCR beta chain PCR was designed using forward primers annealing in the specific
BV regions and reverse primers annealing in the constant BC region. The reverse primers and their
positions are given in Supplement 5.2 (p. 110). The PCR protocol was basically performed as
described in Section 2.7.4 (p. 53). For the pre-amplification PCR the reverse primers Cβ-mid1 or Cβ-
mid2 were designed. Afterwards only one further nested PCR was performed using the reverse primer
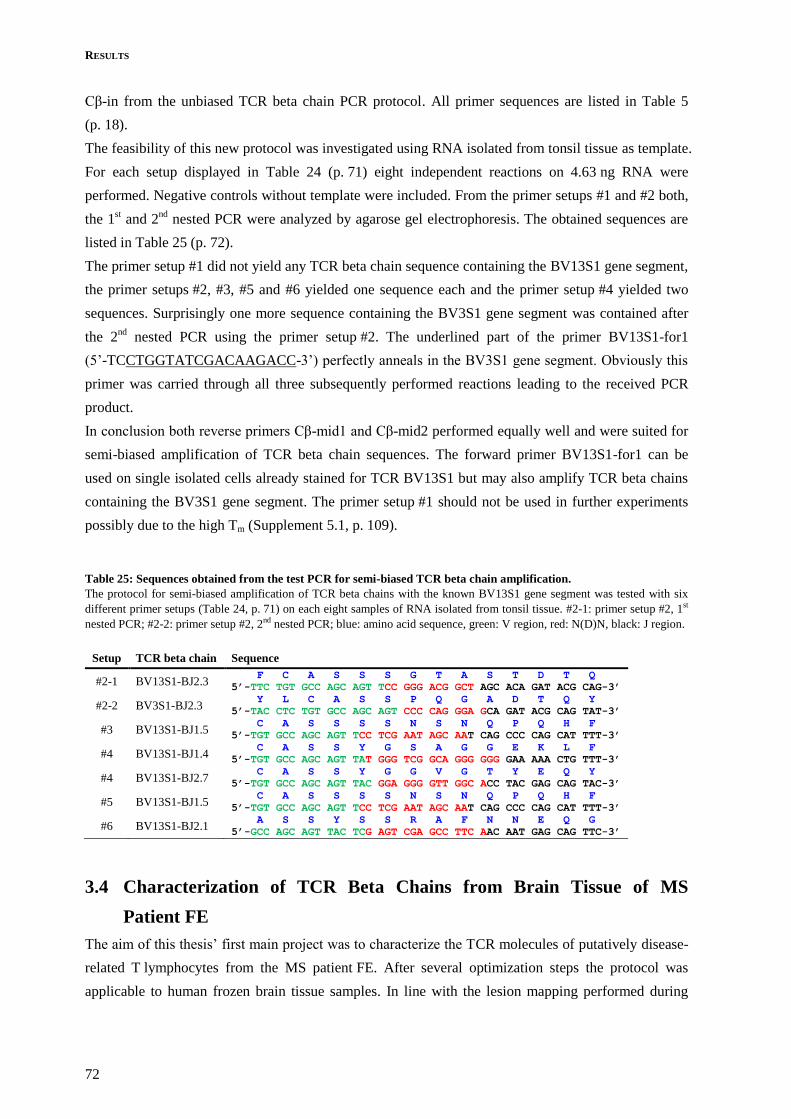
RESULTS
72
Cβ-in from the unbiased TCR beta chain PCR protocol. All primer sequences are listed in Table 5
(p. 18).
The feasibility of this new protocol was investigated using RNA isolated from tonsil tissue as template.
For each setup displayed in Table 24 (p. 71) eight independent reactions on 4.63 ng RNA were
performed. Negative controls without template were included. From the primer setups #1 and #2 both,
the 1st and 2
nd nested PCR were analyzed by agarose gel electrophoresis. The obtained sequences are
listed in Table 25 (p. 72).
The primer setup #1 did not yield any TCR beta chain sequence containing the BV13S1 gene segment,
the primer setups #2, #3, #5 and #6 yielded one sequence each and the primer setup #4 yielded two
sequences. Surprisingly one more sequence containing the BV3S1 gene segment was contained after
the 2nd
nested PCR using the primer setup #2. The underlined part of the primer BV13S1-for1
(5’-TCCTGGTATCGACAAGACC-3’) perfectly anneals in the BV3S1 gene segment. Obviously this
primer was carried through all three subsequently performed reactions leading to the received PCR
product.
In conclusion both reverse primers Cβ-mid1 and Cβ-mid2 performed equally well and were suited for
semi-biased amplification of TCR beta chain sequences. The forward primer BV13S1-for1 can be
used on single isolated cells already stained for TCR BV13S1 but may also amplify TCR beta chains
containing the BV3S1 gene segment. The primer setup #1 should not be used in further experiments
possibly due to the high Tm (Supplement 5.1, p. 109).
Table 25: Sequences obtained from the test PCR for semi-biased TCR beta chain amplification.
The protocol for semi-biased amplification of TCR beta chains with the known BV13S1 gene segment was tested with six
different primer setups (Table 24, p. 71) on each eight samples of RNA isolated from tonsil tissue. #2-1: primer setup #2, 1st
nested PCR; #2-2: primer setup #2, 2nd nested PCR; blue: amino acid sequence, green: V region, red: N(D)N, black: J region.
Setup TCR beta chain Sequence
#2-1 BV13S1-BJ2.3 F C A S S S G T A S T D T Q
5’-TTC TGT GCC AGC AGT TCC GGG ACG GCT AGC ACA GAT ACG CAG-3’
#2-2 BV3S1-BJ2.3 Y L C A S S P Q G A D T Q Y
5’-TAC CTC TGT GCC AGC AGT CCC CAG GGA GCA GAT ACG CAG TAT-3’
#3 BV13S1-BJ1.5 C A S S S S N S N Q P Q H F
5’-TGT GCC AGC AGT TCC TCG AAT AGC AAT CAG CCC CAG CAT TTT-3’
#4 BV13S1-BJ1.4 C A S S Y G S A G G E K L F
5’-TGT GCC AGC AGT TAT GGG TCG GCA GGG GGG GAA AAA CTG TTT-3’
#4 BV13S1-BJ2.7 C A S S Y G G V G T Y E Q Y
5’-TGT GCC AGC AGT TAC GGA GGG GTT GGC ACC TAC GAG CAG TAC-3’
#5 BV13S1-BJ1.5 C A S S S S N S N Q P Q H F
5’-TGT GCC AGC AGT TCC TCG AAT AGC AAT CAG CCC CAG CAT TTT-3’
#6 BV13S1-BJ2.1 A S S Y S S R A F N N E Q G
5’-GCC AGC AGT TAC TCG AGT CGA GCC TTC AAC AAT GAG CAG TTC-3’
3.4 Characterization of TCR Beta Chains from Brain Tissue of MS
Patient FE
The aim of this thesis’ first main project was to characterize the TCR molecules of putatively disease-
related T lymphocytes from the MS patient FE. After several optimization steps the protocol was
applicable to human frozen brain tissue samples. In line with the lesion mapping performed during

RESULTS
73
Backes (2010) the search for matching TCR alpha- and TCR beta-chains was continued using the
tissue blocks 9a and 11b.
Potentially autoaggressive T cells had to be distinguished from bystander cells. Hence certain criteria
were followed. First, the cell’s morphology had to display T lymphocyte appearance (relatively round,
8 to 20 µm in diameter), second the T cell had to be activated carrying the surface marker CD134
(OX-40) or third, the T cell had to belong to a clonally expanded cell population. CDR3 spectratyping
from earlier analyses revealed several TCR beta chains of clonally expanded T cell populations in the
MS patient FE (Babbe et al., 2000; Skulina et al., 2004). Of these we focused on cells carrying the
TCR beta chains BV13S1-BJ2.3 and BV22-BJ2.1 as monoclonal antibodies against TCR BV13S1 and
TCR BV22 were commercially available. The DNA sequence of these two TCR beta chains is given
in Supplement 5.1 (p. 109).
Figure 15: Staining and laser microdissection of CD8+ T lymphocytes from human MS brain tissue.
A 10 µm brain tissue section from MS patient FE was double stained for CD8 beta (A, red) and BV13S1 (B, green).
CD8 beta+ (element 30) and CD8 beta+/BV13S1+ (element 28) cells without autofluorescent background (C, blue) were
marked with red and yellow circles respectively. Marked elements were individually isolated by laser microdissection. D:
Bright-light image of the tissue before and E: after laser microdissection.
For the clone-specific approach 10 µm frozen brain tissue section from MS patient FE were stained
with antibodies against CD8 beta and TCR BV13S1 or TCR BV22. For the unbiased approach
antibodies against CD8 beta and CD134 were employed. Double positive or single CD8 beta+
T lymphocytes were isolated via laser microdissection and further analyzed using the adequate TCR
beta chain PCR protocol. An exemplary staining and cell isolation is depicted in Figure 15 (p. 73).
Cells that are single positive for CD8 beta do not immediately qualify as potentially disease-related
T lymphocytes. But if the TCR beta chain sequence obtained from such cells additionally shows up in
the CDR3 spectratyping analysis, the criterion of clonal expansion would be met.
Table 26: TCR beta chain sequences obtained from isolated single cells from MS patient FE brain tissue.
Single T lymphocytes were isolated by laser microdissection from 10 µm brain tissue sections of MS patient FE.
CD8 beta+/BV13S1+ T cells were analyzed using the clone-specific TCR beta chain PCR protocol; the CD8 beta+/CD134+
T cells was analyzed using the unbiased TCR beta chain PCR protocol. Blue: amino acid sequence, green: V region, red:
N(D)N, black: J region.
Phenotype TCR beta chain Sequence
CD8 beta+/CD134+ BV6S2-BJ2.2 C A S S L A P N G E L F F
5’-TGT GCC AGC AGC TTA GCC CCT AAC GGG GAG CTG TTT TTT-3’
CD8 beta+/BV13S1+ BV13S1-BJ2.3 C A S S Y G T S S T D T Q
5’-TGT GCC AGC AGT TAC GGG ACT AGC AGC ACA GAT ACG CAG-3’
CD8 beta+/BV13S1+ BV13S1-BJ2.3 S V P A A R A A G A D T Q
5’-TCT GTG CCA GCT GCG AGG GCG GCA GGA GCA GAT ACG CAG-3’
RESULTS
74
From 42 CD8 beta+/TCR BV13S1
+ cells isolated from 69 tissue slides 2 TCR beta chain sequences
were recovered. Both were composed of the BV13S1 and BJ2.3 gene segments but differed from the
earlier detected clonally expanded T cell population. From 23 CD8 beta+/TCR BV22
+ cells isolated
from 15 tissue slides no TCR beta chain sequence was identified. 474 CD8 beta+/CD134
+ cells isolated
from 26 tissue slides and 578 CD8beta+ cells isolated from 84 tissue slides were analyzed using the
unbiased PCR protocol. One new TCR beta chain sequence of a CD8 beta+/CD134
+ T lymphocyte was
identified. Unfortunately no corresponding TCR alpha chains could be recovered. The detected TCR
beta chain sequences are presented in Table 26 (p. 73). The low yield compared to single blood
T lymphocytes (Section 3.1, p. 64) is mainly due to moderate RNA quality in the frozen tissue sections.
3.5 Preliminaries to Mimotope Searches of the TCR 2D1 on HLA-A2
Molecules
For better understanding of T cell-mediated processes in MS two major questions need to be answered.
First the TCRs of disease-related effector cells and second the recognized autoantigenic peptides have
to be characterized. To answer the second question Siewert et al. (2012) established a technology for
identification of antigenic peptides recognized by HLA class I-restricted T lymphocytes. The method
of mimotope search employs plasmid-encoded combinatorial peptide libraries (PECP libraries) which
are transfected in antigen presenting cells (APC) stably expressing patient relevant HLA class I
molecules. Reporter cells expressing the TCR of interest, human CD8 and sGFP under control of the
NFAT promoter fluoresce green upon TCR activation and allow subsequent antigen identification
(Section 2.8.4, p. 60).
This technique was now employed to better understand the molecular basis of the genetic linkage to
HLA class I molecules in MS. Carrying the HLA-A*0301 allele correlates with a risk factor, whereas
carrying the HLA-A*0201 allele correlates with a protective effect for MS susceptibility (IMSGC and
WTCCC2, 2011). The TCR 2D1 was isolated from an MS patient and shown to recognize the PLP45-53
peptide (KLIETYFSK) on HLA-A3 molecules (Honma et al, 1997). Friese et al. (2008) discovered
that double-transgenic mice expressing HLA-A3 and the 2D1 TCR develop an MS-like disease after
immunization with PLP45-53 peptide. Surprisingly, not a single triple-transgenic mouse expressing
HLA-A3, the TCR 2D1 and HLA-A2 showed symptoms after immunization as 2D1 T lymphocytes
were depleted in the thymus. The underlying molecular mechanism still remained elusive. Therefore
we focused on characterizing mimotope peptides presented on HLA-A2 molecules that result in TCR
2D1 activation. The control TCR B7 was employed as it recognizes the known peptide TAX11-19
(LLFGYPVYV) on HLA-A2 molecules (Ding et al., 1998).
Before the mimotope search experiments could be started some preliminaries were necessary. First the
COS-7 lines stably expressing HLA-A3 and reporter cell lines stably expressing the TCR 2D1 or TCR
B7 and sGFP under control of the NFAT promoter as well as five new PECP libraries were generated.
Then the question whether the TCR 2D1 can be activated through any endogenous peptides presented
by different cell lines was followed. Next the peptide positions important for recognition by the TCR
2D1 based on the PLP45-53 peptide presented on HLA-A3 were investigated. Finally the question arose

RESULTS
75
whether derivatives of the PLP45-53 and TAX11-19 peptide presented on either HLA-A2 or HLA-A3
molecules resulted in TCR 2D1 or TCR B7 activation.
3.5.1 Cell Lines 2D1-NFAT-sGFP and B7-NFAT-sGFP
To generate the reporter cell lines 2D1-NFAT-sGFP and B7-NFAT-sGFP intrinsic TCR-deficient
T hybridoma cell lines expressing the human TCR 2D1 or B7 were stably transfected with pcDNA6-
NFAT-sGFP containing blasticidin resistance (Section 2.5.6, p. 40). This plasmid codes for sGFP
under control of the NFAT promoter, causing the cells to fluoresce green upon TCR activation. 57 and
89 blasticidin resistant clones of 2D1-NFAT-sGFP and B7-NFAT-sGFP cells respectively were
isolated. Of these all 57 clones of 2D1-NFAT-sGFP cells and 38 clones of B7-NFAT-sGFP cells were
activated with an antibody against CD3 (Section 2.5.8, p. 43). sGFP expression was detected by
fluorescence microscopy and flow cytometry (data not shown). Of each cell line the two strongest
fluorescing clones were cultivated and used as reporter cells for further experiments.
3.5.2 Cell Lines COS-7-A2 and COS-7-A3
Figure 16: HLA-A2 expression of COS-7-A2 cells.
COS-7-A2 cells were stained with the antibody anti-HLA-A2-FITC (D-F) or the isotype control IgG2b-FITC (A-C) and the
dead cell stain ToPro-3. A and D: Gate for COS-7 cells. B and E: Subsequent gate for living cells. C and F: Subsequent
gate for HLA-A2 expression. F: Overlay of unstained (gray) and stained (white) COS-7-A2 cells. SSC: side scatter, FSC:
forward scatter.
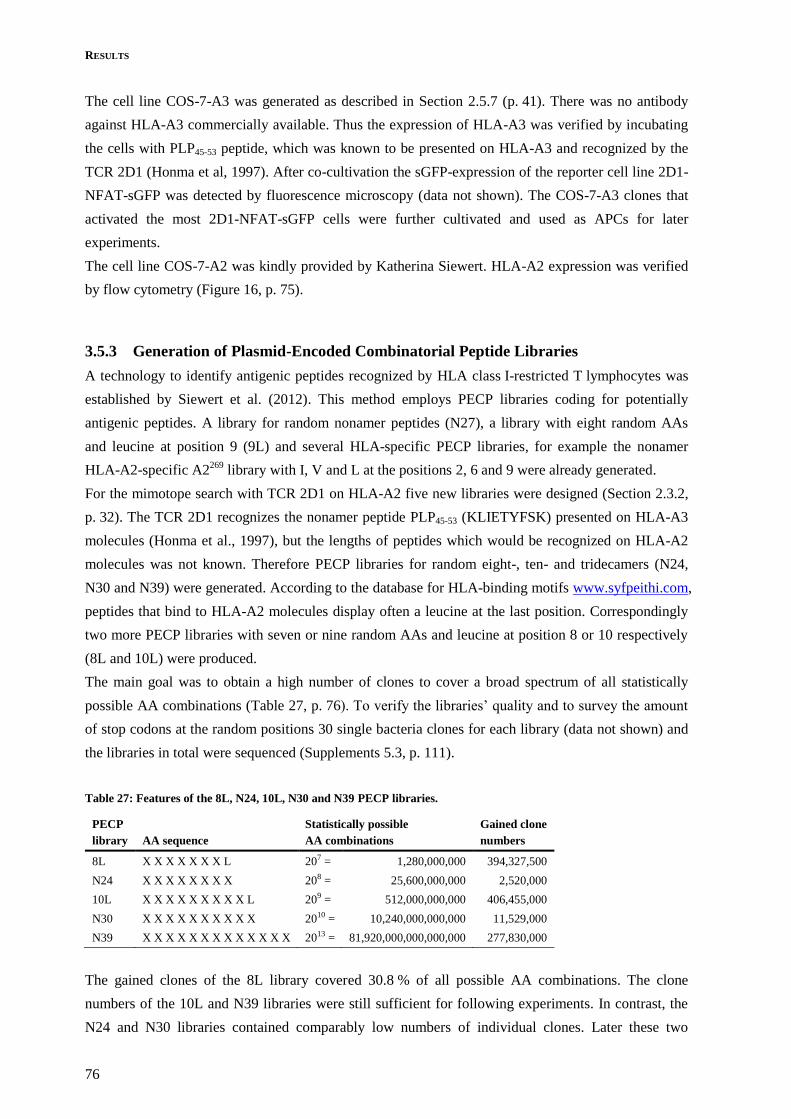
RESULTS
76
The cell line COS-7-A3 was generated as described in Section 2.5.7 (p. 41). There was no antibody
against HLA-A3 commercially available. Thus the expression of HLA-A3 was verified by incubating
the cells with PLP45-53 peptide, which was known to be presented on HLA-A3 and recognized by the
TCR 2D1 (Honma et al, 1997). After co-cultivation the sGFP-expression of the reporter cell line 2D1-
NFAT-sGFP was detected by fluorescence microscopy (data not shown). The COS-7-A3 clones that
activated the most 2D1-NFAT-sGFP cells were further cultivated and used as APCs for later
experiments.
The cell line COS-7-A2 was kindly provided by Katherina Siewert. HLA-A2 expression was verified
by flow cytometry (Figure 16, p. 75).
3.5.3 Generation of Plasmid-Encoded Combinatorial Peptide Libraries
A technology to identify antigenic peptides recognized by HLA class I-restricted T lymphocytes was
established by Siewert et al. (2012). This method employs PECP libraries coding for potentially
antigenic peptides. A library for random nonamer peptides (N27), a library with eight random AAs
and leucine at position 9 (9L) and several HLA-specific PECP libraries, for example the nonamer
HLA-A2-specific A2269
library with I, V and L at the positions 2, 6 and 9 were already generated.
For the mimotope search with TCR 2D1 on HLA-A2 five new libraries were designed (Section 2.3.2,
p. 32). The TCR 2D1 recognizes the nonamer peptide PLP45-53 (KLIETYFSK) presented on HLA-A3
molecules (Honma et al., 1997), but the lengths of peptides which would be recognized on HLA-A2
molecules was not known. Therefore PECP libraries for random eight-, ten- and tridecamers (N24,
N30 and N39) were generated. According to the database for HLA-binding motifs www.syfpeithi.com,
peptides that bind to HLA-A2 molecules display often a leucine at the last position. Correspondingly
two more PECP libraries with seven or nine random AAs and leucine at position 8 or 10 respectively
(8L and 10L) were produced.
The main goal was to obtain a high number of clones to cover a broad spectrum of all statistically
possible AA combinations (Table 27, p. 76). To verify the libraries’ quality and to survey the amount
of stop codons at the random positions 30 single bacteria clones for each library (data not shown) and
the libraries in total were sequenced (Supplements 5.3, p. 111).
Table 27: Features of the 8L, N24, 10L, N30 and N39 PECP libraries.
PECP
library AA sequence
Statistically possible
AA combinations
Gained clone
numbers
8L X X X X X X X L 207 = 1,280,000,000 394,327,500
N24 X X X X X X X X 208 = 25,600,000,000 2,520,000
10L X X X X X X X X X L 209 = 512,000,000,000 406,455,000
N30 X X X X X X X X X X 2010 = 10,240,000,000,000 11,529,000
N39 X X X X X X X X X X X X X 2013 = 81,920,000,000,000,000 277,830,000
The gained clones of the 8L library covered 30.8 % of all possible AA combinations. The clone
numbers of the 10L and N39 libraries were still sufficient for following experiments. In contrast, the
N24 and N30 libraries contained comparably low numbers of individual clones. Later these two

RESULTS
77
libraries were again generated by Geraldine Rühl with yields of 229.25x10⁶ and 27.65x10
6 clones for
the N24 and N30 PECP library respectively.
3.5.4 Investigation of Endogenous Antigens on Different Cell Lines
After generation of all required cell lines (Section 3.5.1, p. 75) first the question whether the TCR 2D1
or the control TCR B7 are intrinsically activated by different cell lines was followed. Such cell lines
would be excluded as APC in later experiments.
According to former knowledge, activation of the TCR 2D1 or B7 was restricted to antigen
presentation on HLA-A3 or HLA-A2 molecules respectively. 2D1-NFAT-sGFP and B7-NFAT-sGFP
cells were co-cultured with COS-7-A2, COS-7-A3, COS-7-Cw06, LTK-A2, LTK-A3, LTK-A1,
GP+E-A2, GP+E-B38, EBV-16488 and EBV-FE cells (Table 18, p. 26). All cell lines were either
untreated, loaded with 10 µg of PLP45-53 peptide (KLIETYFSK) for TCR 2D1 and TAX11-19 peptide
(LLFGYPVYV) for TCR B7 in 1 µL DMSO or treated with 1 µL of pure DMSO as control. Cell
activation was monitored by IL-2 ELISA (Figure 17, p. 77). All obtained results were confirmed by
fluorescence microscopy (data not shown).
Figure 17: IL-2 ELISA for endogenous antigen recognition of TCR 2D1 and TCR B7 on different cell lines.
The cell lines COS-7-A2, COS-7-A3, COS-7-Cw06, LTK-A2, LTK-A3, LTK-A1, GP+E-A2, GP+E-B38, EBV-16488 and
EBV-FE were untreated (NC), treated with 1 µL pure DMSO (DMSO) or loaded with 10 µg of PLP45-53 peptide
(KLIETYFSK) or and TAX11-19 peptide (LLFGYPVYV) in 1 µL DMSO (PLP or TAX) and incubated with either 2D1-
NFAT-sGFP or B7-NFAT-sGFP cells. Anti-CD3 activation served as positive control. Cell activation was measured by IL-2
ELISA with detection minimum at 5 pg/mL. Data represent two independent experiments. Asterisks: IL-2 concentration
> 200 pg/mL - saturation effect in optical density occurred (OD > 1).
The control cell line B7-NFAT-sGFP was activated by cell lines expressing HLA-A2 molecules when
those were loaded with the TAX11-19 peptide. No further combination resulted in cell activation.
In contrast 2D1-NFAT-sGFP cells were activated by cell lines expressing HLA-A3 molecules loaded
with the PLP45-53 peptide but also recognized endogenous antigens on all different LTK and the GP+E-
B38 cells. Endogenous activation was reduced through addition of pure DMSO or PLP45-53 peptide in
DMSO. This effect might be due to cytotoxicity of DMSO.
In the context of GP+E cells expression of HLA-B38 seemed accountable for antigen recognition as
GP+E-A2 cells did not activate 2D1-NFAT-sGFP cells. This is a first indication that the TCR 2D1

RESULTS
78
might be activated by other HLA molecules than HLA-A3. In the context of LTK cells activation of
2D1-NFAT-sGFP cells was HLA-independent. Here xenorecognition of mouse antigen presentation
molecules by the human TCR 2D1 might be the underlying mechanism which was not further
investigated.
EBV-transducted cells could be used as APC. They did not result in endogenous activation of 2D1-
NFAT-sGFP or B7-NFAT-sGFP cells. Major drawbacks were their expression of three to six different
HLA molecules and the clotty growing which prevented proper contact to the reporter cells. COS-7
cells were suited as APC for later experiments because no endogenous antigens of this cell line
activated 2D1-NFAT-sGFP or B7-NFAT-sGFP cells and they grow in an adherent cell layer.
3.5.5 Position Screening for Contacts of TCR 2D1 and PLP45-53:HLA-A3 Complex
Next the interaction motif of the TCR 2D1 with peptide:HLA-A3 complexes was investigated. All
HLA binding motifs were taken from the database www.syfpeithi.com.
Figure 18: PLP45-53-dependent position screening for contacts of TCR 2D1 and peptide:HLA-A3 complexes.
COS-7-A3 cells were transfected with PECP library-like plasmids coding for the peptide KLIETYFSK (PLP45-53), eight
derivatives with alanine substituting the positions 1 to 8 and the peptide KLIETYFSL and co-cultured with 2D1-NFAT-sGFP
cells. Empty plasmid served as negative (NC) and CD3 activation as positive control for activation capability of 2D1-NFAT-
sGFP cells.
The TCR 2D1 recognizes the peptide PLP45-53 (KLIETYFSK) presented on HLA-A3 molecules
(Honma et al., 1997). Thus PECP library-like plasmids coding for the peptide KLIETYFSK as
positive control and eight derivatives with alanine separately substituting the positions 1 to 8 were
generated (Section 2.3.2, p. 32). Additionally plasmids coding for the peptide KLIETYFSL with
leucine at the ninth position being a known binding anchor for HLA-A2 molecules were prepared.

RESULTS
79
After transfection of COS-7-A2 and COS-7-A3 cells with the ten plasmids separately and co-
cultivation with 2D1-NFAT-sGFP cells in two independent experiments, TCR activation was
monitored by fluorescence microscopy (Figure 18, p. 78).
No cell activation was observed in any approach using COS-7-A2 as APC (data not shown). Hence
not even substitution of lysine at position 9 by leucine did result in either peptide presentation on
HLA-A2 molecules or the recognition of KLIETYFSL:HLA-A2 complexes by the TCR 2D1.
Using COS-7-A3 cells as APC the positive control KLIETYFSK (PLP45-53) as well as the derivatives
KLIEAYFSK, KLIETYASK and KLIETYFAK resulted in activation of 2D1-NFAT-sGFP cells.
Furthermore the peptide KLAETYFSK activated few 2D1-NFAT-sGFP cells. The peptides
ALIETYFSK, KAIETYFSK, KLIATYFSK, KLIETAFSK and KLIETYFSL did not result in TCR
2D1 activation.
The peptides with substitutions at position 2 and 9 were probably not presented on HLA-A3 molecules
as these are the two known major anchor positions for peptide:HLA-A3 interaction and should contain
the AAs L/V/M or K/Y/F, respectively. Low TCR activation after alanine substitution of position 3
may also be due to peptide:HLA-A3 interaction. Position 3 is an auxiliary anchor position of HLA-A3
that should contain the AAs F/Y. The positions 1, 4 and 6 seemed to be important for peptide-TCR
2D1 interaction, whereas the positions 5, 7 and 8 may be variable.
3.5.6 Peptide recognition of TCR 2D1 and TCR B7 on HLA-A2 and HLA-A3
Molecules
Some TCRs may recognize over a million different peptides presented on one HLA molecule
(Wooldridge et al., 2012) others have a much narrower recognition spectrum. Hence next the spectrum
of peptides that can be recognized by the TCR 2D1 in comparison to the better characterized TCR B7
was analyzed.
To this end the known peptides PLP45-53 (KLIETYFSK) and TAX11-19 (LLFGYPVYV) were entered in
the BLAST protein search matrix (http://blast.ncbi.nlm.nih.gov). Employing the “non-redundant
protein sequences” database and “blastp” algorithm twelve derivatives of the PLP45-53 peptide and
seven derivatives of the TAX11-19 peptide were chosen by “best-guess”. All 19 “best-guess” candidates
and the two original PLP45-53 and TAX11-19 peptides were loaded onto COS-7-A2 and COS-7-A3 cells.
After co-cultivation with either 2D1-NFAT-sGFP or B7-NFAT-sGFP cells, activation was monitored
by IL-2 ELISA (Figure 19, p. 80). All obtained results were confirmed by fluorescence microscopy
(data not shown).
In line with Hausmann et al. (1999) the TCR B7 was capable of recognizing a broad antigenic
spectrum presented on HLA-A2 molecules. Besides the TAX11-19 peptide (LLFGYPVYV) it was
activated by four of its derivatives (PLFGYTVYG, IGFGYPAYI, SEFSYPVYR and SLFAFPVYQ)
and further seven derivatives of PLP45-53 (KLIEKYFSK, KLIEPYFSK, KLIGTYFSK, KLIDTYFTK,
KLIDTYFSN, KLIETYFKK and KMLETYLSK) presented on HLA-A2 molecules. No peptide was
recognized in the context of HLA-A3 molecules.

RESULTS
80
On the contrary the TCR 2D1 displayed a very narrow recognition pattern of peptides presented on
HLA-A3 molecules. It was activated by the known PLP45-53 peptide (KLIETYFSK) and one of its
derivatives (KLIETYFKK) with a single AA exchange at position 7. This position was already shown
to not be important for peptide-TCR interactions by alanine substitution (Section 3.5.3, p. 76).
Strikingly one nonamer peptide (NLFGNPVYF) that mediated TCR activation in the context of HLA-
A2 molecules was detected. Thus, for the first time cross-recognition of a peptide presented on HLA-
A2 instead of HLA-A3 molecules by the TCR 2D1 was identified.
Figure 19: IL-2 ELISA for peptide recognition of TCR 2D1 and TCR B7 on HLA-A2 and HLA-A3 molecules.
COS-7-A2 and COS-7-A3 cells were loaded with 21 different synthetic peptides and incubated with either 2D1-NFAT-sGFP
or B7-NFAT-sGFP cells. Cell activation was measured by IL-2 ELISA with detection minimum at 5 pg/mL. Data represent
two independent experiments. Dashed line: division between PLP45-53 (KLIETYFSK) with derivatives and TAX11-19
(LLFGYPVYV) with derivatives; asterisk: IL-2 concentration > 200 pg/mL - saturation effect in optical density occurred
(OD > 1).
3.6 Mimotope Search with TCR 2D1 on HLA-A2 Molecules
In a first step all necessary tools for mimotope search of TCR 2D1 on HLA-A2 molecules were
prepared - the cell lines COS-7-A2 and 2D1-NFAT-sGFP as well as several PECP libraries. Second
the interaction motif of the TCR 2D1 with peptide:HLA-A3 complexes was investigated revealing the
importance of the peptide positions 1, 4 and 6 for nonamer peptide-TCR 2D1 contacts. Third the TCR
2D1 was characterized as quite specific for few peptides presented on HLA-A3 molecules and capable
of cross-recognizing one nonamer peptide presented on HLA-A2 molecules.
In the previous experiments the investigated peptides were all derivatives of the PLP45-53
(KLIETYFSK) and TAX11-19 peptide (LLFGYPVYV). In a current step unbiased identification of
further peptides that are cross-recognized by the TCR 2D1 on HLA-A2 molecules was examined. To
this end mimotopes were investigated employing the technology described in Siewert et al. (2012).
This method yields mimotopes which are non-natural peptides. From these a shared motif was
determined. Based on this, motif database search for related existing peptides was performed and those
were tested using peptide-coding plasmids. Finally it was investigated whether or not the identified
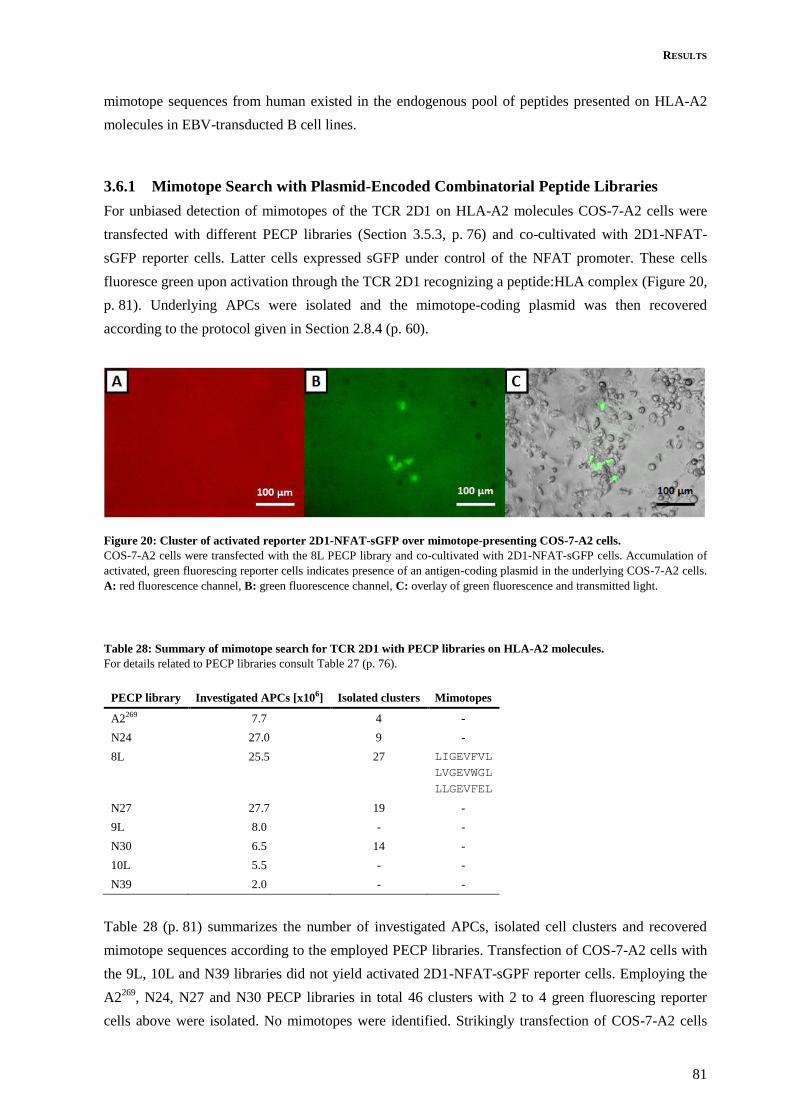
RESULTS
81
mimotope sequences from human existed in the endogenous pool of peptides presented on HLA-A2
molecules in EBV-transducted B cell lines.
3.6.1 Mimotope Search with Plasmid-Encoded Combinatorial Peptide Libraries
For unbiased detection of mimotopes of the TCR 2D1 on HLA-A2 molecules COS-7-A2 cells were
transfected with different PECP libraries (Section 3.5.3, p. 76) and co-cultivated with 2D1-NFAT-
sGFP reporter cells. Latter cells expressed sGFP under control of the NFAT promoter. These cells
fluoresce green upon activation through the TCR 2D1 recognizing a peptide:HLA complex (Figure 20,
p. 81). Underlying APCs were isolated and the mimotope-coding plasmid was then recovered
according to the protocol given in Section 2.8.4 (p. 60).
Figure 20: Cluster of activated reporter 2D1-NFAT-sGFP over mimotope-presenting COS-7-A2 cells.
COS-7-A2 cells were transfected with the 8L PECP library and co-cultivated with 2D1-NFAT-sGFP cells. Accumulation of
activated, green fluorescing reporter cells indicates presence of an antigen-coding plasmid in the underlying COS-7-A2 cells.
A: red fluorescence channel, B: green fluorescence channel, C: overlay of green fluorescence and transmitted light.
Table 28: Summary of mimotope search for TCR 2D1 with PECP libraries on HLA-A2 molecules.
For details related to PECP libraries consult Table 27 (p. 76).
PECP library Investigated APCs [x106] Isolated clusters Mimotopes
A2269 7.7 4 -
N24 27.0 9 -
8L 25.5 27 LIGEVFVL
LVGEVWGL
LLGEVFEL
N27 27.7 19 -
9L 8.0 - -
N30 6.5 14 -
10L 5.5 - -
N39 2.0 - -
Table 28 (p. 81) summarizes the number of investigated APCs, isolated cell clusters and recovered
mimotope sequences according to the employed PECP libraries. Transfection of COS-7-A2 cells with
the 9L, 10L and N39 libraries did not yield activated 2D1-NFAT-sGPF reporter cells. Employing the
A2269
, N24, N27 and N30 PECP libraries in total 46 clusters with 2 to 4 green fluorescing reporter
cells above were isolated. No mimotopes were identified. Strikingly transfection of COS-7-A2 cells

RESULTS
82
with the 8L PECP library yielded accumulations of at least six activated 2D1-NFAT-sGFP cells. Here
27 clusters of underlying COS-7-A2 cells were isolated and 3 mimotopes were recovered. The
eightmer peptide sequences LIGEVFVL, LVGEVWGL and LLGEVFEL were the first unbiasedly
identified mimotopes presented on HLA-A2 molecules that are recognized by the TCR 2D1.
3.6.2 Database Searches and Identification of Mimotope Peptides with Peptide-Coding
Plasmids
As shown in Section 3.5.6 (p. 79) the TCR 2D1 displays a very strict peptide recognition pattern
compared to the TCR B7. In line with this result the three unbiasedly identified eightmer mimotopes
presented on HLA-A2 molecules (LIGEVFVL, LVGEVWGL and LLGEVFEL) shared identical AAs
at the positions 1, 3, 4, 5 and 8. AAs at position 2 were aliphatic and AAs at position 6 were aromatic.
Position 7 seemed variable.
The computational biologist Stefan Pinkert (Max Planck Institute of Biochemistry, Martinsried, D)
developed a motif-based matrix search for peptides resembling given sequences. A search matrix
based on the three eightmer mimotopes was designed where probabilities for certain AAs at each
position were assigned (Table 29, p. 82). Using this matrix Stefan Pinkert searched protein databases
for the taxa 10090 (mouse), 9606 (human), 408170 (human gut metagenome), 2 (bacteria) and 10239
(viruses).
From this first motif-based database search 69 peptides from mouse, 64 peptides from human, 19
peptides from human gut metagenome, 269 peptides from bacteria and 22 peptides from viruses were
obtained. In these peptide lists peptides existing in both mouse and human were accented and for
example peptides from lethal bacteria as Bacillus anthracis or endemic bacteria of the deep sea were
given less importance. Further less importance was given to peptides that did not contain AAs in line
with at least two HLA-A2 anchor and/or TCR 2D1 contact positions.
Table 29: Initial matrix for database search based on three 2D1 - HLA-A2 mimotopes.
According to the three mimotopes each AA was given a probability in percent at each peptide position. Yellow: anchor
position of HLA-A2, orange: presumed TCR 2D1 - peptide contact position, AAP: amino acid position.
AAP Mimotopes
A C D E F G H I K L M N P Q R S T V W Y
Sum
1 L L L
0 0 0 0 0 0 0 0 0 80 20 0 0 0 0 0 0 0 0 0
100 %
2 I V L
5 0 0 0 0 5 0 30 0 30 0 0 0 0 0 0 0 30 0 0
100 %
3 G G G
0 0 0 0 0 100 0 0 0 0 0 0 0 0 0 0 0 0 0 0
100 %
4 E E E
0 0 10 80 0 0 0 0 0 0 0 0 0 10 0 0 0 0 0 0
100 %
5 V V V
0 0 0 0 0 0 0 0 0 0 0 0 0 0 0 0 0 100 0 0
100 %
6 F W F
0 0 0 0 40 0 5 0 0 0 0 0 0 0 0 0 0 0 40 15
100 %
7 V G E
5 5 5 5 5 5 5 5 5 5 5 5 5 5 5 5 5 5 5 5
100 %
8 L L L
0 0 0 0 0 0 0 10 0 70 10 0 0 0 0 0 0 10 0 0
100 %
According to these criteria the lists were reduced to 37 candidates, therefrom 6 peptides shared in
mouse and human, 3 peptides from mouse, 3 peptides from human, 3 peptides from human gut
metagenome, 20 peptides from bacteria and 2 peptides from viruses. For these candidates peptide-

RESULTS
83
coding plasmids were produced (Section 2.3.2, p. 32) and TCR 2D1 activation was tested applying the
protocol given in Section 2.8.2 (p. 59). From the 37 examined peptide sequences 16 induced TCR 2D1
activation when presented on HLA-A2 molecules.
Based on the information of the now 19 recognized mimotopes and 21 not-recognized peptide
sequences a second motif-based matrix search was performed (Supplements 5.4, p. 112). A list of
related peptides with descending matching scores was obtained. The list was cut at a score of 76 %
conformity. Now 199 peptides from mouse, 194 peptides from human and 102 peptides from human
gut metagenome were obtained. The same reduction rules as mentioned above were applied and
further 19 candidates were studied, therefrom 8 peptides shared in mouse and human, 5 peptides from
mouse, 5 peptides from human and 1 peptide from human gut metagenome.
Table 30: Mimotopes presented on HLA-A2 molecules, recognized by the TCR 2D1.
AAP: amino acid position, M&H: mouse and human, HGM: human gut metagenome.
AAP Mouse M&H Human HGM Bacteria
1 L L L L L L L L M L L L L L L L L L L L L I M L L
2 A L I S P I P G E G L Q I P I I I I I I L I V G A
3 G G G G G G G G G G G G G G G G G G G G G G G G G
4 E E E E E E E E E E E E E E E E E E E E E E E E E
5 V V A V V V V V V V V V V V V V V V V A V V V V V
6 F W F F W F F F W Y W F W W W F Y F F F F W W W F
7 A H C G M N A Y G R N G V E L I V V A I I G S L N
8 L L L M V I I V L L A A L L A L L I L L L L L L L
In summary, from 56 candidates 25 mimotopes presented on HLA-A2 molecules were detected that
activated the TCR 2D1 (Table 30, p. 83). The other peptide sequences were either not presented on
HLA-A2 molecules or did not result in activation of the TCR 2D1 (Table 31, p. 83).
Table 31: Sequences of peptides not recognized by the TCR 2D1 on HLA-A2 molecules.
AAP: amino acid position, HGM: human gut metagenome.
AAP Mouse Mouse and Human Human HGM Bacteria Virus
1 L L L L L L L L L L L L L L L L L L L L L L L L L L L L L L I
2 I L E I T V V T L L E R R L V L S E V V I I V P T Y V L G H V
3 G G G G G G G G G G G G G G G G G G G G G G G G G G G G G G G
4 E E E E E E E E E E E E E N D A E E E E E D D E E E Q Q D E E
5 M V A I V V V V L V G V V V L V V V V I G L V V V V V V V V V
6 F V F F A G D V W Q F W W F W W H F F F F F W H F F F F F Y Y
7 E A P E K E F A C A I Q A V N L L I G V V V G V P P A E V N V
8 L L L L L L L L L L L L L L L L L V T L L L V L L L L L L L L
RESULTS
84
3.6.3 Search for Human Candidate Peptides in the Endogenous Repertoire of HLA-
A2+ EBV-Transducted B Cells
In the mimotope search three peptides from human (SPDL1473-480 (LGGEVYRL), TAP1260-267
(LQGEVFGA) and WDR2514-21 (LLGEVWNA)) and interestingly four peptides present in mouse and
human (DMXL2813-820 (LIGEVFNI), EML5997-1004 / EML6997-1004 (MEGEVWGL), GPCPD115-22
(LPGEVFAI) and NCAN257-264 (LGGEVFYV)) were identified to activate the TCR 2D1 in the context
of HLA-A2 (Section 3.6.2, p. 82).
Earlier experiments showed that the TCR 2D1 was not intrinsically activated by the HLA-A2+ EBV-
transduced cell line EBV-16488 (Section 3.5.4, p. 77). This could have been due to either very low
amounts of presented peptides or the clumpy growth of EBV-transduced B cells. Thus the interaction
between the underlying EBV-transduced B cells and the 2D1-NFAT-sGFP reporter cells could have
been impeded. Thus the question arouse whether or not the activating peptides occurred in the
endogenous antigen repertoire of HLA-A2+ EBV-transduced cell lines EBV-16488 or EBV-17490.
The HLA-A2- cell line EBV-FE served as negative control.
HLA-A2 expression on the cell surface was verified by flow cytometry (Figure 21, p. 85).
Peptide:HLA-A2 complexes were isolated from 1.5 x 10⁹ cells of each type using two different
purification methods (Section 2.6.8, p. 47 and Section 2.6.9, p. 47). After denaturation the
endogenously presented peptides were collected and in collaboration with Peer-Hendrik Kuhn
(German Center of Neurodegenerative Diseases, Munich, D) analyzed by ESI-TOF.
In line with the earlier endogenous activation experiment (Section 3.5.4, p. 77), none of the seven
mimotopes could be found in the peptide pool deriving from the HLA-A2+ cell lines EBV-16488 or
EBV-17490.

RESULTS
85
Figure 21: HLA-A2 expression of EBV-transducted B cell lines.
EBV-16488, EBV-17490 and EBV-FE cells were stained with the isotype control IgG2b-FITC (upper row) or the antibody
anti-HLA-A2-FITC (lower row) and the dead cell stain ToPro-3. Gates from left to right were subsequently set for EBV cells,
living cells and HLA-A2 expression. The lower right panel of each cell line presents overlay of isotype control (gray) and
stained cells (white). SSC: side scatter, FSC: forward scatter.

RESULTS
86
3.7 Characterization of Mouse Peptides recognized by TCR 2D1 on
HLA-A2 Molecules
In an unbiased experiment three mimotopes were detected that were presented on HLA-A2 molecules
and activated the TCR 2D1 (Section 3.6.1, p. 81). Based on those mimotopes further 4 peptide
sequences shared in mouse and human, 5 from mouse, 3 from human, 3 from human gut metagenome
and 10 from bacteria were identified (Section 3.6.2, p. 82 and Table 30, p. 83).
Recognition of peptides presented on HLA-A2 molecules by the TCR 2D1 might cause thymic
depletion of TCR 2D1+ T cells and prevent MS-like disease in HLA-A2, HLA-A3 and TCR 2D1
triple-transgenic mice (Friese et al., 2008). Thus in these mice thymic cells might present endogenous
peptides that induce depletion of 2D1 T lymphocytes.
Here we aimed at identifying parent proteins from mouse that might be cleaved resulting in
presentation of mimotope peptides. Thus the focus was put on mimotopes existing in mice
(ALOX12B404-411 (LIGEAFCL), AP5S1185-192 (LLGEVWHL), KLHL28384-391 (LAGEVFAL) and
MDH1B152-159 (LSGEVFGM)) and those also present in humans were emphasized (DMXL2813-820
(LIGEVFNI), EML5997-1004 / EML6997-1004 (MEGEVWGL), GPCPD115-22 (LPGEVFAI) and
NCAN257-264 (LGGEVFYV)). Hereby the mimotope LPGEVWMV from mouse was excluded as its
existence was stated by the protein database UniProt but not could not be verified by protein BLAST.
First the expression of potential parent proteins for the eight detected mimotopes in mouse tissue was
verified. Concentrating on mimotopes present in mouse and human next the recognition of synthetic
peptides loaded on HLA-A2 molecules by the TCR 2D1 was studied. Finally it was examined whether
or not different APCs could cleave potential parent proteins existing in mouse and human resulting in
mimotope presentation on HLA-A2 molecules and recognition by the TCR 2D1
3.7.1 Expression of Potential Parent Proteins in Mouse Tissue
In Section 3.6.2 (p. 82) it was shown that the mouse peptides ALOX12B404-411, AP5S1185-192,
DMXL2813-820, EML5997-1004 / EML6997-1004, GPCPD115-22, KLHL28384-391, MDH1B152-159 and
NCAN257-264 were recognized by the TCR 2D1 on HLA-A2 molecules when they were transfected as
peptide-coding plasmids. Now the expression of genes coding for the parent proteins in mouse tissue
was studied. Brain and thymus tissue was examined as HLA-A3 and TCR 2D1 double-transgenic mice
developed MS-like neurological symptoms and 2D1 TCR+ T lymphocytes were depleted in the thymus
of HLA-A2, HLA-A3 and TCR 2D1 triple-transgenic mice (Friese et al., 2008).
qPCR was performed (Section 2.2.4, p. 29) using primers that span at least one intron and amplify
gene regions coding for the mimotope peptide sequences (Supplements 5.5, p. 113). Thymus and brain
tissue as template derived from a 10 week old female C57BL/6 wild type mouse and a 9 week old
male SJL/J wild type mouse respectively (Kerstin Berer, Max Planck Institute of Neurobiology,
Martinsried, D).
All parent genes were expressed in mouse thymus as well as mouse brain tissue (Figure 22, p. 87). The
Ncan gene is specifically transcribed in the nervous system. Thus low expression level of Ncan in
thymus (ΔCt value of 22.5) might be due to exclusive gene expression in the very few medullary

RESULTS
87
thymic epithelial cells. In these cells expression of the Aire gene drives transcription of organ-specific
genes allowing maturing T cells to be exposed to a huge set of self-antigens during negative selection
(Derbinski et al, 2001).
Figure 22: Gene expression of parent proteins for mimotopes in mouse tissue.
Expression of parent proteins for mimotopes in mouse brain and thymus tissue was examined by qPCR. Data represent
triplicates from two independent experiments. ΔCt values were calculated using Ct values of the house keeping gene Gapdh.
Error bars indicate standard deviation.
3.7.2 Recognition of Mouse and Human Mimotopes on HLA-A2 Tetrameres by the
TCR 2D1
The TCR 2D1 was able to recognize the plasmid-coded peptides DMXL2813-820 (LIGEVFNI),
EML5997-1004 / EML6997-1004 (MEGEVWGL), GPCPD115-22 (LPGEVFAI) and NCAN257-264
(LGGEVFYV) presented on HLA-A2 molecules (Section 3.6.2, p. 82). Those peptides were of special
interest as they are present in mouse and human. Due to the very high hydrophobicity of those
peptides COS-7-A2 cells could not be loaded with synthetic peptides (data not shown). It is assumed
that the extremely hydrophobic peptides get dissolved in lipid membranes before they may interact
with the HLA bincing groove. Hence HLA-A2 molecules were refolded in vitro in complex with the
mentioned peptides (Section 2.6.12, p. 50). As the control TCR B7 but not the TCR 2D1 can be
activated with the TAX11-19 peptide (LLFGYPVYV) presented on HLA-A2 molecules (Ding et al.,
1998), this complex was additionally generated.
After biotinylation (Section 2.6.13, p. 51) the peptide:HLA-A2 tetramers were adsorbed at
streptavidin-coated plates and incubated with 2D1-NFAT-sGFP and B7-NFAT-sGFP cells in two
independent experiments. Empty wells served as negative and anti-CD3 activation as positive control.
TCR activation was monitored by fluorescence microscopy (Figure 23, p. 88).
As expected the cell line 2D1-NFAT-sGFP was activated by the peptides DMXL2813-820, EML5997-1004 /
EML6997-1004, GPCPD115-22, and NCAN257-264 presented on HLA-A2 molecules but not by the
TAX11-19:HLA-A2 complex. On the contrary, the cell line B7-NFAT-sGFP was exclusively activated
by the TAX11-19 peptide presented on HLA-A2 molecules.
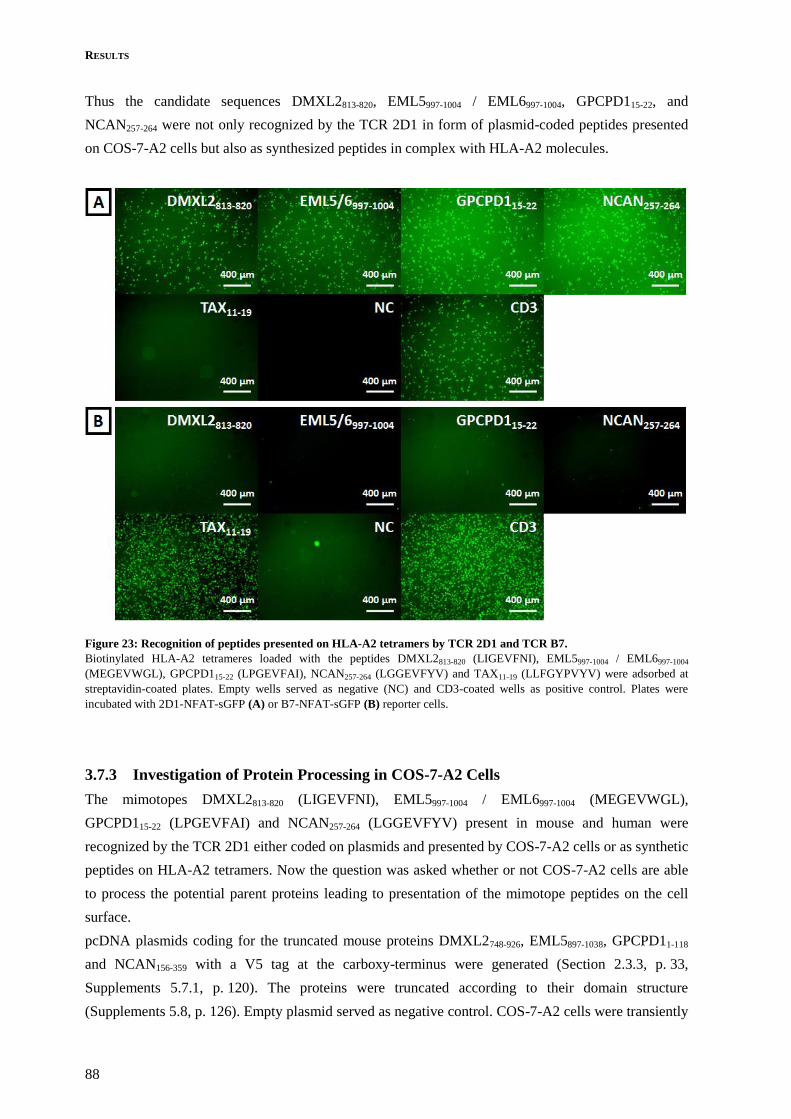
RESULTS
88
Thus the candidate sequences DMXL2813-820, EML5997-1004 / EML6997-1004, GPCPD115-22, and
NCAN257-264 were not only recognized by the TCR 2D1 in form of plasmid-coded peptides presented
on COS-7-A2 cells but also as synthesized peptides in complex with HLA-A2 molecules.
Figure 23: Recognition of peptides presented on HLA-A2 tetramers by TCR 2D1 and TCR B7.
Biotinylated HLA-A2 tetrameres loaded with the peptides DMXL2813-820 (LIGEVFNI), EML5997-1004 / EML6997-1004
(MEGEVWGL), GPCPD115-22 (LPGEVFAI), NCAN257-264 (LGGEVFYV) and TAX11-19 (LLFGYPVYV) were adsorbed at
streptavidin-coated plates. Empty wells served as negative (NC) and CD3-coated wells as positive control. Plates were
incubated with 2D1-NFAT-sGFP (A) or B7-NFAT-sGFP (B) reporter cells.
3.7.3 Investigation of Protein Processing in COS-7-A2 Cells
The mimotopes DMXL2813-820 (LIGEVFNI), EML5997-1004 / EML6997-1004 (MEGEVWGL),
GPCPD115-22 (LPGEVFAI) and NCAN257-264 (LGGEVFYV) present in mouse and human were
recognized by the TCR 2D1 either coded on plasmids and presented by COS-7-A2 cells or as synthetic
peptides on HLA-A2 tetramers. Now the question was asked whether or not COS-7-A2 cells are able
to process the potential parent proteins leading to presentation of the mimotope peptides on the cell
surface.
pcDNA plasmids coding for the truncated mouse proteins DMXL2748-926, EML5897-1038, GPCPD11-118
and NCAN156-359 with a V5 tag at the carboxy-terminus were generated (Section 2.3.3, p. 33,
Supplements 5.7.1, p. 120). The proteins were truncated according to their domain structure
(Supplements 5.8, p. 126). Empty plasmid served as negative control. COS-7-A2 cells were transiently

RESULTS
89
transfected with these plasmids (Section 2.5.5, p. 40). Protein expression was monitored independently
by SDS-PAGE (Section 2.6.4, p. 44) and western blot analysis (Section 2.6.5, p. 45) using the aV5-
HRP antibody (Table 16, p. 26). Therefore supernatant and pellets of cell lysis were loaded (Section
2.6.7, p. 46).
Figure 24: Truncated protein expression in COS-7-A2 cells.
COS-7-A2 cells were transiently transfected with pcDNA6/V5-HisA plasmids coding for the truncated mouse proteins
DMXL2748-926 (D), EML5897-1038 (E), GPCPD11-118 (G) and NCAN156-359 (N) with V5 tag at the carboxy-terminus. Empty
plasmid served as negative control (NC). Supernatants and pellets of cell lysis were analyzed by SDS-PAGE (A) and western
blot (B) employing 0.12 µg/mL of the aV5-HRP antibody and 20 seconds exposure time. Expected molecular weights: D
21.5 kDa, E 16.9 kDa, G 14.4 kDa, N 24.1 kDa.
Figure 25: Protein processing in COS-7-A2 cells.
COS-7-A2 cells were transfected with pcDNA plasmids coding for the truncated mouse proteins GPCPD11-118 and
NCAN156-359 with a V5 tag at the carboxy-terminus and co-cultured with 2D1-NFAT-sGFP cells. Empty plasmid served as
negative control (NC) and pcDNA plasmid coding for the mimotope LLGEVFEL as positive control. CD3 activation served
as control for activation capability of 2D1-NFAT-sGFP cells.
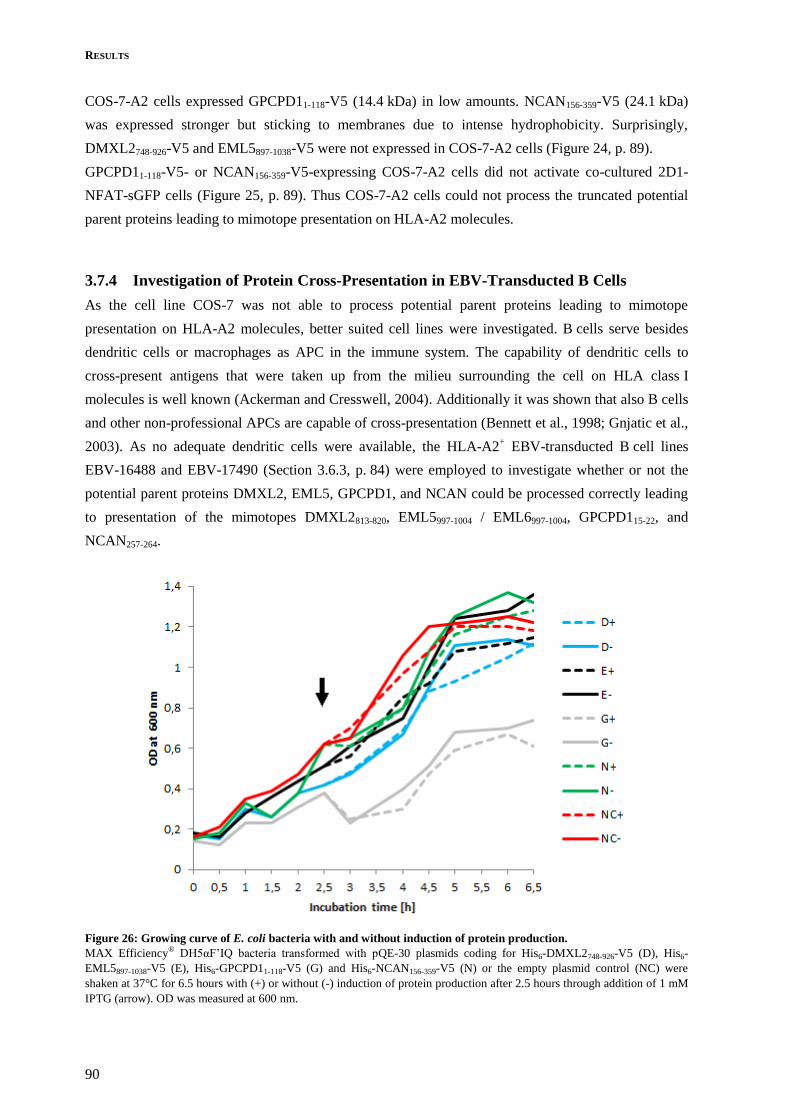
RESULTS
90
COS-7-A2 cells expressed GPCPD11-118-V5 (14.4 kDa) in low amounts. NCAN156-359-V5 (24.1 kDa)
was expressed stronger but sticking to membranes due to intense hydrophobicity. Surprisingly,
DMXL2748-926-V5 and EML5897-1038-V5 were not expressed in COS-7-A2 cells (Figure 24, p. 89).
GPCPD11-118-V5- or NCAN156-359-V5-expressing COS-7-A2 cells did not activate co-cultured 2D1-
NFAT-sGFP cells (Figure 25, p. 89). Thus COS-7-A2 cells could not process the truncated potential
parent proteins leading to mimotope presentation on HLA-A2 molecules.
3.7.4 Investigation of Protein Cross-Presentation in EBV-Transducted B Cells
As the cell line COS-7 was not able to process potential parent proteins leading to mimotope
presentation on HLA-A2 molecules, better suited cell lines were investigated. B cells serve besides
dendritic cells or macrophages as APC in the immune system. The capability of dendritic cells to
cross-present antigens that were taken up from the milieu surrounding the cell on HLA class I
molecules is well known (Ackerman and Cresswell, 2004). Additionally it was shown that also B cells
and other non-professional APCs are capable of cross-presentation (Bennett et al., 1998; Gnjatic et al.,
2003). As no adequate dendritic cells were available, the HLA-A2+ EBV-transducted B cell lines
EBV-16488 and EBV-17490 (Section 3.6.3, p. 84) were employed to investigate whether or not the
potential parent proteins DMXL2, EML5, GPCPD1, and NCAN could be processed correctly leading
to presentation of the mimotopes DMXL2813-820, EML5997-1004 / EML6997-1004, GPCPD115-22, and
NCAN257-264.
Figure 26: Growing curve of E. coli bacteria with and without induction of protein production.
MAX Efficiency® DH5αF’IQ bacteria transformed with pQE-30 plasmids coding for His6-DMXL2748-926-V5 (D), His6-
EML5897-1038-V5 (E), His6-GPCPD11-118-V5 (G) and His6-NCAN156-359-V5 (N) or the empty plasmid control (NC) were
shaken at 37°C for 6.5 hours with (+) or without (-) induction of protein production after 2.5 hours through addition of 1 mM
IPTG (arrow). OD was measured at 600 nm.

RESULTS
91
The truncated potential parent proteins DMXL2748-926, EML5897-1038, GPCPD11-118 and NCAN156-359
with a V5 tag at the carboxy-terminus for detection in western blot analysis and a His6-tag at the
amino-terminus for protein purification were produced (Section 2.6.10, p. 48). To this end the
sequences of DMXL2748-926-V5, EML5897-1038-V5, GPCPD11-118-V5 and NCAN156-359-V5 were cloned
into the pQE-30 vector which added the sequence MRGS-His6-GS at the amino-terminus of the
truncated proteins (Section 2.3.4, p. 35).
Before large scale protein production first the growth curve and behavior of the MAX Efficiency®
DH5αF’IQ bacteria transformed with pQE-30 plasmids coding for His6-DMXL2748-926-V5, His6-
EML5897-1038-V5, His6-GPCPD11-118-V5 and His6-NCAN156-359-V5 with and without induction through
IPTG was determined. Empty plasmid transformed bacteria served as negative control (Figure 26,
p. 90).
The growth of all bacterial strains was slightly retarded through addition of IPTG after 2.5 hours. Non-
induced bacteria grew to an in total higher cell density. The lac promoter appeared leaky so even non-
induced bacteria produced protein albeit in lower amounts (data not shown). The growth peak was
reached after 5.5 hours of incubation. The maximum of cell density reversely correlated with the
amount of produced protein (Figure 26, p. 90 and Figure 27-B, p. 91).
Figure 27: Production of truncated parent proteins in E. coli bacteria and their purification.
MAX Efficiency® DH5αF’IQ bacteria were transformed with pQE-30 plasmids coding for His6-DMXL2748-926-V5 (D), His6-
EML5897-1038-V5 (E), His6-GPCPD11-118-V5 (G) and His6-NCAN156-359-V5 (N) or the empty plasmid control (NC). Protein
production was monitored by SDS-PAGE (A) and western blot (B) employing 0.12 µg/mL of the aV5-HRP antibody and
2 seconds exposure time. Protein purity after nickel chelate affinity chromatography was monitored by SDS-PAGE (C) and
western blot (D) employing 0.12 µg/mL of the aV5-HRP antibody and 10 seconds exposure time. V5-tagged heavy chain of
anti-MOG antibody served as positive control. Expected molecular weights: D 22.8 kDa, E 18.2 kDa, G 15.8 kDa, N
25.4 kDa.

RESULTS
92
The protocol for large scale protein production was adapted to the observed bacterial behavior. Protein
amounts and purity were monitored by SDS-PAGE (Figure 27-A and -C, p. 91) and western blot
(Figure 27-B and -D, p. 91) before and after nickel chelate affinity chromatography (Section 2.6.10,
p. 48). Protein sequences were verified by MALDI-TOF-MS (Supplements 5.9, p. 140).
As expected from the slow growth rate, His6-GPCPD11-118-V5 protein was produced and purified in
very high amounts even leading to dimerization in SDS-PAGE with subsequent western blot analysis
(Figure 27-B and -D, p. 91). Compared to His6-DMXL2748-926-V5 and His6-EML5897-1038-V5 proteins
His6-NCAN156-359-V5 protein was purified in low but sufficient amounts (Figure 27-D, p. 91).
The HLA-A2+ cell lines EBV-16488 and EBV-17490 were incubated with purified proteins or the
purification eluate of empty plasmid control bacteria. Equally treated EBV-FE cells served as negative
control. In none of the experiments co-cultured 2D1-NFAT-sGFP cells were activated (data not
shown). Thus EBV-transducted B cells were not able to process and cross-present the truncated
potential parent proteins leading to mimotope presentation on HLA-A2 molecules.

DISCUSSION
93
4 Discussion
MS is most probably an autoimmune inflammatory disease of the CNS. Demyelination of neurons and
axonal loss occur in temporal and spatial resolution in multiple areas of the brain and spinal cord
(Brück and Stadelmann, 2003). This impairment manifests in neurological symptoms. In acute and
chronic brain lesions the amount of CD8+ T lymphocytes exceeds the number of CD4
+ T cells (Babbe
et al., 2000; Junker et al., 2007). Recent studies further stressed the prominent role of CD8+ T cells
which probably harm the oligodendrocytes and neurons through direct cytotoxicity and release of
cytokines (Mars et al., 2010; Friese and Fugger, 2009).
The course of disease varies between individuals (Lucchinetti et al., 2000) and the causing
mechanisms still remain elusive. Environmental factors as well as genetic predispositions are widely
discussed. Very early a genetic linkage between the HLA gene locus and disease susceptibility was
observed (Jersild et al., 1972; Naito et al., 1972). In 2011 the IMSGC and WTCCC2 published the
latest results of genome-wide association studies for MS, stating that carrying the HLA-A*0201 allele
correlates with a protective effect (Silva et al., 2009). Therefore during this thesis two main questions
were followed:
3. Which CD8+ T lymphocytes participate in the autoimmune attack on CNS tissue and what are
their receptors for antigen recognition?
4. How does the expression of HLA-A2 molecules lead to a decreased disease susceptibility?
To address the first questions potentially disease-related single CD8+ T cells were isolated from brain
tissue of MS patient FE via laser microdissection. Employing two different PCR techniques, their TCR
molecules were analyzed (Seitz et al., 2006; Kim et al., 2012). In the second part antigen recognition
of the disease-related TCR 2D1 in context of HLA-A2 molecules was investigated using a novel
technique developed by Siewert et al. (2012). This led to the identification of several peptide antigens
that might eventually induce depletion of specific T cell clones and thereby mediate protection. Finally
potential parent proteins of the detected antigens were further characterized.
4.1 Identification of Disease-Related Alpha-Beta TCRs from CD8+ T Cells
in MS Patient FE
Patient FE was initially diagnosed with a malignant glioma in 1996, the affected brain area was
surgically removed and stored frozen. Presence of oligoclonal immunoglobulin bands in CSF and
three relapses in the following five years finally led to the diagnosis of MS. In contrast to already
rarely available autopsy tissue, the stored brain biopsy from 1996 provided the unique opportunity to
investigate very early immunological processes in MS brain tissue. In the course of my diploma thesis
(Backes, 2010) all tissue blocks of MS patient FE were mapped according to accumulated immune
DISCUSSION
94
cells, actively inflamed areas and scar formation. Based on these results, the blocks 9a and 11b were
used for the characterization of potentially disease-related CD8+ T lymphocytes.
Therefore the potentially disease-related CD8+ T cells had to be distinguished from non-involved
bystander cells. In an earlier study, Seitz et al. (2006) analyzed disease-related T lymphocytes in
polymyositis patients. During this disease muscle fibers are attacked by the immune system. In muscle
biopsies muscle fibers and immune cells intruding into them were obvious. In the frozen tissue
specimens from MS patient FE borders between brain cells were not distinguishable. Direct cell
contact between autoreactive CD8+ T lymphocytes and target cells could not be observed. Hence two
other criteria were applied: Disease-related T cells had either to belong to a clonally expanded cell
population or had to be activated.
The clone-specific approach for TCR characterization was based on earlier results from single cell
analysis and CDR3 spectratyping that revealed several TCR beta chains of clonally expanded and
persistent T cell populations in brain and blood samples of the MS patient FE (Babbe et al., 2000;
Skulina et al., 2004). To analyze CD8+ T lymphocytes carrying already known TCR beta chains, brain
tissue was stained for CD8 and the specific TCR beta chains. As monoclonal antibodies against TCR
BV13S1 and TCR BV22 were commercially available, persisting T cells carrying the TCR beta chains
BV13S1-BJ2.3 and BV22-BJ2.1 were further investigated.
In the unbiased approach for TCR characterization brain tissue was stained for CD8 and the activation
marker CD134 (formerly known as OX40). CD134 is expressed on activated T cells (Paterson et al.,
1987) and was found on activated T lymphocytes involved in autoimmune encephalomyelitis
(Weinberg et al., 1996).
Despite several technical obstacles the clone-specific PCR protocol for TCR identification could be
optimized, the functionality of the unbiased PCR protocol was verified and disease-related TCR
molecules from CD8+ T cells in brain tissue of MS patient FE were characterized.
4.1.1 Technical Obstacles
During the identification of disease-related alpha beta TCRs from CD8+ T cells in MS patient FE three
major technical obstacles were met. First, T lymphocytes were cut in varying thicknesses in brain
tissue sections and RNA might have been lost. Second, the image quality had to suffice for
fluorescence microscopy and isolation of single cells by laser microdissection (Section 2.7.2, p. 52).
Third, the RNA quality in the isolated single cells had to be adequate for subsequent PCR analyses
(Section 2.7.3, p. 52).
4.1.1.1 Positioning of Cells in Tissue Sections
When preparing tissue sections, potentially disease-related CD8+ T lymphocytes were cut open and
RNA might have been swiped out. For single cell isolation the slides were stained according to the
criteria mentioned above (Section 4.1, p. 93). During the washing and incubation steps again RNA
might have been lost. Attempts to cross-link mRNA molecules to cell skeleton particles did not
improve the yield of subsequent PCR analyses (Kathrin Held, data not published).

DISCUSSION
95
Stained T cells appear as rounded dots under the microscope. This appearance does not correlate with
the amount of cell contained in the tissue section. The 10 µm tissue section might bear the main part
containing a lot of mRNA molecules but also just a marginal part of the T lymphocyte (Figure 28-A,
p. 95). The latter would not bear enough mRNA for later PCR analyses. In thicker tissue sections the
probability of cutting bigger cell parts is higher, but two overlaying cells might appear as one (Figure
28-B, p. 95) and would potentially reveal two sequences for TCR molecules. It would not be possible
to tell whether or not obtained TCR alpha- and beta-chain sequences are matching and truly deriving
from one single disease-related T cell.
Taking those two points together, only approximately 50% of isolated single cells from 10 µm tissue
sections contained enough RNA for subsequent PCR analyses.
Figure 28: Position of cells and their nuclei in tissue sections.
A: In 10 µm tissue sections cells with a diameter of 15 µm may appear the same when stained for microscopy, but may be cut
in different layers. The tissue section only contains the nucleus of the left cell. B: In thicker tissue sections the probability of
cutting bigger cell parts is higher, but two overlaying cells might appear as one. (Modified from Backes, 2010.)
4.1.1.2 Image Quality
For conventional fluorescence staining, tissue slides are incubated as long as possible with blocking
solution, primary and secondary antibodies. Due to the inevitable need of RNA preservation for
subsequent PCR analyses, the staining protocol for laser microdissection was shortened to minimal
incubation times (Section 2.7.2, p. 52). Despite further loss of image quality, the washing steps were
reduced (Section 4.1.1.1, p. 94).
Usually tissue is covered with fluorescence mounting medium and a glass cover slip. This allows light
to pass straightly resulting in sharp images with stark contrast. Covering the tissue is not possible
during microdissection where tissue fragments are catapulted into a reaction tube using a laser beam.
The application of Liquid Cover Glass impeded detection of stained cells due to strong auto-
fluorescence (Section 3.2.2, p. 68). Thus stained tissue was covered with a drop of fast evaporating
1-propanol. The alcohol covers the tissue but adapts to its surface formations. Hence light rays get
refracted in various directions (Figure 13, p. 69).

DISCUSSION
96
Those drawbacks resulted in blurred images (coverage with 1-propanol) with intense background
staining (short incubation with blocking solution and minimal washing steps) (Figure 15, p. 73) but
maintained RNA quality.
4.1.1.3 RNA Quality
To characterize the TCR molecules of potentially disease-related CD8+ T lymphocytes, single cells
were isolated by laser microdissection from frozen brain tissue sections. Thereupon mRNA coding for
the TCR alpha- and beta-chains was transcribed into cDNA in a first RT-PCR (Section 2.7.3, p. 52). In
earlier studies TCR molecules were analyzed employing more stable genomic DNA from single cells
as PCR template (Roers et al., 1998; Babbe et al., 2000). This approach is applicable on TCR beta
chains as in the gene locus only 13 BJ segments exist (Arden et al., 1995; Rowen et al., 1996). Thus
for unbiased characterization of TCR beta chains a forward primer set annealing to all possible BV
segments could be paired in 13 separate reactions with reverse primers annealing to each BJ segment.
However, in this study additionally matching TCR alpha chains should be analyzed. In the TCR alpha
chain gene locus 70 to 80 AV and 61 AJ gene segments are known (Arden et al., 1995; Rowen et al.,
1996). Based on one single cell not enough separate PCR reactions are performable to cover all
possible combinations. Thus genomic DNA was not suited as template in this approach.
Despite lower molecular stability of RNA compared to DNA a huge amount of mRNA molecules
exists in one single cell. Additionally, on mRNA molecules the exon between the rearranged V(D)J
segment and the C segment is removed (Section 1.2.2, p. 3). Forward primers annealing to all known
BV or BA gene segments could be paired with reverse primers annealing to the BC or AC gene
segment. Hence good initial RNA quality in the investigated patient tissue and RNA preservation
throughout the cell isolation was crucial.
The biopsy of MS patient FE employed for the characterization of potentially disease-related CD8+
T cells was taken in 1996. Right after surgery the biopsy was divided into several blocks and frozen
at -80°C. Later the blocks were moved numerous times on dry ice between different laboratories and
freezers. For preparation of tissue slices, the blocks were warmed to -20°C. All these cycles of
warming and cooling during the last 16 years influenced the tissue and notably RNA quality.
Compared to RNA from fresh T hybridoma cells incubated with H2O (Figure 12, p. 67) the RNA
quality in the frozen biopsy parts 9a and 11b was expectedly worse (Figure 10, p. 66). However,
despite many degradation products still intact 18S and 28S rRNA was detectable, rendering the initial
RNA quality not very good but sufficient for subsequent single cell PCR experiments. It was
considered highly probable for at least some TCR alpha- and beta-chain-coding mRNA molecules to
be still intact and serve as RT-PCR template. Notably the RNA quality decreased after tissue slices
were cut, mounted on PET slides and stored at -80°C (Figure 11, p. 66). Moreover after the staining
procedure for single cell isolation (Section 2.7.2, p. 52) almost all RNA was degraded. Thus tissue
slides were stored at -80°C for two weeks at most and RNase inhibitors were added into each staining
solution. These changes of protocol and the employment of SIGMA Albumin from Bovine Serum as
blocking solution improved the RNA preservation during single cell isolation experiments (Figure 12,
p. 67).

DISCUSSION
97
4.1.2 The Clone-Specific PCR Method for TCR Identification
In the clone-specific approach for identification of alpha beta TCR molecules from potentially disease-
related CD8+ T lymphocytes, cells with an already known TCR beta chain were investigated.
Spectratyping analyses revealed that in MS patient FE the TCR beta chains BV13S1-BJ2.3 and BV22-
BJ2.1 belong to clonally expanded T lymphocyte populations with the N(D)N sequences SLGA and
GAGEH, respectively (Skulina et al., 2004, Backes, 2010). The protocol for clone-specific
amplification of TCR beta chains was published (Seitz et al., 2006). In Backes (2010) the protocol was
applied on brain tissue sections from MS patient FE, but the TCR beta chains BV13S1-BJ2.3 and
BV22-BJ2.1 were not recovered from isolated single cells.
Here new primer combinations for amplification of the two TCR beta chains were designed and
evaluated (Section 3.2.3, p. 69). Employing them on RNA prepared from brain tissue slices of MS
patient FE, the BV13S1-BJ2.3 and BV22-BJ2.1 sequences were found six and four times respectively.
These results proofed the existence of the clonally expanded T cells in the investigated brain tissue of
MS patient FE. Further, this experiment indicated that the tissue block 10a might be best suited for
clone specific single cell isolation. From the RNA of this block three times the clonal expanded TCR
beta chain sequence BV13S1-BJ2.3 and once the clonal expanded TCR beta chain sequence BV22-
BJ2.1 was detected. But in line with mapping highly active lesion in the block 10a (Backes 2010), this
tissue block was considered too precious for isolation of potentially disease-related CD8+
T lymphocytes.
Positive staining for CD8 and the TCR beta chains BV13S1 or BV22 in brain tissue slides from the
blocks 9a and 11b was a rare event. In these brain blocks mainly old lesions were present, indicating
that the BV13S1-BJ2.3 and BV22-BJ2.1 T cell populations were participating in the pathomechanism
of active lesions. Only 42 CD8 beta+/TCR BV13S1
+ and 23 CD8 beta
+/TCR BV22
+ single cells were
isolated from 69 and 15 slides, respectively (Section 3.4, p. 72). Employing the strictly clone-specific
primers annealing to the BV and BJ segments only 1 of 13 possible TCR beta chains would have been
detectable. Because TCR beta chains of T lymphocytes that consist of the BV13S1 or BV22 gene
segments combined with one of the other 12 possible BJ gene segments would have been lost (Rowen
et al., 1996), a semi-biased TCR beta chain PCR protocol was established (Section 3.3, p. 71).
Instead of employing reverse primers annealing to the BJ segment, primers annealing to the BC region
were designed. Combining those with the BV13S1- or BV22-specific forward primers, all 13 possible
TCR beta chain arrangements could be amplified. The new primer combination employing the
BV13S1-specific forward primers was evaluated using RNA isolated from inflamed tonsil tissue. Six
different BV13S1+ TCR beta chain sequences were determined (Table 25, p. 72). With this semi-
specific TCR beta chain PCR protocol now the probability for obtaining a sequence from isolated
single cells stained for a specific TCR V beta segment was raised significantly.
Unfortunately, from the 42 CD8 beta+/TCR BV13S1
+ and 23 CD8 beta
+/TCR BV22
+ isolated single
cells the clonally expanded TCR beta chains BV13S1-BJ2.3 and BV22-BJ2.1 could not be amplified
(Section 3.4, p. 72). Instead two different TCR beta chains BV13S1-BJ2.3 with the N(D)N sequences
GTS and ARAAGA were detected (Table 26, p. 73). Those did not belong to clonally expanded T cell
populations and no correlating TCR alpha chains could be identified. The latter might be due to

DISCUSSION
98
statistical reasons resulting from the huge amount of applied primers. Even from freshly isolated
human blood lymphocytes only in 28.6 % the TCR alpha chain could be amplified (Section 3.1, p. 64).
Taken together, these results strongly indicate an important role in active lesions of the T lymphocyte
populations carrying the TCR beta chains BV13S1-BJ2.3 and BV22-BJ2.1 with the N(D)N sequences
SLGA and GAGEH, respectively. For future experiments single cell isolation from tissue block 10a
should be considered to finally reveal the matching TCR alpha chain.
4.1.3 The Unbiased PCR Method for TCR Identification
In the unbiased approach for identification of alpha beta TCR molecules from potentially disease-
related CD8+ T lymphocytes, mainly cells expressing the activation marker CD134 were investigated.
Here the sequence of the TCR beta chains was not known beforehand. Thus a new set of primers
amplifying TCR beta chains irrespectively of the rearranged BV and BJ segments was needed.
Song-Min Kim designed a set of nine forward primers (Table 6, p. 19) annealing to all known human
BV gene segments. Those were combined with reverse primers annealing to the BC region, allowing
the amplification of all possible human TCR beta chain sequences. During this thesis and as part of the
publication Kim et al., 2012 the PCR protocol was tested on single human CD3+ blood T lymphocytes
(Section 3.1, p. 64). From 52 blood T cells 7 different TCR beta chains were identified (13.5 %). For
these seven TCR beta chains two matching TCR alpha chains were detected yielding matching TCR
alpha- and beta-chain sequences in 3.8 % of all analyzed single cells (Table 21, p. 64).
The yield of paired TCR alpha- and beta-chain sequences was relatively low compared to experiments
performed on viable T cells from explant cell cultures from lesional biopsies of patients with chronic
plaque psoriasis (Kim et al., 2012). There in 78 % of all analyzed single cells matching TCR beta- and
alpha-chain sequences were obtained. This difference might be due to the following two reasons: First,
the sorting of single CD3+ blood T lymphocytes was performed by Wolfgang Klinkert employing the
FACSVantage SE machine. He claimed that due to technical problems only in every third tube
actually a sorted single cell could be expected. Second, the sorted single cells were frozen at –80°C
before PCR analysis was performed. Thus strand breakage of mRNA molecules during freezing and
thawing could have occurred and decreased the PCR efficiency.
As the functionality of the newly developed unspecific PCR protocol was proven and published,
analysis of alpha beta TCR molecules from potentially disease-related CD8+ T lymphocytes in brain
tissue of MS patient FE was performed. Mainly T cells expressing the activation marker CD134 were
investigated. As mentioned above, positive staining of CD8 and the TCR beta chains BV13S1 or
BV22 for the clone-specific approach in brain tissue slides of the MS patient FE was a rare event
(Section 4.1.2, p. 97). Thus also CD8 single positive cells were isolated from these slides and analyzed
employing the unbiased TCR beta chain PCR protocol.
From 578 CD8beta+ cells isolated from 84 tissue slides none and from 474 CD8 beta
+/CD134
+ cells
isolated from 26 tissue slides one TCR beta chain sequence and no corresponding TCR alpha chain
sequence was obtained (Section 3.4, p. 72). The TCR beta chain originated from an activated
T lymphocyte which did not belong to a clonally expanded population in MS patient FE (Backes,

DISCUSSION
99
2010). However, a low yield of matching TCR alpha and beta chains obtained from single cells in
frozen brain biopsies was already observed during the establishment of the unbiased PCR protocol
(Kim et al., 2012). In these earlier experiments from 643 isolated single cells 68 TCR beta chains
(10,6 %) and 13 TCR alpha chains were identified yielding 2 % paired TCR alpha and beta chains.
The very low output might be due to the initial RNA quality in the frozen tissue blocks of MS
patient FE and loss of RNA quality during the staining protocol for single cell isolation (Section
4.1.1.3, p. 96). A lot of tissue fractions appearing like a CD8 single positively stained T lymphocyte
could have been isolated because of the low image quality (Section 4.1.1.1, p. 94). To maintain RNA
quality in future experiments isolated single cells should be processed faster. The recent acquisition of
a pipetting robot might improve the technical basis for these requirements.
4.2 Future Prospects (I)
After pre-investigation by spectratyping, TCR beta chains of clonally expanded T cell populations can
be detected and their matching TCR alpha chains may be identified employing the clone-specific PCR
protocol (Seitz et al., 2006). Based on this method, here a semi-biased PCR protocol was established,
allowing the amplification of all possible TCR beta chains that were arranged employing one specified
BV gene segment independent of the BJ gene segment. In future experiments the characterization of
TCR beta chains will not be restricted to pre-detected clones but also TCR beta chains containing
different BJ segments may be identified. Despite differences in the BJ gene segments, those TCR beta
chains might reveal closely related CDR3 sequences and antigen specificities. Further, spectratyping
can be replaced by commercially available pyrosequencing analysis. This approach would save time
and a lot of precious biopsy material.
Clinically it would be very interesting to finally identify the matching TCR alpha chains of the
clonally expanded T cell populations carrying the BV13S1-BJ2.3 and BV22-BJ2.1 TCR beta chain in
MS patient FE. As these T cell clones persisted for at least five years, they probably play a crucial role
in the disease mechanism. In further experiments the complete TCR alpha- and beta-chain sequences
could be reconstructed and employed for antigen search experiments.
Development of the PCR protocol for unbiased identification of TCR beta chains provides an even
more powerful tool for characterization of disease-related alpha beta TCR molecules (Kim et al.,
2012). Employing a universal primer set for all known BV gene segments no pre-investigation of the
T cell repertoire is needed. The TCR beta chains of all T cells considered disease-related due to their
activation status or morphology is now possible.
Further, Sun et al. (2012) designed an alternative pool of primers for unbiased amplification of TCR
beta chains from single T lymphocytes. Their experiments were performed on viable sorted single
T cells originating from human blood leading to high yields of TCR beta chain sequences. This
unbiased pool of primers for the TCR beta chain could be applied using the PCR protocol for
identification of TCR alpha chains (Section 2.7.6, p. 58) combined with reverse primers annealing to
the BC region.

DISCUSSION
100
Taken together, the described methods for identification of matching TCR alpha and beta chains might
be extended on further T cell subsets. Instead of staining for CD8 or CD134, staining for CD4 and
markers of e.g. regulatory T cells, NK T cells or MAIT cells might be performed. For instance this
would provide more profound insights into the molecular mechanisms underlying different kinds of
autoimmune-mediated diseases, immune attacks on tumor cells or complications after organ transplan-
tation.
4.3 Mimotope Identification of the MS-Related TCR 2D1 on HLA-A2
Molecules
Parallel to the characterization of disease-related CD8+ T lymphocytes from brain tissue sections of
MS patient FE, the linkage of moderate disease susceptibility to the expression of HLA-A2 molecules
was investigated. In 2011 the IMSGC and WTCCC2 published the latest results of genome-wide
association studies for MS. Primarily different HLA alleles are linked to disease susceptibility.
Notably a risk factor is carrying the HLA-A*0301 allele and a protective effect correlates with carrying
the HLA-A*0201 allele (Brynedal et al., 2007; Burfoot et al., 2008).
In 1997, Honma et al. isolated the CD8+ T cell clone 2D1 from an MS patient. Further, they
determined activation of the T cell clone 2D1 by the PLP45-53 peptide (KLIETYFSK) presented on
HLA-A3 molecules. In 2008, Friese et al. used humanized mouse models to define the contributions of
both HLA alleles to MS susceptibility. They generated double-transgenic mice expressing HLA-A3
and the TCR 2D1 as well as triple-transgenic mice expressing HLA-A3, the TCR 2D1 and HLA-A2.
4 % of the double-transgenic mice showed mild spontaneous motor deficits and 25 % developed an
MS-like disease after immunization with PLP45-53 peptide. Strikingly even after immunization not a
single triple-transgenic mouse showed symptoms. Further investigation revealed depletion of 2D1
T cells in the thymus of triple-transgenic mice. This observation indicated recognition of unknown
peptide(s) in the context of HLA-A2 molecules leading to negative selection. The hypothesis was
affirmed by the molecular similarity of HLA-A2 and HLA-A3 molecules (Figure 4, p. 6; McMahon et
al., 2011).
The T cell clone 2D1 was isolated from an MS patient carrying both, the HLA-A*0201 and
HLA-A*0301 alleles. The events during positive and negative selection of the clone 2D1 in the
patient’s thymus cannot be reconstructed. Thus it cannot be known whether the TCR 2D1 was initially
selected due to interaction with HLA-A2 or HLA-A3 molecules. However, the TCR 2D1 appeared
double-restricted by HLA-A3 as well as HLA-A2 molecules.
In a first round of experiments the capability of TCR 2D1 to allorecognize peptides bound to HLA-
B38 molecules and to even xenorecognize murine antigen presenting molecules was observed.
Additionally the TCR 2D1 was proven to crossrecognize one closely related nonamer derivative of the
PLP45-53 peptide presented on HLA-A3 molecules. Then the first nonamer peptide presented on HLA-
A2 molecules activating the TCR 2D1 was identified. Finally mimotopes presented on HLA-A2
molecules were identified. Based on the 3 structurally closely related mimotopes a motif-based

DISCUSSION
101
database search was performed revealing further 25 mimotopes presented on HLA-A2 molecules and
recognized by the TCR 2D1.
4.3.1 First Evidence for Allo- and Crossreactivity of the TCR 2D1
The properties of TCR 2D1 were compared to the well-characterized TCR B7. This TCR was initially
shown to recognize the TAX11-19 peptide (LLFGYPVYV) on HLA-A2 molecules (Ding et al., 1998).
Crossrecognition of the peptides LGYGFVNYI, LGYGFVNYV, MLWGYLQYV and ILYGFIHIV
presented on HLA-A2 molecules was later detected by Hausmann et al. (1999).
Unlike TCR B7, the TCR 2D1 showed signs of allo- and even xenorecognition in the very first
experiment examining different cell lines as APC (Section 3.5.4, p. 77). 2D1-NFAT-sGFP reporter
cells were activated by murine GP+E cells stably expressing HLA-B38 molecules. Allorecognition of
endogenous peptides presented on HLA-B38 molecules might have been the underlying mechanism as
GP+E cells stably expressing HLA-A2 molecules failed to activate the 2D1-NFAT-sGFP reporter cells.
Further, murine LTK cells stably expressing human HLA-A1, HLA-A2 or HLA-A3 molecules
activated 2D1-NFAT-sGFP reporter cells in an HLA- and PLP45-53 peptide-independent manner. Thus
xenorecognition of murine antigen-presenting molecules on the surface of all different LTK cell lines
might have occurred. These characteristics strongly indicated a high probability for the TCR 2D1 to
additionally recognize peptides presented on HLA-A2 molecules.
In further experiments crossrecognition of nonamer peptides similar to the known peptides PLP45-53
(KLIETYFSK) and TAX11-19 (LLFGYPVYV) on the HLA-A3 and HLA-A2 molecules by the TCRs
2D1 and B7 was investigated (Section 3.5.6, p. 79). Therefore the two known peptides were entered
into the protein search matrix of BLAST. As “best-guess” candidates twelve and seven derivatives of
the PLP45-53 and TAX11-19 peptide respectively were chosen according to their source organisms or
source proteins (Table 14, p. 24). Hereby neither HLA anchor positions nor potential TCR interaction
residues were taken into account. This experiment aimed at categorizing the capability of
crossrecognition of the TCR 2D1 compared to the TCR B7.
In line with Hausmann et al. (1999) a broad spectrum of crossrecognized peptides presented on HLA-
A2 molecules was detected for the TCR B7. Besides four derivatives of the TAX11-19 peptide even
seven derivatives of the structurally non-related PLP45-53 peptide resulted in activation of the B7-
NFAT-sGFP reporter cell line. Recognition of the PLP45-53 derived peptide candidates presented on
HLA-A2 molecules was surprising, as they did not display sequences in line with typical HLA-A2
anchor residues and thus should not be presented on those molecules. Although the TCR 2D1 showed
some crossrecognition, this appeared in a very strict manner. Only one derivative of the PLP45-53
(KLIETYFSK) peptide with only one exchanged AA at position 8 (KLIETYFKK) activated the
reporter cell line 2D1-NFAT-sGFP in the context of HLA-A3.
Strikingly, during this experiment the first recognition of a peptide presented on HLA-A2 molecules
by the TCR 2D1 was verified. Whereas the reporter cell line B7-NFAT-sGFP was not activated by any
peptide presented on HLA-A3 molecules, the cell line 2D1-NFAT-sGFP was capable of recognizing
the TAX11-19 peptide derivative NLFGNPVYF in the context of HLA-A2 molecules. This peptide
DISCUSSION
102
showed a similar sequence to the later detected eightmer mimotopes (Section 4.3.2.2, p. 103). The
mode of activation was not as strong as activation through the PLP45-53 peptide and its derivative
(KLIETYFSK and KLIETYFKK) but still detectable in two independent experiments (Figure 19,
p. 80). For the first time the TCR 2D1, which originated from an MS patient carrying both, the
HLA-A*0201 and HLA-A*0301 alleles, was shown to be double-restricted.
4.3.2 Identification of Mimotopes Recognized by the TCR 2D1 on HLA-A2 Molecules
After the capability of the TCR 2D1 to recognize peptides presented on HLA-A2 molecules was
verified, experiments for unbiased identification of mimotopes were performed. Therefore a new
technique for the identification of antigenic peptides recognized by HLA class I-restricted
T lymphocytes was employed (Siewert et al., 2012). Based on the three thereby identified mimotopes
a shared motif was determined and database search for related existing peptides was conducted. In
total 28 new peptide sequences were described to activate the TCR 2D1 in the context of HLA-A2
molecules.
4.3.2.1 Unbiased Identification of Antigenic Peptides
The technique developed by Siewert et al. (2012) was the first method for unbiased in vitro antigen
search applicable for all HLA class I restricted TCRs (Section 2.8.4, p. 60). In an earlier approach van
der Bruggen et al. (2007) transfected patient-derived full-length cDNA expression libraries into
autologous APCs. Those APCs were scanned with patient-derived T cells. Only in very rare cases
autologous APCs of a patient are available and the ability of APCs to correctly process antigens in
vitro is very limited. Further, peptide-based screening approaches were independent of antigen
processing (Mohme et al., 2013; Nino-Vasquez et al., 2004; Sospedra et al., 2003) but not all types of
peptides may reach the HLA molecules on APCs if applied from the outside. For example
hydrophobic candidates might accumulate and precipitate in aqueous cell culture media or disappear
into cell membranes.
For the unbiased identification of mimotopes presented on HLA-A2 molecules and recognized by the
TCR 2D1, COS-7 cells stably expressing HLA-A2 molecules served as APC (Section 3.5.2, p. 75).
COS-7 cells derive from kidney tissue of the African green monkey. These cells are closer related to
human than any rodent-derived cell lines, such as LTK or GP+E cells. Hence mechanisms associated
with intracellular signaling or protein turnover might be better comparable to human cells. In 2007
Godelaine et al. successfully employed COS-7 cells as APCs for antigen search of CD8+ T cells.
The COS-7-A2 cells were transfected with PECP libraries, coding for millions of different peptides of
defined lengths with or without fixed AAs at certain positions. Co-cultured 2D1-NFAT-sGFP reporter
cells stably expressed the TCR 2D1 as well as sGFP under the control of the NFAT promoter, leading
to green fluorescence upon TCR activation (Section 3.5.1, p. 75).
As in earlier experiments recognition of the nonamer peptide NLFGNPVYF presented on HLA-A2
molecules was observed, first the N27 library from Katherina Siewert coding for random nonamer
peptides was applied. Screening 27.7 x10⁶ transfected APCs, no mimotope sequences were obtained.

DISCUSSION
103
According to Siewert, 2011 the employed N27 library coded for approximately 4 x10⁶ of all
statistically possible 512 x109 different nonamer peptides. The N27 library was one of the first
libraries produced in our laboratory. The low clone number was obtained due to lacking experience.
Thus no peptide sequence activating the TCR 2D1 in the context of HLA-A2 molecules might have
been coded as the stated clone number was screened in almost 7-fold excess. As in recent attempts of
library generation clone numbers of up to 4 x10⁸ were obtained (Section 3.5.3, p. 76), for future
experiments a new N27 library should be generated.
Next the PECP libraries A2269
and 9L kindly provided by Katherina Siewert were applied. In line with
the HLA-A2 anchor motif stated at http://www.syfpeithi.de/home.htm, those libraries coded for
nonamer peptides with I, V and L at the positions 2, 6 and 9 respectively or merely L at the position 9.
Again no mimotope sequence was obtained. These results were not too surprising as in the analysis of
“best-guess” candidates the antigenic peptide NLFGNPVYF did fit into the fixed AA scheme.
Additionally presentation on HLA-A2 molecules and recognition by the TCR B7 of peptides could be
demonstrated which did not match the stated anchor residues (Section 3.5.6, p. 79).
Five new PECP libraries of different lengths were designed. The PECP libraries N24, N30 and N39
coded for random eight-, ten- and tridecamers, whereas the PECP libraries 8L and 24L coded for
peptides with seven or nine random AAs and L at position 8 or 10 respectively (Section 3.5.3, p. 76).
Here except for the N30 library very high clone numbers were obtained. However, screening APCs
transfected with the N24, N30, N39 and 10L libraries no mimotope sequences were obtained.
In contrast, screening of APCs transfected with the 8L library resulted in 27 clusters of at least six
activated 2D1-NFAT-sGFP reporter cells and finally the three mimotope sequences LIGEVFVL,
LVGEVWGL and LLGEVFEL were identified. For the first time the TCR 2D1 was shown to
recognize three structurally closely related eightmer peptides presented on HLA-A2 molecules
(Section 3.6.1, p. 81).
In antigen search experiments employing other TCRs, mimotopes were obtained from clusters
containing only two to four activated reporter cells (Siewert, 2011). In these studies the TCR
molecules of interest were cloned into different subtypes of 58α-β
- reporter cells. The T hybridoma
cells employed during this thesis revealed “true” antigenic activation only then, when clusters of at
least six activated cells were observed. Employing such cells in further experiments will save a lot of
time and money. Microscopic screening can be performed very fast, because huge clusters of activated
cells are very obvious compared to small accumulations. Those clusters might even facilitate future
automation of cell search experiments.
4.3.2.2 Motif-Based Database Search
The TCR 2D1 displayed very strict recognition patterns for peptides presented on both, the HLA-A3
and HLA-A2 molecules. Presented on HLA-A3 besides the already known PLP45-53 peptide
(KLIETYFSK) only nonamer derivatives with one AA exchange at the positions 3, 5, 7 or 8
(KLAETYFSK, KLIEAYFSK, KLIETYASK, KLIETYFAK and KLIETYFKK) activated the TCR
2D1 (Section 3.5.5, p. 78 and Section 3.5.6, p. 79). The unbiasedly detected eightmer mimotopes
LIGEVFVL, LVGEVWGL and LLGEVFEL recognized on HLA-A2 molecules again presented a

DISCUSSION
104
very strict shared AA motif. AAs at the positions 1, 3, 4, 5 and 8 were identical, AAs at position 2
were aliphatic and AAs at position 6 were aromatic. Only position 7 seemed variable.
Falk et al. discovered in 1991 that nonamer peptides bound to HLA-A2 molecules should present L or
M at position 2, V or L at position 9 and V at the auxiliary anchor position 6. Adapted to eightmer
peptides all tree mimotopes were consistent with this claim. As HLA-A2 interaction motif they
displayed L at position 1 and 9 and V at the auxiliary anchor position 5. Hence the positions 2
(aliphatic AAs I, L or V), 3 (G), 4 (E) and 6 (aromatic AAs F or W) seemed to interact with the TCR
2D1.
Based on the very strict motif a matrix for the search of related peptides was designed, which assigned
probabilities to certain AAs at each position of eightmer peptides (Table 29, p. 82). With this matrix
our collaborator Stefan Pinkert searched for matching peptides in protein databases for the taxa 9606
(human), 10090 (mouse), 408170 (human gut metagenome), 2 (bacteria) and 10239 (viruses). The taxa
were chosen according to the following criteria:
First, the TCR 2D1 was isolated from a human MS patient carrying both the HLA-A*0201 and
HLA-A*0301 alleles (Honma et al., 1997). Second, in a triple-transgenic mouse model the expression
of HLA-A2 besides the TCR 2D1 and HLA-A3 prevented spontaneous and provoked MS-like
symptoms (Friese et al., 2008). Peptides occurring in mouse and human were of special interest. Such
candidates might allow to transfer the molecular basis of the protective effect in the mouse model to
actual mechanisms in human MS. Third, recent evidence stretched the role of bacteria and especially
those of the human gut microbiota in MS susceptibility and course of disease (Berer et al., 2011;
Collins et al., 2012; Fung et al., 2012). Forth, several viruses were associated with MS (Virtanen and
Jacobson, 2012; Rainey-Barger et al., 2013; Sundqvist et al., 2013). Candidate peptides deriving from
pathogenic or commensal bacteria and viruses might activate immune cells. Due to a mechanism
called “molecular mimicry”, such activated immune cells might then recognize endogenous peptides
as well and perform tasks related to disease (Lucas et al., 2011).
The resulting list of hundreds of peptides was reduced excluding both, peptides that did not contain
AAs with at least two HLA-A2 anchor and/or TCR 2D1 contact positions and peptides deriving from
lethal or endemic bacteria from for example the deep sea. The now 37 candidate peptides were cloned
into peptide-coding plasmids, transfected into COS-7-A2 cells and screened for the activation of 2D1-
NFAT-sGFP cells (Section 3.6.2, p. 82). Subsequently a second matrix was designed according to all
activating and non-activating peptide sequences (Supplements 5.4, p. 112). The resulting list of even
more peptides was reduced according to the same criteria. Finally from 56 investigated candidates 25
mimotopes presented on HLA-A2 molecules activated the TCR 2D1 (Table 30, p. 83). The other
peptide sequences were either not presented on HLA-A2 molecules or did not result in activation of
the TCR 2D1 (Table 31, p. 83). Amongst the recognized eightmer peptides four derived from human
and mouse, five from mouse, three from human, three from human gut metagenome, ten from bacteria
and none from viruses.
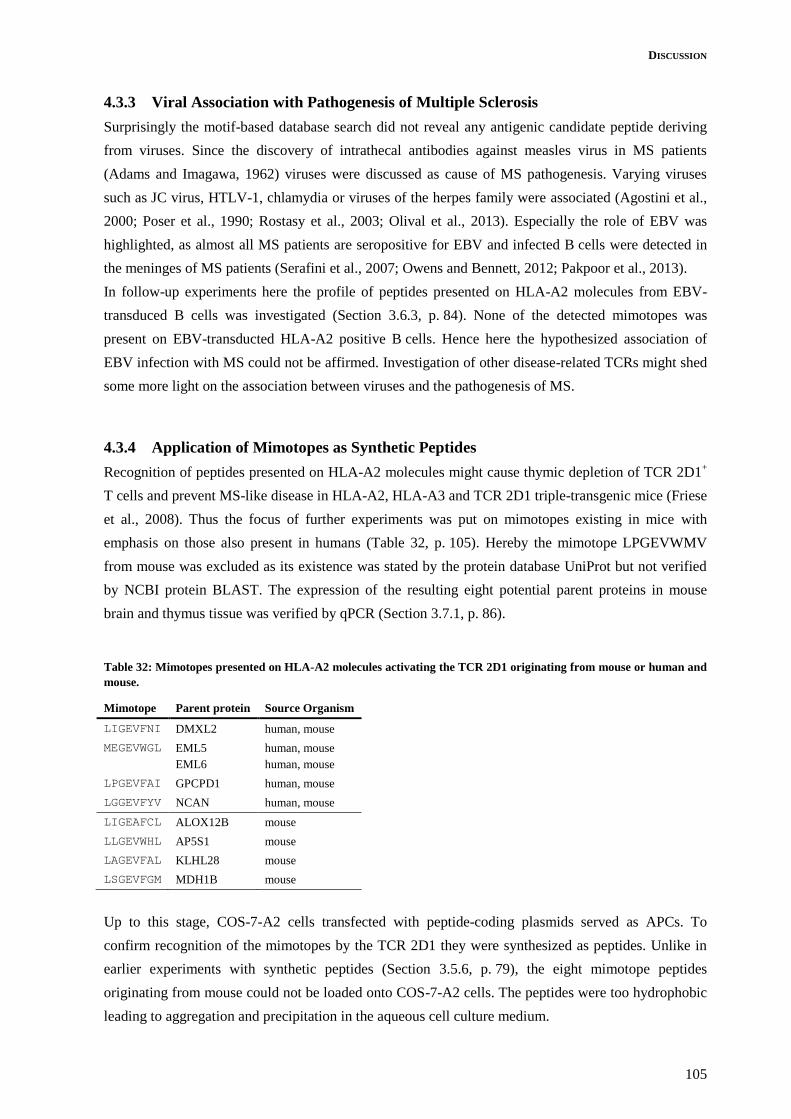
DISCUSSION
105
4.3.3 Viral Association with Pathogenesis of Multiple Sclerosis
Surprisingly the motif-based database search did not reveal any antigenic candidate peptide deriving
from viruses. Since the discovery of intrathecal antibodies against measles virus in MS patients
(Adams and Imagawa, 1962) viruses were discussed as cause of MS pathogenesis. Varying viruses
such as JC virus, HTLV-1, chlamydia or viruses of the herpes family were associated (Agostini et al.,
2000; Poser et al., 1990; Rostasy et al., 2003; Olival et al., 2013). Especially the role of EBV was
highlighted, as almost all MS patients are seropositive for EBV and infected B cells were detected in
the meninges of MS patients (Serafini et al., 2007; Owens and Bennett, 2012; Pakpoor et al., 2013).
In follow-up experiments here the profile of peptides presented on HLA-A2 molecules from EBV-
transduced B cells was investigated (Section 3.6.3, p. 84). None of the detected mimotopes was
present on EBV-transducted HLA-A2 positive B cells. Hence here the hypothesized association of
EBV infection with MS could not be affirmed. Investigation of other disease-related TCRs might shed
some more light on the association between viruses and the pathogenesis of MS.
4.3.4 Application of Mimotopes as Synthetic Peptides
Recognition of peptides presented on HLA-A2 molecules might cause thymic depletion of TCR 2D1+
T cells and prevent MS-like disease in HLA-A2, HLA-A3 and TCR 2D1 triple-transgenic mice (Friese
et al., 2008). Thus the focus of further experiments was put on mimotopes existing in mice with
emphasis on those also present in humans (Table 32, p. 105). Hereby the mimotope LPGEVWMV
from mouse was excluded as its existence was stated by the protein database UniProt but not verified
by NCBI protein BLAST. The expression of the resulting eight potential parent proteins in mouse
brain and thymus tissue was verified by qPCR (Section 3.7.1, p. 86).
Table 32: Mimotopes presented on HLA-A2 molecules activating the TCR 2D1 originating from mouse or human and
mouse.
Mimotope Parent protein Source Organism
LIGEVFNI DMXL2 human, mouse
MEGEVWGL EML5
EML6
human, mouse
human, mouse
LPGEVFAI GPCPD1 human, mouse
LGGEVFYV NCAN human, mouse
LIGEAFCL ALOX12B mouse
LLGEVWHL AP5S1 mouse
LAGEVFAL KLHL28 mouse
LSGEVFGM MDH1B mouse
Up to this stage, COS-7-A2 cells transfected with peptide-coding plasmids served as APCs. To
confirm recognition of the mimotopes by the TCR 2D1 they were synthesized as peptides. Unlike in
earlier experiments with synthetic peptides (Section 3.5.6, p. 79), the eight mimotope peptides
originating from mouse could not be loaded onto COS-7-A2 cells. The peptides were too hydrophobic
leading to aggregation and precipitation in the aqueous cell culture medium.

DISCUSSION
106
To circumvent this problem, HLA-A2 molecules were refolded in vitro (Section 3.7.2, p. 87). As this
is a very costly and complex procedure, only the four mimotopes present in mouse and human were
investigated. The candidate peptides DMXL2813-820, EML5997-1004 / EML6997-1004, GPCPD115-22, and
NCAN257-264 in complex with HLA-A2 molecules resulted in activation of 2D1-NFAT-sGFP reporter
cells. Employing this method, peptides of any characteristics may be loaded onto HLA class I
molecules. Activation capacity of those complexes can then easily be investigated in an in vitro system.
4.4 In Vitro Processing of Potential Parent Proteins
The eight detected mimotopes originating from mouse cannot intrinsically be linked to processes
preventing MS-like symptoms in triple-transgenic mice expressing the TCR 2D1, HLA-A2 and HLA-
A3 (Friese et al., 2008). Expression of all potential parent proteins in brain and thymus was verified
(Section 3.7.1, p. 86), but antigen processing resulting in presentation of antigenic peptides still
remained unproven.
Ideally, professional APCs originating from triple-transgenic mice might be cultured in vitro and fed
with purified potential parent proteins. As read-out system they would be co-cultured with 2D1-
NFAT-sGFP reporter cells. In general, autologous APCs present the best option for the analysis of
antigen processing. However, for most immune-mediated diseases the question of which cell type
actually is the APC in the pathogenic mechanism remains unsolved. Should the correct cell type be
identified, cells still might not be available in sufficient numbers or be generally suited for in vitro
experiments. Thus here the antigen processing capability of first COS-7-A2 and second HLA-A2
positive EBV-transduced B cells was investigated. These cells were available in our laboratories and
could be cultured with minor efforts.
For antigen presentation in the context of HLA class I molecules, proteins are degraded in the cytosol
by the immunoproteasome (Rock et al., 2002). Peptides are then transported into the endoplasmatic
reticulum and loaded onto HLA class I molecules (Yewdell et al., 2003). Those complexes finally
reach the cell surface. This process can be performed by almost all nucleated cells in the body. In
expectation of correct antigen processing, COS-7-A2 cells were transfected with plasmids coding for
truncated versions of the potential parent proteins that contained the antigenic mimotope sequences
(Section 3.7.3, p. 88).
The proteins were truncated according to their domain structure (Supplements 5.8, p. 126). The
database “UniProt” provided known and predicted domains according to the AA sequence of the
proteins of interest. The candidate peptides DMXL2813-820, EML5997-1004 / EML6997-1004, and
NCAN257-264 were positioned between two of such domains. Thus the parent proteins were truncated
before the first and after the second domain. The mimotope GPCPD115-22 was positioned closely to the
amino terminus of the parent protein in a carbohydrate-binding module. In this case the truncation was
performed after this module, leading to expression of only one domain.
The single-domain truncated protein GPCPD11-118-V5 was expressed in low amounts. NCAN156-359-V5
was expressed stronger but sticking to membranes due to strong hydrophobicity. For unknown reasons
DMXL2748-926-V5 and EML5897-1038-V5 were not expressed in COS-7-A2 cells (Figure 24, p. 89). The

DISCUSSION
107
plasmid constructs were based on those coding for mimotope peptide sequences and contained all the
same regulatory sequences. Nonetheless COS-7-A2 cells expressing the truncated proteins
GPCPD11-118-V5 and NCAN156-359-V5 were co-cultivated with 2D1-NFAT-sGFP reporter cells but
failed to activate them (Figure 25, p. 89). In line with earlier experiments, COS-7-A2 cells were not
capable of correct antigen processing (Siewert, 2011; Bhonsle 2011).
In a second approach, HLA-A2 positive EBV-transducted B cell lines were employed as APCs
(Section 3.7.4, p. 90). Those cells did not express the truncated proteins but might be capable of cross-
presentation (Groothuis and Neefjes, 2005). B cells serve besides dendritic cells or macrophages as
APC in the immune system. Cross-presentation of antigens that were taken up from the surrounding
milieu on HLA class I molecules by dendritic cells is well known (Ackerman and Cresswell, 2004).
Additionally it was shown that also B cells and other non-professional APCs are capable of cross-
presentation (Bennett et al., 1998; Gnjatic et al., 2003).
Thus the truncated potential parent proteins His6-DMXL2748-926-V5, His6-EML5897-1038-V5, His6-
GPCPD11-118-V5 and His6-NCAN156-359-V5 were purified and fed to HLA-A2 positive EBV-
transducted B cells. They were co-cultivated with 2D1-NFAT-sGFP reporter cells but failed to
activate them. First of all the EBV-transduced B cells might not be able to uptake proteins from the
cell culture medium and process them leading to mimotope presentation in this artificial setup. Second
their clumpy growing might have impeded antigen presentation to 2D1-NFAT-sGFP reporter cells.
4.5 Future Prospects (II)
Here for the first time one nonamer and 28 eightmer peptides presented on HLA-A2 molecules were
verified to activate the 2D1 TCR. Thus the TCR 2D1 was demonstrated to be crossreactive and
double-restricted. The structural similarity of the eightmer mimotopes allowed fast identification of
eight potential parent proteins originating from mouse, therefrom four additionally existing in human.
In future experiments the role of those proteins in the immunological processes of the investigated
mice should be studied. First professional APCs originating from triple-transgenic mice should be
cultured in vitro and fed with purified potential parent proteins. As read-out system they could be co-
cultured with 2D1-NFAT-sGFP reporter cells generated during this thesis. When these APCs succeed
in correct antigen processing and presentation of the mimotope peptides, the gene(-s) coding for the
parent protein(-s) could be knocked out or knocked down in the triple-transgenic mice. Despite
probable polygenetic influences now these mice might develop MS-like symptoms again.
Interestingly, the T cell clone 2D1 was isolated from an MS patient carrying both, the HLA-A*0201
and HLA-A*0301 alleles. In contrast to the effects observed in the triple-transgenic mouse model,
expression of HLA-A2 molecules did not protect the patient from MS. Even though critical disparities
between animal models and human are observed for various diseases, such models contribute to the
understanding of health and disease and the development of new treatments.
Taken together, the methods for the characterization of disease-related alpha beta TCRs from CD8+
T cells and for the identification of antigenic peptides recognized by HLA class I-restricted
T lymphocytes provide powerful tools to better understand underlying mechanisms in T cell-mediated

DISCUSSION
108
diseases. Large patient cohorts might be studied and perhaps some common patterns could be detected.
The obtained knowledge would allow development of new therapeutic approaches, diagnostic or
prognostic biomarkers or even T cell based vaccinations. In terms of personalized medicine in the far
future one might even think of developing a peptide vaccine against MS applicable for individuals
carrying the HLA-A*0201 allele based on the mimotopes identified in this thesis.
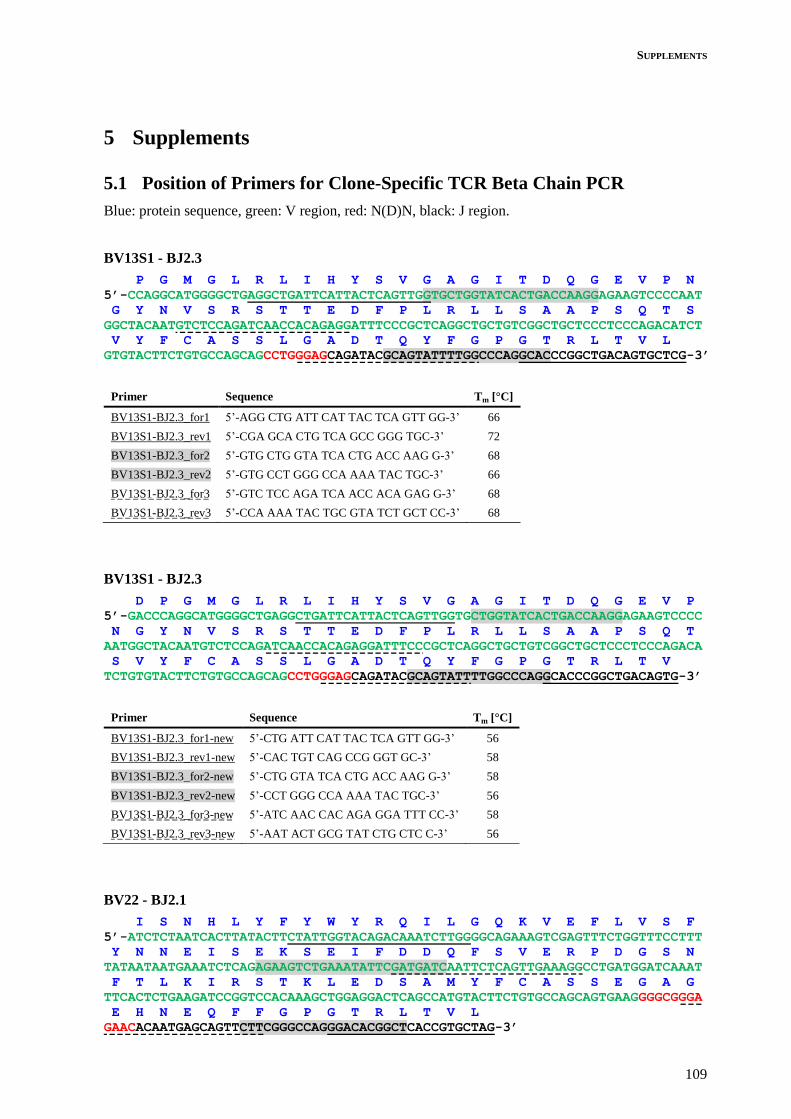
SUPPLEMENTS
109
5 Supplements
5.1 Position of Primers for Clone-Specific TCR Beta Chain PCR
Blue: protein sequence, green: V region, red: N(D)N, black: J region.
BV13S1 - BJ2.3
P G M G L R L I H Y S V G A G I T D Q G E V P N
5’-CCAGGCATGGGGCTGAGGCTGATTCATTACTCAGTTGGTGCTGGTATCACTGACCAAGGAGAAGTCCCCAAT
G Y N V S R S T T E D F P L R L L S A A P S Q T S
GGCTACAATGTCTCCAGATCAACCACAGAGGATTTCCCGCTCAGGCTGCTGTCGGCTGCTCCCTCCCAGACATCT
V Y F C A S S L G A D T Q Y F G P G T R L T V L
GTGTACTTCTGTGCCAGCAGCCTGGGAGCAGATACGCAGTATTTTGGCCCAGGCACCCGGCTGACAGTGCTCG-3’
Primer Sequence Tm [°C]
BV13S1-BJ2.3_for1 5’-AGG CTG ATT CAT TAC TCA GTT GG-3’ 66
BV13S1-BJ2.3_rev1 5’-CGA GCA CTG TCA GCC GGG TGC-3’ 72
BV13S1-BJ2.3_for2 5’-GTG CTG GTA TCA CTG ACC AAG G-3’ 68
BV13S1-BJ2.3_rev2 5’-GTG CCT GGG CCA AAA TAC TGC-3’ 66
BV13S1-BJ2.3_for3 5’-GTC TCC AGA TCA ACC ACA GAG G-3’ 68
BV13S1-BJ2.3_rev3 5’-CCA AAA TAC TGC GTA TCT GCT CC-3’ 68
BV13S1 - BJ2.3
D P G M G L R L I H Y S V G A G I T D Q G E V P
5’-GACCCAGGCATGGGGCTGAGGCTGATTCATTACTCAGTTGGTGCTGGTATCACTGACCAAGGAGAAGTCCCC
N G Y N V S R S T T E D F P L R L L S A A P S Q T
AATGGCTACAATGTCTCCAGATCAACCACAGAGGATTTCCCGCTCAGGCTGCTGTCGGCTGCTCCCTCCCAGACA
S V Y F C A S S L G A D T Q Y F G P G T R L T V
TCTGTGTACTTCTGTGCCAGCAGCCTGGGAGCAGATACGCAGTATTTTGGCCCAGGCACCCGGCTGACAGTG-3’
Primer Sequence Tm [°C]
BV13S1-BJ2.3_for1-new 5’-CTG ATT CAT TAC TCA GTT GG-3’ 56
BV13S1-BJ2.3_rev1-new 5’-CAC TGT CAG CCG GGT GC-3’ 58
BV13S1-BJ2.3_for2-new 5’-CTG GTA TCA CTG ACC AAG G-3’ 58
BV13S1-BJ2.3_rev2-new 5’-CCT GGG CCA AAA TAC TGC-3’ 56
BV13S1-BJ2.3_for3-new 5’-ATC AAC CAC AGA GGA TTT CC-3’ 58
BV13S1-BJ2.3_rev3-new 5’-AAT ACT GCG TAT CTG CTC C-3’ 56
BV22 - BJ2.1
I S N H L Y F Y W Y R Q I L G Q K V E F L V S F
5’-ATCTCTAATCACTTATACTTCTATTGGTACAGACAAATCTTGGGGCAGAAAGTCGAGTTTCTGGTTTCCTTT
Y N N E I S E K S E I F D D Q F S V E R P D G S N
TATAATAATGAAATCTCAGAGAAGTCTGAAATATTCGATGATCAATTCTCAGTTGAAAGGCCTGATGGATCAAAT
F T L K I R S T K L E D S A M Y F C A S S E G A G
TTCACTCTGAAGATCCGGTCCACAAAGCTGGAGGACTCAGCCATGTACTTCTGTGCCAGCAGTGAAGGGGCGGGA
E H N E Q F F G P G T R L T V L
GAACACAATGAGCAGTTCTTCGGGCCAGGGACACGGCTCACCGTGCTAG-3’
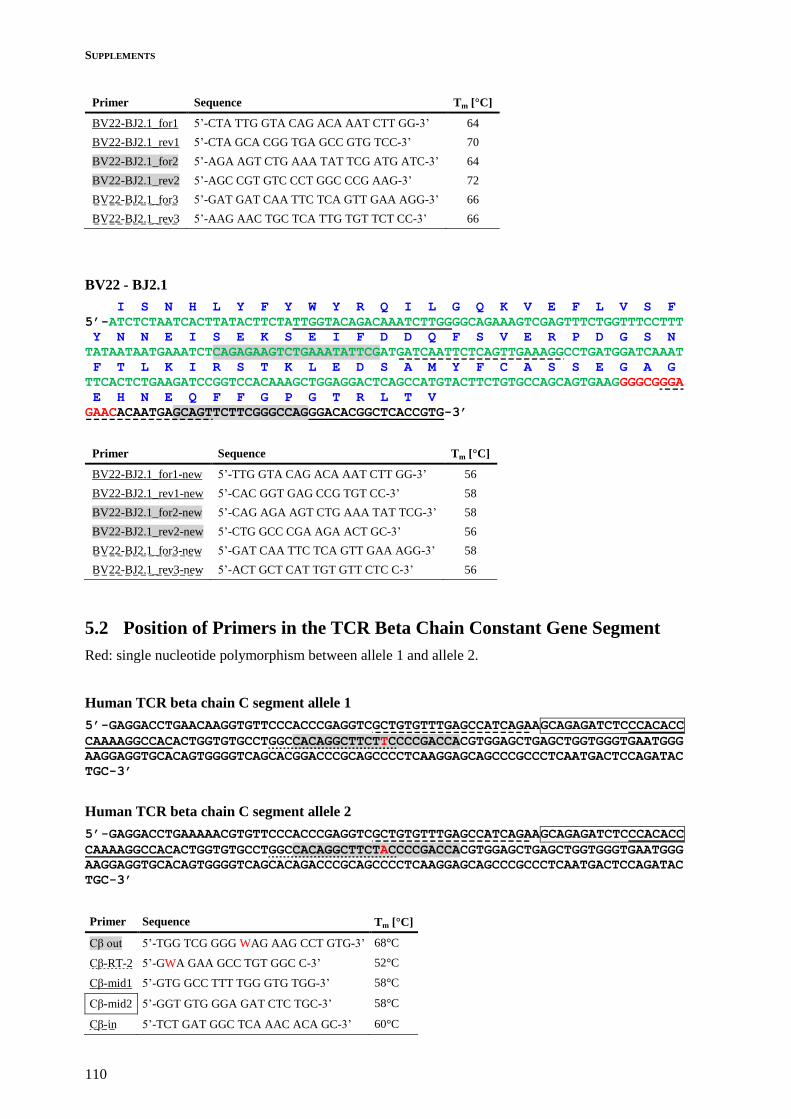
SUPPLEMENTS
110
Primer Sequence Tm [°C]
BV22-BJ2.1_for1 5’-CTA TTG GTA CAG ACA AAT CTT GG-3’ 64
BV22-BJ2.1_rev1 5’-CTA GCA CGG TGA GCC GTG TCC-3’ 70
BV22-BJ2.1_for2 5’-AGA AGT CTG AAA TAT TCG ATG ATC-3’ 64
BV22-BJ2.1_rev2 5’-AGC CGT GTC CCT GGC CCG AAG-3’ 72
BV22-BJ2.1_for3 5’-GAT GAT CAA TTC TCA GTT GAA AGG-3’ 66
BV22-BJ2.1_rev3 5’-AAG AAC TGC TCA TTG TGT TCT CC-3’ 66
BV22 - BJ2.1
I S N H L Y F Y W Y R Q I L G Q K V E F L V S F
5’-ATCTCTAATCACTTATACTTCTATTGGTACAGACAAATCTTGGGGCAGAAAGTCGAGTTTCTGGTTTCCTTT
Y N N E I S E K S E I F D D Q F S V E R P D G S N
TATAATAATGAAATCTCAGAGAAGTCTGAAATATTCGATGATCAATTCTCAGTTGAAAGGCCTGATGGATCAAAT
F T L K I R S T K L E D S A M Y F C A S S E G A G
TTCACTCTGAAGATCCGGTCCACAAAGCTGGAGGACTCAGCCATGTACTTCTGTGCCAGCAGTGAAGGGGCGGGA
E H N E Q F F G P G T R L T V
GAACACAATGAGCAGTTCTTCGGGCCAGGGACACGGCTCACCGTG-3’
Primer Sequence Tm [°C]
BV22-BJ2.1_for1-new 5’-TTG GTA CAG ACA AAT CTT GG-3’ 56
BV22-BJ2.1_rev1-new 5’-CAC GGT GAG CCG TGT CC-3’ 58
BV22-BJ2.1_for2-new 5’-CAG AGA AGT CTG AAA TAT TCG-3’ 58
BV22-BJ2.1_rev2-new 5’-CTG GCC CGA AGA ACT GC-3’ 56
BV22-BJ2.1_for3-new 5’-GAT CAA TTC TCA GTT GAA AGG-3’ 58
BV22-BJ2.1_rev3-new 5’-ACT GCT CAT TGT GTT CTC C-3’ 56
5.2 Position of Primers in the TCR Beta Chain Constant Gene Segment
Red: single nucleotide polymorphism between allele 1 and allele 2.
Human TCR beta chain C segment allele 1
5’-GAGGACCTGAACAAGGTGTTCCCACCCGAGGTCGCTGTGTTTGAGCCATCAGAAGCAGAGATCTCCCACACC
CAAAAGGCCACACTGGTGTGCCTGGCCACAGGCTTCTTCCCCGACCACGTGGAGCTGAGCTGGTGGGTGAATGGG
AAGGAGGTGCACAGTGGGGTCAGCACGGACCCGCAGCCCCTCAAGGAGCAGCCCGCCCTCAATGACTCCAGATAC
TGC-3’
Human TCR beta chain C segment allele 2
5’-GAGGACCTGAAAAACGTGTTCCCACCCGAGGTCGCTGTGTTTGAGCCATCAGAAGCAGAGATCTCCCACACC
CAAAAGGCCACACTGGTGTGCCTGGCCACAGGCTTCTACCCCGACCACGTGGAGCTGAGCTGGTGGGTGAATGGG
AAGGAGGTGCACAGTGGGGTCAGCACAGACCCGCAGCCCCTCAAGGAGCAGCCCGCCCTCAATGACTCCAGATAC
TGC-3’
Primer Sequence Tm [°C]
Cβ out 5’-TGG TCG GGG WAG AAG CCT GTG-3’ 68°C
Cβ-RT-2 5’-GWA GAA GCC TGT GGC C-3’ 52°C
Cβ-mid1 5’-GTG GCC TTT TGG GTG TGG-3’ 58°C
Cβ-mid2 5’-GGT GTG GGA GAT CTC TGC-3’ 58°C
Cβ-in 5’-TCT GAT GGC TCA AAC ACA GC-3’ 60°C

SUPPLEMENTS
111
5.3 Library Sequencing
Samples of the PECP libraries 8L, N24, 10L, N30 and N39 were sequenced after plasmid isolation
(Section 2.3.1, p. 30 and Section 3.5.3, p. 76).
NNK: all amino acids, 1x stop; CTG: leucine.

SUPPLEMENTS
112
5.4 Second Matrix for Database Search Based on TCR 2D1-HLA-A2
Mimotopes and Candidates
According to the 3 mimotopes and 16 recognized candidates as well as the 21 not recognized
candidates each AA is given a probability in percent at each peptide position.
Yellow: anchor position of HLA-A2, orange: presumed TCR 2D1 - peptide contact position, AAP:
amino acid position.
AAP Recognized mimotopes and candidates
1 L L L L L L L L L L L I M L L L L L L
2 I V L I I I A I I I L I V L I G P G A
3 G G G G G G G G G G G G G G G G G G G
4 E E E E E E E E E E E E E E E E E E E
5 V V V V V V V V V A V V V V V V V V V
6 F W F F Y F F W F F F W W W F Y W W F
7 V G E I V V A V A I I G S H N R E L N
8 L L L L L I L L L L L L L L I L L L L
AAP Not recognized candidates
1 L L I L L L L L L L L L L L L L L L L L L
2 I I V L V V I I V V P T V V T T Y V L G H
3 G G G G G G G G G G G G G G G G G G G G G
4 E E E N D E E D D E E E E E E E E Q Q D E
5 I M V V L I G L V V V V V V V V V V V V V
6 F F Y F W F F F W F H A G D V F F F F F Y
7 E E V V N V V V G G V K E F A P P A E V N
8 L L L L L L L L V T L L L L L L L L L L L
Second matrix for database search:
AAP A C D E F G H I K L M N P Q R S T V W Y
Sum
1 0 0 0 0 0 0 0 20 0 50 30 0 0 0 0 0 0 0 0 0
100%
2 10 0 0 0 0 10 0 20 0 20 0 0 20 0 0 0 0 20 0 0
100%
3 20 0 0 0 0 80 0 0 0 0 0 0 0 0 0 0 0 0 0 0
100%
4 0 0 0 100 0 0 0 0 0 0 0 0 0 0 0 0 0 0 0 0
100%
5 30 0 0 0 0 0 0 0 0 0 0 0 0 0 0 0 0 70 0 0
100%
6 0 0 0 0 30 0 20 0 0 0 0 0 0 0 0 0 0 0 30 20
100%
7 5 5 5 5 5 5 5 5 5 5 5 5 5 5 5 5 5 5 5 5
100%
8 0 0 0 0 0 0 0 40 0 60 0 0 0 0 0 0 0 0 0 0
100%

SUPPLEMENTS
113
5.5 Primers and Plasmids for Peptide-Coding Plasmids
All primers were purchased in a concentration of 100 pmol/µL and HPLC purified from Metabion.
Primers designated with “for”(ward) elongate the coding stand and primers designated with
“rev”(erse) elongate the non-coding strand of DNA. Primers were optimized for expression in
mammalian cells with the tool provided on the webpage
http://www.encorbio.com/protocols/Codon.htm.
Name Sequence
PLP45-53-for 5’-CGC GCC ACC ATG AAA CTG ATT GAA ACC TAT TTT AGC AAA TGA GC-3’
PLP45-53-rev 5’-GGC CGC TCA TTT GCT AAA ATA GGT TTC AAT CAG TTT CAT GGT GG-3’
TAX11-19-for 5’-CGC GCC ACC ATG CTG CTG TTT GGC TAT CCG GTG TAT GTG TGA GC-3’
TAX11-19-rev 5’-GGC CGC TCA CAC ATA CAC CGG ATA GCC AAA CAG CAG CAT GGT GG-3’
KLIETYFSL-for 5’-CGC GCC ACC ATG AAA CTG ATT GAA ACC TAT TTT AGC CTG TGA GC-3’
KLIETYFSL-rev 5’-GGC CGC TCA CAG GCT AAA ATA GGT TTC AAT CAG TTT CAT GGT GG-3’
ALIETYFSK-for 5’-CGC GCC ACC ATG GCG CTG ATT GAA ACC TAT TTT AGC AAA TGA GC-3’
ALIETYFSK-rev 5’-GGC CGC TCA TTT GCT AAA ATA GGT TTC AAT CAG CGC CAT GGT GG-3’
KAIETYFSK-for 5’-CGC GCC ACC ATG AAA GCG ATT GAA ACC TAT TTT AGC AAA TGA GC-3’
KAIETYFSK-rev 5’-GGC CGC TCA TTT GCT AAA ATA GGT TTC AAT CGC TTT CAT GGT GG-3’
KLAETYFSK-for 5’-CGC GCC ACC ATG AAA CTG GCG GAA ACC TAT TTT AGC AAA TGA GC-3’
KLAETYFSK-rev 5’-GGC CGC TCA TTT GCT AAA ATA GGT TTC CGC CAG TTT CAT GGT GG-3’
KLIATYFSK-for 5’-CGC GCC ACC ATG AAA CTG ATT GCG ACC TAT TTT AGC AAA TGA GC-3’
KLIATYFSK-rev 5’-GGC CGC TCA TTT GCT AAA ATA GGT CGC AAT CAG TTT CAT GGT GG-3’
KLIEAYFSK-for 5’-CGC GCC ACC ATG AAA CTG ATT GAA GCG TAT TTT AGC AAA TGA GC-3’
KLIEAYFSK-rev 5’-GGC CGC TCA TTT GCT AAA ATA CGC TTC AAT CAG TTT CAT GGT GG-3’
KLIETAFSK-for 5’-CGC GCC ACC ATG AAA CTG ATT GAA ACC GCG TTT AGC AAA TGA GC-3’
KLIETAFSK-rev 5’-GGC CGC TCA TTT GCT AAA CGC GGT TTC AAT CAG TTT CAT GGT GG-3’
KLIETYASK-for 5’-CGC GCC ACC ATG AAA CTG ATT GAA ACC TAT GCG AGC AAA TGA GC-3’
KLIETYASK-rev 5’-GGC CGC TCA TTT GCT CGC ATA GGT TTC AAT CAG TTT CAT GGT GG-3’
KLIETYFAK-for 5’-CGC GCC ACC ATG AAA CTG ATT GAA ACC TAT TTT GCG AAA TGA GC-3’
KLIETYFAK-rev 5’-GGC CGC TCA TTT CGC AAA ATA GGT TTC AAT CAG TTT CAT GGT GG-3’
LIGEVFIL-for 5’-CGC GCC ACC ATG CTG ATC GGC GAG GTG TTC ATC CTG TGA GC-3’
LIGEVFIL-rev 5’-GGC CGC TCA CAG GAT GAA CAC CTC GCC GAT CAG CAT GGT GG-3’
LIGEVYVL-for 5’-CGC GCC ACC ATG CTG ATC GGC GAG GTG TAC GTG CTG TGA GC-3’
LIGEVYVL-rev 5’-GGC CGC TCA CAG CAC GTA CAC CTC GCC GAT CAG CAT GGT GG-3’
LIGEVFVI-for 5’-CGC GCC ACC ATG CTG ATC GGC GAG GTG TTC GTG ATC TGA GC-3’
LIGEVFVI-rev 5’-GGC CGC TCA GAT CAC GAA CAC CTC GCC GAT CAG CAT GGT GG-3’
LIGEIFEL-for 5’-CGC GCC ACC ATG CTG ATC GGC GAG ATC TTC GAG CTG TGA GC-3’
LIGEIFEL-rev 5’-GGC CGC TCA CAG CTC GAA GAT CTC GCC GAT CAG CAT GGT GG-3’
LIGEMFEL-for 5’-CGC GCC ACC ATG CTG ATC GGC GAG ATG TTC GAG CTG TGA GC-3’
LIGEMFEL-rev 5’-GGC CGC TCA CAG CTC GAA CAT CTC GCC GAT CAG CAT GGT GG-3’
LAGEVFAL-for 5’-CGC GCC ACC ATG CTG GCC GGC GAG GTG TTC GCC CTG TGA GC-3’
LAGEVFAL-rev 5’-GGC CGC TCA CAG GGC GAA CAC CTC GCC GGC CAG CAT GGT GG-3’
IVGEVYVL-for 5’-CGC GCC ACC ATG ATC GTG GGC GAG GTG TAC GTG CTG TGA GC-3’
IVGEVYVL-rev 5’-GGC CGC TCA CAG CAC GTA CAC CTC GCC CAC GAT CAT GGT GG-3’
LIGEVWVL-for 5’-CGC GCC ACC ATG CTG ATC GGC GAG GTG TGG GTG CTG TGA GC-3’
LIGEVWVL-rev 5’-GGC CGC TCA CAG CAC CCA CAC CTC GCC GAT CAG CAT GGT GG-3’
LLGNVFVL-for 5’-CGC GCC ACC ATG CTG CTG GGC AAC GTG TTC GTG CTG TGA GC-3’

SUPPLEMENTS
114
Name Sequence
LLGNVFVL-rev 5’-GGC CGC TCA CAG CAC GAA CAC GTT GCC CAG CAG CAT GGT GG-3’
LVGDLWNL-for 5’-CGC GCC ACC ATG CTG GTG GGC GAC CTG TGG AAC CTG TGA GC-3’
LVGDLWNL-rev 5’-GGC CGC TCA CAG GTT CCA CAG GTC GCC CAC CAG CAT GGT GG-3’
LIGEVFAL-for 5’-CGC GCC ACC ATG CTG ATC GGC GAG GTG TTC GCC CTG TGA GC-3’
LIGEVFAL-rev 5’-GGC CGC TCA CAG GGC GAA CAC CTC GCC GAT CAG CAT GGT GG-3’
LVGEIFVL-for 5’-CGC GCC ACC ATG CTG GTG GGC GAG ATC TTC GTG CTG TGA GC-3’
LVGEIFVL-rev 5’-GGC CGC TCA CAG CAC GAA GAT CTC GCC CAC CAG CAT GGT GG-3’
LIGEGFVL-for 5’-CGC GCC ACC ATG CTG ATC GGC GAG GGC TTC GTG CTG TGA GC-3’
LIGEGFVL-rev 5’-GGC CGC TCA CAG CAC GAA GCC CTC GCC GAT CAG CAT GGT GG-3’
LIGEAFIL-for 5’-CGC GCC ACC ATG CTG ATC GGC GAG GCC TTC ATC CTG TGA GC-3’
LIGEAFIL-rev 5’-GGC CGC TCA CAG GAT GAA GGC CTC GCC GAT CAG CAT GGT GG-3’
LLGEVFIL-for 5’-CGC GCC ACC ATG CTG CTG GGC GAG GTG TTC ATC CTG TGA GC-3’
LLGEVFIL-rev 5’-GGC CGC TCA CAG GAT GAA CAC CTC GCC CAG CAG CAT GGT GG-3’
LIGDLFVL-for 5’-CGC GCC ACC ATG CTG ATC GGC GAC CTG TTC GTG CTG TGA GC-3’
LIGDLFVL-rev 5’-GGC CGC TCA CAG CAC GAA CAG GTC GCC GAT CAG CAT GGT GG-3’
IIGEVWGL-for 5’-CGC GCC ACC ATG ATC ATC GGC GAG GTG TGG GGC CTG TGA GC-3’
IIGEVWGL-rev 5’-GGC CGC TCA CAG GCC CCA CAC CTC GCC GAT GAT CAT GGT GG-3’
LVGDVWGV-for 5’-CGC GCC ACC ATG CTG GTG GGC GAC GTG TGG GGC GTG TGA GC-3’
LVGDVWGV-rev 5’-GGC CGC TCA CAC GCC CCA CAC GTC GCC CAC CAG CAT GGT GG-3’
MVGEVWSL-for 5’-CGC GCC ACC ATG ATG GTG GGC GAG GTG TGG AGC CTG TGA GC-3’
MVGEVWSL-rev 5’-GGC CGC TCA CAG GCT CCA CAC CTC GCC CAC CAT CAT GGT GG-3’
LLGEVWHL-for 5’-CGC GCC ACC ATG CTG CTG GGC GAG GTG TGG CAC CTG TGA GC-3’
LLGEVWHL-rev 5’-GGC CGC TCA CAG GTG CCA CAC CTC GCC CAG CAG CAT GGT GG-3’
LIGEVFNI-for 5’-CGC GCC ACC ATG CTG ATC GGC GAG GTG TTC AAC ATC TGA GC-3’
LIGEVFNI-rev 5’-GGC CGC TCA GAT GTT GAA CAC CTC GCC GAT CAG CAT GGT GG-3’
LGGEVYRL-for 5’-CGC GCC ACC ATG CTG GGC GGC GAG GTG TAC AGA CTG TGA GC-3’
LGGEVYRL-rev 5’-GGC CGC TCA CAG TCT GTA CAC CTC GCC GCC CAG CAT GGT GG-3’
LPGEVWEL-for 5’-CGC GCC ACC ATG CTG CCC GGC GAG GTG TGG GAG CTG TGA GC-3’
LPGEVWEL-rev 5’-GGC CGC TCA CAG CTC CCA CAC CTC GCC GGG CAG CAT GGT GG-3’
LVGEVFGT-for 5’-CGC GCC ACC ATG CTG GTG GGC GAG GTG TTC GGC ACC TGA GC-3’
LVGEVFGT-rev 5’-GGC CGC TCA GGT GCC GAA CAC CTC GCC CAC CAG CAT GGT GG-3’
LGGEVWLL-for 5’-CGC GCC ACC ATG CTG GGC GGC GAG GTG TGG CTG CTG TGA GC-3’
LGGEVWLL-rev 5’-GGC CGC TCA CAG CAG CCA CAC CTC GCC GCC CAG CAT GGT GG-3’
LAGEVFNL-for 5’-CGC GCC ACC ATG CTG GCC GGC GAG GTG TTC AAC CTG TGA GC-3’
LAGEVFNL-rev 5’-GGC CGC TCA CAG GTT GAA CAC CTC GCC GGC CAG CAT GGT GG-3’
LPGEVHVL-for 5’-CGC GCC ACC ATG CTG CCC GGC GAG GTG CAC GTG CTG TGA GC-3’
LPGEVHVL-rev 5’-GGC CGC TCA CAG CAC GTG CAC CTC GCC GGG CAG CAT GGT GG-3’
LTGEVAKL-for 5’-CGC GCC ACC ATG CTG ACC GGC GAG GTG GCC AAG CTG TGA GC-3’
LTGEVAKL-rev 5’-GGC CGC TCA CAG CTT GGC CAC CTC GCC GGT CAG CAT GGT GG-3’
LVGEVGEL-for 5’-CGC GCC ACC ATG CTG GTG GGC GAG GTG GGC GAG CTG TGA GC-3’
LVGEVGEL-rev 5’-GGC CGC TCA CAG CTC GCC CAC CTC GCC CAC CAG CAT GGT GG-3’
LVGEVDFL-for 5’-CGC GCC ACC ATG CTG GTG GGC GAG GTG GAC TTC CTG TGA GC-3’
LVGEVDFL-rev 5’-GGC CGC TCA CAG GAA GTC CAC CTC GCC CAC CAG CAT GGT GG-3’
LTGEVVAL-for 5’-CGC GCC ACC ATG CTG ACC GGC GAG GTG GTG GCC CTG TGA GC-3’
LTGEVVAL-rev 5’-GGC CGC TCA CAG GGC CAC CAC CTC GCC GGT CAG CAT GGT GG-3’
LTGEVFPL-for 5’-CGC GCC ACC ATG CTG ACC GGC GAG GTG TTC CCC CTG TGA GC-3’
LTGEVFPL-rev 5’-GGC CGC TCA CAG GGG GAA CAC CTC GCC GGT CAG CAT GGT GG-3’
LYGEVFPL-for 5’-CGC GCC ACC ATG CTG TAC GGC GAG GTG TTC CCC CTG TGA GC-3’

SUPPLEMENTS
115
Name Sequence
LYGEVFPL-rev 5’-GGC CGC TCA CAG GGG GAA CAC CTC GCC GTA CAG CAT GGT GG-3’
LVGQVFAL-for 5’-CGC GCC ACC ATG CTG GTG GGC CAG GTG TTC GCC CTG TGA GC-3’
LVGQVFAL-rev 5’-GGC CGC TCA CAG GGC GAA CAC CTG GCC CAC CAG CAT GGT GG-3’
LLGQVFEL-for 5’-CGC GCC ACC ATG CTG CTG GGC CAG GTG TTC GAG CTG TGA GC-3’
LLGQVFEL-rev 5’-GGC CGC TCA CAG CTC GAA CAC CTG GCC CAG CAG CAT GGT GG-3’
LGGDVFVL-for 5’-CGC GCC ACC ATG CTG GGC GGC GAC GTG TTC GTG CTG TGA GC-3’
LGGDVFVL-rev 5’-GGC CGC TCA CAG CAC GAA CAC GTC GCC GCC CAG CAT GGT GG-3’
LHGEVYNL-for 5’-CGC GCC ACC ATG CTG CAC GGC GAG GTG TAC AAC CTG TGA GC-3’
LHGEVYNL-rev 5’-GGC CGC TCA CAG GTT GTA CAC CTC GCC GTG CAG CAT GGT GG-3’
LPGEVFAI-for 5’-CGC GCC ACC ATG CTG CCC GGC GAG GTG TTC GCC ATC TGA GC-3’
LPGEVFAI-rev 5’-GGC CGC TCA GAT GGC GAA CAC CTC GCC GGG CAG CAT GGT GG-3’
LLGELWCL-for 5’-CGC GCC ACC ATG CTG CTG GGC GAG CTG TGG TGC CTG TGA GC-3’
LLGELWCL-rev 5’-GGC CGC TCA CAG GCA CCA CAG CTC GCC CAG CAG CAT GGT GG-3’
LGGEVFYV-for 5’-CGC GCC ACC ATG CTG GGC GGC GAG GTG TTC TAC GTG TGA GC-3’
LGGEVFYV-rev 5’-GGC CGC TCA CAC GTA GAA CAC CTC GCC GCC CAG CAT GGT GG-3’
LLGEVQAL-for 5’-CGC GCC ACC ATG CTG CTG GGC GAG GTG CAG GCC CTG TGA GC-3’
LLGEVQAL-rev 5’-GGC CGC TCA CAG GGC CTG CAC CTC GCC CAG CAG CAT GGT GG-3’
LEGEGFIL-for 5’-CGC GCC ACC ATG CTG GAG GGC GAG GGC TTC ATC CTG TGA GC-3’
LEGEGFIL-rev 5’-GGC CGC TCA CAG GAT GAA GCC CTC GCC CTC CAG CAT GGT GG-3’
MEGEVWGL-for 5’-CGC GCC ACC ATG ATG GAG GGC GAG GTG TGG GGC CTG TGA GC-3’
MEGEVWGL-rev 5’-GGC CGC TCA CAG GCC CCA CAC CTC GCC CTC CAT CAT GGT GG-3’
LRGEVWQL-for 5’-CGC GCC ACC ATG CTG AGA GGC GAG GTG TGG CAG CTG TGA GC-3’
LRGEVWQL-rev 5’-GGC CGC TCA CAG CTG CCA CAC CTC GCC TCT CAG CAT GGT GG-3’
LRGEVWAL-for 5’-CGC GCC ACC ATG CTG AGA GGC GAG GTG TGG GCC CTG TGA GC-3’
LRGEVWAL-rev 5’-GGC CGC TCA CAG GGC CCA CAC CTC GCC TCT CAG CAT GGT GG-3’
LIGEVWLA-for 5’-CGC GCC ACC ATG CTG ATC GGC GAG GTG TGG CTG GCC TGA GC-3’
LIGEVWLA-rev 5’-GGC CGC TCA GGC CAG CCA CAC CTC GCC GAT CAG CAT GGT GG-3’
LLGEVVAL-for 5’-CGC GCC ACC ATG CTG CTG GGC GAG GTG GTG GCC CTG TGA GC-3’
LLGEVVAL-rev 5’-GGC CGC TCA CAG GGC CAC CAC CTC GCC CAG CAG CAT GGT GG-3’
LIGEAFCL-for 5’-CGC GCC ACC ATG CTG ATC GGC GAG GCC TTC TGC CTG TGA GC-3’
LIGEAFCL-rev 5’-GGC CGC TCA CAG GCA GAA GGC CTC GCC GAT CAG CAT GGT GG-3’
LLGEVWNA-for 5’-CGC GCC ACC ATG CTG CTG GGC GAG GTG TGG AAC GCC TGA GC-3’
LLGEVWNA-rev 5’-GGC CGC TCA GGC GTT CCA CAC CTC GCC CAG CAG CAT GGT GG-3’
LLGAVWLL-for 5’-CGC GCC ACC ATG CTG CTG GGC GCC GTG TGG CTG CTG TGA GC-3’
LLGAVWLL-rev 5’-GGC CGC TCA CAG CAG CCA CAC GGC GCC CAG CAG CAT GGT GG-3’
LEGEAFPL-for 5’-CGC GCC ACC ATG CTG GAG GGC GAG GCC TTC CCC CTG TGA GC-3’
LEGEAFPL-rev 5’-GGC CGC TCA CAG GGG GAA GGC CTC GCC CTC CAG CAT GGT GG-3’
LSGEVFGM-for 5’-CGC GCC ACC ATG CTG AGC GGC GAG GTG TTC GGC ATG TGA GC-3’
LSGEVFGM-rev 5’-GGC CGC TCA CAT GCC GAA CAC CTC GCC GCT CAG CAT GGT GG-3’
LPGEVWMV-for 5’-CGC GCC ACC ATG CTG CCC GGC GAG GTG TGG ATG GTG TGA GC-3’
LPGEVWMV-rev 5’-GGC CGC TCA CAC CAT CCA CAC CTC GCC GGG CAG CAT GGT GG-3’
LSGEVHLL-for 5’-CGC GCC ACC ATG CTG AGC GGC GAG GTG CAC CTG CTG TGA GC-3’
LSGEVHLL-rev 5’-GGC CGC TCA CAG CAG GTG CAC CTC GCC GCT CAG CAT GGT GG-3’
LEGEVFIV-for 5’-CGC GCC ACC ATG CTG GAG GGC GAG GTG TTC ATC GTG TGA GC-3’
LEGEVFIV-rev 5’-GGC CGC TCA CAC GAT GAA CAC CTC GCC CTC CAG CAT GGT GG-3’
LQGEVFGA-for 5’-CGC GCC ACC ATG CTG CAG GGC GAG GTG TTC GGC GCC TGA GC-3’
LQGEVFGA-rev 5’-GGC CGC TCA GGC GCC GAA CAC CTC GCC CTG CAG CAT GGT GG-3’
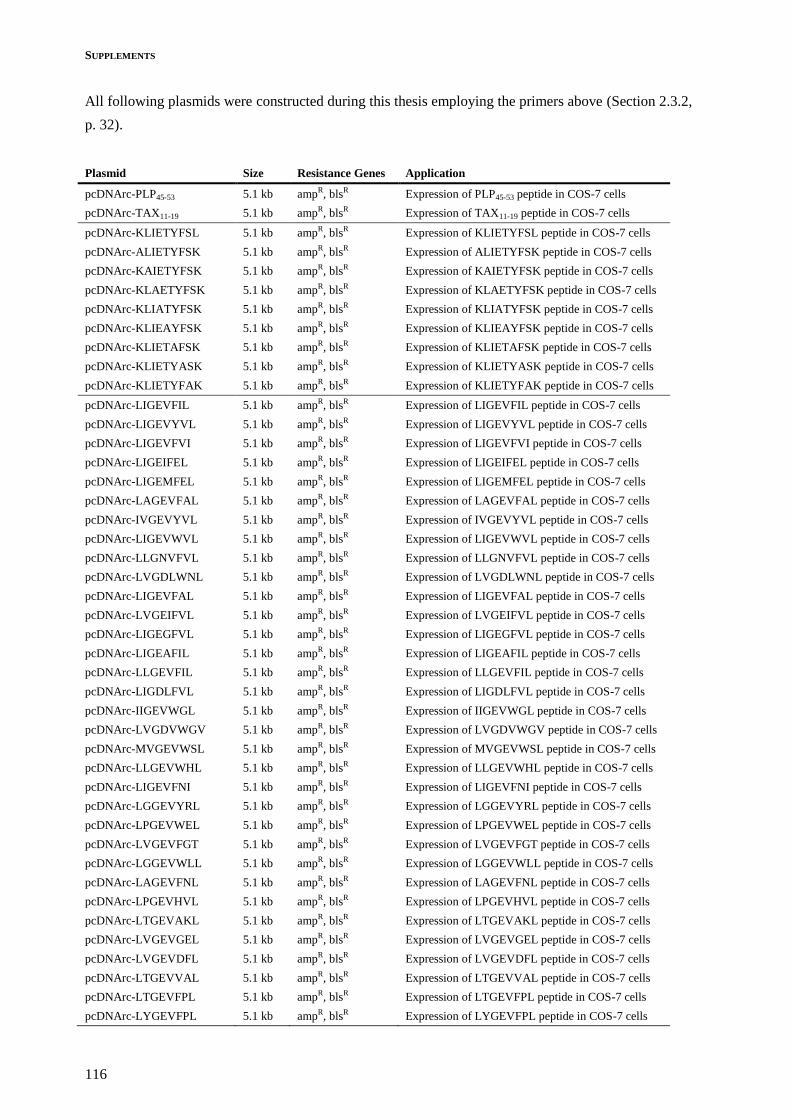
SUPPLEMENTS
116
All following plasmids were constructed during this thesis employing the primers above (Section 2.3.2,
p. 32).
Plasmid Size Resistance Genes Application
pcDNArc-PLP45-53 5.1 kb ampR, blsR Expression of PLP45-53 peptide in COS-7 cells
pcDNArc-TAX11-19 5.1 kb ampR, blsR Expression of TAX11-19 peptide in COS-7 cells
pcDNArc-KLIETYFSL 5.1 kb ampR, blsR Expression of KLIETYFSL peptide in COS-7 cells
pcDNArc-ALIETYFSK 5.1 kb ampR, blsR Expression of ALIETYFSK peptide in COS-7 cells
pcDNArc-KAIETYFSK 5.1 kb ampR, blsR Expression of KAIETYFSK peptide in COS-7 cells
pcDNArc-KLAETYFSK 5.1 kb ampR, blsR Expression of KLAETYFSK peptide in COS-7 cells
pcDNArc-KLIATYFSK 5.1 kb ampR, blsR Expression of KLIATYFSK peptide in COS-7 cells
pcDNArc-KLIEAYFSK 5.1 kb ampR, blsR Expression of KLIEAYFSK peptide in COS-7 cells
pcDNArc-KLIETAFSK 5.1 kb ampR, blsR Expression of KLIETAFSK peptide in COS-7 cells
pcDNArc-KLIETYASK 5.1 kb ampR, blsR Expression of KLIETYASK peptide in COS-7 cells
pcDNArc-KLIETYFAK 5.1 kb ampR, blsR Expression of KLIETYFAK peptide in COS-7 cells
pcDNArc-LIGEVFIL 5.1 kb ampR, blsR Expression of LIGEVFIL peptide in COS-7 cells
pcDNArc-LIGEVYVL 5.1 kb ampR, blsR Expression of LIGEVYVL peptide in COS-7 cells
pcDNArc-LIGEVFVI 5.1 kb ampR, blsR Expression of LIGEVFVI peptide in COS-7 cells
pcDNArc-LIGEIFEL 5.1 kb ampR, blsR Expression of LIGEIFEL peptide in COS-7 cells
pcDNArc-LIGEMFEL 5.1 kb ampR, blsR Expression of LIGEMFEL peptide in COS-7 cells
pcDNArc-LAGEVFAL 5.1 kb ampR, blsR Expression of LAGEVFAL peptide in COS-7 cells
pcDNArc-IVGEVYVL 5.1 kb ampR, blsR Expression of IVGEVYVL peptide in COS-7 cells
pcDNArc-LIGEVWVL 5.1 kb ampR, blsR Expression of LIGEVWVL peptide in COS-7 cells
pcDNArc-LLGNVFVL 5.1 kb ampR, blsR Expression of LLGNVFVL peptide in COS-7 cells
pcDNArc-LVGDLWNL 5.1 kb ampR, blsR Expression of LVGDLWNL peptide in COS-7 cells
pcDNArc-LIGEVFAL 5.1 kb ampR, blsR Expression of LIGEVFAL peptide in COS-7 cells
pcDNArc-LVGEIFVL 5.1 kb ampR, blsR Expression of LVGEIFVL peptide in COS-7 cells
pcDNArc-LIGEGFVL 5.1 kb ampR, blsR Expression of LIGEGFVL peptide in COS-7 cells
pcDNArc-LIGEAFIL 5.1 kb ampR, blsR Expression of LIGEAFIL peptide in COS-7 cells
pcDNArc-LLGEVFIL 5.1 kb ampR, blsR Expression of LLGEVFIL peptide in COS-7 cells
pcDNArc-LIGDLFVL 5.1 kb ampR, blsR Expression of LIGDLFVL peptide in COS-7 cells
pcDNArc-IIGEVWGL 5.1 kb ampR, blsR Expression of IIGEVWGL peptide in COS-7 cells
pcDNArc-LVGDVWGV 5.1 kb ampR, blsR Expression of LVGDVWGV peptide in COS-7 cells
pcDNArc-MVGEVWSL 5.1 kb ampR, blsR Expression of MVGEVWSL peptide in COS-7 cells
pcDNArc-LLGEVWHL 5.1 kb ampR, blsR Expression of LLGEVWHL peptide in COS-7 cells
pcDNArc-LIGEVFNI 5.1 kb ampR, blsR Expression of LIGEVFNI peptide in COS-7 cells
pcDNArc-LGGEVYRL 5.1 kb ampR, blsR Expression of LGGEVYRL peptide in COS-7 cells
pcDNArc-LPGEVWEL 5.1 kb ampR, blsR Expression of LPGEVWEL peptide in COS-7 cells
pcDNArc-LVGEVFGT 5.1 kb ampR, blsR Expression of LVGEVFGT peptide in COS-7 cells
pcDNArc-LGGEVWLL 5.1 kb ampR, blsR Expression of LGGEVWLL peptide in COS-7 cells
pcDNArc-LAGEVFNL 5.1 kb ampR, blsR Expression of LAGEVFNL peptide in COS-7 cells
pcDNArc-LPGEVHVL 5.1 kb ampR, blsR Expression of LPGEVHVL peptide in COS-7 cells
pcDNArc-LTGEVAKL 5.1 kb ampR, blsR Expression of LTGEVAKL peptide in COS-7 cells
pcDNArc-LVGEVGEL 5.1 kb ampR, blsR Expression of LVGEVGEL peptide in COS-7 cells
pcDNArc-LVGEVDFL 5.1 kb ampR, blsR Expression of LVGEVDFL peptide in COS-7 cells
pcDNArc-LTGEVVAL 5.1 kb ampR, blsR Expression of LTGEVVAL peptide in COS-7 cells
pcDNArc-LTGEVFPL 5.1 kb ampR, blsR Expression of LTGEVFPL peptide in COS-7 cells
pcDNArc-LYGEVFPL 5.1 kb ampR, blsR Expression of LYGEVFPL peptide in COS-7 cells

SUPPLEMENTS
117
Plasmid Size Resistance Genes Application
pcDNArc-LVGQVFAL 5.1 kb ampR, blsR Expression of LVGQVFAL peptide in COS-7 cells
pcDNArc-LLGQVFEL 5.1 kb ampR, blsR Expression of LLGQVFEL peptide in COS-7 cells
pcDNArc-LGGDVFVL 5.1 kb ampR, blsR Expression of LGGDVFVL peptide in COS-7 cells
pcDNArc-LHGEVYNL 5.1 kb ampR, blsR Expression of LHGEVYNL peptide in COS-7 cells
pcDNArc-LPGEVFAI 5.1 kb ampR, blsR Expression of LPGEVFAI peptide in COS-7 cells
pcDNArc-LLGELWCL 5.1 kb ampR, blsR Expression of LLGELWCL peptide in COS-7 cells
pcDNArc-LGGEVFYV 5.1 kb ampR, blsR Expression of LGGEVFYV peptide in COS-7 cells
pcDNArc-LLGEVQAL 5.1 kb ampR, blsR Expression of LLGEVQAL peptide in COS-7 cells
pcDNArc-LEGEGFIL 5.1 kb ampR, blsR Expression of LEGEGFIL peptide in COS-7 cells
pcDNArc-MEGEVWGL 5.1 kb ampR, blsR Expression of MEGEVWGL peptide in COS-7 cells
pcDNArc-LRGEVWQL 5.1 kb ampR, blsR Expression of LRGEVWQL peptide in COS-7 cells
pcDNArc-LRGEVWAL 5.1 kb ampR, blsR Expression of LRGEVWAL peptide in COS-7 cells
pcDNArc-LIGEVWLA 5.1 kb ampR, blsR Expression of LIGEVWLA peptide in COS-7 cells
pcDNArc-LLGEVVAL 5.1 kb ampR, blsR Expression of LLGEVVAL peptide in COS-7 cells
pcDNArc-LIGEAFCL 5.1 kb ampR, blsR Expression of LIGEAFCL peptide in COS-7 cells
pcDNArc-LLGEVWNA 5.1 kb ampR, blsR Expression of LLGEVWNA peptide in COS-7 cells
pcDNArc-LLGAVWLL 5.1 kb ampR, blsR Expression of LLGAVWLL peptide in COS-7 cells
pcDNArc-LEGEAFPL 5.1 kb ampR, blsR Expression of LEGEAFPL peptide in COS-7 cells
pcDNArc-LSGEVFGM 5.1 kb ampR, blsR Expression of LSGEVFGM peptide in COS-7 cells
pcDNArc-LPGEVWMV 5.1 kb ampR, blsR Expression of LPGEVWMV peptide in COS-7 cells
pcDNArc-LSGEVHLL 5.1 kb ampR, blsR Expression of LSGEVHLL peptide in COS-7 cells
pcDNArc-LEGEVFIV 5.1 kb ampR, blsR Expression of LEGEVFIV peptide in COS-7 cells
pcDNArc-LQGEVFGA 5.1 kb ampR, blsR Expression of LQGEVFGA peptide in COS-7 cells
5.6 Primer Position for Quantitative PCR of Potential Parent Mouse
Proteins
Sequence information for mRNA and genomic DNA was obtained from www.ncbi.nlm.nih.gov/gene.
Yellow highlight: qPCR primers, gray highlight: qPCR probes, red letters: mimotope peptide-coding
sequence, blue letters: comments.
Alox12b arachidonate 12-lipoxygenase, 12R type [Mus musculus]
Gene ID: 11686
exon 8 - AGGGGGAATATTTACCTGGCAGACTACCGCATCCTGGATGGCATCCCCACCGTGGAGCTCAATGGTCAGCAGCAGCATCACTGTGCCCCGATGTGCTTGCTGCACTTTGGTCCTGATGGCAACATGATGC
CCATCGCCATTCAG - intron - (1375 bp) - exon 9 - CTCAGTCAGACTCCTGGGCCTGATTGTCCTATCTTCCTGCCGAATGATTCTGAGTGGGACTGGCTGTTGGCTAAAACGTGGGTGCGCTACGCGGAGTTCTAC
AGCCACGAGGCCGTGGCACACTTGCTGGAGAGCCACCTCATCGGGGAAGCTTTCTGCTTGGCCCTCCT
GAGGAACCTGCCCATGTGCCACCCCCTGTATAAG
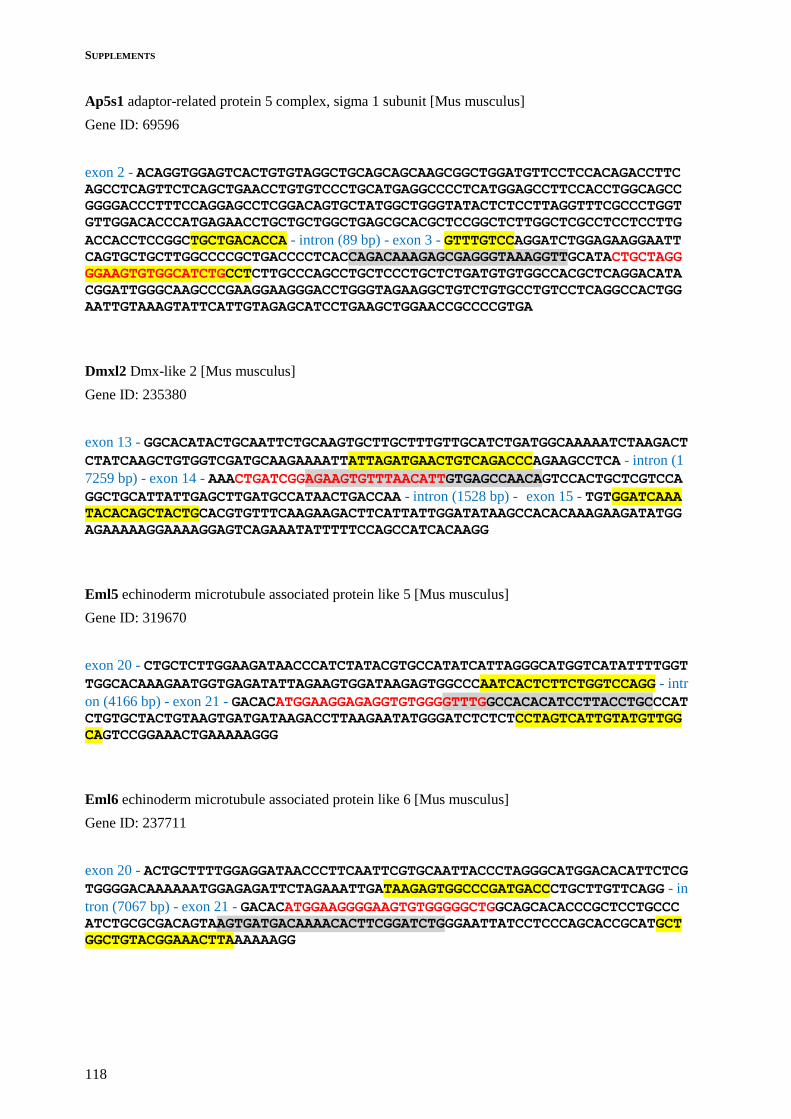
SUPPLEMENTS
118
Ap5s1 adaptor-related protein 5 complex, sigma 1 subunit [Mus musculus]
Gene ID: 69596
exon 2 - ACAGGTGGAGTCACTGTGTAGGCTGCAGCAGCAAGCGGCTGGATGTTCCTCCACAGACCTTCAGCCTCAGTTCTCAGCTGAACCTGTGTCCCTGCATGAGGCCCCTCATGGAGCCTTCCACCTGGCAGCC
GGGGACCCTTTCCAGGAGCCTCGGACAGTGCTATGGCTGGGTATACTCTCCTTAGGTTTCGCCCTGGT
GTTGGACACCCATGAGAACCTGCTGCTGGCTGAGCGCACGCTCCGGCTCTTGGCTCGCCTCCTCCTTG
ACCACCTCCGGCTGCTGACACCA - intron (89 bp) - exon 3 - GTTTGTCCAGGATCTGGAGAAGGAATTCAGTGCTGCTTGGCCCCGCTGACCCCTCACCAGACAAAGAGCGAGGGTAAAGGTTGCATACTGCTAGG
GGAAGTGTGGCATCTGCCTCTTGCCCAGCCTGCTCCCTGCTCTGATGTGTGGCCACGCTCAGGACATA
CGGATTGGGCAAGCCCGAAGGAAGGGACCTGGGTAGAAGGCTGTCTGTGCCTGTCCTCAGGCCACTGG
AATTGTAAAGTATTCATTGTAGAGCATCCTGAAGCTGGAACCGCCCCGTGA
Dmxl2 Dmx-like 2 [Mus musculus]
Gene ID: 235380
exon 13 - GGCACATACTGCAATTCTGCAAGTGCTTGCTTTGTTGCATCTGATGGCAAAAATCTAAGACT
CTATCAAGCTGTGGTCGATGCAAGAAAATTATTAGATGAACTGTCAGACCCAGAAGCCTCA - intron (1
7259 bp) - exon 14 - AAACTGATCGGAGAAGTGTTTAACATTGTGAGCCAACAGTCCACTGCTCGTCCA
GGCTGCATTATTGAGCTTGATGCCATAACTGACCAA - intron (1528 bp) - exon 15 - TGTGGATCAAATACACAGCTACTGCACGTGTTTCAAGAAGACTTCATTATTGGATATAAGCCACACAAAGAAGATATGG
AGAAAAAGGAAAAGGAGTCAGAAATATTTTTCCAGCCATCACAAGG
Eml5 echinoderm microtubule associated protein like 5 [Mus musculus]
Gene ID: 319670
exon 20 - CTGCTCTTGGAAGATAACCCATCTATACGTGCCATATCATTAGGGCATGGTCATATTTTGGT
TGGCACAAAGAATGGTGAGATATTAGAAGTGGATAAGAGTGGCCCAATCACTCTTCTGGTCCAGG - intr
on (4166 bp) - exon 21 - GACACATGGAAGGAGAGGTGTGGGGTTTGGCCACACATCCTTACCTGCCCATCTGTGCTACTGTAAGTGATGATAAGACCTTAAGAATATGGGATCTCTCTCCTAGTCATTGTATGTTGG
CAGTCCGGAAACTGAAAAAGGG
Eml6 echinoderm microtubule associated protein like 6 [Mus musculus]
Gene ID: 237711
exon 20 - ACTGCTTTTGGAGGATAACCCTTCAATTCGTGCAATTACCCTAGGGCATGGACACATTCTCG
TGGGGACAAAAAATGGAGAGATTCTAGAAATTGATAAGAGTGGCCCGATGACCCTGCTTGTTCAGG - in
tron (7067 bp) - exon 21 - GACACATGGAAGGGGAAGTGTGGGGGCTGGCAGCACACCCGCTCCTGCCCATCTGCGCGACAGTAAGTGATGACAAAACACTTCGGATCTGGGAATTATCCTCCCAGCACCGCATGCT
GGCTGTACGGAAACTTAAAAAAGG
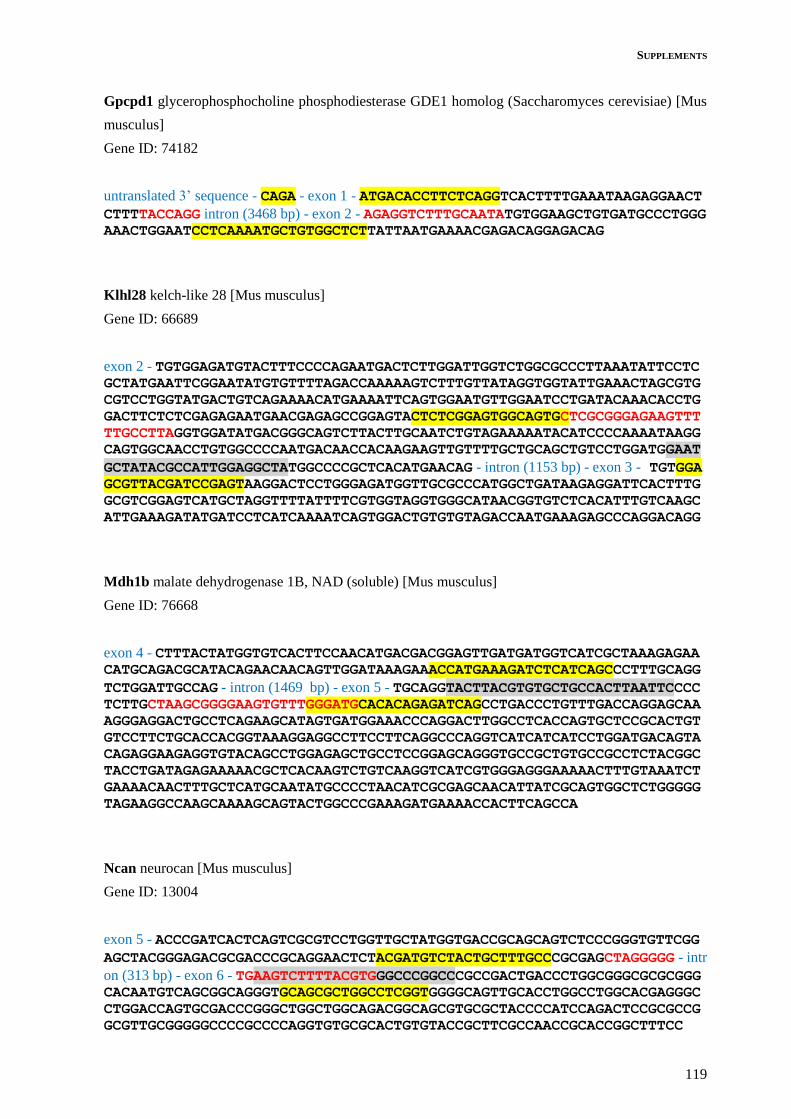
SUPPLEMENTS
119
Gpcpd1 glycerophosphocholine phosphodiesterase GDE1 homolog (Saccharomyces cerevisiae) [Mus
musculus]
Gene ID: 74182
untranslated 3’ sequence - CAGA - exon 1 - ATGACACCTTCTCAGGTCACTTTTGAAATAAGAGGAACT
CTTTTACCAGG intron (3468 bp) - exon 2 - AGAGGTCTTTGCAATATGTGGAAGCTGTGATGCCCTGGGAAACTGGAATCCTCAAAATGCTGTGGCTCTTATTAATGAAAACGAGACAGGAGACAG
Klhl28 kelch-like 28 [Mus musculus]
Gene ID: 66689
exon 2 - TGTGGAGATGTACTTTCCCCAGAATGACTCTTGGATTGGTCTGGCGCCCTTAAATATTCCTCGCTATGAATTCGGAATATGTGTTTTAGACCAAAAAGTCTTTGTTATAGGTGGTATTGAAACTAGCGTG
CGTCCTGGTATGACTGTCAGAAAACATGAAAATTCAGTGGAATGTTGGAATCCTGATACAAACACCTG
GACTTCTCTCGAGAGAATGAACGAGAGCCGGAGTACTCTCGGAGTGGCAGTGCTCGCGGGAGAAGTTT
TTGCCTTAGGTGGATATGACGGGCAGTCTTACTTGCAATCTGTAGAAAAATACATCCCCAAAATAAGG
CAGTGGCAACCTGTGGCCCCAATGACAACCACAAGAAGTTGTTTTGCTGCAGCTGTCCTGGATGGAAT
GCTATACGCCATTGGAGGCTATGGCCCCGCTCACATGAACAG - intron (1153 bp) - exon 3 - TGTGGAGCGTTACGATCCGAGTAAGGACTCCTGGGAGATGGTTGCGCCCATGGCTGATAAGAGGATTCACTTTG
GCGTCGGAGTCATGCTAGGTTTTATTTTCGTGGTAGGTGGGCATAACGGTGTCTCACATTTGTCAAGC
ATTGAAAGATATGATCCTCATCAAAATCAGTGGACTGTGTGTAGACCAATGAAAGAGCCCAGGACAGG
Mdh1b malate dehydrogenase 1B, NAD (soluble) [Mus musculus]
Gene ID: 76668
exon 4 - CTTTACTATGGTGTCACTTCCAACATGACGACGGAGTTGATGATGGTCATCGCTAAAGAGAACATGCAGACGCATACAGAACAACAGTTGGATAAAGAAACCATGAAAGATCTCATCAGCCCTTTGCAGG
TCTGGATTGCCAG - intron (1469 bp) - exon 5 - TGCAGGTACTTACGTGTGCTGCCACTTAATTCCCCTCTTGCTAAGCGGGGAAGTGTTTGGGATGCACACAGAGATCAGCCTGACCCTGTTTGACCAGGAGCAA
AGGGAGGACTGCCTCAGAAGCATAGTGATGGAAACCCAGGACTTGGCCTCACCAGTGCTCCGCACTGT
GTCCTTCTGCACCACGGTAAAGGAGGCCTTCCTTCAGGCCCAGGTCATCATCATCCTGGATGACAGTA
CAGAGGAAGAGGTGTACAGCCTGGAGAGCTGCCTCCGGAGCAGGGTGCCGCTGTGCCGCCTCTACGGC
TACCTGATAGAGAAAAACGCTCACAAGTCTGTCAAGGTCATCGTGGGAGGGAAAAACTTTGTAAATCT
GAAAACAACTTTGCTCATGCAATATGCCCCTAACATCGCGAGCAACATTATCGCAGTGGCTCTGGGGG
TAGAAGGCCAAGCAAAAGCAGTACTGGCCCGAAAGATGAAAACCACTTCAGCCA
Ncan neurocan [Mus musculus]
Gene ID: 13004
exon 5 - ACCCGATCACTCAGTCGCGTCCTGGTTGCTATGGTGACCGCAGCAGTCTCCCGGGTGTTCGG
AGCTACGGGAGACGCGACCCGCAGGAACTCTACGATGTCTACTGCTTTGCCCGCGAGCTAGGGGG - intr
on (313 bp) - exon 6 - TGAAGTCTTTTACGTGGGCCCGGCCCGCCGACTGACCCTGGCGGGCGCGCGGGCACAATGTCAGCGGCAGGGTGCAGCGCTGGCCTCGGTGGGGCAGTTGCACCTGGCCTGGCACGAGGGC
CTGGACCAGTGCGACCCGGGCTGGCTGGCAGACGGCAGCGTGCGCTACCCCATCCAGACTCCGCGCCG
GCGTTGCGGGGGCCCCGCCCCAGGTGTGCGCACTGTGTACCGCTTCGCCAACCGCACCGGCTTTCC

SUPPLEMENTS
120
Gapdh glyceraldehyde-3-phosphate dehydrogenase [Mus musculus]
Gene ID: 14433
exon 2 - ATTTGGCCGTATTGGGCGCCTGGTCACCAGGGCTGCCATTTGCAGTGGCAAAGTGGAGATTGTTGCCATCAACGACCCCTTCATTGACCTCAACTACATGGTCTACATGTTCCAGTATGACTCCACTCAC
GGCAAATTCAACGGCACAGTCAAGGCCGAGAATGGGAAGCTTGTCATCAACGGGAAGCCCATCACCAT
CTTCCAGGAGCGAGACCCCACTAACATCAAATGGGGTGAGGCCGGTGCTGAGTATGTCGTGGAGTCTA
CTGGTGTCTTCACCACCATGGAGAAGGCCGGGG - intron (98 bp) - exon 3 - CCCACTTGAAGGGTGGAGCCAAAAGGGTCATCATCTCCGCCCCTTCTGCCGATGCCCCCATGTTTGTGATGGGTGTGAACCACGA
GAAATATGACAACTCACTCAAGATTGTCAGCAATGCATCCTGCACCACCAACTGCTTAGCCCCCCTGG
CCAAGGTCATCCATGACAACTTTGGCATTGTGGAAGGGCTCATG
5.7 Plasmid Information
5.7.1 pcDNA6/V5-HisA
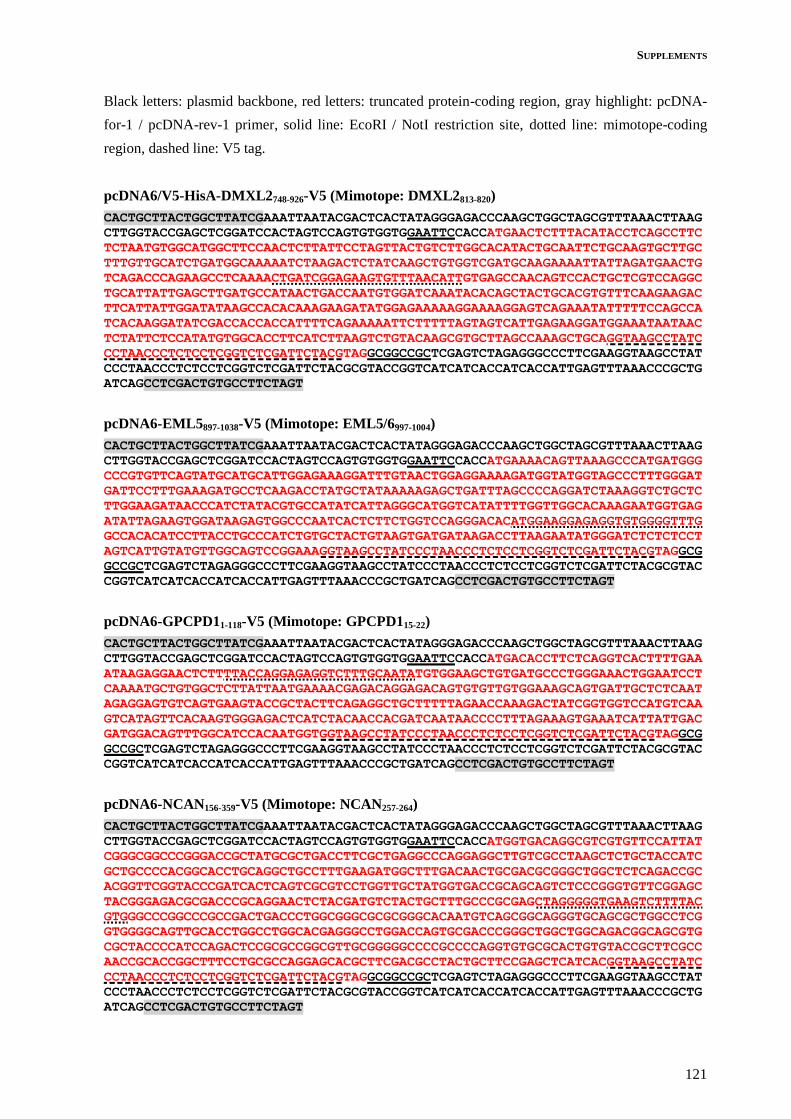
SUPPLEMENTS
121
Black letters: plasmid backbone, red letters: truncated protein-coding region, gray highlight: pcDNA-
for-1 / pcDNA-rev-1 primer, solid line: EcoRI / NotI restriction site, dotted line: mimotope-coding
region, dashed line: V5 tag.
pcDNA6/V5-HisA-DMXL2748-926-V5 (Mimotope: DMXL2813-820)
CACTGCTTACTGGCTTATCGAAATTAATACGACTCACTATAGGGAGACCCAAGCTGGCTAGCGTTTAAACTTAAG
CTTGGTACCGAGCTCGGATCCACTAGTCCAGTGTGGTGGAATTCCACCATGAACTCTTTACATACCTCAGCCTTC
TCTAATGTGGCATGGCTTCCAACTCTTATTCCTAGTTACTGTCTTGGCACATACTGCAATTCTGCAAGTGCTTGC
TTTGTTGCATCTGATGGCAAAAATCTAAGACTCTATCAAGCTGTGGTCGATGCAAGAAAATTATTAGATGAACTG
TCAGACCCAGAAGCCTCAAAACTGATCGGAGAAGTGTTTAACATTGTGAGCCAACAGTCCACTGCTCGTCCAGGC
TGCATTATTGAGCTTGATGCCATAACTGACCAATGTGGATCAAATACACAGCTACTGCACGTGTTTCAAGAAGAC
TTCATTATTGGATATAAGCCACACAAAGAAGATATGGAGAAAAAGGAAAAGGAGTCAGAAATATTTTTCCAGCCA
TCACAAGGATATCGACCACCACCATTTTCAGAAAAATTCTTTTTAGTAGTCATTGAGAAGGATGGAAATAATAAC
TCTATTCTCCATATGTGGCACCTTCATCTTAAGTCTGTACAAGCGTGCTTAGCCAAAGCTGCAGGTAAGCCTATC
CCTAACCCTCTCCTCGGTCTCGATTCTACGTAGGCGGCCGCTCGAGTCTAGAGGGCCCTTCGAAGGTAAGCCTAT
CCCTAACCCTCTCCTCGGTCTCGATTCTACGCGTACCGGTCATCATCACCATCACCATTGAGTTTAAACCCGCTG
ATCAGCCTCGACTGTGCCTTCTAGT
pcDNA6-EML5897-1038-V5 (Mimotope: EML5/6997-1004)
CACTGCTTACTGGCTTATCGAAATTAATACGACTCACTATAGGGAGACCCAAGCTGGCTAGCGTTTAAACTTAAG
CTTGGTACCGAGCTCGGATCCACTAGTCCAGTGTGGTGGAATTCCACCATGAAAACAGTTAAAGCCCATGATGGG
CCCGTGTTCAGTATGCATGCATTGGAGAAAGGATTTGTAACTGGAGGAAAAGATGGTATGGTAGCCCTTTGGGAT
GATTCCTTTGAAAGATGCCTCAAGACCTATGCTATAAAAAGAGCTGATTTAGCCCCAGGATCTAAAGGTCTGCTC
TTGGAAGATAACCCATCTATACGTGCCATATCATTAGGGCATGGTCATATTTTGGTTGGCACAAAGAATGGTGAG
ATATTAGAAGTGGATAAGAGTGGCCCAATCACTCTTCTGGTCCAGGGACACATGGAAGGAGAGGTGTGGGGTTTG
GCCACACATCCTTACCTGCCCATCTGTGCTACTGTAAGTGATGATAAGACCTTAAGAATATGGGATCTCTCTCCT
AGTCATTGTATGTTGGCAGTCCGGAAAGGTAAGCCTATCCCTAACCCTCTCCTCGGTCTCGATTCTACGTAGGCG
GCCGCTCGAGTCTAGAGGGCCCTTCGAAGGTAAGCCTATCCCTAACCCTCTCCTCGGTCTCGATTCTACGCGTAC
CGGTCATCATCACCATCACCATTGAGTTTAAACCCGCTGATCAGCCTCGACTGTGCCTTCTAGT
pcDNA6-GPCPD11-118-V5 (Mimotope: GPCPD115-22)
CACTGCTTACTGGCTTATCGAAATTAATACGACTCACTATAGGGAGACCCAAGCTGGCTAGCGTTTAAACTTAAG
CTTGGTACCGAGCTCGGATCCACTAGTCCAGTGTGGTGGAATTCCACCATGACACCTTCTCAGGTCACTTTTGAA
ATAAGAGGAACTCTTTTACCAGGAGAGGTCTTTGCAATATGTGGAAGCTGTGATGCCCTGGGAAACTGGAATCCT
CAAAATGCTGTGGCTCTTATTAATGAAAACGAGACAGGAGACAGTGTGTTGTGGAAAGCAGTGATTGCTCTCAAT
AGAGGAGTGTCAGTGAAGTACCGCTACTTCAGAGGCTGCTTTTTAGAACCAAAGACTATCGGTGGTCCATGTCAA
GTCATAGTTCACAAGTGGGAGACTCATCTACAACCACGATCAATAACCCCTTTAGAAAGTGAAATCATTATTGAC
GATGGACAGTTTGGCATCCACAATGGTGGTAAGCCTATCCCTAACCCTCTCCTCGGTCTCGATTCTACGTAGGCG
GCCGCTCGAGTCTAGAGGGCCCTTCGAAGGTAAGCCTATCCCTAACCCTCTCCTCGGTCTCGATTCTACGCGTAC
CGGTCATCATCACCATCACCATTGAGTTTAAACCCGCTGATCAGCCTCGACTGTGCCTTCTAGT
pcDNA6-NCAN156-359-V5 (Mimotope: NCAN257-264)
CACTGCTTACTGGCTTATCGAAATTAATACGACTCACTATAGGGAGACCCAAGCTGGCTAGCGTTTAAACTTAAG
CTTGGTACCGAGCTCGGATCCACTAGTCCAGTGTGGTGGAATTCCACCATGGTGACAGGCGTCGTGTTCCATTAT
CGGGCGGCCCGGGACCGCTATGCGCTGACCTTCGCTGAGGCCCAGGAGGCTTGTCGCCTAAGCTCTGCTACCATC
GCTGCCCCACGGCACCTGCAGGCTGCCTTTGAAGATGGCTTTGACAACTGCGACGCGGGCTGGCTCTCAGACCGC
ACGGTTCGGTACCCGATCACTCAGTCGCGTCCTGGTTGCTATGGTGACCGCAGCAGTCTCCCGGGTGTTCGGAGC
TACGGGAGACGCGACCCGCAGGAACTCTACGATGTCTACTGCTTTGCCCGCGAGCTAGGGGGTGAAGTCTTTTAC
GTGGGCCCGGCCCGCCGACTGACCCTGGCGGGCGCGCGGGCACAATGTCAGCGGCAGGGTGCAGCGCTGGCCTCG
GTGGGGCAGTTGCACCTGGCCTGGCACGAGGGCCTGGACCAGTGCGACCCGGGCTGGCTGGCAGACGGCAGCGTG
CGCTACCCCATCCAGACTCCGCGCCGGCGTTGCGGGGGCCCCGCCCCAGGTGTGCGCACTGTGTACCGCTTCGCC
AACCGCACCGGCTTTCCTGCGCCAGGAGCACGCTTCGACGCCTACTGCTTCCGAGCTCATCACGGTAAGCCTATC
CCTAACCCTCTCCTCGGTCTCGATTCTACGTAGGCGGCCGCTCGAGTCTAGAGGGCCCTTCGAAGGTAAGCCTAT
CCCTAACCCTCTCCTCGGTCTCGATTCTACGCGTACCGGTCATCATCACCATCACCATTGAGTTTAAACCCGCTG
ATCAGCCTCGACTGTGCCTTCTAGT

SUPPLEMENTS
122
5.7.2 pQE-30
Black letters: plasmid backbone, red letters: truncated protein-coding region, gray highlight: pQE-for /
pQE-rev primer, solid line: BamHI / SalI restriction site, waved line: His6 tag, dotted line: mimotope-
coding region, dashed line: V5 tag.
pQE-30-His6-DMXL2748-926-V5 (Mimotope: DMXL2813-820)
CCCGAAAAGTGCCACCTGACGTCTAAGAAACCATTATTATCATGACATTAACCTATAAAAATAGGCGTATCACGA
GGCCCTTTCGTCTTCACCTCGAGAAATCATAAAAAATTTATTTGCTTTGTGAGCGGATAACAATTATAATAGATT
CAATTGTGAGCGGATAACAATTTCACACAGAATTCATTAAAGAGGAGAAATTAACTATGAGAGGATCGCATCACC
ATCACCATCACGGATCCAACTCTTTACATACCTCAGCCTTCTCTAATGTGGCATGGCTTCCAACTCTTATTCCTA
GTTACTGTCTTGGCACATACTGCAATTCTGCAAGTGCTTGCTTTGTTGCATCTGATGGCAAAAATCTAAGACTCT
ATCAAGCTGTGGTCGATGCAAGAAAATTATTAGATGAACTGTCAGACCCAGAAGCCTCAAAACTGATCGGAGAAG
TGTTTAACATTGTGAGCCAACAGTCCACTGCTCGTCCAGGCTGCATTATTGAGCTTGATGCCATAACTGACCAAT
GTGGATCAAATACACAGCTACTGCACGTGTTTCAAGAAGACTTCATTATTGGATATAAGCCACACAAAGAAGATA
TGGAGAAAAAGGAAAAGGAGTCAGAAATATTTTTCCAGCCATCACAAGGATATCGACCACCACCATTTTCAGAAA
AATTCTTTTTAGTAGTCATTGAGAAGGATGGAAATAATAACTCTATTCTCCATATGTGGCACCTTCATCTTAAGT
CTGTACAAGCGTGCTTAGCCAAAGCTGCAGGTAAGCCTATCCCTAACCCTCTCCTCGGTCTCGATTCTACGTAGG
TCGACCTGCAGCCAAGCTTAATTAGCTGAGCTTGGACTCCTGTTGATAGATCCAGTAATGACCTCAGAAC

SUPPLEMENTS
123
pQE-30-His6-EML5897-1038-V5 (Mimotope: EML5/6997-1004)
CCCGAAAAGTGCCACCTGACGTCTAAGAAACCATTATTATCATGACATTAACCTATAAAAATAGGCGTATCACGA
GGCCCTTTCGTCTTCACCTCGAGAAATCATAAAAAATTTATTTGCTTTGTGAGCGGATAACAATTATAATAGATT
CAATTGTGAGCGGATAACAATTTCACACAGAATTCATTAAAGAGGAGAAATTAACTATGAGAGGATCGCATCACC
ATCACCATCACGGATCCAAAACAGTTAAAGCCCATGATGGGCCCGTGTTCAGTATGCATGCATTGGAGAAAGGAT
TTGTAACTGGAGGAAAAGATGGTATGGTAGCCCTTTGGGATGATTCCTTTGAAAGATGCCTCAAGACCTATGCTA
TAAAAAGAGCTGATTTAGCCCCAGGATCTAAAGGTCTGCTCTTGGAAGATAACCCATCTATACGTGCCATATCAT
TAGGGCATGGTCATATTTTGGTTGGCACAAAGAATGGTGAGATATTAGAAGTGGATAAGAGTGGCCCAATCACTC
TTCTGGTCCAGGGACACATGGAAGGAGAGGTGTGGGGTTTGGCCACACATCCTTACCTGCCCATCTGTGCTACTG
TAAGTGATGATAAGACCTTAAGAATATGGGATCTCTCTCCTAGTCATTGTATGTTGGCAGTCCGGAAAGGTAAGC
CTATCCCTAACCCTCTCCTCGGTCTCGATTCTACGTAGGTCGACCTGCAGCCAAGCTTAATTAGCTGAGCTTGGA
CTCCTGTTGATAGATCCAGTAATGACCTCAGAAC
pQE-30-His6-GPCPD11-118-V5 (Mimotope: GPCPD115-22)
CCCGAAAAGTGCCACCTGACGTCTAAGAAACCATTATTATCATGACATTAACCTATAAAAATAGGCGTATCACGA
GGCCCTTTCGTCTTCACCTCGAGAAATCATAAAAAATTTATTTGCTTTGTGAGCGGATAACAATTATAATAGATT
CAATTGTGAGCGGATAACAATTTCACACAGAATTCATTAAAGAGGAGAAATTAACTATGAGAGGATCGCATCACC
ATCACCATCACGGATCCATGACACCTTCTCAGGTCACTTTTGAAATAAGAGGAACTCTTTTACCAGGAGAGGTCT
TTGCAATATGTGGAAGCTGTGATGCCCTGGGAAACTGGAATCCTCAAAATGCTGTGGCTCTTATTAATGAAAACG
AGACAGGAGACAGTGTGTTGTGGAAAGCAGTGATTGCTCTCAATAGAGGAGTGTCAGTGAAGTACCGCTACTTCA
GAGGCTGCTTTTTAGAACCAAAGACTATCGGTGGTCCATGTCAAGTCATAGTTCACAAGTGGGAGACTCATCTAC
AACCACGATCAATAACCCCTTTAGAAAGTGAAATCATTATTGACGATGGACAGTTTGGCATCCACAATGGTGGTA
AGCCTATCCCTAACCCTCTCCTCGGTCTCGATTCTACGTAGGTCGACCTGCAGCCAAGCTTAATTAGCTGAGCTT
GGACTCCTGTTGATAGATCCAGTAATGACCTCAGAAC
pQE-30-His6-NCAN156-359-V5 (Mimotope: NCAN257-264)
CCCGAAAAGTGCCACCTGACGTCTAAGAAACCATTATTATCATGACATTAACCTATAAAAATAGGCGTATCACGA
GGCCCTTTCGTCTTCACCTCGAGAAATCATAAAAAATTTATTTGCTTTGTGAGCGGATAACAATTATAATAGATT
CAATTGTGAGCGGATAACAATTTCACACAGAATTCATTAAAGAGGAGAAATTAACTATGAGAGGATCGCATCACC
ATCACCATCACGGATCCGTGACAGGCGTCGTGTTCCATTATCGGGCGGCCCGGGACCGCTATGCGCTGACCTTCG
CTGAGGCCCAGGAGGCTTGTCGCCTAAGCTCTGCTACCATCGCTGCCCCACGGCACCTGCAGGCTGCCTTTGAAG
ATGGCTTTGACAACTGCGACGCGGGCTGGCTCTCAGACCGCACGGTTCGGTACCCGATCACTCAGTCGCGTCCTG
GTTGCTATGGTGACCGCAGCAGTCTCCCGGGTGTTCGGAGCTACGGGAGACGCGACCCGCAGGAACTCTACGATG
TCTACTGCTTTGCCCGCGAGCTAGGGGGTGAAGTCTTTTACGTGGGCCCGGCCCGCCGACTGACCCTGGCGGGCG
CGCGGGCACAATGTCAGCGGCAGGGTGCAGCGCTGGCCTCGGTGGGGCAGTTGCACCTGGCCTGGCACGAGGGCC
TGGACCAGTGCGACCCGGGCTGGCTGGCAGACGGCAGCGTGCGCTACCCCATCCAGACTCCGCGCCGGCGTTGCG
GGGGCCCCGCCCCAGGTGTGCGCACTGTGTACCGCTTCGCCAACCGCACCGGCTTTCCTGCGCCAGGAGCACGCT
TCGACGCCTACTGCTTCCGAGCTCATCACGGTAAGCCTATCCCTAACCCTCTCCTCGGTCTCGATTCTACGTAGG
TCGACCTGCAGCCAAGCTTAATTAGCTGAGCTTGGACTCCTGTTGATAGATCCAGTAATGACCTCAGAAC
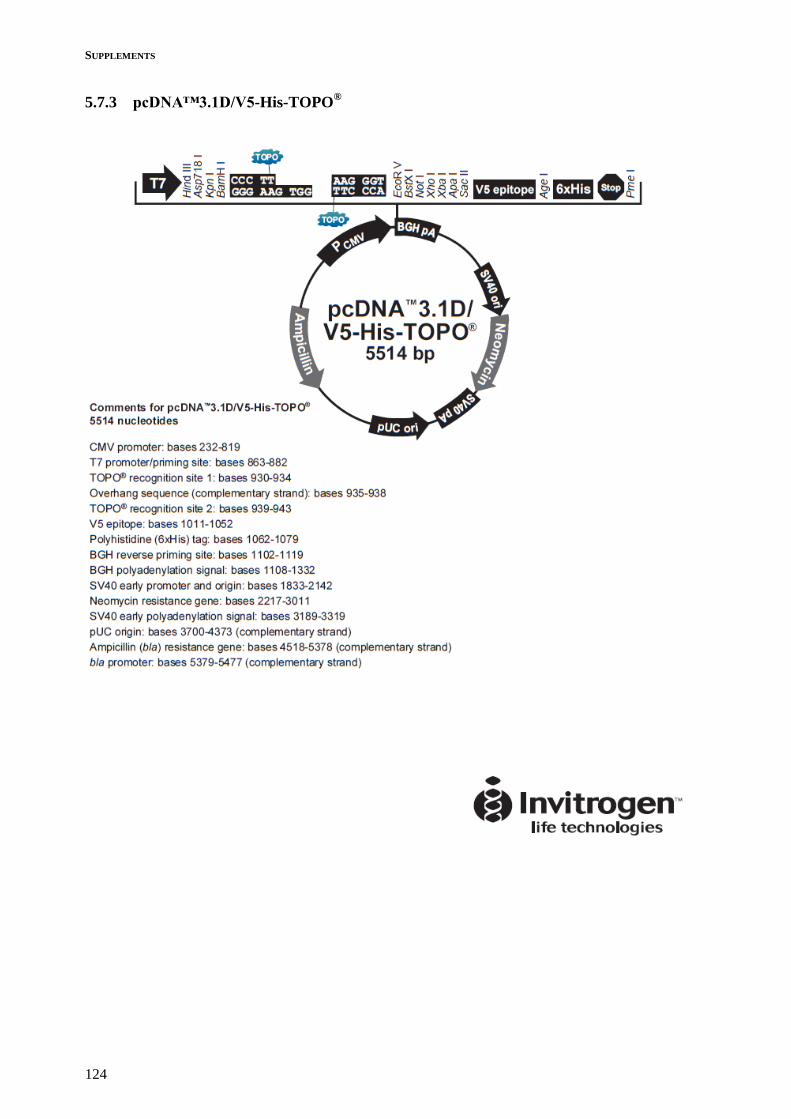
SUPPLEMENTS
124
5.7.3 pcDNA™3.1D/V5-His-TOPO®

SUPPLEMENTS
125
5.7.4 13AAG64P_Ncan-V5_pMA-RQ

SUPPLEMENTS
126
5.8 Protein Truncation
Protein sequences were truncated according to predicted/known domains obtained from
www.uniprot.org. Given are protein sequences with highlighted domains and mRNA sequences.
Green highlight: domains, yellow highlight: mimotope sequence, red letters: truncated protein
sequence.
DMXL2 Dmx-like [Mus musculus]
GenBank: AAH23075.1
http://www.uniprot.org/uniprot/Q8BPN8
10 20 30 40 50 60
MHLHQVLTGA VNPGDNCYSV GSVGDVPFTA YGSGCDIVIL ASDFECVQII PGAKHGNIQV
70 80 90 100 110 120
SCVECSNQHG RVAASYGNAV CIFEPLGVNS HKRNSQLKCQ WLKTGQFFLS SVTYNLAWDP
WD1 130 140 150 160 170 180
QDNRLLTATD SIQLWAPPGG DILEEEEDVD NRAPPVLNDW KCIWQCKTSV SVHLMEWSPD
WD2 190 200 210 220 230 240
GEYFATAGKD DCLLKVWYPM TGWKSSIIPQ DPHEVKRRRA STQFSFVYLA HPRAVTGFSW
WD3 250 260 270 280 290 300
RKTSKYMPRG SVCNVLLTSC HDGVCRLWAE TLLPEDCLLG EQICETTTSS VASNLSSAGK
310 320 330 340 350 360
HKDRIQHALE TIHHLKNLRK GQRRSSVLVT HAELMPDKTA THEVHRHISH HANALCHFHI
370 380 390 400 410 420
AASINPTTDI PNVLVGTAFN IDDINGGFVV HWLNNKEFHF TSSTEIFMHQ LRKLSEKQLD
430 440 450 460 470 480
HESDDADRED EERSQDERER GLRMKLDHEL SLDRESEAGT GSSEHEDGER EGSPRTHPRP
490 WD4 500 510 520 530 540
SISMPLPTVL LDRKIETLLT EWNKNPDMLF TIHPVDGTFL VWHVKYLDEY NPGIFRQVQV
550 560 570 580 590 600
SFSSRIPVAF PSGDANSLSK NIMMYACVNA TKDSYNPSQQ EMMSVDSPHG SQLHSPSHST
WD5 610 620 630 640 650 660
DMNILAPTVM MVSKHIDGSL NQWAVTFADK SAFTTVLTVS HKFRYCGHRF HLNDLACHSV
670 680 690 700 710 720
LPLLLTSSHH NALLTPESDC QWDSDSKVNR LIDPVKHTKA SSKQPLRNAA TRTFHDPNAI
730 740 750 760 770 780
YSELILWRVD PIGPLSYTGG VSELARINSL HTSAFSNVAW LPTLIPSYCL GTYCNSASAC
WD6 790 800 810 820 830 840
FVASDGKNLR LYQAVVDARK LLDELSDPEA SKLIGEVFNI VSQQSTARPG CIIELDAITD
850 860 870 880 890 900
QCGSNTQLLH VFQEDFIIGY KPHKEDMEKK EKESEIFFQP SQGYRPPPFS EKFFLVVIEK
WD7 910 920 930 940 950 960
DGNNNSILHM WHLHLKSVQA CLAKAAEGIS SDSLLSVPGQ KNLDSSPETS SSMSSVPHSS
970 980 990 1000 WD8 1010 1020
SIANLQTASK LILSSRLVYS QPLDLPEAVE VIRATPSAGH LSSSSIYPVC LAPYLVVTTC
1030 1040 1050 1060 1070 1080
SDNKVRFWKC CMETNSLGNT SDESETYHWR RWPLMNDEGE DNSSTVSIVG RPVAVSCSYT
1090 1100 1110 1120 1130 1140
GRLAVAYKQP IHHNGFISKE FSMHVCIFEC ESTGGSEWVL EQTIHLDDLV KVGSVLDSRV
1150 1160 1170 WD9 1180 1190 1200
SVDSNLFVYS KSDAFLSKDR YLIPNIKHLV HLDWVSKEDG SHILTVGVGA NIFMYGRLSG
1210 1220 1230 1240 1250 WD10 1260
IVSDQTNSKD GVAVITLPLG GSIKQGVKSR WVLLRSIDLV SSVDGTPSLP VSLSWVRDGI
1270 1280 1290 1300 1310 1320
LVVGMDCEMH VYAQWKHSVK FGNVDADSPV EETIQDHSAL KSSMLARKSI VEGAAIPDDV
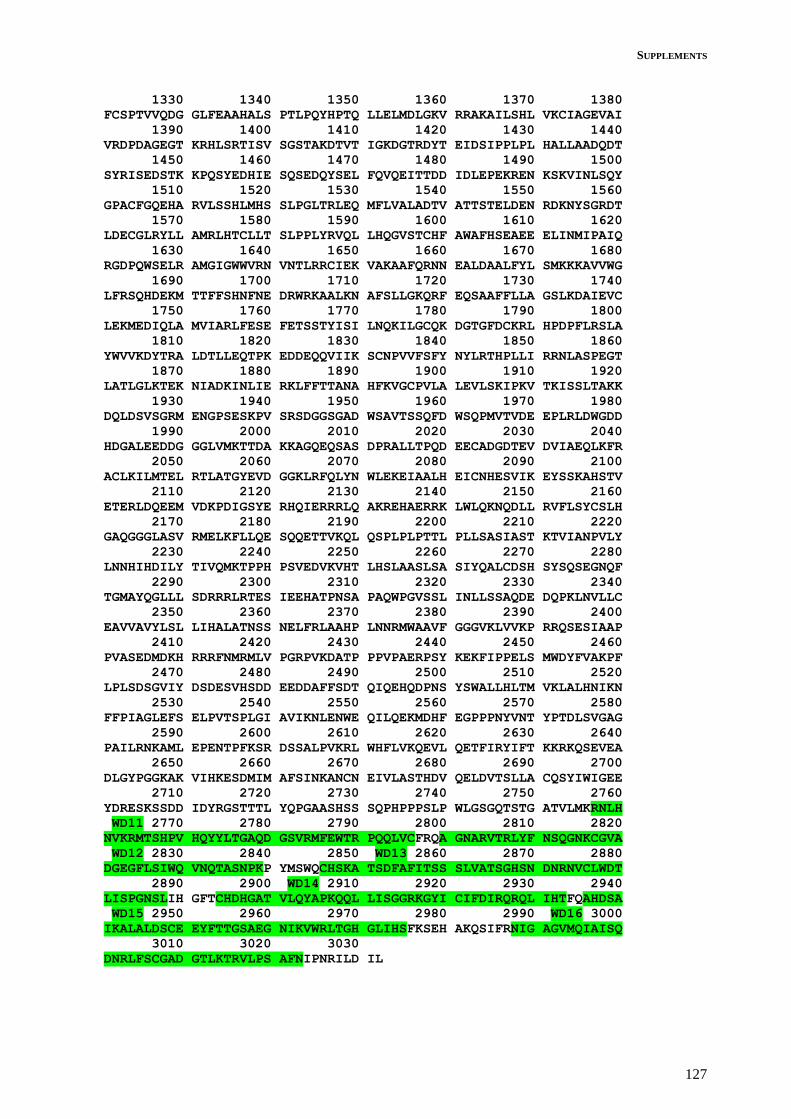
SUPPLEMENTS
127
1330 1340 1350 1360 1370 1380
FCSPTVVQDG GLFEAAHALS PTLPQYHPTQ LLELMDLGKV RRAKAILSHL VKCIAGEVAI
1390 1400 1410 1420 1430 1440
VRDPDAGEGT KRHLSRTISV SGSTAKDTVT IGKDGTRDYT EIDSIPPLPL HALLAADQDT
1450 1460 1470 1480 1490 1500
SYRISEDSTK KPQSYEDHIE SQSEDQYSEL FQVQEITTDD IDLEPEKREN KSKVINLSQY
1510 1520 1530 1540 1550 1560
GPACFGQEHA RVLSSHLMHS SLPGLTRLEQ MFLVALADTV ATTSTELDEN RDKNYSGRDT
1570 1580 1590 1600 1610 1620
LDECGLRYLL AMRLHTCLLT SLPPLYRVQL LHQGVSTCHF AWAFHSEAEE ELINMIPAIQ
1630 1640 1650 1660 1670 1680
RGDPQWSELR AMGIGWWVRN VNTLRRCIEK VAKAAFQRNN EALDAALFYL SMKKKAVVWG
1690 1700 1710 1720 1730 1740
LFRSQHDEKM TTFFSHNFNE DRWRKAALKN AFSLLGKQRF EQSAAFFLLA GSLKDAIEVC
1750 1760 1770 1780 1790 1800
LEKMEDIQLA MVIARLFESE FETSSTYISI LNQKILGCQK DGTGFDCKRL HPDPFLRSLA
1810 1820 1830 1840 1850 1860
YWVVKDYTRA LDTLLEQTPK EDDEQQVIIK SCNPVVFSFY NYLRTHPLLI RRNLASPEGT
1870 1880 1890 1900 1910 1920
LATLGLKTEK NIADKINLIE RKLFFTTANA HFKVGCPVLA LEVLSKIPKV TKISSLTAKK
1930 1940 1950 1960 1970 1980
DQLDSVSGRM ENGPSESKPV SRSDGGSGAD WSAVTSSQFD WSQPMVTVDE EPLRLDWGDD
1990 2000 2010 2020 2030 2040
HDGALEEDDG GGLVMKTTDA KKAGQEQSAS DPRALLTPQD EECADGDTEV DVIAEQLKFR
2050 2060 2070 2080 2090 2100
ACLKILMTEL RTLATGYEVD GGKLRFQLYN WLEKEIAALH EICNHESVIK EYSSKAHSTV
2110 2120 2130 2140 2150 2160
ETERLDQEEM VDKPDIGSYE RHQIERRRLQ AKREHAERRK LWLQKNQDLL RVFLSYCSLH
2170 2180 2190 2200 2210 2220
GAQGGGLASV RMELKFLLQE SQQETTVKQL QSPLPLPTTL PLLSASIAST KTVIANPVLY
2230 2240 2250 2260 2270 2280
LNNHIHDILY TIVQMKTPPH PSVEDVKVHT LHSLAASLSA SIYQALCDSH SYSQSEGNQF
2290 2300 2310 2320 2330 2340
TGMAYQGLLL SDRRRLRTES IEEHATPNSA PAQWPGVSSL INLLSSAQDE DQPKLNVLLC
2350 2360 2370 2380 2390 2400
EAVVAVYLSL LIHALATNSS NELFRLAAHP LNNRMWAAVF GGGVKLVVKP RRQSESIAAP
2410 2420 2430 2440 2450 2460
PVASEDMDKH RRRFNMRMLV PGRPVKDATP PPVPAERPSY KEKFIPPELS MWDYFVAKPF
2470 2480 2490 2500 2510 2520
LPLSDSGVIY DSDESVHSDD EEDDAFFSDT QIQEHQDPNS YSWALLHLTM VKLALHNIKN
2530 2540 2550 2560 2570 2580
FFPIAGLEFS ELPVTSPLGI AVIKNLENWE QILQEKMDHF EGPPPNYVNT YPTDLSVGAG
2590 2600 2610 2620 2630 2640
PAILRNKAML EPENTPFKSR DSSALPVKRL WHFLVKQEVL QETFIRYIFT KKRKQSEVEA
2650 2660 2670 2680 2690 2700
DLGYPGGKAK VIHKESDMIM AFSINKANCN EIVLASTHDV QELDVTSLLA CQSYIWIGEE
2710 2720 2730 2740 2750 2760
YDRESKSSDD IDYRGSTTTL YQPGAASHSS SQPHPPPSLP WLGSGQTSTG ATVLMKRNLH
WD11 2770 2780 2790 2800 2810 2820
NVKRMTSHPV HQYYLTGAQD GSVRMFEWTR PQQLVCFRQA GNARVTRLYF NSQGNKCGVA
WD12 2830 2840 2850 WD13 2860 2870 2880
DGEGFLSIWQ VNQTASNPKP YMSWQCHSKA TSDFAFITSS SLVATSGHSN DNRNVCLWDT
2890 2900 WD14 2910 2920 2930 2940
LISPGNSLIH GFTCHDHGAT VLQYAPKQQL LISGGRKGYI CIFDIRQRQL IHTFQAHDSA
WD15 2950 2960 2970 2980 2990 WD16 3000
IKALALDSCE EYFTTGSAEG NIKVWRLTGH GLIHSFKSEH AKQSIFRNIG AGVMQIAISQ
3010 3020 3030
DNRLFSCGAD GTLKTRVLPS AFNIPNRILD IL

SUPPLEMENTS
128
M H L H Q V L T G A V N P G D N C Y S V
ATG CAT CTG CAT CAG GTC CTC ACC GGG GCT GTC AAC CCT GGG GAC AAC TGC TAT TCG GTG
G S V G D V P F T A Y G S G C D I V I L
GGC AGC GTC GGG GAC GTC CCC TTC ACG GCA TAT GGA TCA GGC TGT GAT ATT GTT ATT CTG
A S D F E C V Q I I P G A K H G N I Q V
GCG AGT GAC TTT GAA TGT GTG CAG ATC ATC CCT GGT GCT AAG CAT GGG AAC ATC CAA GTC
S C V E C S N Q H G R V A A S Y G N A V
AGT TGT GTG GAA TGC TCC AAC CAG CAT GGG AGA GTT GCA GCT TCA TAT GGG AAT GCT GTG
C I F E P L G V N S H K R N S Q L K C Q
TGT ATT TTT GAA CCC CTG GGT GTA AAT TCT CAT AAG AGA AAC AGT CAA CTC AAG TGT CAG
W L K T G Q F F L S S V T Y N L A W D P
TGG CTT AAA ACT GGA CAG TTT TTT TTG AGT TCC GTG ACA TAC AAC TTA GCA TGG GAC CCT
Q D N R L L T A T D S I Q L W A P P G G
CAA GAT AAC AGA TTG CTG ACA GCA ACG GAT TCG ATT CAG CTG TGG GCT CCT CCA GGC GGT
D I L E E E E D V D N R A P P V L N D W
GAT ATT CTA GAA GAG GAG GAA GAT GTT GAT AAT AGA GCC CCT CCT GTT TTA AAT GAT TGG
K C I W Q C K T S V S V H L M E W S P D
AAG TGC ATC TGG CAG TGC AAA ACC TCA GTG TCT GTA CAT CTG ATG GAA TGG TCT CCT GAT
G E Y F A T A G K D D C L L K V W Y P M
GGT GAA TAC TTT GCC ACT GCT GGA AAG GAT GAC TGT CTT CTG AAA GTC TGG TAC CCT ATG
T G W K S S I I P Q D P H E V K R R R A
ACT GGC TGG AAG TCT TCA ATC ATA CCT CAA GAT CCC CAT GAA GTG AAG AGG AGA CGG GCT
S T Q F S F V Y L A H P R A V T G F S W
TCC ACT CAG TTC TCC TTT GTT TAC TTG GCA CAC CCT CGA GCC GTG ACA GGT TTC TCA TGG
R K T S K Y M P R G S V C N V L L T S C
CGG AAA ACT AGC AAG TAT ATG CCC AGG GGC TCT GTC TGT AAT GTC TTA CTG ACT TCA TGT
H D G V C R L W A E T L L P E D C L L G
CAT GAT GGT GTG TGT CGG CTC TGG GCA GAA ACA TTG TTA CCT GAA GAC TGC CTT TTG GGT
E Q I C E T T T S S V A S N L S S A G K
GAG CAG ATT TGT GAG ACC ACT ACC TCC AGC GTT GCC AGC AAC CTC TCT TCT GCT GGG AAA
H K D R I Q H A L E T I H H L K N L R K
CAC AAA GAC AGG ATC CAG CAT GCT CTT GAG ACA ATA CAC CAT TTG AAG AAT TTA AGG AAA
G Q R R S S V L V T H A E L M P D K T A
GGA CAA AGG AGG TCT TCT GTT CTT GTA ACT CAC GCT GAA CTG ATG CCT GAC AAG ACT GCA
T H E V H R H I S H H A N A L C H F H I
ACC CAC GAG GTT CAC AGA CAC ATT TCT CAC CAT GCC AAC GCA CTG TGC CAC TTT CAC ATC
A A S I N P T T D I P N V L V G T A F N
GCG GCG AGC ATC AAT CCT ACT ACA GAT ATT CCA AAT GTC CTG GTT GGC ACT GCA TTT AAT
I D D I N G G F V V H W L N N K E F H F
ATT GAT GAT ATC AAT GGA GGA TTT GTA GTT CAT TGG TTA AAT AAC AAG GAA TTT CAT TTT
T S S T E I F M H Q L R K L S E K Q L D
ACA TCA TCA ACT GAA ATA TTT ATG CAC CAA TTA CGA AAA CTT TCT GAA AAA CAA TTA GAT
H E S D D A D R E D E E R S Q D E R E R
CAT GAA AGT GAT GAT GCA GAT AGA GAA GAT GAG GAG CGC TCA CAG GAC GAG AGA GAG AGG
G L R M K L D H E L S L D R E S E A G T
GGC TTA CGC ATG AAA CTG GAC CAT GAA TTA TCT CTG GAT AGA GAA TCT GAG GCA GGT ACA
G S S E H E D G E R E G S P R T H P R P
GGA TCA TCA GAA CAT GAA GAT GGA GAA CGA GAG GGA AGT CCT AGA ACC CAT CCA CGA CCT
S I S M P L P T V L L D R K I E T L L T
AGC ATC TCA ATG CCA CTG CCT ACA GTA CTG CTG GAC CGG AAG ATT GAA ACG CTG CTG ACA
E W N K N P D M L F T I H P V D G T F L
GAG TGG AAC AAG AAC CCT GAC ATG TTA TTC ACG ATA CAC CCT GTA GAT GGA ACT TTT CTA
V W H V K Y L D E Y N P G I F R Q V Q V
GTG TGG CAT GTA AAG TAT TTG GAT GAA TAT AAC CCT GGA ATA TTT AGA CAA GTT CAG GTT
S F S S R I P V A F P S G D A N S L S K
TCT TTT TCC TCT CGG ATT CCT GTT GCA TTT CCC TCT GGG GAC GCC AAC TCT CTT AGT AAA
N I M M Y A C V N A T K D S Y N P S Q Q
AAC ATC ATG ATG TAT GCT TGT GTG AAT GCT ACA AAA GAT TCA TAC AAC CCA TCC CAG CAA
E M M S V D S P H G S Q L H S P S H S T
GAG ATG ATG TCT GTA GAT AGT CCC CAT GGA TCA CAG CTA CAC TCT CCA TCA CAC AGC ACC
D M N I L A P T V M M V S K H I D G S L
GAT ATG AAT ATT TTA GCA CCT ACG GTA ATG ATG GTC TCT AAA CAC ATA GAT GGG TCT TTG
N Q W A V T F A D K S A F T T V L T V S
AAT CAG TGG GCA GTC ACG TTT GCT GAC AAG TCA GCC TTT ACC ACT GTT CTG ACT GTG TCC
H K F R Y C G H R F H L N D L A C H S V
CAC AAA TTC AGA TAC TGT GGT CAC CGA TTC CAC CTC AAT GAC CTG GCA TGC CAT TCT GTT
L P L L L T S S H H N A L L T P E S D C
TTA CCC CTC TTG CTG ACA TCT TCC CAT CAT AAT GCT CTG TTG ACT CCT GAA TCA GAC TGT
Q W D S D S K V N R L I D P V K H T K A
CAG TGG GAC TCC GAC AGT AAA GTA AAT AGA TTA ATA GAT CCT GTA AAA CAC ACA AAA GCT

SUPPLEMENTS
129
S S K Q P L R N A A T R T F H D P N A I
TCA TCA AAA CAG CCT CTG AGA AAT GCA GCA ACC CGT ACA TTT CAT GAC CCA AAT GCA ATC
Y S E L I L W R V D P I G P L S Y T G G
TAC AGT GAA CTT ATT TTG TGG CGT GTA GAC CCC ATT GGA CCT TTG TCA TAT ACT GGA GGA
V S E L A R I N S L H T S A F S N V A W
GTG TCA GAA TTG GCT CGA ATT AAC TCT TTA CAT ACC TCA GCC TTC TCT AAT GTG GCA TGG
L P T L I P S Y C L G T Y C N S A S A C
CTT CCA ACT CTT ATT CCT AGT TAC TGT CTT GGC ACA TAC TGC AAT TCT GCA AGT GCT TGC
F V A S D G K N L R L Y Q A V V D A R K
TTT GTT GCA TCT GAT GGC AAA AAT CTA AGA CTC TAT CAA GCT GTG GTC GAT GCA AGA AAA
L L D E L S D P E A S K L I G E V F N I
TTA TTA GAT GAA CTG TCA GAC CCA GAA GCC TCA AAA CTG ATC GGA GAA GTG TTT AAC ATT
V S Q Q S T A R P G C I I E L D A I T D
GTG AGC CAA CAG TCC ACT GCT CGT CCA GGC TGC ATT ATT GAG CTT GAT GCC ATA ACT GAC
Q C G S N T Q L L H V F Q E D F I I G Y
CAA TGT GGA TCA AAT ACA CAG CTA CTG CAC GTG TTT CAA GAA GAC TTC ATT ATT GGA TAT
K P H K E D M E K K E K E S E I F F Q P
AAG CCA CAC AAA GAA GAT ATG GAG AAA AAG GAA AAG GAG TCA GAA ATA TTT TTC CAG CCA
S Q G Y R P P P F S E K F F L V V I E K
TCA CAA GGA TAT CGA CCA CCA CCA TTT TCA GAA AAA TTC TTT TTA GTA GTC ATT GAG AAG
D G N N N S I L H M W H L H L K S V Q A
GAT GGA AAT AAT AAC TCT ATT CTC CAT ATG TGG CAC CTT CAT CTT AAG TCT GTA CAA GCG
C L A K A A E G I S S D S L L S V P G Q
TGC TTA GCC AAA GCT GCA GAG GGC ATC TCA TCT GAC AGT CTG CTC TCA GTC CCG GGG CAG
K N L D S S P E T S S S M S S V P H S S
AAG AAC CTG GAC TCT TCT CCA GAA ACC TCC TCT AGT ATG AGC TCC GTG CCA CAT TCC TCG
S I A N L Q T A S K L I L S S R L V Y S
TCA ATT GCC AAT CTT CAA ACT GCT AGT AAG CTT ATT CTG AGC TCC AGA CTT GTA TAT AGC
Q P L D L P E A V E V I R A T P S A G H
CAG CCC CTG GAT CTG CCG GAA GCT GTT GAA GTA ATA AGA GCA ACG CCT TCA GCA GGT CAT
L S S S S I Y P V C L A P Y L V V T T C
CTG AGT TCC TCT TCA ATT TAC CCA GTG TGC CTT GCA CCT TAT TTA GTG GTT ACA ACT TGC
S D N K V R F W K C C M E T N S L G N T
TCC GAC AAT AAA GTA CGC TTC TGG AAA TGT TGT ATG GAA ACT AAC TCA CTG GGC AAT ACA
S D E S E T Y H W R R W P L M N D E G E
AGT GAT GAG AGT GAG ACC TAT CAT TGG AGG AGA TGG CCC TTG ATG AAT GAT GAA GGA GAA
D N S S T V S I V G R P V A V S C S Y T
GAT AAC AGC AGT ACT GTG AGC ATC GTG GGA AGA CCT GTT GCT GTT AGC TGC TCA TAC ACA
G R L A V A Y K Q P I H H N G F I S K E
GGC CGC CTT GCA GTG GCT TAC AAG CAA CCC ATC CAC CAC AAT GGT TTT ATT TCT AAA GAA
F S M H V C I F E C E S T G G S E W V L
TTC TCT ATG CAT GTC TGT ATA TTT GAA TGC GAA TCT ACA GGA GGG TCA GAA TGG GTT TTA
E Q T I H L D D L V K V G S V L D S R V
GAA CAG ACG ATC CAT CTT GAT GAT TTA GTT AAG GTT GGA AGT GTA CTT GAT TCA AGG GTC
S V D S N L F V Y S K S D A F L S K D R
AGT GTT GAC AGT AAT CTG TTT GTA TAT AGC AAA TCA GAT GCA TTT TTA AGT AAG GAT AGA
Y L I P N I K H L V H L D W V S K E D G
TAC CTT ATT CCA AAT ATC AAG CAT TTA GTA CAT TTG GAC TGG GTG TCA AAA GAA GAT GGC
S H I L T V G V G A N I F M Y G R L S G
TCT CAC ATC CTC ACA GTG GGG GTT GGT GCT AAT ATC TTC ATG TAT GGG AGA CTT TCA GGA
I V S D Q T N S K D G V A V I T L P L G
ATT GTA AGT GAC CAA ACC AAC AGT AAG GAT GGA GTA GCT GTC ATC ACT TTA CCA CTA GGT
G S I K Q G V K S R W V L L R S I D L V
GGT AGT ATC AAG CAA GGA GTT AAG TCA AGA TGG GTT CTT CTG AGA TCT ATA GAC TTA GTA
S S V D G T P S L P V S L S W V R D G I
TCC TCT GTG GAT GGC ACA CCT TCA CTG CCT GTT TCT CTC TCT TGG GTA AGA GAT GGA ATA
L V V G M D C E M H V Y A Q W K H S V K
TTG GTG GTG GGA ATG GAT TGT GAA ATG CAT GTA TAT GCC CAA TGG AAG CAT TCT GTC AAA
F G N V D A D S P V E E T I Q D H S A L
TTT GGA AAC GTT GAC GCT GAT AGT CCA GTT GAA GAG ACA ATA CAA GAT CAC TCT GCC CTT
K S S M L A R K S I V E G A A I P D D V
AAA TCC TCT ATG CTG GCA AGA AAA AGT ATT GTT GAA GGA GCA GCT ATC CCT GAT GAT GTT
F C S P T V V Q D G G L F E A A H A L S
TTC TGT TCA CCT ACT GTG GTT CAA GAT GGT GGC TTA TTT GAG GCT GCA CAT GCA CTC TCT
P T L P Q Y H P T Q L L E L M D L G K V
CCT ACT CTG CCA CAG TAT CAT CCA ACT CAG CTG TTA GAA TTA ATG GAC TTA GGG AAA GTT
R R A K A I L S H L V K C I A G E V A I
AGA AGA GCT AAG GCC ATT CTT TCC CAT TTG GTA AAG TGC ATC GCA GGT GAA GTT GCA ATA
V R D P D A G E G T K R H L S R T I S V
GTT CGG GAT CCT GAT GCT GGA GAA GGA ACT AAG CGG CAT CTC TCT CGG ACC ATT AGT GTG

SUPPLEMENTS
130
S G S T A K D T V T I G K D G T R D Y T
AGC GGC AGT ACA GCA AAG GAT ACA GTT ACC ATT GGG AAG GAT GGT ACT CGG GAT TAT ACC
E I D S I P P L P L H A L L A A D Q D T
GAG ATA GAC TCT ATT CCT CCA CTA CCA CTA CAC GCA TTG CTT GCT GCA GAC CAG GAC ACA
S Y R I S E D S T K K P Q S Y E D H I E
TCC TAC AGA ATT TCA GAG GAC AGT ACA AAA AAG CCA CAG AGC TAT GAG GAC CAT ATT GAA
S Q S E D Q Y S E L F Q V Q E I T T D D
AGC CAA TCA GAG GAT CAA TAT TCA GAG CTG TTT CAA GTC CAG GAG ATA ACA ACA GAT GAT
I D L E P E K R E N K S K V I N L S Q Y
ATT GAT TTA GAG CCA GAA AAG AGA GAG AAC AAA TCA AAA GTA ATA AAC CTG TCA CAG TAT
G P A C F G Q E H A R V L S S H L M H S
GGA CCA GCC TGT TTT GGC CAG GAA CAT GCT AGA GTA CTT TCA AGT CAT CTA ATG CAC TCA
S L P G L T R L E Q M F L V A L A D T V
AGT CTG CCA GGC CTT ACC CGC TTG GAG CAG ATG TTC CTT GTA GCA CTG GCG GAT ACT GTG
A T T S T E L D E N R D K N Y S G R D T
GCA ACC ACC AGT ACG GAG CTT GAT GAA AAC AGG GAT AAG AAC TAC TCA GGA AGA GAC ACC
L D E C G L R Y L L A M R L H T C L L T
TTA GAT GAG TGT GGT TTG AGA TAC CTG TTA GCT ATG CGC TTG CAC ACA TGC CTG TTA ACA
S L P P L Y R V Q L L H Q G V S T C H F
TCA CTG CCT CCT TTA TAC CGA GTC CAG CTC CTT CAC CAA GGA GTG TCT ACC TGC CAC TTT
A W A F H S E A E E E L I N M I P A I Q
GCC TGG GCT TTT CAT TCT GAA GCT GAG GAA GAA CTG ATC AAT ATG ATT CCA GCA ATC CAA
R G D P Q W S E L R A M G I G W W V R N
AGA GGG GAC CCT CAG TGG TCT GAA TTA AGA GCT ATG GGA ATA GGC TGG TGG GTG AGG AAT
V N T L R R C I E K V A K A A F Q R N N
GTT AAC ACA CTC CGA AGA TGC ATT GAA AAG GTT GCC AAA GCT GCT TTT CAG AGG AAC AAC
E A L D A A L F Y L S M K K K A V V W G
GAG GCC TTA GAT GCC GCT TTG TTC TAC CTT TCC ATG AAG AAG AAA GCG GTA GTG TGG GGT
L F R S Q H D E K M T T F F S H N F N E
CTG TTC AGG TCA CAA CAT GAT GAA AAA ATG ACA ACA TTC TTC AGC CAC AAC TTT AAT GAA
D R W R K A A L K N A F S L L G K Q R F
GAT AGA TGG CGG AAA GCT GCT TTG AAA AAC GCC TTT TCT TTA CTT GGA AAG CAG CGC TTT
E Q S A A F F L L A G S L K D A I E V C
GAG CAG TCT GCT GCT TTT TTC TTG TTA GCT GGT TCA TTG AAA GAT GCA ATT GAG GTA TGT
L E K M E D I Q L A M V I A R L F E S E
CTT GAA AAA ATG GAA GAT ATT CAA CTA GCC ATG GTT ATT GCC CGT TTA TTT GAA TCT GAA
F E T S S T Y I S I L N Q K I L G C Q K
TTT GAG ACT TCA TCT ACT TAC ATC TCT ATC TTG AAT CAG AAA ATT TTG GGT TGT CAG AAA
D G T G F D C K R L H P D P F L R S L A
GAC GGC ACA GGA TTC GAT TGT AAA AGA TTA CAT CCT GAC CCT TTT CTG CGT AGT CTT GCC
Y W V V K D Y T R A L D T L L E Q T P K
TAT TGG GTA GTG AAA GAT TAT ACC CGA GCC TTG GAT ACC TTA CTG GAA CAG ACA CCA AAG
E D D E Q Q V I I K S C N P V V F S F Y
GAA GAT GAC GAG CAA CAA GTC ATC ATC AAA TCT TGT AAC CCA GTG GTG TTC AGT TTT TAC
N Y L R T H P L L I R R N L A S P E G T
AAC TAC CTT CGA ACA CAT CCT TTA CTT ATT CGA AGA AAT CTT GCT TCC CCT GAA GGA ACT
L A T L G L K T E K N I A D K I N L I E
TTG GCA ACT TTA GGT CTC AAA ACT GAG AAA AAC ATT GCT GAT AAA ATT AAC CTC ATA GAA
R K L F F T T A N A H F K V G C P V L A
AGA AAA TTA TTT TTT ACC ACC GCT AAT GCT CAT TTT AAA GTT GGA TGT CCT GTT TTA GCC
L E V L S K I P K V T K I S S L T A K K
CTT GAA GTA CTT TCT AAA ATT CCT AAA GTA ACC AAA ATA TCC TCC TTA ACT GCA AAA AAA
D Q L D S V S G R M E N G P S E S K P V
GAT CAG CTT GAC TCT GTT TCT GGA AGG ATG GAG AAC GGG CCA TCA GAA TCA AAA CCA GTG
S R S D G G S G A D W S A V T S S Q F D
AGC AGG AGT GAT GGT GGT TCT GGG GCT GAC TGG TCG GCT GTG ACT TCC TCC CAG TTT GAC
W S Q P M V T V D E E P L R L D W G D D
TGG AGT CAG CCA ATG GTT ACA GTT GAC GAG GAG CCT CTT AGG CTC GAT TGG GGT GAC GAT
H D G A L E E D D G G G L V M K T T D A
CAT GAC GGT GCC TTA GAA GAG GAT GAT GGC GGT GGC TTA GTA ATG AAA ACT ACA GAT GCC
K K A G Q E Q S A S D P R A L L T P Q D
AAG AAG GCT GGC CAG GAG CAG AGT GCC TCA GAC CCT CGT GCT TTG CTG ACT CCT CAG GAC
E E C A D G D T E V D V I A E Q L K F R
GAG GAG TGT GCT GAC GGC GAT ACT GAG GTC GAT GTG ATT GCT GAA CAA CTC AAG TTC CGA
A C L K I L M T E L R T L A T G Y E V D
GCT TGC TTG AAG ATC CTT ATG ACT GAG TTA AGA ACT TTG GCT ACA GGT TAT GAA GTA GAT
G G K L R F Q L Y N W L E K E I A A L H
GGA GGG AAG CTG AGA TTT CAG CTC TAT AAC TGG CTT GAA AAG GAA ATT GCT GCC TTG CAT
E I C N H E S V I K E Y S S K A H S T V
GAG ATA TGC AAC CAT GAA TCA GTT ATT AAA GAA TAT TCG AGC AAA GCG CAT TCT ACA GTA
SUPPLEMENTS
131
E T E R L D Q E E M V D K P D I G S Y E
GAG ACT GAG CGT CTG GAT CAG GAG GAA ATG GTG GAC AAG CCG GAT ATC GGT TCC TAT GAG
R H Q I E R R R L Q A K R E H A E R R K
CGC CAC CAA ATA GAA CGA CGA CGG CTG CAG GCT AAA AGG GAG CAT GCA GAA AGA CGA AAG
L W L Q K N Q D L L R V F L S Y C S L H
CTG TGG TTG CAG AAA AAC CAA GAT CTC CTG AGA GTA TTT CTC AGT TAC TGT AGC CTT CAT
G A Q G G G L A S V R M E L K F L L Q E
GGA GCC CAG GGC GGT GGT CTG GCT TCA GTA AGA ATG GAA CTC AAA TTT TTG CTG CAA GAG
S Q Q E T T V K Q L Q S P L P L P T T L
TCA CAG CAG GAA ACT ACA GTG AAG CAG CTC CAG TCC CCA CTG CCA CTA CCT ACC ACG TTG
P L L S A S I A S T K T V I A N P V L Y
CCT CTG CTT TCA GCA AGT ATC GCA TCA ACA AAA ACA GTC ATA GCT AAC CCT GTA TTG TAT
L N N H I H D I L Y T I V Q M K T P P H
TTA AAT AAC CAC ATC CAT GAT ATA CTT TAT ACT ATT GTG CAG ATG AAA ACA CCA CCT CAT
P S V E D V K V H T L H S L A A S L S A
CCC AGT GTT GAA GAT GTG AAG GTG CAC ACA CTT CAT TCA CTA GCA GCA TCA CTT TCT GCA
S I Y Q A L C D S H S Y S S Q S E G N Q
TCA ATT TAC CAG GCA TTA TGT GAC AGT CAT AGC TAC AGC AGT CAG TCG GAA GGA AAT CAG
F T G M A Y Q G L L L S D R R R L R T E
TTC ACA GGA ATG GCC TAT CAA GGG CTT CTT CTA AGT GAT CGA CGA CGC CTC AGG ACA GAA
S I E E H A T P N S A P A Q W P G V S S
AGC ATC GAA GAG CAT GCA ACA CCA AAC TCA GCT CCT GCT CAG TGG CCT GGT GTG AGC TCA
L I N L L S S A Q D E D Q P K L N V L L
CTC ATT AAT CTC TTG AGT TCT GCC CAA GAT GAA GAC CAG CCA AAA TTG AAT GTT CTG TTG
C E A V V A V Y L S L L I H A L A T N S
TGT GAA GCT GTT GTT GCT GTT TAC TTA AGT TTA CTG ATA CAT GCT CTT GCC ACA AAT TCT
S N E L F R L A A H P L N N R M W A A V
TCC AAT GAA TTG TTT CGG CTT GCA GCC CAC CCG TTA AAT AAT CGA ATG TGG GCT GCT GTT
F G G G V K L V V K P R R Q S E S I A A
TTC GGA GGG GGT GTA AAA CTT GTT GTG AAG CCT CGG AGG CAA TCA GAA AGT ATC GCA GCA
P P V A S E D M D K H R R R F N M R M L
CCT CCT GTG GCC TCT GAG GAC ATG GAC AAG CAC CGC AGG AGA TTC AAC ATG AGG ATG CTG
V P G R P V K D A T P P P V P A E R P S
GTC CCT GGG AGG CCT GTA AAA GAT GCC ACC CCA CCC CCA GTG CCT GCA GAA AGA CCA TCT
Y K E K F I P P E L S M W D Y F V A K P
TAC AAG GAA AAA TTT ATT CCC CCA GAA CTT AGT ATG TGG GAC TAC TTT GTT GCA AAG CCG
F L P L S D S G V I Y D S D E S V H S D
TTC CTC CCT TTG TCT GAT AGT GGT GTC ATA TAT GAT TCT GAT GAA AGT GTA CAC AGT GAT
D E E D D A F F S D T Q I Q E H Q D P N
GAT GAA GAG GAT GAT GCC TTT TTT TCA GAC ACA CAA ATA CAG GAG CAT CAA GAT CCT AAT
S Y S W A L L H L T M V K L A L H N I K
TCT TAT AGC TGG GCT CTT CTG CAT TTG ACA ATG GTT AAG CTG GCG CTT CAC AAT ATC AAG
N F F P I A G L E F S E L P V T S P L G
AAT TTT TTT CCT ATT GCT GGG CTG GAA TTC TCT GAG CTC CCT GTG ACA TCA CCG CTA GGA
I A V I K N L E N W E Q I L Q E K M D H
ATC GCT GTC ATT AAA AAC TTG GAG AAC TGG GAA CAG ATT CTG CAG GAG AAA ATG GAT CAC
F E G P P P N Y V N T Y P T D L S V G A
TTT GAA GGC CCA CCC CCT AAC TAT GTC AAC ACA TAC CCA ACT GAC CTC TCA GTG GGA GCG
G P A I L R N K A M L E P E N T P F K S
GGG CCA GCT ATT CTC CGA AAT AAA GCA ATG TTA GAG CCG GAA AAC ACT CCA TTC AAA TCC
R D S S A L P V K R L W H F L V K Q E V
CGG GAT TCG TCT GCA CTT CCT GTC AAG CGA CTC TGG CAT TTC CTT GTC AAA CAG GAA GTT
L Q E T F I R Y I F T K K R K Q S E S V
CTT CAG GAG ACA TTT ATT AGA TAC ATT TTC ACT AAG AAA AGA AAG CAG AGT GAG TCT GTA
E E H V E Q V K H N S V A E D C H I K V
GAA GAA CAT GTG GAG CAG GTC AAA CAC AAC TCC GTA GCA GAA GAT TGC CAC ATC AAG GTC
E A D L G Y P G G K A K V I H K E S D M
GAA GCT GAT CTG GGC TAC CCA GGA GGG AAG GCG AAG GTC ATT CAT AAG GAA TCT GAC ATG
I M A F S I N K A N C N E I V L A S T H
ATC ATG GCA TTC TCT ATT AAT AAG GCA AAC TGT AAT GAA ATT GTT TTG GCT TCA ACA CAT
D V Q E L D V T S L L A C Q S Y I W I G
GAT GTT CAA GAA CTC GAT GTC ACT TCT CTA CTG GCT TGT CAA TCA TAT ATA TGG ATC GGA
E E Y D R E S K S S D D I D Y R G S T T
GAA GAA TAT GAC AGA GAG TCG AAA AGT TCA GAT GAT ATT GAT TAC CGT GGT TCC ACT ACA
T L Y Q P G A A S H S S S Q P H P P P S
ACC CTG TAC CAG CCT GGT GCA GCC TCC CAT TCC TCA AGC CAG CCA CAC CCA CCT CCA TCT
L P W L G S G Q T S T G A T V L M K R N
CTG CCA TGG CTA GGC AGT GGA CAG ACC AGC ACT GGG GCT ACT GTG CTC ATG AAA AGG AAT
L H N V K R M T S H P V H Q Y Y L T G A
CTA CAT AAT GTT AAG AGA ATG ACA TCA CAC CCC GTC CAT CAG TAC TAT CTC ACA GGT GCC

SUPPLEMENTS
132
Q D G S V R M F E W T R P Q Q L V C F R
CAG GAC GGC AGT GTC CGC ATG TTT GAG TGG ACA CGA CCT CAG CAA CTT GTC TGT TTC CGT
Q A G N A R V T R L Y F N S Q G N K C G
CAA GCT GGC AAT GCA AGA GTT ACT AGA TTA TAT TTT AAT TCA CAA GGC AAC AAG TGT GGT
V A D G E G F L S I W Q V N Q T A S N P
GTT GCA GAC GGA GAG GGT TTT CTG AGT ATC TGG CAA GTT AAC CAA ACT GCA TCG AAT CCT
K P Y M S W Q C H S K A T S D F A F I T
AAA CCG TAC ATG AGT TGG CAG TGC CAC AGT AAG GCC ACA AGT GAC TTT GCA TTT ATC ACC
S S S L V A T S G H S N D N R N V C L W
TCT TCA AGC CTA GTT GCA ACC TCT GGA CAT TCC AAT GAC AAT AGA AAC GTA TGC CTC TGG
D T L I S P G N S L I H G F T C H D H G
GAC ACA TTG ATA TCA CCT GGA AAC AGC CTC ATT CAC GGT TTT ACT TGT CAT GAC CAT GGT
A T V L Q Y A P K Q Q L L I S G G R K G
GCC ACA GTA CTC CAA TAT GCC CCC AAG CAA CAA CTC CTA ATC TCT GGG GGT AGG AAA GGC
Y I C I F D I R Q R Q L I H T F Q A H D
TAC ATC TGC ATT TTT GAC ATC AGA CAG AGA CAG CTA ATA CAC ACC TTC CAG GCA CAC GAC
S A I K A L A L D S C E E Y F T T G S A
TCG GCT ATT AAG GCT TTG GCT CTG GAT TCG TGT GAG GAG TAC TTC ACT ACA GGC TCA GCA
E G N I K V W R L T G H G L I H S F K S
GAG GGC AAT ATA AAA GTA TGG AGA TTG ACA GGC CAT GGC CTG ATT CAT TCA TTT AAG AGC
E H A K Q S I F R N I G A G V M Q I A I
GAG CAT GCT AAG CAG TCC ATA TTT CGG AAC ATT GGC GCT GGA GTC ATG CAG ATT GCT ATC
S Q D N R L F S C G A D G T L K T R V L
AGC CAG GAC AAT CGG CTC TTC TCC TGT GGC GCA GAC GGC ACG CTG AAA ACC AGG GTT CTG
P S A F N I P N R I L D I L *
CCC AGT GCT TTT AAC ATC CCT AAT AGA ATT CTT GAC ATT CTG TAG
EML5 echinoderm microtubule associated protein like 5 [Mus musculus]
GenBank: AAI58138.1
http://www.uniprot.org/uniprot/Q8BQM8
10 20 30 40 50 60
MAARSAPSCH LRLEWVYGYR GHQCRNNLYY TAAKEIVYFV AGVGVVYSPR EHRQKFFRGH
WD1 70 80 90 100 110 WD2 120
SDDIISLALH PERVLVATGQ VGKEPYICVW DSYTVQTVSV LKDVHTHGIA CLAFDLDGQR
130 140 150 WD3 160 170 180
LVSVGLDSKN AVCVWDWKRG RMLSMAPGHT DRIFDISWDL YQPNKLVSCG VKHIKFWSLC
190 200 WD4 210 220 230 240
GNALTPKRGV FGKTGDLQTI LCLACARDEL TYSGALNGDI YVWKGINLIR TIQGAHTAGI
WD5 250 260 270 280 WD6 290 300
FSMNSCEEGF ATGGRDGCIR LWDLTFKPIT VIDLRETEQG YKGLSVRSVC WRGDHILVGT
310 320 WD7 330 340 350 360
QDSEIFEIVV HERNKPFLIM QGHCEGELWA LAVHPTKPLA VTGSDDRSVR IWSLVDHALI
370 380 390 400 410 WD8 420
ARCNMEEPIR CAAVNVDGIH LALGMKDGSF TVLRVRDMTE VVHIKDRKEA IHELKYSPDG
430 440 450 WD9 460 470 480
AYLAVGCNDS SVDIYGVAQR YKKVGECVGS LSFITHLDWS SDSRYLQTND GSGKRLLYKM
490 500 510 520 530 540
PGGKEVTSKE EIKGMHWASW TCVAGLEVNG IWPKYSDIND INSVDGNYVG QVLVTADDYG
550 560 WD10 570 580 590 600
VVKLFRYPCL RKGAKFRKYI GHSAHVTNVR WSHDYQWVIS IGGADHSVFQ WKFIPERKLK
610 620 630 640 650 660
DALHIAPQES LAESNSDESD SDLSDVPELD SEIEQETQLT YHRQVYKEDL PQLKEQCKEK
670 680 690 700 710 720
QKSATSKRRE RTPGTSIRLH FIHGYRGYDC RSNLFYTQIG EIVYHVAAVG VIYNRQQNTQ
730 WD11 740 750 760 770 WD12 780
RFYLGHDDDI LCLAIHPLKD YVATGQVGRD PSIHVWDTET IKPLSILKGY HQYGICAVDF
790 800 810 820 WD13 830 840
SADGKRLASV GIDDSHTIVL WDWKKGEKLS VTRGSKDKIF VVKMNPYVPD KLITAGIKHM

SUPPLEMENTS
133
850 860 WD14 870 880 890 900
KFWRRAGGGL IGKKGYVGTL GKNDTMMCAV YGWTEEMAFS GTSTGDVCIW RDVFLVKTVK
WD15 910 920 930 940 950 960
AHDGPVFSMH ALEKGFVTGG KDGMVALWDD SFERCLKTYA IKRADLAPGS KGLLLEDNPS
970 980 990 1000 1010 WD16 1020
IRAISLGHGH ILVGTKNGEI LEVDKSGPIT LLVQGHMEGE VWGLATHPYL PICATVSDDK
1030 1040 WD17 1050 1060 1070 1080
TLRIWDLSPS HCMLAVRKLK KGGRCCCFSP DGKALAVGLN DGSFLMANAD TLEDLVSFHH
WD18 1090 1100 1110 1120 1130 1140
RKDIISDIRF SPGSGKYLAV ASHDSFVDIY NVTSSKRVGV CKGATSYITH IDWDSRGKLL
1150 1160 1170 1180 1190 1200
QVNTGAKEQL FFEAPRGKRQ TIPSVEVEKI SWATWTSVLG LCCEGIWPVI GEVTEVTASC
1210 1220 1230 1240 WD19 1250 1260
LTSDKMVLAT GDDLGFVKLF RYPAKGKFGK FKKYVAHSTH VTNVRWTYDD SMLVTLGGAD
1270 1280 1290 1300 1310 1320
MSLMVWTNEV ESHREKKYCD SEESDIDSEE DGGYDSDVTR ENEISYTIRA LSTNIRPMFG
1330 1340 1350 1360 1370 1380
VKPHLQQKEP SVDERQGVVR GSRPPVSRAP PQPEKLQSNN VGKKKRPIED LVLELAFGYR
1390 1400 1410 1420 WD20 1430 1440
GRDCRNNVHY LNDGDDIIYH TASIGILHNV ATGTQSFYQE HNDDILCLTV NQHPKFINIV
1450 1460 1470 1480 WD21 1490 1500
ATGQVGDSAD MSATAPSVHI WDAVNKQTLS ILRCSHSKGV CSVSFSATGK LLLSVGLDPE
1510 1520 WD22 1530 1540 1550 1560
HTVTIWRWQE GAKIASRGGH NQRIFVAEFR PDSDTQFVSV GIKHVKFWTL AGRALLSKKG
1570 WD23 1580 1590 1600 1610 WD24 1620
LLSSLEDARM QTMLAVAFGA NNLTFTGTIS GDVCVWKDHI LCRVVARAHN GPVFAMYTTL
1630 1640 1650 1660 1670 1680
RDGLIVTGGK ERPSKEGGAV KLWDQELRRC RAFRLETGQV TDCVRSVCRG KGKILVGTRN
1690 1700 WD25 1710 1720 1730 1740
SEIIEVGEKN AACNILVNGH VDGPIWGLAT HPSRDFFLSA AEDGTVRLWD IADKKMLNKV
WD26 1750 1760 1770 1780 | 1790 WD27 1800
NLGHAARTVC YSPEGDMVAI GMKNGEFIIL LVSSLKIWGK KRDRRCAIHD IRFSPDSRYL
1810 1820 1830 1840 1850 1860
AVGSSENSVD FYDLTLGPTL NRISYCKDIP SFVIQMDFSA DSRHLQVSSG CYKRHVYEVP
1870 1880 1890 1900 WD28 1910 1920
SGKHLVDHAA IDRITWATWT SILGDEVMGI WSRHAEKADV TCACVSHSGI SLVTGDDFGM
1930 1940 WD29 1950 1960 1970
VKLYDFPCPE KFAKHKRFLG HSPHVTNIRF TSGDRHVVSA GGDDCSLFVW KCVHMPH
M A A R S A P S C H L R L E W V Y G Y R
ATG GCG GCT CGG AGC GCC CCG AGC TGC CAC CTG CGG CTC GAG TGG GTG TAC GGC TAC CGG
G H Q C R N N L Y Y T A A K E I V Y F V
GGC CAC CAG TGC CGC AAC AAC CTC TAC TAC ACG GCG GCC AAG GAG ATC GTG TAC TTC GTG
A G V G V V Y S P R E H R Q K F F R G H
GCG GGG GTC GGC GTG GTG TAT AGT CCG CGG GAG CAT CGG CAG AAG TTC TTC CGC GGC CAC
S D D I I S L A L H P E R V L V A T G Q
AGC GAC GAC ATC ATC AGT CTT GCA CTG CAT CCT GAG CGA GTG TTG GTA GCA ACA GGA CAA
V G K E P Y I C V W D S Y T V Q T V S V
GTT GGG AAA GAG CCT TAC ATC TGT GTT TGG GAT TCT TAC ACT GTC CAG ACC GTG TCG GTT
L K D V H T H G I A C L A F D L D G Q R
CTG AAG GAT GTT CAT ACA CAT GGT ATA GCT TGT TTG GCA TTT GAC TTG GAT GGA CAG CGC
L V S V G L D S K N A V C V W D W K R G
TTG GTT TCA GTT GGA CTC GAT TCA AAG AAT GCA GTT TGT GTT TGG GAC TGG AAA AGG GGG
R M L S M A P G H T D R I F D I S W D L
AGA ATG CTG TCT ATG GCT CCA GGT CAC ACC GAC AGA ATA TTT GAT ATT TCT TGG GAT TTG
Y Q P N K L V S C G V K H I K F W S L C
TAC CAG CCA AAT AAA CTC GTC AGC TGT GGT GTA AAA CAC ATC AAG TTC TGG AGT TTG TGT
G N A L T P K R G V F G K T G D L Q T I
GGA AAT GCT CTG ACC CCA AAA CGC GGA GTT TTT GGT AAA ACA GGT GAC CTT CAG ACA ATA
L C L A C A R D E L T Y S G A L N G D I
TTG TGC CTC GCC TGT GCT CGG GAT GAG CTA ACA TAT TCT GGT GCA CTC AAT GGG GAT ATA
Y V W K G I N L I R T I Q G A H T A G I
TAT GTA TGG AAA GGA ATC AAT CTT ATA CGA ACA ATA CAA GGA GCC CAT ACT GCA GGG ATT
SUPPLEMENTS
134
F S M N S C E E G F A T G G R D G C I R
TTT AGT ATG AAC TCT TGT GAA GAA GGC TTT GCT ACT GGT GGC AGA GAT GGC TGT ATT CGT
L W D L T F K P I T V I D L R E T E Q G
CTT TGG GAT TTA ACT TTT AAA CCA ATT ACT GTG ATT GAT CTC AGG GAA ACA GAA CAA GGA
Y K G L S V R S V C W R G D H I L V G T
TAC AAA GGT TTA TCT GTG AGG AGT GTT TGT TGG CGA GGT GAC CAC ATT TTA GTG GGA ACG
Q D S E I F E I V V H E R N K P F L I M
CAG GAC AGT GAA ATT TTT GAA ATT GTT GTG CAT GAA AGA AAT AAA CCT TTC CTA ATT ATG
Q G H C E G E L W A L A V H P T K P L A
CAA GGG CAT TGC GAA GGT GAA CTT TGG GCG CTT GCT GTT CAC CCT ACT AAG CCT TTG GCT
V T G S D D R S V R I W S L V D H A L I
GTG ACC GGA AGT GAT GAT CGT TCA GTC AGG ATT TGG AGC CTT GTA GAT CAT GCT TTA ATA
A R C N M E E P I R C A A V N V D G I H
GCA AGA TGT AAT ATG GAA GAG CCA ATT CGG TGT GCT GCT GTA AAT GTA GAT GGA ATT CAT
L A L G M K D G S F T V L R V R D M T E
CTT GCC CTT GGA ATG AAG GAT GGG TCG TTC ACT GTC CTT AGA GTG AGA GAC ATG ACT GAA
V V H I K D R K E A I H E L K Y S P D G
GTT GTA CAT ATT AAA GAC AGG AAA GAA GCA ATC CAT GAG CTA AAA TAT TCA CCA GAT GGC
A Y L A V G C N D S S V D I Y G V A Q R
GCT TAC CTT GCT GTT GGC TGC AAT GAC AGC TCA GTT GAC ATC TAT GGA GTT GCT CAG CGT
Y K K V G E C V G S L S F I T H L D W S
TAT AAA AAG GTC GGT GAA TGT GTC GGC TCC CTT AGC TTC ATC ACT CAC TTG GAC TGG TCT
S D S R Y L Q T N D G S G K R L L Y K M
TCA GAT AGT AGA TAC TTA CAG ACA AAT GAT GGC AGT GGA AAG CGA CTT CTC TAC AAG ATG
P G G K E V T S K E E I K G M H W A S W
CCA GGA GGA AAG GAG GTG ACA AGC AAA GAA GAA ATA AAA GGC ATG CAC TGG GCT TCC TGG
T C V A G L E V N G I W P K Y S D I N D
ACA TGC GTT GCA GGC CTT GAA GTC AAT GGA ATT TGG CCC AAG TAT TCT GAT ATC AAT GAT
I N S V D G N Y V G Q V L V T A D D Y G
ATA AAC TCA GTC GAT GGC AAT TAT GTT GGC CAG GTT TTA GTT ACA GCT GAT GAC TAC GGA
V V K L F R Y P C L R K G A K F R K Y I
GTT GTA AAA TTA TTC CGA TAC CCA TGT TTG AGA AAA GGG GCC AAG TTT AGA AAG TAC ATT
G H S A H V T N V R W S H D Y Q W V I S
GGC CAT TCA GCT CAT GTA ACT AAT GTC AGA TGG TCA CAT GAT TAT CAG TGG GTT ATC TCT
I G G A D H S V F Q W K F I P E R K L K
ATT GGT GGA GCA GAT CAT TCT GTC TTT CAG TGG AAA TTT ATT CCT GAG AGA AAA CTA AAA
D A L H I A P Q E S L A E S N S D E S D
GAT GCT CTT CAC ATA GCA CCG CAA GAA AGT CTG GCT GAG TCC AAC AGT GAT GAA TCA GAT
S D L S D V P E L D S E I E Q E T Q L T
TCA GAT CTG TCT GAT GTT CCA GAA CTG GAT TCT GAG ATT GAG CAA GAG ACA CAG CTT ACT
Y H R Q V Y K E D L P Q L K E Q C K E K
TAC CAC CGG CAG GTT TAC AAA GAA GAT CTA CCT CAA CTT AAA GAA CAA TGC AAA GAG AAG
Q K S A T S K R R E R T P G T S I R L H
CAG AAA AGT GCT ACT TCT AAA CGA AGA GAA CGC ACT CCA GGA ACT AGT ATT CGA TTG CAC
F I H G Y R G Y D C R S N L F Y T Q I G
TTT ATT CAT GGT TAC AGA GGT TAT GAC TGT CGA AGT AAT CTT TTC TAC ACT CAA ATT GGT
E I V Y H V A A V G V I Y N R Q Q N T Q
GAA ATT GTG TAC CAC GTG GCA GCA GTG GGT GTC ATA TAT AAT AGA CAA CAG AAC ACA CAG
R F Y L G H D D D I L C L A I H P L K D
CGT TTT TAC TTG GGT CAT GAT GAT GAT ATT CTG TGT TTG GCT ATT CAT CCT TTG AAA GAC
Y V A T G Q V G R D P S I H V W D T E T
TAT GTG GCA ACA GGC CAG GTA GGT AGA GAT CCC TCA ATT CAT GTA TGG GAC ACA GAA ACC
I K P L S I L K G Y H Q Y G I C A V D F
ATT AAA CCA TTG TCT ATA TTA AAG GGC TAC CAC CAA TAT GGC ATC TGT GCT GTT GAT TTC
S A D G K R L A S V G I D D S H T I V L
TCA GCT GAT GGG AAA CGC CTG GCT TCA GTT GGA ATA GAT GAC AGC CAC ACC ATT GTA TTG
W D W K K G E K L S V T R G S K D K I F
TGG GAC TGG AAG AAA GGG GAG AAA CTT TCA GTG ACA AGA GGC AGT AAA GAT AAG ATT TTT
V V K M N P Y V P D K L I T A G I K H M
GTT GTG AAA ATG AAC CCC TAT GTG CCT GAT AAA CTA ATT ACA GCT GGG ATT AAA CAC ATG
K F W R R A G G G L I G K K G Y V G T L
AAA TTT TGG CGT AGA GCA GGG GGA GGA TTA ATT GGA AAA AAA GGC TAC GTA GGC ACT CTG
G K N D T M M C A V Y G W T E E M A F S
GGG AAA AAC GAC ACA ATG ATG TGT GCA GTG TAC GGA TGG ACT GAA GAG ATG GCT TTT TCT
G T S T G D V C I W R D V F L V K T V K
GGA ACA TCC ACA GGA GAT GTG TGC ATC TGG AGA GAT GTT TTT CTT GTA AAA ACA GTT AAA
A H D G P V F S M H A L E K G F V T G G
GCC CAT GAT GGG CCC GTG TTC AGT ATG CAT GCA TTG GAG AAA GGA TTT GTA ACT GGA GGA
K D G M V A L W D D S F E R C L K T Y A
AAA GAT GGT ATG GTA GCC CTT TGG GAT GAT TCC TTT GAA AGA TGC CTC AAG ACC TAT GCT
SUPPLEMENTS
135
I K R A D L A P G S K G L L L E D N P S
ATA AAA AGA GCT GAT TTA GCC CCA GGA TCT AAA GGT CTG CTC TTG GAA GAT AAC CCA TCT
I R A I S L G H G H I L V G T K N G E I
ATA CGT GCC ATA TCA TTA GGG CAT GGT CAT ATT TTG GTT GGC ACA AAG AAT GGT GAG ATA
L E V D K S G P I T L L V Q G H M E G E
TTA GAA GTG GAT AAG AGT GGC CCA ATC ACT CTT CTG GTC CAG GGA CAC ATG GAA GGA GAG
V W G L A T H P Y L P I C A T V S D D K
GTG TGG GGT TTG GCC ACA CAT CCT TAC CTG CCC ATC TGT GCT ACT GTA AGT GAT GAT AAG
T L R I W D L S P S H C M L A V R K L K
ACC TTA AGA ATA TGG GAT CTC TCT CCT AGT CAT TGT ATG TTG GCA GTC CGG AAA CTG AAA
K G G R C C C F S P D G K A L A V G L N
AAG GGG GGC CGC TGC TGC TGC TTT TCC CCT GAT GGA AAA GCT TTG GCT GTG GGT CTC AAC
D G S F L M A N A D T L E D L V S F H H
GAC GGA AGC TTC TTA ATG GCC AAT GCT GAC ACT CTG GAG GAT CTT GTG TCC TTT CAC CAC
R K D I I S D I R F S P G S G K Y L A V
AGA AAA GAT ATT ATT TCA GAC ATC CGG TTT TCA CCT GGT TCT GGG AAA TAC CTA GCT GTG
A S H D S F V D I Y N V T S S K R V G V
GCA TCC CAT GAC AGC TTC GTT GAT ATA TAC AAC GTG ACG AGT AGT AAA CGA GTG GGG GTT
C K G A T S Y I T H I D W D S R G K L L
TGC AAA GGA GCA ACC AGC TAC ATC ACC CAT ATC GAC TGG GAC AGC AGA GGA AAG CTT TTA
Q V N T G A K E Q L F F E A P R G K R Q
CAA GTC AAC ACT GGT GCT AAA GAA CAG CTA TTC TTT GAA GCT CCC AGA GGA AAA AGA CAA
T I P S V E V E K I S W A T W T S V L G
ACC ATC CCC AGT GTG GAG GTG GAA AAA ATT AGT TGG GCA ACA TGG ACA AGT GTT CTT GGT
L C C E G I W P V I G E V T E V T A S C
TTA TGC TGT GAG GGA ATT TGG CCG GTG ATT GGA GAA GTC ACA GAA GTA ACC GCC TCT TGC
L T S D K M V L A T G D D L G F V K L F
CTC ACC AGT GAC AAA ATG GTC CTA GCC ACA GGG GAT GAC TTG GGA TTC GTG AAG CTG TTC
R Y P A K G K F G K F K K Y V A H S T H
AGA TAC CCA GCT AAA GGA AAA TTT GGA AAG TTT AAG AAG TAT GTG GCT CAC AGC ACA CAT
V T N V R W T Y D D S M L V T L G G A D
GTC ACA AAT GTT CGC TGG ACT TAT GAT GAC AGC ATG CTG GTT ACC CTG GGA GGA GCA GAT
M S L M V W T N E V E S H R E K K Y C D
ATG TCC TTA ATG GTA TGG ACA AAT GAA GTG GAG AGC CAT CGA GAA AAG AAG TAC TGT GAC
S E E S D I D S E E D G G Y D S D V T R
AGT GAA GAG TCT GAT ATA GAT TCT GAA GAA GAT GGA GGC TAT GAC AGC GAT GTT ACA AGA
E N E I S Y T I R A L S T N I R P M F G
GAG AAT GAA ATT AGC TAT ACC ATC AGA GCC TTA TCA ACA AAT ATT CGC CCA ATG TTT GGA
V K P H L Q Q K E P S V D E R Q G V V R
GTC AAG CCT CAT TTG CAA CAG AAA GAG CCA TCA GTT GAT GAA AGA CAG GGG GTA GTA AGA
G S R P P V S R A P P Q P E K L Q S N N
GGA TCT AGG CCT CCA GTG AGT AGG GCC CCA CCA CAG CCA GAG AAA CTT CAG TCA AAC AAT
V G K K K R P I E D L V L E L A F G Y R
GTT GGC AAG AAG AAG AGA CCT ATA GAG GAC CTT GTG TTG GAG CTT GCT TTT GGC TAT CGG
G R D C R N N V H Y L N D G D D I I Y H
GGC AGA GAC TGC AGG AAC AAT GTG CAC TAT TTA AAT GAT GGT GAT GAT ATA ATT TAT CAC
T A S I G I L H N V A T G T Q S F Y Q E
ACT GCC TCT ATT GGA ATT CTA CAC AAT GTT GCC ACA GGG ACT CAG AGT TTT TAT CAA GAG
H N D D I L C L T V N Q H P K F I N I V
CAT AAT GAT GAT ATT TTG TGC CTC ACT GTA AAT CAG CAC CCC AAA TTT ATC AAC ATA GTG
A T G Q V G D S A D M S A T A P S V H I
GCA ACT GGC CAA GTA GGT GAT TCT GCA GAC ATG TCA GCT ACA GCC CCA TCT GTC CAC ATC
W D A V N K Q T L S I L R C S H S K G V
TGG GAT GCA GTG AAC AAG CAG ACG TTG TCT ATA CTA AGA TGC TCC CAC TCA AAG GGT GTG
C S V S F S A T G K L L L S V G L D P E
TGT TCT GTC AGC TTC AGT GCT ACT GGG AAG CTG CTG CTG TCT GTA GGG CTA GAC CCC GAG
H T V T I W R W Q E G A K I A S R G G H
CAC ACT GTA ACC ATT TGG AGA TGG CAG GAA GGG GCC AAA ATT GCC AGC AGA GGT GGG CAC
N Q R I F V A E F R P D S D T Q F V S V
AAC CAA CGT ATT TTT GTA GCA GAA TTT CGA CCA GAT TCA GAT ACC CAG TTT GTC TCT GTG
G I K H V K F W T L A G R A L L S K K G
GGT ATA AAG CAC GTG AAG TTC TGG ACC CTG GCA GGA AGG GCT CTT CTC AGC AAA AAG GGA
L L S S L E D A R M Q T M L A V A F G A
CTT CTG AGC AGC CTG GAG GAT GCC CGG ATG CAG ACG ATG CTT GCT GTT GCA TTT GGT GCA
N N L T F T G T I S G D V C V W K D H I
AAT AAC TTG ACG TTT ACA GGT ACC ATC AGT GGT GAT GTC TGT GTG TGG AAA GAT CAC ATA
L C R V V A R A H N G P V F A M Y T T L
TTG TGC AGA GTG GTG GCT AGA GCG CAC AAT GGG CCT GTG TTT GCC ATG TAC ACC ACC CTG
R D G L I V T G G K E R P S K E G G A V
CGA GAC GGA CTG ATT GTG ACC GGT GGC AAG GAA AGG CCG TCA AAG GAA GGA GGC GCA GTT

SUPPLEMENTS
136
K L W D Q E L R R C R A F R L E T G Q V
AAA CTG TGG GAT CAG GAA CTG AGG CGA TGC CGG GCC TTC AGG CTT GAG ACA GGA CAA GTC
T D C V R S V C R G K G K I L V G T R N
ACA GAT TGT GTT CGG TCT GTG TGC AGA GGC AAA GGC AAG ATA CTA GTT GGG ACA AGG AAT
S E I I E V G E K N A A C N I L V N G H
TCG GAA ATA ATT GAA GTT GGA GAG AAA AAT GCA GCA TGT AAC ATT TTA GTT AAT GGC CAT
V D G P I W G L A T H P S R D F F L S A
GTG GAT GGG CCA ATC TGG GGA CTC GCA ACA CAT CCC TCC AGG GAC TTC TTC CTT TCT GCT
A E D G T V R L W D I A D K K M L N K V
GCT GAA GAT GGG ACA GTG AGA CTC TGG GAC ATT GCT GAT AAA AAG ATG CTA AAC AAA GTG
N L G H A A R T V C Y S P E G D M V A I
AAT TTG GGA CAC GCT GCT CGG ACA GTG TGT TAT AGC CCC GAA GGG GAC ATG GTG GCT ATT
G M K N G E F I I L L V S S L K I W G K
GGA ATG AAA AAT GGA GAA TTT ATT ATA TTA CTT GTG AGT TCT CTA AAA ATA TGG GGA AAG
K R D R R C A I H D I R F S P D S R Y L
AAG AGA GAC AGG CGA TGT GCA ATC CAT GAT ATC AGA TTT AGC CCA GAT TCC CGG TAT TTG
A V G S S E N S V D F Y D L T L G P T L
GCG GTG GGT TCC AGT GAG AAC TCA GTG GAC TTT TAT GAC CTG ACA CTG GGT CCC ACA CTT
N R I S Y C K D I P S F V I Q M D F S A
AAC AGA ATC AGC TAC TGC AAA GAC ATT CCA AGC TTT GTC ATT CAG ATG GAC TTC TCT GCA
D S R H L Q V S S G C Y K R H V Y E V P
GAT AGC AGA CAT CTC CAG GTT TCT AGT GGC TGC TAT AAA CGG CAT GTC TAT GAA GTG CCT
S G K H L V D H A A I D R I T W A T W T
TCA GGA AAA CAC CTT GTG GAT CAT GCT GCC ATT GAC AGG ATC ACG TGG GCT ACC TGG ACT
S I L G D E V M G I W S R H A E K A D V
AGT ATT CTA GGA GAT GAA GTT ATG GGA ATC TGG TCC AGA CAT GCT GAG AAG GCG GAT GTC
T C A C V S H S G I S L V T G D D F G M
ACC TGT GCC TGT GTG TCT CAC TCA GGA ATC AGC CTT GTG ACA GGA GAT GAC TTT GGC ATG
V K L Y D F P C P E K F A K H K R F L G
GTT AAA TTA TAT GAC TTT CCA TGC CCA GAA AAA TTT GCA AAG CAC AAG AGG TTC TTG GGT
H S P H V T N I R F T S G D R H V V S A
CAT TCC CCT CAT GTG ACA AAT ATT CGA TTT ACC AGT GGT GAT CGG CAT GTT GTC AGT GCT
G G D D C S L F V W K C V H M P H *
GGA GGC GAT GAC TGC AGT TTG TTT GTC TGG AAA TGT GTA CAC ATG CCT CAC TGA
GPCPD1 glycerophosphocholine phosphodiesterase GDE1 homolog (Saccharomyces cerevisiae)
[Mus musculus]
GenBank: NP_001036136.1
http://www.uniprot.org/uniprot/Q8C0L9
CBM20 10 20 30 40 50 60
MTPSQVTFEI RGTLLPGEVF AICGSCDALG NWNPQNAVAL INENETGDSV LWKAVIALNR
70 80 90 100 110 120
GVSVKYRYFR GCFLEPKTIG GPCQVIVHKW ETHLQPRSIT PLESEIIIDD GQFGIHNGVE
130 140 150 160 170 180
TLDSGWLTCQ TEIRLRLHFS EKPPVSISKK KFKKSRFRVK LTLEGLEEDE DDDDDKVSPT
190 200 210 220 230 240
VLHKMSNSLE ISLISDNEFK CRHSQPECGY GLQPDRWTEY SIQTMEPDNL ELIFDFFEED
250 260 270 280 290 300
LSEHVVQGDV LPGHVGTACL LSSTIAESGR SAGILTLPIM SRNSRKTIGK VRVDFIIIKP
310 320 330 GDPD 340 350 360
LPGYSCSMQS SFSKYWKPRI PLDVGHRGAG NSTTTAKLAK VQENTIASLR NAASHGAAFV
370 380 390 400 410 420
EFDVHLSKDF VPVVYHDLTC CLTMKRKYEA DPVELFEIPV KELTFDQLQL LKLSHVTALK
430 440 450 460 470 480
TKDRKQSLYE EENFFSENQP FPSLKMVLES LPENVGFNIE IKWICQHRDG VWDGNLSTYF
490 500 510 520 530 540
DMNVFLDIIL KTVLENSGKR RIVFSSFDAD ICTMVRQKQN KYPILFLTQG KSDIYPELMD
550 560 570 580 590 600
LRSRTTPIAM SFAQFENILG INAHTEDLLR NPSYVQEAKA KGLVIFCWGD DTNDPENRRK

SUPPLEMENTS
137
610 620 630 640 650 660
LKEFGVNGLI YDRIYDWMPE QPNIFQVEQL ERLKQELPEL KNCLCPTVSH FIPSSFCVEP
670
DIHVDANGID SVENA
M T P S Q V T F E I R G T L L P G E V F
ATG ACA CCT TCT CAG GTC ACT TTT GAA ATA AGA GGA ACT CTT TTA CCA GGA GAG GTC TTT
A I C G S C D A L G N W N P Q N A V A L
GCA ATA TGT GGA AGC TGT GAT GCC CTG GGA AAC TGG AAT CCT CAA AAT GCT GTG GCT CTT
I N E N E T G D S V L W K A V I A L N R
ATT AAT GAA AAC GAG ACA GGA GAC AGT GTG TTG TGG AAA GCA GTG ATT GCT CTC AAT AGA
G V S V K Y R Y F R G C F L E P K T I G
GGA GTG TCA GTG AAG TAC CGC TAC TTC AGA GGC TGC TTT TTA GAA CCA AAG ACT ATC GGT
G P C Q V I V H K W E T H L Q P R S I T
GGT CCA TGT CAA GTC ATA GTT CAC AAG TGG GAG ACT CAT CTA CAA CCA CGA TCA ATA ACC
P L E S E I I I D D G Q F G I H N G V E
CCT TTA GAA AGT GAA ATC ATT ATT GAC GAT GGA CAG TTT GGC ATC CAC AAT GGT GTT GAA
T L D S G W L T C Q T E I R L R L H F S
ACA CTG GAT TCT GGA TGG CTT ACA TGT CAG ACT GAA ATA AGA TTG CGT CTG CAT TTT TCT
E K P P V S I S K K K F K K S R F R V K
GAG AAA CCT CCT GTT TCA ATT AGC AAG AAA AAG TTC AAA AAA TCG AGA TTT AGG GTA AAG
L T L E G L E E D E D D D D D K V S P T
CTC ACA CTC GAG GGT CTG GAG GAA GAT GAA GAT GAT GAT GAC GAT AAG GTC TCT CCC ACT
V L H K M S N S L E I S L I S D N E F K
GTT CTT CAC AAA ATG TCC AAC AGC CTG GAG ATA TCC TTA ATA AGT GAC AAT GAG TTC AAG
C R H S Q P E C G Y G L Q P D R W T E Y
TGC AGG CAC TCA CAG CCA GAA TGT GGG TAT GGC TTA CAG CCC GAT CGT TGG ACA GAG TAC
S I Q T M E P D N L E L I F D F F E E D
AGC ATA CAG ACA ATG GAA CCA GAT AAT CTG GAG CTC ATC TTT GAC TTT TTT GAG GAA GAT
L S E H V V Q G D V L P G H V G T A C L
CTC AGT GAG CAT GTA GTT CAG GGT GAT GTT CTT CCT GGA CAC GTG GGC ACA GCA TGC CTC
L S S T I A E S G R S A G I L T L P I M
CTG TCT TCT ACC ATT GCT GAG AGT GGA AGA AGC GCT GGA ATC CTT ACT CTT CCC ATC ATG
S R N S R K T I G K V R V D F I I I K P
AGC AGA AAT TCC AGA AAA ACT ATA GGC AAA GTC AGA GTT GAT TTT ATC ATC ATC AAG CCA
L P G Y S C S M Q S S F S K Y W K P R I
TTA CCT GGA TAT AGT TGT TCT ATG CAG TCT TCA TTT TCC AAG TAT TGG AAA CCA AGA ATA
P L D V G H R G A G N S T T T A K L A K
CCA TTG GAC GTT GGA CAT CGT GGT GCA GGG AAC TCA ACA ACG ACT GCC AAG CTA GCT AAA
V Q E N T I A S L R N A A S H G A A F V
GTA CAG GAA AAT ACT ATC GCT TCT TTA AGA AAT GCT GCC AGT CAT GGC GCA GCA TTT GTA
E F D V H L S K D F V P V V Y H D L T C
GAA TTT GAT GTC CAC CTT TCA AAG GAC TTT GTG CCC GTG GTG TAT CAT GAC CTC ACC TGC
C L T M K R K Y E A D P V E L F E I P V
TGT CTG ACC ATG AAG AGG AAA TAT GAA GCT GAT CCA GTT GAA TTG TTT GAA ATC CCA GTA
K E L T F D Q L Q L L K L S H V T A L K
AAA GAA TTA ACA TTT GAC CAA CTC CAG TTA TTG AAG CTT TCT CAT GTG ACT GCA TTA AAA
T K D R K Q S L Y E E E N F F S E N Q P
ACC AAA GAC CGG AAA CAA TCT TTG TAT GAG GAG GAA AAT TTC TTT TCT GAA AAT CAG CCA
F P S L K M V L E S L P E N V G F N I E
TTT CCT TCT CTT AAG ATG GTT TTA GAA TCA TTG CCA GAA AAT GTA GGA TTT AAT ATA GAA
I K W I C Q H R D G V W D G N L S T Y F
ATA AAA TGG ATT TGC CAA CAC AGG GAT GGA GTA TGG GAT GGC AAC TTA TCA ACA TAT TTT
D M N V F L D I I L K T V L E N S G K R
GAT ATG AAT GTG TTT TTG GAT ATA ATT TTA AAA ACT GTT TTA GAA AAT TCT GGG AAG AGG
R I V F S S F D A D I C T M V R Q K Q N
AGA ATA GTG TTT TCT TCT TTT GAT GCA GAT ATT TGT ACA ATG GTT CGG CAG AAG CAG AAC
K Y P I L F L T Q G K S D I Y P E L M D
AAA TAT CCC ATA TTA TTT TTG ACC CAA GGA AAG TCT GAT ATT TAC CCC GAA CTC ATG GAC
L R S R T T P I A M S F A Q F E N I L G
CTC AGA TCT CGG ACA ACA CCC ATT GCA ATG AGT TTT GCA CAG TTT GAA AAT ATT TTG GGG
I N A H T E D L L R N P S Y V Q E A K A
ATA AAT GCC CAT ACT GAA GAC CTC CTT AGA AAC CCA TCC TAT GTC CAA GAG GCA AAA GCT
K G L V I F C W G D D T N D P E N R R K
AAG GGA TTG GTC ATA TTC TGC TGG GGT GAT GAT ACC AAC GAT CCT GAA AAC AGA AGG AAA
L K E F G V N G L I Y D R I Y D W M P E
CTG AAG GAA TTT GGA GTA AAT GGT CTA ATA TAT GAT AGG ATA TAT GAT TGG ATG CCT GAA

SUPPLEMENTS
138
Q P N I F Q V E Q L E R L K Q E L P E L
CAG CCA AAT ATA TTC CAA GTG GAG CAG TTG GAG CGC CTG AAG CAA GAA TTG CCA GAG CTT
K N C L C P T V S H F I P S S F C V E P
AAG AAC TGT TTG TGT CCC ACT GTT AGC CAC TTC ATC CCT TCT TCT TTC TGT GTG GAG CCT
D I H V D A N G I D S V E N A *
GAT ATC CAC GTG GAT GCC AAC GGC ATT GAT AGT GTG GAG AAC GCT TAG
NCAN neurocan [Mus musculus]
GenBank: AAH65118.1
http://www.uniprot.org/uniprot/P55066
10 20 30 40 Ig-like 50 60
MGAGSVWASG LLLLWLLLLV AGDQDTQDTT ATEKGLRMLK SGSGPVRAAL AELVALPCFF
70 80 90 100 110 120
TLQPRLSSLR DIPRIKWTKV QTASGQRQDL PILVAKDNVV RVAKGWQGRV SLPAYPRHRA
130 140 150 160 Link1 170 180
NATLLLGPLR ASDSGLYRCQ VVKGIEDEQD LVTLEVTGVV FHYRAARDRY ALTFAEAQEA
190 200 210 220 230 240
CRLSSATIAA PRHLQAAFED GFDNCDAGWL SDRTVRYPIT QSRPGCYGDR SSLPGVRSYG
250 260 Link2 270 280 290 300
RRDPQELYDV YCFARELGGE VFYVGPARRL TLAGARAQCQ RQGAALASVG QLHLAWHEGL
310 320 330 340 350 360
DQCDPGWLAD GSVRYPIQTP RRRCGGPAPG VRTVYRFANR TGFPAPGARF DAYCFRAHHH
370 380 390 400 410 420
TAQHGDSEIP SSGDEGEIVS AEGPPGRELK PSLGEQEVIA PDFQEPLMSS GEGEPPDLTW
430 440 450 460 470 480
TQAPEETLGS TPGGPTLASW PSSEKWLFTG APSSMGVSSP SDMGVDMEAT TPLGTQVAPT
490 500 510 520 530 540
PTMRRGRFKG LNGRHFQQQG PEDQLPEVAE PSAQPPTLGA TANHMRPSAA TEASESDQSH
550 560 570 580 590 600
SPWAILTNEV DEPGAGSLGS RSLPESLMWS PSLISPSVPS TESTPSPKPG AAEAPSVKSA
610 620 630 640 650 660
IPHLPRLPSE PPAPSPGPSE ALSAVSLQAS SADGSPDFPI VAMLRAPKLW LLPRSTLVPN
670 680 690 700 710 720
MTPVPLSPAS PLPSWVPEEQ AVRPVSLGAE DLETPFQTTI AAPVEASHRS PDADSIEIEG
730 740 750 760 770 780
TSSMRATKHP ISGPWASLDS SNVTMNPVPS DAGILGTESG VLDLPGSPTS GGQATVEKVL
790 800 810 820 830 840
ATWLPLPGQG LDPGSQSTPM EAHGVAVSME PTVALEGGAT EGPMEATREV VPSTADATWE
850 860 870 880 890 900
SESRSAISST HIAVTMARAQ GMPTLTSTSS EGHPEPKGQM VAQESLEPLN TLPSHPWSSL
910 920 930 940 950 960
VVPMDEVASV SSGEPTGLWD IPSTLIPVSL GLDESVLNVV AESPSVEGFW EEVASGQEDP
EGFl1 970 980 990 1000 EGFl2 1010 1020
TDPCENNPCL HGGTCHTNGT VYGCSCDQGY AGENCEIDID DCLCSPCENG GTCIDEVNGF
1030 1040 CtypL 1050 1060 1070 1080
ICLCLPSYGG SLCEKDTEGC DRGWHKFQGH CYRYFAHRRA WEDAERDCRR RAGHLTSVHS
1090 1100 1110 1120 1130 1140
PEEHKFINSF GHENSWIGLN DRTVERDFQW TDNTGLQYEN WREKQPDNFF AGGEDCVVMV
1150 1160 1170 Sushi 1180 1190 1200
AHESGRWNDV PCNYNLPYVC KKGTVLCGPP PAVENASLVG VRKIKYNVHA TVRYQCDEGF
1210 1220 1230 1240 1250 1260
SQHRVATIRC RNNGKWDRPQ IMCIKPRRSH RMRRHHHHPH RHHKPRKEHR KHKRHPAEDW
EKDEGDFC

SUPPLEMENTS
139
M G A G S V W A S G L L L L W L L L L V
ATG GGG GCC GGA TCT GTG TGG GCC TCA GGC CTC CTG CTG CTG TGG CTG CTT CTC CTA GTG
A G D Q D T Q D T T A T E K G L R M L K
GCT GGG GAT CAG GAC ACA CAG GAC ACC ACC GCC ACG GAA AAG GGG CTT CGC ATG CTG AAG
S G S G P V R A A L A E L V A L P C F F
TCA GGG TCA GGA CCC GTC CGT GCT GCC CTG GCA GAG CTA GTG GCC CTG CCC TGC TTC TTT
T L Q P R L S S L R D I P R I K W T K V
ACC CTG CAA CCA CGG CTA AGC TCC CTG CGA GAC ATT CCT CGG ATC AAG TGG ACT AAG GTT
Q T A S G Q R Q D L P I L V A K D N V V
CAG ACT GCA TCA GGC CAG CGA CAG GAT TTG CCA ATC TTG GTG GCC AAA GAC AAC GTG GTG
R V A K G W Q G R V S L P A Y P R H R A
CGT GTG GCC AAG GGC TGG CAG GGA CGG GTG TCA TTG CCT GCT TAT CCC CGG CAC AGA GCC
N A T L L L G P L R A S D S G L Y R C Q
AAT GCT ACC CTT CTG CTG GGG CCA CTT CGA GCA AGC GAC TCT GGG CTG TAT CGC TGC CAA
V V K G I E D E Q D L V T L E V T G V V
GTG GTA AAG GGT ATC GAA GAT GAG CAG GAC CTG GTA ACC CTG GAA GTG ACA GGC GTC GTG
F H Y R A A R D R Y A L T F A E A Q E A
TTC CAT TAT CGG GCG GCC CGG GAC CGC TAT GCG CTG ACC TTC GCT GAG GCC CAG GAG GCT
C R L S S A T I A A P R H L Q A A F E D
TGT CGC CTA AGC TCT GCT ACC ATC GCT GCC CCA CGG CAC CTG CAG GCT GCC TTT GAA GAT
G F D N C D A G W L S D R T V R Y P I T
GGC TTT GAC AAC TGC GAC GCG GGC TGG CTC TCA GAC CGC ACG GTT CGG TAC CCG ATC ACT
Q S R P G C Y G D R S S L P G V R S Y G
CAG TCG CGT CCT GGT TGC TAT GGT GAC CGC AGC AGT CTC CCG GGT GTT CGG AGC TAC GGG
R R D P Q E L Y D V Y C F A R E L G G E
AGA CGC GAC CCG CAG GAA CTC TAC GAT GTC TAC TGC TTT GCC CGC GAG CTA GGG GGT GAA
V F Y V G P A R R L T L A G A R A Q C Q
GTC TTT TAC GTG GGC CCG GCC CGC CGA CTG ACC CTG GCG GGC GCG CGG GCA CAA TGT CAG
R Q G A A L A S V G Q L H L A W H E G L
CGG CAG GGT GCA GCG CTG GCC TCG GTG GGG CAG TTG CAC CTG GCC TGG CAC GAG GGC CTG
D Q C D P G W L A D G S V R Y P I Q T P
GAC CAG TGC GAC CCG GGC TGG CTG GCA GAC GGC AGC GTG CGC TAC CCC ATC CAG ACT CCG
R R R C G G P A P G V R T V Y R F A N R
CGC CGG CGT TGC GGG GGC CCC GCC CCA GGT GTG CGC ACT GTG TAC CGC TTC GCC AAC CGC
T G F P A P G A R F D A Y C F R A H H H
ACC GGC TTT CCT GCG CCA GGA GCA CGC TTC GAC GCC TAC TGC TTC CGA GCT CAT CAC CAT
T A Q H G D S E I P S S G D E G E I V S
ACA GCA CAA CAT GGA GAT TCT GAG ATC CCC TCA TCT GGA GAT GAG GGG GAG ATT GTG TCA
A E G P P G R E L K P S L G E Q E V I A
GCA GAG GGG CCT CCA GGC CGA GAA CTA AAG CCC AGC TTG GGG GAA CAG GAG GTG ATA GCA
P D F Q E P L M S S G E G E P P D L T W
CCT GAC TTC CAG GAA CCT CTC ATG TCC AGT GGA GAA GGC GAA CCC CCA GAC TTG ACT TGG
T Q A P E E T L G S T P G G P T L A S W
ACA CAA GCA CCT GAG GAG ACC CTT GGT TCT ACT CCA GGG GGT CCC ACG CTG GCC TCA TGG
P S S E K W L F T G A P S S M G V S S P
CCC TCT TCA GAA AAG TGG CTC TTT ACG GGT GCC CCA AGC TCC ATG GGT GTC TCC AGT CCC
S D M G V D M E A T T P L G T Q V A P T
AGC GAC ATG GGA GTA GAT ATG GAA GCG ACA ACA CCC TTG GGC ACA CAG GTA GCA CCC ACC
P T M R R G R F K G L N G R H F Q Q Q G
CCC ACG ATG AGG AGG GGC CGC TTT AAA GGG TTG AAT GGT CGA CAC TTC CAG CAG CAG GGC
P E D Q L P E V A E P S A Q P P T L G A
CCA GAA GAC CAG CTG CCT GAG GTA GCA GAG CCC AGT GCC CAG CCT CCC ACC CTG GGA GCT
T A N H M R P S A A T E A S E S D Q S H
ACT GCC AAC CAC ATG AGG CCT TCT GCA GCC ACA GAG GCT TCA GAG AGT GAC CAG AGC CAC
S P W A I L T N E V D E P G A G S L G S
AGT CCT TGG GCC ATT CTG ACC AAC GAA GTG GAT GAG CCA GGA GCA GGC TCT CTT GGC AGC
R S L P E S L M W S P S L I S P S V P S
AGG AGT CTC CCA GAG TCC CTG ATG TGG TCC CCG TCG TTG ATC TCA CCC AGT GTC CCA AGC
T D S T P S A K P G A A E A P S V K S A
ACC GAC AGT ACT CCT AGC GCG AAG CCA GGG GCA GCC GAG GCA CCC AGT GTG AAG TCA GCC
I P H L P R L P S E P P A P S P G P S E
ATC CCC CAC CTG CCC CGG CTG CCC TCA GAG CCC CCT GCT CCC TCT CCC GGG CCC TCA GAG
A L S A V S L Q A S S A D G S P D F P I
GCC CTA AGT GCT GTC TCC CTC CAG GCA TCC TCT GCT GAT GGC TCC CCT GAC TTC CCC ATT
V A M L R A P K L W L L P R S T L V P N
GTA GCC ATG CTT CGA GCC CCC AAA CTG TGG CTT CTG CCA CGC TCT ACA CTT GTC CCC AAT
M T P V P L S P A S P L P S W V P E E Q
ATG ACC CCA GTC CCA CTG TCC CCA GCT TCT CCA CTT CCC TCC TGG GTC CCA GAA GAA CAG
A V R P V S L G A E D L E T P F Q T T I
GCT GTC AGG CCT GTC AGC CTT GGA GCG GAA GAC CTC GAA ACC CCA TTT CAG ACC ACC ATA
SUPPLEMENTS
140
A A P V E A S H R S P D A D S I E I E G
GCT GCC CCA GTT GAA GCC AGC CAC AGA TCC CCT GAT GCA GAT TCT ATA GAA ATC GAG GGG
T S S M R A T K H P I S G P W A S L D S
ACC AGC TCC ATG CGG GCT ACA AAG CAC CCC ATC TCT GGC CCA TGG GCT TCT TTG GAC TCT
S N V T M N P V P S D A G I L G T E S G
AGT AAT GTG ACG ATG AAT CCT GTC CCT TCT GAT GCT GGC ATC CTA GGG ACT GAG TCT GGG
V L D L P G S P T S G G Q A T V E K V L
GTC TTG GAC TTA CCA GGG AGT CCC ACA TCA GGC GGA CAG GCC ACT GTG GAG AAG GTG CTG
A T W L P L P G Q G L D P G S Q S T P M
GCC ACC TGG CTA CCA CTG CCT GGC CAA GGA CTA GAC CCT GGC TCC CAG TCC ACA CCC ATG
E A H G V A V S M E P T V A L E G G A T
GAA GCC CAT GGG GTT GCC GTG AGC ATG GAA CCT ACA GTG GCT TTG GAG GGA GGT GCC ACC
E G P M E A T R E V V P S T A D A T W E
GAG GGC CCT ATG GAG GCC ACC AGG GAG GTG GTC CCC AGC ACT GCT GAT GCC ACT TGG GAG
S E S R S A I S S T H I A V T M A R A Q
TCT GAA TCC AGA AGT GCC ATT TCT AGC ACC CAC ATA GCT GTG ACC ATG GCT AGG GCT CAG
G M P T L T S T S S E G H P E P K G Q M
GGC ATG CCC ACA CTG ACC TCT ACA AGC TCC GAA GGC CAC CCA GAG CCT AAG GGC CAG ATG
V A Q E S L E P L N T L P S H P W S S L
GTG GCC CAG GAG TCA CTG GAG CCT CTC AAC ACT CTG CCT TCG CAC CCC TGG TCA TCC CTG
V V P M D E V A S V S S G E P T G L W D
GTG GTC CCC ATG GAT GAA GTG GCC TCA GTT TCC TCA GGG GAA CCC ACA GGA CTG TGG GAC
I P S T L I P V S L G L D E S D L N V V
ATA CCC AGC ACT CTG ATA CCT GTA TCC TTG GGC TTG GAT GAA TCA GAC CTG AAT GTT GTG
A E S P S V K G F W E E V A S G Q E D P
GCT GAG AGT CCA AGC GTG AAG GGC TTC TGG GAA GAG GTG GCC AGC GGG CAG GAA GAT CCC
T D P C E N N P C L H G G T C H T N G T
ACA GAT CCC TGC GAG AAC AAC CCC TGC CTG CAT GGG GGC ACC TGC CAC ACC AAC GGC ACC
V Y G C S C D Q G Y A G E N C E I D I D
GTG TAT GGC TGT AGT TGT GAC CAG GGC TAT GCT GGG GAG AAT TGT GAA ATT GAC ATT GAT
D C L C S P C E N G G T C I D E V N G F
GAC TGC TTA TGC AGC CCT TGC GAG AAT GGG GGC ACC TGC ATC GAC GAG GTG AAT GGT TTC
I C L C L P S Y G G S L C E K D T E G C
ATC TGC CTC TGC CTC CCC AGC TAT GGG GGC AGC CTG TGT GAG AAG GAC ACA GAA GGC TGC
D R G W H K F Q G H C Y R Y F A H R R A
GAC CGT GGC TGG CAC AAA TTC CAG GGA CAC TGC TAC CGG TAC TTT GCC CAT CGC CGG GCC
W E D A E R D C R R R A G H L T S V H S
TGG GAG GAT GCA GAG AGA GAT TGC AGG CGC CGA GCT GGT CAC CTG ACA AGC GTC CAT TCG
P E E H K F I N S F G H E N S W I G L N
CCA GAA GAG CAC AAG TTC ATT AAC AGT TTT GGA CAT GAG AAT TCG TGG ATC GGC CTG AAT
D R T V E R D F Q W T D N T G L Q Y E N
GAC CGG ACA GTA GAG AGG GAC TTC CAG TGG ACA GAC AAC ACA GGA CTG CAA TAT GAG AAC
W R E K Q P D N F F A G G E D C V V M V
TGG AGG GAG AAG CAG CCG GAT AAT TTC TTC GCA GGT GGG GAG GAT TGT GTG GTG ATG GTG
A H E S G R W N D V P C N Y N L P Y V C
GCA CAT GAG AGT GGG CGC TGG AAT GAT GTC CCC TGC AAC TAC AAC CTA CCC TAT GTC TGC
K K G T V L C G P P P A V E N A S L V G
AAG AAG GGT ACA GTG CTG TGT GGT CCC CCT CCA GCA GTG GAG AAT GCC TCT CTT GTT GGT
V R K I K Y N V H A T V R Y Q C D E G F
GTG CGC AAG ATC AAG TAC AAT GTC CAT GCC ACT GTG CGA TAC CAG TGT GAT GAA GGA TTC
S Q H R V A T I R C R N N G K W D R P Q
TCC CAG CAC CGA GTG GCC ACT ATC CGC TGC CGT AAC AAT GGG AAG TGG GAC CGG CCT CAG
I M C I K P R R S H R M R R H H H H P H
ATC ATG TGC ATC AAA CCC AGG CGG TCA CAT CGG ATG CGT AGA CAC CAC CAC CAT CCA CAC
R H H K P R K E H R K H K R H P A E D W
CGA CAT CAC AAG CCT CGC AAG GAG CAC AGA AAA CAC AAG AGA CAC CCA GCG GAA GAC TGG
E K D E G D F C *
GAG AAA GAC GAA GGG GAT TTC TGC TAA
5.9 Mass Spectrometry of the Protein Sequences His6-DMXL2748-926-V5,
His6-EML5897-1038-V5, His6-GPCPD11-118-V5 and His6-NCAN156-359-V5
Protein sequences were entered at http://web.expasy.org/peptide_mass. All samples were digested
using trypsin setting the maximum number of missed cleavages to 1. Cysteins have been treated with
iodoacetamide to form carbamidomethyl-cysteine. Methionines have not been oxidized. Only peptides
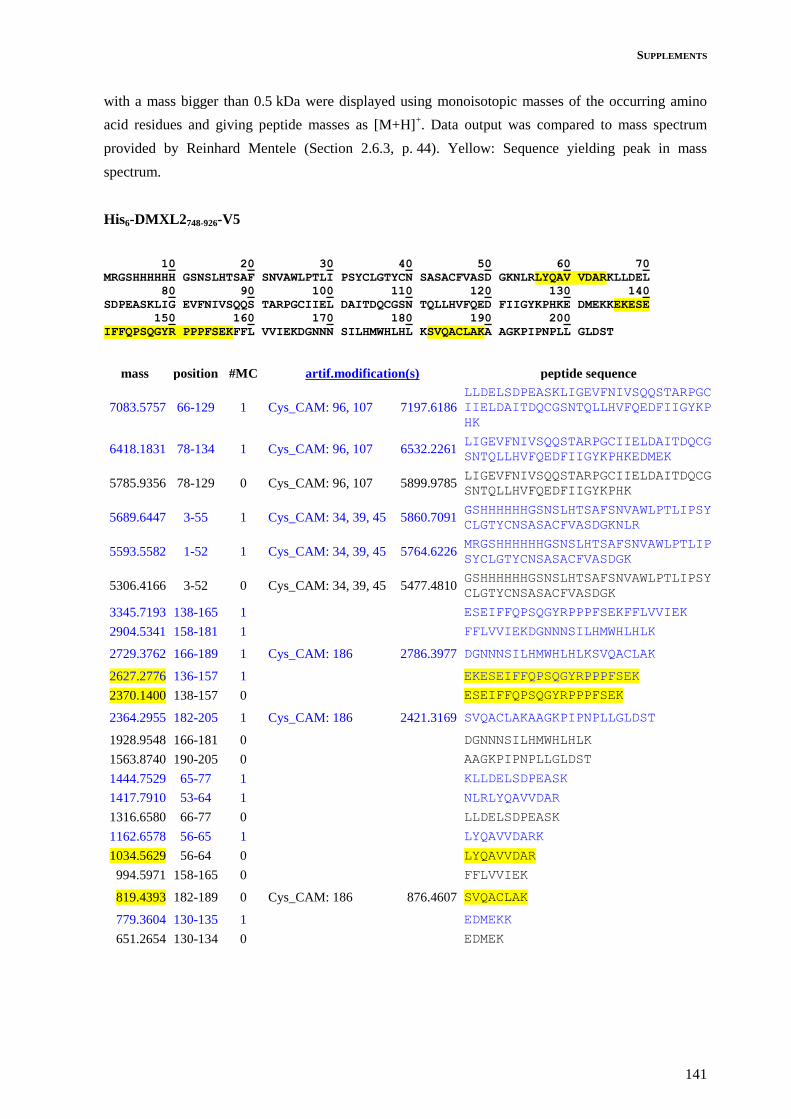
SUPPLEMENTS
141
with a mass bigger than 0.5 kDa were displayed using monoisotopic masses of the occurring amino
acid residues and giving peptide masses as [M+H]+. Data output was compared to mass spectrum
provided by Reinhard Mentele (Section 2.6.3, p. 44). Yellow: Sequence yielding peak in mass
spectrum.
His6-DMXL2748-926-V5
10 20 30 40 50 60 70
MRGSHHHHHH GSNSLHTSAF SNVAWLPTLI PSYCLGTYCN SASACFVASD GKNLRLYQAV VDARKLLDEL
80 90 100 110 120 130 140
SDPEASKLIG EVFNIVSQQS TARPGCIIEL DAITDQCGSN TQLLHVFQED FIIGYKPHKE DMEKKEKESE
150 160 170 180 190 200
IFFQPSQGYR PPPFSEKFFL VVIEKDGNNN SILHMWHLHL KSVQACLAKA AGKPIPNPLL GLDST
mass position #MC artif.modification(s) peptide sequence
7083.5757 66-129 1 Cys_CAM: 96, 107 7197.6186
LLDELSDPEASKLIGEVFNIVSQQSTARPGC
IIELDAITDQCGSNTQLLHVFQEDFIIGYKP
HK
6418.1831 78-134 1 Cys_CAM: 96, 107 6532.2261
LIGEVFNIVSQQSTARPGCIIELDAITDQCG
SNTQLLHVFQEDFIIGYKPHKEDMEK
5785.9356 78-129 0 Cys_CAM: 96, 107 5899.9785
LIGEVFNIVSQQSTARPGCIIELDAITDQCG
SNTQLLHVFQEDFIIGYKPHK
5689.6447 3-55 1 Cys_CAM: 34, 39, 45 5860.7091
GSHHHHHHGSNSLHTSAFSNVAWLPTLIPSY
CLGTYCNSASACFVASDGKNLR
5593.5582 1-52 1 Cys_CAM: 34, 39, 45 5764.6226
MRGSHHHHHHGSNSLHTSAFSNVAWLPTLIP
SYCLGTYCNSASACFVASDGK
5306.4166 3-52 0 Cys_CAM: 34, 39, 45 5477.4810
GSHHHHHHGSNSLHTSAFSNVAWLPTLIPSY
CLGTYCNSASACFVASDGK
3345.7193 138-165 1
ESEIFFQPSQGYRPPPFSEKFFLVVIEK
2904.5341 158-181 1
FFLVVIEKDGNNNSILHMWHLHLK
2729.3762 166-189 1 Cys_CAM: 186 2786.3977
DGNNNSILHMWHLHLKSVQACLAK
2627.2776 136-157 1
EKESEIFFQPSQGYRPPPFSEK
2370.1400 138-157 0
ESEIFFQPSQGYRPPPFSEK
2364.2955 182-205 1 Cys_CAM: 186 2421.3169
SVQACLAKAAGKPIPNPLLGLDST
1928.9548 166-181 0
DGNNNSILHMWHLHLK
1563.8740 190-205 0
AAGKPIPNPLLGLDST
1444.7529 65-77 1
KLLDELSDPEASK
1417.7910 53-64 1
NLRLYQAVVDAR
1316.6580 66-77 0
LLDELSDPEASK
1162.6578 56-65 1
LYQAVVDARK
1034.5629 56-64 0
LYQAVVDAR
994.5971 158-165 0
FFLVVIEK
819.4393 182-189 0 Cys_CAM: 186 876.4607
SVQACLAK
779.3604 130-135 1
EDMEKK
651.2654 130-134 0
EDMEK

SUPPLEMENTS
142

SUPPLEMENTS
143
His6-EML5897-1038-V5
10 20 30 40 50 60 70
MRGSHHHHHH GSKTVKAHDG PVFSMHALEK GFVTGGKDGM VALWDDSFER CLKTYAIKRA DLAPGSKGLL
80 90 100 110 120 130 140
LEDNPSIRAI SLGHGHILVG TKNGEILEVD KSGPITLLVQ GHMEGEVWGL ATHPYLPICA TVSDDKTLRI
150 160
WDLSPSHCML AVRKGKPIPN PLLGLDST
mass position #MC artif.modification(s) peptide sequence
4732.3636 93-136 1 Cys_CAM: 129 4789.3851
NGEILEVDKSGPITLLVQGH
MEGEVWGLATHPYLPICATV SDDK
4105.0884 102-139 1 Cys_CAM: 129 4162.1099
SGPITLLVQGHMEGEVWGLA
THPYLPICATVSDDKTLR
3734.8556 102-136 0 Cys_CAM: 129 3791.8771
SGPITLLVQGHMEGEVWGLA THPYLPICATVSDDK
2610.4725 68-92 1
GLLLEDNPSIRAISLGHGHI LVGTK
2400.3245 79-101 1
AISLGHGHILVGTKNGEILE VDK
2187.0175 31-50 1
GFVTGGKDGMVALWDDSFER
2185.0858 17-37 1
AHDGPVFSMHALEKGFVTGG K
1998.0411 137-153 1 Cys_CAM: 148 2055.0626
TLRIWDLSPSHCMLAVR
1966.0603 60-78 1
ADLAPGSKGLLLEDNPSIR
1884.8618 38-53 1 Cys_CAM: 51 1941.8833
DGMVALWDDSFERCLK
1866.9530 14-30 1
TVKAHDGPVFSMHALEK
1755.9033 140-154 1 Cys_CAM: 148 1812.9247
IWDLSPSHCMLAVRK
1627.8083 140-153 0 Cys_CAM: 148 1684.8298
IWDLSPSHCMLAVR
1585.7843 3-16 1
GSHHHHHHGSKTVK
1549.8948 154-168 1
KGKPIPNPLLGLDST
1544.7148 1-13 1
MRGSHHHHHHGSK
1540.6736 38-50 0
DGMVALWDDSFER
1538.7420 17-30 0
AHDGPVFSMHALEK
1421.7998 155-168 0
GKPIPNPLLGLDST
1402.8165 79-92 0
AISLGHGHILVGTK
1257.5732 3-13 0
GSHHHHHHGSK
1226.6739 68-78 0
GLLLEDNPSIR
1016.5258 93-101 0
NGEILEVDK
939.5332 51-58 1 Cys_CAM: 51 996.5546
CLKTYAIK
914.5054 59-67 1
RADLAPGSK
758.4043 60-67 0
ADLAPGSK
751.4461 54-59 1
TYAIKR
665.3617 31-37 0
GFVTGGK
595.3450 54-58 0
TYAIK

SUPPLEMENTS
144

SUPPLEMENTS
145
His6-GPCPD11-118-V5
10 20 30 40 50 60 70
MRGSHHHHHH GSMTPSQVTF EIRGTLLPGE VFAICGSCDA LGNWNPQNAV ALINENETGD SVLWKAVIAL
80 90 100 110 120 130 140
NRGVSVKYRY FRGCFLEPKT IGGPCQVIVH KWETHLQPRS ITPLESEIII DDGQFGIHNG GKPIPNPLLG
LDST
mass position #MC artif.modification(s) peptide sequence
6816.2316 3-65 1 Cys_CAM: 35, 38 6930.2746
GSHHHHHHGSMTPSQVTFEI
RGTLLPGEVFAICGSCDALG
NWNPQNAVALINENETGDSV LWK
5153.5822 24-72 1 Cys_CAM: 35, 38 5267.6251
GTLLPGEVFAICGSCDALGN
WNPQNAVALINENETGDSVL WKAVIALNR
4705.4259 102-144 1
WETHLQPRSITPLESEIIID
DGQFGIHNGGKPIPNPLLGL DST
4416.1274 24-65 0 Cys_CAM: 35, 38 4530.1703
GTLLPGEVFAICGSCDALGN
WNPQNAVALINENETGDSVL WK
3657.9009 110-144 0
SITPLESEIIIDDGQFGIHN GGKPIPNPLLGLDST
2706.2637 1-23 1
MRGSHHHHHHGSMTPSQVTF EIR
2419.1221 3-23 0
GSHHHHHHGSMTPSQVTFEI R
2299.2128 90-109 1 Cys_CAM: 95 2356.2342
TIGGPCQVIVHKWETHLQPR
2026.0612 83-101 1 Cys_CAM: 84, 95 2140.1041
GCFLEPKTIGGPCQVIVHK
1259.6241 80-89 1 Cys_CAM: 84 1316.6456
YFRGCFLEPK
1251.6878 90-101 0 Cys_CAM: 95 1308.7092
TIGGPCQVIVHK
1226.7579 66-77 1
AVIALNRGVSVK
1066.5428 102-109 0
WETHLQPR
808.4675 73-79 1
GVSVKYR
804.4151 78-82 1
YRYFR
793.3913 83-89 0 Cys_CAM: 84 850.4127
GCFLEPK
756.4726 66-72 0
AVIALNR

SUPPLEMENTS
146

SUPPLEMENTS
147
His6-NCAN156-359-V5
10 20 30 40 50 60 70
MRGSHHHHHH GSVTGVVFHY RAARDRYALT FAEAQEACRL SSATIAAPRH LQAAFEDGFD NCDAGWLSDR
80 90 100 110 120 130 140
TVRYPITQSR PGCYGDRSSL PGVRSYGRRD PQELYDVYCF ARELGGEVFY VGPARRLTLA GARAQCQRQG
150 160 170 180 190 200 210
AALASVGQLH LAWHEGLDQC DPGWLADGSV RYPIQTPRRR CGGPAPGVRT VYRFANRTGF PAPGARFDAY
220 230
CFRAHHGKPI PNPLLGLDST
mass position #MC artif.modification(s) peptide sequence
4313.1308 139-178 1 Cys_CAM: 160 4370.1522
QGAALASVGQLHLAWHEGLD
QCDPGWLADGSVRYPIQTPR
4043.9351 134-171 1 Cys_CAM: 136, 160 4157.9780
AQCQRQGAALASVGQLHLAW
HEGLDQCDPGWLADGSVR
3457.6705 139-171 0 Cys_CAM: 160 3514.6920
QGAALASVGQLHLAWHEGLD
QCDPGWLADGSVR
3334.5545 40-70 1 Cys_CAM: 62 3391.5759
LSSATIAAPRHLQAAFEDGF DNCDAGWLSDR
2993.4137 100-125 1 Cys_CAM: 109 3050.4352
DPQELYDVYCFARELGGEVF YVGPAR
2723.2266 50-73 1 Cys_CAM: 62 2780.2481
HLQAAFEDGFDNCDAGWLSD RTVR
2669.3292 207-230 1 Cys_CAM: 211 2726.3507
FDAYCFRAHHGKPIPNPLLG LDST
2486.2197 3-24 1
GSHHHHHHGSVTGVVFHYRA AR
2475.1860 1-21 1
MRGSHHHHHHGSVTGVVFHY R
2440.2289 27-49 1 Cys_CAM: 38 2497.2503
YALTFAEAQEACRLSSATIA APR
2367.0094 50-70 0 Cys_CAM: 62 2424.0309
HLQAAFEDGFDNCDAGWLSD R
2309.1455 74-94 1 Cys_CAM: 83 2366.1669
YPITQSRPGCYGDRSSLPGV R
2188.0444 3-21 0
GSHHHHHHGSVTGVVFHYR
1968.9708 71-87 1 Cys_CAM: 83 2025.9923
TVRYPITQSRPGCYGDR
1775.8322 198-213 1 Cys_CAM: 211 1832.8536
TGFPAPGARFDAYCFR
1774.8217 99-112 1 Cys_CAM: 109 1831.8432
RDPQELYDVYCFAR
1766.9547 214-230 0
AHHGKPIPNPLLGLDST
1743.8119 25-39 1 Cys_CAM: 38 1800.8333
DRYALTFAEAQEACR
1618.7206 100-112 0 Cys_CAM: 109 1675.7420
DPQELYDVYCFAR
1612.7536 74-87 0 Cys_CAM: 83 1669.7751
YPITQSRPGCYGDR
1549.8121 113-126 1
ELGGEVFYVGPARR
1472.6838 27-39 0 Cys_CAM: 38 1529.7053
YALTFAEAQEACR
1393.7110 113-125 0
ELGGEVFYVGPAR
1361.7072 194-206 1
FANRTGFPAPGAR
1332.6841 181-193 1 Cys_CAM: 181 1389.7055
CGGPAPGVRTVYR
1287.6950 127-138 1 Cys_CAM: 136 1344.7164
LTLAGARAQCQR
1178.6276 88-98 1
SSLPGVRSYGR
1030.5792 172-179 1
YPIQTPRR
1026.5479 190-197 1
TVYRFANR
986.5629 40-49 0
LSSATIAAPR
969.5047 180-189 1 Cys_CAM: 181 1026.5261
RCGGPAPGVR

SUPPLEMENTS
148
921.3923 207-213 0 Cys_CAM: 211 978.4138
FDAYCFR
874.4781 172-178 0
YPIQTPR
873.4577 198-206 0
TGFPAPGAR
857.5315 126-133 1
RLTLAGAR
813.4035 181-189 0 Cys_CAM: 181 870.4250
CGGPAPGVR
715.4097 88-94 0
SSLPGVR
701.4304 127-133 0
LTLAGAR
638.3369 95-99 1
SYGRR
605.2824 134-138 0 Cys_CAM: 136 662.3039
AQCQR
588.3212 22-26 1
AARDR
538.2984 190-193 0
TVYR
507.2674 194-197 0
FANR

SUPPLEMENTS
149

ABBREVIATIONS
150
List of Abbreviations
AA Amino Acid
AC TCR Alpha chain Constant gene segment
aFITC-
Alexa488
Goat anti FITC IgG labeled with Alexa
Fluor 488
AJ TCR Alpha chain Joining gene segment
ALOX12B Arachidonate 12-Lipoxygenase, 12R-type
AP5S1 Adaptor-related Protein 5 Complex,
Sigma 1 Subunit
APC Antigen Presenting Cell
AV TCR Alpha chain Variable gene segment
BC TCR Beta chain Constant gene segment
BD TCR Beta chain Diversity gene segment
BJ TCR Beta chain Joining gene segment
BS³ Bis(Sulfsuccinimidyl)Suberate
BSA Bovine Serum Albumin
BV TCR Beta chain Variable gene segment
CDR Complementarity Determining Region
CNS Central Nervous System
DEPC Diethylpyrocarbonate
DMSO Dimethyl Sulfoxide
ECL Enhanced Chemiluminescence
EML5 Echinoderm Microtubule-associated
Protein-Like 5
EML6 Echinoderm Microtubule-associated
Protein-Like 6
ESI-MS Electrospray Ionization Mass Spectrometry
FCS Fetal Calf Serum
FITC Fluorescein-Isothiocyanat
FPLC Fast Protein Liquid Chromatography
FU Fluorescence Unit
GAPDH Glyceraldehyde-3-Phosphate
Dehydrogenase
GFP Green Fluorescent Protein
GPCPD1 Glycerophosphocholine
Phosphodiesterase 1
HLA Human Leukocyte Antigen
HRP Horseradish Peroxydase
IB Inclusion Body
IL-2 Interleukin 2
IPTG Isopropyl β-D-1-thiogalactopyranoside
KLHL28 Kelch-Like protein 28
MALDI-
TOF-MS
Matrix Assisted Laser Desorption
Ionization - Time Of Flight Mass Spectrometry
MDH1B Malate Dehydrogenase 1B
MOG Myelin Oligodendrocyte Protein
MS Multiple Sclerosis
NCAN Neurocan
NFAT Nuclear Factor of Activated T Cells
OD Optical Density
ori Origin of Replication
PBMC Peripheral Blood Mononuclear Cell
PCR Polymerase Chain Reaction
PECP library Plasmid-Encoded Combinatorial Peptide
Library
PLP Proteolipid Protein 1
PMSF Phenylmethanesulfonyl Fluoride
qPCR Quantitative PCR
RIN RNA Integrity Number
RT-PCR Reverse Transcription PCR
SDS Sodium Dodecyl Sulfate
SDS-PAGE SDS Polyacrylamide Gel Electrophoresis
SPDL1 Spindle Apparatus Coiled-Coil Protein 1
TAP1 Transporter 1
TCR T Cell Receptor
Tm Melting Temperature
WDR25 WD Repeat Domain 25
REFERENCES
151
List of References
Ackerman AL, Cresswell P. (2004) Cellular mechanisms governing cross-presentation of exogenous antigens. Nat Immunol.
5(7):678-84.
Adams JM, Imagawa DT. (1962) Measles antibodies in multiple sclerosis. Proc Soc Exp Biol Med. 111:562-6.
Agostini HT, Ryschkewitsch CF, Baumhefner RW, Tourtellotte WW, Singer EJ, Komoly S, Stoner GL. (2000) Influence of
JC virus coding region genotype on risk of multiple sclerosis and progressive multifocal leukoencephalopathy. J
Neurovirol. 6 Suppl 2:S101-8.
Altman JD, Davis MM. (2003) MHC-peptide tetramers to visualize antigen-specific T cells. Curr Protoc Immunol. Chapter
17: Unit 17.3.
Anderson G, Takahama Y. (2012) Thymic epithelial cells: working class heroes for T cell development and repertoire
selection. Trends Immunol. 33(6):256-63.
Arden B, Clark SP, Kabelitz D, Mak TW. (1995) Human T-cell receptor variable gene segment families. Immunogenetics.
42(6):455-500.
Arens R, Schoenberger SP. (2010) Plasticity in programming of effector and memory CD8 T-cell formation. Immunol Rev.
235(1):190-205.
Arstila TP, Casrouge A, Baron V, Even J, Kanellopoulos J, Kourilsky P. (1999) A direct estimate of the human alphabeta T
cell receptor diversity. Science. 286(5441):958-61.
Babbe H, Roers A, Waisman A, Lassmann H, Goebels N, Hohlfeld R, Friese M, Schröder R, Deckert M, Schmidt S. (2000)
Clonal Expansions of CD8+ T Cells Dominate the T Cell Infiltrate in Active Multiple Sclerosis Lesions as Shown by
Micromanipulation and Single Cell Polymerase Chain Reaction. J Exp Med. 192(3):393-404.
Backes A. (2010) Untersuchungen zur Charakterisierung autoaggressiver CD8+ T-Zellen aus Patienten mit Multipler
Sklerose.
Baranzini SE, Mudge J, van Velkinburgh JC, Khankhanian P, Khrebtukova I, Miller NA, Zhang L, Farmer AD, Bell CJ, Kim
RW, May GD, Woodward JE, Caillier SJ, McElroy JP, Gomez R, Pando MJ, Clendenen LE, Ganusova EE, Schilkey FD,
Ramaraj T, Khan OA, Huntley JJ, Luo S, Kwok PY, Wu TD, Schroth GP, Oksenberg JR, Hauser SL, Kingsmore SF.
(2010) Genome, epigenome and RNA sequences of monozygotic twins discordant for multiple sclerosis. Nature.
464(7293):1351-6.
Bennett SR, Carbone FR, Toy T, Miller JF, Heath WR. (1998) B cells directly tolerize CD8 (+) T cells. J Exp Med.
188(11):1977-83.
Berer K, Mues M, Koutrolos M, Rasbi ZA, Boziki M, Johner C, Wekerle H, Krishnamoorthy G. (2011) Commensal
microbiota and myelin autoantigen cooperate to trigger autoimmune demyelination. Nature. 479(7374):538-41.
Bhonsle L. (2011) Characterization of potentially autoaggressive brain infiltrating CD8+ T cells in multiple sclerosis patients.
Biddison WE, Beall SS, Concannon P, Charmley P, Gatti RA, Hood LE, McFarland HF, McFarlin DE. (1989) the germline
repertoire of T-cell receptor beta-chain genes in patients with multiple sclerosis. Res Immunol. 140(2):212-5.
Booss J, Esiri MM, Tourtellotte WW, Mason DY. (1983) Immunohistological analysis of T lymphocyte subsets in the central
nervous system in chronic progressive multiple sclerosis. J Neurol Sci. 62(1-3):219-32.
Brück W, Stadelmann C. (2003) Inflammation and degeneration in multiple sclerosis. Neurological Sciences. 24, p. 265 - 267.
Brynedal B, Duvefelt K, Jonasdottir G, Roos IM, Akesson E, Palmgren J, Hillert J. (2007) HLA-A confers an HLA-DRB1
independent influence on the risk of multiple sclerosis. PLoS One. 2(7):e664.
Burfoot RK, Jensen CJ, Field J, Stankovich J, Varney MD, Johnson LJ, Butzkueven H, Booth D, Bahlo M, Tait BD, Taylor
BV, Speed TP, Heard R, Stewart GJ, Foote SJ, Kilpatrick TJ, Rubio JP. (2008) SNP mapping and candidate gene
sequencing in the class I region of the HLA complex: searching for multiple sclerosis susceptibility genes in Tasmanians.
Tissue Antigens. 71(1):42-50.
van der Bruggen P, Traversari C, Chomez P, Lurquin C, De Plaen E, Van den Eynde BJ, Knuth A, Boon T. (2007) A gene
encoding an antigen recognized by cytolytic T lymphocytes on a human melanoma. Cancer Res. 62(19):5510-6.
Chaplin DD. (2010) Overview of the immune response. J Allergy Clin Immunol. 125(2 Suppl 2):S3-23.
Clevers H, Alarcon B, Wileman T, Terhorst C. (1988) The T cell receptor/CD3 complex: a dynamic protein ensemble. Annu
Rev Immunol. 6:629-62.
Colf LA, Bankovich AJ, Hanick NA, Bowerman NA, Jones LL, Kranz DM, Garcia KC. (2007) How a single T cell receptor
recognizes both self and foreign MHC. Cell. 129(1):135–46.

REFERENCES
152
Collins SM, Surette M, Bercik P. (2012) The interplay between the intestinal microbiota and the brain. Nat Rev Microbiol.
10(11):735-42.
Compston A, Coles A. (2008) Multiple Sclerosis. Lancet. 372(9648):1502-17.
Cusick MF, Libbey JE, Fujinami RS. (2012) Molecular mimicry as a mechanism of autoimmune disease. Clin Rev Allergy
Immunol. 42(1):102-11.
Davis MM, Bjorkman PJ. (1988) T-cell antigen receptor genes and T-cell recognition. Nature 334(6181):395-402.
Davis MM, Boniface JJ, Reich Z, Lyons D, Hampl J, Arden B, Chien Y. (1998) Ligand recognition by alpha beta T cell
receptors. Annu Rev Immunol. 16:523-44.
Derbinski J, Schulte A, Kyewski B, Klein L. (2001) Promiscuous gene expression in medullary thymic epithelial cells
mirrors the peripheral self. Nat Immunol. 2(11):1032-9.
Ding YH, Smith KJ, Garboczi DN, Utz U, Biddison WE, Wiley DC. (1998) Two human T cell receptors bind in a similar
diagonal mode to the HLA-A2/Tax peptide complex using different TCR amino acids. Immunity. 8(4):403-11.
D'Orsogna LJ, Nguyen TH, Claas FH, Witt C, Mifsud NA. (2013) Endogenous-peptide-dependent alloreactivity: new
scientific insights and clinical implications. Tissue Antigens. 81(6):399-407.
Dyment DA, Ebers GC, Sadovnick AD. (2004) Genetics of multiple sclerosis. Lancet Neurology. 3:104-110.
Ebers GC. (2008) Environmental factors and multiple sclerosis. Lancet Neurol. 7(3):268-77.
Ehling R, Berger T, Reindl M. (2010) Multiple sclerosis - established and novel therapeutic approaches. Cent Nerv Syst
Agents Med Chem. 10(1):3-15.
Falk K, Rötzschke O, Stevanović S, Jung G, Rammensee HG. (1991) Allele-specific motifs revealed by sequencing of self-
peptides eluted from MHC molecules. Nature. 351(6324):290-6.
Felix NJ, Allen PM. (2007) Specificity of T-cell alloreactivity. Nat Rev Immunol. 7(12):942-53.
Friese MA, Fugger L. (2009) Pathogenic CD8(+) T cells in multiple sclerosis. Ann Neurol. 66(2):132-41.
Friese MA, Jakobsen KB, Friis L, Etzensperger R, Craner MJ, McMahon RM, Jensen LT, Huygelen V, Jones EY, Bell JI,
Fugger L. (2008) Opposing effects of HLA class I molecules in tuning autoreactive CD8+ T cells in multiple sclerosis. Nat
Med. 14(11):1227-35.
Frohman EM, Racke MK, Raine CS. (2006) Multiple sclerosis - the plaque and its pathogenesis. N Engl J Med. 354(9):942-
55.
Fung I, Garrett JP, Shahane A, Kwan M. (2012) Do bugs control our fate? The influence of the microbiome on autoimmunity.
Curr Allergy Asthma Rep. 12(6):511-9.
Gangadharan D, Cheroutre H. (2004) The CD8 isoform CD8alphaalpha is not a functional homologue of the TCR co-
receptor CD8alphabeta. Curr Opin Immunol. 16(3):264-70.
Garcia KC, Adams EJ. (2005) How the T cell receptor sees antigen--a structural view. Cell. 122(3):333-6.
Gáspár R Jr, Bagossi P, Bene L, Matkó J, Szöllosi J, Tozsér J, Fésüs L, Waldmann TA, Damjanovich S. (2001) Clustering of
class I HLA oligomers with CD8 and TZR: three-dimensional models based on fluorescence resonance energy transfer and
crystallographic data. J Immunol. 166(8):5078-86.
Gluzman Y. (1981) SV40-transformed simian cells support the replication of early SV40 mutants. Cell. 23(1):175-82.
Gnjatic S, Atanackovic D, Matsuo M, Jäger E, Lee SY, Valmori D, Chen YT, Ritter G, Knuth A, Old LJ. (2003) Cross-
presentation of HLA class I epitopes from exogenous NY-ESO-1 polypeptides by nonprofessional APCs. J Immunol.
170(3):1191-6.
Godelaine D, Carrasco J, Brasseur F, Neyns B, Thielemans K, Boon T, Van Pel A. (2007) A new tumor-specific antigen
encoded by MAGE-C2 and presented to cytolytic T lymphocytes by HLA-B44. Cancer Immunol Immunother. 56(6):753-9.
Goverman J, Perchellet A, Huseby ES. (2005) The role of CD8(+) T cells in multiple sclerosis and its animal models. Curr
Drug Targets Inflamm Allergy. 4(2):239-45.
Greer JM, McCombe PA. (2011) Role of gender in multiple sclerosis: clinical effects and potential molecular mechanisms. J
Neuroimmunol. 234(1-2):7-18.
Griesemer AD, Sorenson EC, Hardy MA. (2010) The role of the thymus in tolerance. Transplantation, 90: 465–74
Groothuis TA, Neefjes J. 2005 The many roads to cross-presentation. J Exp Med. 202(10):1313-8.
Hahn M, Nicholson MJ, Pyrdol J, Wucherpfennig KW. 2005. Unconventional topology of self peptide-major
histocompatibility complex binding by a human autoimmune T cell receptor. Nat. Immunol. 6:490–496.
Harty JT, Tvinnereim AR, White DW. (2000) CD8+ T cell effector mechanisms in resistance to infection. Annu Rev Immunol.
18:275-308.

REFERENCES
153
Hauser SL, Bhan AK, Gilles F, Kemp M, Kerr C, Weiner HL. (1986) Immunohistochemical analysis of the cellular infiltrate
in multiple sclerosis lesions. Ann Neurol. 19(6):578-87.
Hausmann S, Biddison WE, Smith KJ, Ding YH, Garboczi DN, Utz U, Wiley DC, Wucherpfennig KW. (1999) Peptide
recognition by two HLA-A2/Tax11-19-specific T cell clones in relationship to their MHC/peptide/TCR crystal structures.
J Immunol. 162(9):5389-97.
Hohlfeld R, Wekerle H. (2001) Immunological update on multiple sclerosis. Curr. Opin. Neurol. 14(3):299-304.
Honma K, Parker KC, Becker KG, McFarland HF, Coligan JE, Biddison WE. (1997) Identification of an epitope derived
from human proteolipid protein that can induce autoreactive CD8+ cytotoxic T lymphocytes restricted by HLA-A3:
evidence for cross-reactivity with an environmental microorganism. J Neuroimmunol. 73(1-2):7-14.
Hu W, Lucchinetti CF. (2009) The pathological spectrum of CNS inflammatory demyelinating diseases. Semin
Immunopathol. 31(4):439-53.
Huesmann M, Scott B, Kisielow P, von Boehmer H. (1991) Kinetics and efficacy of positive selection in the thymus of
normal and T cell receptor transgenic mice. Cell. 66(3):533-40.
Ibrahim S, Dawson DV, Sanfilippo F. (1995) Predominant infiltration of rejecting human renal allografts with T cells
expressing CD8 and CD45RO. Transplantation. 59(5):724–8.
International Multiple Sclerosis Genetics Consortium; Wellcome Trust Case Control Consortium 2 (2011) Genetic risk and a
primary role for cell-mediated immune mechanisms in multiple sclerosis. Nature. 476(7359):214-9.
Irvine DJ, Purbhoo MA, Krogsgaard M, Davis MM. (2002) Direct observation of ligand recognition by T cells. Nature.
419(6909):845-9.
Jersild C, Svejgaard A, Fog T. (1972) HL-A antigens and multiple sclerosis. Lancet. 1(7762):1240-1.
Junker A, Ivanidze J, Malotka J, Eiglmeier I, Lassmann H, Wekerle H, Meinl E, Hohlfeld R, Dornmair K. (2007) Multiple
sclerosis: T-cell receptor expression in distinct brain regions. Brain. 130(Pt 11):2789-99.
Kim SM, Bhonsle L, Besgen P, Nickel J, Backes A, Held K, Vollmer S, Dornmair K, Prinz JC. (2012) Analysis of the paired
TCR α- and β-chains of single human T cells. PLoS One. 7(5):e37338.
Krangel MS. (2009) Mechanics of T cell receptor gene rearrangement. Curr Opin Immunol. 21(2):133-9.
Kronenberg M, Siu G, Hood LE, Shastri N. (1986) The molecular genetics of the T-cell antigen receptor and T-cell antigen
recognition. Annu Rev Immunol. 4:529-91.
Lassmann H, Brück W, Lucchinetti C. (2001) Heterogeneity of multiple sclerosis pathogenesis: implications for diagnosis
and therapy. Trends Mol Med. 7(3):115-21.
Lefranc MP, Lefranc G. (2001) The T Cell Receptor Facts Book. (London, UK: Academic Press).
Lennon VA, Wilks AV, Carnegie PR. (1970) Immunologic properties of the main encephalitogenic peptide from the basic
protein of human myelin. J Immunol. 105(5),1223-30.
Long EO, Rosen-Bronson S, Karp DR, Malnati M, Sekaly RP, Jaraquemada D. (1991) Efficient cDNA expression vectors for
stable and transient expression of HLA-DR in transfected fibroblast and lymphoid cells. Hum Immunol. 31(4):229-35.
Love PE, Hayes SM. (2010) ITAM-mediated signaling by the T-cell antigen receptor. Cold Spring Harb Perspect Biol.
2(6):a002485.
Lucas RM, Hughes AM, Lay ML, Ponsonby AL, Dwyer DE, Taylor BV, Pender MP. (2011) Epstein-Barr virus and multiple
sclerosis. J Neurol Neurosurg Psychiatry. 82(10),1142-8.
Lucchinetti C, Brück W, Parisi J, Scheithauer B, Rodriguez M, Lassmann H. (2000) Heterogeneity of multiple sclerosis
lesions: implications for the pathogenesis of demyelination. Ann Neurol. 47(6):707-17.
MacDonald KP, Shlomchik WD, Reddy P. (2013) Biology of graft-versus-host responses: recent insights. Biol Blood
Marrow Transplant. 19(1 Suppl):S10-4.
Madden DR, Garboczi DN, Wiley DC. (1993) The antigenic identity of peptide-MHC complexes: a comparison of the
conformations of five viral peptides presented by HLA-A2. Cell. 19;75(4):693-708.
Mars LT, Saikali P, Liblau RS, Arbour N. (2010) Contribution of CD8 T lymphocytes to the immuno-pathogenesis of
multiple sclerosis and its animal models. Biochim Biophys Acta. 1812(2):151-61.
Mason D. (1998) A very high level of crossreactivity is an essential feature of the T-cell receptor. Immunol Today. 19:395–
404.
Matsumoto Y, Yoon WK, Jee Y, Fujihara K, Misu T, Sato S, Nakashima I, Itoyama Y. (2003). Complementarity-determining
region 3 spectratyping analysis of the TCR repertoire in multiple sclerosis. J Immunol. 170, 4846-53.
McMahon RM, Friis L, Siebold C, Friese MA, Fugger L, Jones EY. (2011) Structure of HLA-A*0301 in complex with a
peptide of proteolipid protein: insights into the role of HLA-A alleles in susceptibility to multiple sclerosis. Acta
Crystallogr D Biol Crystallogr. 67(Pt 5):447-54.

REFERENCES
154
Miller E. (2012) Multiple Sclerosis. Adv Exp Med Biol. 724:222-38.
Mohme M, Hotz C, Stevanovic S, Binder T, Lee JH, Okoniewski M, Eiermann T, Sospedra M, Rammensee HG, Martin R.
(2013) HLA-DR15-derived self-peptides are involved in increased autologous T cell proliferation in multiple sclerosis. Brain. 136(Pt 6):1783-98.
Morris GP, Allen PM. (2012) How the TCR balances sensitivity and specificity for the recognition of self and pathogens. Nat
Immunol. 13(2):121-8.
Murphy K, Travers P, Walport M. (2008) Janeway’s Immunobiology. 7. edition, Garland Science, New York and London.
Nagai K, Thøgersen HC. (1987) Synthesis and sequence-specific proteolysis of hybrid proteins produced in Escherichia coli.
Methods Enzymol. 153:461-81.
Naito S, Namerow N, Mickey MR, Terasaki PI. (1972) Multiple sclerosis: association with HL-A3. Tissue Antigens. 2(1):1-4.
Nakayamada S, Takahashi H, Kanno Y, O'Shea JJ. (2012) Helper T cell diversity and plasticity. Curr Opin Immunol,
24(3):297-302.
Nikolic-Zugic J, Bevan MJ. (1990) Role of self-peptides in positively selecting the T-cell repertoire. Nature. 344:65–7.
Nino-Vasquez JJ, Allicotti G, Borras E, Wilson DB, Valmori D, Simon R, Martin R, Pinilla C. (2004) A powerful
combination: the use of positional scanning libraries and biometrical analysis to identify cross-reactive T cell epitopes. Mol
Immunol. 40(14-15):1063-74.
Noseworthy JH, Lucchinetti C, Rodriguez M, Weinshenker BG. (2000) Multiple sclerosis. N Engl J Med. 343(13):938-52.
Olival GS, Lima BM, Sumita LM, Serafim V, Fink MC, Nali LH, Romano CM, Thomaz RB, Cavenaghi VB, Tilbery CP,
Penalva-de-Oliveira AC. (2013) Multiple sclerosis and herpesvirus interaction. Arq Neuropsiquiatr. 71(9B):727-30.
van Oosten BW, Lai M, Hodgkinson S, Barkhof F, Miller DH, Moseley IF, Thompson AJ, Rudge P, McDougall A, McLeod
JG, Adèr HJ, Polman CH. (1997) Treatment of multiple sclerosis with the monoclonal anti-CD4 antibody cM-T412: results
of a randomized, double-blind, placebo-controlled, MR-monitored phase II trial. Neurology. 49(2):351-7.
Owens GP, Bennett JL. (2012) Trigger, pathogen, or bystander: the complex nexus linking Epstein- Barr virus and multiple
sclerosis. Mult Scler. 18(9):1204-8.
Owens GP, Gilden D, Burgoon MP, Yu X, Bennett JL. (2011) Viruses and multiple sclerosis. Neuroscientist. 17(6):659-76.
Pakpoor J, Giovannoni G, Ramagopalan SV. (2013) Epstein-Barr virus and multiple sclerosis: association or causation?
Expert Rev Neurother. 13(3):287-97.
Pannetier C, Even J, Kourilsky P. (1995) T-cell repertoire diversity and clonal expansions in normal and clinical samples.
Immunol Today 16:176-181.
Paterson DJ, Jefferies WA, Green JR, Brandon MR, Corthesy P, Puklavec M, Williams AF. (1987) Antigens of activated rat
T lymphocytes including a molecule of 50,000 Mr detected only on CD4 positive T blasts. Mol Immunol. 24(12):1281-90.
Pircher H, Mak TW, Lang R, Ballhausen W, Rüedi E, Hengartner H, Zinkernagel RM, Bürki K. (1989) T cell tolerance to
Mlsa encoded antigens in T cell receptor V beta 8.1 chain transgenic mice. EMBO J. 8(3):719-27.
Poser CM, Roman GC, Vernant JC. (1990) Multiple sclerosis or HTLV-I myelitis? Neurology. 40(7):1020-2.
Prineas JW, Wright RG. (1978) Macrophages, lymphocytes, and plasma cells in the perivascular compartment in chronic
multiple sclerosis. Lab Invest. 38(4):409-21.
Rainey-Barger EK, Blakely PK, Huber AK, Segal BM, Irani DN. (2013) Virus-induced CD8+ T cells accelerate the onset of
experimental autoimmune encephalomyelitis: implications for how viral infections might trigger multiple sclerosis
exacerbations. J Neuroimmunol. 259(1-2):47-54.
Rock KL, York IA, Saric T, Goldberg AL. (2002) Protein degradation and the generation of MHC class I-presented peptides.
Adv Immunol. 2002;80:1-70.
Roers A, Montesinos-Rongen M, Hansmann ML, Rajewsky K, Küppers R. (1998) Amplification of TCRbeta gene
rearrangements from micromanipulated single cells: T cells rosetting around Hodgkin and Reed-Sternberg cells in
Hodgkin's disease are polyclonal. Eur J Immunol. 28(8):2424-31.
Rose AM, Bell LC. (2012) Epistasis and immunity: the role of genetic interactions in autoimmune diseases. Immunology.
137(2):131-8.
Rostasy K, Reiber H, Pohl D, Lange P, Ohlenbusch A, Eiffert H, Maass M, Hanefeld F. (2003) Chlamydia pneumoniae in
children with MS: frequency and quantity of intrathecal antibodies. Neurology. 61(1):125-8.
Rowen L, Koop BF, Hood L. (1996) The complete 685-kilobase DNA sequence of the human b T cell receptor locus. Science,
272(5269):1755-62.
Rudolph MG, Stanfield RL, Wilson IA. (2006) How TCRs bind MHCs, peptides, and coreceptors. Annu Rev Immunol.
24:419-66.

REFERENCES
155
Schluesener HJ, Sobel RA, Linington C, Weiner HL. (1987) A monoclonal antibody against a myelin oligodendrocyte
glycoprotein induces relapses and demyelination in central nervous system autoimmune disease. J Immunol. 139(12):4016-
21.
Seitz S, Schneider CK, Malotka J, Nong X, Engel AG, Wekerle H, Hohlfeld R, Dornmair K. (2006) Reconstitution of paired
T cell receptor α- and β-chains from microdissected single cells of human inflammatory tissues. PNAS. 103(32):12057-62.
Serafini B, Rosicarelli B, Franciotta D, Magliozzi R, Reynolds R, Cinque P, Andreoni L, Trivedi P, Salvetti M, Faggioni A,
Aloisi F. (2007) Dysregulated Epstein-Barr virus infection in the multiple sclerosis brain. J Exp Med. 204(12):2899-912.
Serafini B, Severa M, Columba-Cabezas S, Rosicarelli B, Veroni C, Chiappetta G, Magliozzi R, Reynolds R, Coccia EM,
Aloisi F. (2010). Epstein-Barr virus latent infection and BAFF expression in B cells in the multiple sclerosis brain:
implications for viral persistence and intrathecal B-cell activation. J Neuropathol Exp Neurol. 69(7):677-93.
Sethi DK, Schubert DA, Anders AK, Heroux A, Bonsor DA, Thomas CP, Sundberg EJ, Pyrdol J, Wucherpfennig KW.
(2011) A highly tilted binding mode by a self-reactive T cell receptor results in altered engagement of peptide and MHC. J
Exp Med. 208(1):91-102.
Sewell AK. (2012) Why must T cells be cross-reactive? Nat Rev Immunol. 12(9):669-77.
Shevchenko A, Wilm M, Vorm O, Mann M. (1996) Mass spectrometric sequencing of proteins silver-stained polyacrylamide
gels. Analytical chemistry. 68, 850–858.
Siewert K. (2011) Autoaggressive Human T Cell Receptors and their Antigen Specificities.
Siewert K, Malotka J, Kawakami N, Wekerle H, Hohlfeld R, Dornmair K. (2012) Unbiased identification of target antigens
of CD8+ T cells with combinatorial libraries coding for short peptides. Nat Med. 18(5):824-8.
Silva AM, Bettencourt A, Pereira C, Santos E, Carvalho C, Mendonça D, Costa PP, Monteiro L, Martins B. (2009) Protective
role of the HLA-A*02 allele in Portuguese patients with multiple sclerosis. Mult Scler. 15(6):771-4.
Skulina C, Schmidt S, Dornmair K, Babbe H, Roers A, Rajewsky K, Wekerle H, Hohlfeld R, Goebels N. (2004) Multiple
sclerosis: Brain-infiltrating CD8+ T cells persist as clonal expansions in the cerebrospinal fluid and blood. PNAS.
101(8):2428-33.
Smith-Garvin JE, Koretzky GA, Jordan MS. (2009) T cell activation. Annu Rev Immunol. 27:591-619.
Sospedra M, Pinilla C, Martin R. (2003) Use of combinatorial peptide libraries for T-cell epitope mapping. Methods.
29(3):236-47.
Speir JA, Stevens J, Joly E, Butcher GW, Wilson IA. (2001) Two different, highly exposed, bulged structures for an
unusually long peptide bound to rat MHC class I RT1-Aa. Immunity. 14(1):81-92.
Sumaya CV, Myers LW, Ellison GW. (1980) Epstein-Barr virus antibodies in multiple sclerosis. Arch Neurol. 37(2), 94-6.
Sun X, Saito M, Sato Y, Chikata T, Naruto T, Ozawa T, Kobayashi E, Kishi H, Muraguchi A, Takiguchi M. (2012) Unbiased
analysis of TCRα/β chains at the single-cell level in human CD8+ T-cell subsets. PLoS One. 7(7):e40386.
Sundqvist E, Bergström T, Daialhosein H, Nyström M, Sundström P, Hillert J, Alfredsson L, Kockum I, Olsson T. (2013)
Cytomegalovirus seropositivity is negatively associated with multiple sclerosis. Mult Scler. [Epub ahead of print]
Trapp BD, Nave KA. (2008) Multiple sclerosis: an immune or neurodegenerative disorder? Annu Rev Neurosci. 31:247-69.
Virtanen JO, Jacobson S. (2012) Viruses and multiple sclerosis. CNS Neurol Disord Drug Targets. 11(5):528-44.
Wang JH, Reinherz EL. (2012) The structural basis of αβ T-lineage immune recognition: TCR docking topologies,
mechanotransduction, and co-receptor function. Immunol Rev. 250(1):102-19.
Weinberg AD, Bourdette DN, Sullivan TJ, Lemon M, Wallin JJ, Maziarz R, Davey M, Palida F, Godfrey W, Engleman E,
Fulton RJ, Offner H, Vandenbark AA. (1996) Selective depletion of myelin-reactive T cells with the anti-OX-40 antibody
ameliorates autoimmune encephalomyelitis. Nat Med. 2(2):183-9.
Wekerle H. (1992) Myelin specific, autoaggressive T cell clones in the normal immune repertoire: their nature and their
regulation. Int Rev Immunol. 9(3),231-41.
Wooldridge L, Ekeruche-Makinde J, van den Berg HA, Skowera A, Miles JJ, Tan MP, Dolton G, Clement M, Llewellyn-
Lacey S, Price DA, Peakman M, Sewell AK. (2012) A single autoimmune T cell receptor recognizes more than a million
different peptides. J Biol Chem. 287(2):1168-77.
Wucherpfennig KW, Newcombe J, Li H, Keddy C, Cuzner ML, Hafler DA. (1992) T cell receptor V alpha-V beta repertoire
and cytokine gene expression in active multiple sclerosis lesions. J Exp Med. 175(4), 993-1002.
Yewdell JW, Reits E, Neefjes J. (2003) Making sense of mass destruction: quantitating MHC class I antigen presentation.
Nat Rev Immunol. 3(12):952-61.

EIDESSTATTLICHE VERSICHERUNG
156
Eidesstattliche Versicherung
Gemäß §7 Abs. 2 der Promotionsordnung der Ludwig-Maximilians-Universität München für die
medizinische Fakultät zur Erlangung des akademischen Doktorgrades der Naturwissenschaften (Dr.
rer. nat.):
Hiermit erkläre ich an Eides statt, dass ich die vorliegende Dissertation mit dem Thema
„Characterization of Disease-Related CD8+ T Cells and their Antigens from Patients with Multiple
Sclerosis“ selbstständig verfasst, mich außer der angegebenen keiner weiteren Hilfsmittel bedient und
alle Erkenntnisse, die aus dem Schrifttum ganz oder annähernd übernommen sind, als solche kenntlich
gemacht und nach ihrer Herkunft unter Bezeichnung der Fundstelle einzeln nachgewiesen habe.
Ich erkläre des Weiteren, dass die hier vorgelegte Dissertation nicht in gleicher oder in ähnlicher Form
bei einer anderen Stelle zur Erlangung eines akademischen Grades eingereicht wurde.
Wolfratshausen, den 07.11.2013
_______________________
Anna Gabriele Niedl