characterization of dna probes on silicon surface
TRANSCRIPT

CHARACTERIZATION OF DNA PROBES ON SILICON SURFACE
ZHIYUN JIN
A Thesis Submitîed in Conformity with the Requirements for the Degree of Master of Science in the
Department of Chemistry University of Toronto
@ Zhiyun Jin
2001

National Library Bibliothèque nationale du Canada
Acquisitions and Acquisitions et Bibliographie Services services bibliagraphiques 395 WeUington Street 395. nia Wotiinglon Oitawa ON K1A O N 4 W O N K l A û N 4 canada Caneda
The author has granted a non- exclusive licence dowing the National Library of Canada to reproduce, loan, disûi'bute or seil copies of tbis thesis in microform, paper or elecîronic formats.
The author retains ownership of the copyright in this thesis. Neither the thesis nor substautial extracts from it may be printed or otherwise reproduced without the author's permission.
L'auteur a accordé une licence non exclusive permettant à la Bibliothèque nationale du Canada de reproduire, prêter, distribuer ou vendre des copies de cette thèse sous la forme de micro fi ch el^ de reproduction sur papier ou sur format électronique.
L'auteur conserve la propriété du droit d'auteur qui protège cette thèse. Ni la thèse ni des extraits substantiels de celle-ci ne doivent êîre imprimés ou autrement reproduits sans son autorisation.

To:
MY HUSBAND JIANPING LU
and
MY PARENTS

Upon completing this thesis, I'd like to express my deepest appreciation to Professor
Michael Thompson, my supervisor. It was through his careful guidance and kind
encouragement that 1 had the chance to get into such a new and incredible research world of
biosensors and carried out al1 the research work successfuIIy.
1 also want to extend my gratitude to Professor Ulrich I. Krull for his kindness in
providing me with so many helpful suggestions and allowing me to use their instrument.
Dr. Rana Sodhi in the Chemical Engineering Department provided invaluable
assistance with most of the surface analysis with XPS and data interpretation: Dr. Mark E.
McGovern and Ms Rosaiia Nisman, who did a lot of the eady work in the silane synthesis
and silanization, have always k e n helpful contributors throughout the research.
Everybody in Chemical Sensors Croup, p s t and present. h a provided their help in
many different ways. Here. 1 would d Iike to thank al1 of thern for sharing their research
experience with me. They are Dr. David Stone, Dr. Bilyana Cavic-Vlasak. Dr. Larisa Cheran,
Dr. Michelle Furtado, Dr. Anil Deisingh, Dr. Shakour Ghafouri-Baksh. Ms. Nardos Tassew.
Ms. Emma-louise Lyle, Ms. Christine Jayarajah, Mr. Scott Ballantyne, and Ms. Liying
Zhang.

ABSTRACT
Characterization of DNA Probes on Silicon Surface
Master of Science, 2001
Zhiyun Jin
Department of Chemistry, University of Toronto
This thesis was focused on establishing a well-controlled system on silicon surface and
characterizing immobilized DNA probes as well as their hybndization. DNA sequences were
immobilized on silicon surface by using silane: !-(thiotrifluoroacetato)-1 1-(trichlorosi1yl)-
undecane (TTU). X-ray photoelectron spectroscopy (XPS) was used to characierize the
surface after the silanization and "P radio-labeling method was used to quantify the surface
coverage of DNA sequences. Washing rnethod was very important to achieve good results in
the silanization process. Relatively controllable system could be achieved by optimizing
parameters, such as pH, solvent, ionic svength and DNA concentration. Two methods. with
sonication and with 6-mercapto-1-hexanol, were tried to decrease non-specific adsorption
and gave satisfactory results. Both the base order and length of the sequence affected
immobilization greatly. Under the experiment condition in this work. IO-15mer is the
suitable length for DNA probes. The packing patterns of different molecule layers could be
analyzed from surface moiecular film thickness measurement.

TABLE OF CONTENTS
Abstract.. . . . .. . . . . . . . . . . . . . . . . . . . . . . . . . . . . . . . . . . . . . . . . . . . . . . . . . . . . . . . . . . . . . . . . . . . . . . . . . . . . . . . . . . . . . . . . . . . . . . . . . . . . . . . . . . . . . . . . . . . . . . .
Table of contents ........................~.........................,.............................................................. v
List of Tables ......................................................,................................................................. .u
1. Introduction .........................................................................................,.......................... I
1.1 Developrnent of gene research requires new methods for gene analysis ........... - ......-..... 1
7 1.2 Genome. DNA and Gene ...............................................................................-................ -
1.3 DNA sequencing ................................................................,,................................... 4
1.4 Immobilization of DNA probe onto solid surface ..................,....................................-... 9
1.4.1 Non-covalent binding ............................................................................................ 9
1.4.2 Covalent binding ................................................................................................. I 1
1 -4.2.1 Covalent binding for electrode ...................................................................... 1 I
1.4.2.2 Covalent binding for gold surface ................................................................ 12
1.4.2.3 Covalent binding for silicon wafers or glass slides ................................... 13
1.4.2.4 Covalent binding for optical fibers ........................................................... 16
1.5 Characterization of silicon surface with DNA probes ............................................. . 19
1 S.1 Introduction for XPS method ... ............................................................... . 1 4
1 5.2 Introduction for Radio-labeiing method .............. .... ....................... 1 7
1 5.3 Introduction for Ellipsometry ................................ , ............................................... 3 1
1.6 Research objectives ....................................................................................................... 34

2 . Expetiment .................................................................................................................... 35
2 . I Materials and reagents ................................................................................................... 35
Reagents for TTU synthesis ............................................................................................ 35
Reagents for Radio-labeling expriment ..................... ... ........................................... 35
................................................................................................................. Other reagents 36
........................................................................................................................ Substrate 36
............................................................................................................... DNA sequences 36
2.2 Synthesis ........................................................................................................................ 37
2.3 Instrumentation ............................................................................................................ 38
..................................................................................................................... 2.4 Procedures 39
Cleaning of substrates .................................................................................................. 39
..................................................................... Silanization and deprotection of substrates 40
........................................................... Immobilization of DNA sequences on substrates 40
. . . Hybndization of substrates ............................................................................................. JI
.............................................................................................. Radio-labeling experiment 41
3 . Results and disscussion ................................................................................................... 42
3.1 Surface functionalization through silanization ........ ... .............................................. 43
.................................................. 3.2 Analysis and optirnization of immobilization method 49
3.2.1 pH effect on surface immobilization ................................................................... 49
. . 3.2.2 Solvent effect on surface immobtlization ............................................................... 51
............. 3.2.3 The effect of salt concentration in Tris buffer on surface immobilization 57
3.2.4 DNA concentration effect on surface immobilization .................... .. ................. 53
3.2.5 Sonication rnethod on selectivity ........................................................................... 53

..................................................................... 3.2.6 The effect of MCH on the selectivity 56
3.3 Characterisation of Silicon surface with immobilized DNA probes ............................. 58
.............................................................. 3.3.1 Hybridization of DNA probes on surface 59
3.3.2 DNA sequences length on the immobilizaion ................................................... 59
3.3.3 The Effect of DNA sequences on immobilization ................................................. 60
3.3.4 Hybridization between partially hybridized sequences .......................................... 62
3.3.5 Film thickness measurement ............................................................... .. ............ 64
4 . Conclusion ........................................................................................................................... 66
5 . References ........................................................................................................................ 68
vii

LIST OF FIGURES
Fig. 1.1
Fig. 1.2
Fig. 1.3
Fig. 1.4
Fig 1.5
Fig 1.6
Fig 1.7
Fig 1.8
Fig 1.9
Fig 1.10
Fig 1.11
Fig 1.12
Mode1 of DNA structure showing the double helix. the composition of different
parts[5]. .................................................................................................................. - 3
......................... ........................ Sanger/Dideoxy DNA sequencing method [SI .. 6
...................................... Maxam-GilbettlChemistry DNA sequencing method [SI 7
Attachment of oligonucleotides onto a g l a s slide via disulfide bonds [37] ........ 14
Chemistry used to covalently attach thiol-modified DNA oligomers to
aminosilane-treated surface [38] ........................................................................... 15
Drawings illustrating the chemistry employed for preparation of the modified
Si( l l 1 ) surface [46] .............................................................................................. 18
Atomic force microscopy of silicon chip surfaces: (a) cleaned. rehydroxylated
silicon surface; (b) self-assernbled MPTS layer on silicon: (c) immobilized DNA
17 probes: (d) surface after hybridization [36] ........................................................... --
(a) A surface irradiated by a X-ray photon source of suficiently high energy will
emit electrons. (2) The X-ray photon tramfers its energy to a core-level electron
imparting enough energy for the electron CO Ieave the atom [59] ......................... 15
The relationship between the escape depth and the incident angle. ..................... 27
Forward reaction of T4 PNK catalysed "P radio-labelling method. [60] .......... 39
Exchange reaction of T4 PNK cataiysed "P radio-labelling rnethod. [60] ......... 30
A schematic diagram of a nulling ellipsometer with the quarter-wave plate
placed before the light is reflected from the sample. L: the light source (usually a
viii

low power He-Ne Iaser); f: the polarking prism: Q: the quarter-wave plate
compensator; S: the sample under study: A: the ananlyzer prism; D: the light
detector .................................................................................................................. 32
Fig 2.1 Synthetic pathways to TTU [61] .......................................................................... 37
Fig 3.1 Schernatic graph of the whole procedure of the surface modification . DNA
.................. immobilization and DNA hybrîdization ........................................ .. 42
Fig 3.2 Water control on Silicon surface in washing step ................................................. 45
Fig 3.3 TTU covalent binding testing by sonication rnethod ............................................ 48
Fig 3.4 The effect of buffer on DNA immobilization ....................................................... 50
Fig 3.5 Effect of DNA concentration on the immobilization ........................................... 53
Fig 3.6 Schematic diagram of MCH on removing non-specific adsorption ASilicon
surface ater immobilization; B . Silicon surface after immobilization followed by
treatrnent with MCH ........................................................................................... 58

LIST OF TABLES
Table 3.1
Table 3.2
Table 3.3
Table 3.4
Table 3.5
Table 3.6
Table 3.7
Table 3.8
Table 3.9
........................................................... Silanization result characterized by XPS 46
Deprotection result characterized by XPS .......................................................... 47
pH effect on irnrnobilization ............................................................................. 50
Solvent effect on immobilization ....................................................................... 51
....................... The effect of salt concentration in tris buffer on immobilization 51
.................................................... DNA concentration effect on irnmobilization 54
................................ Sonication method to remove the non-specific adsorption 54
................................ Sonication time period to remove non-specific adsorption 56
MCH effect on the selectivity ............................................................................. 56
Table 3.10 Effect of MCH concentration on irnmobilization ............................................... 57
Table 3.11 Result of hybridization ....................................................................................... 59
..................................................... Table 3.12 Effect of sequence length on immobilization 60
Table 3.13 Immobilization result of different base order in Zl and 24 ............................... 61
.................................... Table 3.14 DNA sequences Z1 and 23 immobilized on the surface 63
Table 3.15 Hybridized DNA sequences for 21 and 23 ...................................................... 63
.................................... Table 3.16 Film thickness measured by Ellipsometry ... ....... 64

INTRODUCTION
1.1 Development of Genome Research Requires New Methods for Gene Analysis
In recent years, more and more areas have gained benefits from the genome
research. In molecular medicine. both diagnosis and therapy of diseases have reached the
oenetic Ievel. The causes of many diseases may be related to genetic deficiency. For b
example. hemophilia A is due CO the absence of clotting factor VHI and genetic defect of
cystic fibrosis is the defective chloride channel protein etc [Il. The early diagnosis of gene
deficiency can help to prevent some genetic diseases and ;ive these diseases better
chances CO be cured. The gene therapy method may provide new ways of dealing with
genetic diseases which are hard to deal with by traditional therapy methods [Z]. The
Human Genome Project. which has finished 47% high-quality sequence of total sequence
by July 30,2001 and achieved great developrnent in draft sequence generation [31, is one
aspect of the systematic research work for the application of gene methods for disease
diagnosis and therapy. In other areas such as agriculture, livestock breeding and bio-
processing, the genome research helped to produce genetic products including disease-,
insect- and drought-resistant crops; healthier, more productive. disease-resistant farm
animals [4]. Other products such as more nutritious food, bio-pesticides, edible vaccines
and new environmental cleanup uses for plants like tobacco are also on the way that could
be obtained from the genome research [4]. In other areas such as DNA forensics
identification, bio-archaeology, evolution and human migration, etc, the genome research
cari also provide much helpful information and acts as a powerful tool [4]. Therefore, in

genorne research, the requirement of highly sensitive and efficient methods for gene
analysis and gene sequencing is increasingly prominent. In all, the development of
genome research helps in many ways to improve people's life.
1.2 Genome, DNA, and Gene
The complete set of instructions for making an organism is called its genome. It
contains the master blueprint of all the ceIIular structures and activities for the entire
Iifetime of the ce11 or organism. Found in every nucleus of a human's many trillions of
cells. the human genome consists of tighily coiled threads of deoxyribonucleic acid
(DNA) and associated protein molecuIes, organised with structures called chromosomes.
In humans and in other higher organisms, a DNA molecule consists of two strrinds
that wrap üround each other to resernble a twisted ladder whose sides. made of sugar and
phosphate molecules, are connected by rungs of nitrogen-containing chemicals crilled
bases [SI. As it has been shown in Fig 1.1, each strand is a linear arrangement of similar
repeating units called nucleotides that are each cornposed of one sugar. one phosphate.
and a nitrogenous base. Four different bases are present in DNA: adenine (A) . thymine
(T). cytosine (C) and guanine (G). The particular order of the bases arranged dong the
sugar-phosphate backbone is called the DNA sequence: the sequence specifies the exact
genetic instructions required tomate a particular organism with its own unique traits. The
two DNA strands are held together by weak bonds between the bases on each strand.
fonning base pairs (bp): A is always with T, and G with C. These two strands are called
complementary strands and can be denatured at certain condition such as heating to 94T

for Smin. Denatured complementary strands can also be hybridized together again if the
condition is reversed sadually.
Thymine
Menine and Guanine
/'
Fig 1.1 hiodel of DNA structure showing the double helix, the composition of different parts [5].

Each DNA molecule contains many genes, the basic physical and functional units of
heredity. A gene is a specific sequence of nucleotide bases whose sequences carry the
information required for constructing proteins, which provide the structural cornponents of
cells and tissues as well as enzymes for essential biochemical reactions. All living
organisms are composed Iargeiy of proteins, which are made up of long chains of sub-
units called amino acids. Within the gene, each specific sequence of three DNA bues
(codons) directs the cells' protein-synthesising machinery to add specific amino acids ont0
the chain of protein. The genetic code is thus a series of codons that specify which amino
acids are required to make up specific proteins. Hurnan genes Vary widely in length. ot'ten
extending over thousands of bases, but only about IO% of the genome are known to
include the protein-coding sequences (exons) of genes. Interspersed with many genes are
intron sequences. which have no coding function. The balance of the genome is thought to
consist of other noncoding regions (such as control sequences and intergenic resions).
whose functions are stiIl obscure.
1.3 DNA Sequencing
Genomic sequencing is probably the most important aspect in genome research. for
it is the first step that let people know what DNA sequence a gene is composed of. Only
upon this basis, did people have the chance to get to know more about how the gene
functions and how to utilise it by controlhg or modifying it. The diagnosis of genomic
sequencing requires highly sensitive techniques because nucleic acid materials to be
detected are always of trace quantiûes at the concentration IeveI of micro-mole per litre.
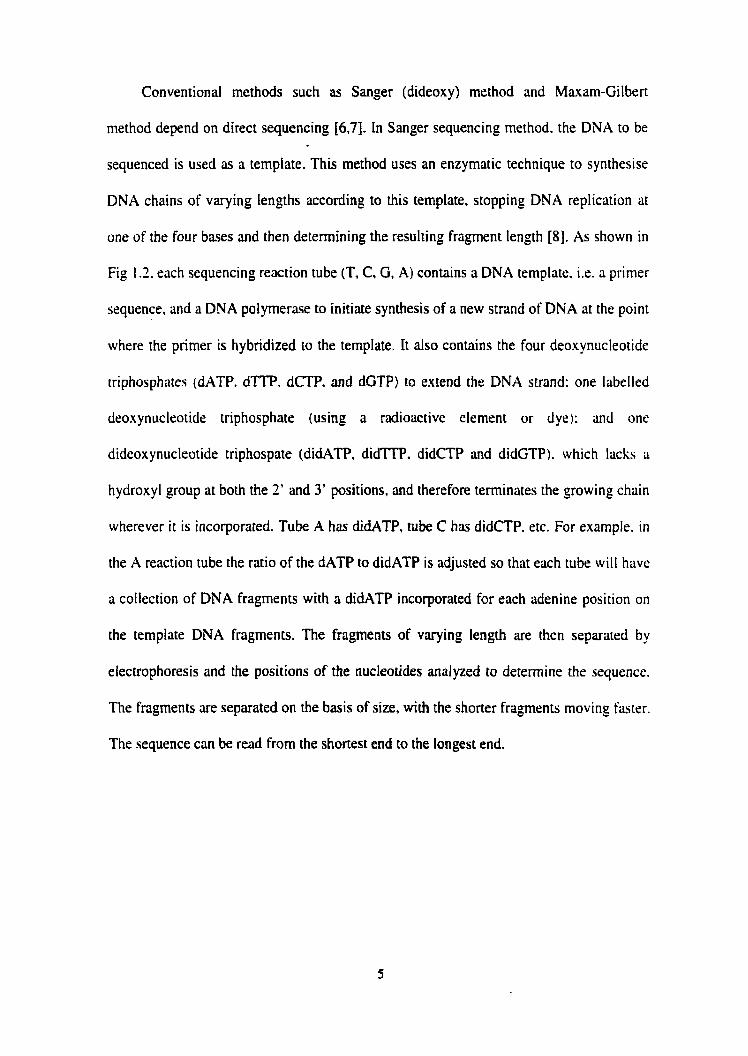
Conventional methods such as Sanger (dideoxy) method and Maxam-Gilbert
method depend on direct sequencing [6,7]. In Sanger sequencing method. the DNA to be
sequenced is used as a template. This method uses an enzymatic technique to synthesise
DNA chains of varying lengths according to this template, stopping DNA replication at
one of the four bases and then determining the resulting fragment length [8]. As shown in
Fig 1.3. each sequencing reaction tube (T, C, G, A) contains a DNA template, i.e. a primer
sequence, and a DNA polymerase to initiace synthesis of a new strand of DNA at the point
where the primer is hybridized to the template. It also contains the four deoxynucleotide
triphosphates (dATP, dTTP. dCTP, and dGTP) to extend the DNA srrand: one labelled
deo.uynucleotide triphosphate (using a radioactive element or dye): and one
dideoxynucleotide triphospate (didATP. didïTP. didCTP and didGTP). which lacks a
hydroxyl group at both the 2' and 3' positions, and therefore terminates the growing chain
wherever it is incorporated. Tube A has didATP, tuix C has didCTP. etc. For example. in
the A reaction tube the ratio of the dATP to didATP is adjusted so that each tube will have
a collection of DNA fragments with a didATP incorporated for each adenine position on
the template DNA fragments. The fragments of varying length are then separated by
electrophoresis and the positions of the nucleotides analyzed to determine the sequence.
The fragments are separated on the ba is of size, with the shorter fragments moving Iaster.
The sequence can be read from the shortest end to the longest end.

region to be sequenced primer a n n d n g site
5' AGCTTAGC----------TGCAATGC 3'
.% reaction T reaction G reaction C reaction
DNA fragments
Fig 1.2 Sanger/Dideoxy DNA sequencing method [SI
Unlike the Sanger method of using the enzyrnatic technique, the Maxam-Gilbert
method [8] is usually called a chernical method. In this method, a DNA sequence is 5'
end-labeled with 3" phosphate and chemicdly cleaved by three steps: (i) modification of

the base using DMS for G. hydrazine/NaCl for C, hydrazine for C and T and NaOH for
A+C: (ii) the modified base is released from the sugar-phosphate backbone: ( i i i ) b-
elimination brings about strand cleavage. As shown in Figl.3, the individual DNA strands
are separated by PAGE again to leave a signature pattern of bands and the gel read
accordingly: however the interpretation of the results is much more difficult since onty G
and C cleavage are nucleotide specific. Currently, this method is not as frequently used as
Sanger method.
G reaction C+A reaction T+C reaction C reaction
DNA fragments *GATCGGACCT *GATCGCACC *GATCGGAC *GATCGGA *GATCGG *GATCG *GATC *GAT *GA *G
Fig 1.3 Maxam-CiiberîKhemistry DNA sequencing method [SI
Although both Sanger and Maxam-Gilbert methods are standard methods and have
been used for several decades, they are laborious. time consurning, and thus they cm not
meet the increasing requirernent for a large-scde, f a t DNA sequencing work.
Now, there are already some automated DNA sequencers comrnercially available.
such as AB1 373 Fluorescent DNA sequencer. AB1 PRISM 377 DNA sequencer etc.
However. they are still based on electraphoresis separation. which will require long
running time.
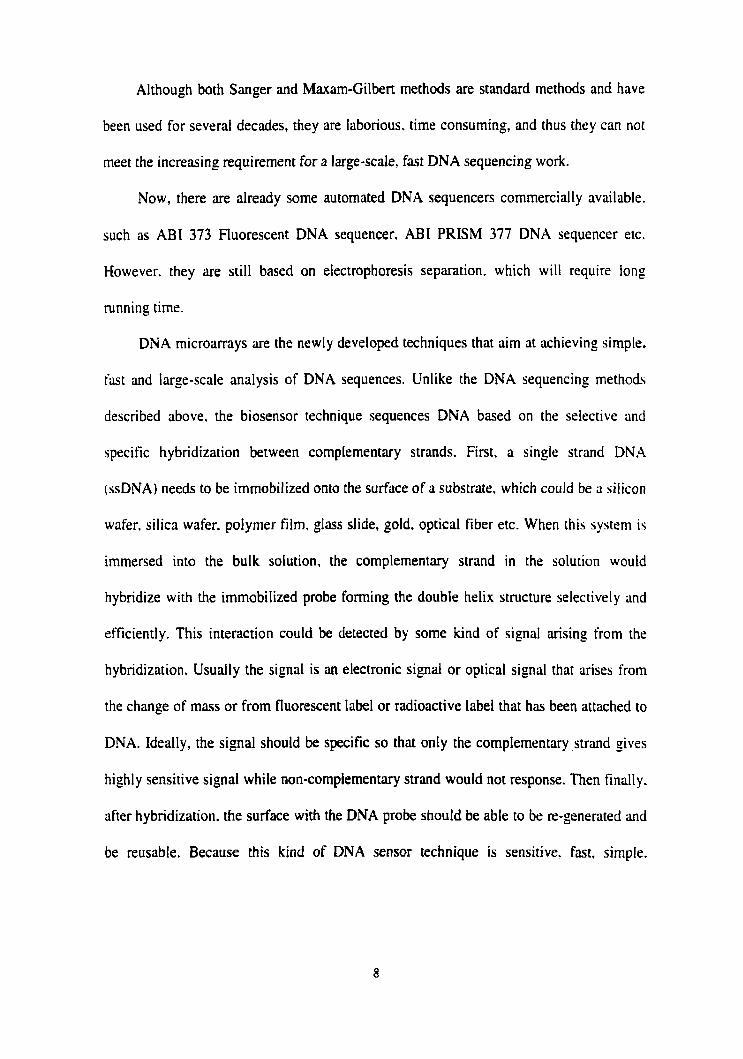
DNA microarrays are the newly developed techniques that airn at achieving simple.
f i t and large-scale analysis of DNA sequences. Unlike the DNA sequencing methods
described above, the biosensor technique sequences DNA based on the selective and
specific hybridization between complementary strands. First, a single strrind DNA
(ssDNA) needs to be imrnobilized onto the surface of a substrate, which could be ri siiicon
wafer, silica wafer, polymer film, glas slide, gold, optical fiber etc. When this system is
immersed into the bulk solution, the complementary strand in the solution would
hybridize with the immobilized probe forming the double helix structure selectively and
efficiently. This interaction could be detected by sorne kind of signal arising from the
hybridization. Usually the signa1 is an electronic signal or opticd signal that arises from
the change of mass or from fluorescent label or radioactive label that has been attached to
DNA. Ideally, the signal should be specific so that onIy the complementary,strand gives
highly sensitive signal while non-compiementary strand would not response. Then finally.
after hybridization, the surface with the DNA probe should be able to be re-generated and
be reusable. Because this kind of DNA sensor technique is sensitive, fast, simple.

convenient and sornetimes provides real-time analysis, more and more research work has
been aimed at developing both its theory and application. [9-111
1.4 Immobilization of DNA Probe ont0 Solid Surface
For different types of sensors, different materials are used as the solid-support
substrate. For example, silicon or glas substrates are usually used in DNA microarray
devices and carbon-paste or graphite, gold and glas are used as materials t'or the
electrodes in electrochemical sensors. Opticai sensors could use t'used silica as the optical
fibre. The surface plasmon resonance (SPR) method uses thin gold film as the solid
surface and the quartz crystal is the most often used one for piezoelectric sensors.
Therefore. different immobilization methods are applied to the type of substrate that'j
being used. Generally. the immobilization methods could be divided into the following
categories: adsorption. crosslinking and encapsulation. Avidin-biotin recognition and
covalent attachment.
1.4.1 Non-covalent Binding
Adsorption is the simplest method to immobilise DNA to surfaces. such as polyrner
films. carbon-paste or graphite electrodes, and metal oxide surfaces [12-151. The main
disadvantage of this method is that this kind of immobilization is not strong enough and i t
is hxd to quantitatively control the adsorption of the irnmobilized DNA probes. The
adsorption method is usually used in electrochemical sensors for the irnmobilization of
DNA sequences on the electrode surface with the aid of an electric potenticil. For example.
a direct detemination by adsorptive stripping square-wave voltammetry method has been

used by Joseph Wang and his colleagues [I6]. They used carbon-paste and glassy carbcin
as the electrode. After preconditioned at 1.7 V for 15s in a quiescent solution of the
nucleic acid, the ssDNA was accumulated from a stirred solution using a potential of
0SV. The voltammetric stripping step was performed with as positivc-,ooing square-wave
potential scan, using an amplitude of 4OmV a frequency of JOHz and a step of I5mV. The
detection limit can be as low as 25pg/L of ssDNA with the 'moving average baseline
correction'.
Crosslinking and Encapsulation method is mainly used with the aid of polymer films
[l7]. in this exampie, this process included an electrochernicüIly directed co-
polymerisarion of a pyrrole and oligonucleorides bearing on their 5' end a pyrrole moisty
introduced by phosphoramidite chemistry. The electro-controlled synthesis of the
copolymer (polypyrroie) gave a solid conducting film deposited on the surfxe of an
electrode. The resulting polymer consisted of pyrrole chains bearing covalently linked
oligonucleotide. The polymer growth is limited to the electrode surface. so that i t is
possible to preprtre a DNA matrix on a multiple electrode device by successive
copolymerisations. This method can achieve high Ioading amount of DNA sequences.
however, the DNA sequences immobilised Iack flexibility so that the hybridisation c m not
achieve high sensitivity.
Unlike the two methods above, the immobilisarion method based on
Avidinlsrreptavidin biotin recognition is still very popular [ 1 8-28]. Avidin and
streptavidin are large proteins (about 70kD), each containing 4 biotin binding sites. Biotin
is a smalI moiecule which attaches with very high affinity to the binding site. in this
method, the DNA sequences are modified with biotin at one end and the avidin is

adsorbed onto the substrate such as gold. With the combination of the avidin and biotin.
the DNA sequences could be immobilised easily due to the aqueous stability of avidin and
biotin. However. the size of avidin or streptavidin is too big. The four binding sites will
probably cause much non-specific recognition. Here is an example for this kind of
immobilisation. In the work of H. J. Watts et al [21] the surface was first coated with
Carboxymethyl dextran (CMD). After k ing washed with sodium acetate buffer solution.
the surface was activated with 1-theyl-3-[3-(dimethylamino) propyl] carbodiimdie (EDC)/
N-hydroxysuccinimide (NHS) in UHP water solution. Then streptavidin w u added and
the excess reactive ester groups in the CMD were deaccivated with ethanolamine. After
the non-covalent bound protein was washed out. the buffer was changed to PBS-T
(phosphate buffer saline-Tween 20) and the biotinylated modified oligonucleotide was
added.
1.42 Covalent Binding
1.4.2.1 Covalent Binding for Electrode
Compared with the other rnethods described above. covaIent binding is the most
popular method for the immobilisation of ssDNA on solid surface. People tried their best
to find different chemicai reactions to modify the surface as weII as DNA sequences.
Different solid surfaces are used for the different types sensor transducers. For example.
for glassy carbon electrodes, Millan and Mikkelsen [29] created carboxylate goups on the
surface by activating the electrodes in DEC (1-[3-(dirnethylamino) propyll-3-
ethylearbodiimide hydrochloride) and NHS (N-Hydroxysulfosuccinirnide) in phosphate
buffer (pH 6.9). Then the DNA could be coupled to the sudace through the amide bond

with the carboxylate groups. This reaction is reported to be selective for the
immobilization with deoxyguanosine (dG) residue. They also reported a similar method
for carbon pastc electrodes [30], which cornbined carbon powder. mineral oiI with stearic
acid as modifier. After packing the mixture tightly into an electrode hoIder. they
immobilised the ssDNA through dG residues on stearic acid modified electrodes.
1.4.2.2 Covalent Binding for Gold Surface
Another common example is the goId surface. The gold surface is of geat interest
because i t has found wide application in sensors associated with surface plasmon
resonance (SPR) and the piezoelectric phenornenon. The thiol-modified ssDNA can be
attached to gold surface directly by the goId-thiol bond [31. 321. For gold surface. many
scientists are also keeping on trying different chemistry to estabiish betrer system. Clair E.
Jordan et al [33] immobilised a ssDNA by setting up a three layer system. The first layer
is the MAU Iayers. made by imrnersing the gold film surface into 1 1 -mercaptoundecrinoic
acid (MAU) ethanok solution. The second Iayer, PL layer. was made by irnmersing the
frrst layer into the poly-L-lysine (PL) solution. And finally. the thio-modified DNA was
linked by the bifunc tional Iinker sulfosuccinimidyl4(N-rnaleimidometii y l) cyclohexane-
1-cûrboxylare (SSMCC), which contains N-hydroxysulfosuccinimide (NHSS) ester
groups to react with some of the free lysine residues on PL and malaimide functional
groups to react with the thiols in DNA sequences. The PL-MUA bi-layer was used ro
minimize the non-specific adsorption of DNA to the gold surface and improve the
detection signal. Another example is that Shuichiro Yamaguchi and Takeshi Shimomura
[3J] modified Au surface with (3-gIucidoxypropy1) trimethoxysilane followed by rinsing

with water to hydrolyze the epoxyring, fonning the Au-O-Si bond. The modified Au
surface is more hydrophilic than before treatment. The purified DNA was dissolved into
EDTAfïris solution. One electrode was in contact with EDTAfïrisIDNA solution, while
another one was kept in air. The adsorption, immobilization and hybridization can al1 be
detected by qumz crystal microbalance (QCM).
1.4.2.3 Covalent Binding for Silicon Wafers or Class Slides
Besides the surface types above, the silicon and silica are two other popular
materials thrit were used widely in biosensors such as optical sensors and DNA micro-
arrays. Although the silicon and silica substrates are di fferent, the chemical active groups
on these two kinds of materials are mostly the same. Usually. the siIicon surface wouid be
activated with Si-OH group, which is the same active group as the silica. The most
comrnon method is to use different kinds of silanes to react with the surface by torming
S i - O - S i bonds [35-401. Here are some examples: Yu-Hui Rogers and his colleagues
[37] used 1% 3-mercaptopropyl trïrnethoxysilane (MPTS). 95% EtOH solution as the
silane reagent for the g las slides. After silanization reaction. the disulfide-moditïed
oli_oonucleotides were immoblized onto the glas slides by the thiol disuifide exchange
reaction.

Silanization -Si-(CH&-SH 0\ (MPTS) Curing ~ t 0 ~ i ~ 0 ~ ~ ~ 4 . 5 ~ Nz or Vacuum -Si-ICHdJ-SH q
/ O 11
/ Class Slide
- pH 9.0 carbonate buffer
Fig 1.4 Attachment of oligonucleotides onCo a glass slide via disulfide bonds. [37)
Chrisey et al [38] used the commonly used trimethoxysilylpropyIdiethylenetriamine
as the silane. The silanized substrates were rnodified with N-(2-aminoethy1)-3-
aminopropyl trimeth y lenetriamine (EDA) followed by heterobi funcrional cross-lin ker.
succinirnidyl 4-[rnaIernidophenyll butyrate (SMPB), whose succinimide ester moiety
reacts with the primary arnino group of EDA. Then, the thiolated DNA oligomers can
react subsequentiy with the maieimide portion of the SMPB crosslinker. to yieId covalent
immobilizacion.

SMPB b
EDA- Modified Silicon Oxide
Fig 1.5 Chemistry used to covalently attach thiol-modified DNA oligomers to aminosilane-treated surface. [38]
J.P. Cloarec et ai 1391 studied two different methods. One was to use
aminopropyltriethoxysilane (APTS) to finish the silanization of the substrate followed by
coating of brominated oligonucleotides on the aminosilane layer. The other method was to
use glycidoxypropyltriethoxysiIane (GPTS) as the silane and react the oligonucleotide
bearing an aminolinker at the 5' end with the surface. They found that the GPTS method
yielded dense and robust immobilization of oligonucleotides on the Si/SiO7 substrate and
was a better method towards obtaining reproducible sensors.

Pimng, et al [40] synthesized three different silanes: A. N-(3-
Diethoxymethylsilylpropyl) bromoacetamide, B. N-(3-Dimethylethoxysilylpropyl~
bromoacetamide, C, N-(4-DiisopropyImetfioxy-silylbutyl) bromoacetamide. After
silanization, oligonucleotides bearhg 5'-phosphorothioates and 3'-fluorescein were
immobilized ont0 the surface with the bromoacetamide groups on the surface and were
imaged with a confocal fluorescence micrograph.
Another way [3 1,411 for DNA immobilisation on silicon surface is to deposit a thin
layer of gold on the silicon surface. Then, the immobilisation methods for gold surfice
could be applied to this surface.
1.4.2.4 Covalent Binding for Optical Fibres
For optical fibres, we can use same methods to immobilise DNA sequences ris those
that could be used on silicon wafers. Optical fibres have one more advantage in thüt after
modification, single strand DNA sequences could be synthesised on the surface directIy
and hybridization events may be detected by the use of the fluorescent DNA m i n
ethidium bromide (EB). which is known to intercalate into double strand DNA. For
example. Uddin et aI [42] functionalized the fibres and gel with 3-
glycidopropyltrimethoxysilane (GOPS), followed by monotritylated hexaethylene glycol
(DMT-HEG) in xylene containing a catalytic arnount of sodium hydride at 40°C. Silica
.el samples were taken from the reaction mixture to determine the loading of DMT-HEG C
to indicate the loading on the activated fibres. After the fibres were dried by P2OS
overnight, the secondary hydroxyl groups produced afier reaction of the HEG Iinker with
the expoxide moeieties and ail other silanok were capped via treatment with trimethylsilyl
chloride in pyridine under argon gas at arnbient temperature for 16 hrs. followed by
treatment with acetic anhydridehi-methylimidazole/collidine in THF to prevent unwanted
oligonucleotide growth at these sites. Then, after witshing, the functionalized DMT-HEG-
GOPS fibres were placed in Applied Biosystems Synthesis column and capped with acetic
anhydride prior to DNA synthesis. The detritylation, activation of phosphoramidites were
achieved by DNA synthesizer. This derivatized surface consists of hydrophilic. long chain
spacer arrn with a DMT-protected hydroxyl terminus onto which oligonucleotides may be
assembled via solid-phase phosphoramidite synthesis. This linker is stable to
oligonucleotide deprotection condition and provides a fluid environment which hcilitates
hybridization between immobilized DNA and target DNA in solution [43].
Piunno et al [JJ] also activated optical fibre surfaces using y-
arninopropyltriethoxysilane (APTES) with long chain aliphatic spacer molecules
terminated with 5'-O-dimethoxytrityl-Tdeoxythymidine nucleoside. Then the ssDNA
could be immobilised covalently on the rnodified surface directly with an autornated solid-
phase DNA synthesiser with highly specific orientation.
in ail. adsorption. affinity of avidin/screptavidin with biotin and organic reactions are
al1 widely used methods for DNA imrnobilization on different kinds of surfaces. More and
more new methods both in finding new organic materials suitable for sensors [JS] and
new synthesis methods have been developed for the DNA immobilization. However. the
existence of non-specific adsorption and poor reproducibility are still big problems for
each method. Some work [46-501 reported that it is the poor reproducibility of S u S i
bond on silicon surfaces that caused the poor reproducibility of the imrnobilization.

Therefore, the alternatively stronger bond Si-CCi was studied to functionalize the
surface.
Strother et al [46] used UV irradiation to react the hydrogen-terrninated Si ( L I l )
surface with o- undecylenic acid rnethyl or trifluorotheyl ester (UDA) to fom a thin film
of the ester applied to the surface.
SSMCC
PL
UDA
Fig 1.6 Drawings illustrating the chemistry employed for preparation of the rnodifwd Si(ll1) surface[46].

Hydrolysis of the ester by treatment with potassium tert-butoxide in DMSO yielded
a carboxylic acid-modified surface. Subsequent addition of poly-L-lysine (PL) and
reaction of the lysine E-arnino groups with the heterobifunctional cross-linker SSMCC
resulted in a rnaleimide-activated surface that might then be coupled in aqueous solution
with a thiol-modified oligodeoxynucleotide to yield the DNA-modified surface.
1.5 Characterisation of Silicon Surface with DNA Probes.
To improve understanding and control of immobilisation and hybridisation
procedures to build up a DNA sensor, much research work has been done to characterise
the surfaces chat are covered with immobilized DNA probes. A rnonolayer of DNA probes
on a surface are in the form of a layer about 40A-IOOA thickness. For quantitative
determination of surface composition or surface identification. the most cornrnonly uscd
surface characterisation techniques include X-ray photoelectron spectroscopy (XPS) [3 1 ,
36. 5 11, radio-labelling methods [37-39,521. and fluorescence detection [36, 37,401. XPS
is a powerful surface analysis too1 to find the eIemental composition of the surface. Radio-
labelling and fluorescence detection cm give surface coverage information to show the
packing density of the immobilised DNA probes. In order to tind the film thickness and
characterize the film on the surface, some methods such as ellipsornetry [31, 51. 531.
angle-resolved XPS 1531, MALDI-TOF m a s spectrometry [35], surface Raman
spectroscopy [54], surface FTIR [54], and atomic force microscopy (MM) [36. 55. 561
are aIso applied. In Herne md Tarlov's work [31], ellipsometry was used to measure a
DNA layer of about 30A thickness, frorn which the authors could deduce whether the
DNA sequences were packed vertically or horizontaily. The principle of angle-resolved

XPS will be explained in detail in the following part. It can be seen in the work of Kallury
et al [53], that if a sample is measured at different angles by XPS. the film thickness on
the surface can be calculated by mathematical equations, one of which is shown below.
By comparing with the results from ellipsometry, they concluded that a fairly accurate
film thickness measurement of monolayer silane films could be achieved with the
following equation.
where K is a normalisation paranieter. A is the attenuation length of the Si(3p) elecrrons
passing through the silane overlayer under investigation. and 8 is the take-off angIe
measured with respect to the surface plane. This equation could be applied for the
calculation of the thickness of the silane overlayer either at one angle or by rinzular
dependency studies.
The MALDI-TOF mass technique enabled the separation and detection of a mixture
of biomolecules in a fraction of a millisecond without gel electrophoresis and labelling. In
the work of Donnell et al [35], MALDI-TOF mass was used to detect DNA sequences
immobilised on the surface and hybridised with the immobilised probes by identifying the
characteristic moIecular ion peaks. The method could only be used for high-density
coverage surface and has an advantage of a few orders of magnitude higher analysis speed
than traditional Sanger sequencing method.
In Wang and Wunder's work [54], surface Raman spectroscopy provided
information on the intra-chah order, that is, the ratio of vans to gauche bonds in the alkyl
chah on the surface, as well as evidence of inter-chain packing. It was also used to
sirnultaneously determine the lateral packing and conformationai order of alkyl chains

attached to a furned silica surface. Surface FT-ER spectroscopy provided information on
the hydration state of fumed silica.
Atomic force microscopy ( M M ) is an emerging technology that has been used for
imaging DNA sequences that are adsorbed onto a surface. dlowing direct visualisation of
DNA modification on the surface. Under most typical irnaging conditions. the AFM
resolution is about 2-20nm. which was high enough for imaging DNA sequences on the
surface, The measured contour length determined from AFM images corresponds to the
length of the DNA, as defined by the number of base pairs. In the report of Fang, Spisz. et
al [ 5 5 ] , a DNA sequence containing 250rner was imaged with AFM. They found that
many divalent metai ions. which could be used to assist the adsorption of DNA onto mica.
would affect the rneasured Iength of the DNA in AFM images. For example. for the same
250bp DNA sequence. Mn (IT) produced the Iength of 86nm and Ca (11) only 54nm.
in the research work of Lenigk et al [36], four different surfaces: cleaned surface.
Silicon with self-assembled MPTS layer. surface with imrnobilised oligonucleotide probe.
and surface after hybridisation to a compIementary target were al1 characterised with
AFM. The DNA sequences used for their experirnent were about 16 mer. Al1 of the
surfaces showed large differences, as shown in Figl.7.

Fig 1.7 Atomic force microscopy of siücon chip surfaces: (a) cleaned, rehydroxylated silicon surface; (b) self-assembleci MPTS layer on silicon; (c) immobilized DNA probes; (d) surface after hybridization [36]
Besides these techniques that are commonly used, some other indirect methods
and new techniques regarding surface chanctensation have also been reported. In
Watterson's work [57], the thermal stability of the duplexes was studied to find out the
effect of oligonucleotide immobilisation density on the selectivity of hybridisation. The
thermal stability of the double helix was measured by means of the melting temperature
(Tm), which is defined as the temperature at which half of al1 duplexes originally formed

are denatured into the single-stranded state. Their results showed that the thermodynarnic
stability of duplexes that are immobilised on a surface is dependent on the density of
immobilisation. Additionally, the deviation in Tm arising from the presence of a centrally
located single base-pair mismatch was significantly larger for thermal denaturation
occumng at the surface of optical fibres relative to that observed in bulk solution,
suggesting that the physical environment of hybrids formed at a solid interface was
significantly different from that of hybrids formed in bulk soiution. In Cheran's work [58].
the new modified scanning Kelvin microprobe, which is capable of the tandem
measurement of contact potential and surface topography with resolution of ImV and
lOnm respectively, was described for the application in monitoring surface chemical
changes, especially for situations involving the immobilisation of oligonucleotides. This
technique measures the work function, which is a very sensitive parameter that could
refiect imperceptible structural variations, surface modiFication. contamination or other
surface-related processes. Compared with many other methods, the measurement of work
function does not depend on an estimation of the electron reflection coefficient on the
surface. Moreover, the technique does not use raised temperature, high electric fields. or
beams of electrons or photons. Being a non-contact and non-destructive method. it does
not pose the risk of desorbing or removing even weakly-bound species from the surface.
Their preliminary work in this paper suggested ihat this technique has geat potential in
the study of biocompatibility, macromolecular structure and microamy devices.
The techniques invoived in this research work inchded XPS, angle-resolved XPS,
radio-labelling method and ellipsometry. Their pinciples of operation and detailed
description follows.

1.5.1 Introduction of XPS method[59]
X-ray photoelectron spectroscopy (XPS) is also called electron spectroscopy for
chemical analysis (ESCA), which is the most widely used contemporq surface
characterisacion rnethod. Compared to other surface analysis techniques, it is highly
informative and has solid theoretical basis.
In the XPS experiment, the surface to be analysed is placed in a vacuum
environment and irradiated with X-ray photons. The atoms cornprising the surface emit
electrons (photoelectrons) after direct transfer of energy from the photon CO core-level
electrons. These emitted electrons are subsequently separated according to their energy
and are counted by the detector. The kinetic energy of the photoelectrons to be detected is
equal to the difference of the energy of incidence of X-ray photons and the binding rnergy
of the core-level electrons:
The binding energy could provide useful information about the electrons' ritornic
and rnolecular environment so that it makes the XPS a powerful tool for the qualitative
analysis. In addition, the number of electrons emitted is related to the concentration of the
ernitting atom in the sample, and thus, the quantitative analysis could be achieved by
detemiining the emitted electrons.

fi Oxygen atom
photon h v
Fig. 1.8 (a) A surface irradiated by a X-ray photon source of sufficiently high energy will emit electrons. (2) The X-ray photon transfers its energy to a core-level electron imparting enough energy for the electron to leave the atom (591
The instrumentation of XPS includes the vacuum system, X-ray source. eleccron
energy analyser and data processing system. The vacuum system provides ri vacuum
environment for X-ray photons, the sarnple and the emitted photoelectrons. This vacuum
environment is very important because withuut it, the emitted photoeiectrons could lose
energy through possible collision with atoms on their way to detector. In addition. the
vacuum environment could also help to avoid contamination of the sampie. There are two
vacuum chambers. one is the analytical chamber and the other is the transfer chamber.

The sarnple holder is in the analytical vacuum chamber and the holder's position could be
adjusted according to the requirement of the analysis. The X-rays for XPS experiment are
usually produced by impinging a high-energy (- 10 KeV) electron bearn on an anode. Core
holes are created in the anode, which in tum emits fluorescence X-ray that is used in XPS
experiment. A specific fluorescence line is used instead of the background emission since
its intensity is several orders of magnitude higher. Thus, the incident X-ray energy is fixed
for each anode. Most spectrometers use only one or two anodes. with Al and Mg being the
rnost cornmon. The electron energy analyser systern consists of three components: the
collection lens to collect photoelectrons, the energy analyser, and the detector. The most
comrnon type of energy analyser used for XPS experiment is the electrostatic
hemispherical analyser. As for data processing system. the modern computer provides
powerful means both for controlling instrument operation and performing data analysis.
XPS is an information-rich method. In the outermost lOnm of a surface. XPS cm
provide identification of almost al1 elements (except H and He) present at concentrations
>O. 1% atomic percent. which is the most basic qualitative and quantitative information
XPS analysis will provide of a surface. By changing the angle of detector to the surface.
the distance for eiectrons to escape wiII change too. This distance is called electron escape
depth (A). As shown in the figure below. changing the angel from O to 45". for example.
the depth from which emitted electrons could escape under the surface would become
much less. Therefore, increasing the incident angle of X-ray photons, which is generally
achieved by changing the angle of sample holder, the more surface sensitive data could be
obtained. And also, by this way the film thickness could be calculated by changing the
positions to severai different angles.

Fig 1.9 The relationship between the escape depth and the incident angle.
More sophisticated application of this method yields more detailed information
about the chemistry of surface, such as molecular environments, including oxidation state.
bonding atorns, aromatic or unsaturated structure. It also can provide information about
the surface morphology such as (1) non-destructive elemental depth profiles IOnm into the
smple and surface heterogeneity assessment. (2) destructive elemental depth profiles
seved hundred nanometers into the sarnple using ion etching rnethods,
1.5.2 Introduction of Radio-labelling Methods.
"P Radio-labelling method is another important method used in this work to
characterise DNA probes on silicon surfaces. With T4 polynucleotide kinase, there are
two different wnys to attach the radio-active "P onto the 5' of DNA. RNA and
deoxyribonucleoside triphosphates. They are called forward reaction and exchange

reaction. "P is in the form of [y-32p] ATP. T4 polynucleotide kinase was the product of
the phage T4 pseT gene. It was originâlly purified from TJ-infected E. coli cells.
Recently, the pseT gene has been cloned into E. coli, so chat the enzyme could be
overproduced from this strain.
( 1) Forward Reaction[M)]
In order to label the 5' with forward reaction. the 5' of DNA or RNA must be
transformed to a hydroxyl group first. Enzymes such as bacterial alkaline phosphatase
(BAP) frorn E. coli or calf intestine phosphatase (Cil?) from veal can be used to catalyse
the hydrolysis of 5'-phosphate residues from DNA or RNA. Both of the phosphateases
require ~ n " for activity. The primary difference between them is the stability of the two
enzymes. CIP is readily inactivated by heating to 70°C for IOmin or extraction with
phenol. On the other hand, BAP is much more resistant to these treatments. Thus. for most
purposes. CiP is the enzyme of choice. Furthermore, CiP has a 10- to 70- fold higher
specific activity than BAP.
After hydroxyl group transformation. in the fonvard reaction. the T4 polynucleotide
kinase catalyses the transfer of the terminal phosphate of ATP to the 5'-hydroxyl termini
of DNA or RNA as shown in Fig 1.10 below. This reaction is very efficient and hence is
the general method for labelling 5' ends of oligonucleotides.

5' - -c.cii
5' reaissed - 5' OH-OH y WPIATP p p , OH 3' 3' O H O H 5' '.' OH-op 5'
ss or ds DNA or RNA
Fig 1.10 Forward reaction of T4 PNK cntalysed 3 2 ~ radio-labelling method. [60J
(2) Exchange Reaction[60]
In the exchange reaction, T4 polynucleotide kinase was also used as the catalyst. In
this reaction, the 5' terminal does not need to be hydrolyzed. This reaction requires an
excess of ADP. The 5'-terminal phosphate is transferred to ADP to produce ATP and is
subsequently rephosphorylated by the transfer from the y phosphate of [-p32p] ATP. ris
shown in Fig 1.1 1. This exchange reaction is less efficient than the forward reaction; thus
it is not as popular as the fonvard reaction.

DNA w RNA
Fig 1.11. Exchange reaction of T4 PNK catalysed '*P radio-labelling method. [60]
In Our woik, the DNA sequences were synthesised by DNA synthesiser. After de-
protection. the 5' of DNA was already reduced to hydroxyl group. Therefore. they couId
rerict with ~. j -~ '~] ATP and T4 PNK with the forward reaction method directly without
hydrolyzing the 5' of DNA.

1.5.3 Introduction of Ellipsometry
Ellipsometry is a sensitive optical technique for determining propenies of surfaces
and thin films. if linearly polarized light of a known orientation is reflected at oblique
incidence from a surface, the reflected light is ellipticdly polarized. The shape and
orientation of the ellipse depend on the angle of incidence. the direction of the polarization
of the incident light. and the reflection properties of the surface. The polarization of the
reflected light can be measured with a quarter-wave plate followed by an analyzer: the
orientations of the quarter-wave plate and the analyzer are varied until no light prisses
though the analyzer. From these orientations and the direction of polarization of the
incident light, the relative phase change, A. and the relative amplitude change, iy,
introduced by reflection from the surface cm be calcuiated. Fig 1.12 is a diagram for
Nulling ellipsometer.
If the sarnple undergoes a change, for example a thin film on the surface changes its
thickness or chemical composition. its reflection properties will also change. Therefore.
measuring these changes in the reflection propenies could allow us to deduce the actual
change in the film's thickness.

Fig 12 .4 schematic diagram of a nulling ellipsometer with the quarter-wave plate placed before the light is reflected from the sample. L: the light source (usually a low power He-Ne laser); P: the polarizing prism; Q: the quarter- wave plate compensator; S: the sample under study; A: the analyzer prism: D: the light detector.
As shown in Fig 1.12. with a nulling ellipsorneter, the orientations of the polanzer.
compensator and analyzer are adjusted so that the intensity of the light reaching the
detector is zero. There are many settings of the polarizer and cornpensator that can
accomplish this. Nevertheless, if we set the compensator at either +45 degrees or 4
degrees, with a few exceptions such as reflection from a highiy anisotropic sample. we
will still be able to find a nul1 in the light intensity after it passes through the analyzer by
varying only P and A. The advantages of setting Q at L45 d e p s are: (a) the amplitude of
the component of the Iight incident on the sample that is polarized in the plane of
incidence is always the same as that for light polarized perpendicular to the plane of

incidence. independent of the polarizer setting; these two incident poiarizacions only differ
in phase. (b) The Jones calculus equations used to describe the polarization of light as it
travels through the ellipsometer simplify considerably with Q-45 degrees. Thus in
practice a fixed-compensator at Qd45 degrees is used and the settings of the polrtrizer
and analyzer are varied until a nul1 is obtained.
The most important application of ellipsometry is to study thin films. In the context
of ellipsometry. a thin film is one that ranges from essentially zero thickness to several
thousand Angstroms. although this range can be extended in sorne cases. If a film is thin
enough so that it shows an interference colour, it will probably be a good ellipsometric
sample. The sensitivity of an ellipsometer is such that a change in film thickness of a few
Angstroms is usually easy to detect. The samples for ellipsometry should have a srnaII tlat
polished area that specularly reflects the incident light. Careful sample preparation is an
imponant factor in obtaining consistent. reproducible. and meaningful ellipsometric data,

1.6 Research Objectives
Although DNA sensors for sequencing have promising applications. there are still
some serious problems that may hinder their development. For example, from the
previous work by other researchers, it was found that when using covalently immobilized
DNA, the addition of complementary DNA would result in hybridization but would aIso
ieave much of the target physically adsorbed at the same time. The adsorbed material is
very hard to rernove [31] and sometimes it also gives signal. interfering with the real
detection. Without solving these problems, it is not feasible to apply this type of method in
practical analysis of DNA sequences to treat genetic diseases. Therefore. detailed study of
characteristics of DNA probes on the surface would be very necessary. If we know how
the DNA strands were on the surface after immobilization and how the way they wrre
there would affect the hybridization, we could probably figure out some of the reasons for
those probIems and find a better way to control them. The reproducibility would improve
greatly too.
In order to characterise the immobilization of DNA probes. a relatively
reproducible systern is required. Therefore, the first objective of this work is to establish
one relatively stable system by finding out the function of different factors and their effect
on the system. Then, characterization work would follow within this system. In this part,
we will try to find out the film thickness by which we can estimate how the DNA strands
are immobilized and onented on the surface, vertically, horizontally or some other way.
We also wi1I try to study the effect of packing density and DNA sequence len,gh on
immobilization and hybridization because that could provide rnuch indirect information
about the surface characteristics and hybridization mechanism.
2.1 Materials and Reagents
Reagents for TTU Synthesis: o-undecenyl alcohol 98%. potassium thioacetate
98%. trifluoroacetic anhydride 99+%, trichlorosilane 99% and hydrogen
hex;tchloroplatinate (IV) hydrate 99.995% were obtained from Aldrich (Oakville ON.
Canada) and were used as received. Triphenylphosphine 98% N-bromosuccinimide
(NBS) 98%. sodium hydroxide. potassium hydroxide, hexane. isopropanol were
purchased from ACP (Montreal QC, Canada) and were used without further purification.
fyridine was obtained from ACP (Montreal QC, Canada) and was distilled over KOH
before use.
Reagents for Radio-labeling Experiment: Radio isotope [.i- ' '~] ATP was obtained
fom Mande1 (Guelph ON, Canada) and Perkin-Elmer (Woodbridge ON, Canada) and was
used as received. T4 polynucleotide kinase and 1xT4 polynucleodie kinase buffer were
obtained from New England Biolabs (Mississauga ON, Canada) and were used as
received. The enzyme was obtained by an E. coli strand that carries the cloned T4
polynucleotide kinase gene from bacteriophage T4(1) cloned into pUC19 and supplied in
50mM Tris-HC1 (pH 7.41, O. lmM EDTA, 1mM DR, O. I pM ATP and 508 glycerol.
Anhydrous ethyl alcohol for molecular biology, NaOAC for molecular biology.
Chloroform 99+% for molecular biology, and phenoi: chloroform isoamyl alcohol
2524: 1, which was saturated with lOmM Tris pH 8.1 ImM EDTA for molecular bioIogy
were al1 purchüsed from Aldrich (Oakville ON, Canada) and used as received.

Other Reagents: Spectrograde Chloroform, Spectrograde Methariol, Benzophenone
and RSO, were obtained form Aldrich (Oakville ON. Canada) and used as received.
KydroxyIammonium chloride was obtained from ACP (Montreal QC, Canada) and was
used as received. Toluene was obtained from Aldrich (Oakville ON. Canada) and was
dried by distillation with sodiurn/benzophenone under nitrogen inert atmosphere. H.0:
(30%) was obtained from Chernical Stores of Chemistry Department, University of
Toronto.
Substrate: The substrates used were <!OC)> silicon wafers obtained from
International Wafer Service (Portola Valley Ca, USA). The silicon wafers were about
400-450 pm thick and cut to about lcmxlcrn squares. The mirror side w u used for
experiments.
DNA sequences:
Z 1 : 5'-AGC TGA CTA GCT ATG CGX-3'
Z I C: 5' -AGC TGA C'FA GCT ATG CG-3'
Z l com: 5' -TCG ACT GAT CGA TAC GC-3'
22: 5'-CAG GTG CAA TCG CI% ACG TAC GCT ATX-3'
22com: 5'-GTC CAC GTT AGC GAG TGC ATG CGA TA-3'
23: 5'-GCT ACX-3'
Z3com: 5'-CGA TG-3'
24: 5'-AAA AAA AAA AAA AAA X-3'
Z4C: 5'-AAA AAA AAA AAA AAA-3'
Z5: 5'-CAG GTG CAA TCG CTC ACG ATA GAA GTC TAC GCG TCX-3'
ZScom: 5'-GTC CAC GïT AGC GAG TGC TAT CTï CAG ATG CGC AG-3'
Z6: S'-TAC CGC GAT CX-3'

Z6com: 5'-ATG GCG CTA G-3'
X is the modification group of -(CH,)$% at 3' of DNA sequences. Al1 of
sequences above are from the Center for Applied Genomics, Hospital for Sick Children.
2.2 Synthesis
As shown below. 1 -(Thiotrifluoroacetato)- 1 1-(trichlorosi1yl)-undecane (TTU) wrts
synthesized according to the work previously described by our group 1611. Due to the
large amount requirement of "iW in the following research work. al1 the compounds
during the synthesis procedure were al1 scaled up to double amount.
Fig 2.1 Synthetic pathways to TTU [611
The NMR (400 MHz. CDC1,) data of products in each step are as follows:
(2) ~Undecenyl Brornide: 'H 65.79 (IH, dddd, J=17.2, 10.2,7.0,7.0 Hz), 4.93 (2H, ml,
3.38 (2H, t), 2.02 (2H, dd, J=6.2, 1.1 Hz), 1.83 (2H, m), 1.24-1.44 ( 12H, m)

(3) w-Undecenyl Thioacetate: 'H 65.79 (lH, dddd, J=17.2, 10.2. 7.0, 7.0 Hz), 3.93 (2H,
m), 4.93 (2H. m), 2.85 (2H, t), 2.35 (3H, s), 2.02 (2H, dd, J=6.2. 1.1Hz). 1.55 CH, m).
1.24-1.4 (12H. m)
(4) ~Undecenyl Thiol: 'H 65.79 (IH, dddd, J=17.2, 10.2. 7.0. 7.0 Hz). 4-93 (2H. rn).
2.52 (ZH, dd, 8.0,4.0). 2.02 (2H, dd, J =62, 1. [Hz), 1.57 ( I H, t). 1.24-1.44 (12H. m)
(5) w-Undecenyl Thiotrifluoroacetate: 'H 65.79 (IH, dddd, J=17.2. 10.2. 7.0, 7.0 Hz).
4.93 (2H. m), 3.05 (2H. t), 2.02 (ZH, dd. J=6.2, 1.1 Hz), 1.55 (2H. rn), 1.74-1.44
( 12H, m)
(6) l-(Thiotrifluoroacetato)-1l-(Trichlorosilyl)-Undecane (TTU): 'H 6 3.05 (2H.t).
1.20-1.80(20H, m): "C 6 184.90, 115.53, 3 1.82, 29.45, 29.35, 29.30. 79.00. 78.97.
28.68. 28.63.24.32.22.28; "si 6 13.32
The NMR data are consistent with those reported [56], and confirmed the correct
products of the synthesis of TTU in each step.
Oligonucleotides were synthesized at The Center of Applied Genomics. Hospital for
Sick Children. University of Toronto, by using standard CE phosphoramidite chemistry.
The oligonucleotides were purified using standard procedures with Poly-Pak cartridges.
2.3 Instrumentation
NMR spectra were reported in units of 6 and were recorded on a Varian VXR4OOS
spectrorneter ('Hl "c, "si) using a Smm switchable probe. In the case of "si. either
inverse-gated decoupling or DEPT were used. The sarnples were dissolved in CDCI,
which contained 0.03% TMS. Both 'H and "Si NMR spectra were referenced to TMS at
O.ûûppm, while "C NMR spectra were referenced to the center of the CDCI, triplet at
77.ûûppm.

X-ray photoelectron spectroscopy (XPS) was used to characterize the surface
eIementaI composition. The instrument was a Leybold MAX-200 spectrometer with a Al
K, source run at 15kV and 20mA. The energy scaie of the spectrometer was calibrated to
the Cu 3p and Cu 2p, peaks at 75.leV and 932.7eV. respectively. The binding energy
scale was calibrated to the main C (1s) feature at 285.0eV. For al1 samples. ri survey was
run from O to IOOOeV dong with the low resolution scans of the relevant regions. Each
sample was anajyzed at a 20 degree angle relative to the electron detector using an X-ray
spot size of 4x7 mm. Satellite subtraction and data normalization were performed with
software obtained from the manufacturer. Quantitative calculation was done using the
Matlab program with the empiricaily-derived sensitivity factors: C 1 s=û.X. O 1 s=0.75,
Nls=OSI, Si2pd.36. S2sd.41 and Fls=I.ûû.
The film thickness was measured with Auto EL-HP 85 Ellipsometry from Rudolph
Research at h=6328A, 0=70 and lower film index is 1 S00.
Radiochemical scintillation counting was examined with a Beckman LS 6000IC
automated counter using a standard "P detecting program.
2.4 Procedures
Cleaning of Substrates Each silicon wafer was soaked in Orvus soap (Chemical
Stores of Chemistry Department, University of Toronto) solution individually for 10
minutes. After k ing transferred to a fresh Orvus soap solution they were sonicated for
additional 10 minutes. Each wafer was then washed with large amount of double distilled
water followed by being boiled in piranha solution (30% '00,: KSO, 3:7 by vo1ume) for
30 minutes. After cooling, the substrates were washed with large amount of double
distilled water, 18MR water three times and then with spectrograde methanol three times.

Substrates were dried in an oven at 120°C for 2 to 3 hours. After cooling under nitrogen.
they were immersed into 2rnl toluene individually, which contained controlled arnount of
water and left ovemight.
Silanization and Deprotection of Substrates The hydrated substrates were
removed from toluene and put into 0.8% (v/v) 1 -(Thiotrifluoroacetatol- I I -(trichlorosilyl)-
undecane (TTU) in dry toluene for 2 hours in a low-moisnrre glove box. After the
silanization reaction, the substrates were washed with dry toluene and spectrograde
chloroform and then were dried under nitrogen. Before the immobilization reaction was
initiated, the thiotrifluoroacetato group in TTLJ needed to be reduced to free thiol group by
immersing the TTU covered siticon wafers into 0.5 M hydroxylamine solution (adjust pH
to 8.5) and sonicating for 0.5 hour. Both the silanization and deprotection results were
confirmed by XPS.
Immobilization of DNA Sequences on Substrates ''P radio-labeled DNA strands
were mixed with identical non-labeled DNA strands at a ratio of about 1:100 by mole
number. 80pI of this DNA mixture solution was put on top of each silicon wafer with
deprotected TTU. The reaction was done at room temperature and lasted for 2.5 hours.
After the reaction was completed. the wafers were washed with different solution. which
will be described in the Discussion section. Then al1 the wafers were put into 5ml
scintillation liquid. 10 pl of the same DNA mixture solution was also put into 5ml
scintillation liquid. The scintillation counting result from the silicon wafers could be
convened to the amount of DNA immobilized on the siIicon surface by cornparing with
signal from a known amount of "P labeled DNA in 10p1 of the soiution-

Hybridization of Substrates DNA solutions containing radio-labeled and non-
ltibeled sequences (around 1:Iûû by mole nurnber) were made the same way as in the
immobilization step. 80pl of complementary strand of the immobilized probe and non-
complementary control were put on the top of different substrates individually. The
hybridization reaction was also cmied out at roorn temperature for 2.5 hours. The
scintillation counc was obtained and converted to the amount of DNA the sarne way as in
the immobilization experiment.
Radio-labeling Expriment DNA solutions were prepared at suitable
concentration so that 6p1 solution contained more than 200pmoI DNA molecules. To this
6p1 solution were added 2 pI T4 PNK 10x buffer and 2 pl TS PNK so that the total
volume of this mixture was 10 pl. To this 10 pl mixture, 10 pl of [A-"PI ATP was added
and the final 20 pl mixture was incubated at 37 "C for 30 minutes. After 30 minutes. 160
pl double de-ioned water. 10pl 3N NaOAC and 200 pl mixture of phenol/chloroform/
isoamyi alcohol were added to the 20pl solution. After mixing and centrifuging for 15
minutes at 4°C. rhe aqueous layer (upper layer) was extracted to a new vial and 200~1
chloroform was added to remove traces of phenol. After mixing and centrifuginp for 5
min at 4"C, the aqueous Iayer (upper layer) was removed again to a new vial. 600~1 cold
ethanol was added to the aqueous layer and the viaS were put on dry ice for ai least 60
minutes followed by centrifuging for 30 minutes at 4°C. The ethano[ was pipetted out.
Ieaving the pellet intact. 2ûûpi 70% ethanol then was added and centrifuged for another
15 minutes at 4T. The etfimol was pipeued out again, leaving the pellet intact. Finally.
the vials were covered with paper towel until dry. The radio-labeled DNA could be re-
suspended in I00pi buffer.

3. RESULTS AND DISCUSSION
As shown in Fig 3.1, The whole work could be divided into five parts: washing.
silanization, deprotection, immobilization, and hybridization. In order to make it clear, we
will discuss the results according to these five parts.
Süanization with R U
1 Deproteciion
Fig 3.1 Schematic graph of the whofe procedure of the surface modification, DNA immobilization and DNA hybndization.

3.1 Surface Functionalization through Silanization
Silanization is the most commonly used method to generate functional groups on
materials such as silicon, silica and glass. There are many kinds of silane being used.
Those that have the reactive trichlorosilyl group can form more stable monolayer silane
films through three Si-O bonds on the surface, rather than other silanes such as
dichloromethylsiane or chlorodimethylsilane fonning only one or two Si-O bonds. In this
work. 1-(thiotrif1uoroacetato)-1 1-(trichlorosilyl) undecane ('TTU) is used. which has a
rrichlorosilyl group, and was synthesized previously by our group. The fluonde in T T is
very sensitive for XPS determination by which the result of silanization couId be
determined.
Before silanization, the silicon wafers need to be washed extensively. The washing
step is very important. Research h a shown [62, 631 that a good wrtshing rnethod for
silicon surfaces could provide three advantages: ( 1 ) to remove the contamination on the
surface. (7) to generate a layer of hydroxyl groups on top of the surface to react with the
trichlorosilyl group, (3) to keep a certain arnount of free water on the surface to initiate the
silanization reaction.
Here in this work, with the reference of previous work 1631, five washing methods
have been tned and compared. In rnethod 1, the silicon wafers were first washed with
Orvus soap followed by chloroform. After being dried, they were put into 308 H.0. A -
solution and sonicated for 30 min. Then, they were put into the oven at 130°C- 150°C for
60min followed by standing in a hurnidity chamber with water saturated Ca(NO,),
overnight. Method 2 used chloroform to wash out the organic contamination on the silicon
wafers first Then, they were sonicated in the washing solution which was made up of
NH,OH: 30WL0,: - - NO - (1: 1:4, v/v) for 30min. After washing with large amount of water.

they were put into the oven for 5min at 130°C-150°C. Method 3 and method 3 have the
same protocols as method 2 except for the washing solution. Method 3 used HCI:
309bH.O.: - - i-LO - ( 1 : 1 :4, v/v ) as washing solution and method 4 used HSO,: 30%KO.: - - H.0 -
(1 : l:4, V/V) as washing solution. In method 5, the silicon wafers were washed with Orvus
soap solution followed by boiling in Piranha solution (WO,: 30%H.O, - - 7:3 by volume)
for 30 minutes. After rinsing with water. 18MQ water. and spectrograde methanol. the
silicon wafers were dried in the oven at 130°C-150°C for two to three hours. Then the
completely dried silicon wafers were put into dry toluene with controlled amount of warer
ovemight. From the silanization results after different washing methods. it was found that
method 2 and method 5 achieved similar results in better surface silane coverage than
other methods and method 5 gave better reproducibility.
Pvlany studies [64-661 have found that the density of silane film deposited on silicon
or ,olass was determined by silane hydrolysis with free water on the surface prior to
silanization. Therefore. the water amount on the surface would affect the silanization
greatly. Less water led to incomplete monolayer formation while too much water would
lead to overpolymerization in the bulk solution so that it would reduce the effective
amount of silane. giving a poor surface coverage of the silane film. Therefore. control of
the free water on the surface i s a key factor to achieve reproducible results. With method
5. it was easy to control the amount of water on the surface. The relation between the
amount of water and the silanization results is shown in Fig 3.2. The values in the figure
were the average of six samples and the RSD is below 17.3%. The surface water amounr
w u controlled by adding different volume of water into the dry Toluene, into which the
wafers were soaked ovemight. The silanization results were characterized by the fluoride
signal in TTU molecules from XPS determinations.

XPS signal
OUI 15ul 30ul 45ul 60ul
Water in 25ml Toluene
Fig 3.2 Water control on silicon surface in washing step.
From Fig 3.2 it can be seen that the amount of water on the surface affects the
silanization results. With the amount of water lower than 15pl in 25ml dry Toluene as the
solution for the hydration of the silicon wafers. the surface could reach the highest relative
coverrige by silanization. Howevet if the water mount was higher than that amount. the
fluoride signal becarne much lower with the increase of the water amount. From the
experiment, it was also found that too small an amount of water could also decrease the
silane on the surface. Therefore, the 1 5 ~ 1 water in 25ml dry Toluene (0.06% by volume)
was chosen in al1 following experimentation.
After washing, the surface will have a full layer of free hydroxyl groups ready for
reaction with the silane. Then, with the uichlorosilyl group, TIZT can react with hydroxyl
groups to form Si-O bond so that the silane layer was fomed on the silicon surface and
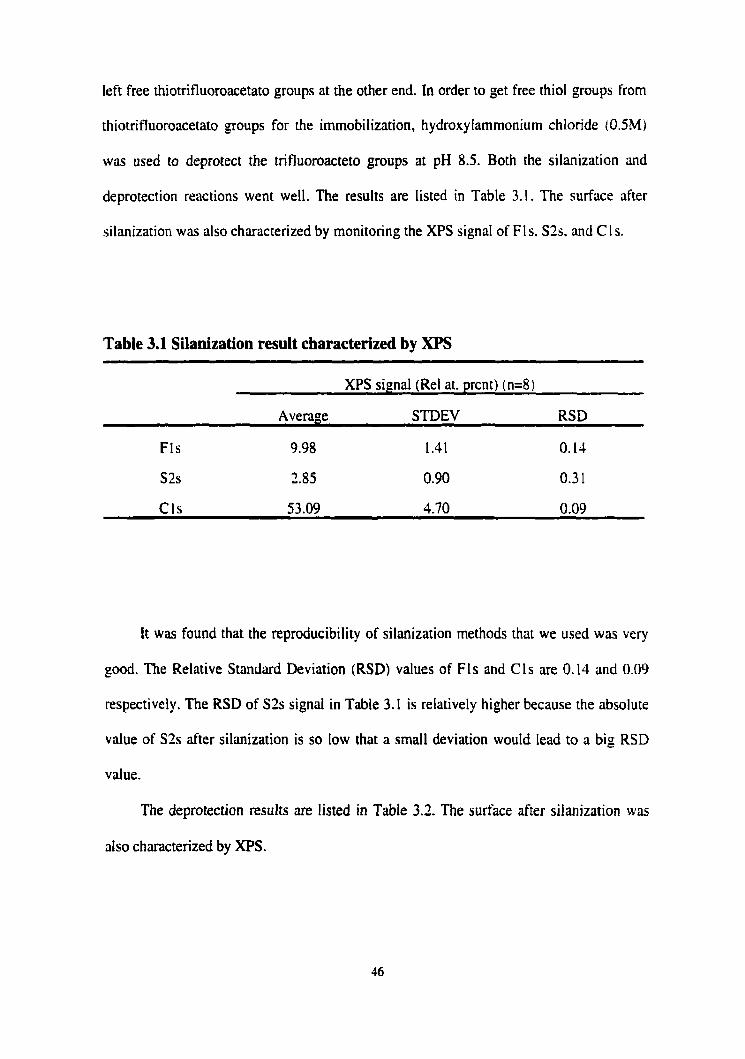
left free thiotrifluoroacetato groups at the other end. In order to get free thiol groups frorn
thiotrifluoroacetato groups for the immobilization, hydroxylarnmonium chloride (0.5M)
was used to deprotect the trifluoroacteto groups at pH 8.5. Both the silanization and
deprotection reactions went well. The results are listed in Table 3.1. The surface rifter
silanization was also characterized by monitoring the XPS signal of Fls. S2s. and CIs.
Table 3.1 Silanization result characterized by XPS
XPS signal (Re1 at. prcnt) (n=8)
Average STDEV RSD
FIS 9.98 1.41 O. 14
S2s 2.85 0.90 0.3 1
It was found that the reproducibility of silanization methods that we used was very
good. The Relative Standard Deviation (RSD) values of Fls and Cls are 0.14 and 0.09
respectively. The RSD of S2s signal in Table 3.1 is relatively higher because the absolute
vaiue of S2s after silanization is so low that a smail deviation would lead to a big RSD
vaiue.
The deprotection results are listed in Table 3.2. The surface afrer silanization was
also characterized by XPS.

Table 3.2 Deprotection result characterized by XPS
XPS signal (Re1 rit. prcnt) (n=8)
Average STDEV RSD
Fls 0.097 O. 17 1.73
S2s 2.68 0.37 0.14
Frorn S?S and Cls signais, it could be concluded that a satisfactory deprotection
nsult could also be achieved reproducibly. The Fls signal was very high because after
deprotection. almost al1 of the trifluoroacecato groups were removed so that the absolute
Fluoride signals are almost zero. For the same reason. a small deviation would lead to the
huge RSD value.
In order to examine if the TKi on the surface was covalently bound or just
physically adsorbed, a sonicator was used to remove the non-specific adsorption. After
silanization, ail the samples were put into toluene and sonicated for different tirne periods
at three times with fresh dry toluene for each time. The determination was repeated twice
and the values in the figure were the average of these two samples. The remaining TTU
amount on the surface of these samples was determined by monitoring the fluoride signal
in XPS. The results are shown in Fig3.3.

Omin O.Smin 2min Smin 10min
Sonkation îime(min)
Fig 3.3 TTU covalent binding testing by sonication method
After silanization. there is always a certain amount of TTU on the surface ririsin3
from physical adsorption because the signal from samples that were not sonicated is
prominently higher than those signais from samples which were sonicated. However.
varying sonication time from 0.5 minutes to 10 minutes does not cause much difference,
which showed that after sonicating for a small period of time, the adsorbed the TTü could
be removed completely. In Our experiment, this step is not necessary because after
silanization. in the next step: deprotection, al1 the samples would be sonicated for half an
hour. which would be long enough to remove the physically adsorbed TTU.

3.2 Analysis and Optimization of Irnmobilization Method
After deprotection, the silicon surface was covered with a layer of free -SH groups.
The synthesized DNA sequences were rnodified with -SH group at the 3' end. By forrning
di-sulphur bond, the DNA probes were immobilized on the silicon surface. The di-sulphur
bond was reported to be stable even at temperature higher than 95°C [67]. It was reported
that this reaction could be catalyzed by the oxygen in the air [68,69]. In the experimencs.
Zl was the DNA sequence, which was modified with a thiol-group and Z1C had exactly
the same sequence without a thiol-group, which acted as the control to provide
information about the amount that was non-specifically adsorbed. The surface coverage
was quantified by adding a fixed portion of the same "P radio-labeled sequences. Zl or
ZlC. into the DNA solution and detecting the ''P signal. The purpose of optimizing
experimental conditions was not only to achieve the highest surface coverage, but also to
establish a reproducible and controIIable system with relatively high DNA surface
coverage.
3.2.1 pH Effect on Surface Immobiüzation
We tned three buffers: pH 8.0 Tris buffered saline, pH 9.8 carbonate-bicarbonate
buffer. and pH 7.6 Tris buffer, as the matrix for 21, ZIC irnrnobilization because the basic
environment benefit the formation of di-sulphur bond. In Table 3.3 and Fig. 3.4, the
amount of ZI and Z1C were measured by "P radio-labeling method. The values were the
average of 5 replicates and the rdative standard deviation (RSD%) of them ranged from
7.71% to 18.3%. It was found that the pH7.6 bufier would give
population and good selectivity. in these three buffer solutions,
the highest surface
with the pH value
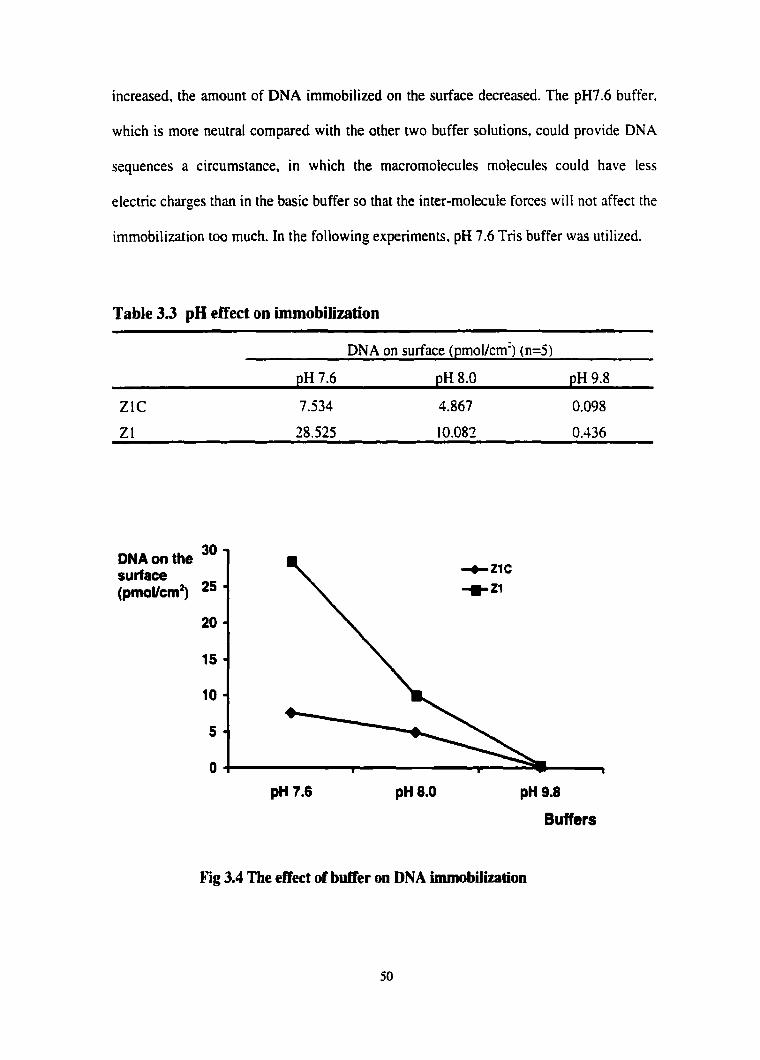
increased, the amount of DNA immobilized on the surface decreased. The pH7.6 buffer,
which is more neutrai compared with the other two buffer solutions. could provide DNA
sequences a circurnstance, in which the macromolecules rnolecules could have less
electric charges than in the basic buffer so that the inter-molecule forces will not affect the
immobilization too much. In the following experiments. pH 7.6 Tris bufier was utilized.
Table 3.3 pH effect on immobilization
DNA on surface (pmo~cm') (n=5)
pH 7.6 pH 8.0 pH 9.8
Z 1 C 7.534 4.867 0.098
Z 1 28.525 10.081 0.436
DNA on the surtace (pmoucm2)
Fig 3.4 The effect of buffer on DNA immobilizaîion

3.2.2 Solvent Effect on Surface Immobilization
From the resuits in Table 3.3, we couid also find that the non-specitic adsorption ir
one of the main problerns in immobilization: about 26% of the signal arises from the non-
specific adsorption. Different solvents were tried in order to get rid of this problem: water.
DMSO. Tris buffer (pH 7.6) and Tris buffer with 5 times higher salt concentration. for the
surface DNA immobilization.
Table 3.4 Solvent effect on immobilization
DNA on surface (pmol/cm') (n=5, at 95% confidence level)
K O DMSO Tris buffer Tris buffer with high salt
ZIC O. 14 1 dl.030 I .089&.229 3.9 14H.437 8.2871 I .407
Z 1 0.34W.057 3.374I0.627 12.190+ 1.058 18.942d.922
As the results show in Table 3.4. the surface coverage with water and DMSO were
very low. The DMSO was chosen because it couid provide a basic environment. which is
good for the di-sulphur bond formation. With Tris buffer. higher surface density and
selectivity could be achieved than water and DMSO. By varying the salt concentration, we
found chat the surface coverage and the selectivity changed as expected. When the salt
concentration was increased in the Tris buffer, much more DNA sequences. both of ZI
and ZIC. were immobilized on the surface and the selectivity was also improved. The salt
concentration determines the ionic suength of the solution so that it will affect the charges
around the DNA sequences. The charges around DNA sequences could affect the electric
force between sequences and that in mm determines the surface density. In the following
experirnent. the salt concentration in Tris buffer was studied in detail.

3.2.3 The Effect of Salt Concentration in Tris Buffer on Surface
Immobiiization
Table 3.5 The effect of salt concentration in tris buffer on immobilization -
DNA on surface (pmol/cm2) (n=5, at 95% confidence level)
0.07M NaCl 0.35M NaCl 0.70M NaCl 1.05M NaCl
ZIC 5.566t 1.242 8.0262 1.592 1 1.684k I .449 2 1 -478k4.26 1
Z 1 10.907Q.434 16.773+3.120 28.413e.8 18 39.176263 12
As shown in Table 3.5, as the salt concentration was increased, the amount of both
Z1 and ZIC on the surface increased greatly. This is because the Salt concentration in the
Tris buffer couId change the ionic strength in the solution so as to change the eiectric
charges around the charged DNA macromolecules. The increased charged environment
around the DNA molecules could decrease the repulsion among molecules so that there
would be more molecules with access to the surface. However. too rnuch salt in the
solution would also lead to too much non-specific adsorption. When the salt concentration
was increased from 0.70M to 1.05M. the non-specific adsorption increased greatly while
the covalent bonding did not change that much. Therefore, the salt concentration of 10
times higher than the normal sait concentration was used in this experiment as it gave the
best result.

3.2.4 DNA Concentration Effect on Surface Immobilization
The DNA concentration is another parameter that would affect the irnrnobilization
results. In this experiment, we tried four different DNA concentrations ranging from
2.59pM to 10.36pM and found that, the higher the DNA concentration used the higher the
surface coverage that could be achieved. However, if the DNA concentration was above a
critical value. which could give highest surface covzrage, the DNA macromoIecules may
have aggregated, and this would lead to a decrease in the amount immobilized DNA. The
average results of five replicated samples from the experiment are shown in Fig 3.5 and
Table 3.6. Their RSD (56) value is in the range of 9.2% to 19.4%
DMA concentration (uM)
DNAon the 60 ' surface 'P~o"" :
30
20
10
O .
Fig 3.5 Effect of DNA concentration on the immobilization
- t a c 49.407
. /\. +a 39.678 27.827
9.602
. u . 1 4
2 4 6 8 10 12

Table 3.6 DNA concentration effect on immobilization
DNA on surface (pmollcm~~ (n=5)
2.59p.M 5.18pM 7.77pM 10.36pM
Z 1 C 3.678 5.825 9.602 7.996
Z 1 27.827 28.719 49.407 39.678
3.2.3 Sonication Method on Selectivity
From the experiment, it was found that the non-specific adsorption i s very hard to
remove simply by washing with buffer or other solvent or solution after the
immobilization. Some studies have found that it would be still there even by heating to
75°C [31]. tn our study. we tried the sonication method to remove the non-specitïc
adsorption. In TabIe 3.7. after immobilizatioin. the silicon wafers were sonicated for
1Omin three times. followed by analysis using the scintillation counter. The ratio of Zl to
ZIC was used to indicate the selectivity.
Table 3.7 Sonication method to remove the non-specific adsorption
DNA on surface (pmol/cm') (n=S, at 95% confidence level)
Without sonication With sonication
ZIC 24.429I5.452 1.7 I5d.357
Z 1 4 1.7 1h9.207 7.243a1 .338
ZI/ZlC 1.707I0.004 4.223I0.099
As shown in Table 3.7, the sonication method could be used to remove the non-
specific adsorption effectively although there would be a big loss of DNA amount on the
surface. It is often used as an effective method to clean solid surfaces or help surface

reaction due to the phenornenon called cavitation, Le. the rapid formation and violent
collapse of minute bubbies or cavities in a liquid [70]. Cavitation is produced by
introducing high frequency (ultrasonic), high intensity sound waves into a Iiquid.
Ultrasonic energy, like any sound wave, is a series of pressure points. or rather a series of
compressions and rarefactions. If the sound energy is of sufficient intensity. the liquid wili
actuaily be pulled apart a[ the rarefaction stage and srnrill bubbles or cavities will be
forrned. With the following compression stages, the bubbles collapse or implode
throughout the Iiquid, creating an extrernely effective force which is uniquely suited to
assist the liquid working on the surface so that it could provide help in surface cleaning.
surface reaction or dissolving of solid particles. From theoretical considerations. it has
been estimated that a pressure of more than 10,000 psi and a temperature greater than
10.000 "F c m eexist within the coliapsing bubbles. and shock wüves radiate in dl
directions at the instant of collapse. Therefore, under such harsh conditions. even some of
the covalent binding after immobilization would be broken. If the ultrasonic wave
frequency is increased, the number of these cavities ais0 increases but the energy released
by each cavitation event decreases making higher frequencies provide less energy to act
with surface. The frequency was not changed, and the energy of sonication was controlled
by changing the sonication time. Here in Table 3.8, there were different time periods for
sonication after the immobilization. When the sonication time was increased. the amount
of adsorbed DNA sequences on the surface did not change rnuch, while the arnount of
covalentiy bonded 21 decreased prorninently. Although by optimizing the sonication tirne.
the suitabie time could also be found to get the largest surface coverage and good
selectivity, it is usually hard to find an optimal time and the reproducibility of this method
was not very good.

Table 3.8 Sonication time period to remove non-specific adsorption
DNA on surface (pmol/cm') (n=5, at 95% confidence level)
Sonication time ZIC Z 1 ZL/ZIC
0.0 min 26.5801t6.262 40.26h8.986 1.515rt0.019
0.5 minx3 tirnes 4.954M.872 30.9876.572 6.255rt0.023
1 .O minx3 times 3.803I0.697 28.776k5.280 7.567rt0.002
2.0 minx3 tirnes 4.105&.8 14 2509914.668 6.1 14a.075
5.0 minx3 rimes 3.787dl.733 14.073Q.9 14 3.7 16H.050
10 minx3 times 3.195g.665 9.995+7. IO7 3. 128a.008
3.2.6 The Effect of MCH on the Selectivity
It was reported [31] that with 6-rnercapto-1-hexanol (MCH), the non-specific
adsorption on gold surface could be removed effkiently. This compound was tried in our
system too because in the reported gold systerns. they used thiol modified DNA to bind
onto a surface. MCH is a small rnolecule with thiol group at one end. so it has a better
chance to access the surface, reacting with the thiol groups on the surface and removing
the non-specific physical adsorption. The C, chah was chosen because it has the same
length as the DNA modifier -(CH,),SH, so that after reaction, it would affect the
following hybridization step. Fig 3.6 shows the expected surface structure.
Table 3.9 MCH effect on the selectivity
DNA on surface (pmo~crn') @=S. at 959 confidence level)
ZIC z 1 Zl/ZlC
Washing with buffer 4.767I0.769 13.062d.687 2.74M. 12 1
Washing with MCH (20mM) 1.193dl.236 10.754I2.0 19 9.0 14a.09 1

As shown in Table 3.9, after immobilization, there was a great difference in the
DNA signals on surface between silicon wafers imrnersed into buffer and into MCH. By
using MCH. the non-specific adsorption of Z1C was removed more than 97%. In the
following part, different MCH concentrations were tried to study the effect on
imrnobilization.
Table 3.10 Effect of MCH concentration on immobilization.
DNA on surface (prnol/cm:)
Z1C z 1 ZlZ1C
Washing wi th buffer 5.75 1 fi.987 19.770IJ.J 13 3.138dl. 177
1.25mM MCH 1.29910.256 15.67 ld.264 11.06JHI. 135
1.50mM MCH 1.46520.287 16.63 1 d.586 1 1.352HI.774
5.00mM MCH 1.769M.482 12.7 14I2.759 7.187dl.398
10.0mM MCH 1.4384.297 1 1.173G.568 7 . 7 7 M . 18 1
20.0mM MCH 1.35 1 I0.300 10.99w.034 S. 135H.301
As the results show in the Table 3.10, the concentration of MCH ranged from
1.25mM to 20.0mM. With the MCH concentration as low as 1.2SrnM in water solution,
most of the adsorbed ZIC could be removed. Even if the MCH concentration was
increased to 20.0mM, the rernaining ZlC would not decrease by much. However.
increasing MCH concentration did cause a decrease of Z1 signal, which means that some
of the covalent binding will also be prevented.
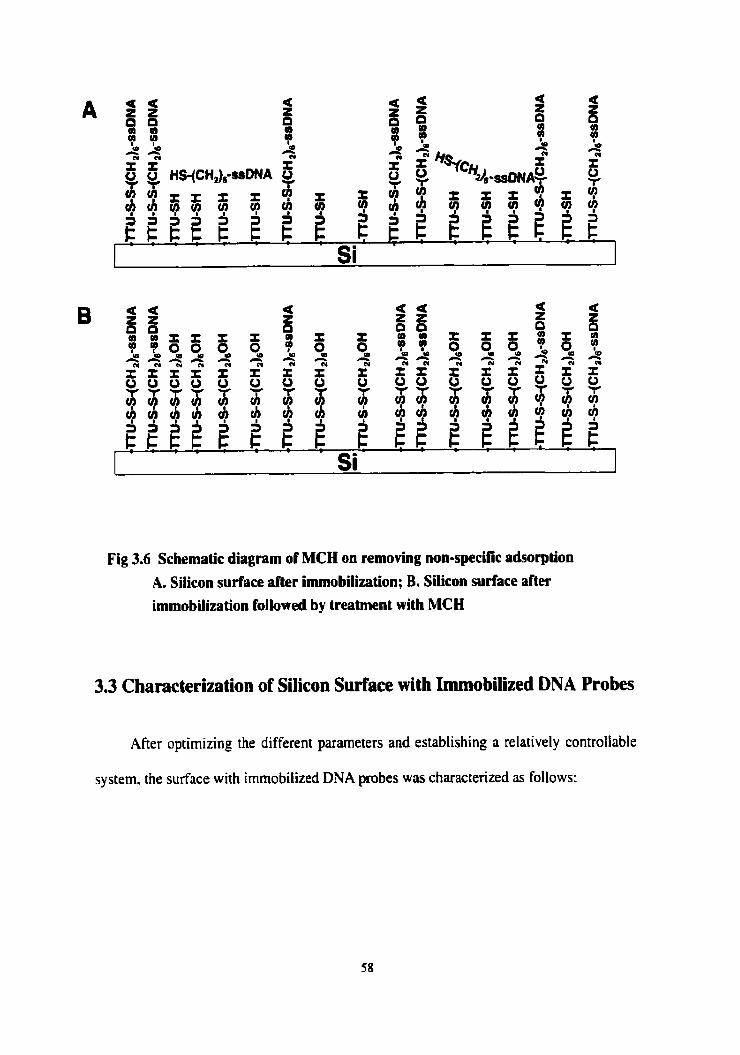
Fig 3.6 Schematic diagram of MCH on removing non-specific adsorption A. Silicon surface aîîer immobilization; B. Silicon surface after immobilization followed by treatment with MCH
3.3 Characterization of Silicon Surface with Immobilized DNA Probes
After optimizing the different parameters and establishing a relatively controliable
system. the surface with irnmobilized DNA probes was characterized as follows:

3.3.1 Hybridization of DNA Probes on Surface
As the results show in Table 3.1 1, after the immobilization of ZI on the surface. the
complementary strand Zlcom was used for the hybridization experiment and the non-
cornplementary strand ZInon to measure the amount that was adsorbed. The result was
the average of six samples and was quantified by ''P radio-labeling method. About 69% of
immobilized 21 was hybridized with Zlcom and the specificity was also very good: four
times higher than the non-specific adsorption.
Table 3.11 Hybridization results
DNA on surface (pmol/cm:) (n=6)
Z 1 (Immobilization) 33.769
Z 1 -Zlcom (Hybridization) 23.545
Z 1-2 1 non (Adsorption) 5.642
Z lcom/Z 1 non 4.173
3.3.2 DNA Sequences Length on the Immobilization
When designing a DNA sensor, there is one question that has to be addressed: how
long should the immobilized DNA probes be? In theory, longer sequences couid make it
easier to find out the target sequences. However, the effect of sequence length on the
immobilization must be detemined. By varying sequence iength, we found that the Longer
the sequences, the harder it was to get a high surface coverage in the immobilization
procedure.

Table 3.12'~ffeet of sequeme length on immobilizntion
DNA on surface (pmol/crn') (n=3)
23 (5 mer) 50.042
26 ( I Omer) 30.1 O5
Zl (17 mer) 19.538
22 (26 mer) 8.387
As shown in Table 3.12. five DNA sequences (5 mer, 10 mer, 17 mer, 26mer and 35
mer) were tried for the irnrnobilization. From the radio-labeling results, we could find that
if the sequence length decreased form 35 mer to 26 mer, there is a small increase in the
amount of oligonucleotide on the surface. However. when decreasing the length to 5 mer.
there was a large increase of surface density frorn 4.57pmollcrn' to 50.04~rnoI/cm:.
Therefore, if the designed surface coverage of imrnobilization w u expected, the selecting
of suitable sequence length is very important.
3.3.3 The Effect of DNA Sequences on Inunobilization
In order to analyze better the results from the previous expenment, we analyzed the
DNA sequences with a software program called "Oligo Tech 1.00 frorn Olido Etc. Inc.
and Oligo Therapeutics Inc. The theoretical structure analysis from this software showed
that the sequence 21 could form stable loop (Ga) as the following structure, in which the
calculated free energy, G, was -1.8 kcaYmol and the loop Tm is 520°C. indicating that this
loop is quite stable.

r A G T C G A 5 '
In addition. the other possible complex structure that could be formed by this sequence 21
is a homodimer in the way of the foliowing example. However. this structure is not as
stable as the previous one for the calculated Tm is only 10.60"C.
5 ' A G C T G A C T A G C T A T G C G 3 ' / / / / / /
3 ' G C G T A T C G A T C A G T C G A 5 '
These theoretical calculations showed that the sequence 21 used in this experiment
has a significant probability of foming loops or homodimer structures in the buffer
solution, which would decrease the free Z1 sequence to attach to the surface and would
also affect the immobilization because of steric effects. Therefore. the base order in some
DNA sequences might dso be an important factor that affects the irnmobilization. To
prove this. we designed another DNA sequences 24, which was only cornposed of
Adenine and had the same Iength as 21. The results of immobilization of Zl and 24 are
listed in Table 3.13, in which the ZIC and Z4C are the control sequences for each
respectively. The RSD (96) is below 15%.
Table 3.13 immobilization result of different base order in 21 and 24
DNA on surface (prnol~crn') ( n d )
Z I C 4.266
Z 1 13.tSl
Z4C 9.828

From the data in Table 3.13, we could see that there were more 24 and Z4C on the
surface after imrnobilization than Zl and ZIC. 24 only contains Adenine so that there
would not be many complex structures formed. In practical DNA sensor design. it is
impossible to use a sequence as simple as 24. Decreasing the sequence length couId
decrease the possibility of foning such structures, therefore, this interfering could be
reduced by selecting shorter sequences.
3.3.4 Hybridization between Partiaiiy Hybridized Sequences
In red measurement. the biosensor with immobilized DNA probes was put into a
mixture of target sequences and other sequences of different lengths. Besides the
hybridized sequences and non-specific adsorption, the sequences in the sample mixture.
which were partially hybridized with the probes would also add to the signal to some
extent. In order IO see how much the partially hybridized sequences would recognize each
other, the sequences Z l , 2 3 and their complementary strands Zlcom and Z3com were
selected.
21: 5'-AGC TGA CTA GCT ATG CGX-3'
23: 5'-GCT ACX-3'
These two strands have pan of the same sequence so that their complementary
strand would have the ability to hybridize partially to the other one. First, 21 and 23 were
immobiIized respectively on different silicon wafers, and the immobilization results are
listed in Table 3.14:
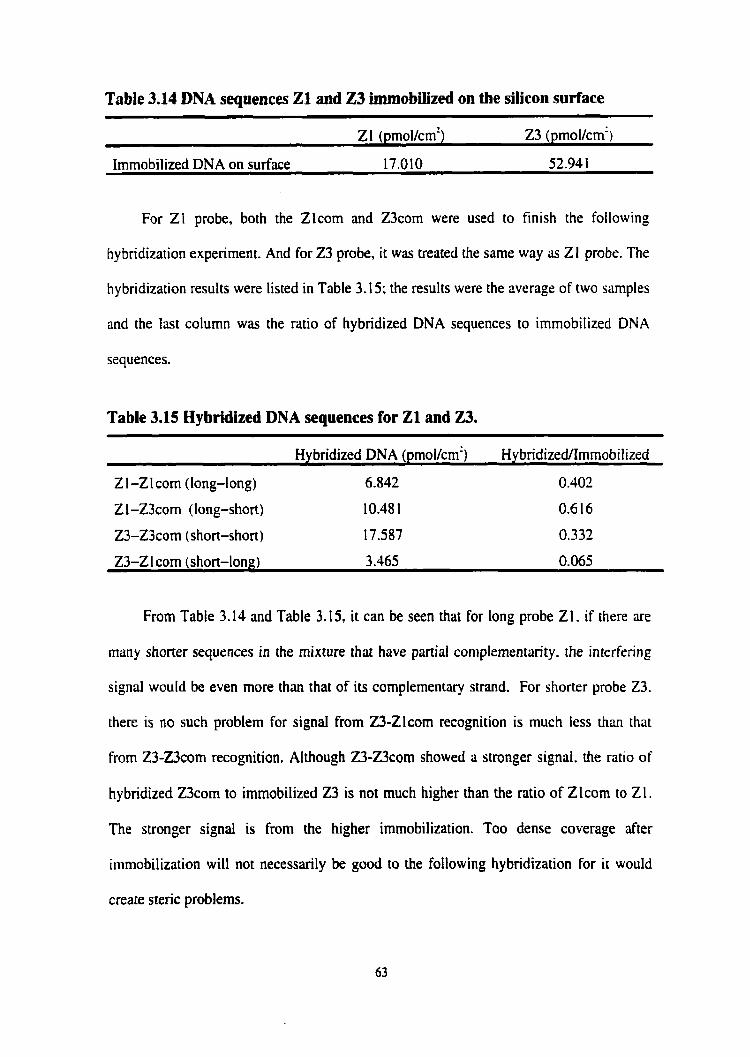
Table 3.14 DNA sequences 21 and 23 immobilized on the silicon surface
Z 1 (pmol/cm2) 23 (pmol/cm')
Immobilized DNA on surface 17.010 52.94 1
For 21 probe, both the Zlcom and Z3com were used to finish the following
hybridization experiment. And for 23 probe, it was treated the same way as ZI probe. The
hybridization results were listed in Table 3.15; the results were the average of two samples
and the last column was the ratio of hybridized DNA sequences to immobilized DNA
sequences.
Table 3.15 Hybridized DNA sequences for Z1 and 23.
Hybridized DNA (pmoi/cm:) Hybridized/Imrnobilized
Z 1-2 l corn (long-long) 6.842 0.402
Z 1 -Z3com (long-short) 10.48 1 0.6 16
23-Z3com (short-short) 17.587 0.332
23-2 1 com (short-long) 3 .465 0.065
From Table 3.14 and Table 3.15, it can be seen that for long probe 21. if there are
many shorter sequences in the mixture that have partial complementarity. the interfering
signal would be even more than that of its complementary strand. For shorter probe 23.
there is no such problem for signal from 23-Zlcom recognition is much less than that
frorn 23-Z3com recognition. AIthough 23-Z3com showed a stronger signai. the ratio of
hybndized Z3com to immobilized 23 is not much higher than the ratio of Zlcom CO Z1.
The stronger signal is from the higher immobilization. Too dense coverage after
immobilization will not necessarily be good to the following hybridization for it would
create steric problems.

Therefore, the sequence length is a very important factor that will affect both the
irnrnobilization and hybridization steps. Sequences that are longer would lead to lower
surface coverage and more non-complementary combination. Shorter sequences could
avoid these problems. however they would lead too high surface coverage and thus cause
difficulties to control the desired surface coverage. In addition, the heavy density of the
DNA probes on the surface would keep the single probe rigid and thus lose its flexibility.
which will affect the hybridization.
3.3.5 Film Thickness Measurement
There are rnany ways to mesure the film thickness of molecular layer lower than 50
A. Here in our work, the film thickness of different samples was measured with one of
the most convenient methods. Eliipsometry, as shown in Table 3.16.
First. the thickness of 'lTU rnolecular layer on the surface is about 18 A. After ir
was covered with another layer of DNA, the thickness wris increased to 2 1 A of ZI and 24
A of Z1C. Most of the Zl was covalently bound while the ZIC was adsorbed on the
surface.
Table 3.16 Film thickness measured b y Ellipsometry
Sarnple Average (A) Standard Deviation (n=8)
Si-TTU 18 0.5
S i-TTU-Z 1 21 1.2
Si-TTU-Z 1 C 25 4.2
Si-TTU-Z 1-2 1 corn 23 1.7

The theoretical calculation showed that the length of the 17 mer DNA sequence
should be 54.4 A, which is aimost double the thickness of the values found from the
experiment. This result showed that the immobilized DNA on the surface was probably
not vertically oriented on the surface. They were probably lying down and thus giving a
thinner Iayer of DNA on silicon surface. This result also showed that the surface coverage
was not dense enough so that the DNA sequences could not vertically stand up on the
surface. The difference of Z1C and Z1 on the surface was probably due to the less
organized packing of ZlC. Since they are on the surface by adsorption. they probably
would not be as ordered as ZI on the surface. Therefore. it is not surprising to see a little
bit thicker surface film from the expriment. After hybridization. the complernentary
sequence film on the surface became thicker slightiy from 21 A to 13 A while the non-
complementary strand was much higher from 21 A to 29 A. In addition. comprired with
Zlcom. the non-complementary sarnples displayed a wider range distribution of film
thickness. This was probably because the non-complementary strand Zlnon combincd
with 21 by randomly physical binding so that there wu no specific orientation for this
kind of binding. However, al1 the Zlcorn sequences hybridized wirh 21 the same way.
they showed similar film thickness, and also a narrow range of distribution of film
thickness.
Because the above results were from the dried surface samples, the thinner film
thickness of DNA molecules compared to theoretical value was probably due to the loss
of the solution environment. In real buffer solution, the DNA molecular film thickness
may be thicker than the dned film.

CONCLUSION
in this work, a relatively stable and controIlable system was established by
optimizing panmeters that would affect each step of the whole procedure including
washing, silanization, de-protection, immobilization and hybridization. The waer content
on the surface is very important for the silanization. A good washing method was found
so that the water content on the surface could be controiled weI1. pH 7.6 Tris buffer
would be better for the imrnobilization. Cumpared with water and DMSO. Ttis buffet
was selected as the matrix for the DNA imrnobiiization and its ionic strength was
controlled by using 0.7M NaCl concentration, 10 times higher than the regular sült
concentrütion. DNA concentration used here in this work was around 7.0pM.
In this system, we also tried two different methods to reduce the non-specific
adsorption when doing immobilization: sonication method and MCH rnethod. The former
is rui effective way but it needs time and work to find the best sonication time to avoid the
Ioss of covalent binding. The MCH method introduced in this work provided a better way
of removing non-specific adsorption.
The base order in DNA sequence would affect the immobilization greatly for there
would be self-hybridization or formation of a loop-shaped structure, which wouId
interfere with the surface immobilization. Although it is unavoidable in red DNA
sequencing anaiysis, this problem needs ro be given attention when designing probes for
immobilization. UsuaIly, this cm be avoided by using shon strands.
Sequence length is another factor that needs to be given consideration. Compared
with longer DNA sequences, shorter sequences could achieve better surface coverage and
avoid the attachrnent of partiaily hybridized sequences. However, if the sequences are
too short, they may pack on the surface too densely and would Iack flexibility and this
decreases the hybridization efficiency.
Film thickness measurements showed that the irnmobilized DNA probes were not
vertical on the surface. They probably lay down so that gave a thinner layer of DNA on
silicon surface than would have been obtained if they stood vertically. The results also
showed that the surface coverage was not dense enough so that the DNA sequences could
not stand up on the surface. The covalent binding of ZI on the surface could give a better
organized packing chan that of non-specific adsorption of ZlC. After hybridization, the
complementary sequence on the surface formed a layer thinner than the non-
complementary strand. [n addition, compared with Zlcom, the non-complementary
samples displayed a wider range of distribution of film thickness. This is probably
because the non-complementary strand Zlnon cornbined with Z1 by random physical
binding and there was no specific orientation of the sequences on the surface.

1. Website about Gene Therapy: Http://www.ultranet.com/-jkimball/biologyPap/G/
GeneTherapy.htm1.
2. M. Cavazzana-Calvo, S. Hacein-Bey, B.G. de Saint, F. Gross, et al, Science, 2000.
288,669.
3. KT. Montgemery, et al. Nature, 2001,409.945,
3. Website for Human Genome Project Information: Http://www .oml.gov/hgrnis/
projectfbenefits.htrn1.
5. Website for moleculitr structure graphic gallery: hhttp://www.accessexcellence.com/
AB/GG/dna-molecule.html.
6. I.M.Prober, G.L. Trainor. R.J. Dam et ai. Science. 1987,238.336.
7. W . Ansorge. B.S. Sproat. J. Stegemann. C. Schwager. J. Biocheniicd cind
Biophysical Methods, 1986, I 3, 3 1 5.
8. F. M. Ausubel, R. Brent and R. E. Kingston etc. Current Prorocols in Molecidm
Biology. A joint venture between Greene hblishing Associates, Inc. and John Wiley
& Sons, Cnc. 1993, Vol 1. 7.0.4.
9. M. Chee, R. Yang, E. Hubbeil, A. Bemo, X.C. Huang, D. Stem, I. Winkler, DJ,
Lockhart, M.S. Morris and S.P. Ford, Science, 1996,374.6 10.
10. J. Derisi, L. Penland, O.P. Brown, M.L. Bittner, P.S. Meluer. M. Ray. Y. Chen. Y.A.
Su and J.M. Trent, Nat. Gener., 1996, 14,457.
1 1. E.M. Southern, U. Maskos and J.K. Elder, Genomics, 1992,13, 1008.
12. M. Yang, M.E. McGovem, M. Thompson, Anal. Chim. Acta., lm, 346,259.
68
13. J. Wang, X. Cai, C. Jonsson and M. Baiakcishnan, Elecrroanalpis, 1996,8,20.
14. Y . Okahata. Y. Matsunobu, K. Ijiro, M. Mukae. A. Murakami and K. Makino, J. Am.
Chem. Soc., 1992, 1 14,8299.
15. H. Su, Krishna, M.R. Kdlury and M. Thompson, Anal. Chem. 1994.66.769.
16. J . Wang. S. Bollo, J. L. L. Paz, Anal. Chem. 1999,71, 1910.
17. T. Livache, A. Roget, E. Dejean, C. Barthet, G. Bidan. R. Teoule, Nitcleic Acids Res..
1994,22,29 15.
18. W. Trabesinger, G.J. Schutz, H.J. Gruber, H. Schindler and T. Schmidt, Anal. C'hem.
1997.69.4939.
19. F. Cmse. E. Rodda, D.N. Furlong, K. Niikura and Y. Okahata. Anal. Chem. 1997,
69.2043.
20. B. Johnsson, S. Lofas and G. Lindquist, Anal. Biochern. 1991, 198.268.
21. H.J. Watts, D. Yeung and H. Parkes,Anal. Chem. 1995,67.4283.
22. P . V. Riccelli, F. Merante, KT. Leung, S. Bortolin, R.L. Zastawny, R. Janeczko. A.
S. Benight, NrccleicAcids Res. 2001,29,4,996.
23. X.C. Zhou, L.Q. Huang, S.F. Li, Biosens. Biaelecrrm. 2001. 16, 1-2. 85.
24. S. Tombelli, M. Mascini, Anal. Lett. 2000, 33. I l . 2129.
25. M. Roth, A. Jeltsch. Biol. Chern. 2000,381,3,269.
26. X. Liu, W. Tan, Anal. Chem. 1999,71,22,5054.
27. B. Kerman, J. Am. Chem. Soc. 1999,121,32,7292.
28. M . Wilchek, E.A. Bayer, Immobifized Biomof. Anal. Oxford University Press 1998.
15.
29. K.M. Millan and S.R. Mikkelsen, Anal. Chern. 1993,65.2317.
30. K.M. Millan, A. Saraullo and S.R. Mikkelsen, Anal. Chem., 1994,66,2943.

3 1. T. M. Herne and M.J. Tariov, J. Am. Chem. Soc. 1997, 1 19,89 16.
32. M. Boncheva, L. Scheibler, P. Lincoln, H. Vogel and B. Akerman. Langmuir 1999.
15.43 17.
33. C.E. Jordan, A.F. Fnttos, Anal. Chem. 1997,69,4939.
34. S . Yamaguchi and T. Shimomura, Anal. Chem. 1993,65, 1925.
35. M.J. O'Donnell, K. Tang, H. Koster, C.L. Smith. and C.R. Cantor. Anal Chem. 1997.
69.1438.
36. R. Lenigk, M. Carles, N. Y. Ip. and N. J. Sucher. Langmuir 2000. 17.7497.
37. Y. Rogers. P J. Baucom, Z. Huang, V. Bogdanov. S. Anderson, and M.T. Boyce-
Jacino, Anahtical Biochemistry, 1999,266,23.
38. L. A. Chrisey. G.U. Lee and C. E. O' Ferrall, Nitcleic Acids Resenrch. 1996. 74. 15,
303 1.
39. J.P. Cloarec. J.R. Martin, C. Poiychronakos, 1. Lawrence, M.F. Lawrence, E.
Souteyrand. Sensurs and Actuators B 1999,58,394.
40. M.C. Pirmng. I.D. Davis and A.L. Odenbaugh, Langmuir, 2000, 16.7 185.
41. X. Xu, H. C. Yang, T.E. Mallouk, and A.J. Bard, J. Am. Chem. Soc. 1994, 1 16.8386.
42. A.H. Uddin, P. A.E. Piunno, R.H.E. Hudson, M.J. Damha. U.J. Knill, Nuclric Acid
Res., l m , 25,20,4139.
43. S.F. Wolf, L. Haines, J. Fish, J.N. Kremsky, J.P. Dougherty and K. Jacobs, N~tcleic
Acid Res., 1987, 15,29 1 1.
44. P.A.E. Piunno, U.J. Knrll, R.H.E. Hudson, M.J. Darnha, H. Cohen, Anal. Chim. Acta,
1994,288,205.
45. R.M. Crooks and A.J. Ricco, Acc. Chem. Res. 1998,3 1.219.

46. T. Strother. W. Cai, X. Zhao, R.J. Hamers and L.M. Smith, J. Am Chem. Soc. 2000,
122, 1205.
47. J. Terry, M.R. Linford, C. Wigren, R. Cao, P. Pianetta, C.E.D. Chidsey, J. Appl.
Ph p.. 1999,85,213.
48. R.J. Hamers. J.S. Hovis. L. Seung, H. Liu, J. Shan, J. Ph-. Chem. B 1997, 101. 1489.
49. M.R. Linford. P. Fenter, P.M. Eisenberger, C.E.D. Chidsey, J. Am. chem. Soc. 1995.
1 l7,3 145.
50. A.B. Sieval, A.L. Demired, J.W.M. Nissink, M.R. LInford. J.H. Vander Mass, W.H.
de Jeu. H. Zuihof, and E.J.R. Sudholter. Langmuir. 1998, 14, 1759.
5 1. M.F. Toney, C.M. Mate. K.A. Leach and D. Pocker, Joiunal of Culloid ctnd Iritrrjiice
Science, 2000,225.3 19.
52. C. M. Halliwell and A.E.G. Cass, Anal Chem. 2001.73, 1 1.2476.
53. K.M.R. Kallury, J.D. Brennan. and U.J. Kmll, Anal Chem.. 1995.67.2635.
54. R. Wang and S.L. Wunder. Langmuir, 2000, 16,5008.
55. Y. Fang, T.S. Spisz, T. Wiltshire, N. P. D'Costa, Isaac N. Bankman. Anal Chrm
1998,70,2 123.
56. S. W. Metzger and M. Natesan, J. Vac. Sci. Technol. A 17,5,1999,2623.
57. J.H. Watterson. P.A.E. Piunno, C.C. Wust, and U.J. Kmll, Langmuir 2000. 16.4983.
58. L. Cheran. M.E. McGovem and M. Thompson, Faraday Discuss, 2000. 116,23.
59. I.C. Vickerman, Surface analysis, the principle techniques, John Wiley & Sons, 1997.
e43-
60. F.M. Ausubei, R. Brent and R.E. Kingston etc. Current Protocois in Molecuiar
Biology, A joint venture between Greene Publishing Associates, Inc. and John Wiley
& Sons, Inc. 1993 Vol 1,3.10.1.

6 1 . M.E. McGovern, M Tnompson. Can, J. Chern. 1999,77, 1678.
62. Y. He. P.A. Thiry. L, Yu. R. Caudano, SuSuce Science. 1995,331-333, MI.
63. J.J. Cras, C.A. Rowe-Taitt, D.A. Nivens, F.S. Ligler, Biosensors & Bioelecronics
199, 14,683.
64. M.E. McGovern, K.M.R. Kallury, M. Thornpson, Lungmrrir, 1994, 10, 10,3607.
65. J.D. Le Grange, J.L. Markham, C.R. Kurkjian, Langmuir, 1993.9. 1749.
66. K. Akagi and M. Tsukada, Thin Soiid Films 1999,343-344397-
67. National Research Development Corporation, Immobilized Polynucleotides. Patent
WO 9 1 J00868.1991.
68. C.J. Swan and D.L. Trimm. 3. Appl. Chem. 1968, 18,340.
69. C.G. Cullis. J.D. Hopton and D.L. Trimm, j. Appl. Chenr. 1968. 18.330.
70. Website about ultrasonic cleaning technoiogy: http://www.bransoncleaning.corn/pp~
indexic.html.