characterization of engineered t cells following …
TRANSCRIPT

CHARACTERIZATION OF ENGINEERED T CELLS
FOLLOWING ANTIGEN STIMULATION
CHARACTERIZING THE RESPONSE OF TAC- AND CAR-
ENGINEERED T CELLS FOLLOWING ANTIGENIC
STIMULATION
By VIVIAN WING CHONG LAU, B.SC.
A Thesis Submitted to the School of Graduate Studies in
Partial Fulfilment of the Requirements for the Degree of Master of Science
McMaster University
© Copyright by Vivian Wing Chong Lau, August 2018

ii
McMaster University MASTER OF SCIENCE (2018) Hamilton, Ontario (Biochemistry and
Biomedical Sciences)
TITLE: Characterizing the Response of TAC- and CAR-Engineered T cells Following Antigenic
Stimulation AUTHOR: Vivian Wing Chong Lau, B.Sc. (McMaster University) Supervisor:
Professor J. Bramson NUMBER OF PAGES: xii, 72.

iii
LAY ABSTRACT
Cytotoxic T cells are also known as “resident killer” cells of the immune system, as they can
seek and eliminate diseased or infected tissue, including cancer cells. However, cancer cells can
evade elimination by T cells over time. Genetic engineering of T cells allows us to re-arm T cells
against cancer cells. T cells isolated from a patient are genetically modified to recognize cancer
cells specifically. So far, these modified T cells have been successful against several leukemias.
However, the side effects of this treatment can be substantial and life-threatening, due to the
massive reaction of the T cells against the cancer cells following infusion. We explore the
biology of two different types of engineered T cells to better understand the interaction between
T cell and tumour cell. Our results aim towards mitigating the side effects of T cell treatment,
while investigating how we can improve its effectiveness for the future.

iv
ABSTRACT
T lymphocytes engineered with chimeric antigen receptors (CARs) have shown remarkable
success in the treatment of leukemias. Conventional CARs seek to recapitulate TCR and
costimulatory signals through fusion of T cell signaling elements into a single receptor. The
robust anti-tumor activity of CAR T cells is often accompanied by debilitating toxicities due to
excessive T cell activation and cytokine production following infusion. Our lab has generated a
novel chimeric receptor termed T cell antigen coupler (TAC), which is designed to engage native
T cell signaling domains for cellular activation. In a murine xenograft model, we previously
found that TAC T cells mediated rapid tumour regression in the absence of toxicities.
Comparatively, CAR T cells elicited significant lethal toxicities to the mice due to reactivity
against an unspecific antigen that resulted in excessive proliferation and cytokine production in
vivo. Here, we report that TAC and CAR T cells have fundamentally different biology, both at
rest, and during activation. TAC T cells were more sensitive to the context of stimulation
compared to CAR T cells. Whereas TAC T cells can discriminate between antigen bound to a
bead, or antigen present on a cell, CAR T cells do not make the same distinction and responds
equally well to both. Compared to several different CAR constructs, TAC T cells are less prone
to tonic signaling and T cell differentiation in the absence of antigen. These findings support that
TAC T cells may pose a safety benefit as a cancer immunotherapy, due to its distinct biology
from CAR T cells that enables them to require more stringent contexts for activation.
v
ACKNOWLEDGEMENTS
Throughout my undergraduate and now graduate experience at McMaster, I have felt extremely
fortunate for the opportunities I have been given to learn from people who have influenced my
research interests and career aspirations.
I would first like to thank my mentor, Dr. Jonathan Bramson, who encouraged my ideas and
free-thinking throughout my Master’s, and expressly drove forward my passion for research in
immunology. My future would certainly not be as bright without your guidance, and I am
grateful for the training experience I was able to receive.
Thank you to my committee, Dr. Carl Richards, and Dr. Matthew Miller, for your advice and
insight both scientifically, and academically. I appreciated your mentorship, which led to
interpretations of my data that would not otherwise have come to light.
To the Bramson lab members, present and past, thank you for ‘science-ing’, laughing, eating,
and pondering with me over the last three years. I am extremely grateful for your comradery,
advice, kindness, and friendship. Science doesn’t always work, but it is much more comforting to
fail together, than to fail alone. I wish you all the best of luck for your future endeavours and
hope that we meet again.
Last, but not least, thank you to my parents, for giving me the opportunity to grow up in a
country like Canada. You have given me the greatest gift that a person could ask for, which is the
opportunity to pursue my passions, and achieve my goals.

vi
TABLE OF CONTENTS
Preliminary Pages
i. Title Page …………………………………………………………………………….. i
ii. Descriptive Note …………………………………………………………………….. ii
iii. Lay Abstract …………………………………………………………………………iii
iv. Abstract……………………………………………………………………………… iv
v. Acknowledgements……………………………………………………………………v
vi. Table of Contents ……………………………………………………………….. vi-vii
vii. Lists of Figures and Tables ……………………………………………………...viii-ix
viii. List of All Abbreviations and Symbols …………………………………………... x-xi
ix. Declaration of Academic Achievement…………………………………………….. xii
Main Text
1.0 Introduction …………………………………………………………………………….. 1-13
1.1 The early history of cancer and the immune system ……………………………….... 1
1.2 Modern cancer immunotherapy targets cancers by enhancing immune function…. 1-2
1.3 The T cell receptor is responsible for antigen recognition by T cells……………….. 3
1.4 T cell activation initiates a cascade of biophysical and biochemical downstream
effects………………………………………………………………………………. 4-5
1.5 Costimulation, in addition to TCR triggering, is required for T cell activation……5-6
1.6 Expression of coinhibitory receptors negatively regulates T cell activation………….6
1.7 Harnessing the power of anti-tumour T cells using adoptive cell transfer…………6-7
1.8 Non-specific T cells in peripheral blood can be rendered tumour-specific ………..7-8
1.9 First-generation CAR designs are based on the earliest TCR activating signal……...8
1.10 Second-generation CARs show enhanced T cell activation and persistence …..8-9
1.11 Toxicities observed in patients treated with CAR T cells……………………...9-10
1.12 Tonic signaling in CAR T cells hinders anti-tumour efficacy………………. 10-11
1.13 Direct comparisons between CAR- and TCR-based stimulation………………...11
1.14 The TAC receptor as an alternative to CARs………………………………...12-13

vii
2.0 Materials and Methods ………………………………………………………………...14-18
3.0 Results…………………………………………………………………………………... 19-50
3.1 Fundamental differences between TAC and CAR T cells during non-activated and
activated states …………………………………………………………………...19-29
3.1.1 TAC T cells lack tonic signaling and retain a less differentiated phenotype
and reduced checkpoint receptor expression relative to CAR T cells…...19
3.1.2 Transcriptome analysis indicates significant tonic activation of CAR T
cells in the absence of stimulation……………………………………… 23
3.1.3 Engineered receptors are downmodulated following antigen-dependent
stimulation ………………………………………………………………27
3.2 Optimal TAC T cell activation is contextually more stringent than CAR T cells..30-42
3.2.1 TAC T cells can discriminate between cell- and bead-based stimulation 30
3.2.2 Lack of proliferation against antigen-loaded beads is independent of co-
stimulation and IL-2 production ………………………………………...32
3.2.3 Gene transcriptional profiling indicates that TAC and CAR T cells diverge
following activation ……………………………………………………..36
3.2.4 Higher surface expression of TAC does not fully restore proliferative
capacity compared to CARs ……………………………………………. 39
3.2.5 HER2-CAR T cells, but not HER2-TAC T cells, respond to stimulation by
cells isolated from lungs of NRG mice …………………………………..41
3.3 Consequences of stimulation, and characteristics of stimulated T cells …………43-50
3.3.1 CAR T cells experience faster activation kinetics, and stronger activation
towards stimulation than TAC T cells ………………………………….. 43
3.3.2 TAC T cells stimulated with beads exhibit low transcriptional activation,
and lack activation of T cell signaling pathways ………………………. 47
4.0 Discussion ……………………………………………………………………………….51-53
5.0 Concluding Remarks ……………………………………………………………………... 54
6.0 References ……………………………………………………………………………….55-67
7.0 Appendix ………………………………………………………………………………..68-72

viii
LIST OF FIGURES AND TABLES
1.0 Introduction
Table 1. Examples of cancer immunotherapy agents, with indications and proposed mechanisms
of action. ……………………………………………………………………………………….... 2
Figure 1. Comparison of antigen engagement between conventional TCR-MHC versus chimeric
receptor T cell antigen coupler (TAC) ………………………………………………………… 12
3.0 Results
Figure 2. Tonic signaling in second-generation CD28ζ CAR T cells results in upregulation of
checkpoint receptors and increased T cell differentiation ……………………………………... 20
Figure 3. Second-generation CAR T cells show upregulation of several checkpoint receptors…21
Figure 4. Tonic signaling in second-generation CAR T cells leads to T cell differentiation and
increased loss of costimulatory receptor expression …………………………………………… 22
Figure 5. Unsupervised hierarchical clustering of non-stimulated CAR and TAC T cells shows
greater similarity between TAC and control T cells …………………………………………… 24
Figure 6. Transcription profiling of BCMA-TAC and BCMA-CD28ζ CAR T cells using RNAseq
shows significant differences in the absence of stimulation …………………………………… 25
Table 2. Gene set enrichment analysis of pathways upregulated by BCMA-CAR T cells relative
to BCMA-TAC T cells …………………………………………………………………………. 26
Figure 7. Downmodulation of CAR and TAC receptors following stimulation with plate-bound
recombinant Fc-conjugated proteins …………………………………………………………… 28
Figure 8. CAR and TAC receptors downmodulate following stimulation with Fc-conjugated
proteins over time………………………………………………………………………………. 29
Figure 9. Proliferation of CD8+ TAC and CD28ζ CAR T cells stimulated by antigen-positive
cells or beads coated with recombinant-Fc-conjugated proteins ………………………………. 31
Figure 10. Effects of co-stimulation are negligible for BCMA-TAC T cell proliferation ……...33
Figure 11. BCMA- and HER2-TAC T cells exhibit lower frequencies of IL-2+ T cells when
stimulation with beads…………………………………………………………………………...34
Figure 12. Proliferation of TAC T cells cannot be induced through exogenous IL-2 supply…...35
Figure 13. Transcriptional analysis of differentially expressed genes ………………………….37

ix
Figure 14. Artificial selection of higher BCMA-TAC receptor expression on T cells increases
sensitivity to low antigen levels ………………………………………………………………...40
Figure 15. HER2-CAR T cells proliferate strongly when stimulated with cells isolated from
lungs of NRG mice ……………………………………………………………………………. 42
Figure 16. CD69 and Nur77 serve as distinct activation markers for CAR- and TAC receptor-
based signaling ………………………………………………………………………………… 45
Figure 17. Ki-67 indicates cell cycle entry of CAR and TAC T cells stimulated with beads or
cells …………………………………………………………………………………………….. 46
Figure 18. Transcriptome analysis of TAC T cells co-cultured with BCMA-Fc-coated beads or
KMS-11 cells at 4h or 24h post-stimulation …………………………………………………… 48
Figure 19. Heat map of transcription factors expressed by TAC T cells 4 or 24h post-stimulation
…………………………………………………………………………………………………... 49
Table 3. List of cell cycle, metabolism, signaling, and apoptosis pathways up- or down-regulated
following bead- or cell-based stimulation of BCMA-TAC T cells…………………………….. 50
7.0 Appendix
Appendix I. Extended graphs of CD69 and Nur77 expression by CAR and TAC T cells
stimulated with BCMA-Fc-coated beads, or KMS-11 cells …………………………………68-69
Appendix II. Heatmap of transcriptome analysis of CD4+ TAC T cells stimulated with beads or
cells …………………………………………………………………………………………….. 70
Appendix III. Fold-change values from differential expression analysis of transcription factors in
TAC T cells ………………………………………………………………………………….71-72
x
LIST OF ALL ABBREVIATIONS AND SYMBOLS
Abbreviations:
ACT - adoptive cell transfer
ADCC - antibody-dependent cell-mediated cytotoxicity
Akt - protein kinase B
ANOVA - analysis of variance
AP-1 - activator protein 1
APC - antigen-presenting cell
BCMA - B cell maturation antigen
BiTE - bispecific T cell engager
CAIX - carbonic anhydrase IX
CAR - chimeric antigen receptor
CD - cluster of differentiation
CFSE - carboxyfluorescein succinimidyl ester
CO2 - carbon dioxide
CRS - cytokine release syndrome
CTLA4 - cytotoxic T lymphocyte-associated protein 4
CTV - CellTrace Violet
DARPin - designed ankyrin repeat protein
DC - dendritic cell
DMEM - Dulbecco's Modified Eagle Medium
DNA - deoxyribonucleic acid
EC50 - concentration of a drug that gives half-maximal response
E:T - effector:target
EF-1α - elongation factor-1 alpha
FBS - fetal bovine serum
Fc - fragment crystallizable region
FcεRI - high-affinity IgE receptor
GM-CSF - granulocyte-macrophage colony-stimulating factor
HEK - human embryonic kidney
HER2 - human epidermal growth factor receptor 2
HLA - human leukocyte antigen
huUCHT1 - humanized UCHT1
IFN - interferon
IgE - immunoglobulin E
IgG - immunoglobulin G
IL - interleukin
ITAM - immunoreceptor tyrosine-based activation motif
IU - international units
JAK-STAT - Janus kinase/signal transducers and activators of transcription
LAG-3 - lymphocyte-activating gene 3
MAPK - mitogen-activated protein kinase
mCMV - minimal cytomegalovirus
MFI - mean/fluorescence intensity
MHC - major histocompatibility complex

xi
MOI - multiplicity of infection
mRNA - messenger RNA
mTOR - mammalian target of rapamycin
NCI - National Cancer Institute
NFAT - nuclear factor of activated T-cells
NGFR - nerve growth factor receptor
NK cell - natural killer cell
NRG - NOD.Cg-Rag1tm1MomIl2rgtm1Wjl/SzJ
N.S. - not significant
PBMC - peripheral blood mononuclear cell
PBS - phosphate buffered saline
PD-1 - programmed cell death protein 1
PD-L1 - programmed death ligand 1
PI3K - phosphoinositide 3-kinase
PSMA - prostate-specific membrane antigen
qPCR - quantitative polymerase chain reaction
rh - recombinant human
RNA - ribonucleic acid
RT - room temperature
scFv - single chain variable fragment
SPICE - simplified presentation of incredibly complex evaluations
TAC - T cell antigen coupler
TCR - T cell receptor
TIL - tumor infiltrating lymphocyte
TIM-3 - T-cell immunoglobulin and mucin-domain containing-3
TNF - tumor necrosis factor
TNFRSF - tumor necrosis factor receptor superfamily
tNGFR - truncated nerve growth factor receptor
ZAP-70 - zeta-chain-associated protein kinase 70
Symbols:
α alpha
β beta
δ delta
γ gamma
ζ zeta
μ micro
°C degrees Celsius
cGy centigray
κ kappa
% percent
xii
DECLARATION OF ACADEMIC ACHIEVEMENT
I, Vivian W.C. Lau, declare that I have independently authored and assembled the contents of
this thesis, with editorial assistance from Professor Bramson. Listed below are the contributions
from colleagues in the providing of materials and/or methods used in this thesis.
Christopher W. Helsen – conceived, cloned, and constructed the T cell antigen coupler (TAC)
receptor, and HER2-TAC constructs
Joanne H. Hammill – cloned and constructed the second-generation HER2-CAR constructs
Ksenia Bezverbnaya – cloned and constructed the BCMA-TAC construct
Galina Denisova – cloned and constructed the BCMA-CD28ζ CAR construct
Christopher Baker – assistance with animal tissue collection
Alina Lelic – designed and provided antibody panels for flow analysis experiments
Anna Dvorkin-Gheva – performed next-generation sequencing data analysis and applied
bioinformatic tools to RNAseq datasets; provided figures from data analysis

M.Sc. Thesis – Vivian W.C. Lau; McMaster University – Biochemistry and Biomedical Sciences
1
1.0 Introduction
1.1 The early history of cancer and the immune system
The concept of immunosurveillance was first proposed in 1909 by German physician
scientist, Paul Ehrlich, as the process by which ‘aberrant’ cells such as cancer cells remain latent
in healthy individuals due to mechanisms that suppress their growth.1 In essence,
immunosurveillance in the context of cancer suggests that although tumour cells naturally
develop and accumulate over time, their deviation from healthy cells enables them to evoke an
immunological response that results in their eradication, thereby preventing further uncontrolled
growth.2 Forty years later, speculations surrounding the concept were supported by several
important observations. In 1943, Ludwik Gross observed that mice inoculated intradermally with
sarcomas were able to resist engraftment and subsequent reinoculation, despite the tumours
originating from genetically identical hosts.3 Further studies showed that chemically-induced
tumours in mice can induce a “state of immunity”, such that subsequent attempts to engraft a
secondary tumour of the same type resulted in tumour rejection.4,5 An intriguing comment came
from F. MacFarlane Burnet’s review on curative cancer treatments in 1957, who suggested:
The acknowledgement that cancer could be considered a disease of the immune system
foreshadows the modern paradigm that a patient’s own immune system can be used for cancer
treatment. Ultimately, these observations support the foundations of modern cancer
immunotherapy which seeks to enhance the immune system to be able to eradicate tumour cells
and maintain a state of immunity against neoplasias.
1.2 Modern cancer immunotherapy targets cancers by enhancing immune function
According to the theory of cancer immunosurveillance, clinical manifestation of cancer
occurs when the immune system has failed to eliminate and suppress neoplastic cells over time.6
Tumours can develop despite the presence of a functional immune system, through
immunosuppressive strategies that allow cancer cells to evade immune recognition. Traditional
cancer therapies involve surgical resection of the tumour, chemotherapy to reduce tumour
growth, and radiation therapy to eradicate the tumour cells. In comparison to traditional
therapies, cancer immunotherapies employ a more targeted approach by recognizing components
of the tumour itself, or promoting immune cells to facilitate an anti-tumour response.7 There are
several major classes of cancer immunotherapies currently employed alone, or in combination
with other immunotherapies or traditional therapies. These can be broadly categorized into cell-
and non-cell-based strategies, with examples and proposed mechanisms of action summarized in
Table 1.
“A slightly more hopeful approach, which, however, is so dependent on the body’s
own resources that it has never been seriously propounded, is the immunological one.”

M.Sc. Thesis – Vivian W.C. Lau; McMaster University – Biochemistry and Biomedical Sciences
2
Table 1. Examples of cancer immunotherapy agents, with indications and proposed mechanisms of action.
Type of Agent Examples of Agents
(Trade names)
Indication(s) Proposed Mechanism of Action Reference
Cytokines
IL-2 (Aldesleukin)
Melanoma,
renal cell
cancer
Broad immunostimulation 8
Type I interferons
(Intron-A, Sylatron)
Leukemias,
melanoma Broad immunostimulation 9
Checkpoint
inhibitor
monoclonal
antibodies
Anti-CTLA-4
(Ipilimumab)
Melanoma
Blocks inhibition of lymphocyte
activation
10
Anti-PD-1
(Nivolumab) Melanoma 11
Anti-PD-L1
(atezolizumab) Bladder cancer 12
Tumour antigen-
specific
monoclonal
antibodies
Anti-CD20
(rituximab) Leukemias
Antibody-dependent cellular
cytotoxicity (ADCC) by NK cells 13
Anti-HER2
(trastuzumab) Breast cancer
Inhibition of tumour cell
proliferation; ADCC 14
Bispecific
antibodies and T
cell engagers
CD3-CD19 bi-specific
T cell engagers
(blinatumomab)
Leukemias Recruitment of T cells to specific
antigen-expressing tumour cells 15
Peptide-based
vaccines Oncophage (Vitespen) Melanoma
Tumour peptides are presented on
MHC-Class I molecules for
lymphocyte activation
16
Dendritic cell
vaccines
Sipuleucel-T
(Provenge)
Prostate
cancer
Priming of lymphocytes with DCs
loaded with prostatic acid
phosphatase and GM-CSF
17
Oncolytic viruses T-vec Melanoma Lysis of infected tumour cells; broad
immunostimulation 18
Adoptive cell
therapy
Tumour-infiltrating
lymphocytes Melanoma
Lysis of tumour cells by antigen-
specific T cells
19,20
TCR-engineered T
cells Melanoma 21
Chimeric antigen
receptor T cells
(Kymriah, Yescarta)
Leukemias 22,23

M.Sc. Thesis – Vivian W.C. Lau; McMaster University – Biochemistry and Biomedical Sciences
3
Cell-based therapies overcome several limitations of other biological therapies, such as
monoclonal antibodies. Cells are living components that can adapt and respond to their
environment, which can make them more amenable to the heterogeneous nature of tumours. As
an example, the longevity of T cells and their intrinsic capability to differentiate into memory
populations make them highly useful in suppressing tumour growth over the long term.
However, live cell therapies are disadvantaged by their degree of personalization as they
typically employ the patient’s own cells. This significantly increases the cost of the therapy, and
makes their manufacturing, preparation, and dosing difficult to manage. Nevertheless, cell-based
immunotherapies remain a promising form of cancer therapy as demonstrated by their
breakthrough success when used for adoptive cell transfer.
1.3 The T cell receptor is responsible for antigen recognition by T cells
T lymphocytes are one of two primary white blood cell-types of adaptive immunity,
which can mount specific immune responses. Over the past 50 years, the development of
microscopic techniques, advancement in gene manipulation, and the use of transgenic animal
models have led to significant improvements in our understanding of T cell activation. In vitro
culturing of engineered T cells was made possible by several discoveries spanning the 1970s and
1980s. Examples of these landmark discoveries include the identification of IL-2 as a primary T
cell growth factor24, discovery of T cell receptor complex components25–28, and uncovering the
critical role of costimulation during T cell activation.29,30 These concepts will be described in
greater detail in subsequent sections.
T cells recognize and respond to antigens, which are defined as substances that can elicit
an antibody response from the host immune system.31 Antigen-presenting cells (APCs), such as
dendritic cells, specialize in processing whole antigens such as viral proteins into peptides, which
are presented on major histocompatibility complex (MHC) molecules. Recognition of peptides in
the context of MHC molecules by T cells is dependent on the T cell receptor (TCR), a
transmembrane protein consisting of a heterodimeric αβ or γδ subunit.32 A majority of circulating
T cells carry αβ TCRs; each α and β subunit contains highly polymorphic variable domains
which grants significant diversity in the peptide-antigens recognized by a given T cell
repertoire.31 While the TCR does not possess signaling domains of its own, it is non-covalently
associated with the CD3 complex, which is composed of three dimers, CD3ε-CD3δ, CD3ε-
CD3γ, and CD3ζ-CD3ζ. 33,34,35 Signal transduction through the TCR relies on the CD3 complex,
which contains intracellular immunoreceptor tyrosine-based activation motifs (ITAMs).26,36,37
ITAMs are conserved amino acid sequences containing tyrosine residues, which are
phosphorylated by tyrosine kinases to serve as the first step in signal transduction following
ligand engagement.38 The TCR-CD3 complex contains a total of 10 ITAMs; one on each of
CD3δ, ε, and γ intracellular domains, and six are located within the intracellular tails of the CD3ζ
homodimer.39 Early experiments that showed that ITAM phosphorylation leads to downstream T
cell activation, measured by activation marker CD69 upregulation, or cytokine production.26
Subsequent studies identified tyrosine kinases Lck and zeta-associated protein-70 (ZAP-70) as
key mediators for initiating signal transduction through ITAM phosphorylation.36,40

M.Sc. Thesis – Vivian W.C. Lau; McMaster University – Biochemistry and Biomedical Sciences
4
1.4 T cell activation initiates a cascade of biophysical and biochemical downstream effects
The process of TCR-CD3-MHC ligation and is known as TCR triggering, and results in
several biochemical and biophysical changes that ultimately result in T cell proliferation,
cytokine production, and/or effector function, depending on the extent of cellular activation.41
Several models for T cell triggering exist, each describing the biophysical events that result in
complete signal transduction. There is currently no unifying theory that consolidates all the
theories for TCR triggering. This is further complicated by variability in the types of T cells used
in each study, methods used to determine kinetics measurements, and whether coreceptors,
costimulatory receptors, and adhesion molecules are also contributing to the quality of the
interaction.42
One theory suggests that when a T cell recognizes an antigen, an immunological synapse
forms which segregates signaling components on the plasma membrane.43 This kinetic-
segregation model proposes that phosphatases, such as CD45, are excluded from the region
where TCR:peptide-MHC are bound, which allows for sustained ITAM phosphorylation by
tyrosine kinases in close proximity through formation of microclusters.44,45 Another model, the
kinetic-proofreading model, suggests that productive binding events only occur if TCR are
bound long enough for a series of phosphorylation steps to occur. Intermediate steps between
TCR engagement allows for error correction, where fast off-rates from weak interactions can
allow the T cell to reverse biochemical modifications.46 Compared to strong agonists that fully
phosphorylate all tyrosine residues of the CD3ζ homodimer, stimulation by weak TCR agonists
or antagonists only resulted in partial ζ-chain phosphorylation.47,48 However, later experiments
attested that T cell activation is not necessarily an “all or nothing” response. These studies
showed that signals originating from weak TCR agonists, as determined by their rapid koff
measurements, can accumulate over time and produce T cell effector functions such as CD69
upregulation or cytokine production. However, these responses were significantly delayed
compared to signals triggered by strong TCR agonists.49 Furthermore, coreceptors CD4 and CD8
can stabilize weak TCR:peptide-MHC interactions by binding to non-variant regions of MHC
class II and class I, respectively.50 One primary function of coreceptors is to recruit kinases such
as Lck, which phosphorylate ζ-chains of the TCR and ZAP-70.51,52 CD4 and CD8 bind to MHCs
with fast kinetics. Several studies have shown that only CD8 is important for low affinity
TCR:peptide interactions, and CD4 has little to no impact on TCR triggering.53,54 This suggests
that the primary function of coreceptors is to deliver Lck and facilitate the early steps in signal
transduction.55
A third model with significant experimental evidence describes serial engagement of
multiple TCR molecules by a single peptide-MHC during TCR triggering.56 On a macro scale of
TCR triggering, individual TCR and ligand interactions may last a few seconds, whereas
interactions between a single T cell and target cell, such as an APC, takes place over several
hours. At low ligand densities of <100 per APC, each peptide-MHC molecule can trigger up to
200 separate TCRs, which amplifies the signal, extends the duration of signaling, and allows for
accumulation of signaling intermediates that lead to complete T cell activation.57 Several studies
have correlated serial triggering with sustained signaling, and showed its role in promoting

M.Sc. Thesis – Vivian W.C. Lau; McMaster University – Biochemistry and Biomedical Sciences
5
downstream T cell cycle progression, and differentiation.58–60 Consequently, TCR
downmodulation following antigenic stimulation has also been used as a marker for sustained
signaling or productive binding.56,61,62 From a functional perspective, downmodulation acts as a
negative feedback mechanism that limits responsiveness to further T cell signaling, thereby
preventing overstimulation and prohibiting excessive inflammatory responses.63–66 Interestingly,
ligand-independent mechanisms have also been shown modulate TCR expression; as an
example, engagement of the programmed cell death-1 (PD-1) pathway was demonstrated to
induce ubiquitin ligase expression and subsequent targeting of TCR for degradation.67
1.5 Costimulation, in addition to TCR triggering, is required for T cell activation
Early reports of costimulation in T cells highlighted the role of CD28 in augmenting
cytokine production in human T cells following stimulation through the TCR-CD3 complex.29
CD28 can enhance TCR triggering by lowering the threshold of TCR occupancy required, and
acts as an amplifier of early TCR signaling.68 In the context of infection, upregulation of
costimulatory molecules by APCs can provide appropriate signal amplification that leads to T
cell activation. Conversely, antigen recognition by the TCR in the absence of costimulation
during initial antigen encounter will result in TCR hyporesponsiveness, or T cell anergy.69,70 This
is the basis for the “two-signal” concept of T cell activation mentioned earlier, which dictates
that T cells will optimally activate only when signal 1 (antigen recognition by the TCR) and
signal 2 (costimulatory signals) are presented concurrently.71,72 Functionally, CD28 signaling
activates the PI3K pathway, which leads to Akt and mTOR signaling. Synergistic with TCR
triggering, CD28 activation optimally induces IL-2 production through Akt signaling73, which
increases glycolytic metabolism in T cells to support biosynthesis.74 Although CD28 may be the
most well-studied costimulatory receptor in T cells, its function, overlaps with other
costimulatory receptors belonging to the TNF receptor superfamily (TNFRSF). TNFRSF
receptors include, but are not limited to, 4-1BB (or CD137), CD27, and OX40.72 Together,
costimulation from the TNFRSF receptors perform a variety of functions, and share
commonalities in their ability to upregulate anti-apoptotic genes such as Bcl-2 and Bcl-XL which
can render activated T cells more resistant to cell death than non-activated counterparts.75,76
A hallmark of adaptive immunity conferred by T cells is their ability to differentiate into
long-lived memory populations.77,78 Transformation of T cells into long lived effector cells
requires CD2879,80, or CD27, 4-1BB, and OX40, collectively. 81,82,83Memory T cells can be
broadly classified into two subgroups; central memory T cells (TCM), and effector memory T
cells (TEM).79 TCM cells are considered superior for tissue homing functions compared to TEM as
they express receptors important for extravasation, such as CD62L and CCR7.84 Conversely, TEM
cells are better at patrolling the periphery and exerting immediate cytotoxic functions upon
antigen encounter. TCM also have greater proliferative capacity, and have demonstrated superior
anti-tumour immunity compared to TEM.85,86 Based on these findings, some groups select for
specific memory T cell subsets prior to ACT, either by immunoseparation using magnetic
beads87–89, or cytokine cocktails that preserve memory T cell phenotypes during ex vivo
expansion.90
M.Sc. Thesis – Vivian W.C. Lau; McMaster University – Biochemistry and Biomedical Sciences
6
1.6 Expression of coinhibitory receptors negatively regulates T cell activation
Immune responses are tightly regulated via costimulated and coinhibitory pathways.
Coinhibition is the opposing function of costimulation, whereby coinhibitory receptors are
expressed following T cell activation to prevent overactivation and excessive inflammation.72
Coinhibitory pathways are also essential for preventing potentially dangerous reactivity against
self-antigens, which can result in autoimmune disease if dysregulated.91 Coinhibitory receptors
serve as direct negative feedback regulators, and multiple mechanisms exist to shut down T cell
activation.92 The most well-studied coinhibitory receptor is cytotoxic T lymphocyte-associated
protein 4 (CTLA4), which peaks in expression 24-48 hours following T cell activation.93 CTLA4
binds to equivalent ligands as CD28 with 10-20-fold higher affinity, thereby terminating CD28
costimulation through competition.92 Similarly, programmed cell death protein 1 (PD-1) is
another well-characterized coinhibitory receptor whose interaction with its ligand PD-L1 results
in recruitment of phosphatases, and termination of CD28 signaling through dephosphorylation
of tyrosines required for signal transduction.94 Although expression of coinhibitory receptors are
normally transient following T cell stimulation, chronically stimulated T cells express multiple
coinhibitory receptors at persistent levels over time.95 In the context of cancer, tumour-reactive T
cells are constantly exposed to high antigen load from tumour cells, leading to ‘exhaustion’ and
eventual loss of anti-tumour immunity.96 T cell experience progressive loss of effector functions
en route to exhaustion. Loss of cytokine production (e.g. IFNγ, TNFα, and IL-2), cytolytic
capacity, and proliferation is followed by apoptosis of dysfunctional T cells.97
The tumour microenvironment is capable of suppressing T cell cytotoxicity through
upregulation of ligands that activate T cell coinhibitory pathways.98 Chronically stimulated T
cells in models of murine viral infection can be rescued from exhaustion through blocking of
coinhibitory pathways using antibodies.99 Following these observations, patients treated with
monoclonal antibodies targeting the PD-1/PD-L1 pathway have shown objective response rates
above 70% in some cancers including melanoma, and Hodgkin’s disease.100
As will be discussed shortly, the use of T cells for cancer immunotherapy face similar
challenges in balancing stimulation and inhibition within the complex tumour microenvironment.
The focus on modern T cell therapies have focused on strategies that activate T cells specifically
against tumour cells, and complementary agents that can increase their potency.
1.7 Harnessing the power of anti-tumour T cells using adoptive cell transfer
A leading form of cell-based immunotherapy is adoptive cell transfer (ACT) of T
lymphocytes, in which tumour-specific T cells are infused into a patient to mediate an anti-
tumour effect.101 T cells are particularly attractive for use as an immunotherapeutic due to their
abundance in peripheral blood, and their natural ability to exert direct cytolytic activity against
tumour cells.6
In the first ACT study of patients with metastatic cancers, T cells were isolated from
peripheral blood and expanded ex vivo with interleukin-2 (IL-2), a growth factor for T cells. Out
of 25 patients, almost half showed marked tumour regression, and one melanoma patient
M.Sc. Thesis – Vivian W.C. Lau; McMaster University – Biochemistry and Biomedical Sciences
7
experienced complete remission of all metastatic lesions.102 These results led to subsequent trials
wherein T cells are isolated directly from metastatic melanoma sites, expanded ex vivo with IL-2,
and reinfused into the patient.103 These tumour-specific T cells, termed tumour-infiltrating
lymphocytes (TILs), were combined with a pre-infusion lymphodepleting regimens to improve
persistence and expansion of TILs following reinfusion. TILs continue to show promising results
for metastatic melanoma. Recent clinical trials show that a majority of patients experience a
partial response to treatment at a minimum, and a subset of patients show complete remission.19
However, efficacy of TILs remains restricted to melanoma, due to difficulties in isolation of
TILs from other types of solid tumours. Despite this limitation, TILs attest to the potential of
harnessing T cells for their natural anti-tumour capacity.
1.8 Non-specific T cells in peripheral blood can be rendered tumour-specific
The development of recombinant viruses for gene transfer gave rise to the opportunity to
genetically modify human T cells.104–106 Genetically engineered T cells could be expanded into
large quantities ex vivo while retaining transgene expression in all daughter populations, prior to
reinfusion into the patient. T cells engineered to express a high affinity TCR against a specific
peptide grants T cells the ability to recognize rare, tumour-associated antigens.107 This strategy
has experienced success against metastatic melanoma108,109, and multiple myeloma21, where the
infused T cells were well-tolerated and induced tumour regressions in several patients.
Due to the highly specific nature of the interaction between TCR and MHC molecules,
however, TIL therapy and TCR-engineered T cells are restricted by their dependence on
expression of specific human MHC molecules (i.e. human leukocyte antigen (HLA)) haplotypes,
limiting their application to a subset of patients. Furthermore, many cancers downregulate HLA
in response to selective pressure by immune cells that recognize transformed cells through
antigens presented on HLA molecules.110.
In the late 1980’s, Eshhar and colleagues described the first chimeric receptor that
provided T cells with antibody-like specificity against a chosen antigen.111 This “chimeric T cell
receptor”, or “T-body”, was designed to overcome the issues of HLA restriction, described in the
previous paragraph, by redirecting T cell activation towards surface-expressed antigen in an
HLA-independent manner. T-bodies employed a binding domain which was a derivative of a
monoclonal antibody known as a single-chain antibodies (scFvs). Single-chain antibodies are
fusion proteins consisting of variable regions of the heavy and light chains of immunoglobulins,
linked by a short peptide.112 More importantly, scFvs retained equivalent antigen specificity
compared to the whole immunoglobulin113, and could even be engineered to increase their
stability and affinity.114,115 T-bodies were designed to mimic T cell receptor (TCR) signaling by
consolidating a T cell’s antigen-recognition complex into a single synthetic protein capable of
eliciting T cell activation. T-bodies composed of an scFv fused to a γ or ζ chain from the TCR-
CD3 complex were able to activate T cell hybridomas through antigen-dependent stimulation,
leading to IL-2 production and lysis of target cells.116 Over the years, T-bodies continued to
evolve as our knowledge of T cell signaling improved. T-bodies are now known as chimeric

M.Sc. Thesis – Vivian W.C. Lau; McMaster University – Biochemistry and Biomedical Sciences
8
antigen receptors (CARs) and CAR-engineered T cells are the most successful form of adoptive
cell therapy commercially available.117
1.9 First-generation CAR designs are based on the earliest TCR activating signal
As described above, the signal transduction moieties incorporated into CARs were
derived from our understanding of fundamental T cell receptor signaling. CARs incorporating
only one activating signal, such as a CD3ζ intracellular domain, are now referred to as first-
generation receptors. Early experiments comparing the intracellular domain of the Fc receptor
for IgE (FcεRI)-γ to the CD3ζ cytosolic tail of the TCR complex showed enhanced in vivo
tumour control by CD3ζ variants.118 These results supported its adoption as the dominant
signaling domain used in future CAR constructs.
Structurally, CARs exist as homodimers on the surface of T cells, but also form
heterodimers with endogenous CD3ζ chains from the TCR.119 In a mouse T cell line that lacks
endogenous expression of CD3ζ, CAR expression can rescue expression of TCR-CD3
complexes , indicating that CARs interact directly with the complex, and may be providing a
source of CD3ζ that restores complex stability. In addition to physical interaction between CARs
and endogenous TCR-CD3 complexes, CARs can activate T cells both directly (i.e.
independently of the TCR) and indirectly by utilizing components of the TCR.120 Interestingly,
progressive truncation of the CD3ζ tail in CARs revealed that stimulation through the CAR was
largely unaffected by the third ITAM residue.120 However, loss of the first or second ITAM
resulted in reduced responsiveness to antigen stimulation.
Despite early experiments demonstrating that CARs bearing a simple CD3ζ signaling
domain were capable of tumour lysis in vitro116, such CAR designs failed to promote T cell
proliferation or IL-2 production.121 In a phase I trial involving two refractory follicular
lymphoma patients, first-generation CAR T cells could not be detected beyond 7 days following
infusion.122 Patients observed neither toxicities nor clinical responses, indicating that these CAR
T cells were not capable of persisting long enough for anti-tumour activity. Trials targeting
different antigens in ovarian cancer123, neuroblastoma87, and renal cell carcinoma124, observed
similar deficiencies in persistence of the first-generation CAR T cells.
1.10 Second-generation CARs show enhanced T cell activation and persistence
The lack of persistence of first-generation CAR T cells prompted further consideration of
the CAR design. As the understanding of costimulation grew during the 1990’s, it became clear
that signaling via the TCR alone would render a T cell non-function (i.e. anergic) whereas
concomitant signaling via the TCR and the CD28 costimulatory receptor would lead to robust T
cell proliferation and functionality. This knowledge led to the discovery that addition of a
costimulatory domain to first-generation CAR T cells was crucial for in vivo persistence and
anti-tumour efficacy in both mouse models, and human clinical trials.125,126 It remains uncertain
which costimulatory domain provides optimal survival signals. The two dominant costimulatory
domains used in second-generation CARs are derived from CD28, or 4-1BB (a.k.a. CD137),

M.Sc. Thesis – Vivian W.C. Lau; McMaster University – Biochemistry and Biomedical Sciences
9
which activate distinct signaling pathways in T cells.127 Clinical data shows that 4-1BB CARs
have longer T cell persistence in patients, detectable in peripheral blood up to 6 months
following infusion, whereas CD28 CARs typically lasted 8 weeks or less.128 This can be
explained by the distinct signaling pathways activated by CD28 and 4-1BB. CD28 signals trigger
IL-2 production, which is an important cytokine for T cell progression through the cell cycle,
followed by upregulation of anti-apoptotic genes such as Bcl-XL.129 Comparatively, 4-1BB
belongs to the tumour necrosis factor receptor superfamily and has been shown to promote long-
term survival and persistence of T cells in vivo.130 For CAR T cells, 4-1BB signals enable
enhanced survival compared to CD28, with an increase in the frequency of central memory T
cells, which are in a less differentiated state than the effector T cell populations found in CD28
CARs. Although it may seem that 4-1BB CARs are outperforming CD28 CARs currently in
CD19-positive cancers, it remains plausible that CD28 CARs may confer greater efficacy against
other tumour types. In solid tumours where metabolic requirements are constrained by the
tumour’s nutrient uptake131, it is possible that CD28 signaling can sensitize T cells towards lower
glucose concentrations132, thereby improving anti-tumour efficacy against hard-to-treat tumours.
Careful consideration is required to select the costimulatory domain to achieve optimal
functionality, as some domains can reduce efficacy133, or induce of tonic signaling in the absence
of antigen.134 In the context of CAR T cells, extracellular ligand-binding differs significantly
from TCR-based stimulation because the single chain antibodies typically used for antigen
recognition is at least 2-3 orders of magnitude higher in affinity.135–137 Furthermore, it is not
known whether CARs utilize all or some of the kinases involved in TCR signaling, since CARs
have ITAM signals and costimulation built into a single receptor. Recent studies have shown that
CARs are capable of kinase recruitment and phosphatase exclusion, similar to TCR-based
signaling.45 While second-generation CARs led to improvements in anti-tumour efficacy, robust
CAR activation and rapid tumour clearance also resulted in significant onset of toxicities in
many patients. Potential unpredicted off-tumour toxicities associated with the use novel scFvs
add to the toxic profile of these promising new therapeutics.
1.11 Toxicities observed in patients treated with CAR T cells
The onset of severe toxicities can hinder anti-tumour efficacy and cause severe systemic
damage despite on-target effects.138,139,140 As mentioned previously, the use of scFvs and other
antigen binding domains circumvents MHC expression on target cells, and theoretically allows
for targeting of any antigen of choice. However, the antigen must be surface expressed and
ideally at high enough levels for differentiation between healthy and cancerous cells. On-target,
off-tumor toxicity is of significant concern to solid tumors where targets that are exclusively
expressed in the tumor are rare. Early clinical trials using CAR T cells targeting carbonic
anhydrase IX (CAIX) for treatment of renal cell carcinomas saw liver toxicities in patients
following infusion, due to CAIX expression on bile duct epithelial cells.124,141 Similarly, infusion
of HER2 CAR T cells caused serious lethal on-target toxicities in one patient, due to reactivity of
CAR T cells against HER2 expressed by lung epithelial cells.142 To mitigate off-tumor
toxicities, several groups have engineered split-signal CARs that utilize Boolean gating to

M.Sc. Thesis – Vivian W.C. Lau; McMaster University – Biochemistry and Biomedical Sciences
10
control activation based on two tumour-associated signals, rather than the tumour antigen alone.
One example of this was demonstrated by Kloss et al., who expressed two receptors on the
surface of primary T cells; the first receptor consisted of a single chain antibody recognizing
CD19, fused to CD3ζ, while the second receptor consisted of a second single chain antibody
recognizing prostate-specific membrane antigen (PSMA), fused to a 4-1BB intracellular
domain.143 Because CD19 is expressed by both healthy and malignant B cells, and PSMA is only
expressed by malignant cells, this strategy ensured that only malignant cells expressing both
antigens would activate both signal 1 and signal 2 in CARs. This idea could in theory be applied
to any set of antigens, where healthy tissues only express the targeted antigen at low levels, and
rarer tumour-specific antigens are restricted to tumour cells.
Another well-documented adverse event following CAR T cell infusion is immune
activation leading to cytokine release syndrome (CRS).144 CRS is a group of symptoms caused
by the infused CAR T cells, as well as bystander immune cells such as macrophages, which
results in massive production of pro-inflammatory cytokines. This systemic inflammatory
response can be life-threatening, and manifests in up to 70-100% of patients treated with CAR T
cells against CD19.145 Onset and severity of CRS is correlated with initial tumour burden and
disease progression.146 Although management of toxicities to counteract CRS is possible, many
treatments can diminish CAR T cell activity and negatively impact anti-tumour efficacy.147
One strategy to control toxicities is the inclusion of “suicide genes” such as inducible
caspase-9 that are co-expressed with CARs following T cell engineering, such that caspase-
dependent apoptosis can be triggered in CAR T cells following specific administration of a
single drug.143,148 Suicide genes allow for CAR activity to be actively modulated following
administration to mitigate excessive systemic toxicities. Furthermore, genetically modified T
cells can be removed from a patient following treatment to prevent the risk of developing
leukemia.
1.12 Tonic signaling in CAR T cells hinders anti-tumour efficacy
A major pitfall of incorporating fixed signaling domains in CAR T cells is the
manifestation of tonic signaling, which primarily occurs due to spontaneous aggregation of the
extracellular single chains used for antigen recognition.134,149 In CAR constructs where tonic
signaling is prominent, upregulation of coinhibitory receptors such as PD-1 and lymphocyte-
activating gene 3 (LAG-3) was observed.134 Expression of coinhibitory receptors, also referred to
as “checkpoint receptors”, severely limits T cell activation and renders them dysfunctional due to
chronic stimulation through the T cell receptor.150
T cell dysfunction resulting from tonic signaling is independent of antigen stimulation.
The use of constitutive strong promoter can result in high surface expression of the CAR, which
exacerbates tonic signaling.149 Several groups have created inducible CARs, where receptor
expression can be controlled by inducible or conditional promoters. One example of this strategy
was successfully demonstrated by two groups, who created independent Tet-ON and Tet-OFF
expression systems for CAR induction. In the Tet-OFF system, removal of doxycycline from the
culture media enabled CAR expression in up to 90% of T cells by 96 hours.151 In the Tet-ON

M.Sc. Thesis – Vivian W.C. Lau; McMaster University – Biochemistry and Biomedical Sciences
11
system, T cells were expanded ex vivo in the absence of doxycycline and CAR expression, and
adoptively transferred into tumour-bearing mice with and without doxycycline treatment.152
Mice receiving both CAR T cells and systemic doxycycline showed significant reduction of
leukemic tumour burden, and prolonged survival compared to constitutively-expressed CARs.
These studies show that not only are inducible CARs feasible as part of the manufacturing
process, but they also pose a therapeutic improvement by mitigating tonic signaling inherent in
many CAR constructs.
1.13 Direct comparisons between CAR- and TCR-based stimulation
Comparing T cell stimulation following CAR and TCR ligation is challenging due to the
dissimilarity in binding interactions between the receptors and their targets (cell surface antigens
and MHC/peptide complexes, respectively). Although it is possible to generate a single chain
antibody that binds to a specific peptide-MHC, it is unlikely to generate a combination that has
the same affinity and functional avidity compared to its interaction with native TCR
complexes.153,154 Harris et al. derived a TCR α and β heterodimer linked to CAR intracellular
domains that exhibited similar binding affinity as the native αβ dimer recognizing the same
peptide-MHC.155,156 Interestingly, CAR constructs exhibited a 10-100-fold reduction in their
sensitivity to peptide-MHC complexes when directly compared to TCR counterparts, despite
being expressed at a higher surface density on T cells. For all effector cytokines tested, including
IFNγ, IL-2, and TNFα, the EC50 (i.e. concentration of peptide required for half maximal cytokine
response) was two orders of magnitude lower for TCRs than CARs. As mentioned previously, it
is possible that the structure of TCR is highly conserved for optimal ligation with peptide-MHC
molecules, whereas linkage of TCRαβ domains onto CAR signaling scaffolds does not support
synapse formation. However, it is worthwhile to note that although CARs are less sensitive to
stimulation in these constructs, they can produce higher concentrations of cytokines when
stimulated with high levels of peptide.
A separate report compared signaling of CARs and TCRs by transducing the same T cell
with a TCR specific for SIINFEKL peptide, and a CAR specific for HER2.157 Authors showed
that stimulation through the TCR led to assembly of specific adhesion molecule “rings”, whereas
localization of the same molecules were indiscriminately distributed when stimulated through the
CAR. Furthermore, proximal and distal phosphorylation of kinases was strong and more rapid
following CAR stimulation than through the TCR. This ultimately led to faster recruitment of
cytotoxic granules and faster immunological synapse resolution following ligation with a target
cell.
These studies indicate that CARs likely do not follow similar mechanisms of T cell
activation compared to conventional TCR triggering. Because we cannot yet predict the type of
signal that will activate a CAR T cell, this makes toxicities in patients hard to anticipate, and
effector functions unpredictable due to variation in tumour burden and antigen availability
between patients.

M.Sc. Thesis – Vivian W.C. Lau; McMaster University – Biochemistry and Biomedical Sciences
12
1.14 The TAC receptor as an alternative to CARs
Our lab has generated a novel chimeric receptor termed T cell antigen coupler (TAC),
which possesses distinct structure and biology compared to CAR T cells. The TAC receptor is
designed to activate a T cell through simultaneous recruitment of the tumour target and TCR
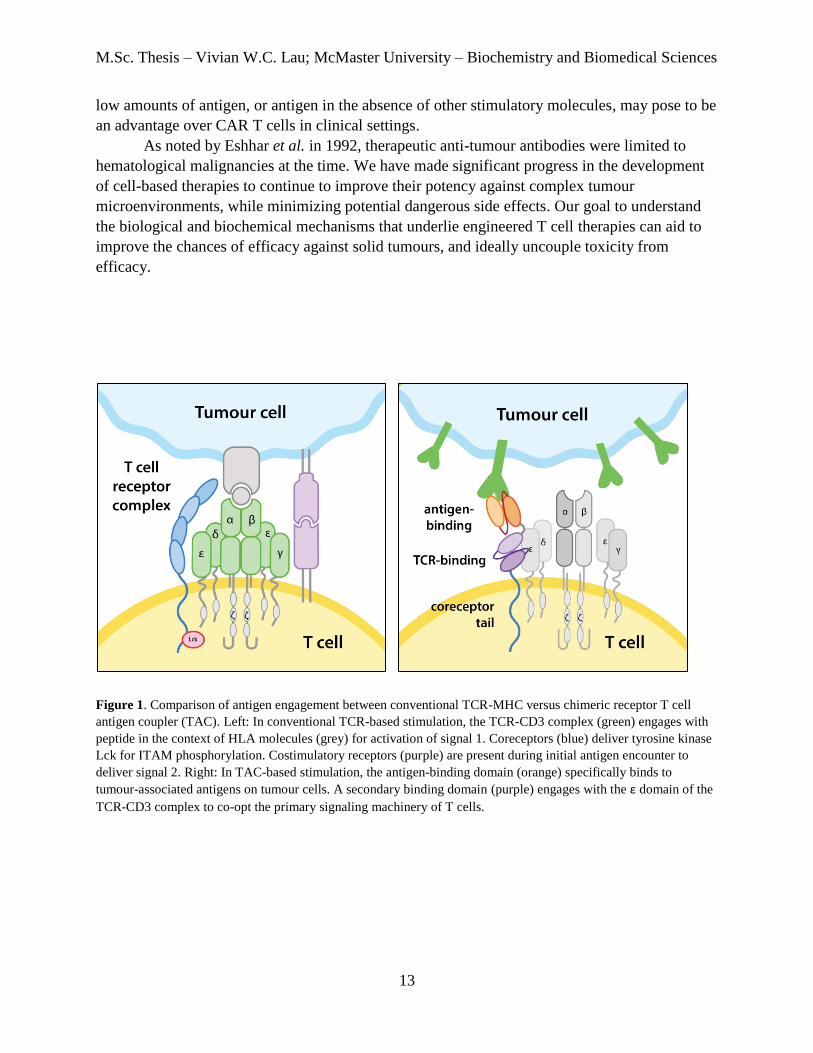
signaling complex using two independent binding domains. The receptor is composed of three
components: (1) an antigen-binding domain, (2) an anti-CD3ε scFv for TCR recruitment, and (3)
a coreceptor domain (hinge, transmembrane, and cytosolic regions) (Figure 1). We believe that
the TAC receptor operates through native TCR signaling machinery via binding of CD3ε, and
subsequently utilizes kinases such as Lck for signal transduction following antigen recognition.
We have recently reported on the rationale for TAC receptor design, and experimental
evidence that TAC T cells possess distinct biology and functional efficacy compared to CAR T
cells engineered with equivalent antigen binding domains.158 Although TACs are designed to
bind CD3ε of the TCR complex, this proposed interaction does not appear to trigger
autoactivation of T cells with surface TAC expression. Consistent with literature, however, CAR
T cells carrying the same binding domain exhibits significant levels of tonic activation that
results in checkpoint receptor upregulation and increased T cell differentiation in the absence of
antigen-dependent stimulation.
Most striking was the contrast of TAC and CAR T cell efficacy in a murine xenograft
model of ovarian carcinoma. While TAC T cells mediated potent and rapid tumour regression,
CAR T cells elicited significant and lethal toxicities in all mice, regardless of tumour burden.
This off-tumour, off-target response against an unknown antigen was not observed in any dose of
TAC T cells tested. Although the effects of this model are attributable to the specific antigen-
binding domain used, the question remains why TAC T cells did not cause equivalent toxicities,
assuming the same binding domain on TAC or CAR T cells could recognize the same off-target
antigen. Based on several clinical reports concerning the severity of toxicities elicited by CAR T
cell infusion in human patients144,147,159, it would be highly beneficial to employ an engineered T
cell approach that offers lower incidence of side effects during treatment.
The data reported in this thesis show that TAC and CAR T cells are fundamentally
different, both in the absence of stimulation, and in response to stimulation. Differences during
basal states are largely caused by tonic activation of CAR T cells, which was significantly less
prominent in TAC T cells. Phenotypic and transcriptional analyses show that TAC T cells were
more similar to control T cells expressing only the transduction marker, whereas CAR T cells
showed extensive evidence of tonic activation. The more interesting discovery, however, was
that TAC T cells were more sensitive to the context of stimulation compared to CAR T cells, as
we explored different sources of antigen in the form of bead-bound targets, or cell-based
stimulation. CAR T cells were agnostic to the source of antigen and could respond equally well
when stimulation with bead-bound antigen or tumour cells. Conversely, TAC T cells only
reached optimal activation equivalent to CAR T cells when stimulated with tumour cells, but not
bead-bound antigen. This important functional dichotomy between TAC and CAR T cells and
potential mechanisms are further explored. The lack of response by TAC T cells towards either
M.Sc. Thesis – Vivian W.C. Lau; McMaster University – Biochemistry and Biomedical Sciences
13
low amounts of antigen, or antigen in the absence of other stimulatory molecules, may pose to be
an advantage over CAR T cells in clinical settings.
As noted by Eshhar et al. in 1992, therapeutic anti-tumour antibodies were limited to
hematological malignancies at the time. We have made significant progress in the development
of cell-based therapies to continue to improve their potency against complex tumour
microenvironments, while minimizing potential dangerous side effects. Our goal to understand
the biological and biochemical mechanisms that underlie engineered T cell therapies can aid to
improve the chances of efficacy against solid tumours, and ideally uncouple toxicity from
efficacy.
Figure 1. Comparison of antigen engagement between conventional TCR-MHC versus chimeric receptor T cell
antigen coupler (TAC). Left: In conventional TCR-based stimulation, the TCR-CD3 complex (green) engages with
peptide in the context of HLA molecules (grey) for activation of signal 1. Coreceptors (blue) deliver tyrosine kinase
Lck for ITAM phosphorylation. Costimulatory receptors (purple) are present during initial antigen encounter to
deliver signal 2. Right: In TAC-based stimulation, the antigen-binding domain (orange) specifically binds to
tumour-associated antigens on tumour cells. A secondary binding domain (purple) engages with the ε domain of the
TCR-CD3 complex to co-opt the primary signaling machinery of T cells.
M.Sc. Thesis – Vivian W.C. Lau; McMaster University – Biochemistry and Biomedical Sciences
14
2.0 Materials and Methods
CAR and TAC vector generation. CAR and TAC receptor transgenes and vectors were
designed as previously described.158 Briefly, the TAC sequence is comprised of an antigen-
binding domain linked to a CD3ε-targeting scFv, followed by the hinge, transmembrane, and
cytoplasmic domains of CD4. The CD3ε-binding domain uses a humanized version of the
UCHT1 scFv (huUCHT1). Anti-HER2-TAC uses a HER2-specific H10-2-G3 designed ankyrin
repeat protein (DARPin)160 downstream of an Igκ leader sequence. The HER2-DARPin was
cloned into the pUC57 plasmid containing the huUCHT1, CD4 hinge, transmembrane, and
cytoplasmic domains, followed by subcloning of the entire HER2-TAC sequence into the pCCL
lentiviral transfer vector (kindly obtained from Dr. Megan Levings, University of British
Columbia, Vancouver, BC). Anti-HER2-CD28ζ CAR consists of the same H10-2-G3 DARPin,
and was obtained as previously described.160 Anti-HER2-4-1BBζ CAR consists of the H10-2-G3
DARPin, CD8α hinge and transmembrane domains, 4-1BB cytoplasmic tail, and CD3ζ
cytoplasmic tail portions from an anti-CD19 CAR, described in 161. Anti-BCMA CAR and TAC
receptors, the anti-BCMA scFv (C11D5.3) sequence was obtained from patent
US20150051266A1162 and synthesized by Genscript. The scFv was subcloned into existing
pCCL TAC and CD28ζ-CAR lentiviral backbones using AscI and BamHI cut sites, replacing the
existing scFv with C11D5.3. The pCCL vector contains a bi-directional promoter for the
chimeric receptor under EF-1α promoter, and truncated nerve growth factor receptor (tNGFR)
under minimal CMV promoter as a transduction control. For constructs containing puromycin
resistance in the transfer vector, receptor transgenes were subcloned using AscI and NheI cut
sites from the pCCL-tNGFR vector, to a pCCL vector with a puromycin-N-acetyltransferase
gene replacing tNGFR.
Lentivirus generation. Third-generation, self-inactivating and non-replicative lentivirus was
produced by transfection of 12x106 HEK293T cells cultured on 15 cm diameter tissue culture-
treated dishes (Nunc) in DMEM supplemented with 10% fetal bovine serum, 1X L-glutamine,
1X HEPES, and 1X penicillin-streptomycin (Gibco). Packaging plasmids pRSV-Rev (6.25 μg),
pMD2.G (9 μg), pMDLg-pRRE (12.5 μg), and the pCCL transfer plasmid (32 μg) encoding the
CAR or TAC transgene were combined with Lipofectamine 2000 (Thermo Fisher Scientific;
Cat#11668-019) in Opti-MEM (Gibco; Cat#31985-070) according to manufacturer’s guidelines.
Ten to twelve hours after transfection, media was replaced with fresh media supplemented with
sodium butyrate (Sigma-Aldrich; Cat#B5887) at a final concentration of 1 mM. Media
containing lentivirus particles were collected 36-48 hours later and concentrated via
ultracentrifugation or Amicon filter concentration (EMD Millipore; Cat#UFC910024). Viral titer
was determined by serial dilution of concentrated virus on HEK293T cells. Transduction of
tNGFR+ HEK293T cells was determined by flow cytometry for calculation of titer in TU/mL.
Lentiviral transduction and culturing of human T cells. Peripheral blood mononuclear cells
(PBMCs) were collected from healthy donors or commercial leukapheresis products
(STEMCELL) and isolated by Ficoll-Paque gradient (GE Healthcare) prior to cryopreservation.
M.Sc. Thesis – Vivian W.C. Lau; McMaster University – Biochemistry and Biomedical Sciences
15
T cells from bulk PBMCs were activated with anti-CD3/anti-CD28 Dynabeads (Gibco;
Cat#11161D) at a 0.8:1 bead ratio for 18-24 hrs, then transduced with lentivirus encoding for
CAR or TAC constructs at a multiplicity of infection (MOI) of 2, 4, or 10, depending on the
construct. Control T cells are transduced with lentivirus encoding only for tNGFR at an MOI of
2. T cells were scaled into culture vessels at an approximate concentration of 1x10⁶ cells/mL in
RPMI 1640 supplemented with 10% fetal bovine serum, 1X L-glutamine, 1X sodium pyruvate,
1X HEPES, 1X non-essential amino acids, 1X penicillin-streptomycin, 50 μM β-
mercaptoethanol. T cell media was further supplemented with 660 IU/mL recombinant human
(rh) IL-2 (Peprotech; Cat#200-02), and 10ng/mL rhIL-7 (Peprotech; Cat#200-07) for checkpoint
receptor and memory phenotypic staining. For functional assays including T cell proliferation
assays, T cell media was supplemented with 100/mL IU rhIL-2 and 10ng/mL rhIL-7. Engineered
T cells transduced with puromycin-acetyltransferase-containing pCCL lentiviruses were
transduced as previously described. Forty-eight hours after transduction, media was replaced
with fresh media containing 100/mL IU rhIL-2, 10ng/mL rhIL-7, and 0.625 μg/mL puromycin
(Invivogen; Cat#ant-pr-1). All T cell cultures were monitored daily and fed according to cell
counts every 1-3 days for a period of up to 16 days.
Cell lines. Adherent HER2+ cell lines SKOV-3 and A549, and HER2- LOX-IMVI tumour cells
were cultured in RPMI 1640, supplemented with 10% fetal bovine serum, 1X L-glutamine, 1X
HEPES, and 1X penicillin-streptomycin (cell lines were obtained from the NCI-60 human
tumour cell lines panel, a kind gift from Dr. Karen Mossman, McMaster University, Hamilton,
ON). Suspension BCMA+ cell lines KMS-11 and MM.1s were cultured in RPMI 1640,
supplemented with 1X L-glutamine, 1X sodium pyruvate, 1X HEPES, 1X non-essential amino
acids, and 1X penicillin-streptomycin (cell lines were a kind gift from Dr. Kelvin Lee from
Roswell Park Comprehensive Cancer Center, Buffalo, New York). BCMA- cell line K562 were a
kind gift from Dr. Jana Burkhardt (Fraunhofer IZI, Leipzig, Germany). CD64/4-1BBL-
engineered K562 cells (referred to as K64) were a kind gift from Dr. Carl June (University of
Pennsylvania, Philadelphia, PA, USA). All cell lines were cultured under ambient atmosphere
adjusted to 5% CO2, 37oC, and routinely tested for mycoplasma using PlasmoTest mycoplasma
detection kit (Invivogen; Cat#rep-pt1).
Surface detection of receptors by flow cytometry. Engineered T cells were analyzed for T cell
subsets and receptor expression by staining with recombinant Fc proteins directly for receptor
specificity. Standard phenotyping of transduced T cells used BCMA-Fc or HER2-Fc proteins for
labeling of chimeric receptors, followed by addition of conjugated secondary antibodies against
human IgG Fc, CD4, CD8, and NGFR. Detection of PD-1, LAG-3, TIM-3, and memory markers
CD45RA, CCR7, CD62L, CD28, CD27 and CD127 was completed using conjugated secondary
antibodies. Flow cytometry was conducted on BD LSRFortessa or BD LSRII and analyzed by
FlowJo vX software (Treestar). SPICE analysis and visualizations were generated using SPICE
v6.0 (NIH).163

M.Sc. Thesis – Vivian W.C. Lau; McMaster University – Biochemistry and Biomedical Sciences
16
Purification of engineered populations. For assays where flow-sorted T cells were used, T
cells were surface labelled with conjugated secondary antibody against NGFR as described
above, for separation of receptor-positive T cells on day 7-14 of culture, depending on
experimental requirements. T cells were sorted on Beckman Coulter MoFlo XDP Cell Sorter,
followed by replenishment of fresh media and expansion of purified populations to day 13-16 as
needed. Magnetic separation using EasySep Human CD271 (STEMCELL; Cat#18659) kit was
also used for positive-selection of tNGFR+ T cells on day 7, or 13 of culture, according to
manufacturer’s guidelines.
Analysis of T cell proliferation by flow cytometry. Engineered T cells were labelled with
CellTrace Violet or CellTrace CFSE (Invitrogen; Cat#C34557 and Cat#C34553) on day 13-16 of
culture. Following stimulation under different conditions, T cell subsets were stained with
LIVE/DEAD NearIR Viability Dye (Invitrogen; Cat#L10119) diluted in PBS for 20 minutes at
room temperature (RT), followed by surface antibodies against CD4, CD8 and NGFR for 30
minutes at RT. For bead-based stimulations, Protein G polystyrene beads (Spherotech, Cat#PGP-
60-5) were incubated with BCMA-Fc or CD86-Fc (R&D Systems; Cat#7625-B2), at a
concentration of 5-10x106 beads per mL in 0.1% BSA in PBS overnight with physical agitation
on a tube rotator at 4°C. For cell-based stimulations, target cells were adjusted to 1x10⁶ cells per
mL in fresh media, and gamma irradiated at a total dosage of 10,000 cGy (Gammacell 1000). T
cells were co-incubated with target beads or cells for 4 days and replenished with 1 volume of
fresh media two days following initial stimulation. Flow cytometry was conducted on BD
LSRFortessa or BD LSRII and analyzed by FlowJo vX software.
Surface and intracellular staining for activation and proliferation markers. For analysis of
activation markers, transduced T cells were co-incubated with target beads or cells for the time
indicated, followed by labelling of conjugated secondary antibodies against human CD69, CD4,
CD8, and NGFR as described previously. Following labelling of surface markers, T cells were
permeabilized using BD Cytofix/Cytoperm (BD Bioscience; Cat#554714) for 20 minutes at RT,
then stained for intracellular markers Nur77 and Ki-67 for 30 minutes at RT. Flow cytometry
was conducted on BD flow cytometers and data was analyzed as previously described.
Activation-induced cell death assays. Engineered T cells were co-incubated with BCMA-Fc-
coated polystyrene beads as previously described. At each time point, samples were collected
into 5mL polystyrene tubes and washed 1X with sterile-filtered binding buffer (10mM HEPES,
140mM NaCl, 2.5mM CaCl2) at room temperature. T cells were labelled with Annexin V-BV421
(BD Horizon; Cat#563973) and 7-amino-actinomycin-D (BD Pharmingen; Cat#559925) diluted
1:10 into binding buffer, for 15 minutes at room temperature. Cells were washed again in
binding buffer, prior to immediate analysis on BD flow cytometers. Data were analyzed as
previously described.
RNA isolation and next-generation sequencing. Flow-sorted T cells from day 7 were sorted
again on day 14 to isolate CD4+ and CD8+ populations. Purified populations were stimulated

M.Sc. Thesis – Vivian W.C. Lau; McMaster University – Biochemistry and Biomedical Sciences
17
with Protein G polystyrene beads coated with 50ng of BCMA-Fc per 1x10⁶ beads, at a T
cell:bead ratio of 2:1. Following stimulation period, T cells were collected, and RNA was
isolated using RNeasy Plus Mini Kit (QIAGEN; Cat#74134) following manufacturer’s
guidelines. Illumina sequencing was performed by the Farncombe Metagenomics Facility
(McMaster University). RNA integrity was first verified using the Agilent BioAnalyzer,
followed by mRNA enrichment and library prep using the NEBNext Ultra II Directional RNA
Library Prep Kit along with the NEBNext Poly(A) mRNA Magnetic Isolation Module. Libraries
were subject to further BioAnalyzer QC and quantified by qPCR, then pooled in equimolar
amounts. Sequencing was performed with the HiSeq Rapid v2 chemistry using onboard cluster
generation (2 lanes) and a 1x51 bp read length configuration.
RNAseq data preprocessing, normalization and statistical analysis. The mapping of the
processed reads was performed by using Tophat164 and HISAT165 with hg38 (UCSC) reference
genome; reads were counted by using HTSeq166. Genes showing less than 10 on average across
all samples were removed, resulting in 10,077 genes for the dataset used to generate Figure 5,
11,422 genes for Figures 6, 13 and Table 2, and 11,336 genes for Figures 18, 19 and Table 3.
The remaining values were normalized with TMM normalization method167 and then
transformed with voom transformation168. Heat maps for transcription factors were generated for
CD4+ and CD8+ T cell datasets independently, using the online tool Heatmapper
(http://heatmapper.ca/expression/). Limma package169 was used to examine differential
expression between the groups of interest, by pairing samples based on the Donors. Obtained p-
values were corrected with BH correction for multiple testing170, and corrected values <0.05
were considered to be significant. Reactome FI plugin171 in Cytoscape environment172 was used
to build Protein-Protein Interaction (PPI) Networks and then to examine Pathway enrichment and
Gene Ontology (GO) – Biological processes. Additional Gene Ontology analysis, not based on
PPI networks, was performed with BINGO173 plugin in Cytoscape environment. For Figure 5,
hierarchical clustering was performed by using a built-in hclust function using all available
genes. Volcano plots were built using Mathematica 10 software. Heatmaps were created in
MatLab R2015b software.
Isolation of cells from murine lung tissue. The McMaster Animal Research Ethics Board
approved all murine experiments. Twelve to sixteen-week-old NOD.Cg-
Rag1tm1MomIl2rgtm1Wjl/SzJ (NRG) mice were purchased from The Jackson Laboratory (Bar
Harbor, ME) (Stock #007799), or bred in-house. Mice were fully anesthetized with isofluorane
and dissected to reveal heart and chest cavity. A 25-gauge needle attached to a syringe filled with
cold, sterile PBS was used to perfuse the lungs through the left ventricle. All lobes of the lung
were removed following perfusion with ~25 mL of PBS and preserved in RPMI media on ice.
Type IV collagenase (Worthington Biochemical; cat#: CLS-4) was reconstituted in RPMI at 1
mg/mL, and 0.2 μm sterile-filtered. Lung tissues were minced into 1mm pieces using surgical
scissors and transferred into the collagenase mixture. DNase I (Roche; cat#: 10104159001) was
added to the mixture at a final concentration of 0.4 mg/mL. Tissues were digested for 1 hour

M.Sc. Thesis – Vivian W.C. Lau; McMaster University – Biochemistry and Biomedical Sciences
18
with continuous rotation on a tube rotisserie at 37°C. The digestion mixture was filtered through
70μm cell strainers and total cell numbers and viability was quantified via trypan blue exclusion.
Antibodies and recombinant proteins.
Recombinant proteins used: rhErbB2/Fc Chimera (R&D Systems; cat#: 1129-ER); rhBCMA/Fc
Chimera (R&D Systems; cat#: 192-BC); rhB7-2/Fc (R&D Systems; cat#: 7625-B2)
Flow cytometry antibodies used: CD4-AF700 (eBioscience; cat#: 56-0048-82); CD4-Pacific
Blue (BD Pharmingen; cat#: 558116); CD4-APC-H7 (BD Pharmingen; cat#: 560158); CD8-
AF700 (eBioscience; cat#: 56-0086-82); CD8-PerCP-Cy5.5 (eBioscience; cat#: 45-0088-42);
LNGFR-BV421 (BD Pharmingen; cat#: 562582); LNGFR-VioBright FITC (Miltenyi Biotec;
cat#: 130-104-893); Human IgG (Fcγ)-PE (Jackson ImmunoResearch; cat#: 109-115-098);
IFNγ-APC (BD Pharmingen; cat#: 554702); IL-2-PE (BD Pharmingen; cat#: 554566); TNFα-
FITC (BD Pharmingen; cat#: 554512); CD69-BV650 (BD Horizon; cat#: 563835); CD27-APC-
H7 (BD Pharmingen; cat#: 560222); CD28-PE (BD Pharmingen; cat#: 555729); CD45RA-ECD
(Beckman Coulter; cat#: IM2711U); CD62L-APC (BD Pharmingen; cat#: 559772); CCR7-PE-
Cy7 (BD Pharmingen; cat#: 557648); PD-1-BV421 (BD Horizon; cat#: 562516); TIM-3-PE-
CF594 (BD Pharmingen; cat#: 565560); TIM-3-BV785 (Biolegend; cat#: 345031); LAG-3-
AF647 (BD Pharmingen; cat#: 565716); Nur77-PE (eBioscience; cat#: 12-5965-82); Ki-67-FITC
(eBioscience; cat#: 11-5699-82); CD86-BV605 (Biolegend; cat#:305430); CD80-PE-Cy5 (BD
Pharmingen; cat#: 559370).

M.Sc. Thesis – Vivian W.C. Lau; McMaster University – Biochemistry and Biomedical Sciences
19
3.0 Results
3.1 Fundamental differences between TAC and CAR T cells during non-activated and
activated states
3.1.1 TAC T cells lack tonic signaling and retain a less differentiated phenotype and reduced
checkpoint receptor expression relative to CAR T cells
One major hindrance of second-generation CARs is the manifestation of tonic signaling,
which primarily occurs due to spontaneous receptor aggregation that leads to antigen-
independent activation.134 Consistent with reports in literature describing tonic signaling in CAR
T cells134,149, the second-generation CARs used in our experiments exhibited similar signs of T
cell activation in the absence of stimulation (Figure 2A). Anti-B cell maturation antigen
(BCMA) CAR T cells with a CD28 costimulatory domain fused to a CD3ζ signaling domain
(hereafter referred to as BCMA-28ζ-CAR) expressed significantly higher levels of PD-1, TIM-3,
and LAG-3 compared to TAC T cells (BCMA-TAC), or vector control. Conversely, TAC T cells
show much lower levels of checkpoint receptor expression, despite its proposed interaction with
the T cell receptor complex. Checkpoint receptor expression was influenced by the amount of
IL-2 present during the manufacturing process, as high IL-2 concentrations drove higher
expression of all three markers in CAR T cells; however, even at high IL-2 concentrations, TAC
T cells did not significantly upregulate checkpoint receptors relative controls (Figure 2B).
To demonstrate that tonic signaling is intrinsic to CARs, but not TAC receptors, we
examined T cells engineered with CARs directed against a different antigen (HER2) using a
different binding domain (designed ankyrin repeat protein; DARPin). We employed SPICE
analysis to visualize the proportions of T cells expressing one or more checkpoint receptor
(Figure 3). As observed with BCMA-28ζ-CAR T cells, HER2-28ζ-CAR T cells significantly
upregulated PD-1 and TIM-3. HER2-BBζ-CAR T cells, which contain a 4-1BB costimulatory
domain instead of CD28, showed less tonic signaling in CD4+ T cells, comparatively.
Tonic signaling also accelerated differentiation of the engineered T cells in culture, as
determined by CD45RA and CCR7 staining by flow cytometry (Figure 4A). Despite lower
checkpoint receptor expression, BBζ-CAR-T cells biased towards loss of naïve T cells and
increased in effector memory T cells. Interestingly, it appeared that HER2-BBζ-CARs deliver
unique tonic signals compared to HER2-28ζ-CARs, as CD27 and CD28 costimulatory receptors
were differentially downregulated in T cells engineered with either construct (Figure 4B).
HER2-BBζ-CARs expressed higher levels of CD28 and lower levels of CD27 compared to
HER2-28ζ-CARs, which showed the opposite. This proposes that tonic signals are derived in
part from both the costimulatory domains and ζ-chains built into the CAR framework.

M.Sc. Thesis – Vivian W.C. Lau; McMaster University – Biochemistry and Biomedical Sciences
20
Figure 2. Tonic signaling in second-generation CD28ζ-CAR T cells results in upregulation of checkpoint receptors
and increased T cell differentiation. (A) Surface expression of PD-1, TIM-3, and LAG-3 of BCMA-CAR- or TAC-
engineered T cells was detected by immunostaining and flow cytometry. Numbers indicate median fluorescence
intensity. (B) Expression of checkpoint receptors of CD4+ BCMA-CAR and TAC T cells cultured in high IL-2
conditions (660 IU/mL) versus low IL-2 conditions (100 IU/mL) during the duration of a 14-day culture period.
Data are representative of three donors from three independent experiments in (A), and a single donor from one
experiment in (B).
PD-1 TIM-3 LAG-3
CD4+
CD8+
BCMA-TAC
BCMA-28ζ-CAR
Vector ctrl
A
129
128
288
96
95
106
3239
3057
8487
3963
4146
10187
48
38
48
96
102
333
PD-1 TIM-3 LAG-3
BCMA-TAC
BCMA-28ζ-CAR
Vector ctrl
660IU/mL IL-2
100IU/mL IL-2
B
145
143
481
149
133
281
2308
2759
7557
1535
1876
3173
9
42
241
6
43
90

M.Sc. Thesis – Vivian W.C. Lau; McMaster University – Biochemistry and Biomedical Sciences
21
Figure 3. Second-generation CAR T cells show upregulation of several checkpoint receptors. SPICE analysis of
HER2-engineered T cells was performed to visualize proportions of T cell expressing checkpoint receptors. Pie
slices represent % of total T cells expression 0-3 checkpoint receptors, and pie arcs indicate proportion of total
population expressing each marker. Data are representative of three donors in three independent experiments.
PD-1 TIM-3 LAG-3 2 3 1 0 Number of inhibitory receptors expressed:
Vector control HER2-TAC HER2-BBζ CAR HER2-28ζ CAR
CD4+
CD8+
A

M.Sc. Thesis – Vivian W.C. Lau; McMaster University – Biochemistry and Biomedical Sciences
22
Figure 4. Tonic signaling in second-generation CAR T cells leads to T cell differentiation and increased loss of
costimulatory receptor expression. (A) Relative proportions of memory T cell populations normalized to vector
control, as determined by CD45RA and CCR7 staining by flow cytometry. Population frequencies were determined
by Boolean gating on FSC/CD45RA+ or FSC/CCR7+ using FlowJo vX software. T cell subsets are defined as naïve
(CD45RA+, CCR7+), central memory (CM) (CD45RA-, CCR7+), effector memory (EM) (CD45RA-, CCR7-), and
terminal effectors (EMRA) (CD45RA+, CCR7-). Lines represent the mean of 4 donors. Multiple t-test is used to
determine significance. Data are representative of three donors in three independent experiments. (B) Histograms of
CD27 and CD28 expression in HER2-TAC- and CAR-T cells from one donor, representative of 4 donors. Numbers
indicate median fluorescence intensity. All populations are gated on CD4+NGFR+, or CD8+NGFR+.
CD4+
CD8+
% o
f p
op
ula
tio
n
no
rm
ali
ze
d t
o v
ec
tor c
on
tro
l
Naiv
eC
ME
M
EM
RA
0 .0
0 .5
1 .0
1 .5
2 .0
2 .5
* * * * * * * * * * * * n .s .
% o
f p
op
ula
tio
n
no
rm
ali
ze
d t
o v
ec
tor c
on
tro
l
Naiv
eC
ME
M
EM
RA
0
1
2
3
4
7
8
9
2 8 z C A R
T A C
B B z C A R
* * * * * n .s .n .s .
A
CD27
HER2-TAC
HER2-28ζ-CAR
Vector ctrl
HER2-BBζ-CAR
CD28
B CD4+ CD8+ CD4+ CD8+

M.Sc. Thesis – Vivian W.C. Lau; McMaster University – Biochemistry and Biomedical Sciences
23
3.1.2 Transcriptome analysis indicates significant tonic activation of CAR T cells in the absence
of stimulation
To examine transcriptional differences between TAC and CAR T cells in their basal
states, BCMA-TAC and BCMA-28ζ-CAR T cells were flow-sorted for receptor-positivity and
separated by CD4 or CD8 expression. Hierarchical clustering indicated greatest similarity
between control and BCMA-TAC T cells, whereas BCMA-28ζ-CAR T cells showed greatest
dissimilarity, for each subpopulation and donor (Figure 5). The extent of tonic signaling in the
absence of stimulation present in CAR T cells led to upregulation of >200 genes in CD4+ T
cells, and >382 genes in CD8+ T cells, compared to control T cells (Figure 6A & 6B). Among
the transcripts detected are several markers of activation, such as TNFRSF9 (a.k.a. 4-1BB), and
CD69. In comparison, fewer than 10 genes were differentially expressed between TAC T cells
and control at baseline (data not shown).
Pathway analysis and GO analysis of protein-protein interaction networks was performed
to identify potential pathways upregulated in CAR T cells relative to TAC T cells (Table 2).
Interestingly, tonic signaling in CAR T cells appear to activate both TCR and CD28
costimulatory pathways, indicating that both the CD3ζ and CD28 domains of the intracellular tail
contribute to tonic activation. As expected, CAR T cells showed diverse and constitutive
cytokine-dependent signaling, as well as transcriptional activation of multiple pathways
downstream of TCR activation.

M.Sc. Thesis – Vivian W.C. Lau; McMaster University – Biochemistry and Biomedical Sciences
24
Figure 5. Unsupervised hierarchical clustering of non-stimulated CAR and TAC T cells shows greater similarity
between TAC and control T cells. RNAseq was performed on engineered T cells sorted into CD4+ and CD8+
populations, and distance between sample groups was determined using average linkage.

M.Sc. Thesis – Vivian W.C. Lau; McMaster University – Biochemistry and Biomedical Sciences
25
Figure 6. Transcription profiling of BCMA-28ζ CAR T cells using RNAseq shows significant gene upregulation in
the absence of stimulation. One-sided volcano plots were generated for visualization of genes upregulated by (A)
CD4+ and (B) CD8+ non-stimulated BCMA-CAR T cells compared to control. Each blue dot represents a single
gene, plotted by fold change and corresponding p-values. Green dots represent manually selected effector genes of
interest. Data was combined from three individual donors as independent biological replicates.
-lo
g10(p
-valu
e)
log2(fold change)
A
CD4+ CARs vs. CD4+ Control -l
og
10(p
-valu
e)
log2(fold change)
CD8+ CARs vs. CD8+ Control B
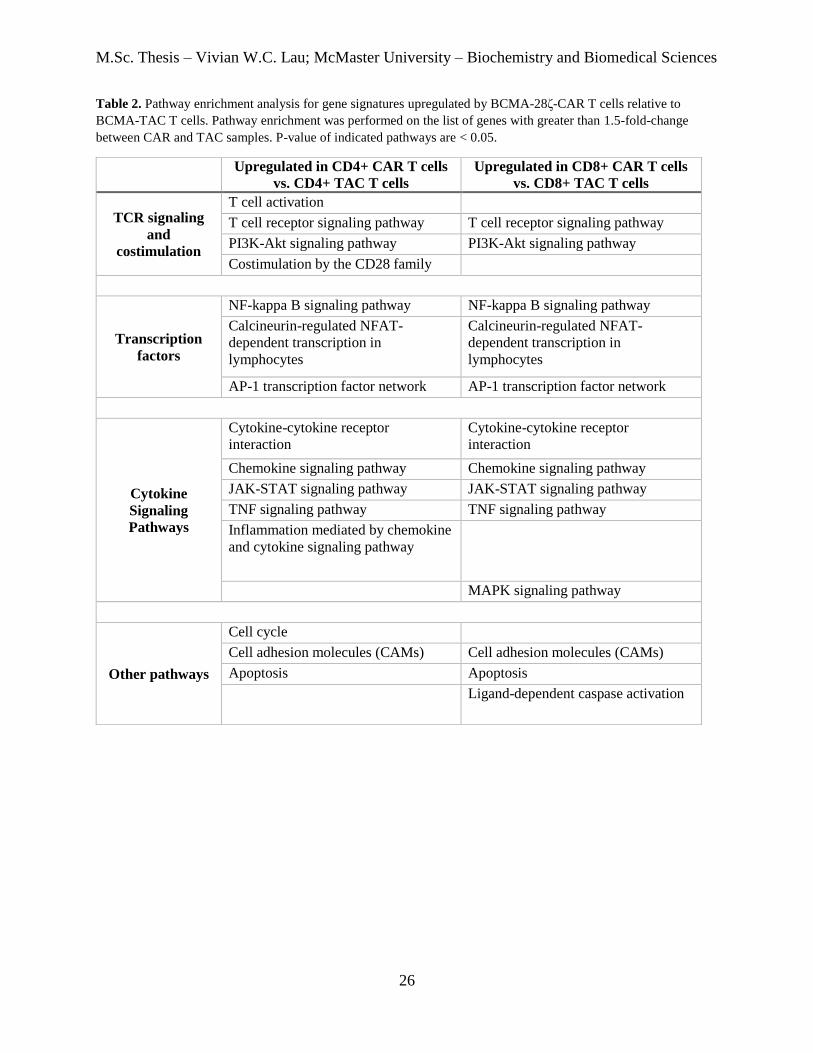
M.Sc. Thesis – Vivian W.C. Lau; McMaster University – Biochemistry and Biomedical Sciences
26
Table 2. Pathway enrichment analysis for gene signatures upregulated by BCMA-28ζ-CAR T cells relative to
BCMA-TAC T cells. Pathway enrichment was performed on the list of genes with greater than 1.5-fold-change
between CAR and TAC samples. P-value of indicated pathways are < 0.05.
Upregulated in CD4+ CAR T cells
vs. CD4+ TAC T cells
Upregulated in CD8+ CAR T cells
vs. CD8+ TAC T cells
TCR signaling
and
costimulation
T cell activation
T cell receptor signaling pathway T cell receptor signaling pathway
PI3K-Akt signaling pathway PI3K-Akt signaling pathway
Costimulation by the CD28 family
Transcription
factors
NF-kappa B signaling pathway NF-kappa B signaling pathway
Calcineurin-regulated NFAT-
dependent transcription in
lymphocytes
Calcineurin-regulated NFAT-
dependent transcription in
lymphocytes
AP-1 transcription factor network AP-1 transcription factor network
Cytokine
Signaling
Pathways
Cytokine-cytokine receptor
interaction
Cytokine-cytokine receptor
interaction
Chemokine signaling pathway Chemokine signaling pathway
JAK-STAT signaling pathway JAK-STAT signaling pathway
TNF signaling pathway TNF signaling pathway
Inflammation mediated by chemokine
and cytokine signaling pathway
MAPK signaling pathway
Other pathways
Cell cycle
Cell adhesion molecules (CAMs) Cell adhesion molecules (CAMs)
Apoptosis Apoptosis
Ligand-dependent caspase activation
M.Sc. Thesis – Vivian W.C. Lau; McMaster University – Biochemistry and Biomedical Sciences
27
3.1.3 Engineered receptors are downmodulated following antigen-dependent stimulation
As previously discussed, TCR triggering results in downmodulation of the TCR-CD3
complex, which has been described as a negative feedback mechanism that limits excessive T
cell effector functions.66 To observe whether CAR or TAC receptors downmodulate following
stimulation, CAR and TAC T cells were stimulated with plate-bound Fc-conjugated proteins
over a specific timeframe, in the presence of protein transport inhibitor brefeldin A. BCMA-TAC
receptors were rapidly downmodulated upon stimulation, whereas BCMA-28ζ-CARs remained
relatively highly expressed (Figure 7A). Interestingly, the entire shift of the curve was indicative
that all T cells gated as transduction marker tNGFR+ were responsive to stimulation. If only a
proportion of T cells were triggered, we would more likely observe bimodal histogram
distributions. In comparison, downmodulation of HER2-28ζ-CAR T cells was more pronounced
than BCMA-28ζ-CARs (Figure 7B), indicating that the extent of downmodulation was
dependent on the target antigen.
Downmodulation of the BCMA-TAC receptor followed a biphasic response, with highest
rate of internalization during the first two hours of stimulation, whereas BCMA-28ζ-CAR
internalization was constant (Figure 8A). Anti-HER2 receptors from both CAR and TAC
receptor scaffolds were equally downmodulated compared to BCMA receptors, and at similar
kinetics (Figure 8B).
To further determine whether the chimeric receptors could be recycled back to the
surface following receptor ligation, HER2-28ζ-CAR and TAC T cells were stimulated with
plate-bound proteins in the presence or absence of brefeldin A. In the presence of brefeldin A
(Figure 8C), BCMA-TAC T cells expressed significantly lower receptor levels than BCMA-
28ζ-CAR T cells at 6 hours post-stimulation, estimated from the MFI values of non-stimulated T
cells. In the absence of brefeldin A (Figure 8D), surface expression of both CAR and TAC
receptors reached a steady state after approximately 2 hours, indicative of saturated receptor
triggering. This indicated that a specific density of antigen likely triggers a finite number of
receptors within the first two hours. After this period, the downmodulation, either at a basal
level, or due to continuous triggering, of receptors was equivalent to the rate at which receptors
were recycled, or newly synthesized.

M.Sc. Thesis – Vivian W.C. Lau; McMaster University – Biochemistry and Biomedical Sciences
28
Figure 7. Downmodulation of CAR and TAC receptors following stimulation with plate-bound recombinant Fc-
conjugated proteins. Histograms for surface expression of anti-BCMA-engineered T cell receptors (A) and anti-
HER2-engineered T cell receptors (B) following stimulation for 4 hours (solid lines), or non-stimulated receptor
levels (dotted lines). Data are representative of 3 donors in from 3 independent experiments, and 2 donors from 2
independent experiment for A and B, respectively.
CD4+
CD8+
CD4+
CD8+
Receptor Expression
% o
f m
axim
um
Receptor Expression
HER2-TAC HER2-28ζ-CAR BCMA-TAC BCMA-28ζ-CAR A B

M.Sc. Thesis – Vivian W.C. Lau; McMaster University – Biochemistry and Biomedical Sciences
29
Figure 8. CAR and TAC receptors downmodulate following stimulation with Fc-conjugated proteins over time.
Median fluorescence intensity (MFI) values of BCMA-Fc-stimulated (A), and HER2-Fc-stimulated (B) T cells are
normalized to non-stimulated MFI. Dotted lines represent curve fitting for exponential decay, with decay constant k
calculated from the function Y=Yo*e-kx, where Yo is initial quantity, and k is rate constant. Data are representative of
2 donors from 2 independent experiments. Timecourse analysis of receptor expression following stimulation of
BCMA-CAR and TAC T cells, with (C) or without (D) initial addition of brefeldin A. MFI values are normalized to
non-stimulated MFI of each T cell type, respectively. Data is representative of one experiment. All populations were
gated on CD4+NGFR+ or CD8+NGFR+.
BCMA-CAR BCMA-TAC
CD4+ 0.194 0.404
CD8+ 0.187 0.771
HER2-CAR HER2-TAC
CD4+ 1.479 0.774
CD8+ 1.744 0.598
Decay constants (k)
Decay constants (k)
A B
T im e P o s t-S t im u la t io n (h )
Re
ce
pto
r M
FI
No
rm
ali
ze
d t
o B
as
eli
ne
0 2 4 6
0 .0
0 .2
0 .4
0 .6
0 .8
1 .0
T im e P o s t-S t im u la t io n (h )
Re
ce
pto
r M
FI
No
rm
ali
ze
d t
o B
as
eli
ne
0 2 4 6
0 .0
0 .2
0 .4
0 .6
0 .8
1 .0 C D 4 + C A R
C D 8 + C A R
C D 4 + T A C
C D 8 + T A C
+ brefeldin A
- brefeldin A
C
T im e (h rs )
0 1 2 3 4 5 6 7 8
0 .0
0 .2
0 .4
0 .6
0 .8
1 .0
Re
ce
pto
r
MF
I n
orm
ali
ze
d
to n
on
-sti
mu
late
d
T im e (h rs )
0 1 2 3 4 5 6 7 8
0 .0
0 .2
0 .4
0 .6
0 .8
1 .0 C D 4 + C A R
C D 8 + C A R
C D 4 + T A C
C D 8 + T A C
D

M.Sc. Thesis – Vivian W.C. Lau; McMaster University – Biochemistry and Biomedical Sciences
30
3.2 Optimal TAC T cell activation is contextually more stringent than CAR T cells
3.2.1 TAC T cells can discriminate between cell- and bead-based stimulation
The magnitude, efficiency, and overall response following T cell stimulation can be
measured using several parameters, including cytokine production, and proliferation. In solid
cancers, presence of proliferating T cells within the tumour are highly associated with improved
outcomes, including overall survival and absence of metastatic relapse.174,175 To compare the
proliferative capacity of CAR and TAC T cells against tumour cells expressing the target
antigen, T cells were labelled with CellTrace Violet (CTV), a cell permeable fluorescent dye that
binds covalently to amine residues, and analyzed by flow cytometry. Response to cell-based
stimulation, either by BCMA-positive myeloma cell line KMS-11, or K562 cells engineered to
express BCMA, was roughly equivalent between TAC and CAR T cells in all donors tested
(Figure 9A).
It is well-established that the T cell response to stimulation varies with antigen density.
To control the amount of antigen used for stimulation, protein G polystyrene beads (minimum
6.0 µm diameter) were coated with increasing quantities of Fc-conjugated recombinant antigens.
Unexpectedly, BCMA-Fc immobilized on beads led to robust CAR, but not TAC, T cell
proliferation (Figure 9B). At all antigen levels tested and with both anti-BCMA and anti-HER2
TAC T cells, the proliferative response against beads was markedly lower compared to CARs
(Figure 9C). Conversely, HER2-Fc loaded on K562 cells engineered to express high affinity
FcγRI showed that TAC T cells were much more responsive to cell-based stimulation (Figure
9D). Beyond 15.6 ng of HER2-Fc per million K562-CD64 cells, TAC T cell proliferation was
more robust compared to CAR T cells, whereas this was not observed for concentrations of up to
400 ng HER2-Fc per million beads.

M.Sc. Thesis – Vivian W.C. Lau; McMaster University – Biochemistry and Biomedical Sciences
31
Figure 9. Proliferation of CD8+ TAC and CD28ζ-CAR T cells stimulated by antigen-positive cells or beads coated
with recombinant-Fc-conjugated proteins. T cells were co-cultured with target cells or beads at an effector:target
ratio of 2:1 on day 13, 14, or 15 of culture, and analyzed 4 days post-stimulation. Histograms show serial dilution of
CellTrace Violet in cell populations that have undergone division. Dotted lines represent fluorescence intensity of
parent peak, or undivided, live T cells. (A) BCMA-TAC and BCMA-28ζ-CAR T cells stimulated with BCMA-
expressing K562 cells, or endogenous BCMA-expressing KMS-11 cells. (B) Differential proliferation of TAC and
CAR T cells stimulation with BCMA-Fc-coated polystyrene beads. HER2-TAC and HER2-28ζ-CAR T cells
stimulated with (C) HER2-Fc-coated beads, or (D) HER2-Fc-loaded K562-CD64 cells. Numbers indicate quantity
of protein per million beads or cells. Dotted lines indicate peak fluorescence intensity of non-stimulated, parent
population. All plots are gated for CD4+NGFR+, or CD8+NGFR+ expression, and live cells. Data are representative
of three donors in three independent experiments.
CellTrace Violet
CD8+ TAC CD8+ CAR
0 ng
[HE
R2-F
c]
HER2-Fc Beads
50 ng
100 ng
200 ng
400 ng
C
[HE
R2-F
c]
CD8+ CAR
No stim
31.3 ng
62.5 ng
125 ng
250 ng
15.6 ng
CellTrace Violet
0.98 ng
3.91 ng
1.95 ng
7.81 ng
0 ng
CD8+ TAC
HER2-Fc-loadedK562-CD64 cells D
CD8+ TAC CD8+ CAR
Cell-based stimulation
K562
KMS-11
K562-
BCMA
A
CellTrace Violet
CD8+ TAC CD8+ CAR
[BC
MA
-Fc
]
Bead-based stimulation B
No stim
CellTrace Violet

M.Sc. Thesis – Vivian W.C. Lau; McMaster University – Biochemistry and Biomedical Sciences
32
3.2.2 Lack of proliferation against antigen-loaded beads is independent of co-stimulation and IL-
2 production
CARs deliver two signals in a fixed stoichiometry; a TCR-based activating signal, and a
costimulatory signal in the form of CD28 in our current anti-BCMA scaffold. We sought to
determine whether the lack of proliferation towards bead-based stimulation in TAC T cells might
be due to a lack of signal 2. The KMS-11 myeloma line used for our stimulations expresses
CD86, which can provide native costimulatory signals for TAC T cells during activation (Figure
10A). To address this possibility beads were loaded with both BCMA-Fc and CD86-Fc and
verified for dual presentation of both antigens (Figure 10B). Inclusion of CD86 on the beads
failed to improve TAC proliferation (Figure 10C), indicating that the lack of stimulation by the
antigen coated on polystyrene beads is not due to lack of signal 2 but rather an aspect of the TAC
receptor biology that relies upon the context of the antigen presentation (i.e. cell-bound versus
cell-free).
Examination of IL-2 production by TAC T cells and CAR T cells revealed that, while
both cells produced equivalent IL-2 following cell stimulation, IL-2 production by TAC T cells
was severely attenuated relative to CAR T cells following stimulation with antigen-coated beads.
This outcome was true for both BCMA-TAC T cells (Figure 11A) and HER2-TAC T cells
(Figure 11B). Given the importance of IL-2 production for T cell proliferation, we posited that
the TAC T cells did not proliferate as well as CAR T cells due to a lack of IL-2. To address this
hypothesis, the culture medium of proliferation assays was supplemented with half the
concentration of IL-2 used during T cell expansion (Figure 12). However, this did not improve
TAC T cell proliferation towards antigen-loaded beads, further reinforcing that tumour cells may
be providing a collection of signals, rather than antigen alone.

M.Sc. Thesis – Vivian W.C. Lau; McMaster University – Biochemistry and Biomedical Sciences
33
Figure 10. Effects of co-stimulation are negligible for BCMA-TAC T cell proliferation. (A) Expression of BCMA,
and costimulatory receptors CD80, CD86, and 4-1BBL on HEK 293T (control), K562, and KMS-11 cells by flow
cytometry, shown as histograms. (B) BCMA-Fc and CD86-Fc are efficiently coated onto Protein G polystyrene
beads. Beads were incubated overnight with Fc-conjugated proteins at the total protein amounts indicated per
million beads. Beads were blocked with rat serum prior to flow analysis using anti-BCMA and anti-CD86
antibodies. (C) Addition of CD86-Fc onto BCMA-Fc-coated polystyrene beads does not influence proliferation of
CD8+ BCMA-TAC or CAR T cells as determined using CellTrace Violet dilution by flow cytometry. Duration of
stimulation, and effector:target ratios were the same as previously described. Dotted lines indicate peak fluorescence
intensity of non-stimulated, parent population. Data is representative of three donors from two independent
experiments.
A
HEK 293T
K562
KMS-11
BCMA CD86 CD80 4-1BBL
BCMA-Fc beads
CD86-Fc beads
100 ng
200 ng
50 ng
25 ng
12.5 ng
BCMA-Fc/CD86-Fc double-coated beads
Non-coated
100 ng BCMA-Fc/ 25 ng CD86-Fc
200 ng BCMA-Fc/ 12.5 ng CD86-Fc
50 ng BCMA-Fc/ 50 ng CD86-Fc
25 ng BCMA-Fc/ 100 ng CD86-Fc
12.5 ng BCMA-Fc/ 200 ng CD86-Fc
Non-coated
B
CD8+ TAC CD8+ CAR
[BC
MA
-Fc]
CellTrace Violet
C
CD8+ TAC CD8+ CAR 0 ng
2 ng
10 ng
50 ng
2 ng BCMA-Fc
20 ng CD86-Fc
10 ng
20 ng
50 ng
20 ng

M.Sc. Thesis – Vivian W.C. Lau; McMaster University – Biochemistry and Biomedical Sciences
34
Figure 11. BCMA- and HER2-TAC T cells exhibit lower frequencies of IL-2+ T cells when stimulation with beads.
Percentage of CD4+ T cells expressing IL-2 following stimulation with plate-bound BCMA-Fc, or BCMA+ cells
(A), or plate-bound HER2-Fc, or HER2+ cells (B), as measured by intracellular staining by flow cytometry. Data
are each representative of one experiment.
0
0.1
24
0.3
7
1.1
1
3.3
3
0
5
1 0
1 5
2 0
2 5
3 0
KMS-11 %
Re
ce
pto
r+ C
D4
+ I
L-2
+ T
ce
lls
Plate-bound BCMA-Fc (ug/mL)
Cells
A
BCMA-28ζ-CAR
BCMA-TAC
Plate-bound HER2-Fc (ug/mL)
Cells
% R
ec
ep
tor+
CD
4+
IL
-2+
T c
ell
s
HER2-28ζ-CAR
HER2-TAC
B
0
0.1
25
0.2
50.5 1 2
LO
X-I
MV
I
A549
SK
OV
-3
0
1 0
2 0
3 0
4 0
5 0
6 0

M.Sc. Thesis – Vivian W.C. Lau; McMaster University – Biochemistry and Biomedical Sciences
35
Figure 12. Proliferation of TAC T cells cannot be induced through exogenous IL-2 supply. (C) Comparison of
BCMA-TAC and BCMA-CAR T cells stimulated with beads coated with BCMA-Fc, and with or without addition
of CD86-Fc, for each individual column of histograms. Values represent quantity of each recombinant protein
loaded per million beads. Side-by-side columns represent co-incubation of T cells in the presence or absence of
exogenously supplemented IL-2. Dotted lines indicate peak fluorescence intensity of non-stimulated, parent
population. Data is represented of two donors from one experiment. Populations were gated on CD4+NGFR+ or
CD8+NGFR+ for all data shown.
2 ng BCMA-Fc
2 ng BCMA-Fc
20 ng CD86-Fc
10 ng
10 ng
20 ng
50 ng
50 ng
20 ng
No stim
+ 50IU/mL IL-2 No IL-2 supplemented
CD8+ TAC CD8+ CAR
No IL-2 supplemented
+ 50IU/mL IL-2
CellTrace Violet

M.Sc. Thesis – Vivian W.C. Lau; McMaster University – Biochemistry and Biomedical Sciences
36
3.2.3 Gene transcriptional profiling indicates that TAC and CAR T cells diverge following
activation
To begin to understand the difference in signaling pathways that lead to gene
transcription in CAR and TAC T cells, BCMA-28ζ-CAR and BCMA-TAC T cells were
stimulated with BCMA-Fc-coated beads. RNA was isolated from T cells, separated into CD4+
and CD8+ populations, at 1 hour and 4 hours post-stimulation.
Transcriptome differences were analyzed for the 4-hour timepoint, as hierarchical
clustering revealed subsets of genes that were upregulated in CAR, but not TAC, and vice versa,
independently in CD4+ and CD8+ T cells (Figure 13A & 13B). Gene ontology analysis was
performed to search for biological relevance within gene clusters. Manually curated gene clusters
(shown as different colours within the left dendrogram) were selected from parent clusters,
automatically generated using NMF clustering. In CD4+ T cells, CARs more strongly
upregulated cytokines compared to TAC T cells, as well as genes related to cellular senescence
and stress. CD4+ TAC T cells downregulated Wnt/β-catenin-associated genes, which is a
signaling pathway that is associated with T cell differentiation.176 Downregulation of Tcf7 and
Lef1, which are central Wnt pathway genes, occurs following antigen-dependent stimulation of T
cells, and may be indicative of memory formation.177

M.Sc. Thesis – Vivian W.C. Lau; McMaster University – Biochemistry and Biomedical Sciences
37
D4
- C
AR
D5
- C
AR
D6
- C
AR
D6
- T
AC
D5
- T
AC
D4
- T
AC
Interleukin-10 signaling Interleukin-20 family signaling Interleukin-4 and 13 signaling
G beta:gamma signalling through PI3Kgamma GPVI-mediated activation cascade
Transcriptional regulation by RUNX1 Signaling by NOTCH2
Cellular responses to stress Senescence-Associated Secretory Phenotype (SASP)
ATF6 (ATF6-alpha) activates chaperones
Regulation of TP53 expression and degradation
Binding of TCF/LEF:CTNNB1 to target gene promoters Deactivation of the β-catenin transactivating complex
Repression of WNT target genes RUNX3 regulates WNT signaling
CD4+ T cells A

M.Sc. Thesis – Vivian W.C. Lau; McMaster University – Biochemistry and Biomedical Sciences
38
Figure 13. Transcriptional analysis of differentially expressed genes between (A) CD4+, and (B) CD8+ BCMA-
TAC and BCMA-CAR T cells at 4-hours post-stimulation, clustered first by sample (top dendrogram), then by
individual genes (left dendrogram). Red represents upregulation of genes, and green represents downregulation,
relative to all samples. Coloured clusters were manually curated, and pathways of interest from pathway enrichment
of genes within each cluster were selected. Transcriptome data are generated from three donors per experiment,
indicated as D4, D5 and D6.
CD8+ T cells B
D4
- C
AR
D5
- C
AR
D6
- C
AR
D6
- T
AC
D5
- T
AC
D4
- T
AC
Cellular Senescence
GPVI-mediated activation Interleukin-10 signaling
Interleukin-3, 5 and GM-CSF signaling Interleukin-4 and 13 signaling
G0 and Early G1 Transcription of E2F targets under negative
control by DREAM complex

M.Sc. Thesis – Vivian W.C. Lau; McMaster University – Biochemistry and Biomedical Sciences
39
3.2.4 Higher surface expression of TAC does not fully restore proliferative capacity compared to
CARs
Due to lower surface expression of BCMA-TAC T cells compared to BCMA-CAR T
cells, we employed antibiotic selection of T cells transduced with a lentiviral vector encoding for
puromycin acetyltransferase, in place of tNGFR under the promoter mCMV (Figure 14A). To
increase receptor density, T cells were selected by puromycin 48 hours after transduction, and
relative receptor levels was measured by flow cytometry (Figure 14B). Non-antibiotic-treated T
cells (hereafter referred to as conventional T cells) were sorted for tNGFR+ by cell sorting on
Day 7. Puromycin selection significantly increased the surface expression of TAC, as the median
fluorescence intensity was nearly doubled in both CD4+ and CD8+ TAC T cells.
We repeated the same stimulations using KMS-11 cells, or BCMA-Fc-coated beads as
previously described for conventional T cells and measured proliferation via CellTrace Violet.
Cell-based stimulation led to similar patterns of proliferation between TAC and CAR T cells
(Figure 14C). Puromycin-selected T cells had a greater response compared to conventional T
cells, where nearly 100% of both the TAC and CAR population divided at least once. Both
puromycin-selected TAC and CAR T cells were more responsive to lower levels of BCMA-Fc
on beads compared to conventional T cells. The highest concentration of BCMA-Fc on beads led
to significant proliferation of conventional CAR T cells, as expected. However, the same level of
antigen on beads did not trigger the same response in puromycin-selected TACs. This data
reinforces that the conditions required for TAC proliferation are more reliant on context than
abundance, compared to CAR T cells.

M.Sc. Thesis – Vivian W.C. Lau; McMaster University – Biochemistry and Biomedical Sciences
40
Figure 14. Artificial selection of higher BCMA-TAC receptor expression on T cells increases sensitivity to low
antigen levels. (A) Puromycin-treated T cells utilize the same lentivirus transfer vector, with puromycin
acetyltransferase transgene replacing tNGFR under minimal CMV promoter. (B) Histogram plots comparing
endogenous TAC receptor and CAR expression on primary T cells transduced with TAC or CAR-encoding
lentiviruses. Surface receptor expression is detected by labelling with recombinant Fc-conjugated BCMA, and a
secondary PE-conjugated anti-human IgG Fc antibody. Dotted black lines represent vector control. (C) Proliferation
of CD8+ TAC and CAR T cells with cell-based (upper panels) or bead-based (lower panels) stimulation, tracked by
CellTrace Violet 4 days after co-culture. T cells were stimulated at an effector:target ratio of 2:1. Vertical dotted
lines indicate peak fluorescence intensity of non-stimulated, parent population. Non-puromycin T cell cultures are
gated on CD4+NGFR+ or CD8+NGFR+ for all plots shown. Puromycin-treated T cells are gated only by CD4 or
CD8 positivity. Data are representative of three donors from three independent experiments.
A
CD4+ CD8+
CD4+ CD8+ Vector
ctrl
CAR
TAC
7778
3536
6019
5659
5419
1647
7023
4595
Receptor expression
+puro +puro
B
CellTrace Violet
CD8+ TAC CD8+ CAR
0 ng
K562
KMS-11
CD8+ TAC puro CD8+ CAR puro
[BC
MA
-Fc]
C
+puro +puro
12.5 ng
25 ng
50 ng
12.5 ng
25 ng
50 ng
0 ng

M.Sc. Thesis – Vivian W.C. Lau; McMaster University – Biochemistry and Biomedical Sciences
41
3.2.5 HER2-CAR T cells, but not HER2-TAC T cells, respond to stimulation by cells isolated
from lungs of NRG mice
A major finding from our recent report on the TAC receptor was that in a HER2
xenograft murine model, HER2-28ζ-CAR T cells were lethally toxic following infusion, in an
off-tumour, off-target manner.158 As previously mentioned, CAR T cells expressing an anti-
HER2 DARPin binding domain accumulated in the lungs and heart of mice following adoptive
cells transfer, and showed significant proliferation against an unknown antigen of murine origin.
Conversely, TAC T cells bearing the same binding domain did not show any toxicities following
infusion, and instead exerted regression of established HER2-positive tumours.
We sought to investigate whether HER2-TAC T cells were capable of proliferating
against murine lung tissue in the absence of other in vivo factors. Lungs from 12-16-week-old
NRG mice were perfused, harvested, and processed into single cell suspension using type IV
collagenase. HER2-28ζ-CAR and TAC T cells were labelled with CellTrace Violet, and co-
cultured with cells isolated from murine lung tissue for four days, akin to proliferation
experiments previously described. BCMA-28ζ-CAR T cells were included as a negative control
for the anti-HER2 DARPin. HER2-28ζ-CAR T cells proliferated strongly; a very small number
of T cells remained undivided at the end of the co-culture period. In contrast, neither TAC nor
BCMA-28ζ-CAR T cells proliferated following co-culture with murine lung cells (Figure 15)
confirming that the proliferative response of HER2-28ζ-CAR T cells was due to the combination
of the HER-2 DARPin and CD28ζ-CAR scaffold. Although multiplex immunohistochemistry
staining previously showed that Ki-67+ co-localized primarily with CD4+ CAR T cells, CD4+
and CD8+ CARs were equally responsive to stimulation in vitro. These results support our in
vivo observations of off-target reactivity by HER2-CAR T cells, in the absence of any
proliferative response by TAC T cells. Further characterization of the murine cells isolated (i.e.
identification of epithelial cells, endothelial cells, or fibroblasts) will aid in narrowing down what
cell types cause CAR T cells to activate.

M.Sc. Thesis – Vivian W.C. Lau; McMaster University – Biochemistry and Biomedical Sciences
42
Figure 15. HER2-CAR T cells proliferate strongly when stimulated with cells isolated from lungs of NRG mice.
HER2-28ζ-CAR, HER2-TAC and BCMA-28ζ-CAR T cells were labelled with CellTrace Violet and co-cultured
with cell suspensions isolated from fresh lung tissue at the indicated effector:target ratios. Dotted lines indicate
maxima of the undivided peak. Data are representative of three donors from three independent experiments, except
for BCMA-28ζ-CAR experiments which only have two donors from two independent experiments. Lung isolates
were pooled from a minimum of two mice per experiment.
CD4+ HER2 TAC CD4+ HER2 CAR CD4+ BCMA CAR
E:T 2:1
No stim
E:T 1:1
CD8+ HER2 TAC CD8+ HER2 CAR CD8+ BCMA CAR
E:T 2:1
No stim
E:T 1:1
CellTrace Violet

M.Sc. Thesis – Vivian W.C. Lau; McMaster University – Biochemistry and Biomedical Sciences
43
3.3 Consequences of stimulation, and characteristics of stimulated T cells
3.3.1 CAR T cells experience faster activation kinetics, and stronger activation towards
stimulation than TAC T cells
To gauge the immediate and early effects of signaling through the chimeric antigen
receptors, we measured surface expression of CD69, a commonly used marker for T cell
activation, and intracellular markers Nur77 and Ki-67 by flow cytometry. CD69 is the earliest
activation marker upregulated by T cells that can be detected one to two hours following
activation.178 However, its expression can be regulated by multiple transcription factors, and
therefore several different pathways can converge to induce CD69 upregulation.179 In addition to
CD69, we investigated Nur77 as a reporter of CAR- or TAC-mediated signaling. Nur77 is an
orphan nuclear receptor belonging to the NR4A family, that binds DNA to activate gene
transcription in several immune cell types.180 In T cells, Nur77 functions as an immediate early
gene reporter which is specific for TCR signaling and has been used recently to measure strength
of TCR stimulation.181 We further incorporated Ki-67 staining as a measure for cell cycle entry
by T cells, as Ki-67 is expressed during all phases of cell division (G1, S, G2, mitosis), and absent
from resting cells (G0).182 As Nur77 is an intracellular stain, we combined Nur77 and Ki-67
during our timecourse to explore the link between strength of chimeric receptor triggering, and
proliferation.
Recent reports have described CAR triggering to be much more potent, and rapid in
kinetics, compared to conventional TCR triggering.157 The percentage of CD69+ T cells
following stimulation with KMS-11 cells, or BCMA-Fc-loaded beads, was determined by flow
cytometry. CD69 was measured on TAC or CAR T cells at 1, 2, 4, 8, 24, and 48 hours following
co-incubation with cells or beads at an effector:target of 2:1. For simplicity, results for CD8+ T
cells are shown. Observations were consistent for both CD4+ and CD8+ compartments
(complete dataset Appendix I). For bead-based stimulation, a significantly lower frequency of
TAC T cells became CD69+ compared to CAR T cells (Figure 16A). Conversely, the number of
CD69+ CAR T cells continued to accumulate past 4 hours, at each subsequent time point
measured. When stimulated with KMS-11, peak CD69 upregulation by CAR T cells was much
faster compared to TAC T cells. Maximal %CD69+ peaked at 8 and 24 hours for CAR and TAC
T cells, respectively. In general, cell-based stimulation engaged more than 80% of CD8+ TAC T
cells, indicating that the population is fully capable of responding, but does not do so when
exposed to BCMA on beads alone. In contrast, both cells and beads engaged up to 70% of the
CD8+ CAR population equally, suggesting that CAR T cells do not readily distinguish between
the stimuli.
We measured intracellular expression of Nur77 and analyzed Nur77 upregulation 1-8
hours following stimulation (Figure 16B). Like CD69 induction, Nur77 was more highly
expressed in CAR T cells than TAC T cells following bead-based stimulation, at roughly twice
the frequency of Nur77+ CAR T cells compared to TAC at each time point following 1 hour.
Cell-based stimulation resulted in significantly more Nur77+ T cells for both TAC and CAR T
cells, at roughly equivalent frequencies. Unexpectedly, cell- and bead-based stimulation did not
M.Sc. Thesis – Vivian W.C. Lau; McMaster University – Biochemistry and Biomedical Sciences
44
result in similar frequencies of Nur77+ CAR T cells. This confounded the earlier observation
that roughly equal numbers of CAR T cells become CD69+, regardless of the stimuli. It is
unclear whether signaling through the chimeric receptors leads to equivalent levels of Nur77
induction compared what was observed in literature, following TCR-based stimulation.181 It is
possible that other pathways, such as signal amplification by the CD28 costimulatory domain in
CAR T cells can induce CD69 expression, but not Nur77.
Lastly, we measured Ki-67 expression as a marker for cell cycle entry, as we previously
observed that cells, but not beads, strongly induces TAC proliferation. Although up to a quarter
of the TAC population upregulated CD69 in response to bead stimulation, less than 10% of
CD69+ cells were also Ki-67+ at 24 hours (Figure 17A). Stimulation with cells showed that
TAC T cells were equally or more proliferative than CARs. CARs observed little difference in
the proportion of Ki-67+ cells between bead- and cell-based stimuli (Figure 17B & 17C).

M.Sc. Thesis – Vivian W.C. Lau; McMaster University – Biochemistry and Biomedical Sciences
45
Figure 16. CD69 and Nur77 serve as distinct activation markers for CAR- and TAC receptor-based signaling. (A)
CD69 expression was analyzed following stimulation of CAR and TAC T cells with BCMA-Fc-loaded beads, or
KMS-11 cells. Stimuli for each plot is indicated in grey text. Percentage of activated cells was determined by
subtracting background CD69 stimulation in corresponding non-stimulated TAC or CAR T cells. Gating of CD69+
population was manually set according to non-stimulated engineered T cell samples. Dotted line is indicated at 50%.
Statistical analysis was performed using two-way ANOVA per timepoint and corrected for multiple comparisons
using Sidak method. n.s. = non-significant; * p<0.05; ** p<0.01; *** p<0.001. (B) Nur77 expression was stained
intracellularly following stimulation of CAR and TAC T cells with BCMA-Fc-coated beads or cells. Percentage of
Nur77+ cells was determined by bisectional gate on Nur77 histograms, using the non-stimulated T cell control as the
negative for each time point. All data was gated for CD8+NGFR+ T cells and were from two donors from two
independent experiments.
T im e P o s t-S t im u la t io n (h )%
T c
ell
s C
D8
+ C
D6
9+
1 2 4 824
48
0
2 0
4 0
6 0
8 0
1 0 0n .s .
*
T im e P o s t-S t im u la t io n (h )
% T
ce
lls
CD
8+
CD
69
+
1 2 4 824
48
0
2 0
4 0
6 0
8 0
1 0 0
n .s .
n .s .
* ** * *
* * *
* * *
KMS-11
BCMA-CD28ζ CAR
BCMA-TAC
A BCMA-Fc Beads
B KMS-11 BCMA-Fc Beads
T im e P o s t-S tim u la t io n (h )
% T
ce
lls
CD
8+
Nu
r7
7+
(bk
gd
co
rr
ec
ted
)
1 2 4 8
0
1 0
2 0
3 0
4 0
5 0
6 0
T im e P o s t-S tim u la t io n (h )
% T
ce
lls
CD
8+
Nu
r7
7+
(bk
gd
co
rr
ec
ted
)
1 2 4 8
0
1 0
2 0
3 0
4 0
5 0
6 0

M.Sc. Thesis – Vivian W.C. Lau; McMaster University – Biochemistry and Biomedical Sciences
46
Figure 17. Ki-67 indicates cell cycle entry of CAR and TAC T cells stimulated with beads or cells. (A) Ki-67 and
CD69 staining of BCMA-engineered T cells 24 hours after co-incubation with target cells or beads. Numbers
indicate percentage of cells in each quadrant gate. Individual donors indicating percentage of Ki-67+ cells within the
CD69+ population are plotted within (B) CD4+ and (C) CD8+ T cell. All plots are gated for CD4+NGFR+, or
CD8+NGFR+ expression, unless otherwise stated. Statistical significance was determined using multiple t-tests for
independent datasets. Data are representative of two donors from two independent experiments.
Ki-
67
CD8+ CAR
CD69
Non-stimulated BCMA-Fc beads KMS-11
CD8+ TAC
A
% K
i-6
7+
of
CD
69
+(c
orr.
for b
kg
d)
T AC
0
1 0
2 0
3 0
4 0
5 0
6 0
7 0
C AR
% K
i-6
7+
of
CD
69
+(c
orr.
for b
kg
d)
T AC
0
1 0
2 0
3 0
4 0
5 0
6 0
7 0
* p<0.0002
C AR
n.s.
* p<0.005 n.s.
Bead-based stim
Cell-based stim
B C CD4+ CD8+

M.Sc. Thesis – Vivian W.C. Lau; McMaster University – Biochemistry and Biomedical Sciences
47
3.3.2 TAC T cells stimulated with beads exhibit low transcriptional activation, and lack
activation of T cell signaling pathways
Following our observations that bead- and cell-based stimulation resulted in significantly
different responses from TAC T cells, we performed RNAseq on differentially stimulated T cells
to investigate whether unique pathways were activated. BCMA-TAC T cells from three
individual donors were flow-sorted into NGFR+ populations on day 7 of culture. On day 14,
purified T cell populations were stimulated with KMS-11 cells, or BCMA-Fc-coated beads at a
density of 50ng BCMA-Fc per 1x10⁶ beads. The antigen density was chosen based on prior
observations that this antigen density induces a sub-optimal proliferative response (see Fig. 8C as
an example) compared to the robust response observed following cell-based stimulation. At 4
and 24 hours following stimulation, TAC T cells were separated into CD4+ and CD8+ via
fluorescence activated cell-sorting, and RNA was collected for RNAseq.
Heat maps were generated for differentially expressed genes compared to non-stimulated
TAC T cell controls at a minimum fold-change of 2.0 or higher (Figure 18). Hierarchical
clustering of the samples showed that TAC T cells stimulated with cells after 4 hours were most
distantly clustered from non-stimulated control. Transcriptional changes observed at 4 hours
resolved by 24 hours, but transcriptional patterns did not return to baseline levels of gene
expression. Transcriptional patterns of TAC T cells stimulated with beads were similar between
the 4 and 24 hour timepoints, suggesting that low level activation was sustained, but did not
reach full activation as observed with cell-based stimulation. Dataset for CD4+ TAC T cells are
shown in Appendix II.
TAC T cells stimulated with KMS-11 resulted in significant upregulation of several
transcription factors, and at levels much higher than bead-based stimulation in CD4+ (Figure
19A) and CD8+ T cells (Figure 19B). Examples of transcription factors upregulated during cell-
based stimulation but not bead-based stimulation include GATA3, T-bet, JUND, and JUNB, all of
which have been associated with CD8 differentiation and cytotoxic T cell function.183–185 Bcl6,
ID3, and Tcf7 were more highly upregulated in T cells exposed to beads for both CD4+ and
CD8+ TAC T cells. Complete differential gene expression values are displayed in Appendix III.
We performed pathway analysis to determine whether cell- or bead-based stimulation
diverged in their signaling pathways following activation. As expected, many pathways
associated with cell division were not upregulated by TAC T cells stimulated with beads (Table
3). While some metabolic pathways could still be induced through bead stimulation, several
other important pathways, such as nucleic acid biosynthesis and carbohydrate metabolism, were
not upregulated at the 24-hour timepoint. Interestingly, apoptosis pathways were upregulated in
bead-stimulated TAC T cells, but downregulated following cell-based stimulation. Taken
together, the transcriptome data suggests that bead stimulation results in an understimulated state
where TAC T cells fail to enter a proliferative state, which may render them susceptible to
apoptosis in the absence of anti-apoptotic gene expression.

M.Sc. Thesis – Vivian W.C. Lau; McMaster University – Biochemistry and Biomedical Sciences
48
Figure 18. Transcriptome analysis of TAC T cells co-cultured with BCMA-Fc-coated beads or KMS-11 cells at 4h
or 24h post-stimulation. Heat map was generated from differentially expressed genes at a fold-change cutoff >2.0.
Donors are represented as “D4”, “D5”, or “D6”, followed by the type and duration of stimulation. Data are
representative of three independent donors.
D4 -
NS
D5 -
NS
D6 -
NS
D5
– B
ea
ds
4h
D4 –
Bea
ds
4h
D6
– B
ea
ds 4
h
D5
– B
ea
ds 2
4h
D4
– B
ea
ds 2
4h
D6
– B
ea
ds 2
4h
D5
– C
ell
s 2
4h
D4
– C
ell
s 2
4h
D6
– C
ell
s 2
4h
D4
– C
ell
s 4
h
D5
– C
ell
s 4
h
D6
– C
ell
s 4
h
CD8+ T cells
Z-score

M.Sc. Thesis – Vivian W.C. Lau; McMaster University – Biochemistry and Biomedical Sciences
49
Figure 19. Heat map of transcription factors expressed by TAC T cells 4 or 24h post-stimulation. List of
transcription factors were manually curated from literature. Black squares indicate non-significant fold-change value
compared to control. Complete linkage method was used for hierarchical clustering of transcription factors. Dataset
per sample type are representative of three independent donors.
CD8+ TAC T cells
4h beads
24h beads
4h cells
24h cells
A
CD4+ TAC T cells
4h beads
24h beads
4h cells
24h cells
B

M.Sc. Thesis – Vivian W.C. Lau; McMaster University – Biochemistry and Biomedical Sciences
50
Table 3. List of cell cycle, metabolism, signaling, and apoptosis pathways up- or down-regulated following bead-
or cell-based stimulation of BCMA-TAC T cells.
CD4+ T cells CD8+ T cells
GO ID
Bea
ds
4 h
rs
Bea
ds
24 h
rs
Cell
s 4 h
rs
Cell
s 24
hrs
Bea
ds
4 h
rs
Bea
ds
24 h
rs
Cell
s 4 h
rs
Cell
s 24
hrs
Proliferation
and Cell
Cycle Entry
cell cycle DOWN UP DOWN DOWN UP
M phase DOWN UP DOWN DOWN UP
mitosis DOWN UP DOWN DOWN UP
nuclear division DOWN UP DOWN DOWN UP
DNA replication DOWN UP DOWN UP
mitotic cell cycle checkpoint DOWN UP regulation of mitosis DOWN DOWN
Metabolic
Pathways
positive regulation of macromolecule metabolic
process UP UP UP UP UP UP UP UP
regulation of cellular protein metabolic process UP UP UP UP UP UP UP
nucleic acid metabolic process UP UP UP UP
polyamine biosynthetic process UP UP L-serine biosynthetic process UP UP
carbohydrate catabolic process UP UP
nucleobase biosynthetic process UP UP UP
Signaling
Pathways
I-kappaB kinase/NF-kappaB cascade UP UP UP UP UP UP
JAK-STAT cascade UP UP
Apoptotic
Pathways
induction of apoptosis by
extracellular signals DOWN DOWN
regulation of apoptosis UP BOTH BOTH BOTH UP BOTH UP DOWN
regulation of cell death UP BOTH BOTH BOTH UP BOTH UP DOWN
positive regulation of apoptosis UP BOTH BOTH DOWN UP BOTH BOTH DOWN
cell death UP BOTH UP DOWN UP BOTH UP DOWN
activation of pro-apoptotic gene
products UP UP UP

M.Sc. Thesis – Vivian W.C. Lau; McMaster University – Biochemistry and Biomedical Sciences
51
4.0 Discussion
Our current findings indicate that CAR and TAC T cells are fundamentally different in
both activated and non-activated states. We initially aimed to understand the impact of the
chimeric receptors on primary human T cells by measuring expression of inhibitory receptors,
and memory-associated markers. We, and others, report that the extent of tonic signaling
manifested by CARs varies according to the antigen-binding domain employed and intracellular
signaling domains incorporated. Interestingly, although TAC T cells are designed to bind to the ε
domain of the TCR-CD3 complex, which might be expected to activate the T cells, tonic
signaling in TAC T cells was minimal compared to levels observed in CAR T cells. Since scFv
aggregation is one driver of tonic signaling in chimeric receptors, it remains plausible that the
TCR sequesters TAC molecules away from one another on the surface of T cells, hence
preventing formation of microclusters that could lead to spontaneous activation.
One consequence of tonic signaling is the promotion of T cell differentiation through
continuous signaling, which we observed as a loss of CD45RA+ CCR7+ naïve T cells in the
CAR T cell products. It is interesting to note that CD28-based and 4-1BB-based CARs promote
alternate differentiation where CD28-based CAR T cells are enriched for central memory T cells,
and the 4-1BB-based CAR T cells are enriched for central and effector memory T cells. Several
groups have advocated for specific memory phenotypes to be generated, maintained, or isolated
during the manufacturing of T cells for adoptive transfer.86,186 Gattinoni et al. reported on a stem
cell-like T cell population capable of self-renewal, which resulted in superior in anti-tumour
responses.187 Similarly, central memory CAR T cells have been purposely isolated from clinical
preparations for their longevity and persistence over effector memory phenotypes.188 Generation
of these T cell subsets can be done using specific culturing conditions, such as supplying one of
IL-15 or IL-7, or both.90,189 Our current data, as well as reports by other groups190, have shown
that lower IL-2 concentrations can also limit differentiation of CAR T cells during the culturing
phase. Small molecule inhibition of targets such as Akt downstream of CD28 signaling has also
been shown to prevent differentiation of CARs and TILs.191,192 These strategies provide evidence
that excessive CD28 signaling, either during the activation of PBMCs, or tonic signaling through
the CAR, can lead to T cell differentiation ex vivo. For TAC T cells, tonic signaling is not
exacerbated by culturing conditions (e.g. IL-2 concentrations) or antigen-binding domains,
which may make the receptor much more amenable to a wider variety of binding domains and
culturing conditions compared to CARs. Where some single chains undoubtedly induce
debilitating tonic signaling within CAR scaffolds134, it would be worthwhile to explore whether
the same scFvs can be used instead as TAC constructs.
We compared the sensitivity of CAR and TAC receptors against varying levels of
antigen, which yielded surprisingly different results in proliferation and cytokine production.
While CAR T cells were sensitive to low levels of antigen on both beads and cells, they did not
appear to differentiate between the two types of stimuli. Conversely, significant proliferation and
cytokine production by TAC T cells was only observed when stimulated with antigen in the
context of a cell, indicating that triggering of TAC receptors is more contextually stringent
compared to CARs. Many cell types, especially hematological tumour cells, naturally express

M.Sc. Thesis – Vivian W.C. Lau; McMaster University – Biochemistry and Biomedical Sciences
52
costimulatory receptors for T cells. For example, KMS-11 are myeloma cells that express CD86,
which can provide costimulatory signals as well as other adhesion molecules that integrate to
promote T cell receptor aggregation. Although CD86-Fc addition in our experiments did not
improve TAC T cell proliferation, it is more likely that we did not adequately capture the
collection of signals needed for complete TAC T cell activation. The similarity in the lack of
response by HER2-TAC to HER2-Fc-loaded beads suggests that this effect is independent of the
ligand binding domain of the chimeric receptor. In fact, loading of the same recombinant protein
on K562 cells engineered to express high-affinity FcγRI showed improved sensitivity towards
lower antigen densities when present on a cellular surface, compared to bead-based stimuli.
One possible explanation for the difference in activation of TAC T cells when stimulated
with cells or beads is the affinity of the interaction. We currently lack data for the affinity of the
interaction between the scFv on the TAC receptor scaffold when bound to endogenous BCMA
on tumour cells, compared to recombinant BCMA-Fc attached to protein G on beads. Previous
studies have shown that low-affinity TCR interactions (albeit in the context of peptide-MHC)
result in delayed expression of CD69 compared to high-affinity interactions.49 Similar to our
current observations, beads inefficiently induce early activation events in TAC T cells, and
responses such as CD69 upregulation were delayed compared to strong signals such as cell-
based stimuli. It is possible that the interactions between TAC receptors and bead-bound BCMA-
Fc is much lower in affinity, due to steric hindrance, lower protein density, or rigidity of the
beads, compared to interactions with BCMA on cells, which is presented on a fluid membrane.
In addition to proliferation, several other markers were used to measure the extent of
activation in engineered T cells, ranging from early reporters, such as Nur77, or CD69, or late
reporters, such as IL-2 production, or upregulation of checkpoint receptors. Nur77, used as a
surrogate for TCR-dependent-signaling based on previous reports181,193, was strongly induced in
TAC T cells following stimulation with KMS-11 cells. This translated to a strong proliferation
signal, measured as Ki-67 expression 24-hours following stimulation. Although proliferation of
CAR T cells was equivalent when stimulated with either cells or beads, Nur77 was weakly
induced when stimulated with beads compared to cells. This hints to the possibility that CARs
are more efficient at translating weak signals to full effector functions compared to TAC
receptors.
Given that we often select antigen-binding domains based on their specificity to a ligand
rather than selectivity against irrelevant ligands, each binding domain poses a risk for off-tumour
toxicities which may not be predicted in vitro. Furthermore, tumour-specific targets are difficult
to find, and often restricted to a subset of tumour types, and individual patients.194 Most tumour
targets are simply overexpressed in cancerous tissue, such as HER2, which is also lowly
expressed on many healthy tissues.195 Based on our current observations, CARs bearing cross-
reactive binding domains can potentiate off-target toxicities due to its reactivity towards low
abundance antigens. Because TAC T cells may require higher antigen densities, or a more
stringent context for activation, the receptor itself may prove useful against a wider pool of
tumour-associated antigens.
This potentially explains the observations from our HER2 xenograft model from our
principle report on the TAC receptor.158 In this model, the anti-HER2 DARPin used as the
M.Sc. Thesis – Vivian W.C. Lau; McMaster University – Biochemistry and Biomedical Sciences
53
binding domain on both HER2-TAC and HER2-28ζ-CAR T cells. Infusion of equal number of
HER2-TAC T cells and HER2-28ζ-CAR T cells results in drastically different outcomes. HER2-
TAC T cells expanded within the HER-2 expressing tumor whereas the HER2-28ζ-CAR T cells
expanded primarily in the lungs. Since the expansion in the lungs was found to be unique to
HER2-28ζ-CAR T cells, we predicted that the HER2-28ζ-CAR T cells were cross-reactive with
murine antigen expressed on lung cells. Indeed, it was confirmed that HER2-28ζ-CAR T cells
are reactive to mouse lung cells in vitro whereas HER2-TAC T cells do not react, despite
carrying the identical antigen-binding domain. These results demonstrate a clear advantage of the
differential biology of TACs and CARs.
The mechanism underlying this dichotomy between an off-tumour response by CAR T
cell and an on-tumour response by TAC T cells can be explained by our current results
demonstrating that activation of the TAC receptor is contextual. We hypothesize that while both
receptors may recognize the same off-target antigen, TAC T cells will not proliferate against low
levels of irrelevant antigen due to its dependence on context of stimulation. Furthermore,
DARPins are well-structured proteins known for their stability and folding efficiency.196,197 This
minimizes the possibility that the structure of the HER2 DARPin is significantly different on the
surface of a CAR T cell, compared to a TAC T cell, especially since both receptors can still
recognize HER2-positive targets. Rather, we are encouraged that the activation modalities
between TAC and CARs are indeed fundamentally different. This supports our goal in
generating genetically engineered T cells that may cause fewer side effects due to off-target
toxicities.
Preclinical models for TAC T cells are limited to xenograft murine studies, due to the use
of the anti-human CD3ε binding domain which is critical for TAC function and only works with
human T cells. Major limitations of xenograft models include the lack of interaction between
human T cells and other functioning immune cells, and the lack of proper tumour
microenvironment that contributes to tumour survival. In theory, a murine TAC receptor could
be constructed using anti-mouse CD3ε single chain antibody, derived from available monoclonal
antibody clones, and a fully murine CD4 transmembrane and cytosolic domain; however, during
the development of the TAC receptors, we learned that functionality is highly dependent upon
the choice of anti-human CD3ε binding domain.158 Syngeneic models of orthotopic murine
tumours have been suggested to better recapitulate disease progression in human patients.198,199
However, models for treatment of B-cell acute lymphoblastic leukemia using anti-mouse CD19
CAR T cells did not reveal any potential lethal toxicities200, which was later observed in human
CD19 CAR T cell trials.138 One way to bridge the gap between xenograft models and syngeneic
models is the use of humanized mice. Reconstitution of human hematopoietic stem cells in
irradiated mice engineered to express a combination of human cytokines allowed for
development of a complete human immune cell repertoire that is xenotolerant against murine
tissues.201 This type of model would be better suited to address TAC versus CAR T cell
questions regarding T cell persistence, toxicity, and anti-tumour efficacy. As human CD19 CAR
T cells were shown to induce significant cytokine release syndrome and neurotoxicity symptoms
in this mice model202, it would be interesting to model whether we can predict clinical outcomes
for patients treated with human CD19 TAC T cells currently under development.

M.Sc. Thesis – Vivian W.C. Lau; McMaster University – Biochemistry and Biomedical Sciences
54
5.0 Concluding Remarks
The development of engineered T cells has led to an exciting form of live medicine that is
capable responding and adapting to its environment. T cells are markedly different from other
forms of cancer immunotherapy, as they can be engineered to differentiate between healthy and
cancerous cells. Arming them with the ability to expressly targets tumour cells has shown
incredible promise against hematological cancers, and greater efforts will be needed to find
strategies that are effective against solid tumours.
In terms of CAR and TAC T cells, we have placed relatively simple circuits in the form of
a recombinant receptor into a complicated cell-type, one which we still do not fully understand.
In some ways, these in vitro stimulations through a chimeric receptor can be viewed as an input
signal into a T cell, which results in an output signal in the form of cytokine production,
proliferation, etc.. The primary purpose of our experiments was to better grasp how an input
antigen can result in output effector function by a T cell. Many reviews in the field attempt to
apply contemporary knowledge of T cell signaling and activation to CAR T cells; perhaps the
more interesting perspective is to reverse the viewpoint and employ chimeric receptors as a tool
to understand T cells. For example, TAC T cells can serve as a model for the restriction point
that segregates some effector functions from proliferation, as our data indicates that the same
antigenic signal can result in contrasting T cell responses. CAR T cells, on the other hand, are
representative of the maximal response that a T cell can produce and could be used as a model
for upper physiological limits of antigen-dependent responses. At the crossroads between
translational research and medicine, chimeric receptors are becoming equally valuable as both
research tools and clinical products. Using one to inform the other, and vice versa, will be
necessary for improvement and development of better cancer therapeutics in the future.

M.Sc. Thesis – Vivian W.C. Lau; McMaster University – Biochemistry and Biomedical Sciences
55
6.0 References
1. Ehrlich P. Über den jetzigen Stand der Chemotherapie. Berichte der Dtsch Chem
Gesellschaft. 1909;42(1):17-47. doi:10.1002/cber.19090420105.
2. Dunn GP, Bruce AT, Ikeda H, Old LJ, Schreiber RD. Cancer immunoediting: From
immunosurveillance to tumor escape. Nat Immunol. 2002;3(11):991-998.
doi:10.1038/ni1102-991.
3. Gross L. Intradermal Immunization of C3H Mice against a Sarcoma That Originated in an
Animal of the Same Line. Cancer Res. 1943;3(5):326-333.
4. FOLEY EJ. Antigenic properties of methylcholanthrene-induced tumors in mice of the
strain of origin. Cancer Res. 1953;13(12):835-837.
http://www.ncbi.nlm.nih.gov/pubmed/13116120.
5. Prehn RT, Main JM. Immunity to methylcholanthrene-induced sarcomas. J Natl Cancer
Inst. 1957;18(6):769-778. doi:10.1093/jnci/18.6.769.
6. Swann JB, Smyth MJ. Immune surveillance of tumors. J Clin Invest. 2007;117(5):1137-
1146. doi:10.1172/JCI31405.
7. Fischbach MA, Bluestone JA, Lim WA. Cell-Based Therapeutics: The Next Pillar of
Medicine. Sci Transl Med. 2013;5(179):179ps7-179ps7.
doi:10.1126/scitranslmed.3005568.
8. Jeal W, Goa KL. Aldesleukin (recombinant interleukin-2): a review of its pharmacological
properties, clinical efficacy and tolerability in patients with renal cell carcinoma.
BioDrugs. 1997;7(4):285-317. doi:10.2165/00063030-199707040-00005.
9. Eggermont AMM, Suciu S, Santinami M, et al. Adjuvant therapy with pegylated
interferon alfa-2b versus observation alone in resected stage III melanoma: final results of
EORTC 18991, a randomised phase III trial. Lancet. 2008;372(9633):117-126.
doi:10.1016/S0140-6736(08)61033-8.
10. Camacho LH. CTLA-4 blockade with ipilimumab: Biology, safety, efficacy, and future
considerations. Cancer Med. 2015;4(5):661-672. doi:10.1002/cam4.371.
11. Borghaei H, Paz-Ares L, Horn L, et al. Nivolumab versus Docetaxel in Advanced
Nonsquamous Non–Small-Cell Lung Cancer. N Engl J Med. 2015;373(17):1627-1639.
doi:10.1056/NEJMoa1507643.
12. Rittmeyer A, Barlesi F, Waterkamp D, et al. Atezolizumab versus docetaxel in patients
with previously treated non-small-cell lung cancer (OAK): a phase 3, open-label,
multicentre randomised controlled trial. Lancet. 2017;389(10066):255-265.
doi:10.1016/S0140-6736(16)32517-X.
13. Maury S, Chevret S, Thomas X, et al. Rituximab in B-Lineage Adult Acute
Lymphoblastic Leukemia. N Engl J Med. 2016;375(11):1044-1053.
doi:10.1056/NEJMoa1605085.
14. Piccart-Gebhart MJ, Procter M, Leyland-Jones B, et al. Trastuzumab after Adjuvant
Chemotherapy in HER2-Positive Breast Cancer. N Engl J Med. 2005;353(16):1659-1672.
doi:10.1056/NEJMoa052306.
15. Mølhøj M, Crommer S, Brischwein K, et al. CD19-/CD3-bispecific antibody of the BiTE
class is far superior to tandem diabody with respect to redirected tumor cell lysis. Mol
Immunol. 2007;44(8):1945-1953. doi:10.1016/j.molimm.2006.09.032.
16. Jonasch E, Wood C, Tamboli P, et al. Vaccination of metastatic renal cell carcinoma
patients with autologous tumour-derived vitespen vaccine: Clinical findings. Br J Cancer.

M.Sc. Thesis – Vivian W.C. Lau; McMaster University – Biochemistry and Biomedical Sciences
56
2008;98(8):1336-1341. doi:10.1038/sj.bjc.6604266.
17. Kantoff PW, Higano CS, Shore ND, et al. Sipuleucel-T Immunotherapy for Castration-
Resistant Prostate Cancer. N Engl J Med. 2010;363(5):411-422.
doi:10.1056/NEJMoa1001294.
18. Andtbacka RHI, Kaufman HL, Collichio F, et al. Talimogene laherparepvec improves
durable response rate in patients with advanced melanoma. J Clin Oncol.
2015;33(25):2780-2788. doi:10.1200/JCO.2014.58.3377.
19. Geukes Foppen MH, Donia M, Svane IM, Haanen JBAG. Tumor-infiltrating lymphocytes
for the treatment of metastatic cancer. Mol Oncol. 2015;9(10):1918-1935.
doi:10.1016/j.molonc.2015.10.018.
20. Hinrichs CS, Rosenberg SA. Exploiting the curative potential of adoptive T-cell therapy
for cancer. Immunol Rev. 2014;257(1):56-71. doi:10.1111/imr.12132.
21. Rapoport AP, Stadtmauer EA, Binder-Scholl GK, et al. NY-ESO-1-specific TCR-
engineered T cells mediate sustained antigen-specific antitumor effects in myeloma. Nat
Med. 2015;21(8):914-921. doi:10.1038/nm.3910.
22. Neelapu SS, Locke FL, Bartlett NL, et al. Axicabtagene Ciloleucel CAR T-Cell Therapy
in Refractory Large B-Cell Lymphoma. N Engl J Med. 2017:NEJMoa1707447.
doi:10.1056/NEJMoa1707447.
23. Maude SL, Laetsch TW, Buechner J, et al. Tisagenlecleucel in Children and Young
Adults with B-Cell Lymphoblastic Leukemia. N Engl J Med. 2018;378(5):439-448.
doi:10.1056/NEJMoa1709866.
24. Ruscetti FW, Morgan DA, Gallo RC. Functional and morphologic characterization of
human T cells continuously grown in vitro. J Immunol. 1977;119(1):131-138.
doi:10.4049/jimmunol.179.3.1413.
25. Meuer SC, Fitzgerald KA, Hussey RE, Hodgdon JC, Schlossman SF, Reinherz EL.
Clonotypic structures involved in antigen-specific human T cell function. Relationship to
the T3 molecular complex. J Exp Med. 1983;157(2):705-719.
http://www.ncbi.nlm.nih.gov/pubmed/6185617.
26. Irving BA, Weiss A, Alcover A, et al. The cytoplasmic domain of the T cell receptor zeta
chain is sufficient to couple to receptor-associated signal transduction pathways. Cell.
1991;64(5):891-901. doi:10.1016/0092-8674(91)90314-O.
27. Samelson LE, Harford JB, Klausner RD. Identification of the components of the murine T
cell antigen receptor complex. Cell. 1985;43(1):223-231.
http://www.ncbi.nlm.nih.gov/pubmed/3878228.
28. Kappler J, Kubo R, Haskins K, et al. The major histocompatibility complex-restricted
antigen receptor on T cells in mouse and man: identification of constant and variable
peptides. 1983. J Immunol. 2006;176(5):2683-2690. doi:10.1016/0092-8674(83)90232-5.
29. Thompson CB, Lindsten T, Ledbetter JA, et al. CD28 activation pathway regulates the
production of multiple T-cell-derived lymphokines/cytokines. Proc Natl Acad Sci.
1989;86(4):1333-1337. doi:10.1073/pnas.86.4.1333.
30. Harding FA, McArthur JG, Gross JA, Raulet DH, Allison JP. CD28-mediated signalling
co-stimulates murine T cells and prevents induction of anergy in T-cell clones. Nature.
1992;356(6370):607-609. doi:10.1038/356607a0.
31. Janeway CJ, P T, M W, Al. E. The components of the immune system. In:
Immunobiology: The Immune System in Health and Disease. 5th Edition. 5th ed. New
York: Garland Science; 2001. https://www.ncbi.nlm.nih.gov/books/NBK27092/.

M.Sc. Thesis – Vivian W.C. Lau; McMaster University – Biochemistry and Biomedical Sciences
57
32. Kreslavsky T, Gleimer M, Garbe AI, Von Boehmer H. αβ versus γδ fate choice: counting
the T-cell lineages at the branch point. Immunol Rev. 2010;238(1):169-181.
doi:10.1111/j.1600-065X.2010.00947.x.
33. Reinherz EL. The Crystal Structure of a T Cell Receptor in Complex with Peptide and
MHC Class II. Science (80- ). 1999;286(5446):1913-1921.
doi:10.1126/science.286.5446.1913.
34. Birnbaum ME, Berry R, Hsiao Y-S, et al. Molecular architecture of the αβ T cell receptor–
CD3 complex. Proc Natl Acad Sci. 2014;111(49):17576-17581.
doi:10.1073/pnas.1420936111.
35. Dustin ML. The Immunological Synapse. Cancer Immunol Res. 2014;2(11):1023-1033.
doi:10.1158/2326-6066.CIR-14-0161.
36. Samelson LE, Patel MD, Weissman a M, Harford JB, Klausner RD. Antigen activation of
murine T cells induces tyrosine phosphorylation of a polypeptide associated with the T
cell antigen receptor. Cell. 1986;46(7):1083-1090.
http://www.ncbi.nlm.nih.gov/pubmed/2428504.
37. Chan AC, Irving BA, Fraser JD, Weiss A. The zeta chain is associated with a tyrosine
kinase and upon T-cell antigen receptor stimulation associates with ZAP-70, a 70-kDa
tyrosine phosphoprotein. Proc Natl Acad Sci U S A. 1991;88(20):9166-9170.
doi:10.1073/pnas.88.20.9166.
38. Love PE, Hayes SM. ITAM-mediated signaling by the T-cell antigen receptor. Cold
Spring Harb Perspect Biol. 2010;2(6):1-11. doi:10.1101/cshperspect.a002485.
39. Wucherpfennig KW, Gagnon E, Call MJ, Huseby ES, Call ME. Structural biology of the
T-cell receptor: insights into receptor assembly, ligand recognition, and initiation of
signaling. Cold Spring Harb Perspect Biol. 2010;2(4). doi:10.1101/cshperspect.a005140.
40. Wang H, Kadlecek TA, Au-yeung BB, et al. ZAP-70: an essential kinase in T-cell
signaling. Cold Spring Harb Perspect Biol. 2010;2(5). doi:10.1101/cshperspect.a002279.
41. Labrecque N, Whitfield LS, Obst R, Waltzinger C, Benoist C, Mathis D. How much TCR
does a T cell need? Immunity. 2001;15(1):71-82. doi:10.1016/S1074-7613(01)00170-4.
42. Corse E, Gottschalk RA, Allison JP. Strength of TCR-Peptide/MHC Interactions and In
Vivo T Cell Responses. J Immunol. 2011;186(9):5039-5045.
doi:10.4049/jimmunol.1003650.
43. Davis SJ, van der Merwe PA. The kinetic-segregation model: TCR triggering and beyond.
Nat Immunol. 2006;7(8):803-809. doi:10.1038/ni1369.
44. Qi SY, Groves JT, Chakraborty AK. Synaptic pattern formation during cellular
recognition. Proc Natl Acad Sci. 2001;98(12):6548-6553. doi:10.1073/pnas.111536798.
45. James JR, Vale RD. Biophysical mechanism of T-cell receptor triggering in a
reconstituted system. Nature. 2012;487(7405):64-69. doi:10.1038/nature11220.
46. McKeithan TW. Kinetic proofreading in T-cell receptor signal transduction. Proc Natl
Acad Sci. 1995;92(11):5042-5046. doi:10.1073/pnas.92.11.5042.
47. Kersh EN, Shaw AS, Allen PM. Fidelity of T cell activation through multistep T cell
receptor zeta phosphorylation. Science. 1998;281(5376):572-575.
doi:10.1126/science.281.5376.572.
48. Kersh GJ, Kersh EN, Fremont DH, Allen PM. High- and low-potency ligands with similar
affinities for the TCR: The importance of kinetic in TCR signaling. Immunity.
1998;9(6):817-826. doi:10.1016/S1074-7613(00)80647-0.
49. Rosette C, Werlen G, Daniels MA, et al. The Impact of duration versus extent of TCR

M.Sc. Thesis – Vivian W.C. Lau; McMaster University – Biochemistry and Biomedical Sciences
58
occupancy on T cell activation: A revision of the kinetic proofreading model. Immunity.
2001;15(1):59-70. doi:10.1016/S1074-7613(01)00173-X.
50. Gao GF, Rao Z, Bell JI. Molecular coordination of αβ T-cell receptors and coreceptors
CD8 and CD4 in their recognition of peptide-MHC ligands. Trends Immunol.
2002;23(8):408-413. doi:10.1016/S1471-4906(02)02282-2.
51. Nika K, Soldani C, Salek M, et al. Constitutively Active Lck Kinase in T Cells Drives
Antigen Receptor Signal Transduction. 2010. doi:10.1016/j.immuni.2010.05.011.
52. Courtney AH, Lo WL, Weiss A. TCR Signaling: Mechanisms of Initiation and
Propagation. Trends Biochem Sci. 2017;43(2):108-123. doi:10.1016/j.tibs.2017.11.008.
53. Laugel B, Van Den Berg HA, Gostick E, et al. Different T cell receptor affinity thresholds
and CD8 coreceptor dependence govern cytotoxic T lymphocyte activation and tetramer
binding properties. J Biol Chem. 2007;282(33):23799-23810.
doi:10.1074/jbc.M700976200.
54. Holler PD, Kranz DM. Quantitative analysis of the contribution of TCR/pepMHC affinity
and CD8 to T cell activation. Immunity. 2003;18(2):255-264. doi:10.1016/S1074-
7613(03)00019-0.
55. Artyomov MN, Lis M, Devadas S, Davis MM, Chakraborty AK. CD4 and CD8 binding to
MHC molecules primarily acts to enhance Lck delivery. Proc Natl Acad Sci U S A.
2010;107(39):16916-16921. doi:10.1073/pnas.1010568107.
56. Valitutti S, Miller S, Cella M, Padovan E, Lanzavecchia A. Serial triggering of many T-
cell receptors by a few peptide-MHC complexes. Nature. 1995;375(6527):148-151.
doi:10.1038/375148a0.
57. Lanzavecchia A, Iezzi G, Viola A. From TCR engagement to T cell activation: A kinetic
view of T cell behavior. Cell. 1999;96(1):1-4. doi:10.1016/S0092-8674(00)80952-6.
58. Berg NN, Puente LG, Dawicki W, Ostergaard HL. Sustained TCR signaling is required
for mitogen-activated protein kinase activation and degranulation by cytotoxic T
lymphocytes. J Immunol. 1998;161(6):2919-2924.
http://www.ncbi.nlm.nih.gov/pubmed/9743353.
59. Iezzi G, Karjalainen K, Lanzavecchia A. The duration of antigenic stimulation determines
the fate of naive and effector T cells. Immunity. 1998;8(1):89-95. doi:10.1016/S1074-
7613(00)80461-6.
60. Miskov-Zivanov N, Turner MS, Kane LP, et al. The Duration of T Cell Stimulation Is a
Critical Determinant of Cell Fate and Plasticity. Sci Signal. 2013;6(300):ra97-ra97.
doi:10.1126/scisignal.2004217.
61. Itoh Y, Hemmer B, Martin R, Germain RN. Serial TCR engagement and down-
modulation by peptide:MHC molecule ligands: relationship to the quality of individual
TCR signaling events. J Immunol. 1999;162(4):2073-2080.
62. Utzny C, Coombs D, Müller S, Valitutti S. Analysis of peptide/MHC-induced TCR
downregulation: deciphering the triggering kinetics. Cell Biochem Biophys.
2006;46(2):101-111. doi:10.1385/CBB:46:2:101.
63. Valitutti S, Müller S, Salio M, Lanzavecchia A. Degradation of T cell receptor (TCR)-
CD3-zeta complexes after antigenic stimulation. J Exp Med. 1997;185(10):1859-1864.
http://www.ncbi.nlm.nih.gov/pubmed/9151711.
64. Cai Z, Kishimoto H, Brunmark A, Jackson MR, Peterson PA, Sprent J. Requirements for
peptide-induced T cell receptor downregulation on naive CD8+ T cells. J Exp Med.
1997;185(4):641-51.
M.Sc. Thesis – Vivian W.C. Lau; McMaster University – Biochemistry and Biomedical Sciences
59
65. Baniyash M. TCR ζ-chain downregulation: curtailing an excessive inflammatory immune
response. Nat Rev Immunol. 2004;4(9):675-687. doi:10.1038/nri1434.
66. Gallegos AM, Xiong H, Leiner IM, et al. Control of T cell antigen reactivity via
programmed TCR downregulation. Nat Immunol. 2016;17(4):379-386.
doi:10.1038/ni.3386.
67. Karwacz K, Bricogne C, MacDonald D, et al. PD-L1 co-stimulation contributes to ligand-
induced T cell receptor down-modulation on CD8+T cells. EMBO Mol Med.
2011;3(10):581-592. doi:10.1002/emmm.201100165.
68. Viola A, Lanzavecchia A. T cell activation determined by T cell receptor number and
tunable thresholds. Science. 1996;273(5271):104-106. doi:10.1126/science.273.5271.104.
69. Sloan-Lancaster J, Evavold BD, Allen PM. Induction of T-cell anergy by altered T-cell-
receptor ligand on live antigen-presenting cells. Nature. 1993;363(6425):156-159.
doi:10.1038/363156a0.
70. Acuto O, Mise-Omata S, Mangino G, Michel F. Molecular modifiers of T cell antigen
receptor triggering threshold: the mechanism of CD28 costimulatory receptor. Immunol
Rev. 2003;192:21-31. doi:034 [pii].
71. Sharpe AH, Freeman GJ. The B7-CD28 superfamily. Nat Rev Immunol. 2002;2(2):116-
126. doi:10.1038/nri727.
72. Chen L, Flies DB. Molecular mechanisms of T cell co-stimulation and co-inhibition. Nat
Rev Immunol. 2013;13(4):227-242. doi:10.1038/nri3405.
73. Kane LP, Andres PG, Howland KC, Abbas AK, Weiss A. Akt provides the CD28
costimulatory signal for up-regulation of IL-2 and IFN-γ but not TH2 cytokines. Nat
Immunol. 2001;2(1):37-44. doi:10.1038/83144.
74. Frauwirth KA, Riley JL, Harris MH, Parry RV, Rathmell JC et al. The CD28 signaling
pathway regulates glucose metabolism. Immunity. 2002;16:769-777.
75. Boise LH, Minn AJ, Noel PJ, et al. CD28 costimulation can promote T cell survival by
enhancing the expression of Bcl-xL. Immunity. 1995;3(1):87-98. doi:10.1016/1074-
7613(95)90161-2.
76. Croft M. The role of TNF superfamily members in T-cell function and diseases. Nat Rev
Immunol. 2009;9(4):271-285. doi:10.1038/nri2526.
77. Klebanoff CA, Gattinoni L, Restifo NP. CD8+ T-cell memory in tumor immunology and
immunotherapy. Immunol Rev. 2006;211:214-224. doi:10.1111/j.0105-
2896.2006.00391.x.
78. Sallusto F, Geginat J, Lanzavecchia A. Central memory and effector memory T cell
subsets: function, generation, and maintenance. Annu Rev Immunol. 2004;22(1):745-763.
doi:10.1146/annurev.immunol.22.012703.104702.
79. Borowski AB, Boesteanu AC, Mueller YM, et al. Memory CD8+ T Cells Require CD28
Costimulation. J Immunol. 2007;179(10):6494-6503. doi:10.4049/jimmunol.179.10.6494.
80. Fuse S, Zhang W, Usherwood EJ. Control of Memory CD8+ T Cell Differentiation by
CD80/CD86-CD28 Costimulation and Restoration by IL-2 during the Recall Response. J
Immunol. 2008;180(2):1148-1157. doi:10.4049/jimmunol.180.2.1148.
81. Palmer CS, Ostrowski M, Balderson B, Christian N, Crowe SM. Glucose metabolism
regulates T cell activation, differentiation, and functions. Front Immunol. 2015;6(JAN):1-
6. doi:10.3389/fimmu.2015.00001.
82. Phan AT, Doedens AL, Palazon A, et al. Constitutive Glycolytic Metabolism Supports
CD8+ T Cell Effector Memory Differentiation during Viral Infection. Immunity.

M.Sc. Thesis – Vivian W.C. Lau; McMaster University – Biochemistry and Biomedical Sciences
60
2016;45(5):1024-1037. doi:10.1016/j.immuni.2016.10.017.
83. Hendriks J, Xiao Y, Rossen JWA, et al. During Viral Infection of the Respiratory Tract,
CD27, 4-1BB, and OX40 Collectively Determine Formation of CD8+ Memory T Cells
and Their Capacity for Secondary Expansion. J Immunol. 2005;175(3):1665-1676.
doi:10.4049/jimmunol.175.3.1665.
84. Sallusto F, Lenig D, Förster R, Lipp M, Lanzavecchia A. Two subsets of memory T
lymphocytes with distinct homing potentials and effector functions. Nature.
1999;401(October):708-712. doi:10.1038/44385.
85. Klebanoff CA, Gattinoni L, Torabi-Parizi P, et al. Central memory self/tumor-reactive
CD8+ T cells confer superior antitumor immunity compared with effector memory T
cells. Proc Natl Acad Sci. 2005;102(27):9571-9576. doi:10.1073/pnas.0503726102.
86. Graef P, Buchholz VR, Stemberger C, et al. Serial Transfer of Single-Cell-Derived
Immunocompetence Reveals Stemness of CD8+ Central Memory T Cells. Immunity.
2014;41(1):116-126. doi:10.1016/j.immuni.2014.05.018.
87. Park JR, DiGiusto DL, Slovak M, et al. Adoptive transfer of chimeric antigen receptor re-
directed cytolytic T lymphocyte clones in patients with neuroblastoma. Mol Ther.
2007;15(4):825-833. doi:10.1038/sj.mt.6300104.
88. Wang X, Popplewell LL, Wagner JR, et al. Phase 1 studies of central memory – derived
CD19 CAR T – cell therapy following autologous HSCT in patients with B-cell NHL.
Blood. 2016;127(24):2980-2991. doi:10.1182/blood-2015-12-686725.
89. Turtle CJ, Hanafi L, Berger C, et al. CD19 CAR – T cells of defined CD4 + : CD8 +
composition in adult B cell ALL patients. J Clin Invest. 2016;1:1-16.
doi:10.1172/JCI85309DS1.
90. Hurton L V, Singh H, Najjar AM, et al. Tethered IL-15 augments antitumor activity and
promotes a stem-cell memory subset in tumor-specific T cells. Proc Natl Acad Sci.
2016;113(48):E7788-E7797. doi:10.1073/pnas.1610544113.
91. Zhang Q, Vignali DAA. Co-stimulatory and Co-inhibitory Pathways in Autoimmunity.
Immunity. 2016;44(5):1034-1051. doi:10.1016/j.immuni.2016.04.017.
92. Saito T, Yamasaki S. Negative feedback of T cell activation through inhibitory adapters
and costimulatory receptors. Immunol Rev. 2003;192:143-160. doi:10.1034/j.1600-
065X.2003.00022.x.
93. Jago CB, Yates J, Saraiva Câmara NO, Lechler RI, Lombardi G. Differential expression
of CTLA-4 among T cell subsets. Clin Exp Immunol. 2004;136(3):463-471.
doi:10.1111/j.1365-2249.2004.02478.x.
94. Hui E, Cheung J, Zhu J, et al. T cell costimulatory receptor CD28 is a primary target for
PD-1–mediated inhibition. Science (80- ). 2017;1292(March):eaaf1292.
doi:10.1126/science.aaf1292.
95. Blackburn SD, Shin H, Haining WN, et al. Coregulation of CD8+ T cell exhaustion by
multiple inhibitory receptors during chronic viral infection. Nat Immunol. 2009;10(1):29-
37. doi:10.1038/ni.1679.
96. Hashimoto M, Kamphorst AO, Im SJ, et al. CD8 T Cell Exhaustion in Chronic Infection
and Cancer: Opportunities for Interventions. Annu Rev Med. 2018;(69):301-318.
doi:10.1146/annurev-med-012017.
97. Wherry EJ. T cell exhaustion. Nat Immunol. 2011;12(6):492-499. doi:10.1038/ni.2035.
98. Santarpia M, Karachaliou N. Tumor immune microenvironment characterization and
response to anti-PD-1 therapy. Cancer Biol Med. 2015;12(2):74-78.
M.Sc. Thesis – Vivian W.C. Lau; McMaster University – Biochemistry and Biomedical Sciences
61
doi:10.7497/j.issn.2095-3941.2015.0022.
99. Barber DL, Wherry EJ, Masopust D, et al. Restoring function in exhausted CD8 T cells
during chronic viral infection. Nature. 2006;439(7077):682-687.
doi:10.1038/nature04444.
100. Ribas A, Wolchok JD. Cancer immunotherapy using checkpoint blockade. Science (80- ).
2018;359(6382):1350-1355. doi:10.1126/science.aar4060.
101. Rosenberg SA, Restifo NP, Yang JC, Morgan RA, Dudley ME. Adoptive cell transfer: A
clinical path to effective cancer immunotherapy. Nat Rev Cancer. 2008;8(4):299-308.
doi:10.1038/nrc2355.
102. Rosenberg SA, Lotze MT, Muul LM, et al. Observations on the systemic administration of
autologous lymphokine-activated killer cells and recombinant interleukin-2 to patients
with metastatic cancer. N Engl J Med. 1985;313(23):1485-1492.
doi:10.1056/NEJM198512053132327.
103. Rosenberg S a., Packard BS, Aebersold PM, et al. Use of tumor-infiltrating lymphocytes
and interleukin-2 in the immunotherapy of patients with metastatic melanoma. A
preliminary report. N Engl J Med. 1988;319(25):1676-1680.
doi:10.1056/NEJM198812223192527.
104. Cline MJ. Perspectives for gene therapy: Inserting new genetic information into
mammalian cells by physical techniques and viral vectors. Pharmacol Ther.
1985;29(1):69-92. doi:10.1016/0163-7258(85)90017-8.
105. Miller AD. Retrovirus Packaging Cells. Hum Gene Ther. 1990;1(1):5-14.
doi:10.1089/hum.1990.1.1-5.
106. Burns JC, Friedmann T, Driever W, Burrascano M, Yee JK. Vesicular stomatitis virus G
glycoprotein pseudotyped retroviral vectors: concentration to very high titer and efficient
gene transfer into mammalian and nonmammalian cells. Proc Natl Acad Sci.
1993;90(17):8033-8037. doi:10.1073/pnas.90.17.8033.
107. Ping Y, Liu C, Zhang Y. T-cell receptor-engineered T cells for cancer treatment: current
status and future directions. Protein Cell. 2017;9(3):254-266. doi:10.1007/s13238-016-
0367-1.
108. Hunder NN, Wallen H, Cao J, et al. Treatment of metastatic melanoma with autologous
CD4+ T cells against NY-ESO-1. N Engl J Med. 2008;358(25):2698-2703.
doi:10.1056/NEJMoa0800251.
109. Robbins PF, Morgan RA, Feldman SA, et al. Tumor regression in patients with metastatic
synovial cell sarcoma and melanoma using genetically engineered lymphocytes reactive
with NY-ESO-1. J Clin Oncol. 2011;29(7):917-924. doi:10.1200/JCO.2010.32.2537.
110. Hicklin DJ, Marincola FM, Ferrone S. HLA class I antigen downregulation in human
cancers: T-cell immunotherapy revives an old story. Mol Med Today. 1999;5(4):178-186.
doi:10.1016/S1357-4310(99)01451-3.
111. Gross G, Waks T, Eshhar Z. Expression of immunoglobulin-T-cell receptor chimeric
molecules as functional receptors with antibody-type specificity. Proc Natl Acad Sci.
1989;86(24):10024-10028. doi:10.1073/pnas.86.24.10024.
112. Inbar D, Hochman J, Givol D. Localization of antibody-combining sites within the
variable portions of heavy and light chains. Proc Natl Acad Sci U S A. 1972;69(9):2659-
2662. doi:10.1073/pnas.69.9.2659.
113. Boss MA, Kenten JH, Wood CR, Emtage JS. Assembly of functional antibodies from
immunoglobulin heavy and light chains synthesised in E. coli. Nucleic Acids Res.

M.Sc. Thesis – Vivian W.C. Lau; McMaster University – Biochemistry and Biomedical Sciences
62
1984;12(9):3791-3806. doi:https://doi.org/10.1093/nar/12.9.3791.
114. Whitlow M, Bell BA, Feng SL, et al. An improved linker for single-chain fv with reduced
aggregation and enhanced proteolytic stability. Protein Eng Des Sel. 1993;6(8):989-995.
doi:10.1093/protein/6.8.989.
115. Griffiths AD, Duncan AR. Strategies for selection of antibodies by phage display. Curr
Opin Biotechnol. 1998;9(1):102-108. http://www.ncbi.nlm.nih.gov/pubmed/9503596.
116. Eshhar Z, Waks T, Gross G, Schindler DG. Specific activation and targeting of cytotoxic
lymphocytes through chimeric single chains consisting of antibody-binding domains and
the gamma or zeta subunits of the immunoglobulin and T-cell receptors. Proc Natl Acad
Sci. 1993;90(2):720-724. doi:10.1073/pnas.90.2.720.
117. Maude SL, Frey N, Shaw P a., et al. Chimeric Antigen Receptor T Cells for Sustained
Remissions in Leukemia. N Engl J Med. 2014;371(16):1507-1517.
doi:10.1056/NEJMoa1407222.
118. Haynes NM, Snook MB, Trapani JA, et al. Redirecting Mouse CTL Against Colon
Carcinoma: Superior Signaling Efficacy of Single-Chain Variable Domain Chimeras
Containing TCR-ζ vs FcεRI-γ. J Immunol. 2001;166(1):182-187.
doi:10.4049/jimmunol.166.1.182.
119. Bridgeman JS, Hawkins RE, Bagley S, Blaylock M, Holland M, Gilham DE. The Optimal
Antigen Response of Chimeric Antigen Receptors Harboring the CD3 Transmembrane
Domain Is Dependent upon Incorporation of the Receptor into the Endogenous TCR/CD3
Complex. J Immunol. 2010;184(12):6938-6949. doi:10.4049/jimmunol.0901766.
120. Bridgeman JS, Ladell K, Sheard VE, et al. CD3ζ-based chimeric antigen receptors
mediate T cell activation via cis- and trans-signalling mechanisms: implications for
optimization of receptor structure for adoptive cell therapy. Clin Exp Immunol.
2014;175(2):258-267. doi:10.1111/cei.12216.
121. Brocker T. Chimeric Fv-zeta or Fv-epsilon receptors are not sufficient to induce activation
or cytokine production in peripheral T cells. Blood. 2000;96(5):1999-2001.
http://www.bloodjournal.org/content/96/5/1999.full.html%0AArticles.
122. Jensen MC, Popplewell L, Cooper LJ, et al. Antitransgene rejection responses contribute
to attenuated persistence of adoptively transferred CD20/CD19-specific chimeric antigen
receptor redirected T cells in humans. Biol Blood Marrow Transplant. 2010;16(9):1245-
1256. doi:10.1016/j.bbmt.2010.03.014.
123. Kershaw MH, Westwood J a, Parker LL, et al. A phase I study on adoptive
immunotherapy using gene-modified T cells for ovarian cancer. Clin Cancer Res.
2006;12(20 Pt 1):6106-6115. doi:10.1158/1078-0432.CCR-06-1183.
124. Lamers CHJ. Treatment of Metastatic Renal Cell Carcinoma With Autologous T-
Lymphocytes Genetically Retargeted Against Carbonic Anhydrase IX: First Clinical
Experience. J Clin Oncol. 2006;24(13):e20-e22. doi:10.1200/JCO.2006.05.9964.
125. Kowolik CM, Topp MS, Gonzalez S, et al. CD28 costimulation provided through a CD19-
specific chimeric antigen receptor enhances in vivo persistence and antitumor efficacy of
adoptively transferred T cells. Cancer Res. 2006;66(22):10995-11004. doi:10.1158/0008-
5472.CAN-06-0160.
126. Finney HM, Akbar AN, Lawson ADG. Activation of Resting Human Primary T Cells
with Chimeric Receptors: Costimulation from CD28, Inducible Costimulator, CD134, and
CD137 in Series with Signals from the TCR Chain. J Immunol. 2004;172(1):104-113.
doi:10.4049/jimmunol.172.1.104.

M.Sc. Thesis – Vivian W.C. Lau; McMaster University – Biochemistry and Biomedical Sciences
63
127. Kawalekar OU, O’Connor RS, Fraietta JA, et al. Distinct Signaling of Coreceptors
Regulates Specific Metabolism Pathways and Impacts Memory Development in CAR T
Cells. Immunity. 2016;44(2):380-390. doi:10.1016/j.immuni.2016.01.021.
128. Zhang T, Cao L, Xie J, et al. Efficiency of CD19 chimeric antigen receptor-modified T
cells for treatment of B cell malignancies in phase I clinical trials: a meta-analysis.
Oncotarget. 2015;6(32):33961-33971. doi:10.18632/oncotarget.5582.
129. Acuto O, Michel F. CD28-mediated co-stimulation: a quantitative support for TCR
signalling. Nat Rev Immunol. 2003;3(12):939-951. doi:10.1038/nri1248.
130. Sabbagh L, Pulle G, Liu Y, Tsitsikov EN, Watts TH. ERK-Dependent Bim Modulation
Downstream of the 4-1BB-TRAF1 Signaling Axis Is a Critical Mediator of CD8 T Cell
Survival In Vivo. J Immunol. 2008;180(12):8093-8101.
doi:10.4049/jimmunol.180.12.8093.
131. Denko NC. Hypoxia, HIF1 and glucose metabolism in the solid tumour. Nat Rev Cancer.
2008;8(9):705-713. doi:10.1038/nrc2468.
132. Jacobs SR, Herman CE, MacIver NJ, et al. Glucose Uptake Is Limiting in T Cell
Activation and Requires CD28-Mediated Akt-Dependent and Independent Pathways. J
Immunol. 2008;180(7):4476-4486. doi:10.4049/jimmunol.180.7.4476.
133. Hudecek M, Sommermeyer D, Kosasih PL, et al. The Nonsignaling Extracellular Spacer
Domain of Chimeric Antigen Receptors Is Decisive for In Vivo Antitumor Activity.
Cancer Immunol Res. 2015;3(2):125-135. doi:10.1158/2326-6066.CIR-14-0127.
134. Long AH, Haso WM, Shern JF, et al. 4-1BB costimulation ameliorates T cell exhaustion
induced by tonic signaling of chimeric antigen receptors. Nat Med. 2015;21(6):581-590.
doi:10.1038/nm.3838.
135. Chervin AS, Stone JD, Holler PD, et al. The impact of TCR-binding properties and
antigen presentation format on T cell responsiveness. J Immunol. 2009;183(2):1166-1178.
doi:10.4049/jimmunol.0900054.
136. Stone JD, Chervin AS, Kranz DM. T-cell receptor binding affinities and kinetics: impact
on T-cell activity and specificity. Immunology. 2009;126(2):165-176. doi:10.1111/j.1365-
2567.2008.03015.x.
137. Chmielewski M, Hombach A, Heuser C, Adams GP, Abken H. T Cell Activation by
Antibody-Like Immunoreceptors: Increase in Affinity of the Single-Chain Fragment
Domain above Threshold Does Not Increase T Cell Activation against Antigen-Positive
Target Cells but Decreases Selectivity. J Immunol. 2004;173(12):7647-7653.
doi:10.4049/jimmunol.173.12.7647.
138. Bonifant CL, Jackson HJ, Brentjens RJ, Curran KJ. Toxicity and management in CAR T-
cell therapy. Mol Ther oncolytics. 2016;3(February):16011. doi:10.1038/mto.2016.11.
139. Brudno JN, Kochenderfer JN. Toxicities of chimeric antigen receptor T cells : recognition
and management. 2016;127(26):3321-3331. doi:10.1182/blood-2016-04-703751.CAR.
140. Locke FL, Neelapu SS, Bartlett NL, et al. Phase 1 Results of ZUMA-1: A Multicenter
Study of KTE-C19 Anti-CD19 CAR T Cell Therapy in Refractory Aggressive
Lymphoma. Mol Ther. 2017;25(1):285-295. doi:10.1016/j.ymthe.2016.10.020.
141. Lamers CHJ, Sleijfer S, Van Steenbergen S, et al. Treatment of metastatic renal cell
carcinoma with CAIX CAR-engineered T cells: Clinical evaluation and management of
on-target toxicity. Mol Ther. 2013;21(4):904-912. doi:10.1038/mt.2013.17.
142. Morgan RA, Yang JC, Kitano M, Dudley ME, Laurencot CM, Rosenberg SA. Case report
of a serious adverse event following the administration of t cells transduced with a
M.Sc. Thesis – Vivian W.C. Lau; McMaster University – Biochemistry and Biomedical Sciences
64
chimeric antigen receptor recognizing ERBB2. Mol Ther. 2010;18(4):843-851.
doi:10.1038/mt.2010.24.
143. Kloss CC, Condomines M, Cartellieri M, Bachmann M, Sadelain M. Combinatorial
antigen recognition with balanced signaling promotes selective tumor eradication by
engineered T cells. Nat Biotechnol. 2013;31(1):71-75. doi:10.1038/nbt.2459.
144. Lee DW, Gardner R, Porter DL, et al. Current concepts in the diagnosis and management
of cytokine release syndrome. Blood. 2014;124(2):188-196. doi:10.1182/blood-2014-05-
552729.current.
145. Oluwole OO, Davila ML. At The Bedside: Clinical review of chimeric antigen receptor
(CAR) T cell therapy for B cell malignancies. J Leukoc Biol. 2016;100(September):1-9.
doi:10.1189/jlb.5BT1115-524R.
146. Davila ML, Riviere I, Wang X, et al. Efficacy and toxicity management of 19-28z {CAR}
{T} cell therapy in {B} cell acute lymphoblastic leukemia. Sci Transl Med.
2014;6(224):224ra25.
147. Maude SL, Barrett D, Teachey DT, Grupp SA. Managing cytokine release syndrome
associated with novel T cell-engaging therapies. Cancer J. 2014;20(2):119-122.
doi:10.1097/PPO.0000000000000035.
148. Gargett T, Brown MP. The inducible caspase-9 suicide gene system as a “safety switch”
to limit on-target, off-tumor toxicities of chimeric antigen receptor T-cells. Front
Pharmacol. 2014;5(OCT):1-7. doi:10.3389/fphar.2014.00235.
149. Gomes-Silva D, Mukherjee M, Srinivasan M, et al. Tonic 4-1BB Costimulation in
Chimeric Antigen Receptors Impedes T Cell Survival and Is Vector-Dependent. Cell Rep.
2017;21(1):17-26. doi:10.1016/j.celrep.2017.09.015.
150. Fuertes Marraco SA, Neubert NJ, Verdeil G, Speiser DE. Inhibitory receptors beyond T
cell exhaustion. Front Immunol. 2015;6(JUN):1-14. doi:10.3389/fimmu.2015.00310.
151. Mamonkin M, Mukherjee M, Srinivasan M, et al. Reversible Transgene Expression
Reduces Fratricide and Permits 4-1BB Costimulation of CAR T Cells Directed to T-Cell
Malignancies. Cancer Immunol Res. 2017:canimm.0126.2017. doi:10.1158/2326-
6066.CIR-17-0126.
152. Sakemura R, Terakura S, Watanabe K, et al. A Tet-On Inducible System for Controlling
CD19-Chimeric Antigen Receptor Expression upon Drug Administration. Cancer
Immunol Res. 2016;4(8):658-668. doi:10.1158/2326-6066.CIR-16-0043.
153. Zhong S, Malecek K, Johnson LA, et al. T-cell receptor affinity and avidity defines
antitumor response and autoimmunity in T-cell immunotherapy. Proc Natl Acad Sci U S
A. 2013;110(17):6973-6978. doi:10.1073/pnas.1221609110.
154. Dubrovsky L, Dao T, Gejman RS, et al. T cell receptor mimic antibodies for cancer
therapy. Oncoimmunology. 2016;5(1). doi:10.1080/2162402X.2015.1049803.
155. Harris DT, Hager M V., Smith SN, et al. Comparison of T Cell Activities Mediated by
Human TCRs and CARs That Use the Same Recognition Domains. J Immunol.
2017:ji1700236. doi:10.4049/jimmunol.1700236.
156. Stone JD, Harris DT, Soto CM, et al. A novel T cell receptor single-chain signaling
complex mediates antigen-specific T cell activity and tumor control. Cancer Immunol
Immunother. 2014;63(11):1163-1176. doi:10.1007/s00262-014-1586-z.
157. Davenport AJ, Cross RS, Watson KA, et al. Chimeric antigen receptor T cells form
nonclassical and potent immune synapses driving rapid cytotoxicity. Proc Natl Acad Sci.
2018:201716266. doi:10.1073/pnas.1716266115.

M.Sc. Thesis – Vivian W.C. Lau; McMaster University – Biochemistry and Biomedical Sciences
65
158. Helsen CW, Hammill JA, Lau VWC, et al. A novel chimeric T cell receptor that delivers
robust anti-tumor activity and low off-tumor toxicity. Nat Commun. 2018;In press.
159. Kalaitsidou M, Kueberuwa G, Schütt A, Gilham DE. CAR T-cell therapy: toxicity and the
relevance of preclinical models. Immunotherapy. 2015;7(5):487-497.
doi:10.2217/imt.14.123.
160. Hammill JA, VanSeggelen H, Helsen CW, et al. Designed ankyrin repeat proteins are
effective targeting elements for chimeric antigen receptors. J Immunother Cancer.
2015;3(1):55. doi:10.1186/s40425-015-0099-4.
161. Brogdon J, June CH, Loew A, Maus M, Scholler J. Treatment of cancer using humanized
anti-CD19 chimeric antigen receptor. September 2014. http://arxiv.org/abs/1208.5721.
162. Kochenderfer JN. Chimeric antigen receptors targeting B-cell maturation antigen. 2015.
163. Roederer M, Nozzi JL, Nason MC. SPICE: Exploration and analysis of post-cytometric
complex multivariate datasets. Cytom Part A. 2011;79 A(2):167-174.
doi:10.1002/cyto.a.21015.
164. Kim D, Pertea G, Trapnell C, Pimentel H, Kelley R, Salzberg SL. TopHat2: accurate
alignment of transcriptomes in the presence of insertions, deletions and gene fusions.
Genome Biol. 2013;14(4):R36. doi:10.1186/gb-2013-14-4-r36.
165. Kim D, Langmead B, Salzberg SL. HISAT: a fast spliced aligner with low memory
requirements. Nat Methods. 2015;12(4):357-360. doi:10.1038/nmeth.3317.
166. Anders S, Pyl PT, Huber W. HTSeq-A Python framework to work with high-throughput
sequencing data. Bioinformatics. 2015;31(2):166-169. doi:10.1093/bioinformatics/btu638.
167. Robinson MD, Oshlack A. A scaling normalization method for differential expression
analysis of RNA-seq data. Genome Biol. 2010;11(3):R25. doi:10.1186/gb-2010-11-3-r25.
168. Law CW, Chen Y, Shi W, Smyth GK. voom: precision weights unlock linear model
analysis tools for RNA-seq read counts. Genome Biol. 2014;15:R29. doi:10.1186/gb-
2014-15-2-r29.
169. Ritchie ME, Phipson B, Wu D, et al. limma powers differential expression analyses for
RNA-sequencing and microarray studies. Nucleic Acids Res. 2015;43(7):e47-e47.
doi:10.1093/nar/gkv007.
170. Benjamini Y, Hochberg Y. Controlling the False Discovery Rate: A Practical and
Powerful Approach to Multiple Testing. J R Stat Soc Ser B. 1995;57(1):289-300.
http://www.jstor.org/stable/2346101.
171. Wu G, Feng X, Stein L. A human functional protein interaction network and its
application to cancer data analysis. Genome Biol. 2010;11(5):R53. doi:10.1186/gb-2010-
11-5-r53.
172. Shannon P, Markiel A, Owen Ozier 2, et al. Cytoscape: a software environment for
integrated models of biomolecular interaction networks. Genome Res. 2003;(13):2498-
2504. doi:10.1101/gr.1239303.metabolite.
173. Maere S, Heymans K, Kuiper M. BiNGO: A Cytoscape plugin to assess
overrepresentation of Gene Ontology categories in Biological Networks. Bioinformatics.
2005;21(16):3448-3449. doi:10.1093/bioinformatics/bti551.
174. Jiang D, Liu Y, Wang H, et al. Tumour infiltrating lymphocytes correlate with improved
survival in patients with esophageal squamous cell carcinoma. Sci Rep. 2017;7(December
2016):1-10. doi:10.1038/srep44823.
175. Maker A V., Ito H, Mo Q, et al. Genetic Evidence That Intratumoral T-cell Proliferation
and Activation Are Associated with Recurrence and Survival in Patients with Resected
M.Sc. Thesis – Vivian W.C. Lau; McMaster University – Biochemistry and Biomedical Sciences
66
Colorectal Liver Metastases. Cancer Immunol Res. 2015;3(4):380-388. doi:10.1158/2326-
6066.CIR-14-0212.
176. Gattinoni L, Zhong XS, Palmer DC, et al. Wnt signaling arrests effector T cell
differentiation and generates CD8+ memory stem cells. Nat Med. 2009;15(7):808-813.
doi:10.1038/nm.1982.
177. Gattinoni L, Ji Y, Restifo NP. Wnt/??-catenin signaling in T-cell immunity and cancer
immunotherapy. Clin Cancer Res. 2010;16(19):4695-4701. doi:10.1158/1078-0432.CCR-
10-0356.
178. Ziegler SF, Ramsdell F, Alderson MR. The activation antigen CD69. Stem Cells.
1994;12(5):456-465. doi:10.1002/stem.5530120502.
179. Cibrián D, Sánchez-Madrid F. CD69: from activation marker to metabolic gatekeeper. Eur
J Immunol. 2017;47(6):946-953. doi:10.1002/eji.201646837.
180. Ipseiz N, Uderhardt S, Scholtysek C, et al. The Nuclear Receptor Nr4a1 Mediates Anti-
Inflammatory Effects of Apoptotic Cells. J Immunol. 2014;192(10):4852-4858.
doi:10.4049/jimmunol.1303377.
181. Ashouri JF, Weiss A. Endogenous Nur77 Is a Specific Indicator of Antigen Receptor
Signaling in Human T and B Cells. J Immunol. 2017;198(2):657-668.
doi:10.4049/jimmunol.1601301.
182. Scholzen T, Gerdes J. The Ki-67 protein: from the known and the unknown. JCell
Physiol. 2000;182(3):311-322. doi:10.1002/(SICI)1097-4652(200003)182:3<311::AID-
JCP1>3.0.CO;2-9.
183. Billingsley JM, Rajakumar PA, Connole MA, et al. Characterization of CD8+ T Cell
Differentiation following SIVΔnef Vaccination by Transcription Factor Expression
Profiling. Douek DC, ed. PLOS Pathog. 2015;11(3):e1004740.
doi:10.1371/journal.ppat.1004740.
184. Intlekofer AM, Takemoto N, Wherry EJ, et al. Effector and memory CD8+ T cell fate
coupled by T-bet and eomesodermin. Nat Immunol. 2005;6(12):1236-1244.
doi:10.1038/ni1268.
185. Tai T-S, Pai S-Y, Ho I-C. GATA-3 Regulates the Homeostasis and Activation of CD8+ T
Cells. J Immunol. 2013;190(1):428-437. doi:10.4049/jimmunol.1201361.
186. Blaeschke F, Stenger D, Kaeuferle T, et al. Induction of a central memory and stem cell
memory phenotype in functionally active CD4+ and CD8+ CAR T cells produced in an
automated good manufacturing practice system for the treatment of CD19+ acute
lymphoblastic leukemia. Cancer Immunol Immunother. 2018;0(0):0. doi:10.1007/s00262-
018-2155-7.
187. Gattinoni L, Lugli E, Ji Y, et al. A human memory T cell subset with stem cell–like
properties. Nat Med. 2011;17(10):1290-1297. doi:10.1038/nm.2446.
188. Sommermeyer D, Hudecek M, Kosasih PL, et al. Chimeric antigen receptor-modified T
cells derived from defined CD8+ and CD4+ subsets confer superior antitumor reactivity in
vivo. Leukemia. 2016;30(2):492-500. doi:10.1038/leu.2015.247.
189. Xu Y, Zhang M, Ramos CA, et al. Closely related T-memory stem cells correlate with in
vivo expansion of CAR.CD19-T cells and are preserved by IL-7 and IL-15. Blood.
2014;123(24):3750-3759. doi:10.1182/blood-2014-01-552174.
190. Kaartinen T, Luostarinen A, Maliniemi P, et al. Low interleukin-2 concentration favors
generation of early memory T cells over effector phenotypes during chimeric antigen
receptor T-cell expansion. Cytotherapy. 2017;19(6):689-702.

M.Sc. Thesis – Vivian W.C. Lau; McMaster University – Biochemistry and Biomedical Sciences
67
doi:10.1016/j.jcyt.2017.03.067.
191. Klebanoff CA, Crompton JG, Leonardi AJ, et al. Inhibition of AKT signaling uncouples T
cell differentiation from expansion for receptor-engineered adoptive immunotherapy. JCI
Insight. 2017;2(23):1-17. doi:10.1172/JCI.INSIGHT.95103.
192. Crompton JG, Sukumar M, Roychoudhuri R, et al. Akt inhibition enhances expansion of
potent tumor-specific lymphocytes with memory cell characteristics. Cancer Res.
2015;75(2):296-305. doi:10.1158/0008-5472.CAN-14-2277.
193. Au-Yeung BB, Zikherman J, Mueller JL, et al. A sharp T-cell antigen receptor signaling
threshold for T-cell proliferation. Proc Natl Acad Sci. 2014;111(25):E3679-88.
doi:10.1073/pnas.1413726111.
194. Ilyas S, Yang JC. Landscape of Tumor Antigens in T Cell Immunotherapy. J Immunol.
2015;195(11):5117-5122. doi:10.4049/jimmunol.1501657.
195. Cheever MA, Allison JP, Ferris AS, et al. The prioritization of cancer antigens: A
National Cancer Institute pilot project for the acceleration of translational research. Clin
Cancer Res. 2009;15(17):5323-5337. doi:10.1158/1078-0432.CCR-09-0737.
196. Wetzel SK, Settanni G, Kenig M, Binz HK, Plückthun A. Folding and Unfolding
Mechanism of Highly Stable Full-Consensus Ankyrin Repeat Proteins. 2008:241-257.
doi:10.1016/j.jmb.2007.11.046.
197. Zahnd C, Wyler E, Schwenk JM, et al. A Designed Ankyrin Repeat Protein Evolved to
Picomolar Affinity to Her2. 2007:1015-1028. doi:10.1016/j.jmb.2007.03.028.
198. Cheadle EJ, Sheard V, Rothwell DG, et al. Differential role of Th1 and Th2 cytokines in
autotoxicity driven by CD19-specific second-generation chimeric antigen receptor T cells
in a mouse model. J Immunol. 2014;192(8):3654-3665. doi:10.4049/jimmunol.1302148.
199. Siegler EL, Wang P. Preclinical models in chimeric antigen receptor-engineered T cell
therapy. Hum Gene Ther. 2018;29(5):hum.2017.243. doi:10.1089/hum.2017.243.
200. Kochenderfer JN, Yu Z, Frasheri D, Restifo NP, Rosenberg SA. Adoptive transfer of
syngeneic T cells transduced with a chimeric antigen receptor that recognizes murine
CD19 can eradicate lymphoma and normal B cells. Blood. 2010;116(19):3875-3886.
doi:10.1182/blood-2010-01-265041.
201. Yao L-C, Riess J, Cheng M, et al. Patient-derived tumor xenografts in humanized NSG-
SGM3 mice: A new immuno-oncology platform. J Clin Oncol. 2016;34(15_suppl):3074.
doi:10.1200/JCO.2016.34.15_suppl.3074.
202. Norelli M, Camisa B, Barbiera G, et al. Monocyte-derived IL-1 and IL-6 are differentially
required for cytokine-release syndrome and neurotoxicity due to CAR T cells. Nat Med.
2018;24(June):1-10. doi:10.1038/s41591-018-0036-4.

M.Sc. Thesis – Vivian W.C. Lau; McMaster University – Biochemistry and Biomedical Sciences
68
7.0 Appendix
Appendix I. Extended graphs of CD69 and Nur77 expression by CAR and TAC T cells
stimulated with BCMA-Fc-coated beads, or KMS-11 cells.
Refer to Figure 12 in main text.
T im e P o s t-S t im u la t io n (h )
% T
ce
lls
CD
8+
CD
69
+
1 2 4 824
48
0
2 0
4 0
6 0
8 0
1 0 0
n .s .
n .s .
* ** * *
* * *
* * *
T im e P o s t-S t im u la t io n (h )
% T
ce
lls
CD
4+
CD
69
+
1 2 4 824
48
0
2 0
4 0
6 0
8 0
1 0 0
n .s .
n .s .
** *
** *
T im e P o s t-S t im u la t io n (h )
% T
ce
lls
CD
8+
CD
69
+
1 2 4 824
48
0
2 0
4 0
6 0
8 0
1 0 0n .s .
*
T im e P o s t-S t im u la t io n (h )
% T
ce
lls
CD
4+
CD
69
+
1 2 4 824
48
0
2 0
4 0
6 0
8 0
1 0 0
n .s .
KMS-11 BCMA-CD28ζ CAR
BCMA-TAC
BCMA-Fc Beads
KMS-11
BCMA-CD28ζ CAR
BCMA-TAC
BCMA-Fc Beads

M.Sc. Thesis – Vivian W.C. Lau; McMaster University – Biochemistry and Biomedical Sciences
69
T im e P o s t-S tim u la t io n (h )
% T
ce
lls
CD
4+
Nu
r7
7+
(bk
gd
co
rr
ec
ted
)
1 2 4 8
0
1 0
2 0
3 0
4 0
5 0
T im e P o s t-S tim u la t io n (h )
% T
ce
lls
CD
4+
Nu
r7
7+
(bk
gd
co
rr
ec
ted
)
1 2 4 8
0
1 0
2 0
3 0
T im e P o s t-S tim u la t io n (h )
% T
ce
lls
CD
8+
Nu
r7
7+
(bk
gd
co
rr
ec
ted
)
1 2 4 8
0
1 0
2 0
3 0
T im e P o s t-S tim u la t io n (h )
% T
ce
lls
CD
8+
Nu
r7
7+
(bk
gd
co
rr
ec
ted
)
1 2 4 8
0
2 0
4 0
6 0
8 0
KMS-11
BCMA-CD28ζ CAR
BCMA-TAC
BCMA-Fc Beads
KMS-11
BCMA-CD28ζ CAR
BCMA-TAC
BCMA-Fc Beads

M.Sc. Thesis – Vivian W.C. Lau; McMaster University – Biochemistry and Biomedical Sciences
70
Appendix II. Heatmap of transcriptome analysis of CD4+ TAC T cells stimulated with beads or
cells. Refer to Figure 14 in main text.
CD4+ T cells
D4 -
NS
D5
- N
S
D6 -
NS
D5 –
Bea
ds
4h
D4
– B
ea
ds
4h
D6
– B
ea
ds 4
h
D5
– B
ea
ds 2
4h
D4
– B
ea
ds 2
4h
D6
– B
ea
ds 2
4h
D5
– C
ell
s 2
4h
D4
– C
ell
s 2
4h
D6
– C
ell
s 2
4h
D4
– C
ell
s 4
h
D5
– C
ell
s 4
h
D6
– C
ell
s 4
h
Z-score

M.Sc. Thesis – Vivian W.C. Lau; McMaster University – Biochemistry and Biomedical Sciences
71
Appendix III. Fold-change values from differential expression analysis of transcription factors
in TAC T cells.
Column1 CD4+ T cells; Beads 4hrs
CD4+ T cells; Beads 24hrs
CD4+ T cells, Cells 4h
CD4+ T cells, Cells 24h
FOS 99.85 29.1
FOSB 27.09 14.68 419.47 11.58
IRF4 19.79 5.48 31.96 8.97
TBX21 11.28 4.81 35.4 4.61
BATF 7.75 4.55 19.31 13.95
BCL6 4.67 2.63 3.44
ZEB2 3.42 4.48 31.56 3.94
PRDM1 3.14 1.98 8.47 5.5
ID2 2.17 2.22 4.99 2.19
ID3 2.14 -3.44 -4.18 -5.92
RORC 2.02
3.85 -5.29
TCF7 1.95
-6.42
PBX3 1.71 1.45
1.37
NFIL3 1.56 2.93 17.89 10.7
BCL11B -1.41
-1.3 -2.55
LEF1
-2.49 -4.41
JUN
-1.6
-3.84
FOXO1
-1.65
GATA3
1.45
JUND
1.67
RUNX3
2.16
JUNB
5.03
EOMES
2.1

M.Sc. Thesis – Vivian W.C. Lau; McMaster University – Biochemistry and Biomedical Sciences
72
Column1 CD8+ T cells; Beads 4hrs
CD4+ T cells; Beads 24hrs
CD8+ T cells; Cells 4hrs
CD4+ T cells; Cells 24 hrs
FOS 12.36 14.71 387.25 3.59
FOSB 6.95 10.37 175.79 3.73
IRF4 9.74 3.28 32.3 4.38
TBX21 7.03 8.22 63.85 11.35
BATF 5.96 5.1 36.64 21.02
BCL6 2.79
-4.41
ZEB2 6.21 17.34 87.79 4.38
PRDM1 3.55 1.89 10.07 3.08
ID2 2.08 1.93 8.29 1.84
ID3 1.78 -2.27 -1.74 -3.96
RORC 4.06 4.09 6.48
TCF7 2.14
-14.98
PBX3
NFIL3
3.15 13.76 8.52
BCL11B
-3 -3.67
LEF1
-4.71 -6.08
JUN
-4.19
FOXO1
-1.87
GATA3
1.75 -1.45
JUND 1.5
1.85 1.64
RUNX3
2.15
JUNB 2.1
5.62
EOMES 2.89 5.42