characterization of genetic structure of podophyllum
TRANSCRIPT
African Journal of Biotechnology Vol. 7 (8), pp. 1028-1040, 17 April, 2008 Available online at http://www.academicjournals.org/AJB DOI: 10.5897/AJB07.697 ISSN 1684–5315 © 2008 Academic Journals
Full Length Research Paper
Characterization of genetic structure of Podophyllum hexandrum populations, an endangered medicinal herb
of Northwestern Himalaya, using ISSR-PCR markers and its relatedness with podophyllotoxin content
Afroz Alam1, Pradeep K. Naik1*, Pallavi Gulati1, Ashwani Kumar Gulati2 and Gyan P. Mishra1
1Department of Bioinformatics and Biotechnology, Jaypee University of Information Technology, Waknaghat, Solan
173215, Himachal Pradesh, India. 2Additional
Principal Chief Conservator of Forests, Himachal Pradesh Forest Department, Talland, Shimla-171 001,
Himachal Pradesh, India.
Accepted 19 February, 2008
To obtain accurate estimates of genetic structure for purpose of conservation planning for wild Indian May apple (Podophyllum hexandrum) in the Northwestern region of Himalayas, Himachal Pradesh, genetic diversity among and within 28 populations were analyzed. Eleven microsatellite DNA markers were isolated and used to quantify genetic structure. Out of 68 ISSR loci tested, 88.23% were polymorphic. The genetic diversity was high (percentage of polymorphic bands, PBB = 83.82%; Shannon’s information index, I = 0.4413) at the population level, but low within individual study populations (PBB = 34.22%; Shannon’s information index I = 0.1879). The mean coefficient of gene differentiation (Gst) was 0.7484, indicating that 29.44% of the genetic diversity resided within the population. Analysis of molecular variance (AMOVA) indicated that 48% of the genetic diversity among the study populations was attributed to geographical location while 29% was attributed to differences in their habitats. An overall value of mean estimated number of gene flow (Nm = 0.1618) indicated that there was limited gene flow among the sampled populations. We found a clear tendency for higher Gst values and podophyllotoxin levels between the populations with increasing geographical altitude. However, the existing variation in podophyllotoxin content among the populations was proved to be coupled with geographical altitude (r = 0.922) but not with genetic variations (r = - 0.273). Hence we recommend that any further cultivation of this species requires optimization of environmental factors in order to increase the rate of production of podophyllotoxin from any collected population. Key words: Genetic structure, Gene flow, differentiation, ISSR-PCR, Podophyllotoxin, Podophyllum hexandrum.
INTRODUCTION Over the long term, the ability of a population to respond adaptively to environmental changes depends on the level of genetic variability or diversity it contains (Ayala and Kiger, 1984). During the process of evolution, genetic differentiation by natural selection to facilitate reproduc-tive isolation involves the presupposition of the origin of *Corresponding author. E-mail: [email protected]
geographic races, subspecies and species (Stebbins, 1999). A species without enough genetic diversity is thought to be unable to cope with changing environments or evolving competitors and parasites (Schaal et al., 1991). Therefore studies of population genetic diversity and the structure of population within a species may not only illustrate the evolutionary process and mechanism but also provide information useful for biological conser-vation of P. hexandrum (Berberidaceae) an endangered medicinal herb grows wild in the interior Himalayan ranges of India.
The Himalayan region is home of numerous highly valued medicinal plants including Podophyllum hexan-drum Royle (Indian May apple). It is recognized for its anticancer properties. The rhizomes and roots of P. hexandrum contain anti-tumor lignans such as podophy-llotoxin, 4’-demethyl podophyllotoxin and podophyllotoxin 4-O-glucoside (Tyler et al., 1988; Broomhead and Dewick, 1990). Among these lignans, podophyllotoxin is most important for its use in the synthesis of anti-cancer drugs etoposide, teniposide and etophos (Issell et al., 1984). These compounds have been used for the treat-ment of long and testicular cancers as well as certain leukemias (Stahelin and Wartburg, 1991; Imbert, 1998). In addition, podophyllotoxin is also the precursor to a new derivative CPH 82 that is being tested for rheumatoid arthritis and other derivatives for the treatment of psoriasis and malaria (Leander and Rosen, 1988; Lerndal and Svensson, 2000). Total synthesis of podophyllotoxin is an expensive process and availability of the compound from natural resources is an important issue for pharma-ceutical companies that manufacture these drugs (Canel et al., 2001). Podophyllotoxin content in Himalayan mayapple is high (4.3%) compared with other species of Podophyllum, notable P. peltatum (0.25%), the most common species in the American subcontinent (Jackson and Dewick, 1984).
The population size of P. hexandrum in Himalayas region is very low (40-700) plants per location) and is declining each year. Some of the populations in certain pockets have virtually disappeared owing to anthropo-genic activities and overexploitation (Bhadula et al., 1996). Thus, there is a need to conserve genetic diversity of this prized medicinal plant which may become extinct if its reckless exploitation continues. In dwindling popula-tions the size of the surviving population greatly affects genetic diversity (Gao, 2005). Therefore, arresting the decline of population of P. hexandrum in the wild and studying the structure of the remaining populations, especially the extent of genetic diversity still remained in them, is of critical importance. Traditionally, for comer-cial purposes and germplasm conservation, a large number of P. hexandrum populations collected from different sites and cultured them in nursery. This method of operation leads to gene flow between the wild populations and the introduced populations. Considerable variation in mor-phological characters such as plant height, leaf characteristics, fruit weight, seed weight and color etc., and in biochemical characters such as podophylloresin and podophyllotoxin content in rhizomes also been reported in P. hexandrum plants from the Garhwal Himalayas (Bhadula et al., 1996; Airi et al., 1997; Purohit et al., 1999). This as well as the RAPD study of P. hexandrum have indicated the existence of high inter and intra population variations (Sharma et al., 2000). However, this study is restricted to only two geographical locations (two district of Himachal Pradesh, India). More-over, the impact of geographical distance/altitude with the
Alam et al. 1029 genetic variation and podophyllotoxin content as well as the relationship of genetic variation with the podophy-llotoxin content of P. hexandrum populations has not been reported so far, which we feel is very important for conservation aspect. This need study of genetic variation of P. hexandrum populations with wide geographical coverage. To our knowledge, no report has been report-ed on the genetic diversity, population structure and gene flow among the populations of P. hexandrum in Himala-yan region with high resolution molecular markers like ISSR.
Inter-Simple Sequence Repeats (ISSR) amplifies inter-microsatellite sequences at multiple loci throughout the genome (Salimath et al., 1995; Li and Xia, 2005). An ISSR molecular marker technique permits the detection of polymorphism in microsatellites and inter-micorsatellite loci without previous knowledge of DNA sequences (Zietkiewicz et al., 1994). Furthermore, they are highly reproducible due to their primer length and to the high stringency achieved by the annealing temperature. This technique has been widely used to investigate genetic diversity and population genetic structure (Reddy and Nagaraju, 1999; Li and Xia, 2005; Chen et al., 2005) because of its advantages in overcoming limitations of allozyme and RAPD techniques (Wolfe et al., 1998; Ratnaparkhe et al., 1998; Esselman et al., 1999).
In this study, we investigated the genetic diversity and population structure as well as their relationship with podophyllotoxin content in the diminishing wild popula-tions of P. hexandrum in northwestern Himalays, Himachal Pradesh, India, with the aim to providing insight to facilitate conservation management of the remaining populations. Appropriate conservation management should be adopted including in situ conservation and germplasm collection from those of the remaining populations with the greatest genetic variation. MATERIALS AND METHODS
Plant materials The plant material used in the study of genetic diversity and population structure was obtained wild from 28 populations (28 sites), covering 11 geographical locations (Forest Divisions) with altitude ranging 1300 – 4300 m from the northwestern Himalaya region, Himachal Pradesh, India (Table 1). Each population consist of about (7 - 8) plants with different age groups (1
st, 2
nd, 3
rd and 4
th
year). Only 3rd
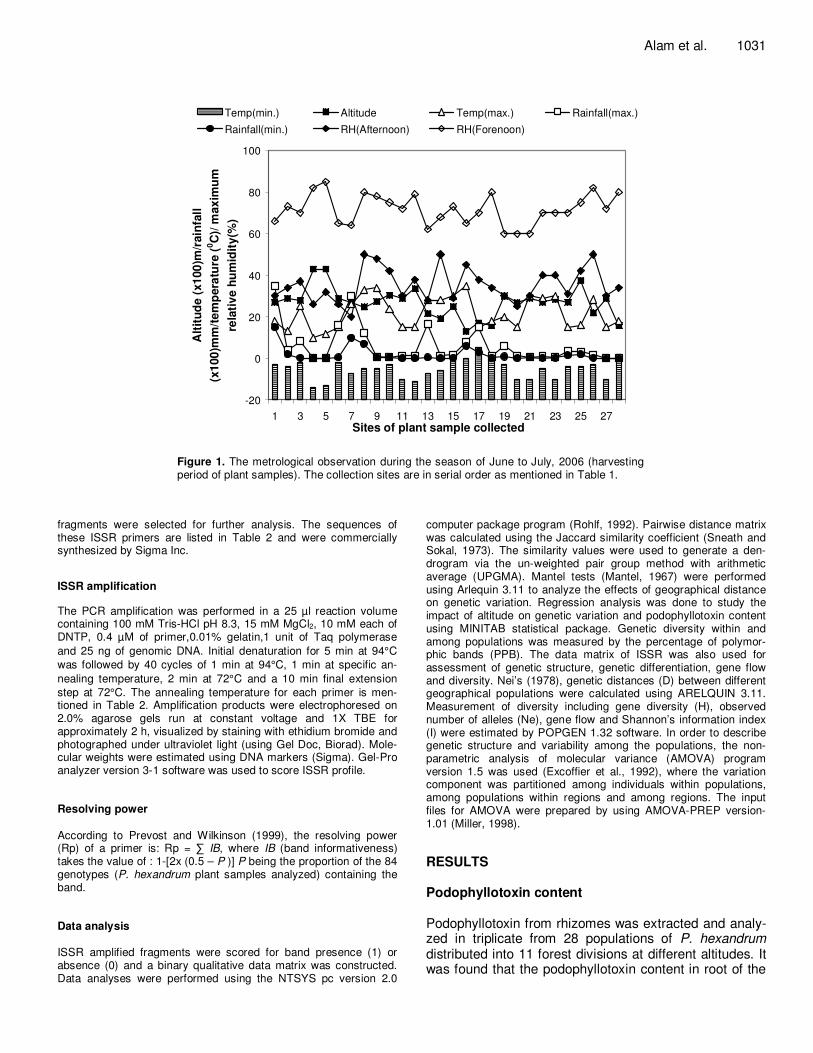
year plants were used for extraction of podophy-llotoxin. Whereas, for analysis of genetic diversity, representative samples of 3 plants (3 replicates for each population) were used and designated with accession code with respect to the site of collections. The interval between samples was 2 - 5 m, the pair wise distance between populations was 0.5 – 32 Km, whereas, the pair wise distance between forest divisions was 10 – 400 Km. Morphological feature of each plant sample as well as the environ-mental factors for each sampling site were also documented. The variations in environmental factors among different sites were represented in Figure 1. About 5 g of young leaves from each representative plant samples were obtained and placed in a zip-lock plastic bag containing silica gel which speeded up the drying
1030 Afr. J. Biotechnol.
Table 1. Twenty eight populations of P. hexandrum collected from different sites at different altitudes covering eleven forest divisions and their podophyllotoxin content.
Name of Forest Division
Acc. No.
Sampling site
Altitude (m)
*Podophyllotoxin (% dry weight) (Mean ± sd)
Parvati TMV Twin Multivora 1300.00 3.567 ± 0.747
R4K R/4,Kasol(C-II-a-Nry) 1570.00 4.753 ± 0.796
ARR Anganoala (R/9) Rajgiri 1300.00 3.020 ± 0.524
Dodrakwar MTH Madhvi Thach 3048.00 6.207 ± 0.743
KLP Kala Pani 2743.20 5.800 ± 0.212
Churah DPC DPF(D-1892-C1) (Chaoundi) 3750.00 8.487 ± 0.565
DPD DPF(D-791-C1 2700.00 5.753 ± 0.411
Seraj JPS Jalora Pass (Sojha Nry) 2667.00 6.607 ± 0.348
JCB Jalora c-30(b) 2473.20 6.790 ± 0.855
Lahaul MVL Myar Valley 4300.00 9.533 ± 0.484
NGR Nayan ghar 4300.00 8.857 ± 0.427
Kullu BND Brundhar 1916.00 4.077 ± 0.270
GLB Gulaba 2895.00 5.943 ± 0.591
CHK ChanderKhani 3352.80 8.033 ± 0.454
KNY Kaned Nry 2150.00 4.657 ± 0.850
SGR Sanghar Nry 2100.00 4.173 ± 0.276
Palampur BBL Bada Bangal 2895.00 7.097 ± 0.797
CBL Chota Bangal 2700.00 6.573 ± 0.827
IHB IHBT 2800.00 5.183 ± 0.780
Rampur BTH Bander Thach 2895.00 6.773 ± 0.640
SRP Saropa Nry 2499.40 6.097 ± 0.942
Kinnaur NCH Nichar Nry 2190.00 4.760 ± 0.291
RAN Rango (N-C-8) 2710.00 5.797 ± 0.552
Pangi SCR Sach Range 2712.70 6.133 ± 0.216
KLR Killer Range 2850.00 5.967 ± 0.692
PTR Purthi Range 2900.00 6.233 ± 0.790
Bharmaur GHD Ghoei DPF 2080.00 5.700 ± 0.692
SMR Samara RF 2590.80 6.030 ± 0.825
*Podophyllotoxin content varied significantly among populations, F = 17.22, P< 0.001; as well as between regions, F = 3.70, P < 0.009. process. Each sample does not necessarily denote a separate
genetic individual. The samples were stored at -80°C until use.
Extraction and quantization of podophyllotoxin
Dried roots were ground to a powder in a pestle and mortar. Podo-phyllotoxin was extracted following the procedure of Broomhead and Dewick (1990). 50 mg root powdered was suspended in 20 ml
of ethanol and continuously stirred at 60°C for 20 min. using a magnetic stirrer. The extract was filtered through Whattman filter paper No.1. Second, third and fourth extractions of the same samples were done with 10 ml ethanol for 10 min under condition mentioned above. All the extracts were pooled and ethanol evapo-
rated to dryness in a water bath shaker at 60°C. The resultant residue was dissolved in 10 ml acetonitrile (HPLC grade) and filter-ed with 0.22 µm durapore membrane filter (Millipore) for HPLC analysis.
HPLC analysis was carried out using Nova Pack C18 cartridge column (250 x 4.6 mm) in HPLC system (Water). Acetonitrile: water: methanol (37:58:5) was used as a mobile phase with a flow rate of 1.5 mlmin
-1. Crude extract (20 µl) was used for injection into the
HPLC system. Podophyllotoxin was detected at 230 nm (490 E
multi wavelength Detector waters). Podophyllotoxin (0.1 mgl-1
; Sigma, P-4405) was used as a standard for calculating podophy-llotoxin content in the samples on the basis of peak heights. All the experiments on extraction of podophyllotoxin and HPLC analysis were repeated three times.
Genomic DNA extraction
Genomic DNA of every representative plant samples (3 replicate samples per site) was isolated using CTAB method (Saghai-Maroof et al., 1984). DNA was quantified by comparison with known con-centration lambda DNA following electrophoresis on a 1% agarose gel.
Evaluation of primers
A total of 30 ISSR primers were screened with 10 plant samples. After assessing the effects of Mg
+2 concentration, template DNA
concentration and temperature during the annealing stage of the amplification, 11 primers which produced clear and reproducible
Alam et al. 1031
-20
0
20
40
60
80
100
1 3 5 7 9 11 13 15 17 19 21 23 25 27Sites of plant sample collected
Alt
itu
de
(x1
00
)m/r
ain
fall
(x1
00
)mm
/te
mp
era
ture
(0C
)/ m
ax
imu
m
rela
tiv
e h
um
idit
y(%
)
Temp(min.) Altitude Temp(max.) Rainfall(max.)
Rainfall(min.) RH(Afternoon) RH(Forenoon)
Figure 1. The metrological observation during the season of June to July, 2006 (harvesting period of plant samples). The collection sites are in serial order as mentioned in Table 1.
fragments were selected for further analysis. The sequences of these ISSR primers are listed in Table 2 and were commercially synthesized by Sigma Inc.
ISSR amplification
The PCR amplification was performed in a 25 µl reaction volume containing 100 mM Tris-HCl pH 8.3, 15 mM MgCl2, 10 mM each of DNTP, 0.4 µM of primer,0.01% gelatin,1 unit of Taq polymerase
and 25 ng of genomic DNA. Initial denaturation for 5 min at 94°C
was followed by 40 cycles of 1 min at 94°C, 1 min at specific an-
nealing temperature, 2 min at 72°C and a 10 min final extension
step at 72°C. The annealing temperature for each primer is men-tioned in Table 2. Amplification products were electrophoresed on 2.0% agarose gels run at constant voltage and 1X TBE for approximately 2 h, visualized by staining with ethidium bromide and photographed under ultraviolet light (using Gel Doc, Biorad). Mole-cular weights were estimated using DNA markers (Sigma). Gel-Pro analyzer version 3-1 software was used to score ISSR profile. Resolving power According to Prevost and Wilkinson (1999), the resolving power (Rp) of a primer is: Rp = ∑ IB, where IB (band informativeness) takes the value of : 1-[2x (0.5 – P )] P being the proportion of the 84 genotypes (P. hexandrum plant samples analyzed) containing the band. Data analysis ISSR amplified fragments were scored for band presence (1) or absence (0) and a binary qualitative data matrix was constructed. Data analyses were performed using the NTSYS pc version 2.0
computer package program (Rohlf, 1992). Pairwise distance matrix was calculated using the Jaccard similarity coefficient (Sneath and Sokal, 1973). The similarity values were used to generate a den-drogram via the un-weighted pair group method with arithmetic average (UPGMA). Mantel tests (Mantel, 1967) were performed using Arlequin 3.11 to analyze the effects of geographical distance on genetic variation. Regression analysis was done to study the impact of altitude on genetic variation and podophyllotoxin content using MINITAB statistical package. Genetic diversity within and among populations was measured by the percentage of polymor-phic bands (PPB). The data matrix of ISSR was also used for assessment of genetic structure, genetic differentiation, gene flow and diversity. Nei’s (1978), genetic distances (D) between different geographical populations were calculated using ARELQUIN 3.11. Measurement of diversity including gene diversity (H), observed number of alleles (Ne), gene flow and Shannon’s information index (I) were estimated by POPGEN 1.32 software. In order to describe genetic structure and variability among the populations, the non-parametric analysis of molecular variance (AMOVA) program version 1.5 was used (Excoffier et al., 1992), where the variation component was partitioned among individuals within populations, among populations within regions and among regions. The input files for AMOVA were prepared by using AMOVA-PREP version-1.01 (Miller, 1998).
RESULTS Podophyllotoxin content Podophyllotoxin from rhizomes was extracted and analy-zed in triplicate from 28 populations of P. hexandrum distributed into 11 forest divisions at different altitudes. It was found that the podophyllotoxin content in root of the
1032 Afr. J. Biotechnol.
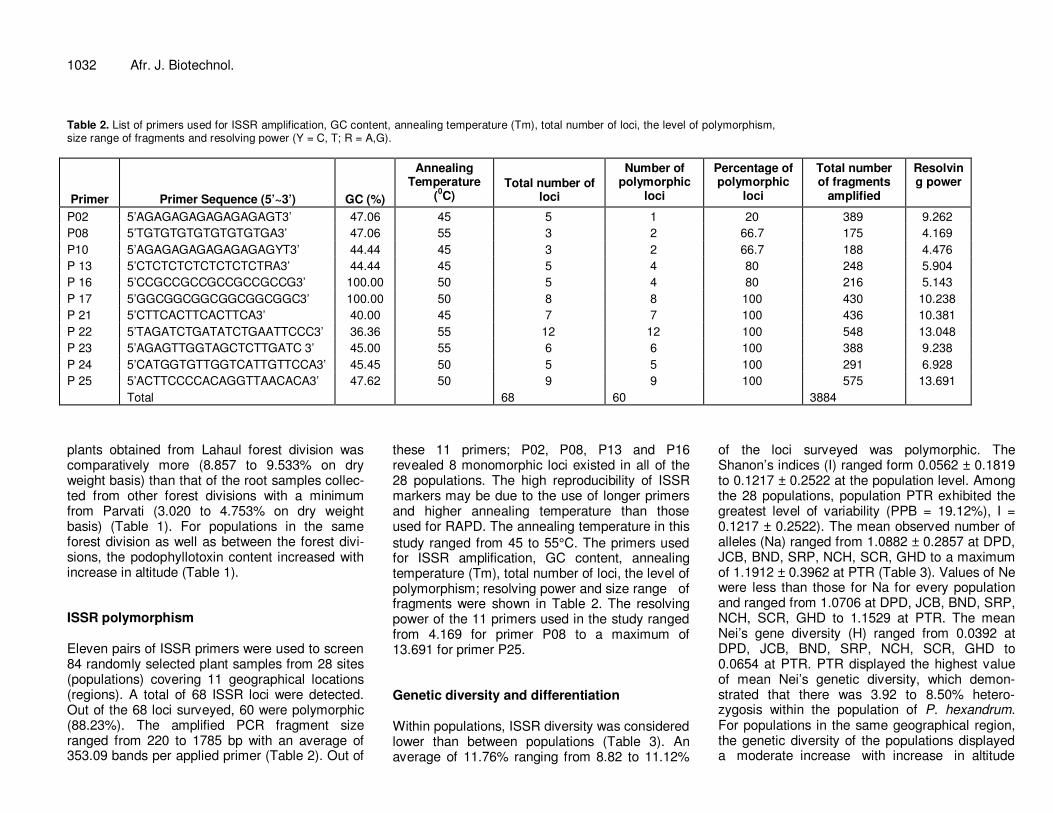
Table 2. List of primers used for ISSR amplification, GC content, annealing temperature (Tm), total number of loci, the level of polymorphism, size range of fragments and resolving power (Y = C, T; R = A,G).
Primer
Primer Sequence (5’~3’)
GC (%)
Annealing Temperature
(0C)
Total number of loci
Number of polymorphic
loci
Percentage of polymorphic
loci
Total number of fragments
amplified
Resolving power
P02 5’AGAGAGAGAGAGAGAGT3’ 47.06 45 5 1 20 389 9.262
P08 5’TGTGTGTGTGTGTGTGA3’ 47.06 55 3 2 66.7 175 4.169
P10 5’AGAGAGAGAGAGAGAGYT3’ 44.44 45 3 2 66.7 188 4.476
P 13 5’CTCTCTCTCTCTCTCTRA3’ 44.44 45 5 4 80 248 5.904
P 16 5’CCGCCGCCGCCGCCGCCG3’ 100.00 50 5 4 80 216 5.143
P 17 5’GGCGGCGGCGGCGGCGGC3’ 100.00 50 8 8 100 430 10.238
P 21 5’CTTCACTTCACTTCA3’ 40.00 45 7 7 100 436 10.381
P 22 5’TAGATCTGATATCTGAATTCCC3’ 36.36 55 12 12 100 548 13.048
P 23 5’AGAGTTGGTAGCTCTTGATC 3’ 45.00 55 6 6 100 388 9.238
P 24 5’CATGGTGTTGGTCATTGTTCCA3’ 45.45 50 5 5 100 291 6.928
P 25 5’ACTTCCCCACAGGTTAACACA3’ 47.62 50 9 9 100 575 13.691
Total 68 60 3884
plants obtained from Lahaul forest division was comparatively more (8.857 to 9.533% on dry weight basis) than that of the root samples collec-ted from other forest divisions with a minimum from Parvati (3.020 to 4.753% on dry weight basis) (Table 1). For populations in the same forest division as well as between the forest divi-sions, the podophyllotoxin content increased with increase in altitude (Table 1). ISSR polymorphism Eleven pairs of ISSR primers were used to screen 84 randomly selected plant samples from 28 sites (populations) covering 11 geographical locations (regions). A total of 68 ISSR loci were detected. Out of the 68 loci surveyed, 60 were polymorphic (88.23%). The amplified PCR fragment size ranged from 220 to 1785 bp with an average of 353.09 bands per applied primer (Table 2). Out of
these 11 primers; P02, P08, P13 and P16 revealed 8 monomorphic loci existed in all of the 28 populations. The high reproducibility of ISSR markers may be due to the use of longer primers and higher annealing temperature than those used for RAPD. The annealing temperature in this
study ranged from 45 to 55°C. The primers used for ISSR amplification, GC content, annealing temperature (Tm), total number of loci, the level of polymorphism; resolving power and size range of fragments were shown in Table 2. The resolving power of the 11 primers used in the study ranged from 4.169 for primer P08 to a maximum of 13.691 for primer P25. Genetic diversity and differentiation Within populations, ISSR diversity was considered lower than between populations (Table 3). An average of 11.76% ranging from 8.82 to 11.12%
of the loci surveyed was polymorphic. The Shanon’s indices (I) ranged form 0.0562 ± 0.1819 to 0.1217 ± 0.2522 at the population level. Among the 28 populations, population PTR exhibited the greatest level of variability (PPB = 19.12%), I = 0.1217 ± 0.2522). The mean observed number of alleles (Na) ranged from 1.0882 ± 0.2857 at DPD, JCB, BND, SRP, NCH, SCR, GHD to a maximum of 1.1912 ± 0.3962 at PTR (Table 3). Values of Ne were less than those for Na for every population and ranged from 1.0706 at DPD, JCB, BND, SRP, NCH, SCR, GHD to 1.1529 at PTR. The mean Nei’s gene diversity (H) ranged from 0.0392 at DPD, JCB, BND, SRP, NCH, SCR, GHD to 0.0654 at PTR. PTR displayed the highest value of mean Nei’s genetic diversity, which demon-strated that there was 3.92 to 8.50% hetero-zygosis within the population of P. hexandrum. For populations in the same geographical region, the genetic diversity of the populations displayed a moderate increase with increase in altitude
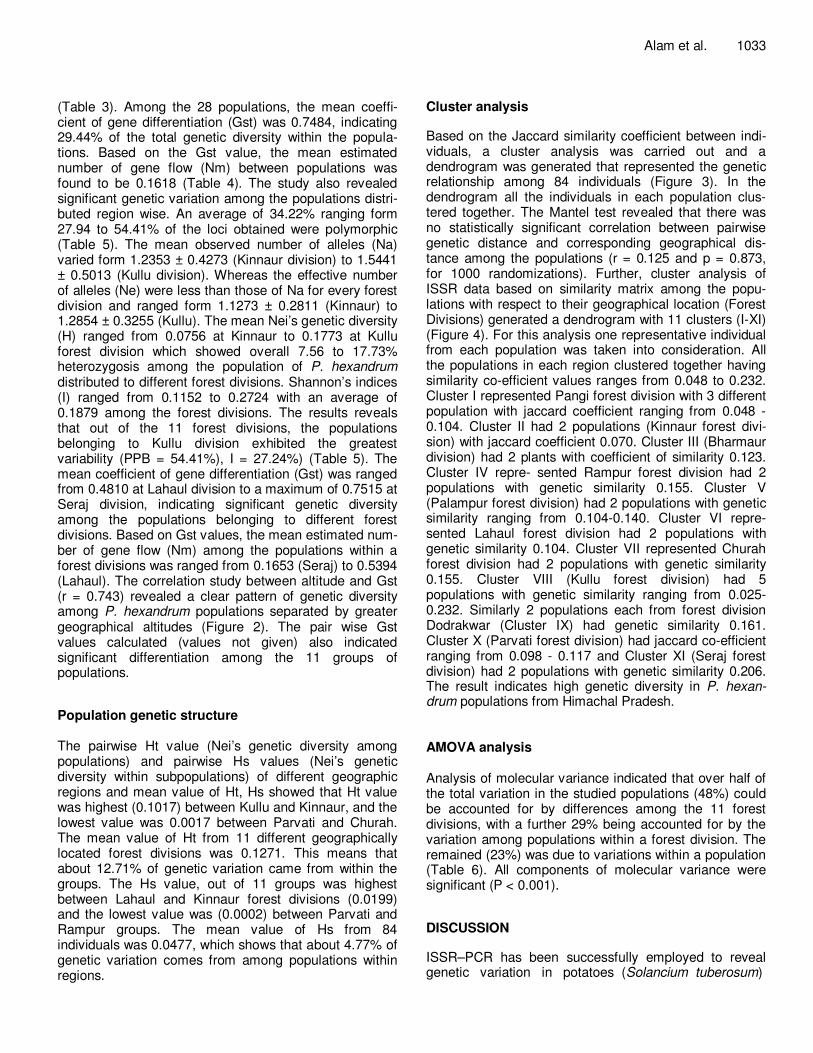
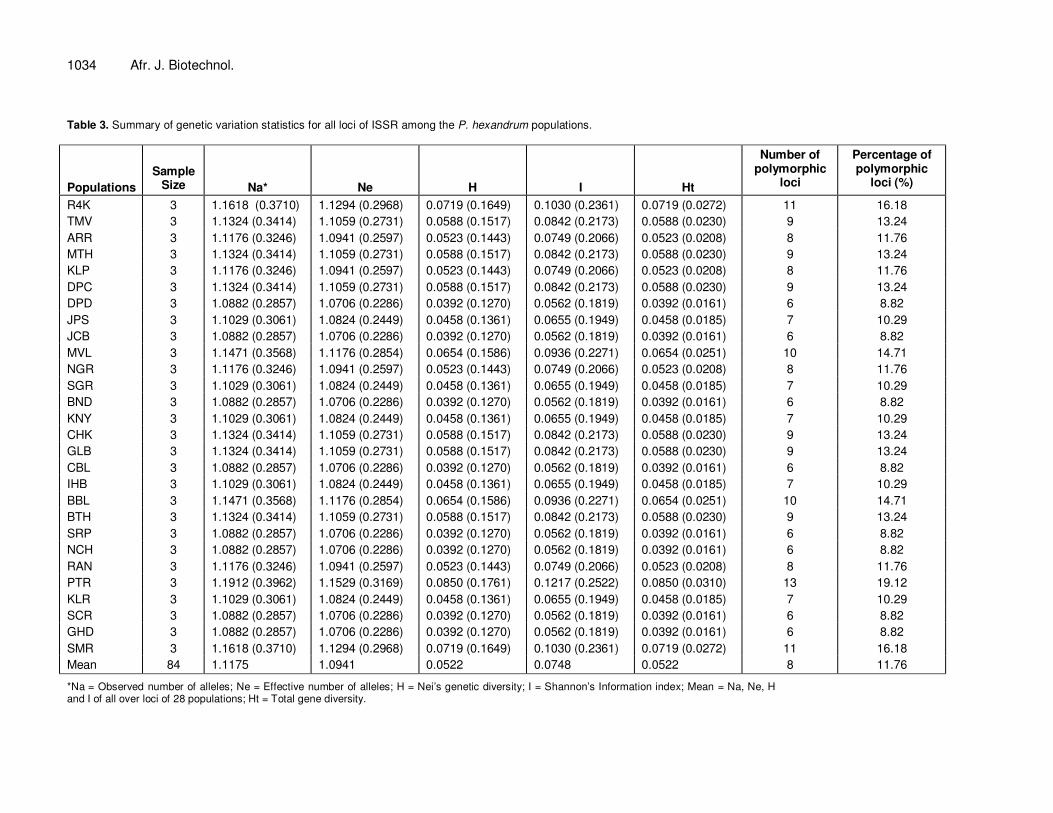
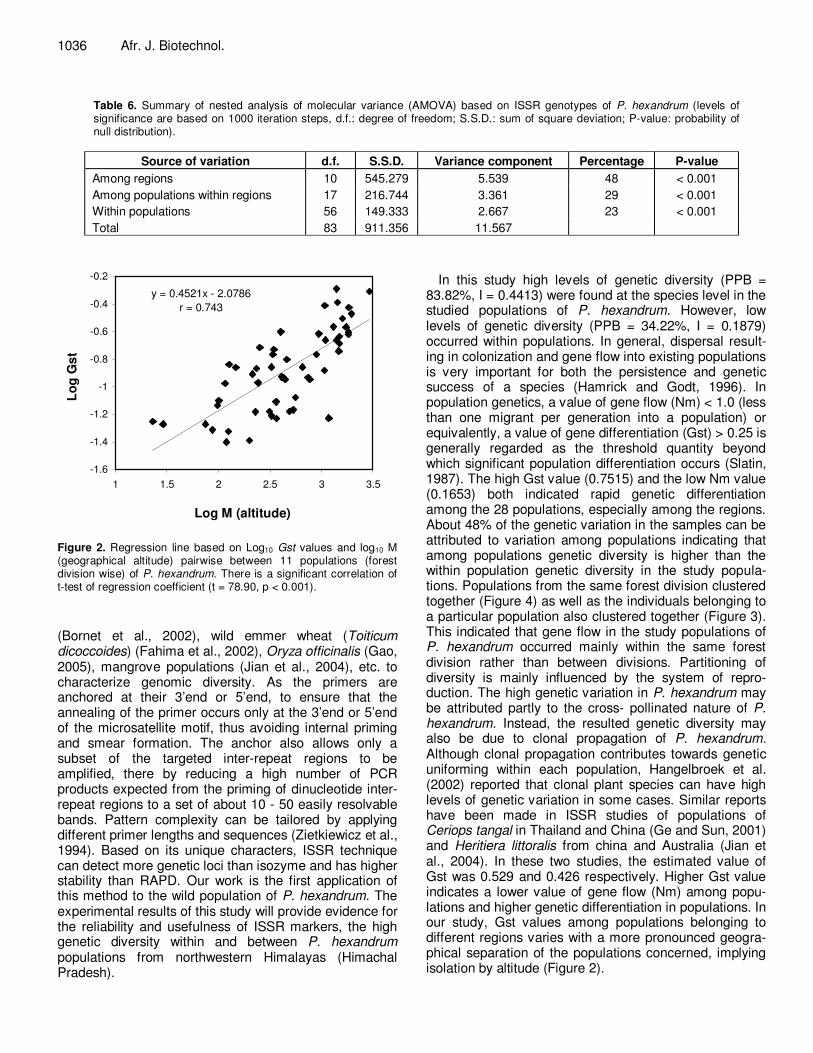
(Table 3). Among the 28 populations, the mean coeffi-cient of gene differentiation (Gst) was 0.7484, indicating 29.44% of the total genetic diversity within the popula-tions. Based on the Gst value, the mean estimated number of gene flow (Nm) between populations was found to be 0.1618 (Table 4). The study also revealed significant genetic variation among the populations distri-buted region wise. An average of 34.22% ranging form 27.94 to 54.41% of the loci obtained were polymorphic (Table 5). The mean observed number of alleles (Na) varied form 1.2353 ± 0.4273 (Kinnaur division) to 1.5441 ± 0.5013 (Kullu division). Whereas the effective number of alleles (Ne) were less than those of Na for every forest division and ranged form 1.1273 ± 0.2811 (Kinnaur) to 1.2854 ± 0.3255 (Kullu). The mean Nei’s genetic diversity (H) ranged from 0.0756 at Kinnaur to 0.1773 at Kullu forest division which showed overall 7.56 to 17.73% heterozygosis among the population of P. hexandrum distributed to different forest divisions. Shannon’s indices (I) ranged from 0.1152 to 0.2724 with an average of 0.1879 among the forest divisions. The results reveals that out of the 11 forest divisions, the populations belonging to Kullu division exhibited the greatest variability (PPB = 54.41%), I = 27.24%) (Table 5). The mean coefficient of gene differentiation (Gst) was ranged from 0.4810 at Lahaul division to a maximum of 0.7515 at Seraj division, indicating significant genetic diversity among the populations belonging to different forest divisions. Based on Gst values, the mean estimated num-ber of gene flow (Nm) among the populations within a forest divisions was ranged from 0.1653 (Seraj) to 0.5394 (Lahaul). The correlation study between altitude and Gst (r = 0.743) revealed a clear pattern of genetic diversity among P. hexandrum populations separated by greater geographical altitudes (Figure 2). The pair wise Gst values calculated (values not given) also indicated significant differentiation among the 11 groups of populations.
Population genetic structure The pairwise Ht value (Nei’s genetic diversity among populations) and pairwise Hs values (Nei’s genetic diversity within subpopulations) of different geographic regions and mean value of Ht, Hs showed that Ht value was highest (0.1017) between Kullu and Kinnaur, and the lowest value was 0.0017 between Parvati and Churah. The mean value of Ht from 11 different geographically located forest divisions was 0.1271. This means that about 12.71% of genetic variation came from within the groups. The Hs value, out of 11 groups was highest between Lahaul and Kinnaur forest divisions (0.0199) and the lowest value was (0.0002) between Parvati and Rampur groups. The mean value of Hs from 84 individuals was 0.0477, which shows that about 4.77% of genetic variation comes from among populations within regions.
Alam et al. 1033 Cluster analysis
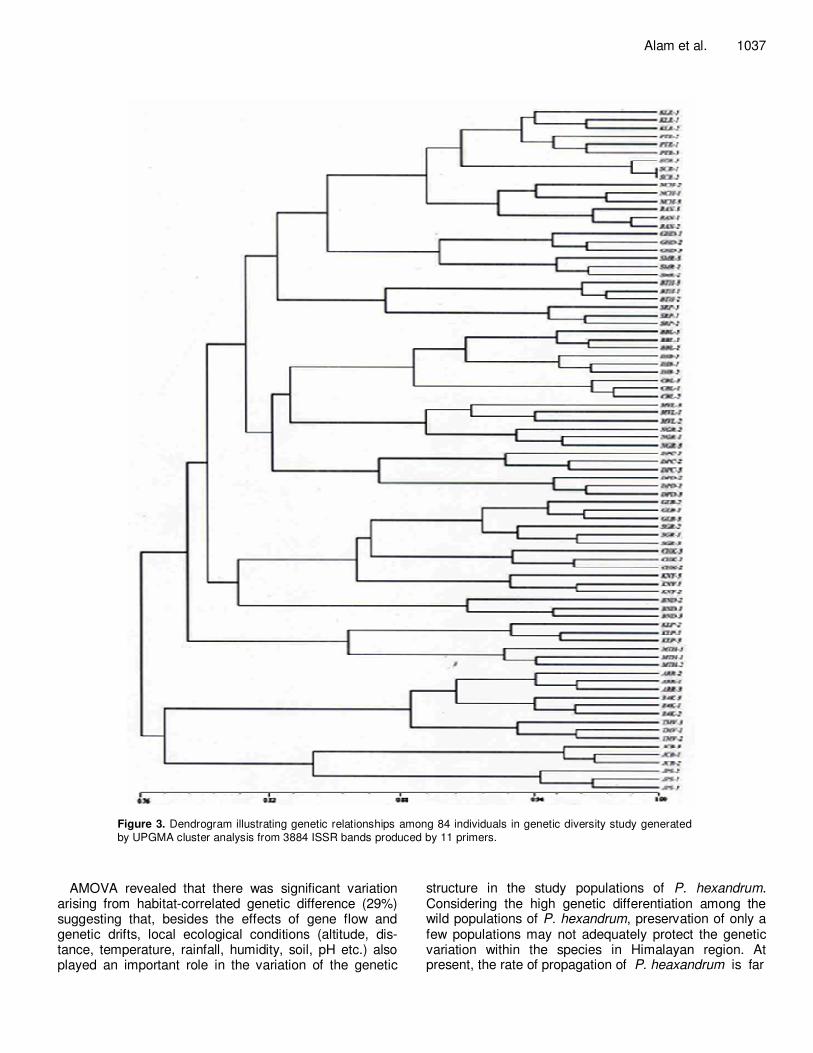
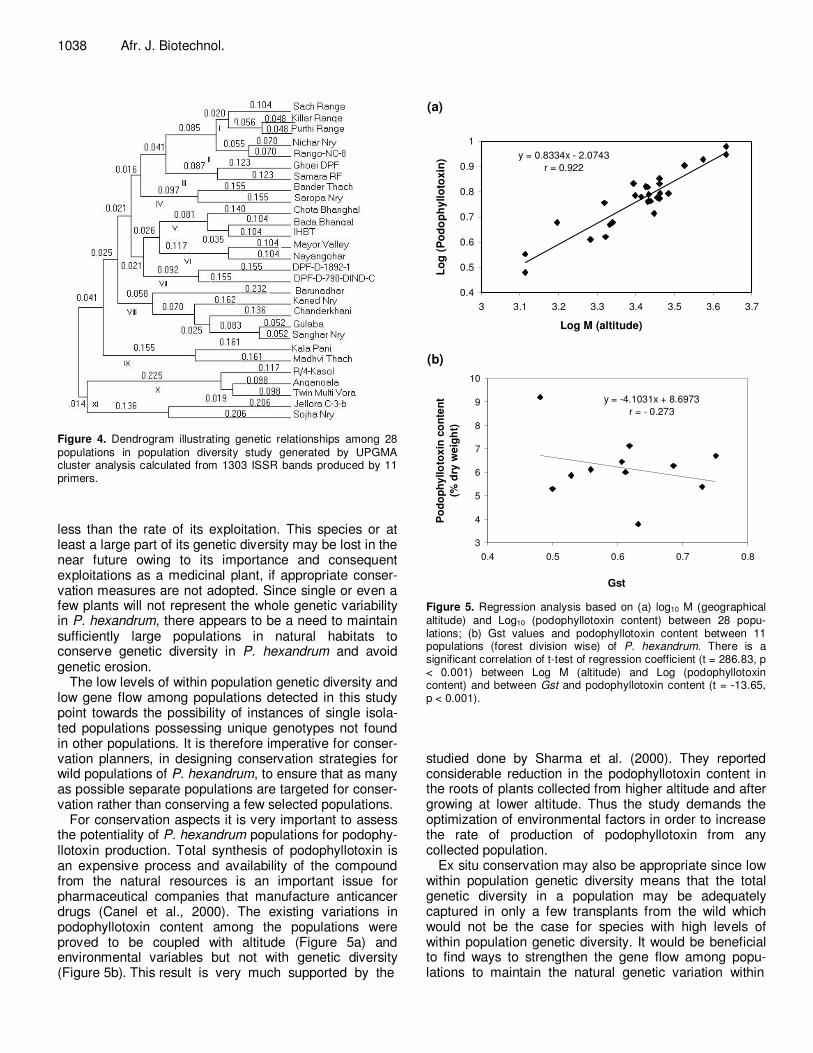
Based on the Jaccard similarity coefficient between indi-viduals, a cluster analysis was carried out and a dendrogram was generated that represented the genetic relationship among 84 individuals (Figure 3). In the dendrogram all the individuals in each population clus-tered together. The Mantel test revealed that there was no statistically significant correlation between pairwise genetic distance and corresponding geographical dis-tance among the populations (r = 0.125 and p = 0.873, for 1000 randomizations). Further, cluster analysis of ISSR data based on similarity matrix among the popu-lations with respect to their geographical location (Forest Divisions) generated a dendrogram with 11 clusters (I-XI) (Figure 4). For this analysis one representative individual from each population was taken into consideration. All the populations in each region clustered together having similarity co-efficient values ranges from 0.048 to 0.232. Cluster I represented Pangi forest division with 3 different population with jaccard coefficient ranging from 0.048 - 0.104. Cluster II had 2 populations (Kinnaur forest divi-sion) with jaccard coefficient 0.070. Cluster III (Bharmaur division) had 2 plants with coefficient of similarity 0.123. Cluster IV repre- sented Rampur forest division had 2 populations with genetic similarity 0.155. Cluster V (Palampur forest division) had 2 populations with genetic similarity ranging from 0.104-0.140. Cluster VI repre-sented Lahaul forest division had 2 populations with genetic similarity 0.104. Cluster VII represented Churah forest division had 2 populations with genetic similarity 0.155. Cluster VIII (Kullu forest division) had 5 populations with genetic similarity ranging from 0.025-0.232. Similarly 2 populations each from forest division Dodrakwar (Cluster IX) had genetic similarity 0.161. Cluster X (Parvati forest division) had jaccard co-efficient ranging from 0.098 - 0.117 and Cluster XI (Seraj forest division) had 2 populations with genetic similarity 0.206. The result indicates high genetic diversity in P. hexan-drum populations from Himachal Pradesh. AMOVA analysis Analysis of molecular variance indicated that over half of the total variation in the studied populations (48%) could be accounted for by differences among the 11 forest divisions, with a further 29% being accounted for by the variation among populations within a forest division. The remained (23%) was due to variations within a population (Table 6). All components of molecular variance were significant (P < 0.001).
DISCUSSION
ISSR–PCR has been successfully employed to reveal genetic variation in potatoes (Solancium tuberosum)
1034 Afr. J. Biotechnol. Table 3. Summary of genetic variation statistics for all loci of ISSR among the P. hexandrum populations.
Populations
Sample Size
Na*
Ne
H
I
Ht
Number of polymorphic
loci
Percentage of polymorphic
loci (%)
R4K 3 1.1618 (0.3710) 1.1294 (0.2968) 0.0719 (0.1649) 0.1030 (0.2361) 0.0719 (0.0272) 11 16.18
TMV 3 1.1324 (0.3414) 1.1059 (0.2731) 0.0588 (0.1517) 0.0842 (0.2173) 0.0588 (0.0230) 9 13.24
ARR 3 1.1176 (0.3246) 1.0941 (0.2597) 0.0523 (0.1443) 0.0749 (0.2066) 0.0523 (0.0208) 8 11.76
MTH 3 1.1324 (0.3414) 1.1059 (0.2731) 0.0588 (0.1517) 0.0842 (0.2173) 0.0588 (0.0230) 9 13.24
KLP 3 1.1176 (0.3246) 1.0941 (0.2597) 0.0523 (0.1443) 0.0749 (0.2066) 0.0523 (0.0208) 8 11.76
DPC 3 1.1324 (0.3414) 1.1059 (0.2731) 0.0588 (0.1517) 0.0842 (0.2173) 0.0588 (0.0230) 9 13.24
DPD 3 1.0882 (0.2857) 1.0706 (0.2286) 0.0392 (0.1270) 0.0562 (0.1819) 0.0392 (0.0161) 6 8.82
JPS 3 1.1029 (0.3061) 1.0824 (0.2449) 0.0458 (0.1361) 0.0655 (0.1949) 0.0458 (0.0185) 7 10.29
JCB 3 1.0882 (0.2857) 1.0706 (0.2286) 0.0392 (0.1270) 0.0562 (0.1819) 0.0392 (0.0161) 6 8.82
MVL 3 1.1471 (0.3568) 1.1176 (0.2854) 0.0654 (0.1586) 0.0936 (0.2271) 0.0654 (0.0251) 10 14.71
NGR 3 1.1176 (0.3246) 1.0941 (0.2597) 0.0523 (0.1443) 0.0749 (0.2066) 0.0523 (0.0208) 8 11.76
SGR 3 1.1029 (0.3061) 1.0824 (0.2449) 0.0458 (0.1361) 0.0655 (0.1949) 0.0458 (0.0185) 7 10.29
BND 3 1.0882 (0.2857) 1.0706 (0.2286) 0.0392 (0.1270) 0.0562 (0.1819) 0.0392 (0.0161) 6 8.82
KNY 3 1.1029 (0.3061) 1.0824 (0.2449) 0.0458 (0.1361) 0.0655 (0.1949) 0.0458 (0.0185) 7 10.29
CHK 3 1.1324 (0.3414) 1.1059 (0.2731) 0.0588 (0.1517) 0.0842 (0.2173) 0.0588 (0.0230) 9 13.24
GLB 3 1.1324 (0.3414) 1.1059 (0.2731) 0.0588 (0.1517) 0.0842 (0.2173) 0.0588 (0.0230) 9 13.24
CBL 3 1.0882 (0.2857) 1.0706 (0.2286) 0.0392 (0.1270) 0.0562 (0.1819) 0.0392 (0.0161) 6 8.82
IHB 3 1.1029 (0.3061) 1.0824 (0.2449) 0.0458 (0.1361) 0.0655 (0.1949) 0.0458 (0.0185) 7 10.29
BBL 3 1.1471 (0.3568) 1.1176 (0.2854) 0.0654 (0.1586) 0.0936 (0.2271) 0.0654 (0.0251) 10 14.71
BTH 3 1.1324 (0.3414) 1.1059 (0.2731) 0.0588 (0.1517) 0.0842 (0.2173) 0.0588 (0.0230) 9 13.24
SRP 3 1.0882 (0.2857) 1.0706 (0.2286) 0.0392 (0.1270) 0.0562 (0.1819) 0.0392 (0.0161) 6 8.82
NCH 3 1.0882 (0.2857) 1.0706 (0.2286) 0.0392 (0.1270) 0.0562 (0.1819) 0.0392 (0.0161) 6 8.82
RAN 3 1.1176 (0.3246) 1.0941 (0.2597) 0.0523 (0.1443) 0.0749 (0.2066) 0.0523 (0.0208) 8 11.76
PTR 3 1.1912 (0.3962) 1.1529 (0.3169) 0.0850 (0.1761) 0.1217 (0.2522) 0.0850 (0.0310) 13 19.12
KLR 3 1.1029 (0.3061) 1.0824 (0.2449) 0.0458 (0.1361) 0.0655 (0.1949) 0.0458 (0.0185) 7 10.29
SCR 3 1.0882 (0.2857) 1.0706 (0.2286) 0.0392 (0.1270) 0.0562 (0.1819) 0.0392 (0.0161) 6 8.82
GHD 3 1.0882 (0.2857) 1.0706 (0.2286) 0.0392 (0.1270) 0.0562 (0.1819) 0.0392 (0.0161) 6 8.82
SMR 3 1.1618 (0.3710) 1.1294 (0.2968) 0.0719 (0.1649) 0.1030 (0.2361) 0.0719 (0.0272) 11 16.18
Mean 84 1.1175 1.0941 0.0522 0.0748 0.0522 8 11.76
*Na = Observed number of alleles; Ne = Effective number of alleles; H = Nei’s genetic diversity; I = Shannon’s Information index; Mean = Na, Ne, H and I of all over loci of 28 populations; Ht = Total gene diversity.
Alam et al. 1035 Table 4. Overall genetic variability across all the populations of P. hexandrum.
Sample size
Observed number of
alleles
Effective number of
alleles
Nei’s gene
diversity
Shannon’s information
index
Ht
Hs
Gst
Estimate of gene
flow
Number of polymorphic
loci
Percentage of polymorphic
loci (%)
28 1.8382
(0.3710)
1.4972
(0.3368)
0.2944
(0.1731)
0.4413
(0.2391)
0.2944
(0.0300)
0.0741
(0.0064)
0.7484
0.1618 57 83.82
Table 5. Summary of genetic variation statistics for all loci of ISSR among the P. hexandrum populations with respect to their distributions among eleven forest divisions.
Forest divisions
Sample size
Na
Ne
H
I
Ht
Hs
Gst
Nm
Number of polymorphic
loci
Percentage of ploymorphic loci
(%)
Parvati 9 1.3971
(0.4929)
1.2248
(0.3371)
0.1318
(0.1877)
0.1989
(0.2706)
0.1318
(0.0352)
0.0485
(0.0065)
0.6319 0.2912 27 39.71
Dodrakwar
6 1.3382
(0.4766)
1.2602
(0.3909)
0.1431
(0.2086)
0.2062
(0.2971)
0.1431
(0.0435)
0.0555
(0.0115)
0.6123 0.3166 23 33.82
Churah 6 1.2941
(0.4590)
1.2420
(0.3949)
0.1301
(0.2076)
0.1857
(0.2939)
0.1301
(0.0431)
0.0497
(0.0138)
0.6182 0.3089 20 29.41
Seraj 6 1.3529
(0.4814)
1.2935
(0.4335)
0.1543
(0.2209)
0.2197
(0.3096)
0.1543
(0.0488)
0.0383
(0.0110)
0.7515 0.1653 24 35.29
Lahaul 6 1.2647
(0.4445)
1.1997
(0.3538)
0.1111
(0.1915)
0.1607
(0.2743)
0.1111
(0.0367)
0.0577
(0.0152)
0.4810 0.5394 18 26.47
Kullu 15 1.5441
(0.5018)
1.2854
(0.3255)
0.1773
(0.1822)
0.2724
(0.2677)
0.1773
(0.0332)
0.0479
(0.0075)
0.7299 0.1850 37 54.41
Palampur 9 1.3676
(0.4857)
1.2299
(0.3469)
0.1339
(0.1920)
0.1992
(0.2778)
0.1339
(0.0369)
0.0421
(0.0063)
0.6857 0.2292 25 36.76
Rampur 6 1.3088
(0.4654)
1.2177
(0.3591)
0.1227
(0.1944)
0.1793
(0.2791)
0.1227
(0.0378)
0.0483
(0.0087)
0.6066 0.3243 21 30.88
Kinnaur 6 1.2353
(0.4273)
1.1273
(0.2811)
0.0756
(0.1538)
0.1152
(0.2246)
0.0756
(0.0237)
0.0378
(0.0071)
0.5001 0.4999 16 23.53
Pangi 9 1.3824
(0.4896)
1.1970
(0.3221)
0.1180
(0.1774)
0.1806
(0.2574)
0.1180
(0.0315)
0.0520
(0.0083)
0.5589 0.3947 26 38.24
Bharmaur 6 1.2794
(0.4520)
1.1740
(0.3289)
0.1000
(0.1765)
0.1492
(0.2548)
0.1000
(0.0312)
0.0472
(0.0104)
0.5286 0.4458 19 27.94
Mean 1.3422 1.2228 0.1271 0.1879 0.1271 0.0477 0.6095 0.3363 23.27 34.22
Na = Observed number of alleles; Ne = Effective number of alleles; H = Nei’s gene diversity; I = Shannon’s Information index; Mean = Na, Ne, H and I of all over loci of 28 populations; Ht = Total gene diversity; Hs = Population diversity; Gst = Gene differentiation; Nm = Number of gene flow.
1036 Afr. J. Biotechnol.
Table 6. Summary of nested analysis of molecular variance (AMOVA) based on ISSR genotypes of P. hexandrum (levels of significance are based on 1000 iteration steps, d.f.: degree of freedom; S.S.D.: sum of square deviation; P-value: probability of null distribution).
Source of variation d.f. S.S.D. Variance component Percentage P-value
Among regions 10 545.279 5.539 48 < 0.001
Among populations within regions 17 216.744 3.361 29 < 0.001
Within populations 56 149.333 2.667 23 < 0.001
Total 83 911.356 11.567
y = 0.4521x - 2.0786
r = 0.743
-1.6
-1.4
-1.2
-1
-0.8
-0.6
-0.4
-0.2
1 1.5 2 2.5 3 3.5
Log M (altitude)
Lo
g G
st
Figure 2. Regression line based on Log10 Gst values and log10 M (geographical altitude) pairwise between 11 populations (forest division wise) of P. hexandrum. There is a significant correlation of t-test of regression coefficient (t = 78.90, p < 0.001).
(Bornet et al., 2002), wild emmer wheat (Toiticum dicoccoides) (Fahima et al., 2002), Oryza officinalis (Gao, 2005), mangrove populations (Jian et al., 2004), etc. to characterize genomic diversity. As the primers are anchored at their 3’end or 5’end, to ensure that the annealing of the primer occurs only at the 3’end or 5’end of the microsatellite motif, thus avoiding internal priming and smear formation. The anchor also allows only a subset of the targeted inter-repeat regions to be amplified, there by reducing a high number of PCR products expected from the priming of dinucleotide inter-repeat regions to a set of about 10 - 50 easily resolvable bands. Pattern complexity can be tailored by applying different primer lengths and sequences (Zietkiewicz et al., 1994). Based on its unique characters, ISSR technique can detect more genetic loci than isozyme and has higher stability than RAPD. Our work is the first application of this method to the wild population of P. hexandrum. The experimental results of this study will provide evidence for the reliability and usefulness of ISSR markers, the high genetic diversity within and between P. hexandrum populations from northwestern Himalayas (Himachal Pradesh).
In this study high levels of genetic diversity (PPB = 83.82%, I = 0.4413) were found at the species level in the studied populations of P. hexandrum. However, low levels of genetic diversity (PPB = 34.22%, I = 0.1879) occurred within populations. In general, dispersal result-ing in colonization and gene flow into existing populations is very important for both the persistence and genetic success of a species (Hamrick and Godt, 1996). In population genetics, a value of gene flow (Nm) < 1.0 (less than one migrant per generation into a population) or equivalently, a value of gene differentiation (Gst) > 0.25 is generally regarded as the threshold quantity beyond which significant population differentiation occurs (Slatin, 1987). The high Gst value (0.7515) and the low Nm value (0.1653) both indicated rapid genetic differentiation among the 28 populations, especially among the regions. About 48% of the genetic variation in the samples can be attributed to variation among populations indicating that among populations genetic diversity is higher than the within population genetic diversity in the study popula-tions. Populations from the same forest division clustered together (Figure 4) as well as the individuals belonging to a particular population also clustered together (Figure 3). This indicated that gene flow in the study populations of P. hexandrum occurred mainly within the same forest division rather than between divisions. Partitioning of diversity is mainly influenced by the system of repro-duction. The high genetic variation in P. hexandrum may be attributed partly to the cross- pollinated nature of P. hexandrum. Instead, the resulted genetic diversity may also be due to clonal propagation of P. hexandrum. Although clonal propagation contributes towards genetic uniforming within each population, Hangelbroek et al. (2002) reported that clonal plant species can have high levels of genetic variation in some cases. Similar reports have been made in ISSR studies of populations of Ceriops tangal in Thailand and China (Ge and Sun, 2001) and Heritiera littoralis from china and Australia (Jian et al., 2004). In these two studies, the estimated value of Gst was 0.529 and 0.426 respectively. Higher Gst value indicates a lower value of gene flow (Nm) among popu-lations and higher genetic differentiation in populations. In our study, Gst values among populations belonging to different regions varies with a more pronounced geogra-phical separation of the populations concerned, implying isolation by altitude (Figure 2).
Alam et al. 1037
Figure 3. Dendrogram illustrating genetic relationships among 84 individuals in genetic diversity study generated by UPGMA cluster analysis from 3884 ISSR bands produced by 11 primers.
AMOVA revealed that there was significant variation arising from habitat-correlated genetic difference (29%) suggesting that, besides the effects of gene flow and genetic drifts, local ecological conditions (altitude, dis-tance, temperature, rainfall, humidity, soil, pH etc.) also played an important role in the variation of the genetic
structure in the study populations of P. hexandrum. Considering the high genetic differentiation among the wild populations of P. hexandrum, preservation of only a few populations may not adequately protect the genetic variation within the species in Himalayan region. At present, the rate of propagation of P. heaxandrum is far
1038 Afr. J. Biotechnol.
Figure 4. Dendrogram illustrating genetic relationships among 28 populations in population diversity study generated by UPGMA cluster analysis calculated from 1303 ISSR bands produced by 11 primers.
less than the rate of its exploitation. This species or at least a large part of its genetic diversity may be lost in the near future owing to its importance and consequent exploitations as a medicinal plant, if appropriate conser-vation measures are not adopted. Since single or even a few plants will not represent the whole genetic variability in P. hexandrum, there appears to be a need to maintain sufficiently large populations in natural habitats to conserve genetic diversity in P. hexandrum and avoid genetic erosion.
The low levels of within population genetic diversity and low gene flow among populations detected in this study point towards the possibility of instances of single isola-ted populations possessing unique genotypes not found in other populations. It is therefore imperative for conser-vation planners, in designing conservation strategies for wild populations of P. hexandrum, to ensure that as many as possible separate populations are targeted for conser-vation rather than conserving a few selected populations.
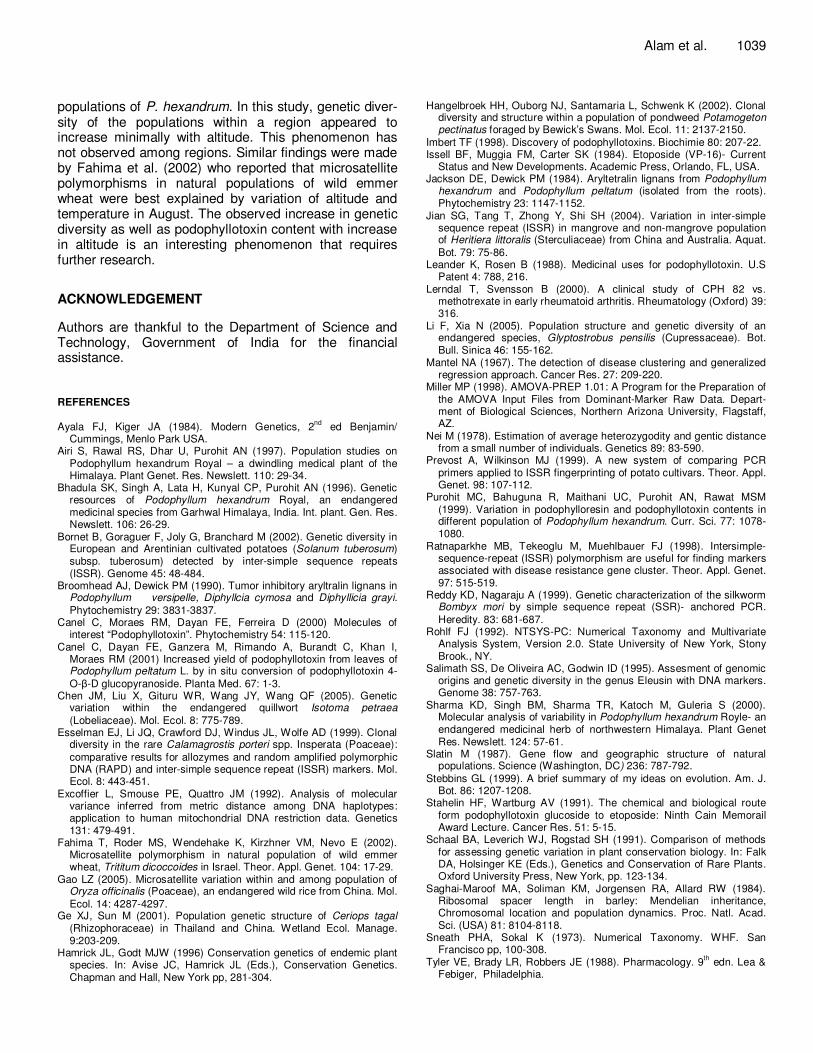
For conservation aspects it is very important to assess the potentiality of P. hexandrum populations for podophy-llotoxin production. Total synthesis of podophyllotoxin is an expensive process and availability of the compound from the natural resources is an important issue for pharmaceutical companies that manufacture anticancer drugs (Canel et al., 2000). The existing variations in podophyllotoxin content among the populations were proved to be coupled with altitude (Figure 5a) and environmental variables but not with genetic diversity (Figure 5b). This result is very much supported by the
(a)
y = 0.8334x - 2.0743
r = 0.922
0.4
0.5
0.6
0.7
0.8
0.9
1
3 3.1 3.2 3.3 3.4 3.5 3.6 3.7
Log M (altitude)
Lo
g (
Po
do
ph
yllo
toxin
)
(b)
y = -4.1031x + 8.6973
r = - 0.273
3
4
5
6
7
8
9
10
0.4 0.5 0.6 0.7 0.8
Gst
Po
do
ph
yllo
tox
in c
on
ten
t
(% d
ry w
eig
ht)
Figure 5. Regression analysis based on (a) log10 M (geographical altitude) and Log10 (podophyllotoxin content) between 28 popu-lations; (b) Gst values and podophyllotoxin content between 11 populations (forest division wise) of P. hexandrum. There is a significant correlation of t-test of regression coefficient (t = 286.83, p < 0.001) between Log M (altitude) and Log (podophyllotoxin content) and between Gst and podophyllotoxin content (t = -13.65, p < 0.001).
studied done by Sharma et al. (2000). They reported considerable reduction in the podophyllotoxin content in the roots of plants collected from higher altitude and after growing at lower altitude. Thus the study demands the optimization of environmental factors in order to increase the rate of production of podophyllotoxin from any collected population.
Ex situ conservation may also be appropriate since low within population genetic diversity means that the total genetic diversity in a population may be adequately captured in only a few transplants from the wild which would not be the case for species with high levels of within population genetic diversity. It would be beneficial to find ways to strengthen the gene flow among popu-lations to maintain the natural genetic variation within
populations of P. hexandrum. In this study, genetic diver-sity of the populations within a region appeared to increase minimally with altitude. This phenomenon has not observed among regions. Similar findings were made by Fahima et al. (2002) who reported that microsatellite polymorphisms in natural populations of wild emmer wheat were best explained by variation of altitude and temperature in August. The observed increase in genetic diversity as well as podophyllotoxin content with increase in altitude is an interesting phenomenon that requires further research.
ACKNOWLEDGEMENT
Authors are thankful to the Department of Science and Technology, Government of India for the financial assistance. REFERENCES
Ayala FJ, Kiger JA (1984). Modern Genetics, 2nd
ed Benjamin/ Cummings, Menlo Park USA.
Airi S, Rawal RS, Dhar U, Purohit AN (1997). Population studies on Podophyllum hexandrum Royal – a dwindling medical plant of the Himalaya. Plant Genet. Res. Newslett. 110: 29-34.
Bhadula SK, Singh A, Lata H, Kunyal CP, Purohit AN (1996). Genetic resources of Podophyllum hexandrum Royal, an endangered medicinal species from Garhwal Himalaya, India. Int. plant. Gen. Res. Newslett. 106: 26-29.
Bornet B, Goraguer F, Joly G, Branchard M (2002). Genetic diversity in European and Arentinian cultivated potatoes (Solanum tuberosum) subsp. tuberosum) detected by inter-simple sequence repeats (ISSR). Genome 45: 48-484.
Broomhead AJ, Dewick PM (1990). Tumor inhibitory aryltralin lignans in Podophyllum versipelle, Diphyllcia cymosa and Diphyllicia grayi.
Phytochemistry 29: 3831-3837. Canel C, Moraes RM, Dayan FE, Ferreira D (2000) Molecules of
interest “Podophyllotoxin”. Phytochemistry 54: 115-120. Canel C, Dayan FE, Ganzera M, Rimando A, Burandt C, Khan I,
Moraes RM (2001) Increased yield of podophyllotoxin from leaves of Podophyllum peltatum L. by in situ conversion of podophyllotoxin 4-
O-β-D glucopyranoside. Planta Med. 67: 1-3. Chen JM, Liu X, Gituru WR, Wang JY, Wang QF (2005). Genetic
variation within the endangered quillwort Isotoma petraea
(Lobeliaceae). Mol. Ecol. 8: 775-789. Esselman EJ, Li JQ, Crawford DJ, Windus JL, Wolfe AD (1999). Clonal
diversity in the rare Calamagrostis porteri spp. Insperata (Poaceae):
comparative results for allozymes and random amplified polymorphic DNA (RAPD) and inter-simple sequence repeat (ISSR) markers. Mol. Ecol. 8: 443-451.
Excoffier L, Smouse PE, Quattro JM (1992). Analysis of molecular variance inferred from metric distance among DNA haplotypes: application to human mitochondrial DNA restriction data. Genetics 131: 479-491.
Fahima T, Roder MS, Wendehake K, Kirzhner VM, Nevo E (2002). Microsatellite polymorphism in natural population of wild emmer wheat, Trititum dicoccoides in Israel. Theor. Appl. Genet. 104: 17-29.
Gao LZ (2005). Microsatellite variation within and among population of Oryza officinalis (Poaceae), an endangered wild rice from China. Mol.
Ecol. 14: 4287-4297. Ge XJ, Sun M (2001). Population genetic structure of Ceriops tagal
(Rhizophoraceae) in Thailand and China. Wetland Ecol. Manage. 9:203-209.
Hamrick JL, Godt MJW (1996) Conservation genetics of endemic plant species. In: Avise JC, Hamrick JL (Eds.), Conservation Genetics. Chapman and Hall, New York pp, 281-304.
Alam et al. 1039 Hangelbroek HH, Ouborg NJ, Santamaria L, Schwenk K (2002). Clonal
diversity and structure within a population of pondweed Potamogeton pectinatus foraged by Bewick’s Swans. Mol. Ecol. 11: 2137-2150.
Imbert TF (1998). Discovery of podophyllotoxins. Biochimie 80: 207-22. Issell BF, Muggia FM, Carter SK (1984). Etoposide (VP-16)- Current
Status and New Developments. Academic Press, Orlando, FL, USA. Jackson DE, Dewick PM (1984). Aryltetralin lignans from Podophyllum
hexandrum and Podophyllum peltatum (isolated from the roots). Phytochemistry 23: 1147-1152.
Jian SG, Tang T, Zhong Y, Shi SH (2004). Variation in inter-simple sequence repeat (ISSR) in mangrove and non-mangrove population of Heritiera littoralis (Sterculiaceae) from China and Australia. Aquat.
Bot. 79: 75-86. Leander K, Rosen B (1988). Medicinal uses for podophyllotoxin. U.S
Patent 4: 788, 216. Lerndal T, Svensson B (2000). A clinical study of CPH 82 vs.
methotrexate in early rheumatoid arthritis. Rheumatology (Oxford) 39: 316.
Li F, Xia N (2005). Population structure and genetic diversity of an endangered species, Glyptostrobus pensilis (Cupressaceae). Bot. Bull. Sinica 46: 155-162.
Mantel NA (1967). The detection of disease clustering and generalized regression approach. Cancer Res. 27: 209-220.
Miller MP (1998). AMOVA-PREP 1.01: A Program for the Preparation of the AMOVA Input Files from Dominant-Marker Raw Data. Depart-ment of Biological Sciences, Northern Arizona University, Flagstaff, AZ.
Nei M (1978). Estimation of average heterozygodity and gentic distance from a small number of individuals. Genetics 89: 83-590.
Prevost A, Wilkinson MJ (1999). A new system of comparing PCR primers applied to ISSR fingerprinting of potato cultivars. Theor. Appl. Genet. 98: 107-112.
Purohit MC, Bahuguna R, Maithani UC, Purohit AN, Rawat MSM (1999). Variation in podophylloresin and podophyllotoxin contents in different population of Podophyllum hexandrum. Curr. Sci. 77: 1078-1080.
Ratnaparkhe MB, Tekeoglu M, Muehlbauer FJ (1998). Intersimple-sequence-repeat (ISSR) polymorphism are useful for finding markers associated with disease resistance gene cluster. Theor. Appl. Genet. 97: 515-519.
Reddy KD, Nagaraju A (1999). Genetic characterization of the silkworm Bombyx mori by simple sequence repeat (SSR)- anchored PCR.
Heredity. 83: 681-687. Rohlf FJ (1992). NTSYS-PC: Numerical Taxonomy and Multivariate
Analysis System, Version 2.0. State University of New York, Stony Brook., NY.
Salimath SS, De Oliveira AC, Godwin ID (1995). Assesment of genomic origins and genetic diversity in the genus Eleusin with DNA markers. Genome 38: 757-763.
Sharma KD, Singh BM, Sharma TR, Katoch M, Guleria S (2000). Molecular analysis of variability in Podophyllum hexandrum Royle- an endangered medicinal herb of northwestern Himalaya. Plant Genet Res. Newslett. 124: 57-61.
Slatin M (1987). Gene flow and geographic structure of natural populations. Science (Washington, DC) 236: 787-792.
Stebbins GL (1999). A brief summary of my ideas on evolution. Am. J. Bot. 86: 1207-1208.
Stahelin HF, Wartburg AV (1991). The chemical and biological route form podophyllotoxin glucoside to etoposide: Ninth Cain Memorail Award Lecture. Cancer Res. 51: 5-15.
Schaal BA, Leverich WJ, Rogstad SH (1991). Comparison of methods for assessing genetic variation in plant conservation biology. In: Falk DA, Holsinger KE (Eds.), Genetics and Conservation of Rare Plants. Oxford University Press, New York, pp. 123-134.
Saghai-Maroof MA, Soliman KM, Jorgensen RA, Allard RW (1984). Ribosomal spacer length in barley: Mendelian inheritance, Chromosomal location and population dynamics. Proc. Natl. Acad. Sci. (USA) 81: 8104-8118.
Sneath PHA, Sokal K (1973). Numerical Taxonomy. WHF. San Francisco pp, 100-308.
Tyler VE, Brady LR, Robbers JE (1988). Pharmacology. 9th edn. Lea &
Febiger, Philadelphia.

1040 Afr. J. Biotechnol. Wolfe AD, Xiang QY, Kephart SR (1998). Assessing hybridization in
natural populations of Penstemon (Scrophulariaceae) using hypervariable intersimple sequence repeat (ISSR) bands. Mole. Ecol. 7: 1107-1126.
Zietkiewicz E, Rafalski A, Labuda D (1994). Genome fingerprinting by simple sequence repeat (SSR)- anchored polymerase chain reaction amplification. Genomics 20: 176-183.