characterization of ground motion hazard peer summative meeting - june 13, 2007 yousef bozorgnia...
Post on 21-Dec-2015
218 views
TRANSCRIPT
Characterization of Ground Motion Hazard
PEER Summative Meeting - June 13, 2007
Yousef Bozorgnia
PEER Associate Director

NSF-PEER Summative Meeting
Numerous Research Projects on Characterization of Ground Motion Hazard
Closest Distance (km)
0.1 1 10 100
Pea
k H
ori
zon
tal
Acc
eler
atio
n (
g)
0.01
0.1
1
Magnitude = 7.5 -- pga -- Strike Slip
Idriss [Vs30 = 450 -- 900 m/s]
Boore & Atkinson (Vs30 = 760 m/s)
Abrahamson & Silva (Vs30 = 760 m/s)
Campbell & Bozorgnia (Vs30 = 760 m/s)
Chiou & Youngs (Vs30 = 760 m/s)
Attenuation models and related projects

NSF-PEER Summative Meeting
Numerous Research Projects on Characterization of Ground Motion Hazard
Ground motion selection & modification for nonlinear analysis
Attenuation models and related projects
NSF-PEER Summative Meeting
Numerous Research Projects on Characterization of Ground Motion Hazard
Ground motion selection & modification for nonlinear analysis
Attenuation models and related projects
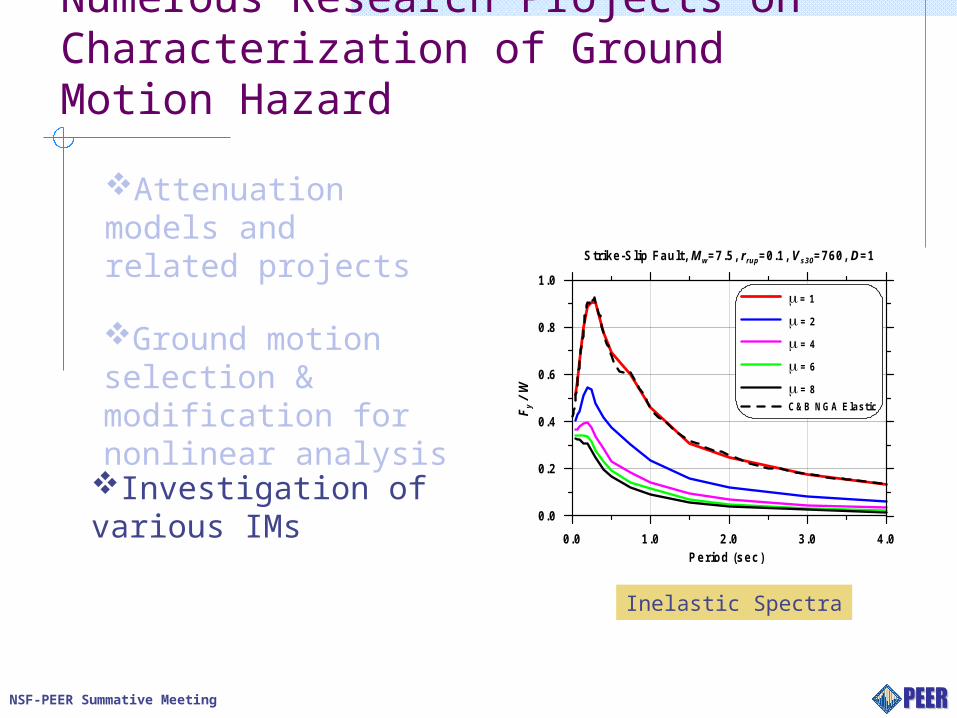
Investigation of various IMs
Strike-Slip Fault, M w=7.5, rrup=0.1, Vs30=760, D=1
0.0 1.0 2.0 3.0 4.0
Period (sec)
0.0
0.2
0.4
0.6
0.8
1.0
Fy /
W
= 1
= 2
= 4
= 6
= 8
C&B NGA Elastic
Inelastic Spectra

NSF-PEER Summative Meeting
Numerous Research Projects on Characterization of Ground Motion Hazard
Ground motion selection & modification for nonlinear analysis
Attenuation models and related projects
Investigation of various IMsInput motion for tall buildings with large embedded structures

Next Generation Attenuation (NGA) Models

NSF-PEER Summative Meeting
Next Generation “Attenuation” (NGA) Is a Multidisciplinary “Program”
Coordinated by PEER over the last four years
Bringing together: geologists,
seismologists, geotechnical engineers, structural engineers, and users of ground motion models
And Researchers, practitioners
USGS
Private Industry
Caltrans
Private Industry
USGS
UC Berkele
y
UC Santa
BarbaraSan
Diego State
U.
U. Nevada
Student

NSF-PEER Summative Meeting
0 . 1 1 1 0 1 0 0 1 0 0 0Distance (km )
4
5
6
7
8
Mag
nit
ud
e
Previous Data
173 worldwide earthquakes
PEER Compiled One of the Largest Uniformly- Processed Strong-Motion Databases in the World
0 . 1 1 1 0 1 0 0 1 0 0 0Distance (km )
4
5
6
7
8
Mag
nit
ud
e
New Data
> 10,500 uniformly processed records
-0.5
0.0
0.5
Ac
ce
l. (g
)
-0.5
0.0
0.5
Ac
ce
l. (g
)
PS10, 47 Deg.
PS10, Vertical
20 25 30 35 40
-0.5
0.0
0.5
Ac
ce
l. (g
)
PS10, 317 Deg.
2002 Denali (A laska) EQ, Pum p Station 10
0.01 0.1 1 10Period (sec)
0
0.5
1
1.5
Sp
ec
tra
l A
cc
ele
rati
on
(g
)
NSF-PEER Summative Meeting
PEER Strong-Motion Database
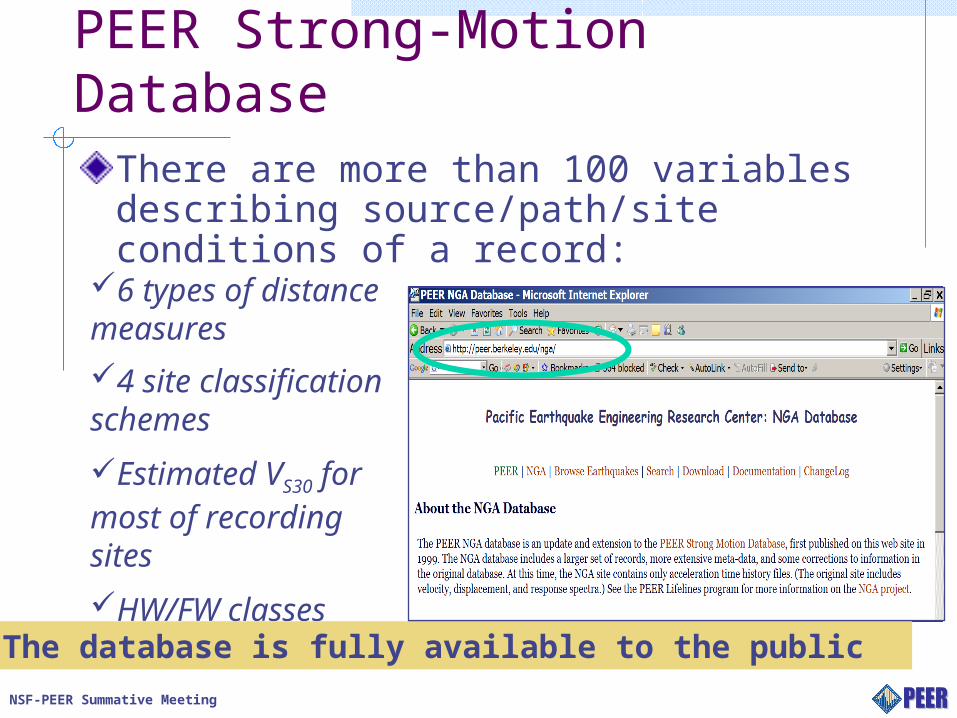
There are more than 100 variables describing source/path/site conditions of a record:
6 types of distance measures
4 site classification schemes
Estimated VS30 for most of recording sites
HW/FW classesThe database is fully available to the public

NSF-PEER Summative Meeting
NGA Model Developer TeamsNGA empirical ground motion model developers Abrahamson & Silva (updating their 1997
model) Boore & Atkinson (updating Boore et al., 1997
model) Campbell & Bozorgnia (updating their 1997,
2003 models) Chiou & Youngs (updating Sadigh et al., 1997
model) Idriss (updating his 1993 & 1996 models)
All model developers started with a common database

NSF-PEER Summative Meeting
Ground motion parameters:
Horizontal components
PGA, PGV, PGD
Pseudo spectral acceleration at 5% damping
Period: 0 - 10 sec
NGA Attenuation Models
Magnitude range: 5.0 - 8.0+
Fault Mechanism: Strike-Slip Reverse Normal
Site EffectsVs30
Distance range: 0 – 200 km

NSF-PEER Summative Meeting
NGA Models Were Constrained by Simulation
To fill the gaps in data
Simulations of 3-D basin and 1-D rock motionsTo model amplification due to sediment-depthTo constrain attenuation models
Nonlinear soil response analysisAmplification factors for different soil profiles
subjected to a wide range of input motions
Dep
th (
m)
to V
s=
1.5
km
/s
Am
plifi
cati
on
(Natu
ral L
og
)
Period (sec)

NSF-PEER Summative Meeting
Example Result: C&B NGA Predicted Acceleration SpectraStrike Slip, M = 7.0, VS30 = 760 m/s
0.01 0.1 1 10
Period (sec)
0.01
0.1
1S
pec
tra
l Acc
ele
rati
on
(g
)RRUP = 10
RRUP = 40
RRUP = 200
NSF-PEER Summative Meeting
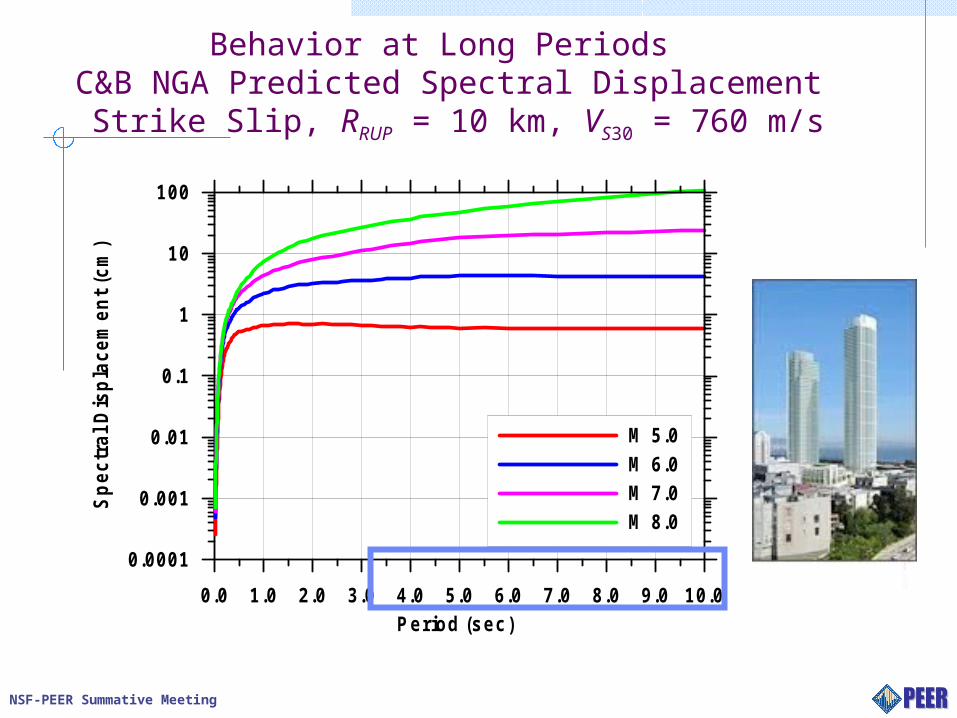
Behavior at Long Periods C&B NGA Predicted Spectral Displacement Strike Slip, RRUP = 10 km, VS30 = 760 m/s
0.0 1.0 2.0 3.0 4.0 5.0 6.0 7.0 8.0 9.0 10.0
Period (sec)
0.0001
0.001
0.01
0.1
1
10
100
Sp
ectr
al
Dis
pla
cem
en
t (c
m)
M 5.0
M 6.0
M 7.0
M 8.0
Examples of Comparison of NGA Models

NSF-PEER Summative Meeting
Campbell & Bozorgnia (C&B) NGA vs. C&B 2003 Strike-Slip Fault, NEHRP B-C
4.0 4.5 5.0 5.5 6.0 6.5 7.0 7.5 8.0 8.5
Moment Magnitude
Ac
ce
lera
tio
n (
g)
10-3
10-2
10-1
100
PGA, Strike Slip, VS30=760
Campbell & Bozorgnia (2003)Campbell & Bozorgnia (NGA May 06)
50
10
200
RRUP=0.1
1 10 100
Closest Distance to Rupture (km)
10-2
10-1
100
Ac
ce
lera
tio
n (
g)
Campbell & Bozorgnia (2003)Campbell & Bozorgnia (NGA May 06)
PGA, Strike Slip, VS30=760
M = 8.0
7.0
6.05.0
4.0 4.5 5.0 5.5 6.0 6.5 7.0 7.5 8.0 8.5
Moment Magnitude
Ac
ce
lera
tio
n (
g)
10-3
10-2
10-1
100
SA(1.0s), Strike Slip, VS30=760
Campbell & Bozorgnia (2003)Campbell & Bozorgnia (NGA May 06)
50
10
200
RRUP=0.1
1 10 100
Closest Distance to Rupture (km)
10-2
10-1
100
Ac
ce
lera
tio
n (
g)
Campbell & Bozorgnia (2003)Campbell & Bozorgnia (NGA May 06)
SA(1.0s), Strike Slip, VS30=760
M = 8.0
7.0
6.05.0

NSF-PEER Summative Meeting
Sa(T=1.0s) – Strike-Slip, M 7.5, NEHRP B-C
Closest Distance (km)
0.1 1 10 100
Sp
ectr
al A
ccel
erat
ion
(g
)
0.01
0.1
1
Magnitude = 7.5 -- T = 1 sec -- Strike Slip
Idriss [Vs30 = 450 -- 900 m/s]
Boore & Atkinson (Vs30 = 760 m/s)
Abrahamson & Silva (Vs30 = 760 m/s)
Campbell & Bozorgnia (Vs30 = 760 m/s)
Chiou & Youngs (Vs30 = 760 m/s)

NGA & US National Seismic Hazard Maps

NSF-PEER Summative Meeting
Impact of NGA Models on Seismic Design
USGS has extensively reviewed NGA, and is adopting the NGA models for the US National Seismic Hazard Maps
Design spectra based on either deterministic or probabilistic approach will be affected by NGA models

NSF-PEER Summative Meeting
Using same set of fault sources as 2002 maps;Subduction zone and deep earthquakes are not included
Rock site condition
Period=0.2 sec Spectral Acceleration2% P.E. in 50 years
Ratio of New/Old:Using 3 NGA relationsVersus:2002 Hazard MapsAbrahamson and Silva (1997),Sadigh et al. (1997), Boore et al. (1997),Campbell and Bozorgnia (2003),Spudich et al. (1999) for extensionalareas
Preliminary Map

NSF-PEER Summative Meeting
Period=1.0 sec Spectral Acceleration2% P.E. in 50 years
Ratio of New/Old:Using 3 NGA relationsVersus:2002 Hazard MapsAbrahamson and Silva (1997),Sadigh et al. (1997), Boore et al. (1997),Campbell and Bozorgnia (2003),Spudich et al. (1999) for extensionalareas
Preliminary Map

NSF-PEER Summative Meeting
“Some of the decrease of 1 sec Sa from the 2002 maps is caused by: Difference in the Vs30 assigned for “rock”
sites in the 2002 maps and the average Vs30
for rock sites reported in NGA (shouldn’t be a factor in the Campbell-Bozorgnia and Boore-Atkinson NGA relations)”
“Most of the decrease is from having additional data from moderate and large earthquakes and improved functional forms to fit the data”
Reasons…
Courtesy: Art Frankel

NSF-PEER Summative Meeting
NGA Reports & Papers
Including computer files of the models
Draft final reports are available at PEER web site
PEER reports are being printed
Journal papers will be published in special issue of EERI Spectra, March 2008

NSF-PEER Summative Meeting
NGA Models Are More Robust Than Old Models Because…
Quantity and quality of dataAmount of time the developers spent on modelsInteractions among model developersNumber of independent variablesAvailability of supporting ground motion simulationsPublic participation via workshops and conferencesFormal peer review commissioned by USGS

NSF-PEER Summative Meeting
Finally…It would have been much more difficult to accomplish NGA without a framework of a national earthquake engineering center
Example: For NGA, PEER coordinated efforts, and has had research contracts with: USGS (different
researchers) California Geological
Survey SCEC (various
contracts) Various universities Several firms and
practitioners
Special Thanks To: