characterization of in-use emissions from txdot's non … · protopapas, and john overman 8....
TRANSCRIPT

Technical Report Documentation Page 1. Report No. FHWA/TX-09/0-5955-1
2. Government Accession No.
3. Recipient's Catalog No.
4. Title and Subtitle CHARACTERIZATION OF IN-USE EMISSIONS FROM TXDOT’S NON-ROAD EQUIPMENT FLEET – PHASE 1 REPORT
5. Report Date October 2008 Published: June 2009
6. Performing Organization Code
7. Author(s) Doh-Won Lee, Josias Zietsman, Mohamadreza Farzaneh, Annie Protopapas, and John Overman
8. Performing Organization Report No. Report 0-5955-1
9. Performing Organization Name and Address Texas Transportation Institute The Texas A&M University System College Station, Texas 77843-3135
10. Work Unit No. (TRAIS)
11. Contract or Grant No. Project 0-5955
12. Sponsoring Agency Name and Address Texas Department of Transportation Research and Technology Implementation Office P. O. Box 5080 A ustin, Texas 78763-5080
13. Type of Report and Period Covered Technical Report: September 2007 – August 2008
14. Sponsoring Agency Code
15. Supplementary Notes Project performed in cooperation with the Texas Department of Transportation and the Federal Highway Administration. Project Title: Characterization of In-Use Emissions from Non-Road Equipment in the TxDOT Fleet URL: http://tti.tamu.edu/documents/0-5955-1.pdf 16. Abstract The objective of this document is to present the preliminary findings of the study characterizing in-use TxDOT non-road diesel equipment emissions. This document presents literature reviews of emissions reduction technologies and emissions control measures practiced by state of Texas and other states, discusses selection of TxDOT non-road equipment and emissions reduction technologies for emissions testing, and shows preliminary results of in-use emissions of TxDOT diesel equipment using portable emissions measurement systems (PEMS). Emissions measurements and data comparison and analysis tasks are still ongoing, so that a stage for any recommendation or conclusion has not been reached.
17. Key Words Non-Road Equipment, TxDOT Diesel Equipment, Grader, Rubber Tire Loader, Excavator, Exhaust Emissions, NOx, Emissions Reduction, PEMS Testing
18. Distribution Statement No restrictions. This document is available to the public through NTIS: National Technical Information Service 5285 Port Royal Road Springfield, Virginia 22161
19. Security Classif.(of this report) Unclassified
20. Security Classif.(of this page) Unclassified
21. No. of Pages 90
22. Price
Form DOT F 1700.7 (8-72) Reproduction of completed page authorized


CHARACTERIZATION OF IN-USE EMISSIONS FROM TXDOT’S NON-ROAD EQUIPMENT FLEET – PHASE 1 REPORT
by
Doh-Won Lee Assistant Research Scientist
Texas Transportation Institute
Josias Zietsman Associate Research Engineer Texas Transportation Institute
Mohamadreza Farzaneh
Assistant Research Scientist Texas Transportation Institute
Annie Protopapas
Assistant Research Scientist Texas Transportation Institute
John Overman
Associate Research Scientist Texas Transportation Institute
Report 0-5955-1 Project 0-5955
Project Title: Characterization of In-Use Emissions from Non-Road Equipment in the TxDOT Fleet
Performed in cooperation with the Texas Department of Transportation
and the Federal Highway Administration
October 2008 Published: June 2009
TEXAS TRANSPORTATION INSTITUTE
The Texas A&M University System College Station, Texas 77843-3135


v
DISCLAIMER
The contents of this report reflect the views of the authors, who are Doh-Won Lee, Josias
Zietsman, Mohamadreza Farzaneh, Annie Protopapas, and John Overman responsible for the
facts and the accuracy of the data presented herein. The contents do not necessarily reflect the
official view or policies of the Federal Highway Administration (FHWA) or the Texas
Department of Transportation (TxDOT). This report does not constitute a standard,
specification, or regulation. The engineer in charge was Josias Zietsman, Ph.D., P.E., (TX,
#90506).
vi
ACKNOWLEDGMENTS
This project was conducted in cooperation with TxDOT and FHWA. The authors would
like to thank the members of the Project Monitoring Committee: Dianna Noble (Program
Coordinator; TxDOT), Don Lewis (Project Director; TxDOT), Duncan Stewart (TxDOT’s
Research and Technological Implementing Office), Jackie Ploch (TxDOT), Vic Ayres (City of
Houston) and Ruben Casso (EPA Region 6). The authors would also like to thank the following
researchers for their contributions: Brian Bochner and Tara Ramani.

vii
TABLE OF CONTENTS
Page List of Figures............................................................................................................................... ix List of Tables ................................................................................................................................. x Chapter 1: Introduction ............................................................................................................... 1
Defining the Problem.................................................................................................................. 1 Study Objectives ......................................................................................................................... 1
Chapter 2: State-of-the-Practice Assessment ............................................................................. 3 Non-Road Emissions Reduction Technologies .......................................................................... 3
Emissions Reduction Technologies: Control Devices............................................................ 5 Emissions Reduction Technologies: Fuel/Fuel Additives ...................................................... 8
Non-Road Emission Reduction Case Studies ........................................................................... 11 Non-Road Emission Resources................................................................................................. 11
Non-Road Emission Factors ................................................................................................. 12 NONROAD Model ............................................................................................................... 13 Non-Road Inventories........................................................................................................... 14
Practices of Other States ........................................................................................................... 14 Chapter 3: Selection of TxDOT Equipment For Testing......................................................... 17
Non-Road Construction Equipment Database .......................................................................... 17 Database Description ............................................................................................................ 17 Database Refinement Criteria ............................................................................................... 18
NOx Emissions from TxDOT Equipment ................................................................................ 18 Emissions Calculation Methodology .................................................................................... 19 Emissions Results ................................................................................................................. 20
Criteria and Equipment Category Priority List......................................................................... 24 Test Protocol ............................................................................................................................. 25
Phase 1 Testing ..................................................................................................................... 26 Phase 2 Testing ..................................................................................................................... 26
Chapter 4: Selection of Emissions Reduction Technologies For Testing .............................. 29 Non-Road Emissions Reduction Technologies ........................................................................ 29
Selective Catalytic Reduction ............................................................................................... 30 Lean NOx Catalyst................................................................................................................ 31 Exhaust Gas Recirculation.................................................................................................... 32 Fuel Additives....................................................................................................................... 33 Hydrogen Enrichment........................................................................................................... 34
Technology Selection................................................................................................................ 35 NOx Emissions Cost-Effectiveness Analysis ....................................................................... 35 Evaluation for Final Technology Selection .......................................................................... 37
Vendor Selection....................................................................................................................... 38 Chapter 5: Development of Duty Cycles for Selected Equipment ......................................... 39
Methodology Selection ............................................................................................................. 39 Graders...................................................................................................................................... 40 Rubber-Tire Loaders................................................................................................................. 44 Excavators................................................................................................................................. 46

viii
Chapter 6: Measurements and Analysis of Baseline and Treatment Level Emissions ........ 47 Test Site .................................................................................................................................... 48 Test Equipment ......................................................................................................................... 50 Test Instrument ......................................................................................................................... 51
SEMTECH-DS ..................................................................................................................... 52 Axion..................................................................................................................................... 52
Test Results............................................................................................................................... 53 NOx Emissions Analysis ...................................................................................................... 55
Chapter 7: Final Remarks.......................................................................................................... 57 Next Project Steps..................................................................................................................... 58
References.................................................................................................................................... 61 APPENDIX A: NON-ROAD EMISSION REDUCTION CASE STUDIES ........................ 65 APPENDIX B: NON-ROAD EMISSION RELATED DOCUMENTS.................................. 69 APPENDIX C: PRACTICES OF OTHER STATES – STRATEGIES AND INCENTIVES....................................................................................................................................................... 71 APPENDIX D: PRACTICES OF OTHER STATES – NON-ROAD EMISSIONS............ 75 APPENDIX E: QUESTIONNAIRES FOR FUEL ADDITIVES (FA) ................................. 77 APPENDIX F: QUESTIONNAIRES FOR HYDROGEN ENRICHMENT (HE) SYSTEM .......................................................................................................................................................79

ix
LIST OF FIGURES Page Figure 1. Total Average FY 2005-2007 NOx Emissions by Equipment Category – Statewide. . 21 Figure 2. Total Average FY 2005-2007 NOx Emissions by Equipment Category –
Nonattainment Counties........................................................................................................ 22 Figure 3. Total Average FY 2005-2007 NOx Emissions by Equipment Category – EAC
Counties. ............................................................................................................................... 23 Figure 4. Phase 1 Testing Flow Chart........................................................................................... 26 Figure 5. Phase 2 Testing Flow Chart: (a) Scenario A: When the New Technology Tested in
Phase 2 Performs Best, (b) Scenario B: When the Better Technology Identified in Phase 1 Performs Best........................................................................................................................ 27
Figure 6. Grader Blade Position in forward (left) and backward (right) Movements. ................. 41 Figure 7. Bed for Leveling/Backup Testing. ................................................................................ 43 Figure 8. Leveling Portion of Graders’ Duty Cycle. .................................................................... 43 Figure 9. Loader Operation; Material Pickup (left) and Loading Truck (right). .......................... 45 Figure 10. Loading Portion of Loaders’ Duty Cycle. ................................................................... 46 Figure 11. Test Site: (a) Aerial View of the Riverside Campus at Texas A&M University, (b)
Section of the Runway (marked as white box in [a]) Where Testing Took Place, and (c) Section Covered with Base Material for Leveling and Backup Testing............................... 48
Figure 12. Pictures of (a) Driving Testing and (b) Leveling Testing. .......................................... 49 Figure 13. Emissions Measurement Instruments (a) SEMTECH-DS Unit, (b) Axion Unit, and (c)
Both Units along with EFM Installed on a TxDOT Grader.................................................. 51 Figure 14. Baseline Testing Results of Graders (a) 1100A, (b) 1112A, (c) 1453, and (d) 1468.. 53

x
LIST OF TABLES Page
Table 1. Verified Technologies for Non-Road Equipment/Engines........................................... 4 Table 2. Summary of Possible Emissions Reduction Technologies for Diesel Equipment. ...... 4 Table 3. Total NOx Emissions by Equipment Category and County Status. ........................... 20 Table 4. Priority Equipment Categories by Tier and County Status......................................... 24 Table 5. Candidate Technologies for NOx Emissions Reduction. ........................................... 30 Table 6. NOx Reduction Rates and Costs of the Candidate Technologies............................... 35 Table 7. Results of NOx Removal Costs (CNOx) for All Candidate Technologies. .................. 36 Table 8. Considering Factors for Final Candidate Technologies. ............................................ 37Table 9. Tasks of Proposed Duty Cycle for Motor Graders...................................................... 42Table 10. Tasks of Proposed Duty Cycle for Rubber-Tire Loaders. ........................................ 44 Table 11. Information of the TxDOT Graders Tested for Phase 1 Testing. ............................. 50 Table 12. Baseline NOx Emission Rates (g/s).......................................................................... 56

1
CHAPTER 1: INTRODUCTION
DEFINING THE PROBLEM
The Texas Department of Transportation (TxDOT) operates the largest fleet of non-road equipment in Texas and one of the largest in the U.S. Based on the data provided by TxDOT for this project, TxDOT owned and operated almost 3200 non-road diesel units at the end of fiscal year (FY) 2007. The emissions impact from these units is considerable, but the emissions characteristics are not well understood. TxDOT recognizes that pursuing methods to reduce emissions from non-road equipment as well as understanding the emissions characteristics are important goals. In June 2005, the U.S. Environmental Protection Agency (EPA) issued a final rule (EPA420-F-05-021; [1]) requiring in-use testing of heavy-duty diesel engines and vehicles. In contrast to earlier emissions testing programs conducted primarily in laboratory settings using engine or chassis dynamometers, the new rule requires measurement of exhaust emissions from on-road heavy-duty diesel engines during real-world driving conditions using a portable emissions measurement system (PEMS). Currently, the EPA is implementing the rule for on-road heavy-duty diesel engines; a future rule expected by 2010 will establish a similar in-use testing program for non-road heavy-duty diesel engines. Thus, the characterization of emissions from non-road diesel engines during real-world operating conditions is important for TxDOT and the state of Texas. The use of PEMS equipment in testing of non-road equipment is a cost-effective and proactive approach to investigate the emissions impact of using selected engine and fuel emissions reduction technologies because it enables emissions testing of TxDOT’s non-road fleet under actual operating conditions.
STUDY OBJECTIVES
The overall goals of this project are to: • understand how results from the new federal in-use testing program may affect current
estimates of emissions of oxides of nitrogen (NOx) and other pollutant emissions, particularly in ozone nonattainment areas,
• evaluate the effectiveness of emerging fuels/fuel additives and retrofit technologies to reduce emissions so that TxDOT can make optimal use of funds available for emissions reductions, and
• identify emissions control strategies, such as changes in operating practices, which may avoid the costs of retrofits.
Researchers will achieve these project goals by:
• carefully selecting the TxDOT non-road equipment and emissions reduction technologies to test,
• developing duty cycles for the selected equipment,

2
• measuring and analyzing baseline and treatment level emissions using the most state-of-the-art PEMS equipment in Texas, and
• comparing the results with existing data sources. Researchers will achieve the goals by conducting seven tasks in two phases. Phase 1 involves background research and testing of TxDOT equipment identified as having the highest priority for emissions reduction, using two selected emissions reduction technologies: fuel additive (FA) and hydrogen enrichment (HE) technologies. Phase 2 of the project involves testing the first priority and second priority TxDOT equipment using the most promising emissions reduction technologies identified during the Phase 1 testing. Based on technological developments and other factors that might become known at a later stage of the project, an additional technology will be selected and tested during Phase 2 for both first and second priority equipment. The goals of the project will be achieved by implementing the following seven tasks:
• Task 1: State-of-the-Practice Assessment; • Task 2: Select TxDOT Equipment for Testing; • Task 3: Select Emissions Reduction Technologies for Testing; • Task 4: Develop Duty Cycles for Selected Equipment; • Task 5: Measure and Analyze Baseline and Treatment Level Emissions; • Task 6: Compare Results with Existing Data Sources; and • Task 7: Prepare Final Products.
This report documents the research and preliminary findings from Phase 1 of the project.

3
CHAPTER 2: STATE-OF-THE-PRACTICE ASSESSMENT As the first step for conducting the project, the research team performed an extensive review of available information on the following topic areas: emissions reduction technologies, emissions rates, and emissions control (by other states). The state-of-the-practice assessment included searches of published materials, information from personal contacts, and databases such as the Transportation Research Board’s transportation research information services (TRIS) database, TxDOT and Texas Transportation Institute (TTI) libraries, EPA and California Air Resources Board (CARB) databases, and general web-searches. The collected information was analyzed and organized into four topic areas, as listed below:
• Non-Road Emissions Reduction Technologies, • Non-Road Emissions Case Studies, • Non-Road Emission Resources, and • Practices of Other States.
The results are presented in the following four sections.
NON-ROAD EMISSIONS REDUCTION TECHNOLOGIES
This section briefly covers a broad range of emissions reduction technologies/combinations of technologies for non-road diesel equipment. Chapter 4, “Selection of Emissions Reduction Technologies for Testing,” provides more detailed information of the candidate and selected technologies along with the selection criteria. Diesel emissions controls are generally achieved by either modifying the engine design, treating the exhaust (also referred to as after treatment), modifying the fuel source, or a combination of these controls. The primary sources for information on diesel emissions control devices and fuel/fuel additives are from the Environmental Protection Agency, California Air Resources Board, and the Manufacturers of Emission Control Association (MECA) (2, 3, 4). Several different technologies are currently available for emissions reduction of non-road diesel equipment. As of October 2008, the EPA and CARB verified one technology and a combination of two technologies for non-road diesel construction equipment. Table 1 lists the details of these verified technologies.

4
Table 1. Verified Technologies for Non-Road Equipment/Engines. % Reduction
Technology NOx PM
Verification by Other Information
DOC + SCR* 80 ≥ 25 CARB Fuel with S < 500 ppm DPF* N/A ≥ 85 EPA** & CARB Fuel with S < 30 ppm***
Sources: EPA (5) and CARB (6) Acronyms used in the table are listed alphabetically: DOC: Diesel Oxidation Catalyst; DPF: Diesel Particulate Filter; N/A: Not Applicable; NOx: Oxides of Nitrogen; PM: Particulate Matter; S: Sulfur; SCR: Selective Catalytic Reduction. * Verification for a product is subject to certain engine makes and with certain fuel requirements. ** Not in the EPA's Environmental Technology Verification (ETV) Program *** Most products require Ultra-Low Sulfur Diesel (ULSD; S < 15 ppm [parts per million]) and are also verified with biodiesel blends subject to certain requirements. Most products for non-road diesel construction equipment are verified by CARB. Since the main focus of CARB verification is PM emissions reduction, the verified technologies are primarily targeted on PM. For NOx emissions reductions, technologies currently receiving the most attention are Selective Catalytic Reduction, exhaust gas recirculation (EGR), and lean NOx catalyst (LNC). These technologies, as well as those listed in Table 1 are evaluated in Chapter 4 as candidates for actual testing on TxDOT’s non-road fleet. Based on reviews of available literature, including reports of previous TTI studies conducted in cooperation with TxDOT (7, 8) and information from EPA, CARB and MECA, the most common emissions reduction technologies that can be used for non-road diesel equipment are listed in Table 2.
Table 2. Summary of Possible Emissions Reduction Technologies for Diesel Equipment. % Reduction Technology
NOx PM Cost over 7 Years*
Biodiesel** -5*** 20 Low Closed crankcase ventilation 0 20 Low
Diesel oxidation catalyst 0 20 Low Exhaust gas recirculation 40 0 Medium
Fuel additives 5 0 Low Hydrogen enrichment 20 TBD**** Medium
Lean NOx catalyst 25 0 High Diesel particulate filter 0 85 Medium
Selective catalyst reduction 75 25 High * Low: Less than $5,000; Medium: from $5,000 to $10,000; High: More than $10,000. ** Usually, used in the form of 20 percent biodiesel and 80 percent ULSD, i.e., B20. *** -5 means 5 percent of NOx emission increase. **** TBD - To be determined. The following two sections – control devices and fuel/fuel additives – provide brief descriptions of the technologies.

5
Emissions Reduction Technologies: Control Devices
Diesel Oxidation Catalyst
In most applications, a DOC consists of a stainless steel canister that contains a honeycomb structure called a substrate or catalyst support. The interior surfaces are coated with catalytic metals such as platinum or palladium. A DOC chemically converts diesel exhaust gas pollutants, carbon monoxide (CO) and hydrocarbons (HC), and the liquid hydrocarbons adsorbed on carbon particles (referred to as the soluble organic fraction [SOF]), into water (H2O) and carbon dioxide (CO2) by using an oxidation catalyst. When the exhaust flow passes through the oxidation catalyst, unburned HC and CO are oxidized. In addition, the SOF of diesel particulate matter (DPM) is also oxidized to H2O and CO2. Although DOC retrofits have proven effective at reducing particulate and smoke emissions with gaseous CO and HC emissions on older vehicles, they do not reduce NOx emissions. Currently, under the CARB and EPA retrofit technology verification processes, several manufacturers have verified that DOC products provide at least a 19 percent reduction in PM emissions. However, there are no verified DOCs for non-road diesel construction equipment.
Diesel Particulate Filter
A DPF is a device designed to remove DPM from the exhaust gas of a diesel engine. The first type of DPF, called a wall-flow filter, consists of a honeycomb structure with alternate channels plugged at opposite ends. As the gasses pass into the open end of a channel, the plug at the opposite end forces the gasses through the porous wall of the honeycomb channel and out through the neighboring channel. The ultrafine porous structure of the channel walls of the filter results in collection efficiencies greater than 85 percent. It captures smoke, soot, and other PM from the exhaust by interception and impaction of the solid particles across the porous wall. These filters are commonly made from ceramic materials such as cordierite, aluminum titanate, mullite or silicon carbide. Since a filter can fill up over time by developing a layer of retained particles on the inside surface of the porous wall, the captured PM must be burned off during the operation of the vehicle to prevent clogging the DPF. This burn-off is referred to as regeneration. The filter regenerations are either through the use of a catalyst (passive), or through an active technology. The passive regeneration occurs by removing the captured particulates continuously and spontaneously through catalytic oxidation on the filters, depending mainly on the filter temperature and soot load in the filter. In the event of long periods of operation at low load and temperature, however, a filter needs to burn off the loaded particulates by additional means such as a fuel burner, electric heater and/or fuel-borne catalysts (FBCs). This burn-off by a burner is referred to as “active regeneration.” The amount of soot build-up and the resulting increase in back pressure determine the frequency of regeneration. Despite the high efficiency of the catalyst, a layer of ash may build up on the filter requiring replacement or servicing. The ash is made up of inorganic oxides from the fuel or lubricants used in the engine and will not decompose during the regular soot regeneration process. Because sulfur in the fuel interferes with many regeneration strategies, almost all DPFs must use ultra-low sulfur diesel. There is a

6
1-to-4 percent fuel penalty (i.e., increase in fuel consumption) depending on catalysts and regeneration methods.
Lower levels of filtration can be achieved using a flow through filter. In this type of device, the filter element can be made of a variety of materials and designs, such as sintered metal, metal mesh or wire, or a reticulated metal or ceramic foam structure. In this type of device the exhaust gasses and PM follow a tortuous path through a relatively open network. The filtration occurs as particles impinge on the rough surface of the mesh or wire network of the filter element. These filters can be catalyzed or uncatalyzed and are less prone to plugging than the more commonly used wall-flow filters discussed previously. To meet the stringent particulate emissions standards that are required for heavy-duty diesel vehicle (HDDV) engines starting with the 2007 model year, the wall-flow type DPFs are required. Currently, under the CARB and EPA retrofit technology verification processes, several manufacturers have verified that DPFs provide at least a 25 percent reduction in PM emissions. For non-road construction equipment applications, one product is verified by EPA (Caterpillar DPF); and three products (Cleaire Horizon, Engine Control Systems Combifilter, and HUSS FS-MK filter) are verified by CARB. These products are discussed below:
• Caterpillar DPF: o This product is EPA-verified for model years 1996 through 2005 (subject to
certain engine types and sizes) with low S diesel (S < 30 ppm); verification valid until January 2010. Reduction of PM is 89 percent, CO is 90 percent, and HC is 93 percent. Detailed information is available on the EPA website (9).
• Cleaire Horizon:
o CARB Level 3 Verified for model year 2007 or older (subject to certain engine types and sizes) with biodiesel blends (subject to certain requirements) and with standard CARB diesel; verification valid until January 2010. Reduction of PM is 85 percent or more. Detailed information is available on the CARB website (10).
• ECS Combifilter:
o CARB Level 3 Verified for model year 2007 or older (subject to certain engine makes, types and sizes) with biodiesel blends (subject to certain requirements) and with standard CARB diesel. Reduction of PM is 85 percent or more. Detailed information is available on the CARB website (11).
• HUSS FS-MK Filter:
o CARB Level 3 Verified for model year 2007 or older (subject to certain engine makes and types) with biodiesel blends (subject to certain requirements) and with standard CARB diesel. Reduction of PM is 85 percent or more. Detailed information is available on the CARB website (12).
Selective Catalytic Reduction
An SCR system uses a metallic or ceramic wash-coated catalyzed substrate, or a homogeneously extruded catalyst and a chemical reductant to convert NOx to molecular nitrogen and oxygen.

7
For applications, an aqueous urea solution or ammonia is usually injected into the exhaust gas. When urea is used, it decomposes thermally in the exhaust to ammonia which serves as the reductant. As exhaust and reductant pass over the SCR catalyst, chemical reactions occur that reduce NOx emissions to nitrogen and water.
SCR systems are also effective in reducing HC emissions up to 80 percent and PM emissions by 20 to 30 percent. As with all catalyst-based emissions control technologies, the use of low sulfur fuel enhances SCR performance. SCR catalysts can be combined with a particulate filter for combined reductions of both PM and NOx. Currently, there are no stand-alone SCR systems verified by EPA or CARB. However, in conjunction with a DOC, one product (Extengine ADEC System) is currently verified by CARB for non-road construction equipment applications:
• Extengine ADEC System: o CARB Level 1 Verified for model year 1991-1995 (subject to certain engine
makes, types, and sizes) with diesel (S < 500 ppm). Reduction in PM is 25 percent or more, and NOx reduction is 80 percent. Detailed information is available on the CARB website (13).
Lean NOx Catalyst
An LNC system removes NOx from the exhaust by catalytically reducing NOx. Under lean conditions, some LNC systems use diesel fuel as a reductant, which is injected into the exhaust gas to help reduce NOx over a catalyst. The NOx is converted to nitrous oxide (N2O), CO2, and H2O. Other systems operate passively without any added reductant at reduced NOx conversion rates. An LNC often includes a porous material made of zeolite (a micro-porous material with a highly ordered channel structure), along with either a precious metal or base metal catalyst. The zeolites provide microscopic sites that are fuel/hydrocarbon rich where reduction reactions can occur. Without the added fuel and catalyst, reduction reactions that convert NOx to N2O would not occur because of excess oxygen present in the exhaust. Currently, peak NOx conversion efficiencies typically are around 10 to 30 percent (at reasonable levels of diesel fuel reductant consumption). There is only one LNC system in conjunction with a DPF that has been verified by CARB as providing a 25 percent reduction in NOx emissions and at least an 85 percent reduction in PM. However, there are no verified systems for non-road diesel construction equipment.
Exhaust Gas Recirculation
An EGR system controls NOx emissions. Through an EGR valve, NOx emissions reductions are accomplished by allowing exhaust gases to be recirculated into the intake manifold. Because the exhaust stream is composed of inert gas, blending some percentage of that gas into the intake mixture lowers the combustion temperature and thus reduces the formation of NOx. During these recirculation processes, PM emissions usually increase, so that EGR systems require other technologies such as a DPF to control the increased PM emissions.

8
Currently only one system in conjunction with a DPF has been verified by CARB as providing at least a 40 percent reduction in NOx emissions and at least an 85 percent reduction in PM. However, there are no verified systems for non-road diesel construction equipment.
Closed Crankcase Ventilation (CCV)
This system prevents crankcase emissions from being exposed to the cabin inside the operating vehicles and to ambient air. After closing the crankcase vent with the intake system, gases are returned to the intake system, and intake pressure is balanced with a regulator and a valve. Added filtration in the closed system further reduces crankcase PM emissions. Using a multistage filter, the emitted lube oil can be collected, coalesced, and returned to the engine’s sump. Typical closed crankcase filtration (CCF) systems consist of filter housing, a pressure regulator, a pressure relief valve, and an oil check valve. These systems greatly reduce crankcase emissions. Crankcase emissions controls are available as a retrofit technology for existing diesel engines or as an original equipment component of a new diesel engine. For model years 1994 to 2006 heavy-duty diesel engines, crankcase PM emissions reductions provided by crankcase emission control technologies range from 0.01 grams per brake horsepower-hour (g/bhp-hr) to 0.04 g/bhp-hr or up to 25 percent of the tailpipe emission standards. Currently, under the EPA and CARB retrofit technology verification processes, several manufacturers have verified CCV and CCF systems in conjunction with DOCs as providing at least a 25 percent reduction in PM emissions. However, there are no verified systems for non-road diesel construction equipment.
Emissions Reduction Technologies: Fuel/Fuel Additives
This section provides summaries of selected fuels and fuel additives that may be applicable in non-road environments.
Fuel Additive
FAs are products for use in conventional gasoline and diesel fuels to improve the combustion characteristics of these fuels, reduce emissions, and increase fuel efficiency and engine power at a modest cost to the user. FA manufacturers claim that their products can reduce emissions of NOx, HC, PM and/or CO up to 25 percent, 25 percent, 50 percent, and 30 percent, respectively. Additionally, manufacturers claim that FAs can decrease fuel consumption by up to 15 percent. However, it is also known that some products can increase emissions of one or more pollutants while reducing emissions of other pollutants and increasing fuel efficiency. Currently, there are no verified FAs.

9
Hydrogen Enrichment
HE systems reduce engine exhaust emissions by creating a better flame front in the engine. Using an on-board hydrolysis device or catalytic fuel reformer, hydrogen gas (H2) is generated from a small amount of water or diverted fuel. The enriched H2 is added into the fuel intake manifold and delivered into the cylinders with the fuel. Because the mixture is more flammable, the hydrogen-rich intake charge creates a better flame front, which produces lower engine-out emissions. Because O2 is also produced during the hydrolysis or reformation, the H2-O2 combination provides for a better combustion on the power stroke and reduces emissions as well. The combination provides a higher energy value than just ambient air and the fuel burns more completely in the combustion chamber, with little or no waste. This cooler but more complete burn reduces the amount of gasoline or diesel needed to power the engine and thus, fuel consumption decreases. Manufacturers claim that their products can reduce NOx and CO emissions up to 25 percent and 35 percent, respectively. Additionally, they claim that HE systems can decrease fuel consumption by about 10 percent. However, there are currently no verified HE systems.
Biodiesel
Biodiesel fuel is composed of mono-alkyl esters of long chain fatty acids derived from vegetable oils or animal fats meeting the requirements of American Society of Testing and Materials (ASTM) D 6751. Biodiesel reduces emissions of PM, CO, and HC when using it as fuel with or without blending with petroleum-based diesel (e.g., ULSD). Biodiesel is an alternative fuel that can be used in diesel engines and provides power similar to conventional diesel fuel. It is produced by reacting vegetable or animal fats with methanol or ethanol to produce a lower-viscosity fuel that is similar in physical characteristics to diesel, and which can be used neat or blended with petroleum diesel for use in a diesel engine. Biodiesel is commonly blended into petroleum-based fuel at low levels, i.e., 20 percent (B20) or less. Biodiesel can be used in its pure form (B100), but may require certain engine modifications to avoid maintenance and performance problems. Typical emissions benefits of B20 include:
• a 10 percent decrease in CO, • up to a 15 percent decrease in PM emissions, • a 20 percent decrease in sulfate emissions, and • a 10 percent decrease in HC emissions.
In some tests, B20 has shown a slight increase in NOx emissions on some types of existing heavy-duty engines. The emissions control technology suitable for engines operating on biodiesel blends would be similar to emissions control technology used for diesel-fueled vehicles. Currently biodiesel is in EPA’s verified technologies list for highway, heavy-duty, 4 cycle, non-EGR-equipped engines (4). On the list, biodiesel provides 0-to-47 percent reductions in PM,

10
0-to-47 percent reductions in CO, and 0-to-67 percent reductions of HC while showing 0-to-10 percent increases in NOx emissions. However, EPA does not endorse the use of any particular company’s product.
11
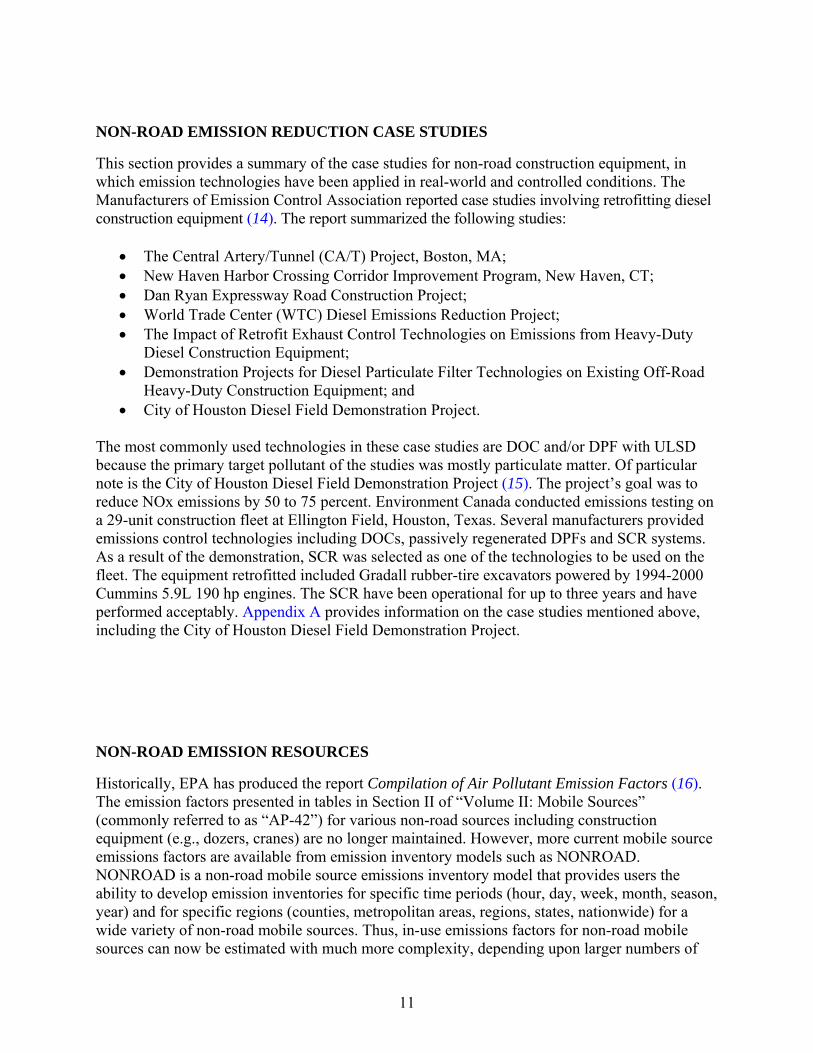
NON-ROAD EMISSION REDUCTION CASE STUDIES
This section provides a summary of the case studies for non-road construction equipment, in which emission technologies have been applied in real-world and controlled conditions. The Manufacturers of Emission Control Association reported case studies involving retrofitting diesel construction equipment (14). The report summarized the following studies:
• The Central Artery/Tunnel (CA/T) Project, Boston, MA; • New Haven Harbor Crossing Corridor Improvement Program, New Haven, CT; • Dan Ryan Expressway Road Construction Project; • World Trade Center (WTC) Diesel Emissions Reduction Project; • The Impact of Retrofit Exhaust Control Technologies on Emissions from Heavy-Duty
Diesel Construction Equipment; • Demonstration Projects for Diesel Particulate Filter Technologies on Existing Off-Road
Heavy-Duty Construction Equipment; and • City of Houston Diesel Field Demonstration Project.
The most commonly used technologies in these case studies are DOC and/or DPF with ULSD because the primary target pollutant of the studies was mostly particulate matter. Of particular note is the City of Houston Diesel Field Demonstration Project (15). The project’s goal was to reduce NOx emissions by 50 to 75 percent. Environment Canada conducted emissions testing on a 29-unit construction fleet at Ellington Field, Houston, Texas. Several manufacturers provided emissions control technologies including DOCs, passively regenerated DPFs and SCR systems. As a result of the demonstration, SCR was selected as one of the technologies to be used on the fleet. The equipment retrofitted included Gradall rubber-tire excavators powered by 1994-2000 Cummins 5.9L 190 hp engines. The SCR have been operational for up to three years and have performed acceptably. Appendix A provides information on the case studies mentioned above, including the City of Houston Diesel Field Demonstration Project.
NON-ROAD EMISSION RESOURCES
Historically, EPA has produced the report Compilation of Air Pollutant Emission Factors (16). The emission factors presented in tables in Section II of “Volume II: Mobile Sources” (commonly referred to as “AP-42”) for various non-road sources including construction equipment (e.g., dozers, cranes) are no longer maintained. However, more current mobile source emissions factors are available from emission inventory models such as NONROAD. NONROAD is a non-road mobile source emissions inventory model that provides users the ability to develop emission inventories for specific time periods (hour, day, week, month, season, year) and for specific regions (counties, metropolitan areas, regions, states, nationwide) for a wide variety of non-road mobile sources. Thus, in-use emissions factors for non-road mobile sources can now be estimated with much more complexity, depending upon larger numbers of

12
parameters. With the user of the emission factors having far more options for tailoring estimates to specific areas and times, compilation and presentation of this information in tabular form, or in a single document, is no longer feasible. Therefore, non-road emissions can be obtained from resources such as emissions factors, models, and inventories. These resources were used to calculate TxDOT non-road diesel equipment emissions. Researchers used calculated emissions for TxDOT equipment selection in Chapter 3. Researchers also discussed the emissions calculation methodology and the calculated emissions results in Chapter 3 in detail. Also, the resources will be used in Task 6 for comparisons with emissions test results from Task 5. Additional information is also available on-line from EPA’s Office of Transportation and Air Quality (OTAQ) program (17), and, in particular, the “Non-road Engines, Equipment and Vehicles” site (18). Appendix B lists some relevant documents including both EPA and non-EPA reports.
Non-Road Emission Factors
The document EPA 420-P-04-009 (19) contains exhaust emissions factors for compression ignition (CI) engines used for the current NONROAD emission inventory model. It should be noted that the term “compression ignition” is synonymous with “diesel.” Covered pollutants include HC, CO, NOx, PM, CO2, and sulfur dioxide (SO2). Brake specific fuel consumption (BSFC), a fuel rate measurement, is also discussed. The document covers:
• zero-hour, • steady-state emissions factors, • transient adjustment factors, and • deterioration factors for all diesel-fueled engines.
Adjustments to emissions rates due to variations in fuel sulfur level are also included. The document also covers crankcase HC emissions factors. The relevant tables in this document to be used in this project are the input factors used in NONROAD 2005 model. These relevant tables include:
• Table 1 – Non-road CI Engine Emissions Standards; • Table A1 – Non-road CI Technology Distributions by HP Category and Model Year; • Table A2 – Zero-Hour Steady State Emissions Factors for Non-road CI Engines; • Table A3 – Transient Adjustment Factors by Equipment Type for Non-Road CI Engines; • Table A4 – Deterioration Factors for Non-road Diesel Engines; • Table F3 – CI Transient Adjustment Factors for Various Non-Road Test Cycles; and • Table F4 – CI Cycle Transient Adjustment Factors Binned by Load Factor Category.

13
NONROAD Model
An area’s emissions inventory consists of emissions from point, area, and mobile sources. Mobile sources are divided into on-road and non-road categories, and non-road consists of several subcategories, some of which are:
• mobile construction equipment, • industrial and agricultural equipment, • lawn and garden equipment, • locomotives, • port equipment, • recreational and commercial boats, • commercial ships, and • off-shore platforms.
NOx (a precursor to ozone) is the criteria pollutant in Texas. In Texas the most nonattainment and near nonattainment areas (eight out of a total of nine) are for ozone. Non-road sources account for about 39 percent of the mobile source NOx emissions and about 11 percent of total emissions in the Dallas-Ft. Worth area (20). For the Houston-Galveston area, non-road sources make up 54 percent of mobile source NOx emissions and 34 percent of all other criteria pollutants’ emissions. Hence, non-road emissions make up a significant percentage of both mobile source and total emissions. Emissions rates for non-road equipment are typically contained in EPA’s AP-42 documents and tables as noted in the previous section. In terms of modeling, however, non-road emissions data center on the EPA’s NONROAD 2005 model, commonly called NONROAD. This model estimates air pollution from more than 80 types of compression ignition and spark ignition (SI) non-road sources including such items as lawnmowers, motorboats, portable generators, and construction equipment. By bringing together information on equipment populations, equipment usage, and emission factors, the NONROAD model estimates mass emissions of HC, CO, NOx, SO2, PM, and CO2 for specific states and counties for past and future years. These emissions are estimated using a number of inputs, including:
• fuel and engine type, including gasoline, diesel, compressed natural gas (CNG) and liquefied petroleum;
• geographic area and related characteristics; • time period, such as day, month, season; • climatic conditions, such as temperature and humidity; • activity, such as hours of operation per analysis period; and • equipment and engine types, including retrofit equipment.
In general, default values are available and used for the above characteristics that are not specifically known. Activity estimates can be made using survey data in the local area. However, the emissions rates in the current NONROAD model must be used for estimating emissions unless otherwise approved by EPA. The emissions rates included in NONROAD are based on emissions tests conducted for EPA using specified duty cycles and dynamometer testing.

14
Non-Road Inventories
The Texas Commission on Environmental Quality (TCEQ) conducts most of the non-road emissions estimations in Texas for emissions inventory purposes. However, other entities in the state have had experiences with non-road emissions inventory and analysis. For example, the Alamo Area Council of Governments (AACOG) has produced construction equipment emission estimates for its region. The methodology used was based on that used for the 1999 AACOG emission inventory. The study relied on local data produced from surveys, and on national data used in the EPA’s Non-road Emissions Inventory Model in the absence of reliable local data. It was concluded that the preferred methodology for calculating construction emissions continues to involve a local construction survey of equipment use within the AACOG region (21). The Houston-Galveston Area Council conducted an early analysis of area wide diesel construction emissions concluding that NONROAD is an improvement over their previous methodologies (22). However, with the advent of PEMS, it is now possible to make direct in-use measurements for non-road equipment such as TxDOT’s construction equipment. If done credibly and according to protocols acceptable to EPA, local emissions rates for the actual equipment and alternative emissions reduction treatments can be tested and documented for potential use in inventories as well as evaluation of effectiveness of treatments.
PRACTICES OF OTHER STATES
Many states have proposed or implemented various practices to encourage both on-road and non-road emissions reductions. This section summarizes those practices related to implementing non-road emissions control strategies in various states. In general, these state practices fall into one of two categories: control strategies and/or incentives. Additionally, some states have conducted research and examined EPA emissions modeling practices to more accurately determine equipment inventories and emissions factors that ultimately affect their emissions inventories, most notably California and Texas. State departments of transportation (DOT) control strategies for non-road emission generally include but are not limited to:
• operational controls such as idling restrictions and site operational controls; • clean contracting that stipulates contract incentives and contract requirements; • inspections and maintenance of non-road equipment; • fuels – early deployment of ULSD; • retrofit technologies; • rebuilds / re-power; • financial incentives; and • use of congestion mitigation and air quality (CMAQ) funds.

15
Regulatory strategies for non-road diesel emissions generally include implementing:
• EPA Non-Road Diesel Engines Rule; • adoption of California’s 2007 highway diesel standards (states that have adopted this
include Connecticut, Delaware, Georgia, Maine, Maryland, New Jersey, New York, North Carolina, and Pennsylvania); and
• contracting requirements for clean construction and emission reduction on state contracts.
Appendix C provides a few examples of the control strategies and funding incentives used in various states and regions. Appendix D provides a few selected examples of state practices for estimating non-road emissions.

16

17
CHAPTER 3: SELECTION OF TXDOT EQUIPMENT FOR TESTING TxDOT’s non-road construction equipment inventory was examined, equipment categories were selected, and the selection was recommended to the Project Monitoring Committee (PMC) for emissions testing. Additionally, Researchers developed a test protocol containing the recommended number of technologies, and reported it to the PMC. After discussion of the recommended equipment selection and test protocol, the PMC finalized the selection and test protocol. The following sections describe the process of the final selection and protocol in detail. In order to select the equipment for testing, TxDOT’s Non-Road Equipment Inventory database, provided by TxDOT, was analyzed carefully and thoroughly. Researchers developed criteria and applied them to refine the universe of equipment to those pieces that fulfilled the goals and objectives of the project. EPA guidelines were then followed to calculate the total annual NOx emissions for each unit. The equipment population was classified into categories in the source category code (SCC) that EPA defined. A further set of criteria enabled identification of priority equipment categories for emissions testing under Phases 1 and 2 of the project. These criteria were the:
• total NOx emissions in FY 2007; • total average NOx emissions over FY 2005-2007; and • number of units operating statewide, in nonattainment, and in Early Action Compact
(EAC) counties. It was found that the primary equipment categories were graders and rubber-tire loaders, and excavators were the secondary category. Researchers recommended and agreed with the PMC to select three pieces of equipment (one each from emissions tiers 0, 1, and 2) from each category for emissions testing during Phases 1 and 2 of the project. Researchers proposed three technologies (detailed in Chapter 4) for testing. The technology showing the best cost-effectiveness of NOx emissions reduction among the three will be tested on graders, rubber-tire loaders, and excavators for baseline and “degreened” conditions (i.e., before and after application of the selected technology), and long-term testing.
NON-ROAD CONSTRUCTION EQUIPMENT DATABASE
TxDOT provided their non-road construction equipment database in a file along with another file containing format descriptions and brief explanations of data attributes. TTI researchers examined the database to select equipment for this project. This section describes the database and also discusses the database refining criteria.
Database Description
The database included a wealth of information for a total of 3915 pieces of non-road equipment owned by TxDOT. The equipment consisted primarily of road construction machinery along with some equipment used by TxDOT for other functions, such as sweepers. The databases was

18
last updated on August 31, 2007, thus included complete FY 2007 information, as well as complete information for the previous two fiscal years, FY 2006 and FY 2005. The attributes for each piece of equipment include:
• static attributes (for example, o ID number, o classification, o model year, o fuel type, o engine horsepower, o etc.) and
• dynamic attributes, which varied by fiscal year (for example, o status, o hours of usage, o gallons of fuel used, o etc.)
A data dictionary text file accompanied with the database file provides explanations of the attribute fields, codes, and abbreviations used for data entry.
Database Refinement Criteria
Researchers established criteria to refine the universe of machinery to those pieces that fulfilled the goals and objectives of this project, specifically:
• diesel equipment only (not gasoline, nor electric); • equipment designated as currently in use only (status of ‘Voucher Processed’); • equipment without missing key attributes; e.g., engine horsepower data; and • equipment that had hours of usage in at least one of the past three fiscal years (i.e., the
years included in the database). As a result, Researchers removed 741 pieces of equipment from the initial raw population of 3915 pieces because they did not conform to one or more of these criteria, reducing the population to a total of 3174 pieces of equipment.
NOX EMISSIONS FROM TXDOT EQUIPMENT
NOx emissions from the refined 3174 pieces of TxDOT equipment were calculated by the same method that is used in the EPA NONROAD 2005 model. The following sections provide detailed methodology and the calculated results.

19
Emissions Calculation Methodology
Researchers followed the EPA’s procedures and guidelines (18) were followed to calculate the NOx emissions for each piece of equipment in FY 2007 and the average annual NOx emissions over the past three fiscal years, according to the hours of usage in each year. These are the same guidelines and data used in EPA’s NONROAD 2005 model that estimates air pollution from non-road sources. The emissions tier of each piece of equipment was determined from Table A1 of the guidelines, according to the engine horsepower and model year. Table A2 then provided the steady-state NOx emissions factor in grams/hp-hr (EFss) for each piece of equipment, according to its engine horsepower rating and tier. For pre-1988 (‘Base’ tier) engines greater than 50 hp, the guidelines and NONROAD 2005 use the emission factors in the Nonroad Engine and Vehicle Study (NEVES; 23). The NOx Transient Adjustment Factor (TAF) for each piece of equipment, according to its EPA Source Category Code and tier, was then determined from Table A3 of the guidelines. Although the equipment had already been classified by TxDOT into its own categories by type, the equipment had to be reclassified into EPA’s SCCs to utilize the table and obtain the TAF. The Deterioration Factor (DF) was calculated in a multi-step fashion based on data from Table A4 and two NONROAD default input files, which are based on national non-road equipment activity data, Activity.dat and Uspop.dat, which are available from EPA’s NONROAD2005a Core Model and Data Files (24). The DF was calculated as:
DF = 1 + A × (Cumulative hours of activity × Load factor / Median life at full load, hrs) Where: A = NOx Relative Deterioration Factor (Table A4, by tier)
Cumulative hours of activity = Age × Activity, hrs/year (Activity.dat, by SCC) where Age = 2007 – Model Year + 1 (equipment database)
Load factor (Activity.dat, by SCC) Median life at full load, hrs (Uspop.dat, by SCC and horsepower) The adjusted NOx emissions factor for each piece of equipment, in grams/hp-hr, was then calculated as:
EFadj = EFss × TAF × DF The NOx emissions in FY 2007, 2006, and 2005 for each piece of equipment were then calculated according to the hours of usage in each year as:
NOx Emissions, grams = EFadj × Horsepower × Hours of Usage

20
The average NOx emissions according to the hours of usage reported for each piece of equipment over each of the last three years — FY 2005, 2006 and 2007 — were then calculated. Finally, the FY 2007 NOx emissions and the average NOx emissions in FY 2005-2007 were summed for all equipment, to arrive at total NOx emissions in FY 2007 and total average NOx emissions over FY 2005-2007 of the non-road equipment fleet.
Emissions Results
Table 3 shows the total NOx emissions in FY 2007, the total average NOx emissions over FY 2005-2007, and the number of units operating statewide, in nonattainment, and in EAC counties by the equipment’s SCC. Researchers used EPA attainment designations (25, 26) at the time this analysis was conducted were used.
Table 3. Total NOx Emissions by Equipment Category and County Status.
All Counties Nonattainment Counties Only EAC Counties Only
Total NOx Emissions (ton)
Total NOx Emissions (ton)
Total NOx Emissions (ton)
EPA Source Category Code
# of
units* FY 07 Average over FY 05-07
# of
units* FY 07 Average
over FY 05-07
# of
units* FY 07 Average
over FY 05-07
Pavers 14 1.4 1.7 3 0.4 0.5 2 0.0 0.0 Rollers 646 33.5 38.3 73 2.7 3.4 36 1.6 1.9
Trenchers 15 0.1 0.1 3 0.0 0.0 2 0.0 0.0 Excavators 144 56.1 56.3 25 8.3 8.5 19 7.3 7.4
Cranes 21 4.7 4.5 1 0.1 0.1 2 0.0 0.0 Graders 545 133.1 146.1 64 11.1 12.6 38 5.9 6.3
Rubber-Tire Loaders 782 111.1 116.6 108 13.6 14.6 51 5.7 5.7 Tractors/Loaders/Backhoes 596 37.5 39.3 62 4.8 4.7 51 1.9 2.2
Off Highway Tractors 55 6.0 7.4 10 1.3 1.5 9 0.8 0.9 Other Construction
Equipment 54 22.7 26.7 10 2.4 3.1 2 2.4 2.4
Sweepers/Scrubbers ** 298 24.0 23.8 32 1.9 2.2 15 1.0 1.0 SUM 3170 430.2 460.8 391 46.6 51.2 227 26.6 27.8
* Excludes 3 Cement & Mortar Mixers and 1 Scraper. ** Categorized as industrial equipment in EPA SCC.

21
Figures 1, 2, and 3 show the total average NOx emissions over FY 2005-2007 and the number of units for each of the 11 equipment categories operating statewide (all counties), in nonattainment counties, and in EAC counties, respectively.
SCC
Pavers
Rollers
Trenchers
Excava
tors
Cranes
Graders
Rubber Tire
Loaders
Tractors/
Loaders/Backh
oes
Off Highway T
ractors
Other Constr
uction Equipment
Sweepers/Scru
bbers
tota
l NO
x em
issi
ons
(tons
)
0
20
40
60
80
100
120
140
160
num
ber o
f uni
ts
0
200
400
600
800
1000
Average 05-07Units
Figure 1. Total Average FY 2005-2007 NOx Emissions by Equipment Category –
Statewide.

22
SCC
Pavers
Rollers
Trenchers
Excava
tors
Cranes
Graders
Rubber Tire
Loaders
Tractors/
Loaders/Backh
oes
Off Highway T
ractors
Other Constr
uction Equipment
Sweepers/Scru
bbers
tota
l NO
x em
issi
ons
(tons
)
0
2
4
6
8
10
12
14
16
num
ber o
f uni
ts
0
20
40
60
80
100
120
Average 05-07Units
Figure 2. Total Average FY 2005-2007 NOx Emissions by Equipment Category –
Nonattainment Counties.

23
SCC
Pavers
Rollers
Trenchers
Excava
tors
Cranes
Graders
Rubber Tire
Loaders
Tractors/
Loaders/Backh
oes
Off Highway T
ractors
Other Constr
uction Equipment
Sweepers/Scru
bbers
tota
l NO
x em
issi
ons
(tons
)
0
2
4
6
8
num
ber o
f uni
ts
0
10
20
30
40
50
60
Average 05-07Units
Figure 3. Total Average FY 2005-2007 NOx Emissions by Equipment Category – EAC
Counties.

24
CRITERIA AND EQUIPMENT CATEGORY PRIORITY LIST
Researchers developed three major criteria to enable the selection of the equipment categories. In the order of importance, these criteria were:
• total NOx emissions in FY 2007 and total average NOx emissions over FY 2005-2007, • number of units operating in all counties statewide, and • number of units operating in nonattainment or EAC counties only.
When these criteria were applied to all 11 categories, the first two greatest NOx emitting equipment categories (in all Texas counties as well as in nonattainment and EAC counties) were graders and rubber-tire loaders, as shown graphically in the previous section. Excavators ranked third overall, but ranked first in total average NOx emissions over FY 2005-2007 in EAC counties. However, they were considered of secondary importance based on the large differences in total emissions and the lesser number of units statewide, in comparison with the first two categories. Table 4 presents the priority list, and further classifies the equipment within each category by emissions tier.
Table 4. Priority Equipment Categories by Tier and County Status.
All Counties Nonattainment Counties Only
EAC Counties
Only Total NOx Emissions
(ton)
EPA SCC Tier
# of units (1471)* FY 07 Average over
FY 05-07
# of units (197)* # of units (108)*
Base 25 2.5 3.5 1 8 Tier 0 198 51.3 57.6 24 11 Tier 1 187 53.3 59.0 22 9 Tier 2 114 23.9 24.0 13 10 Tier 3 21 2.1 1.9 4 0
Graders (TxDOT Classes: 90010/20/30/40)
Total 545 133.1 146.1 64 38 Base 22 2.7 2.8 1 6 Tier 0 250 45.4 48.9 33 15 Tier 1 312 40.4 43.3 43 22 Tier 2 174 21.6 20.6 29 8 Tier 3 24 1.0 1.0 2 0
Rubber-Tire Loaders (TxDOT Classes: 110010/20,
115000/10/20/30/40/50)
Total 782 111.1 116.6 108 51 Base 2 0.0 0.1 0 0 Tier 0 26 12.4 11.1 0 2 Tier 1 75 33.3 35.9 19 10 Tier 2 37 9.9 8.6 6 5 Tier 3 4 0.6 0.6 0 2
Excavators (TxDOT Classes: 70010/20,
75010/20/30)
Total 144 56.1 56.3 25 19 * Total number units of all graders, loaders, and excavators are in parentheses.

25
Based on the results in Table 4, TTI’s recommendation of equipment selection in each category for each set of emissions testing (baseline and after-treatment) was:
• graders: three pieces of equipment (one each from tiers 0, 1, and 2); • rubber-tire loaders: three pieces of equipment (one each from tiers 0, 1, and 2); and • excavators: three pieces of equipment (one each from tiers 0, 1, and 2).
The PMC accepted this recommendation, and TTI researchers will perform the testing with the selected equipment.
TEST PROTOCOL
Based on the emissions calculation results and the three technologies recommended in Chapter 4 (Researchers will use two technologies during the Phase 1 testing in FY 2008 and another during Phase 2 in FY 2009), a test protocol was developed and discussed with the PMC. The finalized protocol has two parts of testing, one to be conducted in Phase 1 and the other in Phase 2. The testing protocol in Phase 2 is divided into two different scenarios depending upon the results of the first set of testing. The following are summaries of the proposed test protocol:
• equipment categories: three (graders, rubber-tire loaders, and excavators); • individual pieces of equipment to be tested for each set: three (for graders and
rubber-tire loaders, one each from tiers 0, 1, and 2; for excavators, one from tier 2 and two from tier 1);
• technologies: three (all three technologies will be applied on only graders; for loaders and excavators, one or two best technologies will be applied depending on test results);
• test modes for each unit: three (baseline, “degreened” (conditioned), and long-term; • number of test sets: seven (three units each set); and • total number of tests: 39 or 45 (18 for Phase 1 and 21 or 27 for Phase 2) depending
on test results. The following two sections describe the details of the test protocol for Phase 1 and Phase 2.

26
Phase 1 Testing
As Figure 4 shows, Phase 1 testing consists of three test sets. Researchers will perform the first two sets of testing with two technologies (details of their selection are discussed in Chapter 4) on a total of six graders; i.e., each technology is applied for three graders. Based on the results of testing before and after the applied technologies, the technology (either technology 1 or 2 in Figure 4) showing the better result in cost-effective NOx emission reduction will then be applied on three loaders (test set # 3 in Figure 4) to determine if it shows similar results in NOx emission reduction on loaders as well. After testing (both baseline and “degreened” tests) is completed, the tested units will continue in their normal operations with the applied technologies. A total of 18 (baseline and “degreened”) tests will be performed in Phase 1. Prior to testing, TTI will identify specific units for actual testing from the TxDOT database mentioned earlier, and discuss the selection with the PMC.
Test Set #1 (6 tests total)• Category: Grader
• Technology 1• 3 units in Tiers 0, 1, & 2
(G1, G2, G3; one unit each tier)*• 2 tests for each unit
(baseline & degreened**)
Test Set #2 (6 tests total)• Category: Grader
• Technology 2• 3 units in Tiers 0, 1, & 2
(G4, G5, G6; one unit each tier)*• 2 tests for each unit
(baseline & degreened**)
Based on test results,better technology will be applied on another
category for testing ***
Test Set #3 (6 tests total)• Category: Loader• Better technology
• 3 units in Tiers 0, 1, & 2(L1, L2, L3; one unit each tier)*
• 2 tests for each unit(baseline & degreened**)
* TTI will identify specific units for testing (Task 5) ** “Degreened” tests will be performed after degreening time, which is required for the applied technology to be effective after initial adjustment period upon installation. *** The units, on which the better technology is applied, may be tested later for long-term effects (after 6 months or 300 hours of operations).
Figure 4. Phase 1 Testing Flow Chart.
Phase 2 Testing
Researchers will perform Phase 2 testing in FY 2009. Phase 2 testing will consist of four test sets. First, the third technology (technology 3 in Figure 5, which is also discussed in Chapter 4) will be tested with three additional graders: test set #4 in Figure 5. Based on results of the first test set (test set #4 in Figure 5; baseline and “degreened” tests), researchers will perform three additional sets of test following either scenario (a) or (b) in Figure 5.

27
(a) Scenario A
Test Set #4 (6 tests total)• Category: Grader
• Technology 3• 3 units in Tiers 0, 1, & 2
(G7, G8, G9; one unit each tier)*• 2 tests for each unit
(baseline & degreened)
If the better technology(either technology 1 or 2) is better than
technology 3 Test Set #7 (3 tests total)• Category: Loader
•3 units tested with better technology(L1, L2, L3)
• long-term test only**
Test Set #5 (9 tests total)• Category: Excavator
• Better technology• 3 units in Tiers 0, 1, & 2
(E1, E2, E3; one unit each tier)*• 3 tests for each unit
(baseline, degreened & long-term**)
Test Set #6 (3 tests total)• Category: Grader
•3 units tested with better technology(either G1, G2, G3 or G4, G5, G6)
• long-term test only**
(b) Scenario B
Test Set #4 (6 tests total)• Category: Grader
• Technology 3• 3 units in Tiers 0, 1, & 2
(G7, G8, G9; one unit each tier)*• 2 tests for each unit
(baseline & degreened**)
If technology 3 isbetter than the better technology
(either technology 1 or 2)
Test Set #6 (9 tests total)• Category: Excavator
• Technology 3• 3 units in Tiers 0, 1, & 2
(E1, E2, E3; one unit each tier)*• 3 tests for each unit
(baseline, degreened & long-term**)
Test Set #7 (3 tests total)• Category: Grader
•3 units tested with technology 3(G7, G8, G9)
• long-term test only**
Test Set #5 (9 tests total)• Category: Loader
• Technology 3• 3 units in Tiers 0, 1, & 2
(L4, L5, L6; one unit each tier)*• 3 tests foreach unit
(baseline, degreened & long-term**)
* TTI will identify specific units for testing during the actual testing (Task 5). ** “Degreened” tests will be performed after degreening time, which required for the applied technology to be
effective after initial adjustment period upon installation. *** The units, on which the best technology is applied, may be tested later for long-term effect (6 months or
500 hours). Figure 5. Phase 2 Testing Flow Chart: (a) Scenario A: When the New Technology Tested in Phase 2 Performs Best, (b) Scenario B: When the Better Technology Identified in Phase 1
Performs Best.

28
When the new technology (technology 3 tested in test set #4) on the graders shows better results than previously tested technologies (technologies 1 and 2), technology 3 will be applied to three excavators and three additional loaders (six units total), and be tested for their NOx emissions reduction through baseline, “degreened,” and long-term testing. The long-term testing will be performed later after 300 hours or six months of operation, whichever comes first. Also, long-term testing will be performed for the graders tested with technology 3. Based on this scenario, a total of 27 (baseline, “degreened,” and long-term) tests will be performed. However, when the better technology (either technology 1 or 2) identified in Phase 1 shows better cost-effective NOx emissions reduction results than technology 3 on the graders in test set #4, this technology will be applied to three excavators, and be tested for their NOx emissions reduction through baseline, “degreened,” and long-term testing. Also, an additional two sets of long-term testing (test sets #6 and 7 in Figure 5[b]) will be performed for the graders and loaders tested with the best technology to investigate long-term effects of the technology on NOx emissions reduction. A total of 21 (baseline, “degreened,” and long-term) tests will be performed based on this scenario: Scenario B in Figure 5(b).

29
CHAPTER 4: SELECTION OF EMISSIONS REDUCTION TECHNOLOGIES FOR TESTING
The purpose of this task is to investigate fuel and engine technologies for non-road diesel equipment emissions reduction, and to select appropriate technologies for emissions testing in Task 5. The research team conducted a review of numerous technologies, and selected nine of the most popular and/or promising technologies, which are briefly described in Chapter 2. Out of these nine technologies, five technologies were identified as possible candidates for NOx emissions reduction, the primary target pollutant for this project. After careful investigations of the five technologies, lean NOx catalyst technology was excluded from the candidates. With more specific information collected from vendors through the vendor selection procedure (which is described in the “Vendor Selection” section in this chapter), exhaust gas recirculation technology was again excluded. Then, after examining the information, fuel additive and hydrogen enrichment technologies were recommended to the PMC, and selected as the final two technologies for the Phase 1 testing. Also, two vendors (one each for FA and HE) were selected. For Phase 2 testing, selective catalytic reduction (SCR) technology was tentatively selected.
NON-ROAD EMISSIONS REDUCTION TECHNOLOGIES
Diesel emissions controls are generally achieved by either: • modifying the engine design, • treating the exhaust (also referred to as after treatment), • modifying the fuel source, or • a combination of these controls as stated in Chapter 2.
The primary sources for information on diesel emissions control devices and fuel/fuel additives are from EPA, CARB and the Manufacturers of Emission Control Association (1, 2, 3). Several different technologies are currently available for emissions reduction of non-road diesel equipment. Among numerous technologies, the most popular and/or promising emissions reduction technologies were chosen and reported briefly in Chapter 2. Out of the nine technologies discussed, four technologies (diesel particulate filter, diesel oxidation catalyst, closed crankcase ventilation, and biodiesel) are primarily targeted on PM emission reductions. These technologies were excluded from the technology selection because this project is focused on NOx reduction. The remaining five technologies, which reduce NOx emissions in various degrees, were therefore chosen as possible candidates. Table 5 summarizes the five chosen technologies.

30
Table 5. Candidate Technologies for NOx Emissions Reduction. % Reduction* Technology
NOx PM Cost Over 7 Years ($)**
Selective catalyst reduction 75 25 17,000 – 30,000 Lean NOx catalyst 25 0 8,000 – 15,000 Exhaust gas recirculation 40 0*** 5,000 – 10,000 Fuel additives 5 0 500 – 2,500 Hydrogen enrichment 20 NA 6,000 – 10,000 * Some of the reduction percentages shown are estimates from on-road applications when no data were available
for non-road construction equipment. ** Only limited pilot-scale projects have been applied for non-road applications. Costs presented here are based on
estimates from several sources mentioned above including personal contacts with vendors. *** PM emissions will possibly increase, so that another technology, such as a particulate filter, is needed to reduce
PM emissions. Based on reviews of literature including reports from previous TTI studies conducted in cooperation with TxDOT (7, 8) and information from EPA, CARB, MECA, and personal contacts with vendors, the five candidate technologies are described in detail in the following sections. It should be noted that, due to limited resources for non-road construction equipment applications, some information is obtained only from on-road applications and/or non-road non-construction equipment such as emergency generators.
Selective Catalytic Reduction
Description: Using a catalyzed substrate or a catalyst with a chemical reductant, an SCR system converts NOx to molecular nitrogen and oxygen. A reductant (ammonia or urea), which is injected into the exhaust gas, assists in the NOx conversion over a catalyst. When urea is used, urea decomposes thermally in the exhaust to ammonia which serves as the reductant. As exhaust and reductant pass over the SCR catalyst, chemical reactions occur that reduce NOx emissions to nitrogen and water. An SCR system can be combined with a particulate filter for combined reductions of both PM and NOx. However, an SCR system is also effective in reducing hydrocarbon (HC), carbon monoxide (CO), and PM emissions even without any particulate filters. The performance of an SCR system is enhanced by the use of low sulfur (S) fuel. Advantages:
• the system offers the greatest NOx emissions reductions among the candidates – 70 percent or more;
• additional emissions reductions for PM (up to 50 percent), for HC (up to 90 percent), and for CO (up to 90 percent); and
• it is best suited to larger vehicles and equipment due to the need for a small separate tank of chemical reductant.
Disadvantages:
• the system cost is the highest among the candidates ($15,000 - $25,000); • an additional container for reductant and regular refilling of the reductant is needed;

31
• for best performance, an SCR system needs to be optimized by running the engine through a simulation of the operating cycle of the equipment. When actual operations are different from the simulated conditions, the effectiveness of the system decreases;
• by using ammonia as the reductant, ammonia slip (release of unreacted ammonia) may occur when catalyst temperatures are not in the optimal range for the reaction or when too much ammonia is injected into the process; and
• some manufacturers stated that they would not sell an SCR system alone, but would sell an SCR with a PM reduction technology, such as a DPF, which would increase the system cost by 50 percent or more.
Products, Authentication and Verification: Several companies are developing SCR systems, and some of these have been applied and tested in pilot-scale projects. Although stand-alone SCR systems have been successfully applied on boilers, such as large utility boilers, industrial boilers, and municipal solid waste boilers, SCR systems, in most cases, have been applied or tested with other PM technologies such as DPF and DOC for construction equipment. Currently, there are no stand-alone SCR systems verified by EPA or CARB for non-road construction equipment applications. However, in conjunction with a DOC, one product (Extengine ADEC System) is currently verified by CARB:
• Extengine ADEC System: o CARB Level 1 Verified for 1991-1995 model years off-road Cummins 5.9-liter
150-200 Horsepower engines (applications to rubber-tired dozers, loaders, and excavators, and utility tractor rigs) with diesel (S < 500 ppm): Reductions of PM: 25 percent or more, and NOx: 80 percent. Detailed information is available on the CARB website (12).
Cost (system): The cost of an SCR system ranges from $15,000 to $25,000. With a DPF system, the cost could range from $23,000 to $33,000. Installation, Maintenance, and Operation: Installation time ranges from two to five days depending on type of equipment, engine, exhaust, etc. The cost for installation ranges from $2,000 to $5,000. For maintenance, there is an additional cost for the reductant (e.g., $0.80/gal for urea), which needs to be refilled periodically.
Lean NOx Catalyst
Description: An LNC system removes NOx from the exhaust by catalytically reducing NOx. Under lean conditions, an LNC uses diesel fuel as a reductant, which is injected into the exhaust gas to help reduce NOx over a catalyst. The NOx is converted to N2O, CO2, and H2O. Without the added fuel and catalyst, NOx reduction reactions would not occur because of excess oxygen present in the exhaust. Advantages: Currently, peak NOx conversion efficiencies typically are about 25 percent. However, some manufacturers have claimed conversion efficiencies of over 90 percent in theory.

32
Disadvantages: The main disadvantage of the system is that it has not been fully developed although some commercial products are currently available. In addition, LNC systems require supplemental fuel injection, which can cause a 4-to-7 percent fuel penalty. Products, Authentication and Verification: Some companies are developing LNCs. A few companies including Cummins are manufacturing commercial products. Currently, there are no LNC systems (either stand-alone or with other technologies) verified by EPA or CARB for non-road construction equipment applications. However, in conjunction with a DPF, one product (Cleaire Longview™ System) is currently verified by CARB for on-road applications; information on this product is available from the CARB’s website (27). Cost (system): The cost of an LNC system ranges from $6,500 to $10,000. Installation, Maintenance and Operation: Installation time ranges from one to three days depending on type of equipment, engine, exhaust, etc. The cost for installation ranges from $1,000 to $3,000. For operation, there is an additional cost for fuel as the reductant: about 5 percent (up to 10 percent).
Exhaust Gas Recirculation
Description: Through an EGR valve, an EGR system accomplishes NOx emissions reductions by allowing exhaust gases to be recirculated into the intake manifold. Because the exhaust stream is composed of inert gas, blending some percentage of that gas into the intake mixture lowers the combustion temperature and thus reduces the formation of NOx. During these recirculation processes, PM emissions usually increase, so that EGR systems require other technologies, such as a DPF, to reduce the increased PM emissions. Advantages: The manufacturers claim the following advantages:
• NOx emissions are reduced by up to 50 percent; and • on the basis of NOx reduction per unit cost, the EGR system is more cost effective than
an SCR. Disadvantages:
• the EGR system increases PM emissions, which requires the EGR systems to be used in conjunction with other technologies, such as a DPF;
• the EGR system also increases fuel consumption (0-to-5 percent fuel penalty); and • when used with filters, problems can occur between the engine and the EGR system that
can lead to filter failure, and the cost for the system will increase. Products, Authentication and Verification: EGR systems are not yet widely applied. However, tests are continuously being performed for new commercial vehicles as well as retrofits. Currently, there are no EGR systems (either stand-alone or with other technologies) verified by EPA or CARB for non-road construction equipment applications. However, in conjunction with a DPF, one product (CleanAIR EGR/PERMIT™ DPF DECS) is conditionally verified by CARB for stationary generator, and another product (Johnson Matthey, Inc. EGRT™ System) is

33
currently verified by CARB for on-road applications. Information about these products is available on the CARB website (28, 29). Cost (system): The cost of an EGR system ranges from $4,000 to $8,000. Installation, Maintenance, and Operation: Installation time ranges from one to four days depending on the type of equipment, engine, exhaust, etc. The cost for installation ranges from $1,000 to $2,000.
Fuel Additives
Description: An FA is a product for use in conventional gasoline and diesel fuels to: • improve the combustion characteristics of the fuels, • to reduce emissions, and • to increase fuel efficiency and engine power at a modest cost to the user.
FA manufacturers claim that their products can reduce emissions of NOx, HC, PM and/or CO up to 25, 25, 50, and 30 percent, respectively. However, most of these claims are not officially verified or certified. Advantages: FA manufacturers claim the following advantages. However, a single FA will have only some (but, not all) of the advantages listed below:
• ease of use (i.e., there is no need to install an additional system and no additional installation costs);
• reduces additional emissions of other pollutants (PM, CO, and HC); • increases cetane number by up to 6; • decreases fuel consumption by about 3 to 15 percent; • protects and cleans fuel injectors and pumps; • increases engine power at the same or lower engine speed; and • stabilizes stored fuel, especially, biodiesel.
Disadvantages:
• NOx reduction efficiency (about 5 percent) is the lowest among all candidates; • emissions of one or more pollutants can be increased while reducing emissions of other
pollutants and increasing fuel efficiency; and • predetermined amount of FAs need to be added when refueling unless an FA pre-mixed
fuel is used. Products, Authentication and Verification: Many companies are manufacturing FAs including fuel borne catalysts (FBCs), which often are conjunctively used with a DPF. Manufactures often claims that their products can reduce more than 10 percent of NOx, HC, PM and/or CO emissions, and decrease fuel consumption by more than 15 percent. However, some product claims may be exaggerated, especially, for emissions; most of their claims are not supported by verifiable data. For fuel efficiency, the manufacturers’ claims are mostly not based on certified tests (e.g., reports from independent research institutes following standard procedure such as

34
SAEJ1321) (30). Currently, there are no FAs verified by EPA or CARB except that EPA verifies cetane enhancers as verified retrofit technologies for on-road applications with 0-to-5 percent NOx reduction. However, EPA does not endorse the use of any particular company’s product. Cost and Operation: Costs for FAs range from $5 to $25 for each gallon. For operation, usually less than 1 percent of the product volume is needed to treat fuel. The additives are either pre-mixed with the fuel at the depot or via a dosing unit fitted to the equipment.
Hydrogen Enrichment
Description: HE systems reduce engine exhaust emissions by creating a better flame front in the engine. Using an on-board hydrolysis device or catalytic fuel reformer, hydrogen gas is generated from a small amount of water or diverted fuel. The generated H2 is added into the fuel intake manifold, and delivered into the cylinders with the fuel. The hydrogen-rich intake charge creates a better flame front because the mixture is more flammable. Because oxygen gas is also generated during the hydrolysis or reformation, the combined hydrogen and oxygen gases provide a better combustion on the power stroke, which results in emissions reductions. This cooler but more complete burn reduces the amount of diesel needed to power the engine, so that fuel consumption also decreases. Advantages: The manufacturers’ claim the following advantages:
• emissions reductions of up to 25 percent for NOx and 35 percent for CO; • cleans the inside of the engine and removes deposits on the cylinder walls; • decreases fuel consumption by about 10 percent; and • increases engine power and torque.
Disadvantages:
• additional space is needed for the hydrogen-generating device; • for operations, an HE system needs battery power from the equipment or an additional
generator; and • regular refilling of deionized water is needed.
Products, Authentication and Verification: A few companies are manufacturing HE systems. This is new technology, thus only a limited number of tests have been performed. Currently, there are no HE systems verified by EPA or CARB. Cost (system): The cost of an HE system ranges from $5,000 to $8,000. Installation, Maintenance, and Operation: Installation time ranges from one to three days depending on type of equipment, engine, exhaust, etc. The system needs battery power from equipment. The cost for installation ranges from $1,000 to $2,000. For maintenance, there is an additional cost for deionized water (e.g., $1.00/gal for 160 hours of operation), and the deionized water must be refilled periodically.

35
TECHNOLOGY SELECTION
For selecting two technologies for Phase 1 testing and another technology for Phase 2 testing (as described in the “Test Protocol” section in Chapter 3), TTI researchers examined the five candidate technologies. Because this project focuses on NOx emission reductions, costs for NOx emissions reduction were first examined. Then, other critical factors like applicability to non-road equipment were considered based on specific information collected from vendors and other personal contacts. After discussion with and approval from the PMC, FA and HE technologies were selected for Phase 1 testing, and SCR technology is tentatively selected for Phase 2 testing. The SCR technology will be selected for Phase 2 testing as long as it is provided free-of-charge for this project. If any other emerging and promising technologies are available in the market when TTI researchers perform Phase 2 testing, then, one of these technologies can be selected instead of SCR for Phase 2 testing. For the alternative selection of the technology, the technology does also need to be provided free-of-charge.
NOx Emissions Cost-Effectiveness Analysis
For the NOx emissions cost-effectiveness analysis, costs for NOx removal (CNOx) are calculated using the following equation:
CNOx = Ctech/(ENOx × RNOx) Where: Ctech = Costs for system, installation and operation of a technology (over seven years);
ENOx = total NOx emissions of an off-road unit for seven years; and RNOx = NOx emissions reduction rate.
The seven years in the above equation were determined based on information collected from literature and vendors, as discussed previously. Based on the information, the candidate technologies would operate for seven years without any major failure or problems, requiring only regular maintenance, if any. Table 6 shows NOx reduction rates (taken from Table 1 in this report) and costs (average values from the cost ranges in Table 5) for the five candidate technologies. It should be noted that the analysis presented here shows preliminary results to assist with technology selection for Phase 1 testing. The NOx reduction rates, RNOx, shown in Table 6 are estimates based on the collected information, not from actual testing. The actual costs for the technologies applied for equipment will vary from one piece of equipment to another. Researchers will perform more accurate cost-effective analysis in Task 6 after obtaining actual testing data and acquiring actual equipment-specific costs.
Table 6. NOx Reduction Rates and Costs of the Candidate Technologies.
Technology NOx Reduction Rate Cost Over 7 Years
Selective catalyst reduction 0.75 $23,500 Exhaust gas recirculation 0.40 $7,500 Lean NOx catalyst 0.25 $11,500 Hydrogen enrichment 0.20 $8,000

36
Technology NOx Reduction Rate Cost Over 7 Years
Fuel additive 0.05 $1,500 Table 7 shows the calculated costs for NOx removal over seven years using the NOx reduction rates and the costs from Table 6 along with total NOx emissions (per year and over seven years) for Tier 0, 1, and 2 graders, rubber-tire loaders, and excavators.
Table 7. Results of NOx Removal Costs (CNOx) for All Candidate Technologies.
Units
Total NOx Emissions
(tons; FY07)
Total NOx Emissions for each
unit over 7 years (tons)
SCR EGR LNC HE FA
Tier 0 198 51.3 1.81 17,274 10,337 25,360 22,052 16,539Tier 1 187 53.3 1.99 15,713 9,403 23,068 20,059 15,044Tier 2 114 23.9 1.47 21,320 12,758 31,300 27,218 20,413Tier 0 250 45.4 1.27 24,658 14,756 36,201 31,479 23,609Tier 1 312 40.4 0.91 34,592 20,700 50,784 44,160 33,120Tier 2 174 21.6 0.87 35,994 21,539 52,842 45,949 34,462Tier 0 26 12.4 3.33 9,407 5,629 13,810 12,009 9,006Tier 1 75 33.3 3.10 10,096 6,042 14,822 12,889 9,667Tier 2 37 9.9 1.87 16,750 10,023 24,591 21,383 16,037
20,645 12,354 30,309 26,355 19,766
Graders
Rubber Tire
Loaders
Average
CNOx ($/1 ton of NOx reduced)ALL COUNTIES
Tier
EPA Source
Category Code (SCC)
Excavators
As shown in Table 7, costs for reducing one ton of NOx emissions, CNOx, are the lowest for EGR followed by FA, SCR, HE, and LNC, respectively. From the lowest amount, the costs are $12,354 for EGR, $19,766 for FA, $20,645 for SCR, $26,355 for HE, and $30,309 for LNC for one ton of NOx removal (on average for graders, rubber-tire loaders, and excavators combined). For an EGR system, however, an additional PM control device, such as a DOC or a DPF, is needed as discussed previously. Based on information obtained at this stage of the project, no vendors have supplied an EGR + DOC system. Considering the addition of a DPF in an EGR system, the resulting system cost increases by about $8,000, which totals $25,532 for CNOx for an EGR system with a DPF. Thus the final CNOx costs considered in this analysis are $19,766 for FA, $20,645 for SCR, $25,532 for EGR+DPF, $26,355 for HE, and $30,309 for LNC, respectively. As previously stated, Ctech used for calculating CNOx can vary up to about ± 30 percent depending on the ranges of Ctech estimates in Table 5. Comparing FA, which has the lowest CNOx, SCR, EGR+DPF, and HE are in the range of about 30 percent variation. CNOx for LNC is more than 50 percent higher than that of FA. In addition, LNC has not been used much in off-road applications or on-road applications. Therefore, TTI researchers excluded LNC technology from the final selection.

37
Evaluation for Final Technology Selection
With limited information currently available from vendors and other sources, Table 8 lists CNOx, RNOx, and critical factors for technology selection of the final four candidates.
Table 8. Considering Factors for Final Candidate Technologies.
Technology CNOx RNOx Critical Factors
FA $19,766 0.05 RNOx is mostly based on vendor’s claims, so that actual testing results can be smaller.
SCR $20,645 0.75 Addition of DPF increases CNOx by 34 percent.
EGR+DPF $25,532 0.40 Some vendors stated that EGR technology is not suitable for non-road construction applications.
HE $26,355 0.20 RNOx is mostly based on vendor’s claims, so that actual testing results can be smaller or greater.
As shown in Table 8, TTI researchers found that the followings critical issues need to be considered:
• With 0.05 of RNOx (i.e., 5 percent of NOx reduction), FA shows the least amount of CNOx. However, based on TTI’s experiences on FAs testing, it is known that RNOx could be much smaller, resulting in an increased CNOx value. For example, 3 percent of NOx reduction instead of the 5 percent assumed increases CNOx to $32,944, which is higher than that of LNC.
• SCR shows the highest RNOx and the second lowest CNOx. However, RNOx can be decreased if an SCR system is not optimized. Additionally, depending on vendors, CNOx will increase to $27,673 with the addition of a DPF, making the cost higher than that of HE.
• RNOx for an EGR system (EGR+DPF) is the second highest, and there are no additional system costs because a DPF is already included. However, EGR technology has been scarcely applied on non-road construction equipment. In addition, TTI researchers collected information that one application (among few) of an EGR on non-road construction equipment was not successful, and a vendor who sells EGR+DPF systems for on-road applications stated his belief that EGR technology is not appropriate for non-road construction equipment.
• HE shows the highest amount of CNOx with 20 percent NOx reduction. Because HE has not been applied for non-road construction equipment, the RNOx values may deviate significantly from 0.20. If RNOx is more than 0.2, CNOx will decrease. For example, 0.25 of RNOx decreases CNOx to $21,084, which is close to those of SCR and FA.
Based on the current, but limited, cost information, NOx reduction rates, applicability to non-road construction equipment, and specific issues stated above, TTI researchers selected FA and HE technologies for Phase 1 testing. The two main reasons for excluding EGR+DPF technology were testimonial of a city official that their applications of EGR systems on non-road construction equipment had not been successful and vendors’ statement that they believed that EGR technology is not appropriate for non-road construction equipment. For SCR technology, TTI researchers had difficulties in finding vendors who would supply a maximum of nine SCR

38
systems (total costs would be up to $300,000) free-of-charge, so that SCR was excluded for Phase 1 testing. However, it is the best candidate for Phase 2 testing currently, mainly because of the highest NOx reduction rate. After additional investigations of financial applicability of SCR on TxDOT equipment and the possibility of other emerging and promising technologies in the market being available, the final selection of technology for Phase 2 will be determined at a later date after discussions with the PMC.
VENDOR SELECTION
TTI researchers investigated vendors extensively for the five candidate technologies: EGR, FA, HE, LNC, and SCR. The researchers contacted a large number of vendors and asked them general and specific questions about their technologies and products. After careful examination of the responses, some of them were used for the technology selection while others for vendor selections. For final vendor selection for FA and HE technologies, more specific questions regarding costs, emissions reduction data, and willingness to participate in the project were asked to more than 10 vendors. After examining the respondents’ answers, two candidates (Carbon Chain Technologies Ltd. for FA and GoGreen Fuel Inc. for HE) were recommended to the PMC and chosen for Phase 1 testing. For vendor selections, TTI researchers and TxDOT participants agreed during the progress meetings that:
• TTI would prepare questionnaires for technologies and agreements between participants and TTI, and submit them to the PMC for review;
• TTI would distribute questionnaires and collect the responses from vendors; and • based on the collected information, TTI would recommend one vendor for each
technology. The questionnaires contained both general and specific questions about technologies and vendor’s products. For the FA and HE technologies, two different draft questionnaires were prepared, and are provided in Appendices E and F. After carefully examining the responses (mainly costs [for technology, installation, and maintenance, if any], emission reduction data, and willingness to participate [free of charge and warranty] in this project), two candidates (Carbon Chain Technologies Ltd. for FA and GoGreen Fuel Inc. for HE) were chosen and recommended to the PMC. The PMC approved the recommended vendors for Phase 1 testing. After the vendors had been selected, agreements between TTI and vendors were drafted, and submitted to the PMC for review. The following aspects were covered in the agreements:
• vendors will provide their technologies free of charge; • vendors will install their technologies, and supply any necessary parts or accessories
needed for normal operations free of charge; • if TxDOT is not satisfied with the technology, vendors will uninstall their technologies,
and return TxDOT equipment to its original condition free of charge; • vendors will follow the testing schedule and protocol set by TTI; and • test results will be available to the public; however, there will be no endorsements of the
products or vendors from TxDOT or TTI.

39
CHAPTER 5: DEVELOPMENT OF DUTY CYCLES FOR SELECTED EQUIPMENT
The research team conducted interviews with TxDOT personnel, literature searches, and general web-searches to obtain information on diesel-powered non-road equipment. The research team also visited TxDOT work sites and recorded the activities of selected non-road equipment during their normal operations, and developed simplified and repeatable duty cycles that would replicate actual operating conditions for the selected equipment under TxDOT’s operating conditions. The development of the duty cycles for the selected equipment categories comprised three major steps: methodology selection, site visits and data collection, and duty cycle development. In the methodology selection step, Researchers concluded that a task-based approach would be more suitable for portable emissions measurement system testing, and recommended the approach to the PMC, and the PMC approved it for this study. After selecting the types of equipment for testing, TTI staff members visited TxDOT work sites to collect data regarding the operational characteristics of the selected equipment. These site visits included interviews with equipment operators and project managers as well as observing and recording activities of the selected pieces of equipment during their normal operations. A portable Global Positioning System (GPS) was also installed on the selected pieces of equipment to track their movement and operation distance. Additionally, the research team obtained engine operation data from Eastern Research Group (ERG) — a consulting firm. ERG had collected engine operation data from a sample of TxDOT non-road equipment for a previous research management committee (RMC) project: RMC 0-4576- Emulsified Diesel Emission Testing (31). The data included second-by-second readings of engine speed (rpm), engine load (%), throttle position (%) for a rubber-tire loader and an excavator. These data were used for quality control.
METHODOLOGY SELECTION
Non-road equipment relies on their engines both to operate the equipment and to provide power for attachments such as buckets, shovels, and blades. A duty cycle for non-road equipment is defined as the sequential tasks that are performed by the equipment to produce a unit of output (32). The existing emissions testing procedure for non-road equipment is based on testing the engines on engine dynamometers. For example, the current federal duty cycle for non-road applications is an eight mode steady-state cycle for engine dynamometer testing. The procedure is explained in 40 CFR Part 89 Subpart E (33). In cooperation with the authorities in the European Union, the EPA has also developed a transient driving cycle for mobile non-road diesel engines named Non-Road Transient Cycle (NRTC). The NRTC is a 1200-second long transient cycle developed for dynamometer testing. The developed cycle will be used for certification type approval testing of some non-road diesel engines, with full implementation occurring over six years.

40
PEMS technology provides the capability of emissions measurement under real-world operating conditions. A duty cycle for PEMS testing of non-road equipment can be either task-based or engine-based modes. A task-based cycle is comprised of a sequence of different tasks performed by the equipment and an engine-based cycle consists of a series of steady-state and transient engine loads. The EPA is now considering a more flexible approach for its newest emissions model, motor vehicle emission simulator (MOVES). Three potential methods using PEMS data to generate non-road emission rates for MOVES were investigated by the University of California at Riverside (UCR), Environ Corporation, and North Carolina State University (NCSU) (34). UCR pursued a database approach by constructing macro-, meso-, and micro-level emissions lookup tables based on individual vehicle and duty cycle results. NCSU applied a modal binning approach in which the operational modes of the non-road vehicles were defined based on changes in engine speed and exhaust flow. Finally, Environ Corporation divided the second-by-second PEMS data into a series of micro-trips. The literature shows that the task-based approach is superior when using PEMS technology (35, 36).
GRADERS
A grader, also commonly referred to as a motor grader, is a construction vehicle with a large blade used to create a flat surface. TxDOT uses graders in two major operations: asphalt overlay maintenance, and to spread and level base layer material to create a wide flat surface for asphalt. In order to identify the in-use operational characteristics of TxDOT graders, the research team coordinated site visits to a sample of TxDOT work sites. The visits included a visit to TxDOT’s maintenance office in Brenham followed by a visit to a road maintenance work site on FM 109 located southwest of Brenham. The TTI staff interviewed the site managers, support crew, and equipment operators at both sites. According to the TxDOT operators, the TxDOT graders are mostly (more than 80 percent of their operation time) used for asphalt overlay maintenance operation (hot mix or reclaimed asphalt) and the rest of the time for base layer preparation. The operators stated that both types of operations are similar in terms of tasks and the only difference would be the type of the material they are working with. During the both operations, the graders are used to level the material (asphalt or base material) on a surface in several runs. The leveling task is conducted only in a forward run. If there is not enough space to make a turn at the end of a forward run, the operator would lift the blade and back up to reach the starting point, and then repeat another forward run. Figure 6 shows the blade positions of a grader in forward and backward run maneuvers. The operators stated that when there is enough room for a U-turn maneuver at the end of a forward run, they turn around and perform another forward (leveling) run.

41
Figure 6. Grader Blade Position in forward (left) and backward (right) Movements. The graders that TxDOT operates mostly have six or seven forward and two or three backward gears. The interview with operators also revealed that they only use one gear during a leveling movement (forward run). The gear selection depends on the types of material they are working with. Hot mix asphalt usually needs higher speed, therefore operators often use the third gear, while for other materials they can utilize either the second or the third gear. The graders are usually driven to the work site unless the distance is more than approximately 25 miles. For distances farther than 25 miles they are transported by a flatbed trailer operated by TxDOT. The top speed of the graders in driving mode varies between 20 mph and 30 mph depending on their makes and models. TTI researchers recorded a video footage of grader operation during the site visit. A GPS unit was also installed on the grader to track its movement during the operation. TTI researchers processed the GPS data, video recordings, and information obtained from the operators. Four distinct tasks were identified for a grader: 1 – idling, 2 – leveling maneuver: forward movement with engaged blade (blade in down position), 3 – backward movement with unengaged blade (blade in lifted position), and 4 – driving to/from the work site (forward movement with unengaged blade). For tasks 2 and 3 a grader is operated at speeds lower than 5 mph. When moving to/from the work site (task 4), speeds are usually between 20 mph and 30 mph. For the purpose of this study, all tasks are assumed to occur when the testing equipment is in hot-stabilized conditions. A minimum of 20 minutes of idling is considered at the beginning of the testing to ensure that test vehicles have reached hot-stabilized conditions. A duty cycle was developed to represent a broad range of the operational modes of a TxDOT grader. The proposed duty cycle includes all four tasks that were identified. Table 9 describes the characteristics of the tasks in this duty cycle. Leveling and backup tasks (tasks 2 and 3) need to be executed at a constant speed for each task.

42
Table 9. Tasks of Proposed Duty Cycle for Motor Graders. Task Description Duration (s) Distance (yd)1. Idling Hot-stabilized idling between leveling sub-runs 30 N/A 2. Leveling Forward move with blades engaged in leveling operation N/A 70 3. Backup Reverse move with blades unengaged N/A 70 4. Driving 1 Forward move with blades unengaged at maximum speed N/A 500 5. Driving 2 Forward move with blades unengaged at 20 mph N/A 500
N/A: Not Applicable Two different driving tasks (“driving 1” and “driving 2”) are considered to provide the necessary data for the purpose of emissions comparison. The first driving task is set to reach the maximum speed while the second driving task is set at 20 mph. The maximum-speed driving task intends to capture the emissions characteristics of the equipment at its maximum load while the 20-mph speed intends to provide consistent emissions data for comparison purposes. The driving tests must be executed on a paved road. After idling for about 20 minutes, a TxDOT operator will move the test grader at the beginning of the 500-yard paved portion of the test road designated for the driving task. After at least one minute of idling, the operator will be asked to accelerate the grader to reach the maximum speed, and maintain the speed until the end of the test section. The operator will then reduce the speed at the end of the test section and turn around and stop for at least 30 seconds. Then, the operator will repeat the maximum speed driving task in the opposite direction (i.e., heading back to the starting position). After returning to the starting point and turning around, the grader will stop and idle for at least 30 seconds. Then, there will be another round of driving from the starting position to the other end of the 500-yard paved road, and back to the starting position. However, during this driving task the grader will accelerate to 20 mph and maintain this speed until the end of the paved test road. The grader will stop and idle for at least 30 seconds at the end of the road before driving back to the starting position. After the driving portion of the duty cycle is completed, the leveling/backup parts will be tested. The leveling/backup testing will be performed in a bed of the base material, Colorado rocks. Figure 7 shows the 10-inch deep bed covered with 206 tons of Colorado rocks on a paved road. The size of the bed is 70 yards long and 10 yards wide.

43
Figure 7. Bed for Leveling/Backup Testing.
Each run of the developed leveling/backup duty cycle consists of three leveling sub-runs and one repetition of the driving tasks. Each of the first and second leveling sub-runs consists of two leveling tasks with one backup task in-between. The third sub-run has only one leveling task. At the end of each leveling sub-run, the test grader will turn around and perform another leveling sub-run. A 30-second period of idling has been considered between each leveling sub-run. Figure 8 shows this process graphically.
Figure 8. Leveling Portion of Graders’ Duty Cycle.
After completing leveling/backup parts of the cycle, the grader will return to the starting position for the driving tasks to repeat the entire duty cycle. The entire duty cycle (including driving 1 and 2, leveling, and backup) will be repeated at least three times to obtain statistically meaningful data.
Sub-run 1
Sub-run 3
Sub-run 2
Forward Leveling Backup Movement

44
RUBBER-TIRE LOADERS
A loader is a type of construction equipment machinery that is primarily used to “load” material (e.g., asphalt, dirt, and gravel) onto dump trucks. TxDOT mostly uses its loaders to load asphalt and gravel on trucks to be taken to road construction/maintenance sites. When TTI staff visited TxDOT’s maintenance office in Brenham, they observed normal operations of a TxDOT loader, and interviewed the operator and the manager. According to the operators and operation manager, TxDOT mostly uses its loaders for loading materials onto dump trucks. This task is either performed in TxDOT maintenance offices (yard operation) or at maintenance/construction sites (stockpiling operation). Both operations are the same except for their locations. According to the operators, they do not shift gears during a loading operation. They would use more gears only if they need to drive longer distances. TxDOT loaders have a top speed of 20 to 30 mph depending on makes and models. These rubber-tire loaders are usually driven to construction/maintenance sites if needed, unless the distance is more than around 25 miles. For distances farther than 25 miles they are usually transported by a flatbed trailer operated by TxDOT. Video footage of an operating loader was recorded during the site visit. A GPS unit was also installed on the loader to track its movement during the operation. Additionally, second-by-second engine data for a sample loader was obtained from ERG. The data included second-by-second readings of engine speed (rpm), engine load (%), and throttle position (%) for a rubber-tire loader. TTI researchers processed the GPS data, video recordings, interviews with operators, and engine speed data. Three distinct tasks were identified for a loader: 1 – idling, 2 – loading to a truck, and 3 – driving to/from the work site. Task 2 (loading task) usually involves operation at speeds lower than 5 mph. In contrast, moving to/from the work site (task 3) consists of driving at speeds between 20 mph and 30 mph. For the purpose of this study, all tasks are assumed to occur in hot-stabilized conditions. A minimum of 20 minutes of idling is considered at the beginning of the testing to ensure that test rubber-tire loaders have reached hot-stabilized conditions. A duty cycle was developed to represent a broad range of the operational modes of a TxDOT loader. The proposed duty cycle includes all three tasks that were identified. Table 10 describes the characteristics of the tasks in this duty cycle. The loading task must be executed at a fixed gear. Figure 9 shows a TxDOT loader performing loading operations.
Table 10. Tasks of Proposed Duty Cycle for Rubber-Tire Loaders. Task Description Duration (s) Distance (yd)1. Idling Hot-stabilized idling between loading sub-runs 60 N/A 2. Loading Assimilating loading gravel onto a dump truck N/A N/A 3. Driving 1 Forward move with empty bucket at maximum speed N/A 500 4. Driving 2 Forward move with empty bucket at 20 mph N/A 500

45
Figure 9. Loader Operation; Material Pickup (left) and Loading Truck (right).
In general, the loading tasks include all the maneuvers needed to fully load a dump truck; that is,
• moving forward to the gravel pile with empty bucket at the low position, • loading the bucket with gravels, • moving backward with the loaded bucket, • turning and moving to the dump truck location with loaded bucket, • lifting the loaded bucket, • emptying the gravel into the truck’s box, and • moving back to the gravel pile.
Two different driving tasks (“driving 1” and “driving 2”) are considered to provide the necessary data for the purpose of emissions comparison. The first driving task is set to reach the maximum speed while the second driving task is set at 20 mph. The maximum-speed driving task intends to capture the emissions characteristics of the equipment at its maximum load while the 20-mph speed intends to provide consistent emissions data for comparison purposes. The driving tests must be executed on a straight paved road. After idling for about 20 minutes, a TxDOT operator will move the test loader at the beginning of the 500-yard paved portion of the test road designated for driving tasks. The two driving tasks, driving at maximum speed and at 20 mph, are performed in the same way as for the grader testing discussed previously. After finishing the driving portion of the duty cycle, testing of the loading parts will be conducted. A set of loading tests consists of three sub-loading-runs (sub-runs). Each sub-run consists of four loading maneuvers (i.e., loading four buckets). At the end of each sub-run, the test rubber-tire loader will idle for 60 seconds to simulate the wait time for arrival of the next truck. Figure 10 graphically shows a loading maneuver. The operator must be instructed to empty the bucket at the same height that they usually empty their load (i.e., height above a normal truck box).

46
20 yards
15 y
ards
Material Pickup
Emptying Bucket
a
b
cd
20 yards
15 y
ards
Material Pickup
Emptying Bucket
a
b
cd
Figure 10. Loading Portion of Loaders’ Duty Cycle.
After completing the leveling/backup parts of the cycle, the rubber-tire loader will return to the starting position for the driving task, and the entire duty cycle will be repeated. The duty cycle (including driving 1 and 2, and loading) will be repeated at least three times to obtain statistically meaningful data.
EXCAVATORS
The duty cycle development for excavators is scheduled to be completed in early fall 2008. The Phase 2 report will present the process in detail.

47
CHAPTER 6: MEASUREMENTS AND ANALYSIS OF BASELINE AND TREATMENT LEVEL EMISSIONS
As discussed in the “Test Protocol” section in Chapter 3, two technologies (FA and HE) will be tested with six graders and three loaders (baseline and degreened tests) for Phase 1 testing. Then, another technology (tentatively, SCR) will be tested for Phase 2 testing. Among the three technologies, the technology showing the best cost-effective NOx emissions reduction will be tested with all selected equipment (graders, loaders, and excavators; three pieces each category) based on the scenarios described in the “Test Protocol” section. These final tests will include not only baseline and degreened tests, but also long-term tests. Among the proposed 18 baseline and degreened tests with six graders and three loaders for Phase 1 testing, Researchers have currently performed four baseline tests with four graders. For the four graders, degreened tests have been rescheduled several times due to lack of sufficient operational hours required for the degreened test, and will be performed in FY 2009 along with baseline and degreened tests for the remaining two graders and three loaders. The results of the baseline tests of the four graders are briefly presented in this chapter. More detailed results and analysis will be presented in the final research report as well as in the technical memoranda for Tasks 5 and 6, after completion of all remaining tests in Phase 1 and Phase 2. In addition to the brief test results for the four graders, the following sections also provide information on the test setup, including the test site, the tested TxDOT equipment, and instruments used for testing.

48
TEST SITE
The emissions measurement testing took place at TTI’s test track located at Riverside Campus of Texas A&M University in Bryan, Texas. The Riverside campus is a 2000-acre former Air Force base which is used for research and training purposes. The available test roads consist of a roadway network surrounding old barracks and other base buildings plus the former runways (longest straightaway of 7500 feet). Figure 11 shows an aerial view of available road network at the Riverside Campus and the pictures of the runway on which testing was performed. A section of one runway (marked as a white box in Figure 11(a) and shown in Figure 11(b) and (c)) was used for testing in this study. (a)
(b) (c)
Figure 11. Test Site: (a) Aerial View of the Riverside Campus at Texas A&M University,
(b) Section of the Runway (marked as white box in [a]) Where Testing Took Place, and (c) Section Covered with Base Material for Leveling and Backup Testing.

49
Baseline tests of four graders were performed in the section of the runway shown in Figure 11. In those sections, driving, leveling, and backup testing were conducted. (Details are discussed in Chapter 5.) Figure 12 shows pictures taken during the actual driving testing of a grader on the 500-yard-long paved runway and the leveling testing on the 70-yard long, 20-yard wide, and 10-inch deep Colorado rock bed on a portion of the runway. (a) (b)
Figure 12. Pictures of (a) Driving Testing and (b) Leveling Testing.

50
TEST EQUIPMENT
After examining TxDOT’s non-road construction equipment inventory (described in Chapter 3), six graders were selected for Phase 1 testing. Among the six, four graders were tested for baseline testing. Table 11 provides the details of the four graders. After the baseline testing, these four TxDOT graders were returned to their office locations. The FA and HE technologies have been applied on the graders (FA for graders 1112A and 1468, and HE for 1100A and 1453), while they continue performing their normal operations. After approximately 100 hours of normal operations with the technologies, the four graders will be tested again for degreened testing.
Table 11. Information of the TxDOT Graders Tested for Phase 1 Testing. Equipment No (ID)
Model Year
Engine Tier
Total accumulated usage hours before testing
Applied technology
1112A* 1999 1 3764 FA 1468* 1994 0 4695 FA 1100A* 1998 1 2575 HE 1453* 1993 0 3171 HE * All are GALION-DRESSER 830B graders with 6 cylinder 5.88 liter KOMATSU engines with 144 horsepower (hp).

51
TEST INSTRUMENT
Researchers use two PEMS units simultaneously in this study – one to collect gaseous emissions (NOx, HC, CO, and CO2) and another one to collect PM. For the gaseous emissions, TTI’s SEMTECH-DS unit manufactured by Sensors Inc. is used along with TTI’s electronic exhaust flow meters (EFMs). TTI’s “Axion” system manufactured by Clean Air Technologies International, Inc. (CATI) is used to measure PM. Figure 13 shows photographs of the two PEMS units used in the testing and a photograph of installed PEMS units along with EFM on test equipment. (a) (b)
(c)
Figure 13. Emissions Measurement Instruments (a) SEMTECH-DS Unit, (b) Axion Unit,
and (c) Both Units along with EFM Installed on a TxDOT Grader.

52
SEMTECH-DS
The SEMTECH-DS unit includes a set of gas analyzers, an engine diagnostic scanner, a Global Position System, an exhaust flow meter, and embedded software. The gas analyzers measure the concentrations of NOx (NO and NO2), total hydrocarbons, carbon monoxide, carbon dioxide, and oxygen in the vehicle exhaust. The SEMTECH-DS uses the Garmin International, Inc. GPS receiver model GPS 16 HVS to track the route, elevation, and ground speed of the vehicle on a second-by-second basis. TTI’s SEMTECH-DS uses the SEMTECH EFM to measure the vehicle exhaust flow. Its post-processor application software uses this exhaust mass flow information to calculate exhaust mass emissions for all measured exhaust gases.
Axion
The Axion system is comprised of a gas analyzer, a PM measurement system, an engine diagnostic scanner, a GPS, and an on-board computer. For this study, only the PM measurement system will be used. The PM measurement capability includes a laser light scattering detector and a sample conditioning system. The PM concentrations are converted to PM mass emissions using concentration rates produced by the CATI unit and the exhaust flow rates produced by the SEMETCH-DS unit.

53
TEST RESULTS
Baseline testing of the four graders was performed in June and July 2008. Test results of the graders for all tasks (idling, driving at maximum speed and at 20 mph, leveling, and backup) are shown in Figure 14. Figure 14 shows average emissions rates of gaseous pollutants (CO2, CO, NOx, and HC) and PM as well as equipment speed, exhaust flow rates, and fuel consumption rates during all of the tasks along with their associated error bars. Graders having same Tier engines (1100A [a] and 1112A [b] for Tier 1; 1453 [c] and 1468 [d] for Tier 0) show similar test results. Emission rates of the graders having newer Tier 1 engines (Figure 14[a] and [b]) are lower than those of older Tier 0 ones (Figure 14[c] and [d]). Researchers performed a preliminary NOx emission analysis. The following section briefly describes it. More detailed results (NOx emissions and others) and analysis of the results will be discussed in the final research report as well as in the technical memoranda for Tasks 5 and 6, after the completion of all remaining tests (remaining Phase 1 tests and all of the Phase 2 tests).
(a)
Speed (mph)
Flow (m3/min)
Fuel (ml/s)
CO2 (g/s)
CO (mg/s)
NOx (mg/s; × 0.1)
HC (mg/s)
PM (mg/s; × 10)
0
10
20
30
40
50IdleDriving @ Max SpeedDriving @ 20 MPHLevelingBackup
Figure 14. Baseline Testing Results of Graders (a) 1100A, (b) 1112A, (c) 1453, and (d) 1468.

54
(b)
Speed (mph)
Flow (m3/min)
Fuel (ml/s)
CO2 (g/s)
CO (mg/s)
NOx (mg/s; × 0.1)
HC (mg/s)
PM (mg/s; × 10)
0
10
20
30
40
50IdleDriving @ Max SpeedDriving @ 20 MPHLevelingBackup
(c)
Speed (mph)
Flow (m3/min)
Fuel (ml/s)
CO2 (g/s)
CO (mg/s)
NOx (mg/s; × 0.1)
HC (mg/s)
PM (mg/s; × 10)
0
10
20
30
40
50IdleDriving @ Max SpeedDriving @ 20 MPHLevelingBackup
Figure 14. Baseline Testing Results of Graders (a) 1100A, (b) 1112A, (c) 1453, and
(d) 1468 (Continued).

55
(d)
Speed (mph)
Flow (m3/min)
Fuel (ml/s)
CO2 (g/s)
CO (mg/s)
NOx (mg/s; × 0.1)
HC (mg/s)
PM (mg/s; × 10)
0
10
20
30
40
50IdleDriving @ Max SpeedDriving @ 20 MPHLevelingBackup
Figure 14. Baseline Testing Results of Graders (a) 1100A, (b) 1112A, (c) 1453, and
(d) 1468 (Continued).
NOx Emissions Analysis
NOx emissions of the four TxDOT graders were measured and the results are summarized in Table 12. Also, the calculated NOx emission rates based on the following equation are presented. Calculation of the adjusted NOx emissions factor, EFadj is described in Chapter 3 in detail:
NOx Emissions rate, grams/s = EFadj (g/hp hr) × Horsepower (hp) × (3600 s/1 hr)
As shown in Table 12, NOx emissions rates were highest during the task of driving at maximum speed, and lowest during the idle task. NOx emissions rates during the leveling are usually lower than those during the driving at 20 mph, but always higher than those during the backup. Table 12 shows that calculated emission rates are higher than measured ones during any of the testing tasks, including driving at maximum speed. However, these findings are not conclusive yet. Researchers will discuss the findings in detail after collecting all of the emissions data and completing extensive analyses of the collected data.

56
Table 12. Baseline NOx Emission Rates (g/s). Equipment ID (Engine Tier) 1112A (1) 1100A (1) 1468 (0) 1453 (0) Idle 0.0354 0.0242 0.0076 0.0081 Driving @ Max Speed 0.124 0.0929 0.311 0.274 Driving @ 20 MPH 0.101 0.0802 0.213 0.224 Leveling 0.063 0.087 0.159 0.170 Backup 0.0625 0.0539 0.0924 0.0794 Calculated 0.217 0.217 0.323 0.322

57
CHAPTER 7: FINAL REMARKS The overall goals of this project are to:
• understand how results from the new federal in-use testing program may affect current estimates of oxides of nitrogen (NOx) and other pollutant emissions in particular ozone nonattainment areas,
• evaluate the effectiveness of emerging fuels/fuel additives and retrofit technologies to reduce emissions, so that TxDOT can make cost-effective use of funds available for emissions reductions, and
• identify emissions control strategies, such as changes in operating practices, which may avoid the costs of retrofits.
In order to achieve these goals, TTI researchers set and have been performing the following seven tasks:
• Task 1: State-of-the-Practice Assessment; • Task 2: Select TxDOT Equipment for Testing; • Task 3: Select Emissions Reduction Technologies for Testing; • Task 4: Develop Duty Cycles for Selected Equipment; • Task 5: Measure and Analyze Baseline and Treatment Level Emissions; • Task 6: Compare Results with Existing Data Sources; and • Task 7: Prepare Final Products.
In FY 2008, Tasks 1, 2, 3, most parts of Task 4, and some parts of Tasks 5 and 6 have been completed. The completed tasks are summarized below:
• TTI researchers performed an extensive investigation to obtain information on emissions reduction technologies, non-road emissions reduction case studies, and non-road emissions resources. Based on the analysis of the collected information, FA and HE technologies were selected for Phase 1 testing while SCR technology was tentatively selected for Phase 2 testing. Findings from seven selected studies relevant to this research are also presented in this report. The emissions of TxDOT non-road diesel equipment were calculated in Task 2. Also, various practices proposed and/or implemented for non-road emissions reductions by other states as well as by Texas were investigated and presented.
• TTI researchers investigated TxDOT’s Non-Road Equipment Inventory database
provided by TxDOT, developed criteria focused on NOx emissions and number of units for equipment selection, and selected graders, rubber-tire loaders, and excavators for Phase 1 and 2 testing.
• With the selected three equipment categories and three technologies, TTI researchers
developed a test protocol, which consists of two phases: Phase 1 testing in FY 2008 and Phase 2 testing in FY 2009. For the best technology, as determined during the Phase 1 and 2 testing, all of the baseline, degreened, and long-term tests will be performed with

58
all of the selected equipment categories (graders, loaders, and excavators; three pieces each category).
• For the emissions testing, duty cycles were developed for graders and rubber-tire loaders from a series of collected data including those from site visits to observe operations of TxDOT equipment and interviews of operators and operation managers. The graders’ duty cycle includes driving on a 500 yard paved road, leveling 70 yards of gravel spread on a paved road, and a number of idling periods in between. The loaders’ duty cycle includes driving on a 500 yard paved road, transferring gravel between two piles located 20 yards apart, and idling.
• Among proposed 18 baseline and degreened tests for Phase 1 testing, four baseline tests with four graders have currently been performed. Preliminary results of the baseline tests show that graders having Tier 0 engines emit more emissions than graders with Tier 1 engines, and NOx emissions rates are highest while driving at maximum speed, followed mostly by driving at 20 mph, leveling, and backup, and lowest during the idling. More detailed results and analysis of the results will be discussed after completing all the remaining tests in both Phase 1 and Phase 2 testing.
• From the collected information, two vendors for FA and HE technologies (one for each technology) were selected to participate in this project. The technologies were applied on the four graders after finishing their baseline testing, and will be applied on others as planned for remaining Phase 1 and 2 testing.
The next section describes the remaining steps to perform in FY 2009. Researchers will perform the remaining steps to accomplish the goals of this project.
NEXT PROJECT STEPS
The bullet listings below represent the additional steps in the project that TTI researchers will complete through FY 2009. Emissions Measurement and Analysis (Task 5)
• Baseline NOx, HC, CO, CO2, and PM emissions for remaining selected equipment. • Treatment level NOx, HC, CO, CO2, and PM emissions for the selected equipment
installed with the selected emissions reduction technologies. • Comparisons between baseline and treatment level emissions. • Conclusions and recommendations about the effectiveness of the various emissions
reduction strategies and their potential emissions impact if implemented in the TxDOT non-road fleet particularly with regard to nonattainment areas, near nonattainment areas, and early action compact areas.
Comparison of Measurement Results with Existing Data Sources (Task 6)

59
• Comparison between baseline emissions rates of the tested equipment and existing rates from sources such as EPA’s AP-42 emissions tables, the NONROAD model, and rates produced by dynamometer studies.
• Comparison between treatment level emissions rate reductions of the tested equipment and existing rate reductions from the abovementioned sources.
• Recommendations of how emissions inventories can be revised based on the implementation of the various emissions reduction technologies.
Final Products (Task 7)
• Preparation of final research report. • Preparation of project summary report. • Preparation of a PowerPoint presentation that can be used for dissemination of the
research results to TxDOT and other agencies.

60

61
REFERENCES 1. EPA. Final Rule on In-Use Testing Program for Heavy-Duty Diesel Engine and Vehicles-
Regulatory Announcement. EPA420-F-05-021, June 2005. 2. EPA. National Clean Diesel Campaign, http://www.epa.gov/otaq/diesel/index.htm, accessed
September 2008. 3. CARB. California’s Diesel Risk Reduction Plan, http://www.arb.ca.gov/diesel/diesel.htm,
accessed October 2008. 4. Manufacturers of Emission Control Association. Emission Control Technology,
http://www.meca.org/page.ww?section=Emission+Control+Technology&name=Overview, accessed October 2008.
5. EPA. http://www.epa.gov/otaq/retrofit/verif-list.htm, accessed October 2008. 6. CARB. http://www.arb.ca.gov/diesel/verdev/vt/cvt.htm, accessed October 2008. 7. Zietsman, J., W. Schneider, and J. Borowiec. Increasing Fleet Content of Clean and Energy
Efficient Vehicles. Texas Department of Transportation, August 2004. 8. Lee, D.-W., J. Zietsman, and B. Bochner. Development of a Clean Fuel and Engine
Technology Matrix. Texas Department of Transportation and Texas Commission on Environmental Quality, September 2007.
9. EPA. http://www.epa.gov/otaq/retrofit/documents/verif-letter-cat2.pdf, accessed October
2008. 10. CARB. http://www.arb.ca.gov/diesel/verdev/level3/cleairehorizon_condverifletter.pdf,
accessed October 2008. 11. CARB. http://www.arb.ca.gov/diesel/verdev/level3/eo_de04012_01.pdf, accessed October
2008. 12. CARB. http://www.arb.ca.gov/diesel/verdev/level3/eo_de06007_01.pdf, accessed
October 2008. 13. CARB. http:// www.arb.ca.gov/diesel/verdev/eode05001.pdf, accessed October 2008. 14. MECA. Case Studies of Construction Equipment Diesel Retrofit Projects.
http://www.meca.org/galleries/default-file/Construction%20Case%20Studies%200306.pdf, March 2006, accessed October 2008.

62
REFERENCES (CONTINUED)
15. City of Houston Field Diesel Demonstration. ERMD Report 01-36.
http://www.arb.ca.gov/msprog/ordiesel/Documents/houston_demo_project.pdf, accessed October 2008.
16. EPA. http://www.epa.gov/otaq/ap42.htm, accessed October 2008. 17. EPA. http://www.epa.gov/otaq/, accessed October 2008. 18. EPA. http://www.epa.gov/nonroad/, accessed October 2008. 19. EPA. Exhaust and Crankcase Emission Factors for Nonroad Engine Modeling –
Compression-Ignition http://www.epa.gov/otaq/models/nonrdmdl/nonrdmdl2004/420p04009.pdf, April 2004, accessed October 2008.
20. Texas Commission on Environmental Quality. Texas 2002 Periodic Emissions Inventory:
Area, Non-road Mobile and Biogenic Sources, Austin, Texas, June 2004. 21. Alamo Area Council of Governments, 1999 Emissions Inventory. 22. Documentation for the HGA Area Diesel Construction Emissions Project.
Houston/Galveston Attainment Demonstration and Post-1999 Rate-of-Progress SIP, December 2000.
23. EPA. Nonroad Engine and Vehicle Emission Study-Report. EPA460/3-91-02, November
1991. 24. EPA. http://epa.gov/OMSWWW/nonrdmdl.htm, accessed October 2008. 25. EPA. The Green Book Nonattainment Areas for Criteria Pollutants.
http://www.epa.gov/air/oaqps/greenbk/ancl.html#TEXAS, accessed December 2007. 26. EPA. Ozone Early Action Compacts. http://www.epa.gov/ttn/naaqs/ozone/eac/#List,
accessed December 2007. 27. CARB. http://www.arb.ca.gov/diesel/verdev/eode0400402.pdf, accessed October 2008. 28. CARB. http://www.arb.ca.gov/diesel/verdev/vt/stationary/cleanair/egrcleanairletter.pdf,
accessed October 2008. 29. CARB. http://www.arb.ca.gov/diesel/verdev/level3/eo_de05004_01.pdf, accessed October
2008.

63
REFERENCES (CONTINUED)
30. SAE International (1986) Joint TMC/SAE Fuel Consumption Test Procedure – Type II. SAE
Surface Vehicle Recommended Practice J1321. 31. Matthews, R., M. Hall, and J. Prozzi. TxDOT Emulsified Diesel Final Report, Texas
Department of Transportation, January 2004. 32. Abolhasani, S. Assessment of On-Board Emissions and Energy Use of Non-road
Construction Vehicles, MS Thesis, North Carolina State University, August 2006. 33. EPA. 40 CFR Part 89 Subpart E – Exhaust Emission Test Procedure. An electronic version is
available at http://ecfr.gpoaccess.gov/cgi/t/text/text-idx?c=ecfr&sid=cde8f7cc3663b3cac18d2da4227bcd77&rgn=div6&view=text&node=40:20.0.1.1.3.5&idno=40, accessed October 2008.
34. EPA. EPA’s Onboard Analysis Shootout: Overview and Results; EPA420-02-026; Office of
Transportation and Air Quality, U.S. EPA: Ann Arbor, MI, 2002. 35. Peter Howes, City of Houston Diesel Field Demonstration Project, ERMD Report #01-36,
www.arb.ca.gov/msprog/ordiesel/Documents/houston_demo_project.pdf, accessed October 2008.
36. Manufacturers of Emission Controls Association, Case Studies of Construction Equipment
Diesel Retrofit Projects, March 2006.

64

65
APPENDIX A: NON-ROAD EMISSION REDUCTION CASE STUDIES
The Central Artery/Tunnel (CA/T) Project, Boston, MA
Commonly known as the “Big Dig,” this project was one of the first wide scale efforts to reduce non-road construction emissions. Approximately 25 percent of the long-term non-road diesel equipment used on the Central Artery/Tunnel project (“Big Dig”) was retrofitted with DOCs. More than 200 pieces of equipment (most of the equipment was model year 1999 or 2000) were retrofitted including:
• Nichi, Caterpillar, SIC, Terex, and JLG lifts; • Mantis cranes; • John Deere and Caterpillar dozers; and • Cradel excavators.
The equipment was fueled using ULSD and emulsified diesel fuels. DOCs did not experience any adverse operational problems, such as loss of power or additional fuel consumption. Environment Canada used a portable emissions-testing device, and will perform further tests of DOCs. Currently, preliminary area-wide emission reductions for 2000-2004 were estimated at:
• 36 tons/year of CO, • 12 tons/year of HC, and • 3 tons/year of PM.
More detailed information can be obtained from the website: www.massturnpike.com/bigdig/background/airpollution.html.
I-95 New Haven Harbor Crossing Corridor Improvement Program, New Haven, CT
Known as the Q-Bridge Project, DOCs were installed on approximately 70 pieces of construction equipment. The project is being used as a mode for statewide efforts to reduce mobile source emissions. The objective was to protect workers and residents from harmful construction emissions along a populated corridor. The contractor requirements included:
• emissions control devices on non-road diesel-powered construction equipment with engine horsepower ratings of 60 hp and above that are on the project or assigned to the contract for more than 30 days; and
• truck staging zones, idling restrictions, and avoiding sensitive areas. Contractors voluntarily used low sulfur diesel (500 ppm sulfur) on all of their non-road equipment. During the program, estimated emissions reductions were:
• 20 tons/year of CO, • 8 tons/year of HC, and • 2 tons/year of PM.

66
More detailed information can be obtained from the website: http://www.i95newhaven.com/poverview/environ_init.asp.
Dan Ryan Expressway Road Construction Project
The Illinois Department of Transportation (IDOT) implemented this pollution reduction initiative. During the project, all heavy construction equipment on the Dan Ryan project required to be either retrofitted with emissions control devices or to use ULSD. Approximately 290 pieces of construction equipment in use on the Dan Ryan project had emissions control devices or used ULSD. Also, IDOT implemented idling limits and dust controls to reduce air emissions. With these tactics in place no significant environmental impacts due to road construction were identified from 2004 to date. More detailed information can be obtained from the website: http://dnr.wi.gov/air/pdf/danryancasestudy.pdf.
World Trade Center (WTC) Diesel Emissions Reduction Project
The seven World Trade Center Diesel Emissions Reduction Projects will demonstrate clean construction by retrofitting non-road, heavy-duty diesel construction equipment with DOCs and DPFs and using ULSD. The first investigation with ULSD and DPFs included two Caterpillar 966G wheel loaders. Using two PEMS units, a Clean Air Technologies International Montana system, and the Environment Canada DOES2 system, Environment Canada measured emissions of the loaders. Results with using just ULSD showed that reductions of PM and CO were 13 to 17 percent and 2 to 10 percent, respectively, while HC emissions increased. When DPFs were used with ULSD, the results showed that reductions were more than 97 percent for PM, more than 87 percent for CO, and 97 percent for HC. This project did not target NOx reductions. Although test results indicated NOx reductions (16 to 30 percent), this reduction may be related to engine backpressure effects associated with operations utilizing a DPF. More detailed information can be obtained from the website: http://www.cleanaircommunities.org/projects/wtc.html.
The Impact of Retrofit Exhaust Control Technologies on Emissions from Heavy-Duty Diesel Construction Equipment
The testing program was conducted to study the in-use emissions and duty cycles from five heavy-duty construction vehicles and to examine the emissions reduction potential of retrofit control technologies on construction equipment, such as DOCs and DPFs. Test results showed that a:
• dump truck, equipped with a DOC, showed PM reductions of 17 percent; however, the conversion of the gaseous emissions was low;
• backhoe, equipped with an active DPF, showed PM reductions of 81 percent; • bulldozer DOC system showed PM reductions of 24 percent, CO emissions were also
significantly reduced while HC was not reduced;

67
• Caterpillar wheeled loader, equipped with a catalyzed DPF, showed a combination of 97 percent PM reductions and excellent gaseous control; and
• Volvo wheeled loader, equipped with a DOC, showed PM reductions of 52 percent (during the tests a leak developed in the mass flow controller and made it difficult, if not impossible to determine the absolute emissions rates).
Based on the results, retrofitting 200,000 pieces of construction equipment with DPFs would reduce PM emissions up to 15,000 tons/year, CO up to 109,000 tons/year, and HC up to 17,000 tons/year; with DOCs, reductions would be up to 4,000, 45,000 and 7,000 tons/year for PM, CO and HC, respectively. More information along with detailed test results are available from the SAE paper no. 1999-01-0110.1
Demonstration Projects for Diesel Particulate Filter Technologies on Existing Off-Road Heavy-Duty Construction Equipment
The South Coast Air Quality Management District (SCAQMD) and CARB conducted a project to evaluate the durability and effectiveness of passive DPF technology installed on existing non-road diesel construction equipment. The project installed PM filters on 15 diesel engines that are used on 12 heavy-duty construction vehicles — six scrapers and six dozers. After operating these equipments with DPFs for a period of one year, they were tested at the West Virginia University (WVU) Engines and Emissions Research Laboratory. Dynamometer tests were performed on a Caterpillar engine using both transient and eight-mode steady-state duty cycles. DPFs showed that more than 90 percent of PM reductions were achieved during both pre- and post-demonstration testing along with 65 percent or greater reductions of CO and HC emissions. More detailed information can be obtained from the website: http://www.meca.org/galleries/default-file/SCAQMD_Trap_Construction%20Project%20Study_v11%20edited%20lm.pdf.
City of Houston Diesel Field Demonstration Project
The Diesel Field Demonstration Project evaluated diesel emissions control devices on various vehicles and equipment, including construction equipment, during the summer of 2000 through the fall of 2001. The project identified retrofit emission control systems that can achieve 75 percent NOx reductions and at least 25 to 33 percent reduction in fine particulates. The following are the summaries of this project:
• Environment Canada performed emissions testing on the City of Houston fleet. • From the demonstration testing on a Gradall G3WD excavator, SCR system was selected
among DOC + emulsified diesel fuel (DOC+E), an SCR system (SCR), and a combined DPF + SCR system (DPF+SCR). Test results are 35 percent, 78 percent, and 84 percent in NOx emissions reductions for the DOC+E, the SCR, and the DPF+SCR, respectively, and 76 percent, 27 percent, and 92 percent in PM reductions for the DOC+E, the SCR, and the DPF+SCR, respectively.
1 Cooper, C. and G.R. Rideout. The Impact of Retrofit Exhaust Control Technologies on Emissions from Heavy-Duty Diesel Construction Equipment. SAE paper no. 1999-01-0110.

68
• As a result of the demonstration, 33 rubber-tire excavators were retrofitted with SCR systems. In addition, the City has retrofitted about 30 to 40 non-road engines such as backhoes and water pumps with DOCs.
• A total of 33 ditch excavators were equipped with an initial design SCR system and the SCR system will be upgraded to increase the level of emissions reduction. The SCR systems that were installed included a DOC and a warning signal to indicate when the ammonia supply was getting low.
More information on this project is available at http://www.arb.ca.gov/msprog/ordiesel/Documents/houston_demo_project.pdf.
69
APPENDIX B: NON-ROAD EMISSION RELATED DOCUMENTS
• Report: “Diesel Retrofit Technology: An Analysis of the Cost-Effectiveness of Reducing
Particulate Matter and Nitrogen Oxides Emissions from Heavy-Duty Nonroad Diesel Engines Through Retrofits” (EPA420-R-07-005, May 2007; http://www.epa.gov/otaq/diesel/documents/420r07005.pdf).
• Report: “The Cost-Effectiveness of Heavy-Duty Diesel Retrofits and Other Mobile Source Emission Reduction Projects and Programs” (EPA-420-B-07-006, May 2007; http://www.epa.gov/otaq/stateresources/policy/general/420b07006.pdf).
• Guidance: “Diesel Retrofits: Quantifying and Using Their Benefits in SIPs and Conformity — Guidance for State and Local Air and Transportation Agencies” (EPA420-B-06-005, June 2006; http://www.epa.gov/otaq/stateresources/transconf/policy/420b06005.pdf).
• Fact Sheet: “EPA’s Diesel Retrofit SIP and Conformity Guidance” (EPA420-F-06-034, June 2006; http://www.epa.gov/otaq/stateresources/transconf/policy/420f06034.pdf).
• Report: “Diesel Retrofit Technology and Program Experience: Final Draft” (July 2005; http://www.epa.gov/cleandiesel/documents/retrofit-tech-prog-exp.07-2005.pdf).
• Report: “Diesel Construction Equipment Activity and Emissions Estimates for the Dallas/Ft. Worth Region” (August 2005; http://files.harc.edu/Projects/AirQuality/Projects/H043.T163/H43.T163FinalReport.pdf).
• Report: “TxDOT Emulsified Diesel Final Report” (January 2004; http://www.bp.com/liveassets/bp_internet/bp_ecd/bp_ecd_us/STAGING/local_assets/downloads_pdfs/t/Texas_DOT4576_3.pdf).

70

71
APPENDIX C: PRACTICES OF OTHER STATES – STRATEGIES AND INCENTIVES
Texas
Texas has statewide initiatives to reduce mobile source emissions. Under the Texas Emissions Reduction Plan (TERP), several monetary incentive programs were established to improve air quality (intentionally, NOx emissions reduction) in the state’s nonattainment areas. Among those, the TCEQ’s Emissions Reduction Incentive Grants (ERIG) Program offers grants and other financial incentives for emission reductions and alternatives to the selected applicants. The grants will be issued for the repowering or replacement of non-road and on-road vehicles and equipment. The $30 million allocated to the Rebate Grant Program under the latest round of funding (FY 2008) has been awarded, and new FY 2009 rebate grant notice will be released on September 10, 2009. More information is available at http://www.tceq.state.tx.us/implementation/air/terp/.
Connecticut
The Connecticut General Assembly directed the Department of Environmental Protection (DEP) through Special Act 05-7 to develop diesel emissions reduction strategies. The Act addressed transit buses, school buses, and construction equipment. The entire report is available at http://www.ct.gov/dep/lib/dep/air/diesel/docs/ctcleandieselplanfinal.pdf. The plan listed numerous strategies for reducing emissions including:
• continue to encourage retrofits, and clean fuels; • call on state agencies (including DOT, Department of Public Welfare [DPW], Office
of Personnel Management [OPM], Department of Economic and Community Development [DECD], and University of Connecticut) to adopt Clean Air Construction Contract Specifications for state construction contracts greater than $5 million;
• revise DEP’s regulations governing indirect sources of air pollution to allow for retrofits as a compliance option for applicable DOT projects;
• provide retrofits for equipment rental agencies; • mandate requirements for emissions control technology, ULSD fuel and best
available technology (BAT) be used with diesel construction equipment; and • fund incentives to contractors to reduce emissions through purchase and use of
retrofitted equipment, clean fuels, and engine re-builds. Incentives would be in the form of sales tax waivers.
Tennessee
The Tennessee Department of Transportation (TDOT) created the Clean Transportation Initiative to reduce on- and off-road mobile source emissions. TDOT dedicated $4.8 million in CMAQ funds over three years to a Clean Transportation Innovations Incentives Fund for reducing emissions from heavy-duty diesel trucks using retrofit control equipment and idling reduction technology.
72
TDOT manages the Innovations Incentive Fund, and funds public/private partnerships focusing on:
• emissions control solutions, • replacement, • repowering, • Rebuilding, and • encouraging idling reduction and cleaner fuels.
TDOT is currently implementing three pilot partnership projects. As with the national apportionment formula, TDOT does not account for PM 2.5 nonattainment status in its CMAQ distribution to Metropolitan Planning Organizations (MPOs). However, TDOT is providing resources to address PM 2.5 issues by creating a statewide fund for PM 2.5 CMAQ projects. More information about the TDOT’s Environmental Policy office can be found at: http://www.tdot.state.tn.us/environment/policy/.
Illinois
Illinois has statewide initiatives to reduce mobile source emissions. These initiatives include the following programs: “Alternate Fuels Rebate Program” and “Green Fleets” program.2 The most notable effort is the “Clean Air Construction Initiative” undertaken by IDOT in the last year, most of the heavy construction equipment on the Dan Ryan project will either be retrofitted with devices designed to reduce harmful emissions or will use ULSD fuel. IDOT has also instituted idling limits and dust controls in order to reduce construction-related air emissions. As noted in the case studies, approximately 290 pieces of equipment in use on the Dan Ryan project will have emissions control devices or will use ULSD fuel. These emissions control strategies are a contract requirement for equipment operating on the Dan Ryan project. The initiative is funded in part through a $60,000 grant from the EPA that was secured by the Illinois EPA. More information is available at http://www.dot.state.il.us/press/airbear.html.
North Carolina
In 2004, the North Carolina Department of Transportation (NCDOT) announced changes in its CMAQ program guidelines, for the first time giving MPOs the authority to determine project priorities. North Carolina receives approximately $20 million in CMAQ funds annually. Roughly 20 percent of this amount is retained for statewide projects with the rest being divided among North Carolina’s 21 nonattainment counties. Both statewide and MPO programmed CMAQ dollars included diesel retrofit projects during North Carolina’s most recent approval of new CMAQ projects. NCDOT also awarded $1.6 million over three years to the North Carolina Solar Center at North Carolina State University to establish a three-year Clean Fuel Advanced Technology Program (CFATP). A 20 percent match was provided by the North Carolina Division of Air Quality and the State Energy Office. Under the CFATP, public and private entities in ozone or PM nonattainment and maintenance areas can apply for funding of on-road and non-road diesel retrofits. 2 Illinois EPA. http://www.epa.state.il.us/air/, accessed November 2007.

73
New Jersey
In September 2005, New Jersey enacted a new Diesel Risk Reduction Law, which set the framework for a program to control PM from diesel-powered mobile sources. According to this law, garbage trucks (publicly owned or used in a public contract), transit buses, and other publicly owned on-road and off-road vehicles are and will be required to install exhaust emissions control devices. Retrofit technology and installation costs will be reimbursed by the state of New Jersey through the Corporate Business Tax as approved through a constitutional amendment in November 2005. Retrofit requirements will be phased in over 10 years based on the availability of funding. Annual funding levels are anticipated to be in the range of $14 million. Other provisions of the law required the use of ULSD by all on- and off-road diesel vehicles by January 2007 and extended authority to local police to enforce existing idling regulations. The New Jersey Department of Environmental Protection provides further guidance on how to comply with the law with more information at http://www.nj.gov/dep/airworkgroups/diesel_workgroup.html.
Wisconsin
The Wisconsin Department of Natural Resources has federal grant funds available for diesel retrofit projects done in the state’s eastern ozone nonattainment counties. The Wisconsin retrofit program applies to on-road and non-road municipal vehicles, as well as private or public-owned school buses and other non-road equipment. All vehicles must use EPA or CARB verified technologies and remain in the fleet for at least five years after being retrofitted.
Oregon
Oregon created a tax credit to help compensate for the cost of installing pollution control devices on EPA’s verified technology list. The provision provides a maximum 35 percent credit against Oregon income taxes (rates may be less for equipment not used exclusively in Oregon).
New York City
New York City Local Law No. 77 3 requires the phase-in use of ULSD and BAT for emissions control in all diesel-powered non-road vehicles used in city construction projects. It applies to all diesel non-road vehicles with an engine rated at 50 hp or greater that is owned by, operated by or on behalf of, or leased by a city agency. Public works contracts less than $2 million must specify that the contractors use BAT.
3 The City of New York. www.nyccouncil.info/pdf_files/bills/law03077.pdf, accessed November 2007.


74
APPENDIX D: PRACTICES OF OTHER STATES – NON-ROAD EMISSIONS
Western Regional Air Partnership (WRAP)
The following states are involved in WRAP: Alaska, Arizona, California, Colorado, Idaho, Montana, New Mexico, North Dakota, Oregon, South Dakota, Utah, Washington, and Wyoming. All the western states in the WRAP, except California, use NONROAD default values for estimating non-road diesel mobile source emissions. Many states in WRAP consider non-road construction emissions a very small fraction of their inventory. More detailed information is available at: http://www.wrapair.org/index.html.
Arkansas
Arkansas used the NONROAD model with the exception of the defaults used in growth factors. NONROAD default equipment populations are mostly based on either 1996 or 1998 data from Power Systems Research, a private marketing research company (EPA, 1998). ENVIRON decided not to use the default NONROAD growth factors because questions have been raised concerning their validity. Instead, ENVIRON developed alternative state-level growth factors using different surrogates for each non-road equipment category and assumed linear growth to forecast the 1996 or 1998 base year data to 2002. More detailed information is available at: http://www.adeq.state.ar.us/AIR/branch_planning/pdfs/sip_crittenden_county.pdf.
Louisiana
Louisiana’s non-road mobile emissions data were derived from the “Emission Inventory Development For Mobile Sources and Agricultural Dust Sources for the Central States” produced by Sonoma Technology, Inc. for The Central States Air Resource Agencies in October 2004. The inventory was developed using NONROAD 2004. For other source categories, NONROAD default activity data were used in conjunction with region-specific fuels information to estimate emissions. More detailed information is available at: http://www.deq.louisiana.gov/portal/tabid/2542/Default.aspx.
New York
Non-road mobile source emissions were estimated using two separate methodologies. New York is modeled for all 62 counties separately on a monthly basis. In addition, New York is separated into two areas due to the federally mandated Reformulated Gas (RFG) Program. This program is in place in the New York City Metropolitan Area (NYCMA) which consists of Bronx, Kings, Nassau, New York, lower Orange, Queens, Richmond, Rockland, Suffolk and Westchester counties. Emissions from two-stroke gasoline, four-stroke gasoline-fueled and diesel-fueled off-highway vehicles as well as emissions from recreational marine vessels were estimated using the EPA draft NONROAD model. Using the EPA NONROAD model, non-road emissions from New York were estimated for each individual county for each month of the year. Temperature and fuels blend data varied by month for each county across the state.
75

75
Temperature data for 1999 was acquired from the National Oceanic and Atmospheric Association which included historical weather data from 17 airport locations across the state of New York as well as surrounding locations. This information was used to develop average high and low temperatures for each month on a county-by-county basis. The results were input into the NONROAD model. Fuels blend data for 1999 were acquired from the New York State Department of Agriculture and Markets. These data are based upon thousands of samples collected across the state from fueling stations and retention areas. These samples are then analyzed for many profiles including oxygen content, Reid Vapor Pressure (RVP) and sulfur content. The data provided average monthly fuels profiles on a county-by-county basis. The results were then used as inputs to the NONROAD model. More detailed information is available at: http://www.glc.org/air/inventory/1999/mobile/AppendixE_NY_mobile.pdf.
76
77
APPENDIX E: QUESTIONNAIRES FOR FUEL ADDITIVES (FA)
Questionnaires
Emissions Reduction Do you have any emissions test data* for your FA, which can be shared with us?
Yes ______ No ______
If yes, who performed the test(s)?
EPA ______ CARB ______ SwRI ______ Yourself ______
Others ______; please, specify _____________________________________________
Based on the data, please specify average emissions reduction rate (%)
on construction equipment for : NOx _____ PM _____ HC _____ CO _____
on all applications, if different, for : NOx _____ PM _____ HC _____ CO _____ * Please attach copies of such test data that you believe are relevant to this project.
Experiences Do you have any commercially available FA products?
Yes ___ No ___; if no, will any products be available in three months? Yes ___ No ___
If yes, approximately how much have you sold or applied in the field?
Total ______: Construction Equipment ______ On-road vehicles ______ Others ______
Is(Are) your FA product(s) certified?
Yes ______ No ______; if yes, by EPA ______ and/or CARB ______
Applications How much does your product cost?
$____/gallon(G) when sold for 1 G; $____/G for 100 G; $____/G for 1000 G or more
What is the mixing ratio?
1 G of your product in ______ G of diesel
Does your product need to be pre-mixed or just added to the fuel?
Add ______ Pre-Mix ______
Others ______; please specify _____________________________________________
77

78
How will your product be purchased and stored? (e.g., 1-G containers, drums, 8-oz bottles for 50-G of diesel fuel, or pre-mixed fuel tanks)
Please specify: ______________________________________________________
________________________________________________________________________
________________________________________________________________________
Do you have any general and specific requirements, instructions, and/or cautions in applying your FA technology to any of TxDOT’s off-road diesel construction equipment?
Yes ______ No ______
If any, please specify: ________________________________________________
________________________________________________________________________
________________________________________________________________________
________________________________________________________________________
Contact(s) Please, provide contact information below
Name/title/e-mail/phone/fax:
________________________________________________________________________
________________________________________________________________________
78
79
APPENDIX F: QUESTIONNAIRES FOR HYDROGEN ENRICHMENT (HE) SYSTEM
Questionnaires
Emissions Reduction Do you have any emissions test data* for your HE, which can be shared with us?
Yes ______ No ______
If yes, who performed the test(s)?
EPA ______ CARB ______ SwRI ______ Yourself ______
Others ______; please specify _____________________________________________
Based on the data, please specify average emissions reduction rate (%)
on construction equipment for : NOx _____ PM _____ HC _____ CO _____
on all applications, if different, for : NOx _____ PM _____ HC _____ CO _____ * Please attach copies of such test data that you believe are relevant to this project.
Experiences Do you have any commercially available products using HE technology?
Yes ___ No ___; if no, will any products be available in three months? Yes ___ No ___
If yes, how many units (or, systems) approximately have you sold or applied in the field?
Total ______: Construction Equipment ______ On-road vehicles ______ Others ______
Is your HE technology certified?
Yes ______ No ______; if yes, by EPA ______ and/or CARB ______
Do have any products commercially available now or in three months using other technology(gies) than HE?
Yes ______ No ______
If yes, please, name the technology(gies):
_______________________________________________________________________
How many units have you sold or applied in the field for all of the technologies excluding HE?
Total ______: Construction Equipment ______ On-road vehicles ______ Others ______
Are any of the technologies other than SCR certified?
Yes ______ No ______; by EPA ______ and/or CARB ______ If yes, please name them _________________________________________________________
Applications
79

80
What is the cost of your system?
$___________ when sold for 1; $___________ for 10; $___________ for 100 or more
What is your cost estimate(s) to install your system on non-road diesel construction equipment such as graders, rubber-tire loaders, and excavators; please include all necessary costs for parts, labor, etc.?
$___________ when installed on 1; $___________ on 10; $__________ on 100 or more
What is the maintenance/operation cost be per each system?
$___________ for one year of operation (at 40 hours/weeks for 25 weeks)
Is there anything that needs to be specified for the cost and/or cost estimates above?
If any, please specify: ________________________________________________
________________________________________________________________________
________________________________________________________________________
Do you have any general and specific requirements, instructions, and/or cautions to apply your SCR technology to any of TxDOT’s off-road diesel construction equipment?
Yes ______ No ______
If any, please specify: ________________________________________________
________________________________________________________________________
________________________________________________________________________
________________________________________________________________________
Contact(s) Please, provide contact information below
Name/title/e-mail/phone/fax:
________________________________________________________________________
________________________________________________________________________
80