characterization of non-urbanized areas for land-use planning of ... · characterization of...
TRANSCRIPT

Daniele La Rosa
Riccardo Privitera
Characterization of non-urbanized areas for land-use planning of agricultural and
green infrastructure in urban contexts
Università di Catania - Dipartimento di Architettura
LAboratorio per la Progettazione del Territorio e dell’Ambiente
Buildings
Cultivated
Trees
Herbaceous
vegetation
Fig. 2 Land cover types iden
Synthesizing different perspectives on the valueof urban ecosystem services
Lodz,15-16 July, 2011

outline
• Non-Urbanised Areas (NUAs) in metropolitan contexts
• Study area
• Characterization of NUAs (method & results)– Land Cover Analysis
– Fragmentation Analysis
– Proximity Analysis
– Land Use Suitability Model (LUSM)
– Compatibility Matrix
• Conclusions

Aim of the work
Presence of evapotranspiration features
Degree of fragmentation
Proximity to urban areas
Current land use
Proposition of new land uses for Non Urbanized Areas in metropolitan
contexts aimed at enhancing the provision of ecosystem services and
climate change adaptations
Which parameters for Non-Urbanized Areas characterization?
How?
Characterizing Non Urbanized Areas to re-think their role in environmental
urban planning

Non Urbanized Areas (NUAs)
New scenario of new land uses to protect and
enhance ecosystem services provided by NUAs
Natural Areas, woods, shrubs, abandoned farmaland, urban green spaces
PressuresClimate Changes
outdoor places with significant amounts of vegetation, mainly semi-natural areas that
represent the last remnants of nature in urban areas
Non-urbanized Areas in metropolitan regions (1)
Urban Sprawl
Response
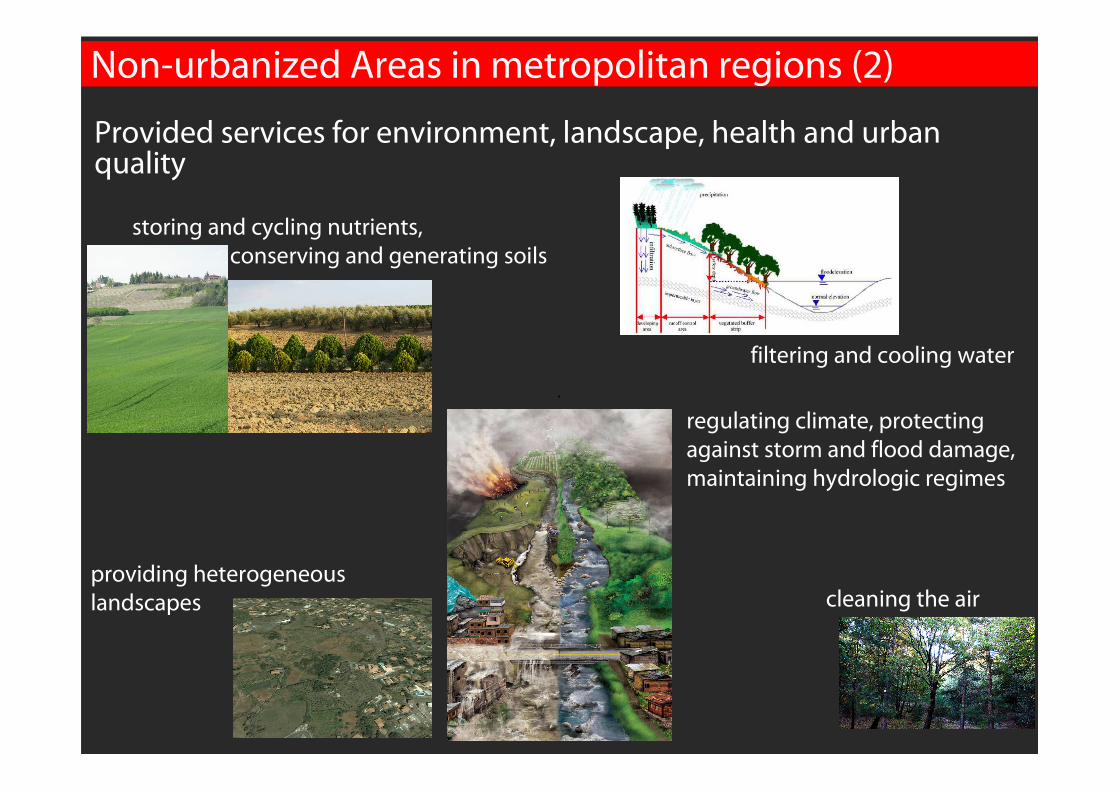
Provided services for environment, landscape, health and urban quality
cleaning the air
storing and cycling nutrients,
conserving and generating soils
regulating climate, protecting
against storm and flood damage,
maintaining hydrologic regimes
providing heterogeneous
landscapes
filtering and cooling water
Non-urbanized Areas in metropolitan regions (2)
The study area (1)
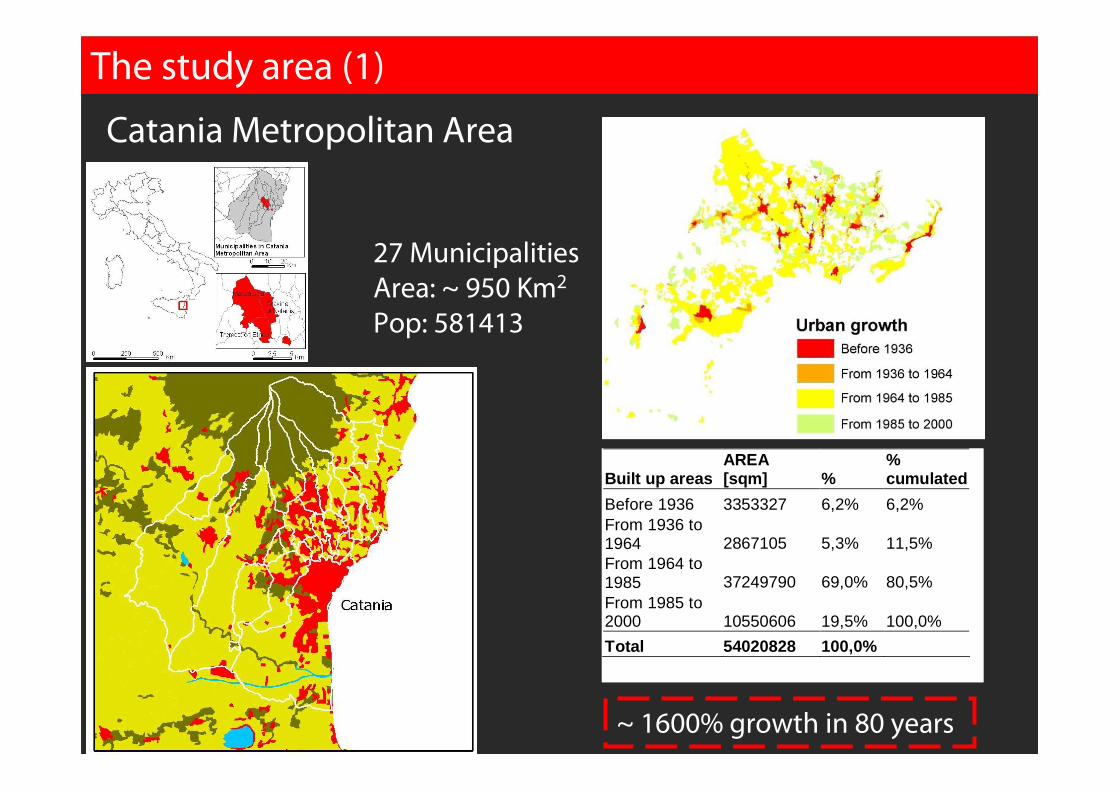
Catania Metropolitan Area
27 Municipalities
Area: ~ 950 Km2
Pop: 581413
Built up areas AREA [sqm] %
% cumulated
Before 1936 3353327 6,2% 6,2% From 1936 to 1964 2867105 5,3% 11,5% From 1964 to 1985 37249790 69,0% 80,5% From 1985 to 2000 10550606 19,5% 100,0%
Total 54020828 100,0%
~ 1600% growth in 80 years

The study area (2)
Municipalities of Mascalucia , Tremestieri Etneo and Gravina di Catania
•Population almost doubled twice since 1936 (27482 inhabitants)
•Agriculture oriented economy, mainly based on wine production, completely
swiped out by urban sprawl
•Urban land increased by more than 2000 % between 1928 and 2008
The study area (3)
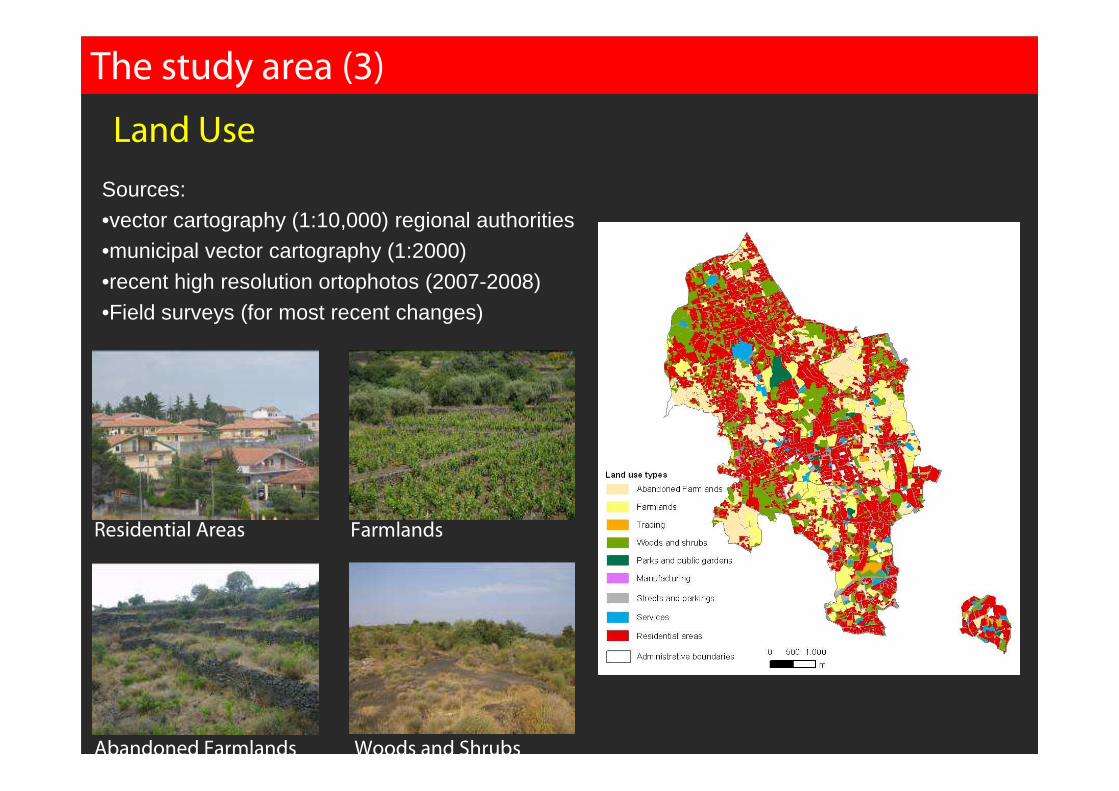
Land Use
Residential Areas Farmlands
Abandoned Farmlands Woods and Shrubs
Sources:
•vector cartography (1:10,000) regional authorities•municipal vector cartography (1:2000)
•recent high resolution ortophotos (2007-2008)
•Field surveys (for most recent changes)

The study area (4)
Mascalucia Municipality
•Residential land covers almost half of the
municipality
•Farmland (cultivated and abandoned)
almost 30 %
•wood and shrubs (18,7 %).
•Relevant amount of small patches of
farmland, eroded by urban sprawl.
Land Use
Farmlands, Woods and shrubs, Parks and Public
Gardens are the Non-Urbanized
100,0%2504Total
0,5%12,7Roads and parkings
1,3%31,4Trading
2,6%64,9Services and utilities
46,1%1154,4Residential
0,3%6,4Manufacturing
18,7%468,5Woods and shrubs
1,4%34,3Parks and public
gardens
11,8%295,3Farmland
17,9%448,9Abandoned farmland
%Area
[ha]Land use types

From Land Use to Land Cover
Land use categories not
able to provide
indications about land
cover features.
Each patch of a single
land use type
composed by a
(complex) mix of land
covers
Characterizing land uses type by
different land covers becomes crucial
for environmental planning (i.e.
climate change adaptation strategies)
Different percentages of
evapotranspiring surfaces can be
taken into account in deciding
prospective land uses or safeguard
measures.
Why a Land Cover Analysis of NUA?
Land Cover Analysis (1)

Buildings
Cultivated
Impervious
Shrubs
Trees
Herbaceous
vegetation
Bare soils
Grass
Fig. 2 Land cover types iden
Land Cover Analysis (2)
Land Cover Types

Composition of land cover surfaces for each land use type*
Land Cover Analysis (3)
1008.102.1019.2221.462.094.6131.2011.52Woods &
shrubs
10013.772.190.256.149.100.270.9567.34
Parks &
public
gardens
1003.401.1215.2128.070.4312.1128.3711.30Abandoned
farmland
1004.681.647.3213.291.1351.6513.356.94Farmland
TOTImperviousBuildingsBare soilHerbaceous
vegetationGrassCultivatedShrubsTrees
Land cover types percentages [%]Land Use
Type
19.2210.1970.89Woods and shrubs
0.2515.9583.80Parks and public gardens
15.214.5180.28Abandoned farmland
7.326.3286.36Farmland
% bare
soil
% impervious
surface
% evapotranspiring surface
(ET)Land Use Types
• evapotranspiring LC types = Trees, Shrubs, Cultivated, Grass,
Herbaceous Vegetation
• impervious LC types = Buildings and Impervious
Fragmentation analysis (1)
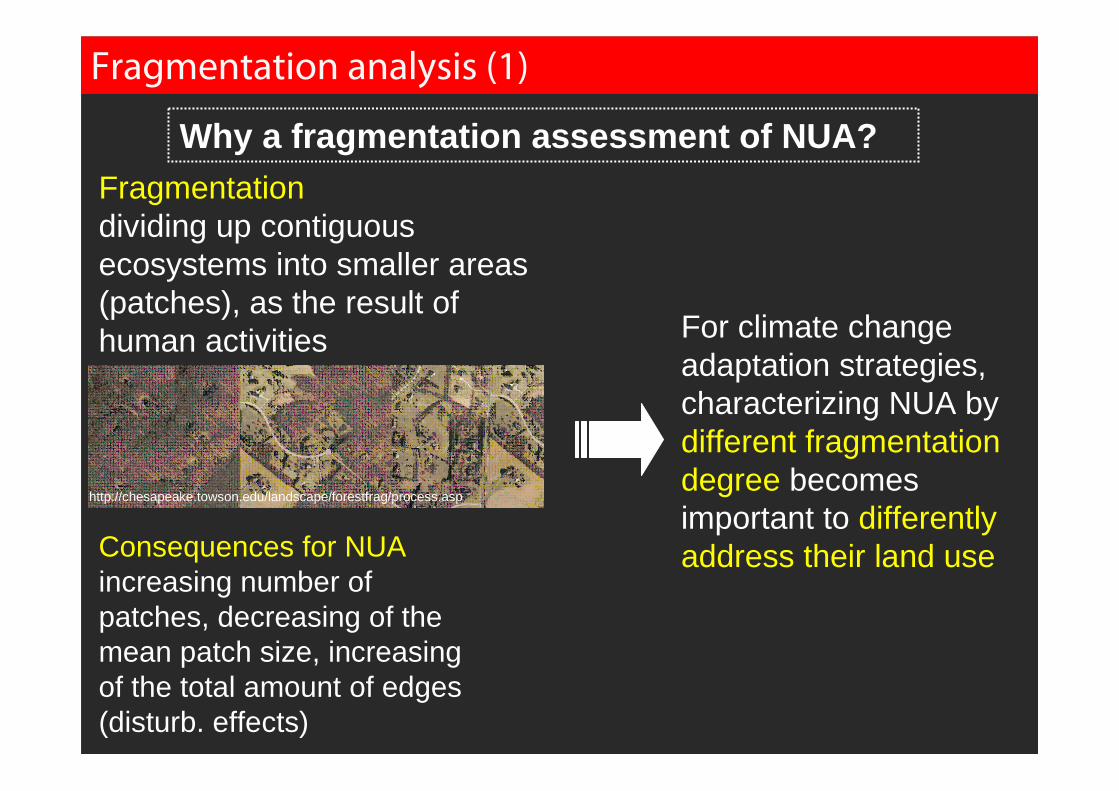
Why a fragmentation assessment of NUA?Fragmentationdividing up contiguous ecosystems into smaller areas (patches), as the result of human activities
Consequences for NUAincreasing number of patches, decreasing of the mean patch size, increasing of the total amount of edges (disturb. effects)
For climate change adaptation strategies, characterizing NUA by different fragmentation degree becomes important to differently address their land use
http://chesapeake.towson.edu/landscape/forestfrag/process.asp

Fragmentation analysis (2)
Low fragmented NUA
High fragmented NUA
Environmental
Conservation
Leisure or new forms
of agriculture
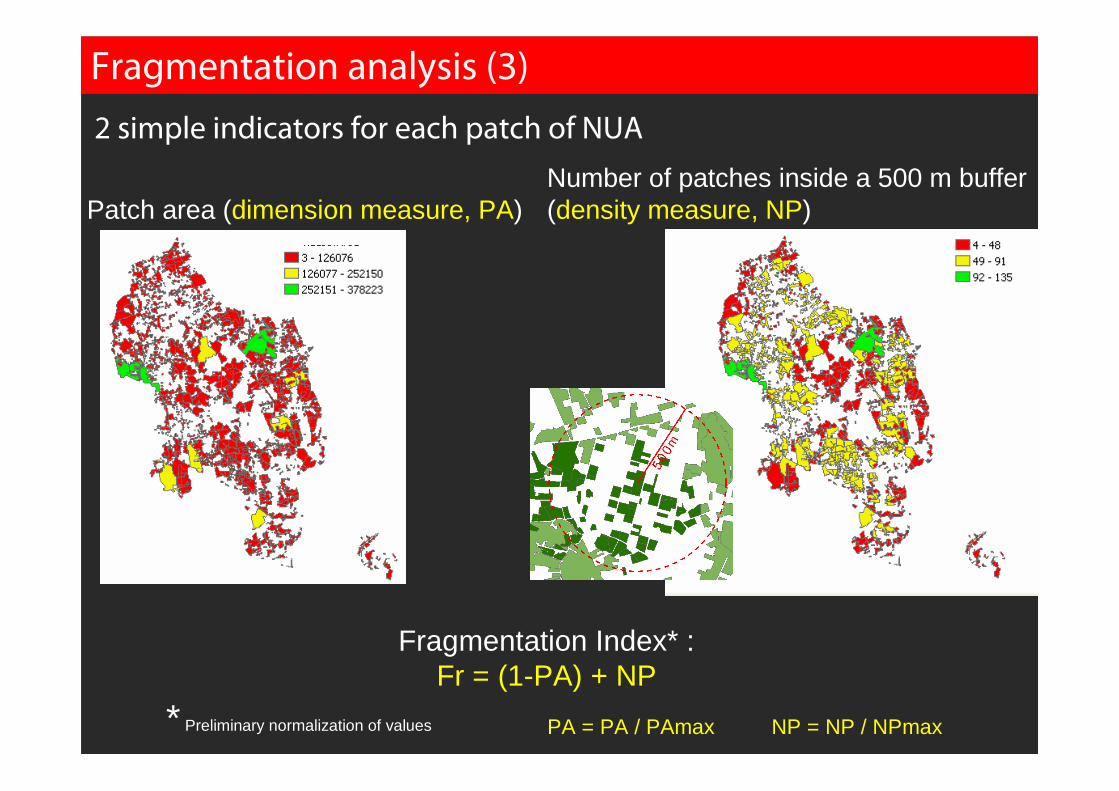
Fragmentation analysis (3)
Number of patches inside a 500 m buffer (density measure, NP)Patch area (dimension measure, PA)
Fragmentation Index* :Fr = (1-PA) + NP
* Preliminary normalization of values PA = PA / PAmax NP = NP / NPmax
2 simple indicators for each patch of NUA

Fragmentation analysis (4)
Fragmentation index (FA)
High
Fragmentation
Medium
Fragmentation
Low
fragmentation

Proximity analysis (1)
NUAs with high proximity to residential areas
should be oriented to particular land uses (i.e.
Small gardens, playgrounds or allotment gardens)
This is particularly important for patches with
high fragmentation.
Need of appropriate metric to assess the
proximity of NUAs to residential areas
∑=
=n
j ji
j
dist
PopPROXi
1
Proximity
analysis
total number of people (by census data) that can access to each NUA and weighs this
number with the inverse of the distance of each residential patch
gravity potential expression

Proximity analysis (2)
•Central and southern patches have higher proximity (due to concentration of residential
parcels)
•5 clusters of high proximity patches with high fragmentation levels

Land Use Suitability Model (1)
•3 dimensions matrix(Evapotranspiration, fragmentation
and proximity levels)
•Evapotranspiration, fragmentation and proximity levels divided in
classes of equal interval (respectively
3, 3 and 2)
•New Prospective Land Uses (PLUs) proposed, as the intersection
between the different levels of
evapotranspiration, fragmentation
and proximity.
LEISUREENVIROMENTAL PROTECTION
LOCAL GREEN
SERVICES
URBAN AGRICULTURE
strategic purposes

Land Use Suitability Model (2)
Natural parks
large highly natural areas
with relevant vegetation
cover within a
metropolitan context
LEISUREENVIROMENTAL PROTECTION
LOCAL GREEN
SERVICES
URBAN AGRICULTURE
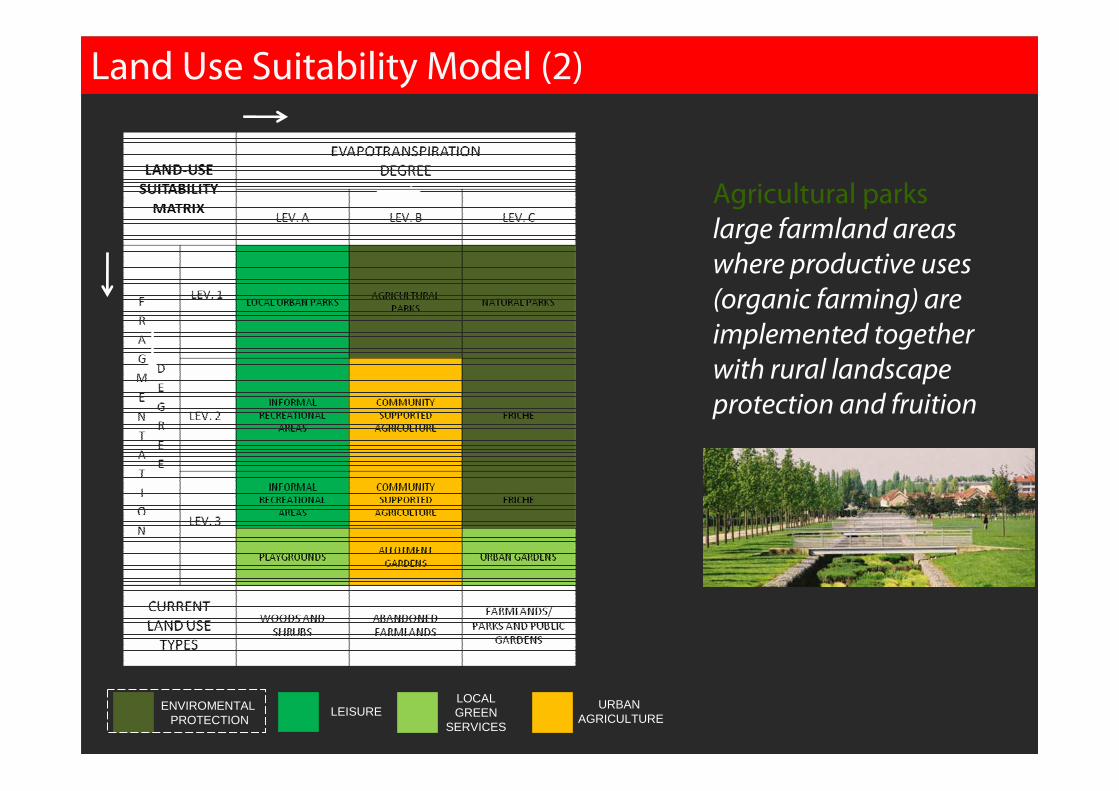
Land Use Suitability Model (2)
LEISUREENVIROMENTAL PROTECTION
LOCAL GREEN
SERVICES
URBAN AGRICULTURE
Agricultural parks
large farmland areas
where productive uses
(organic farming) are
implemented together
with rural landscape
protection and fruition

Land Use Suitability Model (2)
LEISUREENVIROMENTAL PROTECTION
LOCAL GREEN
SERVICES
URBAN AGRICULTURE
Friche
network of natural, semi
natural and restored to
natural state areas within,
around and between
developed patches, mainly
aimed at environmental
protection
Land Use Suitability Model (2)
LEISUREENVIROMENTAL PROTECTION
LOCAL GREEN
SERVICES
URBAN AGRICULTURE
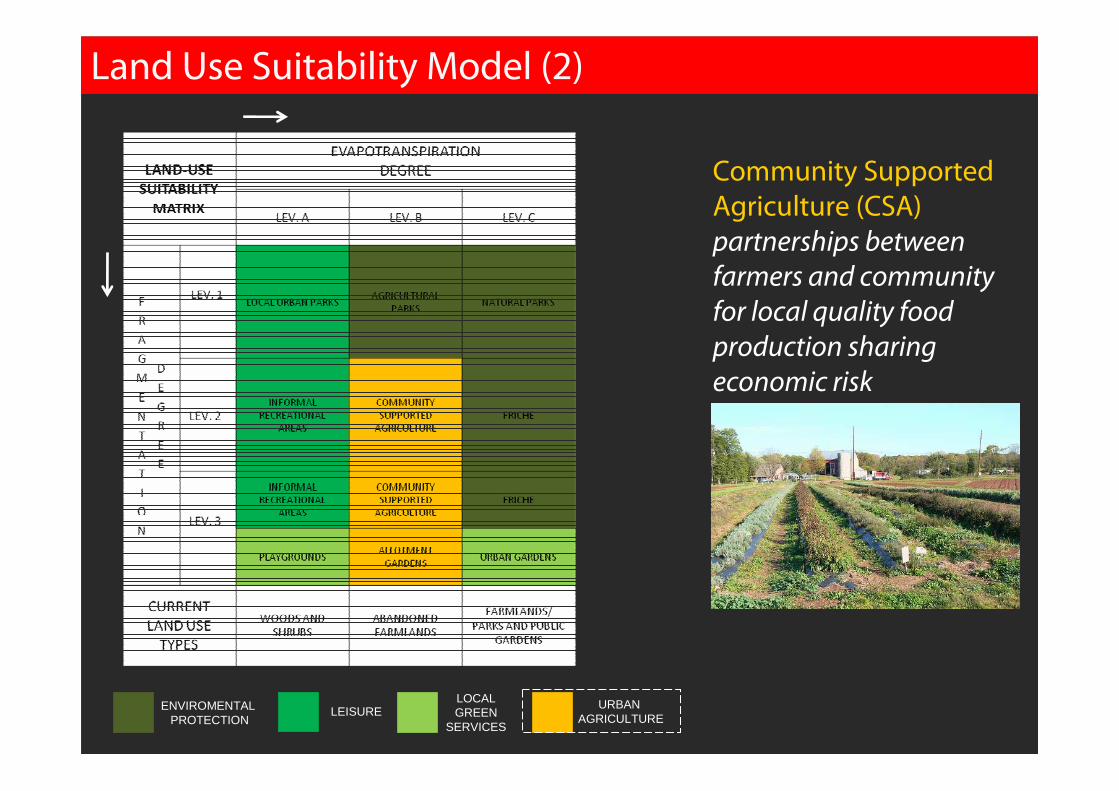
Community Supported
Agriculture (CSA)
partnerships between
farmers and community
for local quality food
production sharing
economic risk

Land Use Suitability Model (2)
LEISUREENVIROMENTAL PROTECTION
LOCAL GREEN
SERVICES
URBAN AGRICULTURE
Informal recreation areas
semi natural areas and
mainly oriented to leisure
and wellness, aimed
mainly at reducing work-
related stress

Compatibility Matrix (1)
PLUS can be, in most cases, different from the current onesIt is important to check the compatibility of the proposed transformations.
Current land uses of NUAs are characterized by the relationship of different bio-physical features with the way these features are used during human activities. A PLU is considered compatible with current land-use when it fits or does not contrast with this relationship.
•Farmlands to Natural Parks: not compatible (altering the characteristics of the land cover and generate loss of agricultural values)•Farmlands to Community supported agriculture: compatible

Map of Prospective Land UsesProspected Land
Uses (PLUs)
Number of
patches
% num of
patches
Total Area (ha)
% area
Average Patch Area
(ha) ET FR PD
Agricultural Park 88 0.07 263.625 0.21 29957.3864 80.3 1.1611 34.0 FRICHE 16 0.01 3.7333 0.00 2333.3125 83.8 1.3077 39.6 LUP 217 0.17 210.97 0.17 9722.1198 70.9 1.1731 33.3 Natural Park 190 0.15 184.8221 0.15 9727.4789 85.4 1.1781 37.3 Playgrounds 27 0.02 11.5051 0.01 4261.1481 70.9 1.4244 41.9 Allotment Gardens 15 0.01 18.9961 0.02 12664.0667 80.3 1.4313 43.7 Informal Recreational Areas
378 0.30 246.0479 0.20 5732.2516 70.9
1.4058 29.2
CSA 331 0.26 307.2429 0.25 4736.4405 83.5 1.4278 31.8
Most frequent: Informal recreational areas (378 patches and 246 ha)
Largest average patch area: Agricultural parks (3 ha)\
Less frequent: Allotment gardens (15 patches)
Smallest: Friches (0.2 ha)Highest evapotranspiration: Natural
Park (85.4)Highest fragmentation: Allotment
Gardens (1.43)Highest proximity: Allotment Gardens
(43.7)

Strategic role of NUAs in the provision of ecosystem services, especially in urban metropolitan areas.
Need of the characterization of NUAs with appropriate analytical tools (LCA, FA, PA, LUSM, CM) to better choose the most appropriate land uses to maintain their integrity and provided ecosystem services.
The results propose a new spatial configuration of NUAs, with a highly differentiated scenario of new land uses. This scenario will give municipalities a varied range of possibilities for the implementation of planning policies on NUAs aimed at conservation and increased provision of ecosystem services.
This is extremely relevant In metropolitan areas, where NUAs have suffered from urban sprawl and have always been considered as generic farmlands or undefined urban green spaces.
Conclusions
Buildings
Cultivated
Impervious
Shrubs
Trees
Herbaceous vegetation
Bare soils
Grass
Fig. 2 Land cover types iden
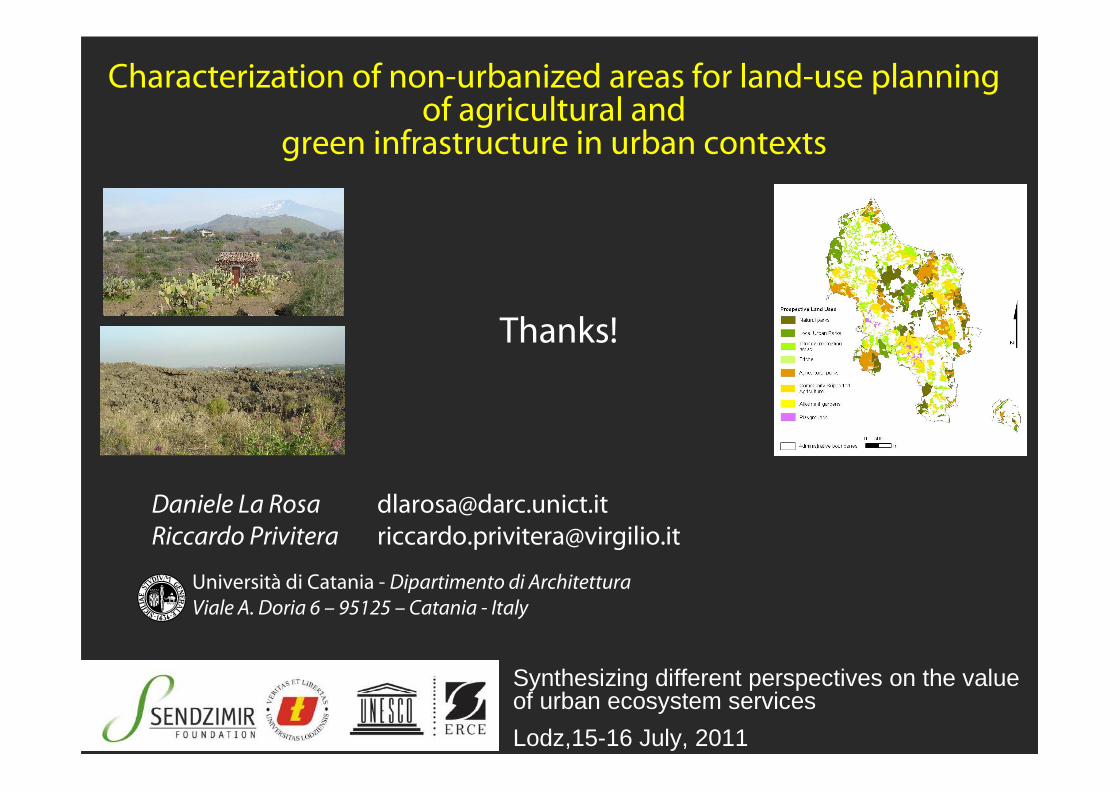
Daniele La Rosa
Riccardo Privitera
Characterization of non-urbanized areas for land-use planning of agricultural and
green infrastructure in urban contexts
Thanks!
Synthesizing different perspectives on the valueof urban ecosystem services
Lodz,15-16 July, 2011
Università di Catania - Dipartimento di Architettura
Viale A. Doria 6 – 95125 – Catania - Italy