characterization of polarization-mode dispersion on …
TRANSCRIPT

CHARACTERIZATION OF POLARIZATION-MODE DISPERSION
ON BURIED STANDARD SINGLE-MODE FIBERS
Pradeep Kumar Kondamuri
Committee:Dr. Chris Allen (Chair)Dr. Ron HuiDr. Jim Stiles
Lightwave Lab., ITTC, University of Kansas 2
OVERVIEW
Introduction
PMD concepts
PMD measurement methods: JME method
Measurement setup
Measurement results and data analysis
Conclusions and Future work
Lightwave Lab., ITTC, University of Kansas 3
INTRODUCTION
Fiber-optic communication technology is barely three decades
old but it has made tremendous progress
Currently fourth-generation fiber-optic systems are in use.
Problems in the past included huge fiber loss, inter-modal dispersion, chromatic dispersion, electronic repeaters, etc.
As the bit rate approaches >10 Gb/s per channel, current fiber-optic systems face a different dispersion impairment called ‘polarization-mode dispersion’ (PMD)
PMD is random in nature and so statistical characterization is necessary for better understanding

Lightwave Lab., ITTC, University of Kansas 4
PMD CONCEPTS
PMD in fibersFundamental property of single-mode fibersSignal energy at a given λ is resolved into two orthogonal polarization modes with different refractive indicesDifference in propagation time between both modes is differential group delay (DGD)PMD is a vector quantity in Stokes spaceSpecified using PMD coefficient (ps/(km) or ps/(km)1/2)
Causes of PMDBirefringenceMode coupling

Lightwave Lab., ITTC, University of Kansas 5
BIREFRINGENCE AND MODE COUPLING
BirefringenceDespite their name, ‘single-mode’ fibers support two orthogonal modes of propagation Loss of degeneracy of the two modes is called birefringenceIntrinsic and extrinsic factorsPMD is typically larger in older fibers
Mode couplingEnergy of light pulse launched in one mode will couple into the other and vice versa as it propagates along the fiber until both the modes are equally populatedThe length of the fiber at which the average power in one mode is within 1/e2 of that of other is coupling length, Lc
Short fibers (L<<Lc) and long fibers (L>>Lc)

Lightwave Lab., ITTC, University of Kansas 6
PRINCIPAL STATES MODELDeveloped by Poole and Wagner in 1986Assumes coherence time of source is high and PDL (polarization-dependent loss) in the link is negligibleIt states that for a length of fiber, there exists for every frequency a special pair of orthogonal polarization states, called the Principal states of polarization (PSPs) PSP– input polarization for which output state of polarization is independent of frequency to first orderIn time-domain, a light pulse launched in any PSP results in an output pulse that is undistorted to first orderDifference in time delays of the two PSPs is DGD

Lightwave Lab., ITTC, University of Kansas 7
SYSTEM IMPAIRMENTS DUE TO PMD
PMD causes pulse spreading and distortion and thus can lead to
system penalties
In digital systems, DGD results in intersymbol interference
(ISI) and hence power penalty
Second-order PMD results in polarization-dependent chromatic
dispersion (PCD) and PSP depolarization
PMD induces coherent cross-talk between channels in
polarization-multiplexed transmission systems

Lightwave Lab., ITTC, University of Kansas 8
PMD MEASUREMENT METHODS
Time-domain methodsOperate by sensing pulse delays
Slow because of the need to determine PSPs experimentally
Generally not suitable for field measurements
Frequency-domain methodsOperate by detecting changes of polarization with frequency
Suitable for field measurements
Some methods measure scalar instantaneous DGD, few measure mean DGD and some others measure instantaneous PMD vectors

Lightwave Lab., ITTC, University of Kansas 9
JONES MATRIX EIGENANALYSIS (JME) METHOD
Measures instantaneous DGD vectorsAny polarized signal can be expressed as a Jones vectorJones matrix describes the polarization-transforming characteristic of a two-port deviceMeasurement of Jones matrix requires application of 3 known states of linearly polarized light to the DUT
PMD measurement by JME method(Frequency-domain method)

Lightwave Lab., ITTC, University of Kansas 10
JONES MATRIX EIGENANALYSIS (JME) METHOD (cont’d ..)
Jones matrix is determined from the relationship of the measured output states to the known input statesTo determine DGD at a particular λ, Jones matrices at two different λs equally spaced about λ are measuredDGD, ∆τ, is then determined using
ρ1 and ρ2 are the Eigen values of T(ω+∆ω)T-1(ω); T is Jones matrixEigen vectors of T(ω+∆ω)T-1(ω) locate the output PSP as a function of ω
Τhis method can be readily automatedNot always practical in field tests
ωρρ
τ∆
⎟⎠
⎞⎜⎝
⎛
=∆ 2
1Arg

Lightwave Lab., ITTC, University of Kansas 11
MEASUREMENT SETUP
Agilent 8509 B / C
Tunable Laser Source (TLS)HP 8768 E / Agilent 8164 A
DeviceUnderTest
PC-System Controller(Windows)
Polarization Analyzer (PA)
InstrumentController
Dedicated Interface
Monitor
Fiber Patch CordsFiber
Patch cord
GPIB BUS
Measurement setup for making automated DGD measurements.

Lightwave Lab., ITTC, University of Kansas 12
MEASUREMENT SETUP (cont’d..)
Visual basic software running on the system controller controls the system
One measurement at a specific λ and time takes ~ 4 sec.
Max. measurable DGD with 0.1 nm step is ~ 40 ps
Measurement uncertainty is ~ ± 310 fs for 0.1 nm step
Data automatically saved into text files (8 kB - 30 kB)
Measurement system is usually very reliable, but occasionally (once in a month or so) any of the instruments might become frozen

Lightwave Lab., ITTC, University of Kansas 13
MEASUREMENT RESULTS AND DATA ANALYSIS: INDIVIDUAL FIBER SPANS
3 different 95-km fibers (1, 2, and 3) within a slotted-core, direct buried, standard single-mode fiber-optic cableWavelength band: 1510 – 1625 nmSpectral resolution: 0.1 nmMeasurement repetition:on span 1, once every 3 hrson spans 2 and 3, once every 1 ½ hours
Measured, normalized DGD vs.wavelength and time for fiber span 1
(86 days, Nov. 9, 2001 – Feb. 2, 2002)

Lightwave Lab., ITTC, University of Kansas 14
COLOR MAPS (cont’d)
Measured, normalized DGD vs.wavelength and time for fiber span 2
( 14 days, May 4, 2002 – May 18, 2002)
Measured, normalized DGD vs.wavelength and time for fiber span 3
(64 days, May 29, 2002 – Aug. 1, 2002)
Lightwave Lab., ITTC, University of Kansas 15
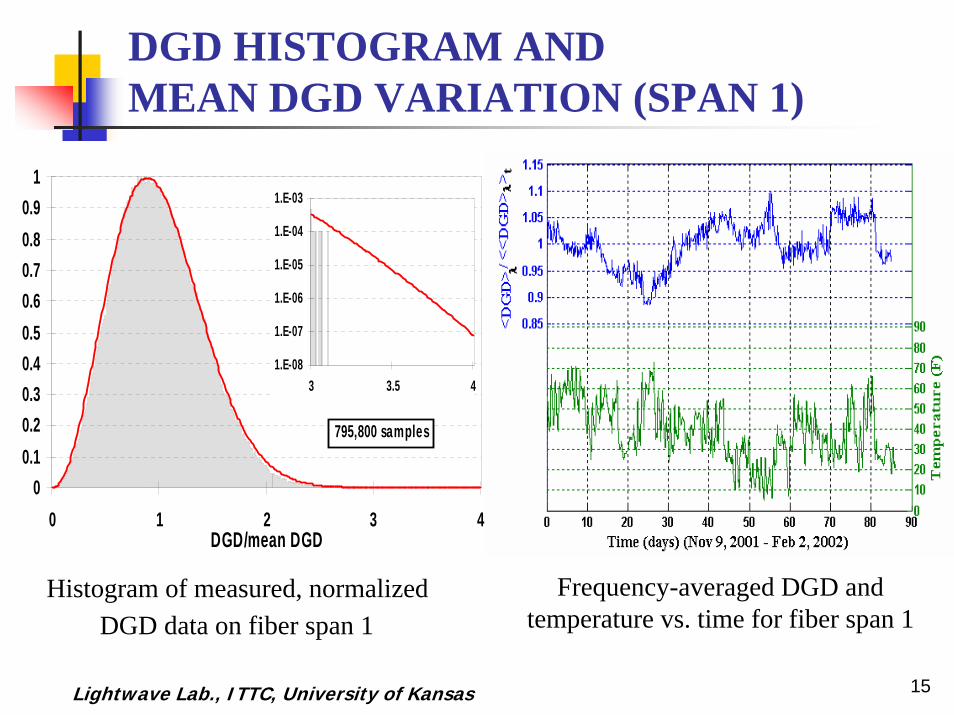
DGD HISTOGRAM AND MEAN DGD VARIATION (SPAN 1)
00.10.20.30.40.50.60.70.80.9
1
0 1 2 3 4DGD/mean DGD
795,800 samples
1.E-08
1.E-07
1.E-06
1.E-05
1.E-04
1.E-03
3 3.5 4
Frequency-averaged DGD and temperature vs. time for fiber span 1
Histogram of measured, normalizedDGD data on fiber span 1

Lightwave Lab., ITTC, University of Kansas 16
TEMPORAL AUTOCORRELATION FUNCTIONS (ACFs) (SPANS 1 AND 2)
Normalized temporal ACF of frequency-averaged DGD data on fiber span 1 and
its theoretical curve-fit
Normalized temporal ACF of frequency-averaged DGD data on fiber span 2 and
its theoretical curve-fit( )
d
dtt
tttACF
∆∆−−
=∆/exp1
)(Theoretical fit:(Source: Paper by
Karlsson et.al, JLT, Vol 18, July 2000)

Lightwave Lab., ITTC, University of Kansas 17
TEMPORAL ACF (SPAN 3) AND SPECTRAL ACF (SPAN1)
Normalized temporal ACF of frequency-averaged DGD data on fiber span 3 and
its theoretical curve-fit
Normalized spectral ACF of time-averaged DGD data from fiber span 1 and its adjusted
theoretical curve-fit
Theoretical fit: ( )( )
2
22 3/exp13
ω
ωτω
∆
∆∆−−=∆ACF
(Source: Paper by Karlsson et.al, Optics Letters, Vol 24, July 1999)τω ∆= /24c

Lightwave Lab., ITTC, University of Kansas 18
SYSTEM OUTAGE ANALYSIS
Goal is to determine outage probability, mean outage rate and mean outage duration as a function of threshold/<∆τ>From “WDM design issues with highly correlated PMD spectra of buried optical cables” by Caponi et.al, OFC ’02
Outage probability: Pout = Pout usually expressed in [minutes/year]
∆τth is threshold; f∆τ( ∆τ) is the pdf of DGD (Maxwellian)
Mean outage rate: Rout = mean number of outage events per unit time [1/year]
Mean outage duration:Tout = Pout/Rout = mean duration of an outage event [minutes]
( ) ( )∫∆
∆ ∆∆−=∆≥∆th
th dfPτ
τ ττττ0
1

Lightwave Lab., ITTC, University of Kansas 19
SYSTEM OUTAGE ANALYSIS (cont’d)
( )∫∞
∞−∆∆∆ ∆⋅∆∆∆∆= '|'')(
21
|' τττττ τττ dffR thout
∆τ’ is the first derivative of ∆τ w.r.t time
f∆τ’|∆τ is the Conditional probability distribution
Caponi has showed that ∆τ’ is independent of ∆τ
( ) ( ) '''21
' ττττ ττ ∆∆∆∆= ∫∞
∞−∆∆ dffR thout
ƒ∆τ(∆τ), and ƒ∆τ’ (∆τ’) are the pdfs of DGD and first derivative of DGD

Lightwave Lab., ITTC, University of Kansas 20
Pout, Rout and Tout values (Individual spans)
Calculated Pout, Rout, and Tout versus threshold/mean DGD for the three fiber spans
3*<DGD> 3.7*<DGD>
Span 1:MTBOOutage duration
6.39 years136 min
1648 years108 min
Span 2:MTBOOutage duration
3.25 years69 min
833 years55 min
Span 3:MTBOOutage duration
3.96 years84 min
1021 years67 min
MTBO = mean time between outages
= 1 / Rout

Lightwave Lab., ITTC, University of Kansas 21
TWO-FIBER CONFIGURATION: COLOR MAPS
Automated PMD
measurement system
span 1 / span 2 / span 3
~ 95 km
EDFA EDFA
span 2 / span 3 / span 1
Measurement setup
Wavelength band: 1535-1565 nm
Spectral resolution: 0.1 nmMeasurement repetition: once every 23 minutes
Measured, normalized DGD vs. wavelength and time for fiber spans
1 and 2 concatenated (18 days, Aug. 22, 2002 – Sept. 9, 2002)

Lightwave Lab., ITTC, University of Kansas 22
COLOR MAPS (cont’d)
Measured, normalized DGD vs. wavelength and time for fiber spans
2 and 3 concatenated (21 days, Aug. 1, 2002 – Aug. 22, 2002)
Measured, normalized DGD vs. wavelength and time for fiber spans
1 and 3 concatenated (16 days, Sept. 27, 2002 – Oct. 13, 2002)
Lightwave Lab., ITTC, University of Kansas 23
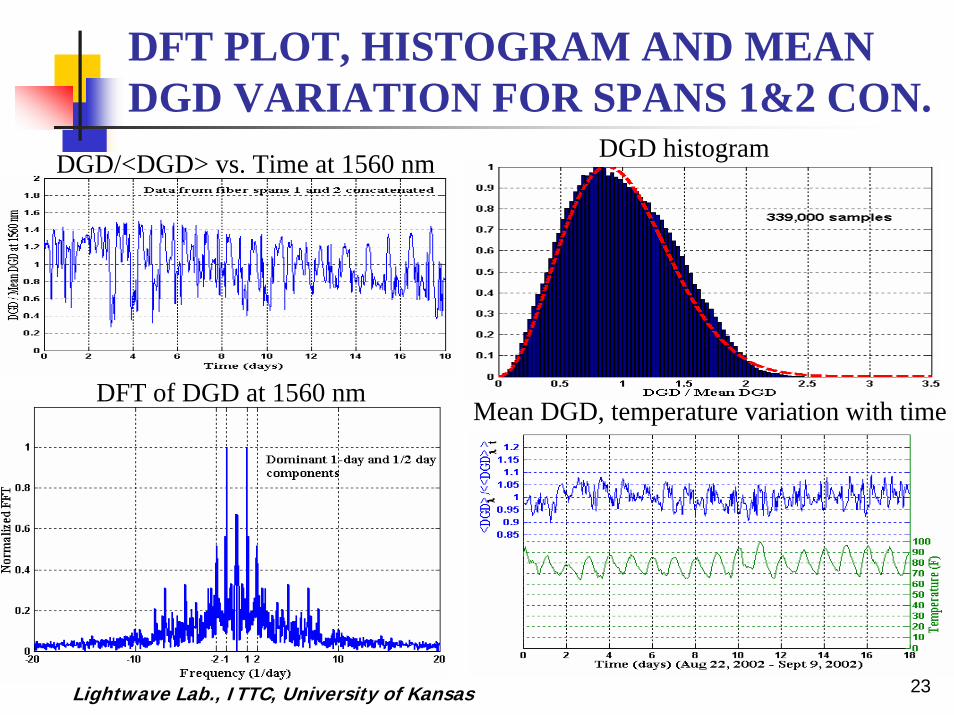
DFT PLOT, HISTOGRAM AND MEAN DGD VARIATION FOR SPANS 1&2 CON.
DGD/<DGD> vs. Time at 1560 nm
DFT of DGD at 1560 nm
DGD histogram
Mean DGD, temperature variation with time

Lightwave Lab., ITTC, University of Kansas 24
TEMPORAL AND SPECTRAL ACFs FOR SPANS 1 & 2 CON.
Normalized temporal ACF of frequency-averaged DGD data
on fiber spans 1 and 2 concatenated and its theoretical curve-fit
Normalized spectral ACF of time-averaged DGD data on fiber spans 1 and 2 and it’s
adjusted theoretical curve-fit

Lightwave Lab., ITTC, University of Kansas 25
SYSTEM OUTAGE ANALYSIS
Calculated Pout, Rout, and Tout versus threshold/mean DGD for two-fiber configurations3*<DGD> 3.7*<DGD>
Spans 1&2: MTBOOutage duration
0.413 years9 min
106 years7 min
Spans 2&3: MTBOOutage duration
0.644 years14 min
167 years11 min
Spans 1&3: MTBOOutage duration
0.525 years11 min
135 years9 min
MTBO = mean timebetween outages
= 1 / Rout

Lightwave Lab., ITTC, University of Kansas 26
DESIGN RULES BASED ONDGD MARGIN
DGD margin Mτ = ∆τRx / <∆τ>; ∆τRX is receiver’s DGD tolerance and <∆τ> is the mean DGD
For cases where Mτ > 3, the frequency of PMD-induced outages will be low, and their duration may be brief
Use of reserved protection channels in WDM systems is a viable solution
For cases where Mτ < 3, the frequency of PMD-induced outages will be high with reasonably long duration
Use of PMD compensators, alternate modulation formats, or even replacing particular fiber segments may be appropriate

Lightwave Lab., ITTC, University of Kansas 27
CONCLUSIONS An automated PMD measurement system was used to make long-term measurements on buried fibersResults showed DGD to vary slowly with time and high-DGD episodes to be spectrally localizedDGD histograms had shapes consistent with Maxwellian<DGD> varied by 10 % or less during the measurementsDrift times of DGD, measured for a long period, agreed with those reported by others, but needs further studyDGD bandwidths estimated agreed well with those found using the theoretical spectral autocorrelation fits Outage analysis showed DGD excursions of > 3 times the <DGD> to be infrequent and relatively short lived

Lightwave Lab., ITTC, University of Kansas 28
FUTURE WORK
Variation of DGD with controlled fiber temperatures could be
studied using a temperature chamber
A detailed study of second-order PMD on buried fibers would
be extremely useful
Discrepancy in temporal autocorrelation analysis should be
studied
It would be interesting to see if the behavior observed on two-
fiber configurations is repeatable with buried EDFAs

Lightwave Lab., ITTC, University of Kansas 29
QUESTIONS?