characterization process to measure the electrical contact
TRANSCRIPT

HAL Id: hal-01670713https://hal.archives-ouvertes.fr/hal-01670713
Submitted on 21 Dec 2017
HAL is a multi-disciplinary open accessarchive for the deposit and dissemination of sci-entific research documents, whether they are pub-lished or not. The documents may come fromteaching and research institutions in France orabroad, or from public or private research centers.
L’archive ouverte pluridisciplinaire HAL, estdestinée au dépôt et à la diffusion de documentsscientifiques de niveau recherche, publiés ou non,émanant des établissements d’enseignement et derecherche français ou étrangers, des laboratoirespublics ou privés.
Characterization process to measure the electricalcontact resistance of Gas Diffusion Layers under
mechanical static compressive loadsSoufiane El Oualid, Rémy Lachat, Denis Candusso, Yann Meyer
To cite this version:Soufiane El Oualid, Rémy Lachat, Denis Candusso, Yann Meyer. Characterization process to mea-sure the electrical contact resistance of Gas Diffusion Layers under mechanical static compres-sive loads. International Journal of Hydrogen Energy, Elsevier, 2017, 42 (37), pp.23920-23931.10.1016/j.ijhydene.2017.03.130. hal-01670713
1
AEM2016
Soufiane El Oualid; Oral-HE-Room-A-final
Abstract ID 224 - International Journal of Hydrogen Energy
Characterization process to measure the electrical contact resistance of Gas
Diffusion Layers under mechanical static compressive loads
S. El Oualid 1, 2, 3, R. Lachat 2, 4, D. Candusso 3, 5, Y. Meyer 1, 2, †,*
1 Univ. Bourgogne Franche-Comté, UTBM, Belfort, France 2 FCellSys, Univ. Bourgogne Franche-Comté, UTBM, Belfort, France 3 FCLAB (FR CNRS 3539), UTBM bâtiment F, Rue Thierry Mieg, F 90010 Belfort Cedex,
France 4 ICB UMR 6303, CNRS Univ. Bourgogne Franche-Comté, UTBM, Belfort, France 5 IFSTTAR / COSYS / SATIE (UMR CNRS 8029), 25 Allée des marronniers, F 78000
Versailles Satory, France
* Corresponding author:
Tel: 0033 3 84 58 36 33
Fax: 0033 3 84 58 36 36
Other email addresses:
†† Research Associate at Sorbonne Universités, Université de Technologie de Compiègne, CNRS, UMR 7337 Roberval, Centre de recherche
Royallieu, CS 60 319 Compiègne cedex, France
International Journal of Hydrogen EnergyVolume 42, Issue 37, 14 September 2017, Pages 23920-23931
2
Abstract
Recent research has identified the mechanical properties of the fuel cell internal components
(in particular, the Gas Diffusion Layers - GDLs) as key-parameters to obtain high final
performances of the generator. The mechanical compression modulus of these components, the
stability of their mechanical properties with respect to temperature and humidity, and their
ability to interact with water have an impact on the electrical contact resistances in the stack
and, by consequence, on the overall performance of the electric generator. Reducing the losses
by contact resistance is an objective necessary to optimize the fuel cells in operation. The study
of GDL electrical behavior under various internal operating conditions provides a suitable
database to better understand their effects on the overall stack performance.
This paper describes an experimental method for measuring the electrical contact resistance
versus the static mechanical pressure applied to the GDLs. A nonlinear behavior of the electrical
contact resistance versus the mechanical stress is observed. The PTFE and MPL additions
modify the electrical contact resistance.
Keywords: Proton Exchange Membrane Fuel Cell; Gas Diffusion Layer; Mechanical properties;
Compressive loads; Electrical contact resistances
Highlights:
• Three industrial GDLs are tested under static electromechanical excitations.
• A specific ex-situ electrical characterization method is developed.
• The electrical contact resistance is nonlinear versus the mechanical pressure.
• The electrical contact resistance decreases versus pressure at room temperature.
• The PTFE and MPL additions to the GDLs modify the electrical contact resistance.

3
1. Introduction
Fuel cell (FC) is one of the most promising solutions to generate power with high efficiency,
portability and near zero-emissions [1, 2]. Proton Exchange Membrane Fuel Cell (PEMFC) or
Polymer Electrolyte Fuel Cell (PEFC) is the most mature and promising FC technology due to
the solid nature of its electrolyte, low start-up temperature and high efficiency. The PEMFC
performance is fully related with the properties of its components, especially with the MEAs
(Membrane Electrode Assemblies), with the assembly process to build a stack, and the
operating conditions. The widespread success of this technology in the industry field is linked
with the high performance provided by the stacks and the stable mechanical behaviors of the
assemblies under both operating and environmental excitations. To reach suitable PEMFC
performance levels and durability targets, it is essential to study both the electrical, thermal and
mechanical behaviors of each MEA element under temperature and humidity variations [3].
Indeed, the coupling between the different physical phenomena inside the MEA leads to
complex effects and interactions on the performance results. In particular, the compressive
strength of the elements, the stability of their mechanical properties versus temperature,
humidity, as well as their capabilities to interact with water have some direct effects on the
electrical contact resistances inside the FC assembly, and thus, on the global performance of
the whole generator. The decrease of the contact resistance losses is obviously required to
optimize the global behavior of the PEMFC technology [4-12].
Gas Diffusion Layer (GDL) is known as a key-component of the MEA [13], due to its role in
the gas diffusion and in the water flushing / management, high thermal and electrical
conductivity, hydrophobicity, and mechanicals properties. Thus, understanding the
compressive behavior of the GDL is required for further improvements of the PEMFC
technology.
In the next part, we will present the different components of a PEMFC in terms of material and
properties, allowing us to expose the operation mode of this generator in details and to highlight
the strong mechanical / electrical interactions existing at the GDL / bipolar plate interfaces. The
conclusions of Section 2 will underline the essentials points that have motivated us to realize
this study focusing on the determination of the electrical contact resistances between gas flow
field plates and Gas Diffusion Layers subjected to mechanical static compressive loads.
With this article, we intend to propose a better understanding of the GDL mechanical behavior
as well as some guidelines for the ex-situ measurement of GDL electrical contact resistances.
The work presented in this article is a step towards the more complex analysis of the mechanical
– electrical GDL properties under real FC operating conditions including thermal and humidity
variations.
2. The key-role of the GDL / bipolar plate interface
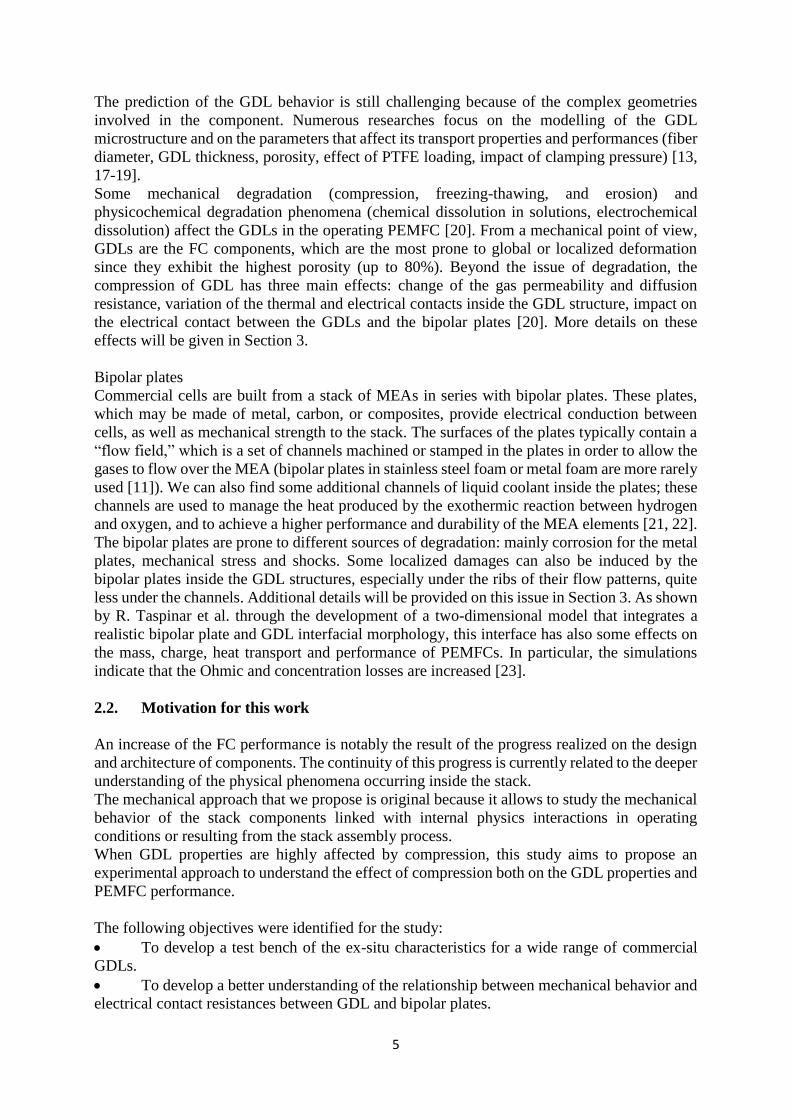
2.1. The FC assembly and its components
A PEMFC has four main components: the polymer electrolyte or membrane, the electro-
Catalyst Layers (CLs), the Gas Diffusion Layers (GDLs), and the Flow Field Plates (FFPs) (or
bipolar plates, gas distribution plates). Fig. 1 shows the classical architecture of a PEMFC. The
Membrane Electrode Assembly (MEA) is built in an additive manner. The membrane is coated
with Catalytic Layers (CLs) and assembled between two GDLs. In order to collect the electrons,
the MEA and the GDLs are inserted between two bipolar plates. The reactants reach the cathode
and anode sides through the channels of the FFPs and the GDLs. This minimal assembly is
called cell. Each cell component is designed to realize specific functions in the MEA.
4
To generate a useful electric power, several cells are stacked and mechanically constrained by
applying a clamping pressure from the terminal plates, usually with fasteners (bolts and nuts)
[3, 14, 15]. As described by Jason Millichamp et al. in [10], various techniques used to put
stacks into compression can now be found in the literature and be obtained from FC stack
suppliers: standard tie rod setup, tie rods through gas / water manifolds, bands, crimps, straps /
curved endplate, leaf-spring, tie rod springs, dynamic fluid compression plate.
Fig. 1. Classical architecture of a PEMFC [16].
Polymer Electrolyte Membrane
PEM, also called a Proton Exchange Membrane, is an organic material providing the proton
selectivity and forcing the electrons generated by Reaction (1) to travel along an external
electric circuit to the cathode side; this is the key of the FC technology. Other substances passing
through the electrolyte would tend to disrupt the chemical reaction.
Catalyst layers
A catalyst layer is added on both sides of the membrane at the anode and cathode sides, and
lead to the MEA. Conventional PEMFC catalytic layers include particles of platinum dispersed
on a high-surface-area of carbon support. This supported platinum catalyst is mixed with an
ion-conducting polymer sandwiched between the membrane and the GDLs. The FC powers are
generated by oxidizing hydrogen atoms into protons and electrons at the anode electrode
(Reaction (1)), and by reducing oxygen atoms with protons at the opposite side (Reaction (2)).
𝐻2 ↔ 2 𝐻+ + 2𝑒− (1) 1
2𝑂2 + 2𝐻+ + 2𝑒− ↔ 𝐻2𝑂 (2)
Gas Diffusion Layers
The MEA is sandwiched between two GDLs. These elements provide the flow of reactants to
catalytic sites, as well as the removal of product water. Each GDL is typically composed of a
sheet of carbon paper in which the carbon fibers are partially coated with
polytetrafluoroethylene – PTFE (note that metal-sheet GDLs also exist [14]). Gases rapidly
diffuse through the pores of the GDL. These pores are kept open by the hydrophobic PTFE,
which prevents excessive water buildup. In many cases, the GDL is coated with a thin layer of
high-surface-area carbon mixed with PTFE, called the micro-porous layer (MPL). The MPL
gives the possibility to manage retention of water to ensure electrolyte conductivity and gas
flow inside the GDL.
5
The prediction of the GDL behavior is still challenging because of the complex geometries
involved in the component. Numerous researches focus on the modelling of the GDL
microstructure and on the parameters that affect its transport properties and performances (fiber
diameter, GDL thickness, porosity, effect of PTFE loading, impact of clamping pressure) [13,
17-19].
Some mechanical degradation (compression, freezing-thawing, and erosion) and
physicochemical degradation phenomena (chemical dissolution in solutions, electrochemical
dissolution) affect the GDLs in the operating PEMFC [20]. From a mechanical point of view,
GDLs are the FC components, which are the most prone to global or localized deformation
since they exhibit the highest porosity (up to 80%). Beyond the issue of degradation, the
compression of GDL has three main effects: change of the gas permeability and diffusion
resistance, variation of the thermal and electrical contacts inside the GDL structure, impact on
the electrical contact between the GDLs and the bipolar plates [20]. More details on these
effects will be given in Section 3.
Bipolar plates
Commercial cells are built from a stack of MEAs in series with bipolar plates. These plates,
which may be made of metal, carbon, or composites, provide electrical conduction between
cells, as well as mechanical strength to the stack. The surfaces of the plates typically contain a
“flow field,” which is a set of channels machined or stamped in the plates in order to allow the
gases to flow over the MEA (bipolar plates in stainless steel foam or metal foam are more rarely
used [11]). We can also find some additional channels of liquid coolant inside the plates; these
channels are used to manage the heat produced by the exothermic reaction between hydrogen
and oxygen, and to achieve a higher performance and durability of the MEA elements [21, 22].
The bipolar plates are prone to different sources of degradation: mainly corrosion for the metal
plates, mechanical stress and shocks. Some localized damages can also be induced by the
bipolar plates inside the GDL structures, especially under the ribs of their flow patterns, quite
less under the channels. Additional details will be provided on this issue in Section 3. As shown
by R. Taspinar et al. through the development of a two-dimensional model that integrates a
realistic bipolar plate and GDL interfacial morphology, this interface has also some effects on
the mass, charge, heat transport and performance of PEMFCs. In particular, the simulations
indicate that the Ohmic and concentration losses are increased [23].
2.2. Motivation for this work
An increase of the FC performance is notably the result of the progress realized on the design
and architecture of components. The continuity of this progress is currently related to the deeper
understanding of the physical phenomena occurring inside the stack.
The mechanical approach that we propose is original because it allows to study the mechanical
behavior of the stack components linked with internal physics interactions in operating
conditions or resulting from the stack assembly process.
When GDL properties are highly affected by compression, this study aims to propose an
experimental approach to understand the effect of compression both on the GDL properties and
PEMFC performance.
The following objectives were identified for the study:
To develop a test bench of the ex-situ characteristics for a wide range of commercial
GDLs.
To develop a better understanding of the relationship between mechanical behavior and
electrical contact resistances between GDL and bipolar plates.
6
To identify the effect of GDL composition on the mechanical and electrical test
responses.
To study the effect of compression on the GDL properties and its influence on the global
PEMFC performance.
In the following part, we will present the various methods to investigate the GDL physical
properties related with the fibres structure. Also, we will discuss the effect of mechanical
compression on the stack performances.
3. Ex-situ and in-situ investigation of GDL behavior
3.1. Structure investigations
GDL material structure provides useful functionality to this component:
High thermal and electric conductivity
Mechanical support to the MEA
Management of the water flow, of the heat from the reaction
Gas diffusion up to the catalytic layers.
The GDL structure is made of a structured carbon fibers layer. Two major structures are found
in the different applications: woven (carbon cloth) and non-woven (carbon paper). The spatial
location of the fibres has a direct effect on the mechanical properties of the GDL, as well as on
the porosity, the permeability, and the electrical behavior [13, 24].
Porosity and pore size distribution
Porosity is the most important properties of GDL and all other physical properties (thermal
conductivity, gas flow, mechanical behavior, water management) may be affected by its change.
A porous material is also characterized by its porosity, denoted Ø and expressed by Eq. (3):
∅ =𝑉𝑝,𝑡
𝑉𝑝,𝑡+𝑉𝑠 (3)
With Vp,t and Vs the pore volume (the volume of void-space) and the bulk volume respectively
(mm3). Porous materials have also cavities or channels which exist in a grain also called intra-
granular pore: the pores can be open, closed or in intercommunication.
The porosity can be measured by a large set of techniques like gas absorption, mercury
porosimetry, SEM or TEM [25, 26]. Mercury standard porosimetry (MSP) is the commonly
used method. In the MSP technique, octane is used as an intrusion liquid to wet the GDL
materials. This technique has the advantage of having very low injection pressures and
providing a nondestructive investigation on any type of porous materials. The assessment of
the pore size distribution is also a characterization method of porous materials. Due to the
randomness in the structure of the GDL, the pore size is not uniform. MSP or MIP (Mercury
Intrusion Porosimetry) can be used to measure this distribution [25, 26]. Yu-Xian Hang et al.
[27] have studied the effect of the porosity gradient on the PEMFC performance, the water
condensation on the open pores of the GDL, and the oxygen transport delay affecting the current
density.
Surface roughness, fibre structure (SEM)
The GDL structure can be conditioned and modified to enhance its intrinsic properties. One of
these modifications is to coat the carbon fibres surfaces with polytetrauoroethylene (PTFE).
According to many studies, this solution has a significant effect under the operating conditions
7
on the mechanical behavior [28-31]. It ensures hydrophobicity of the GDL and protects the
electrodes from flooding [30, 31].
Roughness of the substrate is another structural parameter of the GDL. Fishman et al. [32] have
studied the effect of the surface topography. They have found that non-treated GDL surfaces
with lower roughness have a high retention and a low evaporation of water [6, 33]. In order to
create a smoother surface in contact with the CL, MPL provides a solution to eliminate the
products of the chemical reaction and to increase the durability of the MEA.
During the PEMFC operation, the cell undergoes some changes in its dimension. This results
in a mechanical stress inside the stack. This mechanical stress causes a modification of the
mechanical behavior, of the electrical properties, and of the fluidic properties of the GDLs. This
mechanical stress due to the operating conditions is added to the existing mechanical stress due
to the assembly.
3.2. Effect of compression on stack performance (component properties)
The GDLs are designed to be able to withstand the internal mechanical pressure in the FC stack
and ensure their main functionalities (gas flow, electrical conductivity, water management). To
provide cell sealing (to avoid any gas leaks), mechanical clamping pressure is applied, as well
as to minimize the contact resistance between the different components. The mechanical
properties of a GDL are often evaluated with respect to the compressive elastic and plastic
deformation, (ii) contact resistance, and (iii) the reactant flow under compression.
As already mentioned, the GDL is a composite structure with a high porosity rate, made by
carbon fibers with the potential addition of a PTFE coating and the presence of a MPL. This
leads to an elastic-plastic behavior as a deformable solid material. The relation between the
mechanical stress and the mechanical load applied to a bulk material is given by Relation (4).
𝜎𝑖𝑗 =𝐹𝑖𝑗
𝑆 (4)
𝐹𝑖𝑗 is the component of 𝑒→
𝑖 vector-force acting on the face 𝑗 (N), S is the area on which the
force is acting on (m²), and 𝜎𝑖𝑗 homogeneous components to stresses (N.m-²). In the
orthonormal base 𝑒→
1 𝑒→
2 𝑒→
3 , the stress state is described by Tensor (5).
𝜎 = (
𝜎11 𝜎12 𝜎13
𝜎21 𝜎22 𝜎23
𝜎31 𝜎32 𝜎33
) (5)
In general, the diagonal terms are defined as the normal stresses and the off-diagonal terms as
the shear stresses. The latter are often written 𝜏𝑖𝑗. As a result, the stress tensor can be described
by Tensor (6).
𝜎 = (
𝜎11 𝜏12 𝜏13
𝜏21 𝜎22 𝜏23
𝜏31 𝜏32 𝜎33
) (6)
Normal stress can also be on tensile or compressive mode. This depends on the “+” or “-” sign
of the applied loading. To study the mechanical behavior under compression of a solid material,
8
the classical test is made by a mechanical load of a sample surface and by the record of its
length changes.
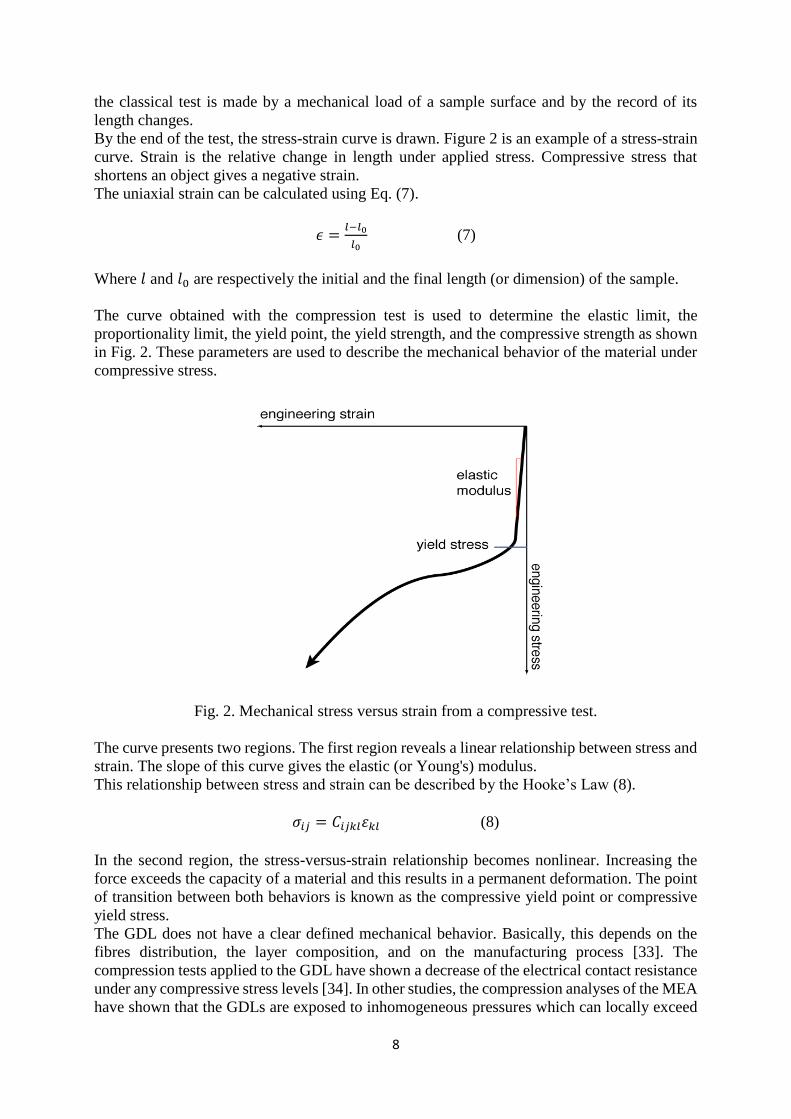
By the end of the test, the stress-strain curve is drawn. Figure 2 is an example of a stress-strain
curve. Strain is the relative change in length under applied stress. Compressive stress that
shortens an object gives a negative strain.
The uniaxial strain can be calculated using Eq. (7).
𝜖 =𝑙−𝑙0
𝑙0 (7)
Where 𝑙 and 𝑙0 are respectively the initial and the final length (or dimension) of the sample.
The curve obtained with the compression test is used to determine the elastic limit, the
proportionality limit, the yield point, the yield strength, and the compressive strength as shown
in Fig. 2. These parameters are used to describe the mechanical behavior of the material under
compressive stress.
Fig. 2. Mechanical stress versus strain from a compressive test.
The curve presents two regions. The first region reveals a linear relationship between stress and
strain. The slope of this curve gives the elastic (or Young's) modulus.
This relationship between stress and strain can be described by the Hooke’s Law (8).
𝜎𝑖𝑗 = 𝐶𝑖𝑗𝑘𝑙𝜀𝑘𝑙 (8)
In the second region, the stress-versus-strain relationship becomes nonlinear. Increasing the
force exceeds the capacity of a material and this results in a permanent deformation. The point
of transition between both behaviors is known as the compressive yield point or compressive
yield stress.
The GDL does not have a clear defined mechanical behavior. Basically, this depends on the
fibres distribution, the layer composition, and on the manufacturing process [33]. The
compression tests applied to the GDL have shown a decrease of the electrical contact resistance
under any compressive stress levels [34]. In other studies, the compression analyses of the MEA
have shown that the GDLs are exposed to inhomogeneous pressures which can locally exceed

9
10 Mpa. Furthermore, a mechanical nonlinear behavior is observed. The addition of PTFE or
MPL has a clear impact on this nonlinear behavior [28]. The loading / unloading cycles have
also a strong influence on the GDL key parameters [35].
Residual deformation and layer damage
The excessive mechanical interne pressure causes a plastic deformation of the GDL, against the
surface contact of the bipolar plate, and leads to a structural deformation called “tenting” (see
Fig. 3 - left). At the other side of the GDL (GDL – electrode interface), the swelling of the
membrane can be inhomogeneous (due to local inhomogeneous rates of humidity). This leads
to a difference of mechanical pressure and may locally cause a mechanical distortion of the FC
components (MEA) [30, 31].
Fig. 3. Illustration of the GDL “tenting” deformation [30] (left) and effect of compression on
a GDL (right).
The structural modifications, illustrated by the thickness changes, the fibres displacement and
cracks over time (see Fig. 3 (right)), interact with other phenomena in the FC system. This
complex problem may impact the reactants flow and the electrical transport parameters in the
system. This leads finally to the decrease of the FC efficiency and to the cell degradation.
Electrical behavior and contact resistance
The capacity of a GDL to transport electrons is ensured by the carbon fibres and can be
measured under three forms: in-plane, through-plane, and contact resistance.
The electrical behavior of a GDL is a function of its thickness, electron conductivity, and
porosity. However, GDL presents a randomness structure. Various studies focus on the relation
between this structure and a change of the GDL electrical behavior on the overall cell
performance.
Zhou et al. [5] have analytically studied the effect of the electrical resistance of the GDL on its
performance in a PEMFC by considering the anisotropic nature of the GDL structure. They
have found that the GDL through and in-plane resistances can be neglected as they have little
effect on the overall cell performance. However, the contact resistance between the PEMFC
components has a significant effect, especially between the bipolar plate and the GDL.
When clamping pressure and intern compression increase, the layer thickness decreases and
this phenomenon directly affects the electrical contact resistance between components.
Ahmad El-kharouf et al. [6] have studied the electrical contact resistance and the electrical in-
plane resistance of a large set of commercial GDLs under two values of compression (1.5 MPa
and 2.6 MPa) using a specific device. The effects of high compression loads on contact

10
resistances have been analyzed in [7]. It should be noted that he behavior of the electrical
contact resistance vs. the mechanical stress is nonlinear. This behavior is due to the fibres
reordering during compression.
In [8], Pradeep Kumar Sow et al. report a novel characterization technique and experimental
setup with the aim to separately evaluate the interfacial and bulk components of the through-
plane electrical resistance of a GDL. The experimental evaluation of the GDL - bipolar plate
interface and GDL bulk electrical resistivity was performed as a function of clamping pressure
and Teflon content for graphite and stainless steel bipolar plates, and for a GDL with and
without an MPL. The measured GDL bulk resistance was found to be at most 10% of the total
Ohmic resistance.
4. Experimental studies
Ex-situ characterization
The ex-situ experimental process developed is the combination of three elements: a Dynamic
Mechanical Analysis (DMA) test machine, a dedicated experimental approach, and a specific
method to extract the electrical contact resistance (TLM Method). A sample holder, depicted in
Fig. 4, has been designed to conduct the experimental process. Then, the GDL sample can
endure mechanical excitation / solicitation close to the operating conditions as cyclic
mechanical compressions, mechanical static compression pre-loads, and dynamic loads, if
necessary.
Fig. 4. Scheme of the specific sample holder used to measure the electrical contact resistance.
The measurements were performed with a Metravib VA2000 DMA machine (Fig. 5). The
machine has force and displacement sensors. It also allows applying a given load in a quasi-
static mode, while increasing the value of displacement in real time. The software displays the
data points and the movement in real time too. This device can apply a maximal force of 64 N.
With a contact surface of 3 mm² (contact areas of the indenters in Fig. 5), a stress value of 10.67
MPa can be achieved.
In order to study the electrical behavior under a given stress, the sample holder is electrically
connected to a voltage generator (Tektronix TDS 2002). Current and voltage between the
measurements points are recorded with a specific acquisition card.
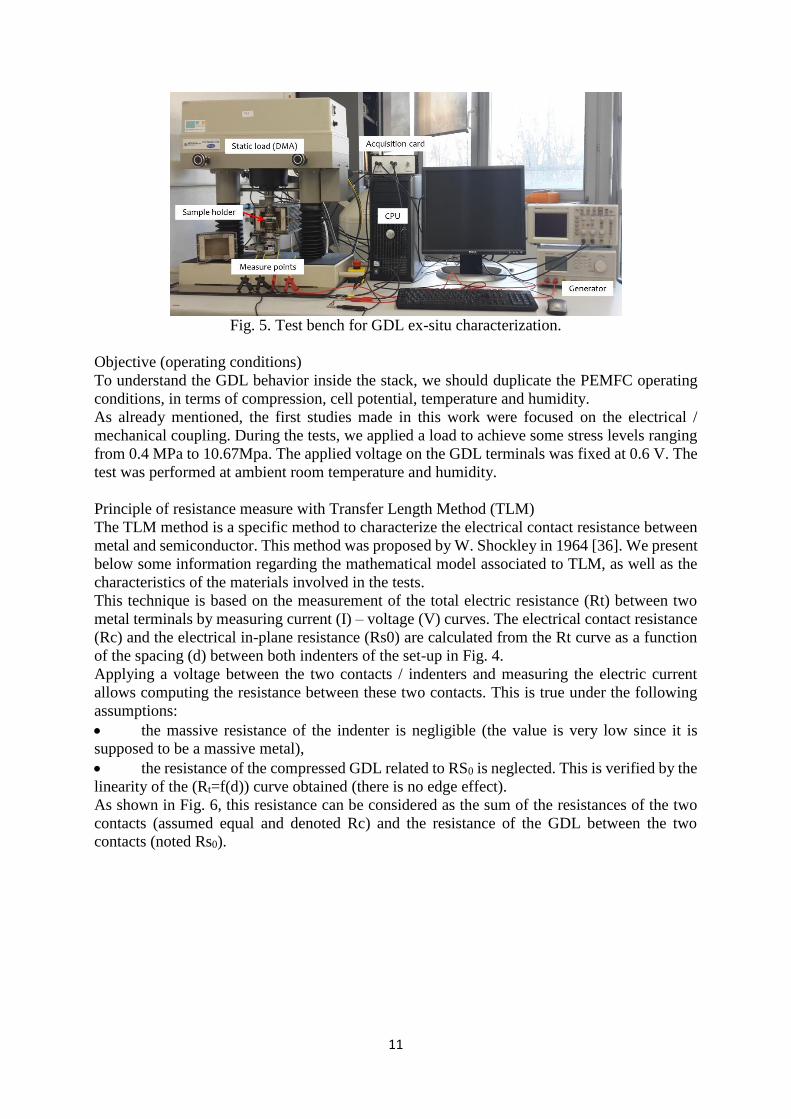
11
Fig. 5. Test bench for GDL ex-situ characterization.
Objective (operating conditions)
To understand the GDL behavior inside the stack, we should duplicate the PEMFC operating
conditions, in terms of compression, cell potential, temperature and humidity.
As already mentioned, the first studies made in this work were focused on the electrical /
mechanical coupling. During the tests, we applied a load to achieve some stress levels ranging
from 0.4 MPa to 10.67Mpa. The applied voltage on the GDL terminals was fixed at 0.6 V. The
test was performed at ambient room temperature and humidity.
Principle of resistance measure with Transfer Length Method (TLM)
The TLM method is a specific method to characterize the electrical contact resistance between
metal and semiconductor. This method was proposed by W. Shockley in 1964 [36]. We present
below some information regarding the mathematical model associated to TLM, as well as the
characteristics of the materials involved in the tests.
This technique is based on the measurement of the total electric resistance (Rt) between two
metal terminals by measuring current (I) – voltage (V) curves. The electrical contact resistance
(Rc) and the electrical in-plane resistance (Rs0) are calculated from the Rt curve as a function
of the spacing (d) between both indenters of the set-up in Fig. 4.
Applying a voltage between the two contacts / indenters and measuring the electric current
allows computing the resistance between these two contacts. This is true under the following
assumptions:
the massive resistance of the indenter is negligible (the value is very low since it is
supposed to be a massive metal),
the resistance of the compressed GDL related to RS0 is neglected. This is verified by the
linearity of the (Rt=f(d)) curve obtained (there is no edge effect).
As shown in Fig. 6, this resistance can be considered as the sum of the resistances of the two
contacts (assumed equal and denoted Rc) and the resistance of the GDL between the two
contacts (noted Rs0).

12
Fig. 6. Description of the different resistances involved in the TLM method.
𝑅𝑆0 (Ω.cm²): Resistance of GDL out of contact.
𝑅𝑆: Resistance of GDL under contact.
𝑅𝑀: Resistance of coated steel (indenter).
𝑅𝑇: Total resistance.
𝑅𝑐: Contact resistance.
𝑑: Distance between indenters.
On the basis of the TLM mathematical model shown in Fig. 6, the total electric resistance (Rt)
can be computed using Eq. (9) and (10).
𝑅𝑡(𝑑) = 2𝑅𝑐 + 𝑅𝑠0(𝑑) (9)
With:
𝑅𝑠0(𝑑) =𝑑
𝑊𝑅𝑠0 (10)
Once the resistance Rt(d) is measured between two consecutive contacts (Fig. 7), we can draw
the curve of resistors Rt versus d (Fig. 8).
Fig. 7. Description of the measurement by the TLM method.
13
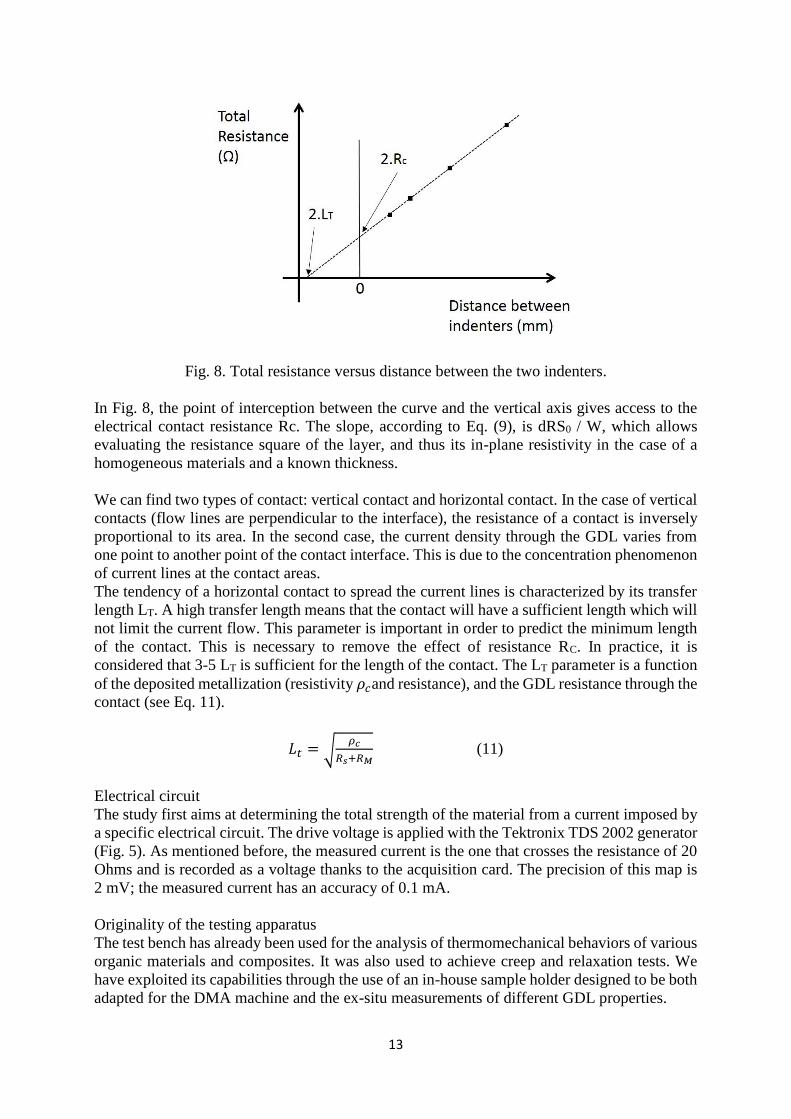
Fig. 8. Total resistance versus distance between the two indenters.
In Fig. 8, the point of interception between the curve and the vertical axis gives access to the
electrical contact resistance Rc. The slope, according to Eq. (9), is dRS0 / W, which allows
evaluating the resistance square of the layer, and thus its in-plane resistivity in the case of a
homogeneous materials and a known thickness.
We can find two types of contact: vertical contact and horizontal contact. In the case of vertical
contacts (flow lines are perpendicular to the interface), the resistance of a contact is inversely
proportional to its area. In the second case, the current density through the GDL varies from
one point to another point of the contact interface. This is due to the concentration phenomenon
of current lines at the contact areas.
The tendency of a horizontal contact to spread the current lines is characterized by its transfer
length LT. A high transfer length means that the contact will have a sufficient length which will
not limit the current flow. This parameter is important in order to predict the minimum length
of the contact. This is necessary to remove the effect of resistance RC. In practice, it is
considered that 3-5 LT is sufficient for the length of the contact. The LT parameter is a function
of the deposited metallization (resistivity 𝜌𝑐and resistance), and the GDL resistance through the
contact (see Eq. 11).
𝐿𝑡 = √𝜌𝑐
𝑅𝑠+𝑅𝑀 (11)
Electrical circuit
The study first aims at determining the total strength of the material from a current imposed by
a specific electrical circuit. The drive voltage is applied with the Tektronix TDS 2002 generator
(Fig. 5). As mentioned before, the measured current is the one that crosses the resistance of 20
Ohms and is recorded as a voltage thanks to the acquisition card. The precision of this map is
2 mV; the measured current has an accuracy of 0.1 mA.
Originality of the testing apparatus
The test bench has already been used for the analysis of thermomechanical behaviors of various
organic materials and composites. It was also used to achieve creep and relaxation tests. We
have exploited its capabilities through the use of an in-house sample holder designed to be both
adapted for the DMA machine and the ex-situ measurements of different GDL properties.
14
First, to have representative results for the FC stack, the indenter is designed to have a
representative dimension of flow field contacts. A gold layer was deposited to minimize the
electric resistance of the indenters and to produce a reference result.
The second point is the mechanical consistency of the results. The mechanical loading must be
distributed in a uniform way across the surface of GDL. This is an essential condition to ensure
the relevance of the results.
The sample holder is specifically designed in a way to guarantee the uniform load for the whole
measurement surface. A ball device is used for this function. The electrical insulation is
guaranteed by glass plates.
5. Results and discussion
The objective of this study is to obtain a better understanding of the GDL – plate set electrical
behavior under stress. The stress-strain curves are plotted from experimental test results. The
compression-creep tests are carried out on different GDL references (Table 1).
Table 1. GDL technical specifications (SGL Carbon company).
GDL
reference
Thickness Sample
(µm)
PTFE addition (wt %) MPL addition
SGL 24 AA 190±30 0 No
SGL 24 BA 190±30 5 No
SGL 24 BC 235±30 5 Yes
The GDLs are made of carbon fiber, and some of them are loaded with PTFE or coated with a
microporous sublayer (MPL). The GDL 24 BC undergoes a treatment with PTFE and has a
MPL.
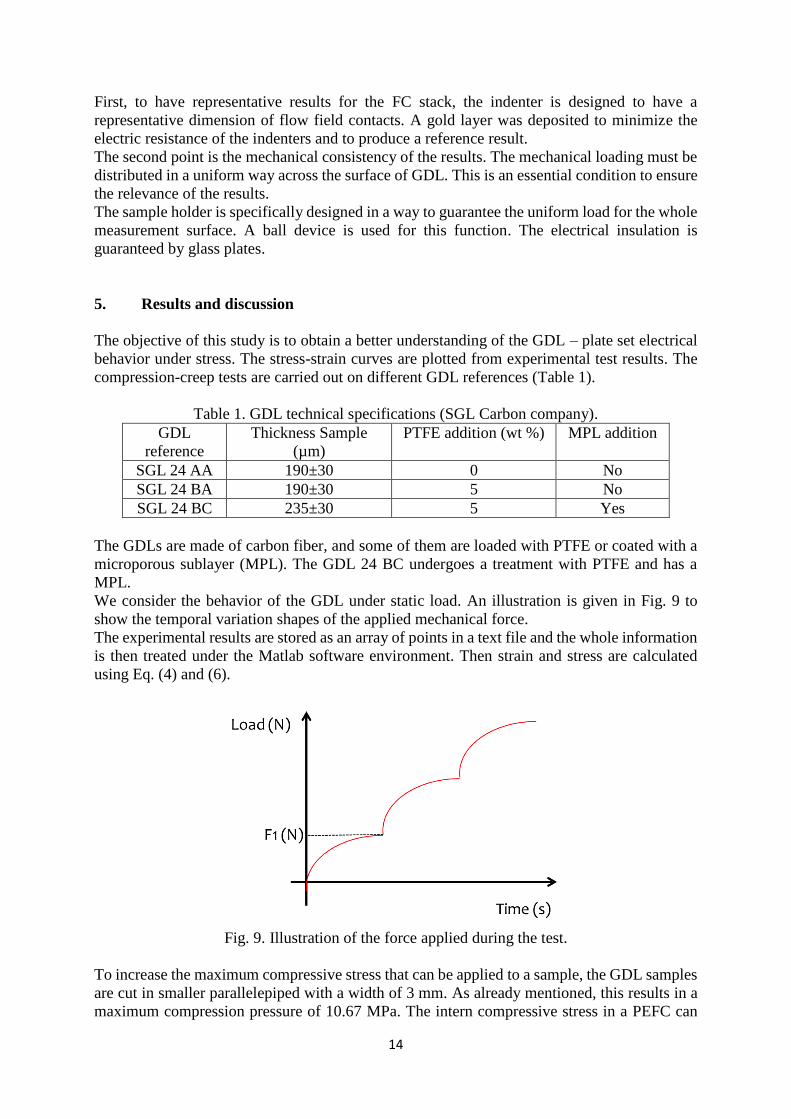
We consider the behavior of the GDL under static load. An illustration is given in Fig. 9 to
show the temporal variation shapes of the applied mechanical force.
The experimental results are stored as an array of points in a text file and the whole information
is then treated under the Matlab software environment. Then strain and stress are calculated
using Eq. (4) and (6).
Fig. 9. Illustration of the force applied during the test.
To increase the maximum compressive stress that can be applied to a sample, the GDL samples
are cut in smaller parallelepiped with a width of 3 mm. As already mentioned, this results in a
maximum compression pressure of 10.67 MPa. The intern compressive stress in a PEFC can

15
reach 10 MPa [28]. Therefore, the purpose of the study is to extend the range of the stress test.
In order to stabilize the mechanical behavior of the GDL, 5 loading / unloading cycles varying
between 0 and Fmax equal to 65 N are applied to the GDL [35].
5.1. Study of the measurement stability and repeatability
Before initiating the test, as already mentioned, the aim is to approach as closely as possible
with our set-up the reality of the physical phenomena inside the stack. Table 2 shows the test
conditions.
Table 2. Experimental parameters and conditions selected for the tests.
Load levels Distance (mm) Voltage (V) Repeatability of test
10, 20, 30, 40,
50, and 60 N
Test with
SGL 24AA
SGL 24BA
SGL 24BC
1,5 6 The tests are made 3
times after 7 cycles of
loading – unloading. 9,28 6
18 6
26 6
To choose these parameter values, some preliminary studies were performed in order to observe
the effect of the chosen levels on the measurements. The first parameter investigated was the
voltage imposed by the power generator (Fig. 5).
Fig. 10. Total resistance versus distance between indenters for three different voltages
imposed with the electrical generator.

16
We applied three different potential values (4V, 6V, and 8V) in order to evaluate the effect of
the voltage value applied at the GDL terminals on the resistance measurement under the
loading. Figure 10 shows that the change of the applied voltage has a negligible effect on the
measured contact resistance.
5.2 Effect of PTFE on GDL stress strain curve
To ensure the gas flow through the GDL and the water management, the fibers are treated with
a hydrophobic agent (PTFE). It leads to a structural effect and arrangement of the fibers, but it
induces also some changes of the physical properties. Many research works were conducted on
PTFE effect over the gas diffusion properties as the permeability [37], whereas the effect of this
additive on the mechanical behavior has been less studied [16].
Figure 11 presents the stress-strain curves of the three GDLs SGL 24AA, SGL 24BA and SGL
24BC with different PTFE contents. One can notice that the three curves show similar shapes,
as the base material is the same (carbon fiber). The loading with PTFE effect becomes more
significant after a stress of 2 MPa. In this first part, the GDL thickness continues to decrease
due to the rearrangement of the fibers and their compaction. Beyond this stress value, the GDL
with SGL 24BC and SGL 24BA references have higher compressive resistances than the
untreated GDL SGL 24 AA. This is due to the presence of PTFE that coats the fibers for granted
over compressibility resistance.
The presence of MPL that contains a significant proportion of PTFE increases the resistance,
which is illustrated in Fig. 11 by the difference between the GDL SGL 24 BC and the GDL
SGL 24 BA.
Fig. 11. Stress-strain curves for three GDLs.
For the highest constraints applied on a GDL, we can observe a kind of trend curve showing a
limit value of deformation. This is due that the GDL is fully compressed. Beyond this stage, we
could cause any damages in the layers and any fiber cracks.
17
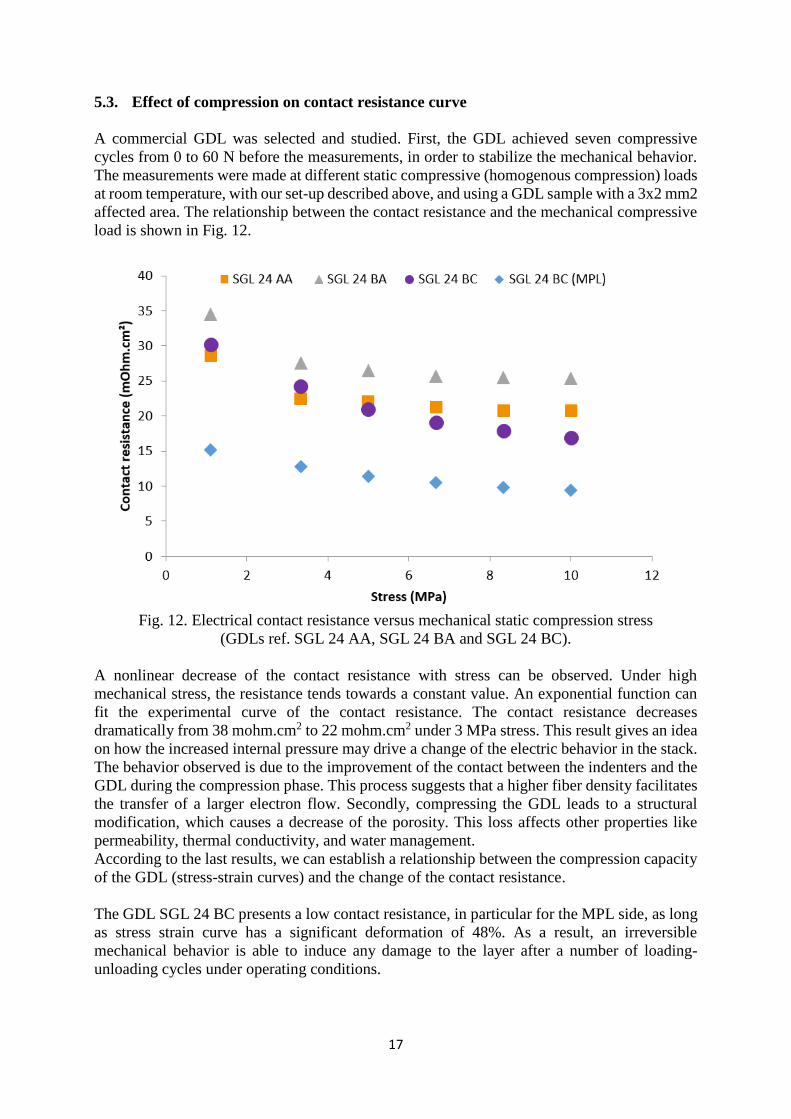
5.3. Effect of compression on contact resistance curve
A commercial GDL was selected and studied. First, the GDL achieved seven compressive
cycles from 0 to 60 N before the measurements, in order to stabilize the mechanical behavior.
The measurements were made at different static compressive (homogenous compression) loads
at room temperature, with our set-up described above, and using a GDL sample with a 3x2 mm2
affected area. The relationship between the contact resistance and the mechanical compressive
load is shown in Fig. 12.
Fig. 12. Electrical contact resistance versus mechanical static compression stress
(GDLs ref. SGL 24 AA, SGL 24 BA and SGL 24 BC).
A nonlinear decrease of the contact resistance with stress can be observed. Under high
mechanical stress, the resistance tends towards a constant value. An exponential function can
fit the experimental curve of the contact resistance. The contact resistance decreases
dramatically from 38 mohm.cm2 to 22 mohm.cm2 under 3 MPa stress. This result gives an idea
on how the increased internal pressure may drive a change of the electric behavior in the stack.
The behavior observed is due to the improvement of the contact between the indenters and the
GDL during the compression phase. This process suggests that a higher fiber density facilitates
the transfer of a larger electron flow. Secondly, compressing the GDL leads to a structural
modification, which causes a decrease of the porosity. This loss affects other properties like
permeability, thermal conductivity, and water management.
According to the last results, we can establish a relationship between the compression capacity
of the GDL (stress-strain curves) and the change of the contact resistance.
The GDL SGL 24 BC presents a low contact resistance, in particular for the MPL side, as long
as stress strain curve has a significant deformation of 48%. As a result, an irreversible
mechanical behavior is able to induce any damage to the layer after a number of loading-
unloading cycles under operating conditions.

18
The presence of PTFE leads to an improvement of the resistance to deformation under increased
pressure. But instead both SGL 24 BA and 24 BC present larger contact resistances than SGL
24 AA.
GDL ref. SGL 24 BC (MPL) is coated with a microporous layer. To highlight the effect of this
layer on the contact resistance, we chose to achieve some tests on the MPL-side. Figure 12
shows that the contact resistance between the MPL and the indenter is smaller than the
resistance between the GDL and the indenter.
6. Conclusion
As PEMFC technology becomes gradually mature for a widespread marketing, so the research
and innovation conducted in the mechanical field grow in importance. To reach the various
requirements in terms of durability and reliability, the mechanical constraints must be taken
into account during the design process of FC stacks and the selection of the well-suited
components.
The work described in this article focus on the electrical – mechanical behavior of GDLs for
PEMFC stacks. The GDL mechanical / materials properties play a key-role in the achievement
of high cell performances. In particular, the GDL is the component that is subject to the
strongest deformation. Especially the contact resistance between the GDL and the flow field
plate needs to be studied. It has to be determined by considering different mechanical loads
related both with the internal cell pressure due to the thermal expansion of the MEA
components and the external clamping pressure applied to the cell or stack assembly.
In this paper, we have described an experimental set-up (and the related protocols) that can be
used as an ex-situ tool to determine the contact resistances of different GDL references (and
materials). The electrical measurements are done while imposing mechanical loads to the tested
GDLs. Particular attention was paid to the definition of a preconditioning procedure made of
different loading / unloading cycles in order to stabilize the mechanical behavior of the GDLs
and increase the relevancy of the results.
A nonlinear behavior of the electrical contact resistance versus the mechanical stress was
observed in the experiments. After applying a mechanical pressure of 5 MPa, some constant
values were obtained for the three commercial GDLs. This behavior is due to the GDL fibres
reordering during compression up to the reaching of the physical compaction limit. During
testing, we could also identify the effect of the GDL composition on the mechanical and
electrical test responses. The impact of the PTFE on the GDL behavior was observed. The
increase of the compression resistance was linked to the presence of this additive. This change
in the compression behavior leads to an increase of the electrical resistance.
Through the experiments, we could develop a better understanding of the relationship between
the GDL mechanical behavior and its electrical contact resistances. The set-up will allow
building a database of GDL electrical – mechanical characteristics, which can be useful to
obtain a better understanding of GDL behaviors, to feed with GDL data some more global
multi-physical FC models, to help FC manufacturers in the stack design and in the selection of
suitable components.
Further works will deal with the investigation of mechanical – electrical GDL properties under
real FC operating conditions including thermal and humidity variations.

19
Acknowledgments
The “Région Franche-Comté” is gratefully acknowledged for its support through the funding
of Soufiane El Oualid Master’s thesis in the frame of the project ELICOP (Ref. 2015C-4944
and 2015C-4948).

20
7. References
[1] A Alaswad, A Baroutaji, H Achour, J Carton, Ahmed Al Makky, AG Olabi.
Developments in fuel cell technologies in the transport sector. International Journal of
Hydrogen Energy 2016; 41(37):16499-16508.
[2] Tabbi Wilberforce, A Alaswad, A Palumbo, M Dassisti, AG Olabi. Advances in
stationary and portable fuel cell applications. International Journal of Hydrogen Energy 2016;
41(37):16509-16522.
[3] C-C Chen, D Shaw, K-L Hsueh. Optimization of the electrodes humidification
temperature and clamping pressure to achieve uniform current density in a commercial-sized
proton exchange membrane fuel cell. International Journal of Hydrogen Energy, In Press,
Corrected Proof, Available online 14 October 2016.
[4] D Singdeo, T Dey, PC Ghosh. Contact resistance between bipolar plate and gas diffusion
layer in high temperature polymer electrolyte fuel cells. International Journal of Hydrogen
Energy 2014; 39(2):987-995.
[5] P Zhou, CW Wu, GJ Ma. Contact resistance prediction and structure optimization of
bipolar plates. Journal of Power Sources 2006; 159(2):1115-1122.
[6] Ahmad El-kharouf, Thomas J Mason, Dan JL Brett, Bruno G Pollet. Ex-situ
characterisation of gas diffusion layers for proton exchange membrane fuel cells. Journal of
Power Sources 2012; 218:393-404.
[7] R Montanini, G Squadrito, G Giacoppo. Measurement of the clamping pressure
distribution in polymer electrolyte fuel cells using piezoresistive sensor arrays and digital image
correlation techniques. J Power Sources 2011;196(20):8484-8493.
[8] PK Sow, S Prass, P Kalisvaart, W Mérida. Deconvolution of electrical contact and bulk
resistance of gas diffusion layers for fuel cell applications. International Journal of Hydrogen
Energy 2015; 40(6):2850-2861.
[9] S Tanaka, T Shudo. Experimental and numerical modeling study of the electrical
resistance of gas diffusion layer-less polymer electrolyte membrane fuel cells. Journal of Power
Sources 2015; 278:382-395.
[10] J Millichamp, TJ Mason, TP Neville, N Rajalakshmi, R Jervis, PR Shearing, DJL Brett.
Mechanisms and effects of mechanical compression and dimensional change in polymer
electrolyte fuel cells – A review. Journal of Power Sources 2015; 284:305-320.
[11] M Hamour, JC Grandidier, A Ouibrahim, S Martemianov. Electrical conductivity of
PEMFC under loading. Journal of Power Sources 2015; 289:160-167.
[12] Devin Todd, Scott Bennett, Walter Mérida. Anisotropic electrical resistance of proton
exchange membrane fuel cell transport layers as a function of cyclic strain. International Journal
of Hydrogen Energy 2016; 41(14):6029-6035.

21
[13] DM Fadzillah, MI Rosli, MZM Talib, SK Kamarudin, WRW Daud. Review on
microstructure modelling of a gas diffusion layer for proton exchange membrane fuel cells.
Renewable and Sustainable Energy Reviews, In Press, Corrected Proof, Available online 5
December 2016.
[14] S Tanaka, WW Bradfield, C Legrand, AG Malan. Numerical and experimental study of
the effects of the electrical resistance and diffusivity under clamping pressure on the
performance of a metallic gas-diffusion layer in polymer electrolyte fuel cells. Journal of Power
Sources 2016; 330:273-284.
[15] C Carral, N Charvin, H Trouvé, P Mélé. An experimental analysis of PEMFC stack
assembly using strain gage sensors. International Journal of Hydrogen Energy 2014;
39(9):4493-4501.
[16] Sogol Roohparvarzadeh. Experimental Characterization of the Compressive Behaviour
of Gas Diffusion Layers in PEM Fuel Cells. Thesis, Master of Applied Science in Mechanical
Engineering, University of Waterloo, Ontario, Canada, 2014. 89 Pages.
[17] OM Orogbemi, DB Ingham, MS Ismail, KJ Hughes, L Ma, M Pourkashanian. The
effects of the composition of microporous layers on the permeability of gas diffusion layers
used in polymer electrolyte fuel cells. International Journal of Hydrogen Energy 2016;
41(46):21345-21351.
[18] M Fazeli, J Hinebaugh, Z Fishman, C Tötzke, W Lehnert, I Manke, A Bazylak. Pore
network modeling to explore the effects of compression on multiphase transport in polymer
electrolyte membrane fuel cell gas diffusion layers. Journal of Power Sources 2016; 335:162-
171.
[19] IV Zenyuk, DY Parkinson, LG Connolly, AZ Weber. Gas-diffusion-layer structural
properties under compression via X-ray tomography. Journal of Power Sources 2016; 328:364-
376.
[20] F Lapicque, M Belhadj, C Bonnet, J Pauchet, Y Thomas. A critical review on gas
diffusion micro and macroporous layers degradations for improved membrane fuel cell
durability. Journal of Power Sources 2016; 336:40-53.
[21] Xiao-Zi Yuan, Haijiang Wang. PEM Fuel Cell Fundamentals. In: PEM Fuel Cell
Electrocatalysts and Catalyst Layers: Fundamentals and Applications. Edited by Jiujun Zhang.
Springer-Verlag London, 2008. Pages 1-79. ISBN: 978-1-84800-935-6 (Print) 978-1-84800-
936-3 (Online). DOI 10.1007/978-1-84800-936-3.
[22] Rama P, Chen R, Andrews JD. A review of performance degradation and failure modes
for hydrogen-fuelled polymer electrolyte fuel cells. Proceedings of the Institution of
Mechanical Engineers, Part A: Journal of Power and Energy 2008; 222(5):421-441. [DOI:
10.1243/09576509JPE603].
[23] R. Taspinar, S. Litster, E.C. Kumbur. A computational study to investigate the effects
of the bipolar plate and gas diffusion layer interface in polymer electrolyte fuel cells.
International Journal of Hydrogen Energy 2015; 40(22):7124-7134.
22
[24] Prafful Mangal, Lalit M. Pant, Nicholas Carrigy, Mark Dumontier, Valentin Zingan,
Sushanta Mitra, Marc Secanell. Experimental study of mass transport in PEMFCs: Through
plane permeability and molecular diffusivity in GDLs. Electrochimica Acta 2015; 167:160-171.
[25] Yu M Volfkovich, VS Bagotzky. The method of standard porosimetry: 1. Principles and
possibilities. Journal of Power Sources 1994; 48(3):327-338.
[26] Yu M Volfkovich, VS Bagotzky. The method of standard porosimetry 2. Investigation
of the formation of porous structures. Journal of Power Sources 1994; 48(3):339-348.
[27] Yu-Xian Huang, Chin-Hsiang Cheng, Xiao-Dong Wang, Jiin-Yuh Jang. Effects of
porosity gradient in gas diffusion layers on performance of proton exchange membrane fuel
cells. Energy 2010; 35(12):4786-4794.
[28] Y Faydi, R Lachat, P Lesage, Y Meyer. Experimental Characterization Method of the
Gas Diffusion Layers Compression Modulus for High Compressive Loads and Based on a
Dynamic Mechanical Analysis. Journal of Fuel Cell Science and Technology 2015; 12(5). 5
pages.
[29] Y Faydi, R Lachat, Y Meyer. Thermomechanical characterisation of commercial Gas
Diffusion Layers of a Proton Exchange Membrane Fuel Cell for high compressive pre-loads
under dynamic excitation. Fuel 2016; 182:124-130.
[30] Thomas J Mason, Jason Millichamp, Paul R Shearing, Daniel JL Brett. A Study of the
Effect of Compression on the Performance of Polymer Electrolyte Fuel Cells Using
Electrochemical Impedance Spectroscopy and Dimensional Change Analysis. International
Journal of Hydrogen Energy 2013; 38(18):7414-7422.
[31] Thomas J Mason, Jason Millichamp, Tobias P Neville, Paul R Shearing, Stefaan
Simons, Daniel JL Brett. A study of the effect of water management and electrode flooding on
the dimensional change of polymer electrolyte fuel cells. Journal of Power Sources 2013;
242:70-77.
[32] J Zachary Fishman, Hilary Leung, A Bazylak. Droplet pinning by PEM fuel cell GDL
surfaces. International Journal of Hydrogen Energy 2010; 35(17):9144-9150.
[33] Ahmaf El-Kharouf. Understanding GDL properties and performance in polymer
electrolyte fuel cells. PhD Thesis. University of Birmingham, 10th March 2014.
[34] Ö Aydin, M Zedda, N Zamel. Challenges Associated with Measuring the Intrinsic
Electrical Conductivity of Carbon Paper Diffusion Media. Fuel Cells 2015; 15(3):537-544.
[35] PA Gigos, Y Faydi, Y Meyer. Mechanical characterization and analytical modeling of
gas diffusion layers under cyclic compression. International Journal of Hydrogen Energy 2015;
40(17):5958-5965.
[36] W Shockley. Research and investigation of inverse epitaxial UHF power transistors. Air
Force Atomic Laboratory, Wright-Patterson Air Force Base, USA A1-TOR-64-20, 1964.

23
[37] Aydin Nabovati, James Hinebaugh, Aimy Bazylak, Cristina H Amon. Effect of porosity
heterogeneity on the permeability and tortuosity of gas diffusion layers in polymer electrolyte
membrane fuel cells. Journal of Power Sources 2014; 248:83-90.
24
Figure Captions
Fig. 1. Classical architecture of a PEMFC [16].
Fig. 2. Mechanical stress versus strain from a compressive test.
Fig. 3. Illustration of the GDL “tenting” deformation [30] (left) and effect of compression on
a GDL (right).
Fig. 4. Scheme of the specific sample holder used to measure the electrical contact resistance.
Fig. 5. Test bench for GDL ex-situ characterization.
Fig. 6. Description of the different resistances involved in the TLM method.
𝑅𝑆0 (Ω.cm²): Resistance of GDL out of contact.
𝑅𝑆: Resistance of GDL under contact.
𝑅𝑀: Resistance of coated steel (indenter).
𝑅𝑇: Total resistance.
𝑅𝑐: Contact resistance.
𝑑: Distance between indenters.
Fig. 7. Description of the measurement by the TLM method.
Fig. 8. Total resistance versus distance between the two indenters.
Fig. 9. Illustration of the force applied during the test.
Fig. 10. Total resistance versus distance between indenters for three different voltages
imposed with the electrical generator.
Fig. 11. Stress-strain curves for three GDLs.
Fig. 12. Electrical contact resistance versus mechanical static compression stress
(GDLs ref. SGL 24 AA, SGL 24 BA and SGL 24 BC).

25
Table Captions
Table 1. GDL technical specifications (SGL Carbon company).
Table 2. Experimental parameters and conditions selected for the tests.