characterizing a firefighter’s immediate thermal
TRANSCRIPT

Characterizing a Firefighter’s ImmediateThermal Environment in Live-Fire TrainingScenarios
Joseph M. Willi and Gavin P. Horn*, Illinois Fire Service Institute, Universityof Illinois at Urbana-Champaign, 11 Gerty Drive, Champaign, IL 61820,USA
Joseph M. Willi and Daniel Madrzykowski, National Institute of Standards andTechnology, 100 Bureau Drive, Gaithersburg, MD 20899, USA
Received: 17 August 2015/Accepted: 13 December 2015
Abstract. Detailed characterization of a firefighter’s typical thermal exposures dur-ing live-fire training and responses can provide important insights into the risks facedand the necessary protections, protocols, and standards required. In order to gather
data on representative thermal conditions from a firefighter’s continually varyinglocal environment in a live-fire training exercise, a portable heat flux and gas temper-ature measurement system was created, calibrated, and integrated into firefighter per-
sonal protective equipment (PPE). Data were collected from 25 live-fire trainingexposures during seven different types of scenarios. Based on the collected data, mildtraining environments generally exposed firefighters to temperatures around 50�C and
heat fluxes around 1 kW/m2, while severe training conditions generally resulted intemperatures between 150�C and 200�C with heat fluxes between 3 kW/m2 and 6kW/m2. For every scenario investigated, the heat flux data portrayed a more severeenvironment than the temperature data when interpreted using established thermal
classes developed by the National Institute for Standards and Technology for elec-tronic equipment used by first responders. Local temperatures from the portable mea-surement system were compared with temperatures measured by stationary
thermocouples installed in the training structure for 14 different exposures. It wasdetermined the stationary temperatures represented only a rough approximate boundof the actual temperature of the immediate training environment due to the typically
coarse distribution of these sensors throughout the structure and their relative (fixed)distance from the fire sets. The portable thermal measurement system has providednew insights into the integration of electronic sensors with firefighter PPE and theconditions experienced by firefighters in live-fire training scenarios, which has promise
to improve the safety and health of the fire service.
Keywords: Firefighters, Heat flux, Thermal environment, Thermal class, Live-fire training, Flashover
simulator
* Correspondence should be addressed to: Gavin P. Horn, E-mail: [email protected]
Fire Technology, 52, 1667–1696, 2016
� 2016 The Author(s).
Manufactured in The United States
DOI: 10.1007/s10694-015-0555-1
1
1. Introduction
A firefighter’s thermal exposure on the fire ground or training ground has a signif-icant contribution to the risk faced in their job. Measuring this exposure can pro-vide a means to quantify the risk and guide standards development to improvetraining, personal protective equipment (PPE), technology, and overall firefighterhealth and wellness. According to the National Fire Protection Association(NFPA), over 7500 firefighters were injured during training related activities in theUnited States in 2013 [1]. Instructors throughout the fire service follow the NFPA1403 Standard on Live Fire Training Evolutions [2] in an attempt to minimize therisk involved with this type of training. However, many believe there are addi-tional ways to increase the safety of such activities. For example, thermocoupleshave been integrated into some training structures to allow monitoring of roomtemperatures during training exercises. There is concern that gas temperaturealone may not be a sufficient measure of the risk to which the firefighters areexposed as these stationary thermocouples may be either partially shielded fromsome portion of the fuel or installed in areas distant from where the firefighterswould be exposed. Fatalities that have occurred during live-fire training have ledto discussions about what the future of live-fire training should be [3–9].
In addition to instrumenting training buildings, the response environment hasrecently been augmented through electronic technologies that have potential toenhance fire fighting response capabilities and to acquire vast amounts of poten-tially useful data from different areas of the fire service [10]. Data streams areavailable from permanent installed temperature sensors within structures to whichfirefighters respond, though the utility of these temperature sensors to identifyrisks for firefighters has not been studied [10]. Additionally, portable measurementand data acquisition systems are being researched and developed for integrationwith firefighter PPE [10]. Local temperature measurement and display systems arerelatively inexpensive, compact, and mobile. Heat flux measurements can also pro-vide important additional information, particularly when being used to monitor afire environment, but are more costly in terms of equipment and investment. Theability to study thermal sensor capabilities in a training environment can providea first step towards improved utilization on the fire ground.
While thermal data acquisition capabilities are improving and their applicationsincreasing in scale, there exists limited guidance for fire and training officers onthe thermal and time limits that would ensure a safe live-fire response and trainingexposure. Over the years, a variety of thermal environment classification systemshave been developed by researchers that may be useful to provide such insightwith appropriate instrumentation [11–13]. Many of these systems define three orfour different thermal classes based on temperature and heat flux. In 2006, theNational Institute of Standards and Technology (NIST) reviewed existing thermalenvironment classification data and proposed four thermal classes, defined inTable 1, for use in defining standardized test criteria for electronic safety equip-ment used by firefighters [14].
While the NIST Thermal Classes have been established for evaluation of firefighting electronic equipment, limited experimental time-resolved data exist from
1668 Fire Technology 2016
the perspective of a firefighter’s typical exposure. Previous studies [15, 16] concern-ing firefighter PPE and thermal exposures in a fire environment have describedpre-flashover fire fighting environments with temperatures ranging from 100�C(212�F) to 300�C (572�F) and maximum heat fluxes between 5 kW/m2 and 12kW/m2. However, these studies did not specifically focus on the firefighter’s localenvironment in live-fire training scenarios, and the studied environments oftencontained fuel loads that were different than the wood-based products and strawoften used in NFPA 1403 compliant training exercises. For example, Krasny et al.conducted seven room fire scenarios using fuel loads prohibited for live-fire train-ing by NFPA 1403 (mattresses, sofas, typical residential structure fuels) and com-pared the results to the protection level required for firefighter turnout coats byNFPA 1971 Protective Clothing for Structural Fire Fighting [17]. Similarly, thermalexposures during live-fire training were studied by Rossi [16]. However, in bothcases, the instrumentation used to gather data remained stationary throughout theexperiments. Firefighters typically move throughout a structure during trainingscenarios, so data collected from a single fixed position for the duration of a live-fire training exercise are unable to accurately define the firefighters’ local thermalenvironment. By gathering experimental time-resolved data from the local envi-ronment of a firefighter moving throughout live-fire training scenarios, the live-firetraining environment can be better understood and compared to current descrip-tions of pre-flashover fire fighting thermal conditions. Foster and Roberts havepreviously developed a mobile firefighter carried data acquisition system [12].However, this system was limited by the physical size and the firefighter’s mobil-ity. Furthermore, the available analysis does not interpret the time-resolved effectsof typical fire training conditions.
Additionally, there exists a legacy of research to study the effects of fire fightingPPE and activities on a firefighter’s physiology and biomechanics, which has beenconducted in a variety of testing environments. Some studies have utilized trainingdrills with environmental temperatures less than 100�C in a live-fire burn structureto simulate fire ground activities [18–22]. More commonly, research groups haveused a treadmill protocol in a temperature-controlled (�25�C to 50�C) room [23–28]. While Selkirk and McLellan have shown that the physiological responses toactivity in fire fighting PPE is affected by the ambient temperature of the testingenvironment, there are limited data available upon which to base the representa-tive thermal conditions.
Table 1National Institute of Standards and Technology Thermal Classes
Thermal class Maximum time (min) Maximum temperature (�C) Maximum heat flux (kW/m2)
I 25 100 1
II 15 160 2
III 5 260 10
IV <1 >260 >10
Fire Technology 1669

The purpose of this project is to characterize a firefighter’s typical thermalexposures as a firefighter participates in NFPA 1403 compliant live-fire trainingexercises in order to study risks associated with training as well as establish abaseline for response exposure scenarios and data acquisition systems. To accom-plish this task, a portable measurement and data acquisition system was createdand integrated into firefighter PPE. Laboratory experiments were conducted atNIST to test and calibrate the custom system. This tool was then used to collecttemperature and heat flux measurements from a firefighter’s immediate surround-ings in numerous live-fire training scenarios at the Illinois Fire Service Institute(IFSI). The live-fire exposure data were then interpreted with the NIST ThermalClass system and compared to data from stationary thermocouple arrays installedin the walls of the fire room.
2. Portable Measurement and Data Acquisition System
2.1. System Components and Design
To characterize a firefighter’s continuously changing local thermal exposure dur-ing live-fire training, the data acquisition system shown in Figure 1 was designedto be used with standard firefighter PPE to allow for portability with minimalimpact on mobility. Neither the thermal protection of the PPE nor the user’srange of motion were significantly compromised by the utilization of the system.The measurement and data acquisition system is composed of two main parts: thehelmet and the pack.
The helmet portion of the system (Figure 2) consists of a fire helmet (Cairns880, MSA, Cranberry Township, PA, USA) equipped with a 0.25 mm (0.01 in)bare bead type K thermocouple (Type K, Omega Engineering Inc., Stamford,CT), a heat flux microsensor (HFM) [29], and a custom cooling block for the sen-sor that is attached to an aluminum helmet shield. The thermocouple bead is loca-ted approximately 6 cm (2.4 in) in front of the helmet shield.
In order to mount the thermocouple and HFM to the front of the helmet, fourholes are fabricated along the vertical centerline of the aluminum shield. The ther-mocouple wire passes through the top hole and is located approximately 6 cm(2.4 in) in front of the shield. The three remaining holes are used to mount thecooling block for the HFM to the back of the shield and to mount the HFM tothe front of the shield. The aluminum cooling block is designed specifically for theHFM and contains counterbore holes machined to the HFM’s specifications. A 1/2-20 THD nut is used to hold the HFM in the block. Additionally, a 1/8 in diam-eter ‘‘pipeline’’ is machined around the counterbore holes for the cooling water toflow through. Two 1/8-NPT pipe fittings are used to connect 1/8 in diameter rub-ber tubing from the cooling block to the miniature water pump and water reser-voir in the hydration backpack.
A data logger [30], water reservoir, and miniature water pump [31] are con-tained in various pockets of the hydration backpack (Figure 3). The data loggerrests in the front pocket of the pack and is used to collect and store data from theheat flux microsensor and the thermocouple. The water reservoir, located in the
1670 Fire Technology 2016

rear pocket of the pack, serves as the storage unit for the cooling water. Finally,the water pump used to circulate water from the reservoir through the coolingblock and its battery pack are located in a side pocket of the pack. The low-pro-file pack is worn under the firefighter’s bunker coat on the chest to avoid interfer-ence with the SCBA pack on the back. While this system is designed to work withfire fighting PPE, it’s intended for use as a research instrument at this point. Itcan be advanced for use in the response environment in future efforts.
Figure 1. Customized portable measurement and data acquisitionsystem used for all experiments.
Figure 2. Exploded CAD model of the helmet portion of theportable measurement and data acquisition system.
Fire Technology 1671
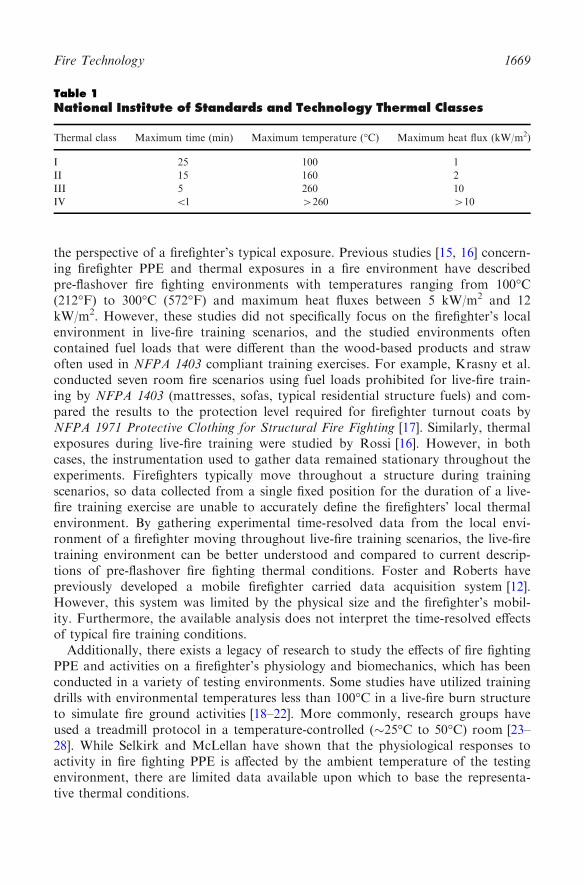
2.2. Laboratory Calibration
All laboratory calibration experiments were performed at NIST in Gaithersburg,MD using a natural gas-fired radiant panel apparatus described in detail inASTM E162 Standard Test Method for Surface Flammability of Materials Using aRadiant Heat Energy Source [32]. The apparatus was modified to provide for arange of heat flux exposures from 1 kW/m2 to 20 kW/m2 for testing firefighterprotective equipment [33–35].
For each experiment, a NIST-calibrated, water-cooled Schmidt–Boelter totalheat flux gauge (SBG) [36] was moved along a horizontal track to locate the dis-tance from the panel with the desired level of heat flux. The distance from thepanel was recorded, and the incident heat flux at this position was measured bythe SBG and collected by a data acquisition system (SCB-100, National Instru-ments Corporation, Austin, TX, USA) for 60 s at a rate of one sample per sec-ond. The entire helmet portion of the portable measurement and data acquisitionsystem with the HFM installed as it would be in the field (Figure 2) was movedalong the horizontal track to the marked position, and the system’s HFM mea-sured the incident heat flux for 60 s at a rate of one sample per second.
Water Pump
Data Logger
Pump Ba�ery Pack
Water Reservoir
Figure 3. Contents of the pack portion of the portable measurementand data acquisition system.
Table 2Heat Flux Microsensor (HFM) and Schmidt–Boelter Gauge (SBG) Labo-ratory Calibration Results
Approximate incident
heat flux (kW/m2)
Average SBG heat
flux (kW/m2)
Average HFM heat
flux (kW/m2)
1 1.08 ± 0.02 1.28 ± 0.09
3 3.26 ± 0.02 3.24 ± 0.10
5 5.27 ± 0.03 5.23 ± 0.10
Data are presented as mean ± standard deviation
1672 Fire Technology 2016

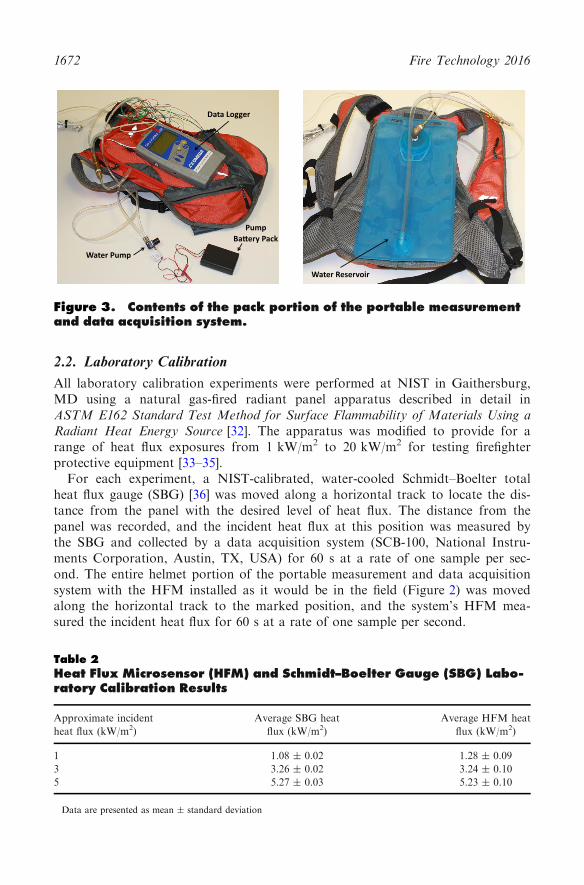
The procedure was performed for incident heat flux values of approximately1 kW/m2, 3 kW/m2, and 5 kW/m2 (Table 2; Figure 4). Firefighter PPE and ther-mal exposures [15, 16] have described pre-flashover fire fighting environments withmaximum heat fluxes between 5 kW/m2 and 12 kW/m2. It was decided that labo-ratory experiments would be conducted at heat fluxes up to the lower end of themaximum range to ensure that the data collected from the helmet mounted HFMcan be generalized to other similar training scenarios. The average and standarddeviation of each experimental data set were calculated and used to generate acalibration curve for the portable system’s HFM module compared to the NIST-traceable SBG (Figure 5).
It is apparent from Figure 4 that the field-deployable HFM module and dataacquisition system has a higher sample-to-sample variation within the 60 s datainterval compared to the laboratory-based SBG sensor and data acquisition sys-tem. The average coefficient of variation (standard deviation/mean) for the threeheat flux levels measured with the SBG sensor was 1.0%, while the HFM of theportable system resulted in a 4.0% variation. Furthermore, the relative variabilityof the HFM module was the largest at the 1 kW/m2 heat flux (6.8%) and reducedfor larger heat fluxes (3.2% and 1.9% for 3 kW/m2 and 5 kW/m2, respectively).The calibration curve in Figure 5 confirms a slope of very near 1 with a highPearson correlation coefficient (R = 0.997). The plot does suggest a slight biastowards over predicting the lowest end of the calibration range, though agreementat 3 kW/m2 and 5 kW/m2 is better than 1%. Together, these results suggest theHFM of the portable measurement and data acquisition system will provide areliable assessment of the moderate to high heat flux values of interest in the Class
Figure 4. Heat flux microsensor (HFM) and Schmidt–Boelter gauge(SBG) data at each incident heat flux for each 60 s calibration expo-sure.
Fire Technology 1673
II–IV levels (Table 1) expected in the training environments. At lower heat fluxvalues (Class I), the HFM’s data will be more significantly affected by A/D con-version noise and result in slightly higher variability. Future iterations of thisdevice may be improved with increased sensor sensitivity (currently 150 lV/W/cm2) or reduction in the noise floor of the data acquisition system.
3. Live-Fire Scenarios
Experimental data were collected from a variety of live-fire scenarios includingmultiple coordinated fire ground training exercises and two different fire behaviordemonstrations: (1) in a concrete-and-steel burn structure and (2) in a metal con-tainer based training prop known as a ‘‘flashover simulator’’. A wide variety ofscenarios—from fuel loads, conditions, and activities commonly used for trainingfirefighters from new recruit to highly experienced veterans—were studied. Priorto entering any structure, a steel plate coated with high emissivity ultra flat blackpaint (� = 0.97) [37] that was acclimatized to the outside ambient temperaturewas placed in front of the HFM module for 30 s to estimate black body emissionat the current environmental conditions and establish background flux. Uponentry into the structure, the firefighter equipped with the portable measurementand data acquisition system followed the company of firefighters throughout thetraining exercise as the temperature and incident heat flux measurements from theimmediate thermal environment were being recorded. This study involved humansubject research, and its methods were approved by the University of Illinois Insti-tutional Review Board.
Figure 5. Heat flux microsensor (HFM) calibration with the Schmidt–Boelter gauge (SBG).
1674 Fire Technology 2016
3.1. Live-Fire Training Exercises
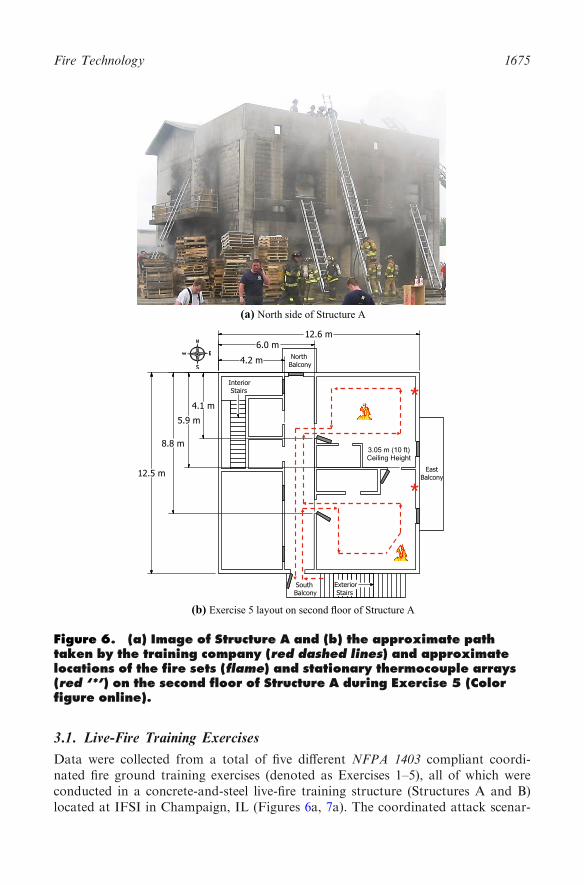
Data were collected from a total of five different NFPA 1403 compliant coordi-nated fire ground training exercises (denoted as Exercises 1–5), all of which wereconducted in a concrete-and-steel live-fire training structure (Structures A and B)located at IFSI in Champaign, IL (Figures 6a, 7a). The coordinated attack scenar-
(a) North side of Structure A
3.05 m (10 ft) Ceiling Height
*
*
(b) Exercise 5 layout on second floor of Structure A
Figure 6. (a) Image of Structure A and (b) the approximate pathtaken by the training company (red dashed lines) and approximatelocations of the fire sets (flame) and stationary thermocouple arrays(red ‘*’) on the second floor of Structure A during Exercise 5 (Colorfigure online).
Fire Technology 1675

(a) Northeast corner of Structure B
Lower Level 3.05 m (10 ft) Ceiling Height
Upper Level 2.44 m (8 ft)
Ceiling Height
Location of FF throughout
demonstration
Levels offset by 0.61 m (2 ft)
* (b) Fire behavior demonstration layout on second floor of Structure B
Figure 7. (a) Image of Structure B and (b) approximate locations ofthe firefighter equipped with portable measurement and data acqui-sition system (red ‘X’), fire sets (flame), and stationary thermocouplearray (red ‘*’) on the second floor of Structure B during the firebehavior demonstration (Color figure online).
1676 Fire Technology 2016
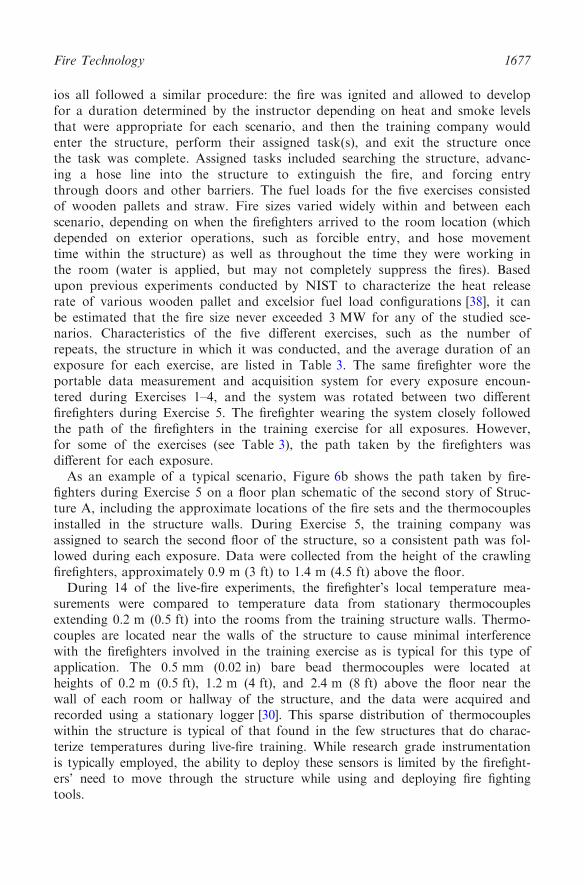
ios all followed a similar procedure: the fire was ignited and allowed to developfor a duration determined by the instructor depending on heat and smoke levelsthat were appropriate for each scenario, and then the training company wouldenter the structure, perform their assigned task(s), and exit the structure oncethe task was complete. Assigned tasks included searching the structure, advanc-ing a hose line into the structure to extinguish the fire, and forcing entrythrough doors and other barriers. The fuel loads for the five exercises consistedof wooden pallets and straw. Fire sizes varied widely within and between eachscenario, depending on when the firefighters arrived to the room location (whichdepended on exterior operations, such as forcible entry, and hose movementtime within the structure) as well as throughout the time they were working inthe room (water is applied, but may not completely suppress the fires). Basedupon previous experiments conducted by NIST to characterize the heat releaserate of various wooden pallet and excelsior fuel load configurations [38], it canbe estimated that the fire size never exceeded 3 MW for any of the studied sce-narios. Characteristics of the five different exercises, such as the number ofrepeats, the structure in which it was conducted, and the average duration of anexposure for each exercise, are listed in Table 3. The same firefighter wore theportable data measurement and acquisition system for every exposure encoun-tered during Exercises 1–4, and the system was rotated between two differentfirefighters during Exercise 5. The firefighter wearing the system closely followedthe path of the firefighters in the training exercise for all exposures. However,for some of the exercises (see Table 3), the path taken by the firefighters wasdifferent for each exposure.
As an example of a typical scenario, Figure 6b shows the path taken by fire-fighters during Exercise 5 on a floor plan schematic of the second story of Struc-ture A, including the approximate locations of the fire sets and the thermocouplesinstalled in the structure walls. During Exercise 5, the training company wasassigned to search the second floor of the structure, so a consistent path was fol-lowed during each exposure. Data were collected from the height of the crawlingfirefighters, approximately 0.9 m (3 ft) to 1.4 m (4.5 ft) above the floor.
During 14 of the live-fire experiments, the firefighter’s local temperature mea-surements were compared to temperature data from stationary thermocouplesextending 0.2 m (0.5 ft) into the rooms from the training structure walls. Thermo-couples are located near the walls of the structure to cause minimal interferencewith the firefighters involved in the training exercise as is typical for this type ofapplication. The 0.5 mm (0.02 in) bare bead thermocouples were located atheights of 0.2 m (0.5 ft), 1.2 m (4 ft), and 2.4 m (8 ft) above the floor near thewall of each room or hallway of the structure, and the data were acquired andrecorded using a stationary logger [30]. This sparse distribution of thermocoupleswithin the structure is typical of that found in the few structures that do charac-terize temperatures during live-fire training. While research grade instrumentationis typically employed, the ability to deploy these sensors is limited by the firefight-ers’ need to move through the structure while using and deploying fire fightingtools.
Fire Technology 1677
Table
3Sum
mary
ofAll
Sce
nari
os
Exercise
Repeats
Structure
Averageduration
±StdDev
(min)
Brief
description
Live-fire
trainingexercises
14
A11±
21st
floorofstructure;samegeneralpath
aroundoneroom;onefuel
package
inmiddle
ofroom
23
A9±
41st
floorofstructure;differentpathsthrough2–3rooms;threefuel
packages
32
B15±
12ndto
4th
floors
ofstructure;differentpath
duringeach
exposure;fuel
pack-
ages
on2ndand3rd
floors
46
A11±
32ndfloorofstructure;samegeneralpath
aroundoneroom;onefuel
package
inmiddle
ofroom
57
A13±
52ndfloorofstructure;path
andfuel
packagelocationsshownin
Figure
6b
Label
Repeats
Structure
Averageduration(m
in)
Brief
description
Firebehaviordem
onstrations
FB
1B
14
Firefighteron2ndfloorofstructure;threefuel
packages
close
together;fire-
fighterstationary
throughout
FL
2C
19±
2Firefighteronlower
level;fire
onupper
level;firefighterstationary
throughout
1678 Fire Technology 2016
3.2. Fire Behavior Demonstrations
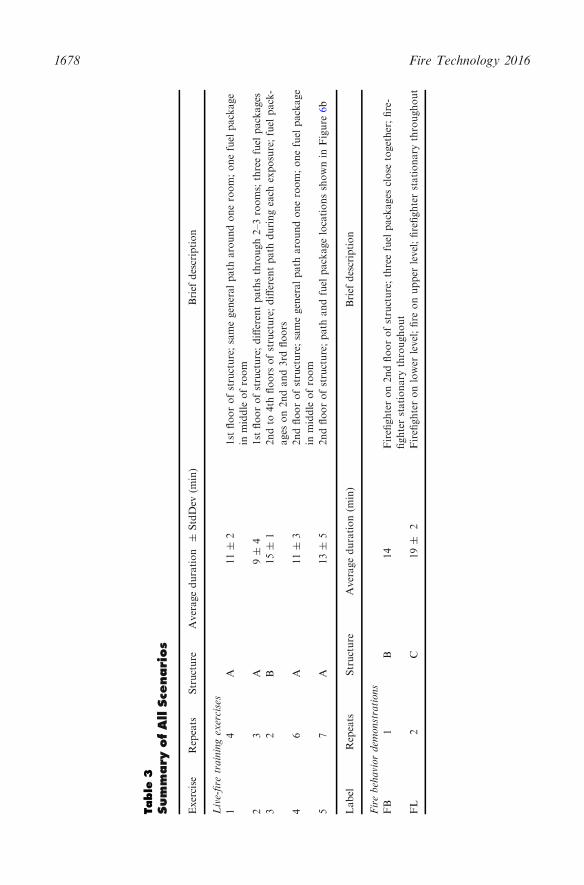
Two different, but common, fire behavior demonstrations were studied usingStructure B in Figure 7 (using only the second floor of the simulated six-storyhigh-rise structure) and Structure C, a typical steel-container-based ‘‘flashoversimulator’’ (Figure 8). In both scenarios, firefighters remained stationary for themajority of the demonstration. The firefighter wearing the portable measurementand data acquisition system was in a position such that data were collected fromheights of approximately 0.9 m (3 ft) to 1.2 m (4 ft) above the floor.
Figure 7b shows the approximate location of the fire sets and the area from whichdata were collected during the fire behavior demonstration in Structure B. Thedemonstration lasted approximately 15 min and involved igniting the fuel load (woo-den pallets and straw); letting the fire develop and allowing ‘‘rollover’’ to occur; sup-
(a) Image of typical "flashover simulator"
Upper Level 2.44 m (8 ft)
Ceiling Height
Levels offset by 1.22 m (4 ft)
Lower Level 2.44 m (8 ft)
Ceiling Height
Location of FF throughout Exposure 1
Location of FF throughout Exposure 2
~1.5 m
OSB
MDF
Ceiling Vent
(b) Fire behavior demonstration layout for Structure C
Figure 8. (a) Image of ‘‘flashover simulator’’ and (b) approximatelocations of the firefighter equipped with portable measurement anddata acquisition system (red ‘X’) and location of fire set (flame) inStructure C during the ‘‘flashover simulator’’ fire behavior demon-stration (Color figure online).
Fire Technology 1679
pressing the fire with a water stream from a smooth bore nozzle; and then repeatingthe process using a combination nozzle set to the wide fog stream pattern.
Two exposures using Structure C, the ‘‘flashover simulator’’, were studied duringa training exercise at an IFSI Regional Training Site in Frankfort, IL. The ‘‘flash-over simulator’’ contains two levels: the lower level where the training companywas located throughout the duration of each exposure and the upper level wherethe fuel load was located. Both exposures used identical fuel loads: two woodenpallets and straw in a fire set located in the middle of the upper level; one1.9 cm 9 1.2 m 9 2.4 m (0.75 in 9 4 ft 9 8 ft) sheet of oriented strand board(OSB) against a side wall of the upper level; and one 1.9 cm 9 1.2 m 9 2.4 m(0.75 in 9 4 ft 9 8 ft) sheet of medium density fiberboard (MDF) against the adja-cent wall of the upper level. Each experiment began by igniting the middle fire setand allowing the fire to develop and rollover to the lower level. Ventilation condi-tions were varied and small amounts of water were applied to the fire several timesto demonstrate the impact of changing these parameters. During Exposure 1, datawere collected from the perspective of a firefighter near the front of the trainingcompany (closer to the source) and during Exposure 2, data were collected fromthe perspective of a firefighter located towards the back of the training company.
4. Results and Discussion
4.1. Live-Fire Training Exercises
Data collected from the five different typical live-fire training exercises are summa-rized in Tables 4 and 5.
Throughout Exercises 1–5, more severe thermal exposures were characterized byambient temperatures generally between 150�C and 200�C (Class II and III) andincident heat fluxes between 3 kW/m2 and 6 kW/m2 (Class III), while moderateexposures consisted of ambient temperatures around 50�C (Class I) and incidentheat fluxes less than 1 kW/m2 (Class I). These values were determined based onthe average and standard deviation of the top and bottom 10% of the heat fluxand temperature measurements collected from Exercises 1–5. To provide a visualcomparison of the range of different exposure conditions, data collected during amore severe exposure (Exercise 2) and data from a moderate exposure (Exercise 5)were plotted against time, as shown in Figure 9. These data provide the first time-resolved picture of a firefighter’s typical thermal exposure while moving through astructure and conducting live-fire training. Qualitatively, there exists a positivecorrelation between the heat flux and temperature variations with time. However,the temperature data peaks and valleys tend to lag behind the peaks in heat fluxand are not as severe. Furthermore, the ratio between these measures is not con-sistent between each training scenario. Even though the same types of fuels areused in all of these scenarios (straw and wood pallets), the varying quantity offuel involvement (due to different levels of fuel consumption and water applica-tion) throughout each scenario will affect direct radiant load and smoke produc-tion.
1680 Fire Technology 2016

Table
5Loca
lTem
pera
ture
Data
for
Exerc
ises
1–5
Exercise
Average±
StdDev
(�C)
Maxim
um
(�C)
NISTThermalClass
averages
duration[m
m:ss](tem
perature
±StdDev
[�C])
III
III
IV
1119±
28
180
03:32(90±
8)
05:41(126±
19)
01:18(167±
4)
00:00(-
)
2113±
45
230
03:41(68±
16)
03:37(130±
17)
01:34(181±
16)
00:00(-
)
3115±
47
238
06:38(69±
13)
04:36(138±
17)
03:01(180±
17)
00:00(-
)
492±
20
162
07:44(84±
14)
02:33(116±
12)
00:03(161±
1)
00:00(-
)
559±
12
137
12:33(53±
16)
00:14(116±
11)
00:00(-
)00:00(-
)
Table
4Loca
lHeatFlu
xData
for
Exerc
ises
1–5
Exercise
Average
±StdDev
(kW/m
2)
Maxim
um
(kW/m
2)
NIST
ThermalClass
averages
duration[m
m:ss](heatflux±
StdDev
[kW/m
2])
III
III
IV
12.4
±1.4
11.1
01:33(0.6
±0.3)
02:50(1.5
±0.3)
06:07(3.2
±1.2)
00:01(10.8
±0.3)
22.5
±1.7
10.0
00:31(0.6
±0.5)
04:16(1.5
±0.2)
04:05(3.9
±1.6)
00:00(-
)
31.4
±1.3
12.7
05:28(0.2
±0.7)
05:03(1.5
±0.3)
03:43(2.8
±0.9)
00:01(12.7
±0.0)
41.0
±1.1
6.9
05:32(0.2
±0.7)
03:10(1.5
±0.3)
01:39(2.8
±0.6)
00:00(-
)
51.0
±0.7
8.8
07:55(0.5
±0.3)
03:43(1.4
±0.3)
01:10(2.9
±1.2)
00:00(-
)
Fire Technology 1681

It has been reported that surface cracking of a firefighter’s SCBA facepiece canbegin to occur at temperatures around 180�C and at an exposure to a heat flux of5 kW/m2 for a minimum of 12 min [35]. Firefighter radios begin to experienceperformance problems (drift of signal frequency, failure to transmit, etc.) whenexposed to Class II/III conditions at 160�C for 15 min [39]. While some environ-ments encountered during Exercises 1–5 contained temperatures and heat fluxesthat exceeded these values, exposure levels varied throughout each training evolu-
(a) Data with linear scaling
(b) Data scaled to different thermal classes
Figure 9. Local temperature and heat flux (moving average of 5 s) ofa more severe thermal environment (Exercise 2) and a moderatethermal environment (Exercise 5) encountered during the various typ-ical response live-fire training exercises.
1682 Fire Technology 2016

tion and were not maintained at these levels continuously for the stated durations.Intermittent cooling occurred as the firefighter moved through the training evolu-tion to areas with lower intensity heat flux exposure. So, no degradation of thefirefighter’s PPE or radio was observed during the exposures.
In Tables 4 and 5, the exposure duration is parsed into the average time spentin each of the NIST Thermal Classes for Exercises 1–5. Based on the temperaturecriteria in Table 1, no evolution exposed the firefighters to thermal conditions thatexceed the maximum times associated with each NIST Thermal Class. Using theheat flux criteria, however, firefighters were exposed to Class III conditions longerthan the suggested maximum time (5 min) for 7 of the 22 exposures encounteredduring Exercises 1–5. The longest exposure for a Class III thermal environmentbased on heat flux criteria was 8 min and 18 sec at an average heat flux of4.1 kW/m2. It is important to note that the durations listed for each class do nottypically represent a continuous amount of time at that level; as firefighters movedthroughout the structure, exposure to varying levels of thermal environmentsoccurred. For example, considering only the temperature data from Exercise 2 inFigure 9b, Class III conditions were encountered between 79 s and 143 s; 248 sand 251 s; 253 s and 262 s; and 335 s and 400 s, for a total time of 141 s in ClassIII conditions. However, the longest amount of continuous time in Class III con-ditions was 65 s (the period from 335 s to 400 s). So, for all environments studiedduring Exercises 1–5, the longest continuous exposure to conditions at or aboveClass III during Exercises 1–5 was 2 min and 55 s. The intermittent thermal expo-sure conditions studied here may have allowed the firefighter’s SCBA facepeiceand other PPE to dissipate some built up heat due to the interior air movementwhich prevented any visual damage to the firefighter’s PPE to occur.
As these results and the tabulated average NIST Thermal Class durations sug-gest, classifying an exposure using the heat flux criteria portrays a more severeexposure than if the temperature criteria were used to characterize the same envi-ronment. In fact, for every exposure encountered during Exercises 1–5, using theheat flux criteria suggested longer exposures to Class II–IV conditions than whenusing the temperature criteria. This result indicates that solely using temperaturemeasurements to monitor a thermal environment in live-fire training scenariosmay not be sufficient to predict risk to firefighters and that other measurements,such as heat flux, should be considered.
4.1.1. Comparison of Structure Temperatures to Immediate Environment Tempera-tures For 14 of the live-fire experiments conducted during Exercises 1–4, station-ary temperatures were measured at the structure walls as described in Sect. 3.1.For each experiment, the fire was approximately located in the middle of theroom. The temperatures measured by the thermocouples in the stationary arraywere compared to the ambient temperature data collected from the firefighter’simmediate thermal environment. The firefighters participating in the training exer-cises were crawling for the majority of the exposure, so the thermocouple used tomeasure the ambient temperature of the firefighter’s immediate environment wasgenerally 0.9 m (3 ft) to 1.4 m (4.5 ft) above the floor.
Fire Technology 1683
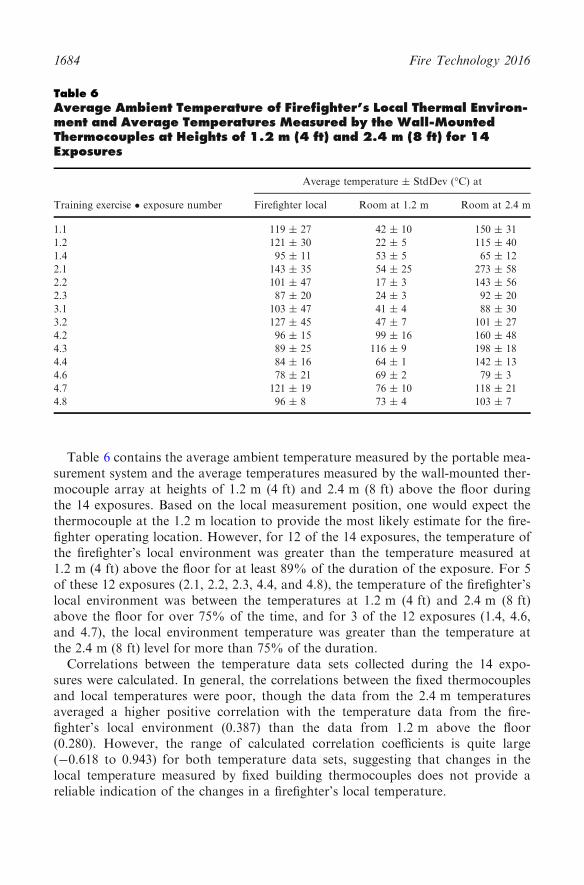
Table 6 contains the average ambient temperature measured by the portable mea-surement system and the average temperatures measured by the wall-mounted ther-mocouple array at heights of 1.2 m (4 ft) and 2.4 m (8 ft) above the floor duringthe 14 exposures. Based on the local measurement position, one would expect thethermocouple at the 1.2 m location to provide the most likely estimate for the fire-fighter operating location. However, for 12 of the 14 exposures, the temperature ofthe firefighter’s local environment was greater than the temperature measured at1.2 m (4 ft) above the floor for at least 89% of the duration of the exposure. For 5of these 12 exposures (2.1, 2.2, 2.3, 4.4, and 4.8), the temperature of the firefighter’slocal environment was between the temperatures at 1.2 m (4 ft) and 2.4 m (8 ft)above the floor for over 75% of the time, and for 3 of the 12 exposures (1.4, 4.6,and 4.7), the local environment temperature was greater than the temperature atthe 2.4 m (8 ft) level for more than 75% of the duration.
Correlations between the temperature data sets collected during the 14 expo-sures were calculated. In general, the correlations between the fixed thermocouplesand local temperatures were poor, though the data from the 2.4 m temperaturesaveraged a higher positive correlation with the temperature data from the fire-fighter’s local environment (0.387) than the data from 1.2 m above the floor(0.280). However, the range of calculated correlation coefficients is quite large(-0.618 to 0.943) for both temperature data sets, suggesting that changes in thelocal temperature measured by fixed building thermocouples does not provide areliable indication of the changes in a firefighter’s local temperature.
Table 6Average Ambient Temperature of Firefighter’s Local Thermal Environ-ment and Average Temperatures Measured by the Wall-MountedThermocouples at Heights of 1.2 m (4 ft) and 2.4 m (8 ft) for 14Exposures
Training exercise � exposure number
Average temperature ± StdDev (�C) at
Firefighter local Room at 1.2 m Room at 2.4 m
1.1 119 ± 27 42 ± 10 150 ± 31
1.2 121 ± 30 22 ± 5 115 ± 40
1.4 95 ± 11 53 ± 5 65 ± 12
2.1 143 ± 35 54 ± 25 273 ± 58
2.2 101 ± 47 17 ± 3 143 ± 56
2.3 87 ± 20 24 ± 3 92 ± 20
3.1 103 ± 47 41 ± 4 88 ± 30
3.2 127 ± 45 47 ± 7 101 ± 27
4.2 96 ± 15 99 ± 16 160 ± 48
4.3 89 ± 25 116 ± 9 198 ± 18
4.4 84 ± 16 64 ± 1 142 ± 13
4.6 78 ± 21 69 ± 2 79 ± 3
4.7 121 ± 19 76 ± 10 118 ± 21
4.8 96 ± 8 73 ± 4 103 ± 7
1684 Fire Technology 2016
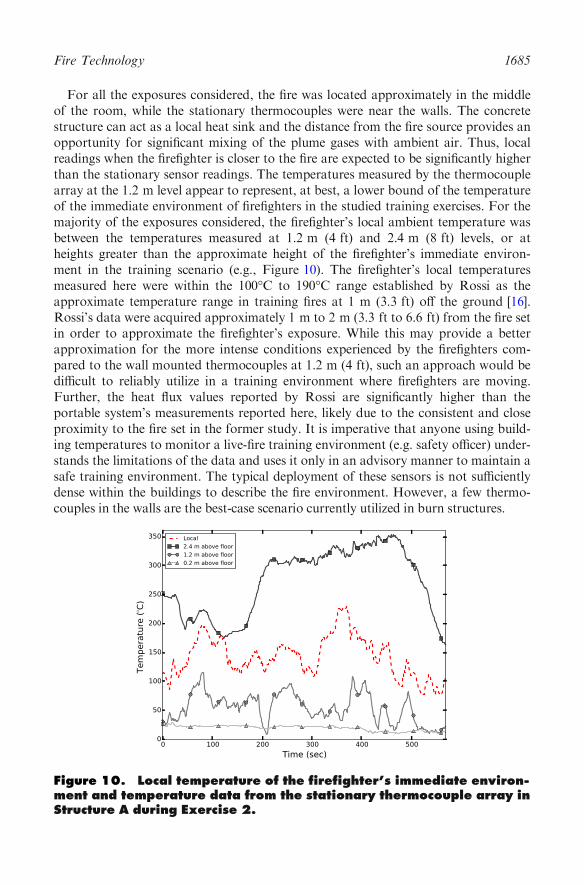
For all the exposures considered, the fire was located approximately in the middleof the room, while the stationary thermocouples were near the walls. The concretestructure can act as a local heat sink and the distance from the fire source provides anopportunity for significant mixing of the plume gases with ambient air. Thus, localreadings when the firefighter is closer to the fire are expected to be significantly higherthan the stationary sensor readings. The temperatures measured by the thermocouplearray at the 1.2 m level appear to represent, at best, a lower bound of the temperatureof the immediate environment of firefighters in the studied training exercises. For themajority of the exposures considered, the firefighter’s local ambient temperature wasbetween the temperatures measured at 1.2 m (4 ft) and 2.4 m (8 ft) levels, or atheights greater than the approximate height of the firefighter’s immediate environ-ment in the training scenario (e.g., Figure 10). The firefighter’s local temperaturesmeasured here were within the 100�C to 190�C range established by Rossi as theapproximate temperature range in training fires at 1 m (3.3 ft) off the ground [16].Rossi’s data were acquired approximately 1 m to 2 m (3.3 ft to 6.6 ft) from the fire setin order to approximate the firefighter’s exposure. While this may provide a betterapproximation for the more intense conditions experienced by the firefighters com-pared to the wall mounted thermocouples at 1.2 m (4 ft), such an approach would bedifficult to reliably utilize in a training environment where firefighters are moving.Further, the heat flux values reported by Rossi are significantly higher than theportable system’s measurements reported here, likely due to the consistent and closeproximity to the fire set in the former study. It is imperative that anyone using build-ing temperatures to monitor a live-fire training environment (e.g. safety officer) under-stands the limitations of the data and uses it only in an advisory manner to maintain asafe training environment. The typical deployment of these sensors is not sufficientlydense within the buildings to describe the fire environment. However, a few thermo-couples in the walls are the best-case scenario currently utilized in burn structures.
Figure 10. Local temperature of the firefighter’s immediate environ-ment and temperature data from the stationary thermocouple array inStructure A during Exercise 2.
Fire Technology 1685
These temperature comparisons also provide useful information for investiga-tors designing research protocols for physiological testing of firefighters. Studies,such as those conducted in live-fire training buildings, have reported ambient tem-peratures at the 1.2 m (4 ft) level as approximately 71�C to 82�C [22], which isnear the upper end of the average temperatures reported in Table 6 at 1.2 m(4 ft). However, these values are typically lower than the average temperatures ofthe firefighter’s local environment during the same exposures. Laboratory-basedphysiological test scenarios (which are often necessitated due to sensitive equip-ment) are typically performed at temperatures around 35�C to 50�C. While thesevalues match the lower end of the 1.2 m (4 ft) building temperature conditions,they do not approximate the firefighter’s local exposure conditions. Furthermore,these physiology-focused studies typically employ temperatures that are relativelyconstant, which is different than the continuously varying temperatures typicallyencountered on the training ground (Figure 9). As Selkirk and McLellan [23] haveshown, physiological responses to activities in PPE are affected by the temperatureof the environment, so these differences should be considered in future iterationsof firefighter physiological studies where possible. Finally, the effect of heat fluxon firefighter physiological responses has not been studied to the same level ofdetail as exposure to high ambient air temperature environments.
4.2. Fire Behavior Demonstrations
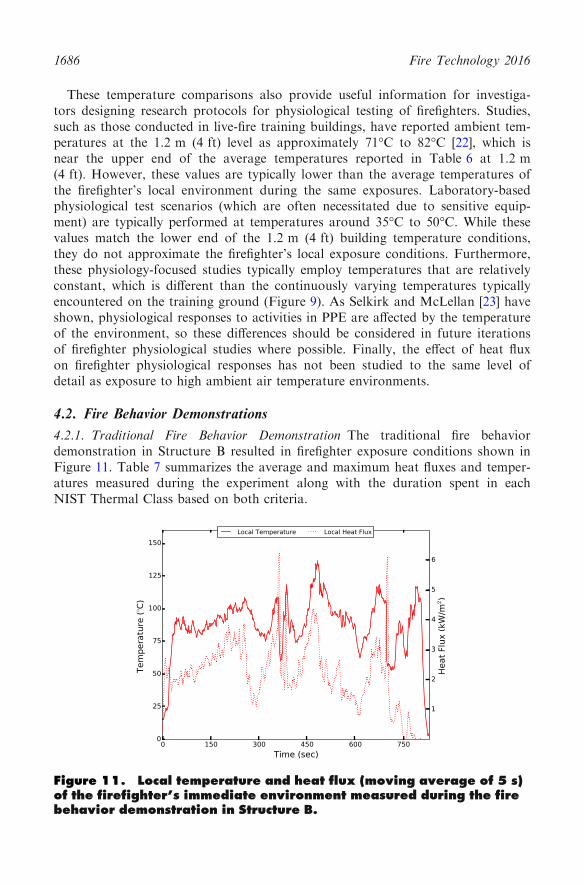
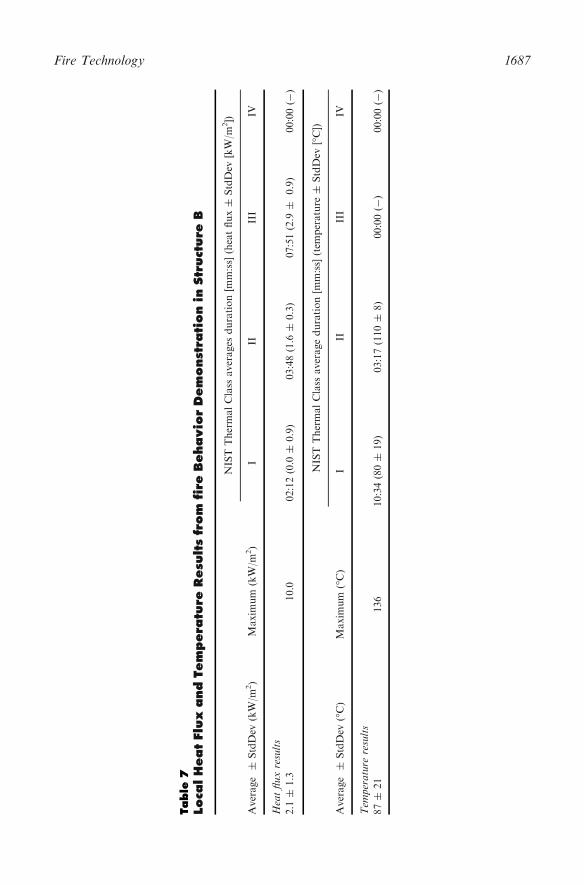
4.2.1. Traditional Fire Behavior Demonstration The traditional fire behaviordemonstration in Structure B resulted in firefighter exposure conditions shown inFigure 11. Table 7 summarizes the average and maximum heat fluxes and temper-atures measured during the experiment along with the duration spent in eachNIST Thermal Class based on both criteria.
Figure 11. Local temperature and heat flux (moving average of 5 s)of the firefighter’s immediate environment measured during the firebehavior demonstration in Structure B.
1686 Fire Technology 2016
Table
7Loca
lHeatFlu
xand
Tem
pera
ture
Resu
lts
from
fire
Behavio
rDem
onst
ration
inStr
uct
ure
B
Average
±StdDev
(kW/m
2)
Maxim
um
(kW/m
2)
NISTThermalClass
averages
duration[m
m:ss](heatflux±
StdDev
[kW/m
2])
III
III
IV
Heatfluxresults
2.1
±1.3
10.0
02:12(0.0
±0.9)
03:48(1.6
±0.3)
07:51(2.9
±0.9)
00:00(-
)
Average
±StdDev
(�C)
Maxim
um
(�C)
NISTThermalClass
averageduration[m
m:ss](tem
perature
±StdDev
[�C])
III
III
IV
Tem
perature
results
87±
21
136
10:34(80±
19)
03:17(110±
8)
00:00(-
)00:00(-
)
Fire Technology 1687
Compared to the live-fire training exercises, the thermal environment encoun-tered during the traditional fire behavior demonstration in Structure B wasdefined by relatively moderate temperatures averaging 87�C (Class I) and reachinga maximum of 136�C (Class II) and moderate to severe incident heat fluxes aver-aging 2.1 kW/m2 (Class III) and reaching a maximum of 10.0 kW/m2 (Class III/IV). The average heat flux was typically higher than the coordinated fire attackscenarios, yet the average temperature was near the lowest levels encountered dur-ing the coordinated attack scenarios. In fact, based on the NIST Thermal Classheat flux criteria, the firefighters were exposed to Class III conditions for 7 minand 51 s, which exceeds the maximum suggested time of 5 min (as with the coor-dinated attack scenarios, the firefighter did not experience a continuous exposureto these levels). On the other hand, the conditions never entered the Class IIIregion based on the temperature criteria. Figure 11 shows significant reductions intemperature at approximately 375 s and 675 s when water is applied to the fire.These breaks in the high temperature and heat flux conditions may have beenenough to keep PPE damage from occurring. It is interesting to note that a sharpspike in local heat flux is experienced each time water is briefly applied to the fire.This phenomenon is attributed to convective heat transfer due to steam generationin the relatively small, enclosed room and close proximity to the fire set.
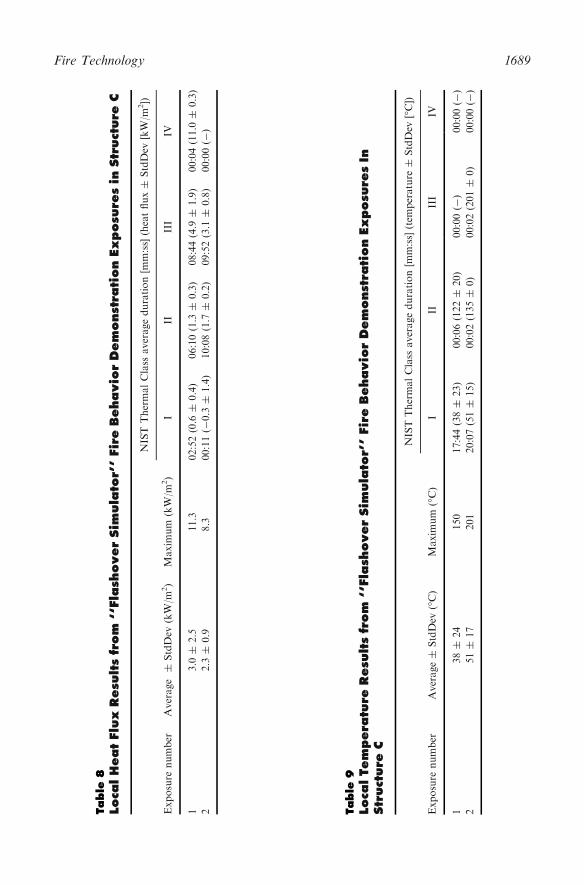
4.2.2. ‘‘Flashover Simulator’’ Fire Behavior Demonstrations Figure 12a, b containplots of the ambient temperature and heat flux as a function of time for Expo-sures 1 (firefighter located closer to the fire set) and 2 (farther from the fire set),respectively, for the ‘‘flashover simulator’’ fire behavior demonstration in Struc-ture C. Tables 8 and 9 list the average and maximum heat fluxes and ambienttemperatures of the firefighter’s immediate environment for each of the two expo-sures along with the total amount of time spent in each NIST Thermal Class.
Once again, using the ambient temperature data to define the thermal environ-ment of each exposure produces drastically different results than using the incidentheat flux data. Based on ambient temperature data, the environment of the ‘‘flash-over simulator’’ training exercise was quite mild, with average ambient tempera-tures of 38�C and 51�C (Class I). Class II conditions were experienced for a totalof 6 s during Exposure 1 and for a total of 4 s during Exposure 2, each instanceoccurring at the very end of the exposure when the firefighter stood up to exit thecontainer. However, the incident heat flux data from the two exposures suggestthe environment of the ‘‘flashover simulator’’ training exercise was severe, contain-ing average heat fluxes of 3.0 kW/m2 and 2.3 kW/m2 (Class III in both cases) andmaximum heat fluxes of 11.3 kW/m2 and 8.3 kW/m2 (Class IV and III, respec-tively) for each exposure. Additionally, the NIST Thermal Class durations gener-ated using the heat flux data suggested that firefighters were in conditions thatexceeded the Class III maximum recommendation (5 min) for each exposure.
To further visualize the differences in NIST Thermal Classifications based onheat flux and temperature data, kernel density estimations (KDEs) were calculatedto estimate the probability density functions of the heat flux and temperature datasets from each of the three fire behavior demonstration exposures (Figure 13).
1688 Fire Technology 2016
Table
9Loca
lTem
pera
ture
Resu
lts
from
‘‘Fla
shover
Sim
ula
tor’
’Fir
eBehavio
rDem
onst
ration
Exposu
res
InStr
uct
ure
C
Exposure
number
Average±
StdDev
(�C)
Maxim
um
(�C)
NISTThermalClass
averageduration[m
m:ss](tem
perature
±StdDev
[�C])
III
III
IV
138±
24
150
17:44(38±
23)
00:06(122±
20)
00:00(-
)00:00(-
)
251±
17
201
20:07(51±
15)
00:02(135±
0)
00:02(201±
0)
00:00(-
)
Table
8Loca
lHeatFlu
xResu
lts
from
‘‘Fla
shover
Sim
ula
tor’
’Fir
eBehavio
rDem
onst
ration
Exposu
res
inStr
uct
ure
C
Exposure
number
Average
±StdDev
(kW/m
2)
Maxim
um
(kW/m
2)
NIST
ThermalClass
averageduration[m
m:ss](heatflux±
StdDev
[kW/m
2])
III
III
IV
13.0
±2.5
11.3
02:52(0.6
±0.4)
06:10(1.3
±0.3)
08:44(4.9
±1.9)
00:04(11.0
±0.3)
22.3
±0.9
8.3
00:11(-
0.3
±1.4)
10:08(1.7
±0.2)
09:52(3.1
±0.8)
00:00(-
)
Fire Technology 1689

The KDEs demonstrate the effect of the large radiant heat loading componentof the fire behavior demonstrations, specifically on how these scenarios are classi-fied by the NIST Thermal Classifications. The differences between the temperatureand heat flux classifications are more extreme in the fire behavior demonstrationsthan the differences observed during Exercises 1–5. Compared to the coordinatedattack scenarios, the fire behavior scenarios exposed firefighters to the highest heatflux conditions, yet also to the lowest ambient air temperature. Fire behavior sce-narios typically involve larger radiant heat fluxes with less smoke (at least at the
(a) Exposure 1
(b) Exposure 2
Figure 12. Local temperature and heat flux (moving average of 5 s)of the firefighter’s immediate environment during the two ‘‘flashoversimulator’’ fire behavior demonstration exposures in Structure C.
1690 Fire Technology 2016

trainee level) than the attack scenarios. While these demonstration scenarios pro-vide great opportunities for firefighters to learn fire behavior in an immersive set-ting, it also exposes firefighters to conditions that can lead to PPE—particularlySCBA and helmet—damage and potential risk for increased thermal storage inbunker coats.
One important, yet unexpected, outcome from the ‘‘flashover simulator’’ sce-nario was that towards the end of Exposure 1, the SCBA facepiece of the fire-fighter equipped with the portable measurement and data acquisition systembegan to form bubbles (the firefighter immediately left the structure upon noticingthis damage). A picture of the damaged facepiece is shown in Figure 14. Althoughthe ambient temperature data indicate an extremely mild environment was presentduring the ‘‘flashover simulator’’ exercise and the firefighters participating in theexercise felt no physical discomfort, the thermal environment was quite severe.
According to Putorti et al, an SCBA facepiece can begin to bubble whenexposed to a heat flux of 5 kW/m2 for approximately 12 min or 7 kW/m2 for 6min [35]. During Exposure 1, bubbling of the facepiece began to occur afterroughly 9 min of Class I and Class II heat flux exposures (average of 1.1 kW/m2)followed by less than 9 min of Class III heat flux exposures containing an averageof 5.0 kW/m2. Preheating of the SCBA facepiece during the initial Class I and IIconditions likely contributed to the earlier onset of damage at this heat flux level(i.e. 9 vs. 12 min). Thus, predicting risk for damage to PPE should account forthe entirety of the exposure conditions, even those that may be considered subcrit-ical based on the NIST Thermal Classes. Interestingly, during Exposure 2, nodegradation occurred after more than 10 min of Class II exposure averaging1.7 kW/m2 and just under 10 min of Class III conditions averaging 3.1 kW/m2.
Figure 13. Estimated probability density functions for the NationalInstitute of Standards and Technology Thermal Classes based on heatflux and temperature data from the Structure B traditional (FB) andStructure C ‘‘flashover simulator’’ (FL) fire behavior demonstrations.
Fire Technology 1691

Compared to Exposure 1, the second exposure contained a longer duration atClass III, yet no visible damage occurred. This outcome could suggest that condi-tions in this range may need to be studied more carefully in terms of risk for PPEdamage. For example, Foster and Roberts [12] propose slightly different exposurecriteria where ‘Hazardous Conditions’ include heat fluxes from 1 kW/m2 to 4 kW/m2 while 4 kW/m2 to 10 kW/m2 would be considered ‘Extreme Conditions’.
As shown repeatedly in these training scenarios and demonstrations, the mea-sured heat flux suggests a more severe environment than the temperature measure-ments. In this case, the local temperature measurements indicate a very mildenvironment, yet fire fighting PPE was damaged. Only by measuring the local heatflux would we have any indication that these conditions reach the Class III leveland present risk for such damage. While temperature measurements can be madein a simple and cheap manner, it appears more valuable to characterize the fireenvironment by the relatively expensive heat flux measurements.
5. Conclusions and Future Works
In order to effectively measure the heat flux and ambient temperature of a fire-fighter’s local environment during live-fire training exercises, a portable measure-ment and data acquisition system was created and integrated into firefighter PPE.
Figure 14. Image of the facepiece damaged during Exposure 1 ofthe ‘‘flashover simulator’’ demonstration.
1692 Fire Technology 2016
Laboratory experiments were conducted at NIST to calibrate and characterize thevariability associated with the HFM module of the portable measurement anddata acquisition system compared to a NIST-traceable Schmidt–Boelter total heatflux gauge. The portable system was then used to measure the temperature andincident heat flux of a firefighter’s immediate thermal environment in numerouslive-fire training scenarios.
Of the environments encountered during the training exercises, the most severethermal environments were typically defined by ambient temperatures generallybetween 150�C and 200�C and incident heat fluxes between 3 kW/m2 and 6 kW/m2, while the less severe environments consisted of ambient temperatures generallyaround 50�C and incident heat fluxes around 1 kW/m2.
NIST Thermal Class definitions were used to better establish exposure severityof every live-fire training environment studied. For every exposure, heat flux dataproduced higher estimates for severity of exposure than those derived from tem-perature data. The difference in the exposure estimates was most extreme duringthe ‘‘flashover simulator’’ training exercise. Of particular interest, minor damageoccurred to an SCBA facepiece in conditions in the Class I range based on tem-perature criteria, but Class III based on heat flux criteria.
Finally, the temperature data collected from the training structure’s wall moun-ted, stationary thermocouple array represented only a rough approximate boundof the actual temperature of the immediate training environment. For the majorityof the exposures studied, the actual local temperature of the crawling firefighterwas between the temperatures measured at the 1.2 m (4 ft) and 2.4 m (8 ft) levels.Those using thermocouples to monitor the thermal conditions of a live-fire envi-ronment must understand the limitations of this measurement.
The portable measurement and data acquisition system that has been developedand proven effective during this project may play a significant role in futureresearch such as studying other types of training scenarios (gas-fed burners, prox-imity or wildland fire fighting, etc.) or to study the impact of fire service tacticsand strategies. Considering the lack of agreement between firefighter worn localand building installed temperature measurements, as well as the absence of con-gruence between temperature and local heat flux measurements, a useful futureinvestigation could study improved methods of fixed environmental monitoringtechniques, such as plate thermometers. Combining this thermal mapping capabil-ity with 3D firefighter tracking tools might also provide great additional insightinto the locations where peak temperatures and heat flux exposures are encoun-tered.
Acknowledgements
The authors would like to thank the Frankfort Fire Department and BrianAdcock for providing access to their training facility and their support in conduct-ing the ‘‘flashover simulator’’ scenarios. Thanks to NIST and its Summer Under-graduate Research Fellowship program for providing access to their laboratoryfacilities and to Roy McLane for his assistance with the laboratory experiments.
Fire Technology 1693

Thanks to John Regan for his assistance with the live-fire training experiments.Finally, the authors would like to thank the University of Illinois EmployeesCredit Union for their continuing support of the Fire Protection Engineering pro-grams at UIUC.
Open Access
This article is distributed under the terms of the Creative Commons Attribution4.0 International License (http://creativecommons.org/licenses/by/4.0/), which per-mits unrestricted use, distribution, and reproduction in any medium, provided yougive appropriate credit to the original author(s) and the source, provide a link tothe Creative Commons license, and indicate if changes were made.
References
1. Karter MJ Jr, Molis JL (2014) Firefighter Injuries in the United States. NFPA,National Fire Protection Association, Quincy
2. Standard on Live Fire Training Evolutions (2012) NFPA 1403. National Fire Protec-tion Association, Quincy
3. NIOSH F2000-27, Volunteer assistant chief dies during a controlled burn training evo-
lution-delaware, Technical report, NIOSH Fire Fighter Fatality Investigation andPrevention Program, Morgantown (2001)
4. NIOSH F2001-38, Volunteer Fire fighter and two others are injured during live burn
training-New York, Technical Report, NIOSH Fire Fighter Fatality Investigation andPrevention Program, Morgantown, WV (2002)
5. NIOSH F2002-34, Career lieutenant and fire fighter die in a flashover in a live-firetraining evolution-Florida, Technical Report, NIOSH Fire Fighter Fatality Investiga-
tion and Prevention Program, Morgantown, WV (2003)6. NIOSH F2003-28, live-fire training exercise claims the life of one recruit fire fighter and
injures four others-Florida, Technical Report, NIOSH Fire Fighter Fatality Investiga-
tion and Prevention Program, Morgantown, WV (2006)7. NIOSH F2005-31, Career officer injured during a live-fire evolution at a training acad-
emy dies two days later-Pennsylvania, Technical Report, NIOSH Fire Fighter Fatality
Investigation and Prevention Program, issued August 27, 2007, Revised January 15,2008
8. NIOSH F2007-09, Career probationary fire fighter dies while participating in a live-firetraining evolution at an acquired structure-Maryland, Technical Report, NIOSH Fire
Fighter Fatality Investigation and Prevention Program, Morgantown, WV (2008)9. Madrzykowski D (2007) Fatal training fires: fire analysis for the fire service, interflam
Conference, 11th Proceedings International Conference, London, England, September
3–510. Grant C, Hamins A, Bryner N, Jones A, Koepke G (2015) Research roadmap for
smart fire fighting, NIST SP 1191. National Institute of Standards and Technology,
Gaithersburg
1694 Fire Technology 2016
11. Duffy RM, Sawicki JC, Beer AR (1985) Project fires: firefighters integrated responseequipment system—The Final Report, Technical Report, International Association ofFirefighters. Department of Occupational Health and Safety, Washington, DC
12. Foster JA, Roberts GV Measurements of the firefighting environment—SummaryReport, 61, Central Fire Brigades Advisory Council Research
13. Colletta GC, Arons IJ, Ashley LE, Drennan AP (1976) The development of criteria forfirefighters’ gloves volume I: glove requirements, Technical Report, U. S. Department
of Health, Education, and Welfare, Public Health Service, Center for Disease Control,National Institute for Occupational Safety and Health, Division of Physical Sciencesand Engineering, Cincinnati
14. Donnelly MK, Davis WD, Lawson JR, Selepak MJ (2006) Thermal environment forelectronic equipment used by first responders, NIST TN 1474. National Institute ofStandards and Technology, Gaithersburg
15. Krasny J, Rockett JA, Huang D (1998) Protecting fire fighters exposed in room fires:comparison of results of bench scale test for thermal protection and conditions duringroom flashover. Fire Technol 24:5–19
16. Rossi R (2003) Fire fighting and its influence on the body. Ergonomics 46:1017–1033
17. Standard on Protective Ensembles for Structural Fire Fighting, Proximity Fire Fighting,(2013) NFPA 1971. National Fire Protection Association, Quincy,
18. Manning JE, Griggs TR (1983) Heart rates in fire fighters using light and heavy breath-
ing equipment: similar near maximal exertion in response to multiple work load condi-tions. J Occup Med 25:215–218
19. Romet TT, Frim J (1987) Physiological responses to fire fighting activities. Eur J Appl
Physiol 56:633–63820. Colburn D, Suyama J, Reis SE, Morley JL, Goss FL, Chen Y, Moore CG, Hostler
DA (2011) A comparison of cooling techniques in firefighters after a live burn evolu-tion. Prehospital Emerg Care 15:226–232
21. Burgess JL, Duncan MD, Hu C, Littau SR, Caseman D, Kurzius-Spencer M, Davis-Gorman G, McDonagh PF (2012) Acute cardiovascular effects of firefighting and activecooling during rehabilitation. J Occup Environ Med 54:1413–1420
22. Horn GP, Gutzmer S, Fahs CA, Petruzzello SJ, Goldstein E, Fahey GC, Fernhall B,Smith DL (2011) Physiological recovery from firefighting activities in rehabilitation andbeyond. Prehosp Emerg Care 15(2):214–225
23. Selkirk GA, McLellan TM (2004) Physical work limits for Toronto firefighters in warmenvironments. J Occup Environ Hygiene 1:199–212
24. Selkirk GA, McLellan TM, Wong J (2006) The impact of various rehydration volumesfor firefighters wearing protective clothing in warm environments. Ergonomics 49:418–
43325. Kong PW, Beauchamp G, Suyama J, Hostler D (2010) Effect of fatigue and hypohy-
dration on gait characteristics during treadmill exercise in the heat while wearing fire-
fighter thermal protective clothing. Gait Posture 31:284–28826. Hostler D, Bednez JC, Kerin S, Reis SE, Kong PW, Morley J, Gallagher M, Suyama J
(2010) Comparison of rehydration regimens for rehabilitation of firefighter performing
heavy exercise in thermal protective clothing: a report from the Fireground RehabEvaluation (FIRE) Trial. Prehospital Emerg Care 14:194–201
27. Hostler D, Reis SE, Bednez JC, Kerin S, Suyama J (2010) Comparison of active cool-ing devices with passive cooling for rehabilitation of firefighter performing exercise in
thermal protective clothing: a report from the Fireground Rehab Evaluation (FIRE)Trial. Prehospital Emerg Care 14:300–309
Fire Technology 1695

28. Gallagher M Jr, Robertson RJ, Goss FL, Nagle-Stilley EF, Schafer MA, Suyama J,Hostler D (2012) yDevelopment of a perceptual hyperthermia index to evaluate heatstrain during treadmill exercise. Eur J Appl Physiol 112:2025–2034
29. Vatell Corporation (2012) Christiansburg, VA 24073, HFM-6 and HFM-7 Operator’sManual
30. Omega Engineering, Inc., Stamford, CT 06907, OM-DAQPRO-5300 Portable HandheldData Logger User’s Guide
31. Simply Pumps, Manor, PA 15665, Data Sheet Model HP200S (2014)32. ASTM (2013) Standard test method for surface flammability of materials using a radi-
ant heat energy source, ASTM E162-13, ASTM International, West Conshohocken
33. Lawson JR, Twilley WH (1999) Development of an apparatus for measuring the ther-mal performance of fire fighters’ protective clothing, NISTIR 6400. National Instituteof Standards and Technology, Gaithersburg
34. Vettori RL, Twilley WH, Stroup DW (2001) Measurement techniques for low heat fluxexposures to fire fighters protective clothing, NISTIR 6750. National Institute of Stan-dards and Technology, Gaithersburg
35. Putorti AD Jr, Bryner NP, Mensch A, Braga G (2013) Thermal performance of self-
contained breathing apparatus facepiece lenses exposed to radiant heat flux, NIST TN1785. National Institute of Standards and Technology, Gaithersburg
36. Medtherm Corporation Bulletin 118, 64 Series heat flux tansducers, Medtherm Corpo-
ration, Hunstsville 200437. Medtherm Corporation Optical Black Coating, Huntsville38. Averill JD, Moore-Merrell L, Barowy A, Santos R, Peacock R, Notarianni KA, Wis-
soker D (2010) Report on residential fireground field experiments, NIST TN 1661. Na-tional Institute of Standards and Technology, Gaithersburg
39. Donnelly MK, Young WF, Camell D (2014) Performance of portable radios exposedto elevated temperatures, NIST TN 1850. National Institute of Standards and Technol-
ogy, Gaithersburg
1696 Fire Technology 2016