characterizing phase transitions in a model of neutral evolutionary dynamics adam david scott...
TRANSCRIPT

Characterizing Phase Transitions in a Model of Neutral Evolutionary Dynamics
Adam David ScottDepartment of Physics & Astronomy
University of Missouri at St. LouisAPS March Meeting – Baltimore, MD
18 March 2013

Acknowledgements
• Dr. Sonya Bahar• Dawn King• Dr. Nevena Marić
• McDonnell Foundation Complex Systems Grant
• UMSL Department of Physics & Astronomy

• Model• Phase transitions– Evidence for two separate behaviors
• Obtaining critical exponents for each
Model
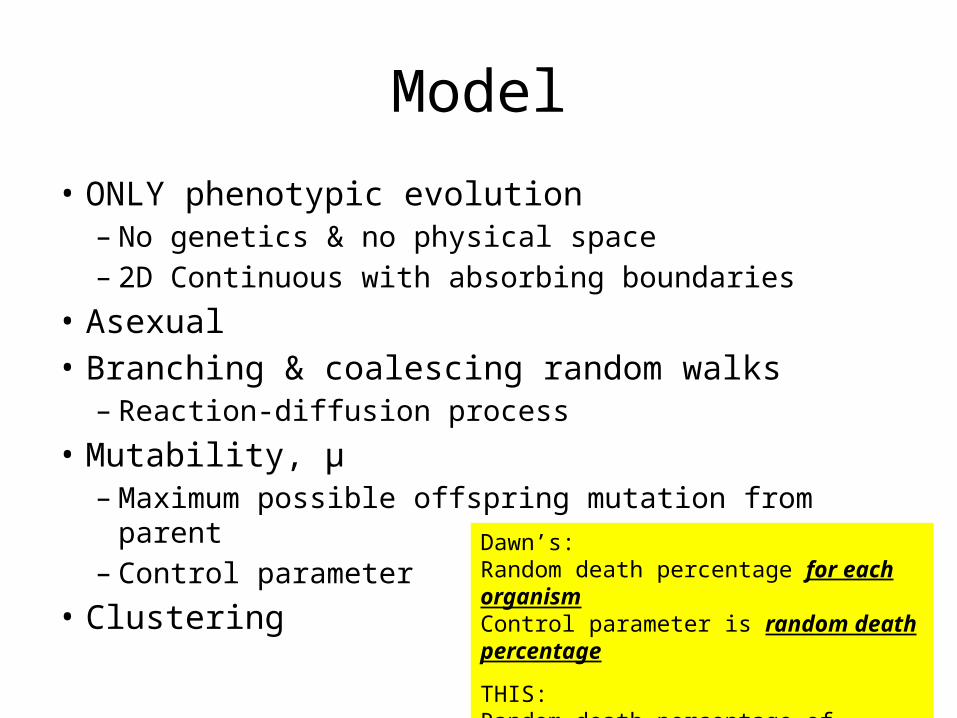
• ONLY phenotypic evolution– No genetics & no physical space– 2D Continuous with absorbing boundaries
• Asexual• Branching & coalescing random walks– Reaction-diffusion process
• Mutability, μ– Maximum possible offspring mutation from parent– Control parameter
• Clustering
Dawn’s: Random death percentage for each organismControl parameter is random death percentage
THIS: Random death percentage of populationControl parameter is mutability

Model: Clustering
• Phenetic species– Speciation by phenotypes
• Cluster seeds– Reference• Nearest neighbor• Second nearest neighbor
• Closed sets of cluster seeds

Scott et al. (submitted)
Generations
Mutability

Phase Transitions: Order Parameters
Scott et al. (submitted)
0.34 0.38 0.34 0.38
• <Population> • <Number of Clusters>

Evidence: Times to extinction

Evidence: Nearest Neighbor Index
0.34 0.38
• Clark & Evans – Average nearest neighbor distance / random expectation
Scott et al. (submitted)

Phase Transitions
• Temporal• 2nd order
non-equilibrium– Absorbing state:
extinction• Directed percolation
• Spatial• 2nd order
equilibrium• Isotropic percolation

Directed Percolation: Critical Exponents
• Density scaling, – Density decay rate,
• Correlation length, – Decay rate,
• Correlation time, • Need 2 for classification–
(Henkel, Hinrichsen, Lübeck)
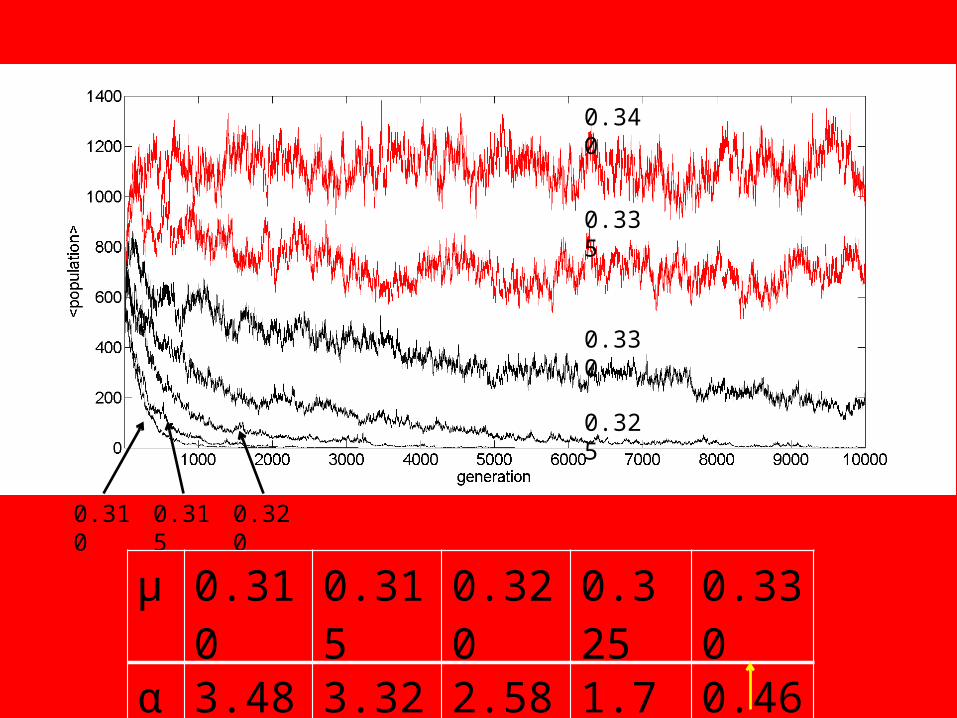
0.310 0.315 0.320
0.325
0.330
0.335
0.340
μ 0.310 0.315 0.320 0.325 0.330α 3.489 3.326 2.589 1.773 0.462

Directed Percolation Density Decay Rate
• This model
• Compared with others– (Hinrichsen)• 2.6%
– (Lauritsen)• 2.4%

Isotropic Percolation: Critical Exponents
• Static measures– Fisher exponent• Distribution of cluster mass, ns, for size, s
– Cluster fractal dimension • Cluster mass (N)
– Number of organisms in cluster
• Cluster diameters (L)– Longest of the shortest paths
• Still running!
(Lesne)
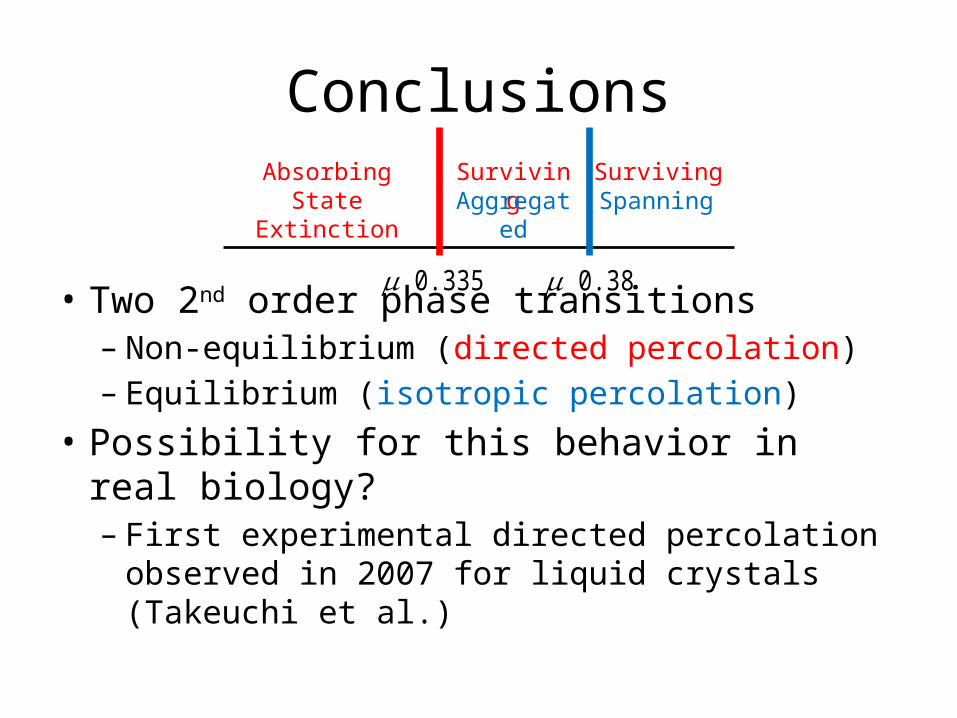
Conclusions
• Two 2nd order phase transitions– Non-equilibrium (directed percolation)– Equilibrium (isotropic percolation)
• Possibility for this behavior in real biology?– First experimental directed percolation observed
in 2007 for liquid crystals (Takeuchi et al.)
Absorbing StateExtinction
Surviving Surviving
𝜇 0.335 𝜇 0.38
Aggregated Spanning

Thank you!
Absorbing StateExtinction
Surviving Surviving
𝜇 0.335 𝜇 0.38
Aggregated Spanning

References• Henkel, Hinrichsen, Lübeck, Non-Equilibrium Phase Transitions:
Vol 1: Absorbing Phase Transitions, 2009• Hinrichsen, “Nonequilibrium Critical Phenomena and Phase
Transitions into Absorbing States”, arXiv, 2000• Lauritsen, Sneppen, Marošová, Jensen, ”Directed percolation with
an absorbing boundary”, 1997.• Lesne, Renormalization Methods: Critical Phenomena, Chaos,
Fractal Structures, 1998• Scott, King, Marić, Bahar, “Clustering and Phase Transitions on a
Neutral Landscape”, submitted• Takeuchi, Kuroda, Chaté, Sano, “Directed percolation criticality in
turbulent liquid crystals”, 2007, 2009