characterizing the energy efficiency potential …€¦ · characterizing the energy efficiency...
TRANSCRIPT

Energy Research and Development Div is ion FINAL PROJECT REPORT
CHARACTERIZING THE ENERGY EFFICIENCY POTENTIAL OF GAS‐FIRED COMMERCIAL FOODSERVICE EQUIPMENT
OCTOBER 2014CEC ‐500 ‐2014 ‐095
Prepared for: California Energy Commission Prepared by: Fisher‐Nickel, Inc.
PREPARED BY: Primary Author(s): Charlene Spoor David Zabrowski Lauren Mills Fisher-Nickel Inc. San Ramon, CA 94583 Contract Number: 500-06-028 Prepared for: California Energy Commission Bradley Meister. Ph.D., P.E. Contract Manager Virginia Lew Office Manager Energy Efficiency Research Office Laurie ten Hope Deputy Director ENERGY RESEARCH AND DEVELOPMENT DIVISION Robert P. Oglesby Executive Director
DISCLAIMER This report was prepared as the result of work sponsored by the California Energy Commission. It does not necessarily represent the views of the Energy Commission, its employees or the State of California. The Energy Commission, the State of California, its employees, contractors and subcontractors make no warranty, express or implied, and assume no legal liability for the information in this report; nor does any party represent that the uses of this information will not infringe upon privately owned rights. This report has not been approved or disapproved by the California Energy Commission nor has the California Energy Commission passed upon the accuracy or adequacy of the information in this report.
i
PREFACE
The California Energy Commission Energy Research and Development Division supports public interest energy research and development that will help improve the quality of life in California by bringing environmentally safe, affordable, and reliable energy services and products to the marketplace.
The Energy Research and Development Division conducts public interest research, development, and demonstration (RD&D) projects to benefit California.
The Energy Research and Development Division strives to conduct the most promising public interest energy research by partnering with RD&D entities, including individuals, businesses, utilities, and public or private research institutions.
Energy Research and Development Division funding efforts are focused on the following RD&D program areas:
• Buildings End‐Use Energy Efficiency
• Energy Innovations Small Grants
• Energy‐Related Environmental Research
• Energy Systems Integration
• Environmentally Preferred Advanced Generation
• Industrial/Agricultural/Water End‐Use Energy Efficiency
• Renewable Energy Technologies
• Transportation
Characterizing the Energy Efficiency Potential of Gas‐Fired Commercial Foodservice Equipment is the final report project (contract number 500‐06‐028) conducted by Fisher‐Nickel, Inc. The information from this project contributes to Energy Research and Development Division’s Buildings End‐Use Energy Efficiency Program Program.
For more information about the Energy Research and Development Division, please visit the Energy Commission’s website at www.energy.ca.gov/research/ or contact the Energy Commission at 916‐327‐1551.
ii
ABSTRACT
In 2008‐2009, the Pacific Gas and Electric Food Service Technology Center, operated by Fisher‐Nickel Inc., characterized the energy load and energy savings potential of the primary gas‐fired cooking equipment in commercial and institutional foodservices for the California Energy Commission. This report describes the inventory, energy load and energy efficiency potential of various primary cooking appliances found in commercial and institutional foodservice sectors in California through literature review, independent surveying and data collection and trade association reporting.
The report identifies specific requirements for developing incentives, supporting regulatory programs, potential RD&D improvements in appliance energy efficiency and performance and act as a catalyst for product development. A variety of strategies exist for promoting energy efficient cooking appliances. The ultimate goal is to stimulate developing more energy efficient equipment through collaborative efforts between utilities, research groups, end‐users and manufacturers. The report identifies the most effective strategies for each cooking appliance category. This information will provide support for future utility‐based incentives for more efficient equipment. This efficient stock of foodservice equipment would consume much less energy in the future, reducing the necessity for additional power generation and lowering greenhouse gasses and other undesirable emissions.
Keywords: commercial foodservice, energy efficiency, cooking equipment, market, forecasts, natural gas, restaurant industry, quick‐service, full‐service, ASTM, Food Service Technology Center, primary cooking appliance inventory, ENERGY STAR®, commercial kitchen, Title 20, Title 24, USGBC LEED, green business, codes & standards, rebates, incentives, NAFEM, NRA
Please use the following citation for this report:
Spoor, Charlene; Zabrowski, David; Mills, Lauren. (Fisher‐Nickel, Inc). 2014. Characterizing the Energy Efficiency Potential of Gas‐Fired Commercial Foodservice Equipmen. California Energy Commission. Publication number: CEC‐500‐2014‐095.
iii
TABLE OF CONTENTS
PREFACE ..................................................................................................................................................... i
ABSTRACT ............................................................................................................................................... ii
TABLE OF CONTENTS ......................................................................................................................... iii
LIST OF FIGURES ................................................................................................................................. vii
LIST OF TABLES ...................................................................................................................................... x
EXECUTIVE SUMMARY ........................................................................................................................ 1
Introduction ........................................................................................................................................ 1
Project Purpose ................................................................................................................................... 1
Project Outcomes ............................................................................................................................... 3
Recommendations .............................................................................................................................. 5
Benefits to California ......................................................................................................................... 7
CHAPTER 1: Introduction ....................................................................................................................... 9
1.1 Background and Overview ....................................................................................................... 9
1.2 Project Objectives ....................................................................................................................... 9
1.3 Report Organization ................................................................................................................ 12
CHAPTER 2: Project Approach ............................................................................................................ 13
2.1 Commercial Foodservice Characterization System ............................................................. 13
2.2 Estimating the Inventory of Commercial Cooking Appliances ........................................ 14
2.3 Modeling the Commercial Cooking Appliance Energy Load ........................................... 16
2.4 Evaluating Appliance Energy Efficiency Potential ............................................................. 18
CHAPTER 3: Commercial Food Service Characterization .............................................................. 19
3.1 Classification of the Commercial Food Service Industry ................................................... 19
3.2 Food Service Market Characteristics Overview ................................................................... 23
3.3 Food Service Market Trends ................................................................................................... 25
3.4 Commercial Cooking Equipment Background .................................................................... 26
3.5 Appliance Purchasing Drivers ............................................................................................... 27
3.5.1 Menu Offerings ................................................................................................................ 27

iv
3.5.2 Production Needs ............................................................................................................. 27
3.5.3 Fuel Source Economics .................................................................................................... 27
3.5.4 User Perceptions ............................................................................................................... 29
3.5.5 Initial Costs vs. Operating Costs .................................................................................... 29
3.6 Literature Review ..................................................................................................................... 30
3.6.1 Facility and Appliance Data Collection Overview ...................................................... 30
3.6.2 NAFEM Size and Shape of the Industry ....................................................................... 32
3.6.3 ReCount® Restaurant Database ..................................................................................... 32
3.6.4 Additional Sources ........................................................................................................... 33
3.6.5 Site Monitoring Projects .................................................................................................. 33
3.7 Facility Data Analysis .............................................................................................................. 34
3.7.1 Data Organization and Exploration .............................................................................. 34
3.7.2 Determining Facility Operating Schedules .................................................................. 36
3.8 Summarization of Facility Data ............................................................................................. 37
3.8.1 Characterized Commercial Food Service Facilities ..................................................... 37
3.8.2 Characterized Institutional Food Service Facilities ..................................................... 38
3.8.3 Uncharacterized Foodservice Facilities ......................................................................... 39
3.8.4 Facilities in Host Locations ............................................................................................. 40
3.8.5 Facilities with Limited Operating Hours ...................................................................... 41
CHAPTER 4: Inventory of Commercial Food Service Facilities .................................................... 42
4.1 Commercial Food Service Sector ........................................................................................... 42
4.1.1 Large Chains ..................................................................................................................... 42
4.1.2 Small Chains ..................................................................................................................... 42
4.1.3 Independents .................................................................................................................... 42
4.2 Institutional Food Service Sector ........................................................................................... 43
4.2.1 Educational Services ........................................................................................................ 44
4.2.2 Health Care and Social Services ..................................................................................... 47
4.2.3 Correctional Services ....................................................................................................... 48

v
4.2.4 Military Services ............................................................................................................... 50
4.2.5 Accommodation Services ................................................................................................ 50
4.2.6 Recreational Services ....................................................................................................... 51
4.2.7 Retail Services ................................................................................................................... 52
4.2.8 Employee Services ........................................................................................................... 53
CHAPTER 5: Inventory of Commercial Gas Cooking Appliances ................................................ 54
5.1 Primary Fuel Source ................................................................................................................ 54
5.2 Gas Commercial Cooking Appliance Inventory Results .................................................... 55
5.3 Gas Commercial Cooking Appliance Demographics ......................................................... 56
5.3.1 Braising Pans ..................................................................................................................... 57
5.3.2 Broilers ............................................................................................................................... 58
5.3.3 Fryers ................................................................................................................................. 63
5.3.4 Griddles ............................................................................................................................. 66
5.3.5 Ovens ................................................................................................................................. 69
5.3.6 Pasta Cookers .................................................................................................................... 75
5.3.7 Ranges ................................................................................................................................ 77
5.3.8 Steam Cookers .................................................................................................................. 80
5.3.9 Steam Kettles ..................................................................................................................... 83
CHAPTER 6: Commercial Gas Cooking Appliance Energy Load ................................................. 87
6.1 Appliance Standard Test Methods ........................................................................................ 88
6.2 Appliance Energy Efficiency .................................................................................................. 89
6.3 Adjusting Appliance Energy Loads ...................................................................................... 91
6.4 Sample Energy Load Calculation .......................................................................................... 94
6.5 Appliance Inventory Energy Load Results .......................................................................... 96
CHAPTER 7: Energy Efficiency Potential of Gas‐Fired Cooking Appliances .......................... 100
7.1 Status of Commercial Cooking Appliance Inventory ....................................................... 100
7.2 Impact of ASTM Test Methods on the Foodservice Industry .......................................... 101
7.3 Marketing & Promoting Energy‐Efficient Cooking Appliances ..................................... 105

vi
7.3.1 Regulatory Environment of commercial cooking appliances .................................. 105
7.3.2 Voluntary Regulatory Programs .................................................................................. 108
7.3.3 EPA ENERGY STAR® Program .................................................................................. 109
7.3.4 Utility Energy Efficiency Programs ............................................................................. 112
7.4 Emerging Technologies ......................................................................................................... 112
7.4.1 Improved Insulation ...................................................................................................... 113
7.4.2 Improved Heat Exchanger Design .............................................................................. 113
7.4.3 Advanced Atmospheric Burners ................................................................................. 113
7.4.4 Enhanced Control .......................................................................................................... 113
7.5 RD&D Opportunities for Gas Commercial Cooking Appliances ................................... 114
7.5.1 Braising Pans ................................................................................................................... 114
7.5.2 Broilers ............................................................................................................................. 115
7.5.3 Fryers ............................................................................................................................... 116
7.5.4 Griddles ........................................................................................................................... 119
7.5.5 Ovens ............................................................................................................................... 121
7.5.6 Pasta Cookers .................................................................................................................. 125
7.5.7 Ranges .............................................................................................................................. 126
7.5.8 Steam Cookers ................................................................................................................ 128
7.5.9 Steam Kettles ................................................................................................................... 130
CHAPTER 8: Conclusions and Recommendations ......................................................................... 131
8.1 Conclusions ............................................................................................................................. 131
8.2 Recommendations .................................................................................................................. 133
8.3 Benefits to California ............................................................................................................. 134
GLOSSARY ............................................................................................................................................ 136
REFERENCES ........................................................................................................................................ 139
APPENDIX A: Summary of Sources ................................................................................................. A‐1
APPENDIX B: Commercial Facility Descriptions ............................................................................... 1
APPENDIX C: Institutional Facility Descriptions .......................................................................... C‐1
vii
APPENDIX D: Current Commercial Sector Energy Use Studies in California ............................. 1
APPENDIX E: Assumptions of Facility Operating Schedules ......................................................... 1
APPENDIX F: Comparison of Foodservices for Major California Hotel Chains ......................... 1
LIST OF FIGURES Figure ES‐1: Gas‐fired appliance inventory estimates in commercial and institutional foodservice facilities in California ........................................................................................................... 3
Figure ES‐2: Gas energy load estimates in institutional vs. commercial foodservice facilities ....... 4
Figure ES‐3: Strategies for reducing commercial cooking appliance energy consumption ............ 5
Figure 1: Distribution of quick‐service and full‐service commercial food service establishments in California .............................................................................................................................................. 24
Figure 2: Distribution of institutional food service establishments in California in 2008 by primary services ....................................................................................................................................... 25
Figure 3: Average commercial sector retail cost of energy (per MMBtu) in California and the nation ......................................................................................................................................................... 28
Figure 4: Student enrollment trends in California public primary schools for 2007‐2008 ............. 35
Figure 5: Classification scheme histogram of California public primary schools in 2007‐2008 .... 36
Figure 6: Breakdown of large chain, small chain and independent establishments in California 38
Figure 7: Breakdown of institutional foodservice facilities in California ........................................ 39
Figure 8: Average annual operating days of institutional foodservice facility categories ............ 44
Figure 9: Distribution of residential care (independent and assisted living) establishments by rated beds .................................................................................................................................................. 47
Figure 10: Comparison of mean rated bed capacity for correctional service facility groups in California ................................................................................................................................................... 49
Figure 11: Estimated gas‐fired commercial cooking appliance inventory in California ................ 55
Figure 12: 40‐Gallon tiliting braising pan ............................................................................................. 57
Figure 13: Distribution of braising pans in commercial facilities ...................................................... 58
Figure 14: Distribution of braising pans in institutional facilities ..................................................... 58
Figure 15: Underfired (chair) broiler ..................................................................................................... 59
Figure 16: Overfired broiler with two broiling decks ......................................................................... 60
Figure 17: Salamander broiler ................................................................................................................ 61
viii
Figure 18: Conveyor broiler .................................................................................................................... 62
Figure 19: Distribution of broilers in commercial facilities ................................................................ 62
Figure 20: Distribution of broilers in institutional facilities ............................................................... 63
Figure 21: French fryer ............................................................................................................................ 64
Figure 22: Pressure fryer ......................................................................................................................... 64
Figure 23: Large Vat Fryer ...................................................................................................................... 65
Figure 24: Donut Fryer ............................................................................................................................ 65
Figure 25: Distribution of Fryers in Commercial Facilities ................................................................ 66
Figure 26: Distribution of Fryers in Institutional Facilities ................................................................ 66
Figure 27: 3‐Foot (flat) Griddle ............................................................................................................... 67
Figure 28: 3‐Foot Grooved Griddle ....................................................................................................... 67
Figure 29: 3‐Foot Double‐Sided Griddle ............................................................................................... 68
Figure 30: Distribution of Griddles in Commercial Facilities in California ..................................... 68
Figure 31: Distribution of Griddles in Institutional Facilitites in California ................................... 69
Figure 32: Six‐Burner Range with Oven Base ...................................................................................... 70
Figure 33: Pizza Deck Oven .................................................................................................................... 71
Figure 34: Full‐size Convection Oven ................................................................................................... 71
Figure 35: Double Rack Oven and Rack ............................................................................................... 72
Figure 36: Double‐stacked Conveyor Oven ......................................................................................... 72
Figure 37: Rotisserie Oven ...................................................................................................................... 73
Figure 38: Combination Oven ................................................................................................................ 74
Figure 39: Cook‐and‐Hold Oven ........................................................................................................... 74
Figure 40: Distribution of Ovens in Commercial Facilities ................................................................ 75
Figure 41: Distribution of Ovens in Institutional Facilities ................................................................ 75
Figure 42: Pasta Cooker ........................................................................................................................... 76
Figure 43: Distribution of Pasta Cookers in Commercial Facilities .................................................. 76
Figure 44: Distribution of Pasta Cookers in Institutional Facilities .................................................. 77
Figure 45: Six‐Burner Range Top with Range Oven ........................................................................... 77
ix
Figure 46: Stock Pot Range ..................................................................................................................... 78
Figure 47: Chinese Wok .......................................................................................................................... 79
Figure 48: Distribution of Ranges in Commercial Foodservice Facilities in California ................. 79
Figure 49: Distribution of Ranges in Institutional Foodservice Facilities in California ................. 80
Figure 50: Pressure Steam Cooker ......................................................................................................... 81
Figure 51: Pressurless Steamer ............................................................................................................... 81
Figure 52: “Connectionless” Steam Cooker .......................................................................................... 82
Figure 53: Distribution of Steamers in Commercial Foodservice Facilities in California .............. 83
Figure 54: Distribution of Steamers in Institutional Foodservice Facilities in California .............. 83
Figure 55: 20‐Gallon Steam Kettle .......................................................................................................... 84
Figure 56: 40‐Gallon Steam Kettle .......................................................................................................... 84
Figure 57: 60‐Gallon Steam Kettle .......................................................................................................... 85
Figure 58: Distribution of Steam Kettles in Commercial Foodservice Facilities in California ...... 85
Figure 59: Distribution of Steam Kettles in Institutional Foodservice Facilities in California ...... 86
Figure 60: Typical Energy Breakdown (Btu) By End‐Use in a Full‐Service Restaurant ................. 87
Figure 61: Estimated Gas Commercial Cooking Appliance Energy Load in California ................ 97
Figure 62: Energy Saving Potential of Comemrcial Gas Cooking Appliances in California ....... 102
Figure 63: Strategies for Reducing Commercial Cooking Appliance Energy Consumption ...... 105
Figure 64: Reported Market Penetration of Energy Star ® Rated Commercial Foodservice Products in United States ...................................................................................................................... 110
Figure 65: Reported Total Annual Sales of Energy Star ® Rated Commercial Foodservice Products in United States ...................................................................................................................... 110
Figure 66: Braising Pan Energy Saving Potential in California ....................................................... 114
Figure 67: Broiler Energy Saving Potential ......................................................................................... 115
Figure 68: Fryer Energy Saving Potential ........................................................................................... 117
Figure 69: Griddle Energy Saving Potential ....................................................................................... 120
Figure 70: Oven Energy Saving Potential ........................................................................................... 121
Figure 71: Pasta Cooker Energy Saving Potential ............................................................................. 125
Figure 72: Range Energy Saving Potential ......................................................................................... 126

x
Figure 73: Steam Cooker Energy Saving Potential ............................................................................ 128
Figure 74: Steam Kettle Energy Saving Potential .............................................................................. 130
LIST OF TABLES Table 1: Appliance Categories and Types ............................................................................................ 15
Table 2: Quick‐Service Restaurant Segment Classification Scheme ................................................. 21
Table 3: Full‐Service Restaurant Segment Classification Scheme ..................................................... 21
Table 4: Instututional Food Service Segment Classification Scheme ................................................ 22
Table 5: Commercial Foodservices in Host Venues ............................................................................ 41
Table 6: Estimated Typical Market Shares of Gas and Electric Appliance ...................................... 54
Table 7: Estimated Gas Commerical Cooking Inventory in California ............................................ 56
Table 8: Appliance Energy Efficiencies ................................................................................................. 91
Table 9: Distribution of Appliance Efficiencies and Primary Appliances in Commercial and Institutional Foodservice ......................................................................................................................... 93
Table 10: Commercial Gas Standard Griddle Daily Energy Consumption Example ..................... 94
Table 11: Estimated Gas Commercial Cooking Appliance Energy Load In California ................. 98
Table 12: Estimated Gas Cooking Appliance Energy Load by Industry Sector in California ....... 99
Table 13: Gas Appliance Efficiency Potential: Current, Near‐Term and Long‐Term ................... 101
Table 14: Breakdown of Estimated Energy Saving Potential by Appliance Category ................. 103
Table 15: Market Penetration Rates and Energy Saving Potential of Improved Efficiency Gas Cooking Appliances in California ....................................................................................................... 104
1
EXECUTIVE SUMMARY
Introduction The commercial foodservice industry is a major sector California’s economy and it is estimated that more than a million buildings in North America contain some type of commercial or institutional foodservice. In 2009, the National Restaurant Association expected these restaurants to have $566 billion in sales or about 4 perccent of the US gross domestic product. The industry is currently one of the largest private‐sector employers with about 13 million people.
Recent studies suggest that foodservice operations are the most energy intensive building sub‐category of the commercial sector, consuming an average 550,000 Btu/ft2 per year. Unfortunately, commercial cooking equipment has generally proven to exhibit poor energy performance and most foodservice facilities are constructed without thoughtful, energy efficient design and are operated with little emphasis on energy efficiency.
Despite the large operating cost associated with this end use and the number of facilities that can benefit from energy efficiency measures, there has been little motivation to develop and promote high‐efficiency gas‐fired cooking equipment. Without mandatory, minimum energy efficiency standards, manufacturers lack incentive to develop commercial cooking appliances that comply with higher levels of energy efficient performance and operators lack incentive to purchase and install such appliances.
Appliance purchases are often made with little or no knowledge of their potential energy use and are driven primarily by price. Combined with heavy competition among manufacturers for market share within a typically frugal industry, higher cost energy efficient models have enjoyed little success. There is potential to increase the overall efficiency of commercial appliances; while the majority of appliances have full‐load (ideal) efficiencies in the 30 to 40 percent range, their actual in‐kitchen efficiencies can be quite low ‐ less than 20 percent.
It is important to have a thorough analysis and understanding of the size, scope and energy load contribution of the commercial foodservices to identify opportunities in energy efficiency and conservation in commercial buildings statewide.
In 2008‐2009, the Pacific Gas and Electric (PG&E) Food Service Technology Center, operated by Fisher‐Nickel Inc., characterized the energy load and energy savings potential of the primary gas‐fired cooking equipment in commercial and institutional foodservices for the California Energy Commission (Energy Commission) Research and Development (R&D) program. This project described the inventories of commercial primary cooking equipment and quantified gas energy load and energy efficiency potential associated with commercial foodservice operations. The research also identified the categories of commercial cooking equipment that have the largest gas loads and the greatest potential for reducing that load in the near term.
Project Purpose This project improved understanding of the current and projected future statewide energy load associated with natural gas‐fired cooking appliances, identified appliance types which represent

2
the greatest gas energy loads, and identified the appliance categories which show the most potential for targeted reductions in energy consumption. The long term goal was to raise the minimum energy‐ efficiencies of future appliances installed in California through a combination of marketing, research, development and demonstration (RD&D) and deploying emerging technologies. The project:
• Obtained preliminary information on the current size and shape of the commercial foodservice industry and its constituent major market segments in California.
• Estimated the current size and shape of the installed base of natural gas‐fired commercial cooking appliances in California.
• Assessed the current market share of standard, medium, and high‐efficiency natural gas‐fired commercial cooking appliances in California.
• Estimated the energy (and associated monetary) saving potential associated with increasing the energy efficiencies of the current installed base of natural gas‐fired commercial cooking appliances in California.
• Identified energy saving opportunities specifically attributed to RD&D, marketing and emerging technology efforts in each appliance category and make recommendations for future projects.
• Identified barriers related to improving appliance energy‐efficiencies.
• Defined future, related research needs.
• Served as a catalyst for specific projects that advance median appliance efficiencies through RD&D and emerging technologies.
There are significant opportunities to improve the energy efficiency and performance of commercial gas cooking appliances, both by incorporating existing technologies into appliance design and by re‐engineering appliances to incorporate advanced design concepts used in other industries.
Specific appliance categories are believed to have the most potential for energy efficiency improvements based on total appliance inventory, appliance energy load, and the current state of their overall in‐kitchen efficiencies and sophistication of controls: these appliance categories are fryers, broilers, ovens and ranges. While some of the appliance types associated with the aforementioned categories will require specific strategies for improving efficiency, the goal of any RD&D initiative for commercial cooking appliances should be to improve cooking performance (e.g., production capacity, uniformity) while reducing unnecessary idle energy use across all appliance types with technologies that have been developed, tested and can be practically applied. Many technologic advances have been successfully applied to specific appliance categories which resulted in measureable improvements in efficiency and performance. These advances (such as thermostatic controls) are considered standards in their specific appliance fields (fryers) but have not yet been successfully applied to the more rudimentary appliance types such as underfired charbroilers.
3
Project Outcomes The growing literature on the commercial foodservice sector was reviewed: including market demographics, market trends, equipment sales trends, and recent industry reports estimating the contribution of commercial foodservice sector energy consumption in California. Nine categories and thirty subcategories of commercial cooking appliances were identified and applied to the various equipment lineups for each type and facility.
The project team identified approximately 93,300 foodservice establishments currently operating in California. This estimate includes the known commercial sector and foodservice facilities that are believed to prepare food using commercial grade cooking appliances. There are an estimated 73,200 commercial foodservice facilities in California ‐ 50,700 of these facilities are classified as small chains and independent foodservices. The remaining 22,500 represent large chain foodservices. There are also an estimated 20,000 institutional foodservice facilities in California, including educational services, health & social services, recreational services, correctional services, accommodation services, military, work cafeterias and grocery retail.
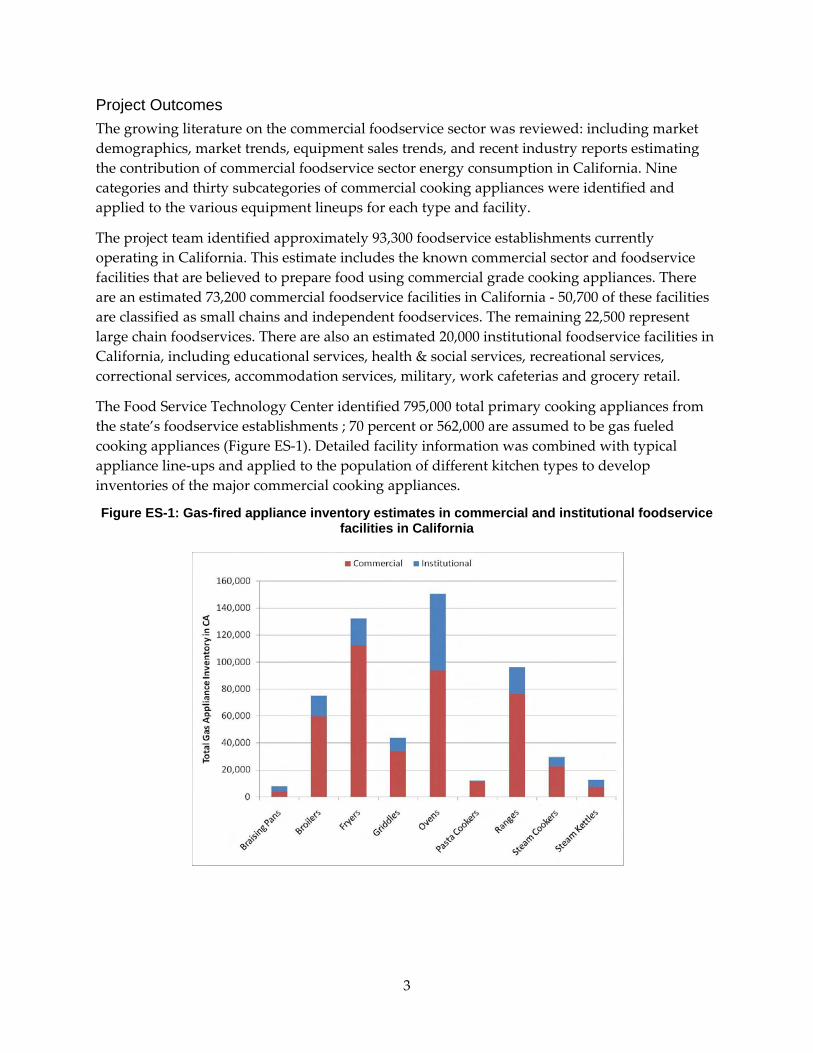
The Food Service Technology Center identified 795,000 total primary cooking appliances from the state’s foodservice establishments ; 70 percent or 562,000 are assumed to be gas fueled cooking appliances (Figure ES‐1). Detailed facility information was combined with typical appliance line‐ups and applied to the population of different kitchen types to develop inventories of the major commercial cooking appliances.
Figure ES-1: Gas-fired appliance inventory estimates in commercial and institutional foodservice facilities in California
4
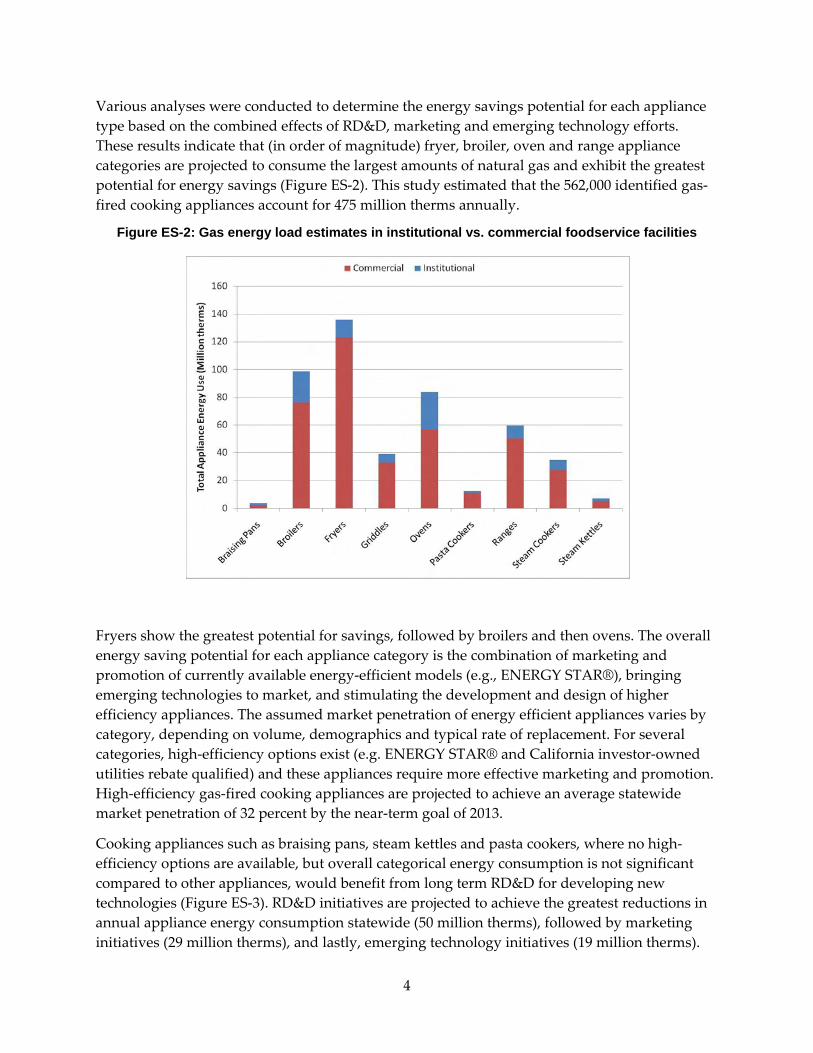
Various analyses were conducted to determine the energy savings potential for each appliance type based on the combined effects of RD&D, marketing and emerging technology efforts. These results indicate that (in order of magnitude) fryer, broiler, oven and range appliance categories are projected to consume the largest amounts of natural gas and exhibit the greatest potential for energy savings (Figure ES‐2). This study estimated that the 562,000 identified gas‐fired cooking appliances account for 475 million therms annually.
Figure ES-2: Gas energy load estimates in institutional vs. commercial foodservice facilities
Fryers show the greatest potential for savings, followed by broilers and then ovens. The overall energy saving potential for each appliance category is the combination of marketing and promotion of currently available energy‐efficient models (e.g., ENERGY STAR®), bringing emerging technologies to market, and stimulating the development and design of higher efficiency appliances. The assumed market penetration of energy efficient appliances varies by category, depending on volume, demographics and typical rate of replacement. For several categories, high‐efficiency options exist (e.g. ENERGY STAR® and California investor‐owned utilities rebate qualified) and these appliances require more effective marketing and promotion. High‐efficiency gas‐fired cooking appliances are projected to achieve an average statewide market penetration of 32 percent by the near‐term goal of 2013.
Cooking appliances such as braising pans, steam kettles and pasta cookers, where no high‐efficiency options are available, but overall categorical energy consumption is not significant compared to other appliances, would benefit from long term RD&D for developing new technologies (Figure ES‐3). RD&D initiatives are projected to achieve the greatest reductions in annual appliance energy consumption statewide (50 million therms), followed by marketing initiatives (29 million therms), and lastly, emerging technology initiatives (19 million therms).

5
Figure ES-3: Strategies for reducing commercial cooking appliance energy consumption
The energy saving potential associated with improving minimum energy efficiencies across all major commercial cooking appliance categories is estimated to amount to 98 million therms annually, or a 20 percent reduction in annual appliance energy consumption.
Recommendations In the absence of reliable near‐term options for mandatory regulations, this study recommends improving and consolidating existing voluntary regulatory program standards. Improving existing standards to more accurately reflect the significant contribution of natural gas‐ fired commercial cooking appliances to overall building energy load in the commercial foodservice sector will incentivize compliance with higher standards of appliance efficiency. By extension, increased compliance on the part of building operators will increase the statewide market shares of high efficiency appliances and push manufacturers to develop more products that comply with these voluntary standards.
This report also found the importance of shifting the commercial foodservice industry equipment purchasing trends by influencing programs and organizations that recognize and/or certify, businesses that adhere to higher environmental performance standards. These organizations exist at the local, regional, state and national levels and include (but are not limited to): the Unites States Green Building Council Leeding Leadership for Energy and Environmental Design program, Association of Bay Area Governments Green Business Program, National Restaurant Association Conserve Initiative, and ENERGY STAR® program for commercial foodservices. This information should also be discussed with many public
6
entities including the California Department of Education‐ Nutrition Services, University of California, California State University and California Community College system, California Office of Statewide Health Planning and Development, and the California Department of Corrections and Rehabilitation to set and adhere to energy efficiency standards for foodservice procurement policies, especially where state and federal grants are concerned.
A key element to the successfully transforming the market towards more energy efficient equipment is developing a comprehensive web‐based directory of American Society for Testing and Materials appliance performance data. Such a directory would rely extensively on the efficiencies reported by Food Service Technology Center and the California Investor‐Owned Utility foodservice equipment research and educational centers. To date, the combined test results of these centers include only a fraction of the available models of cooking equipment on the market. Advancing this database would increase industry awareness of the availability of scientific performance data, allowing end users to make more informed decision about equipment purchasing and stimulating manufacturers to have their equipment tested in accordance with the American Society for Testing and Materials test methods in other U.S. laboratories. Further benefits may include expanding a more accurate energy modeling techniques for commercial cooking appliances, leading to a more comprehensive understanding of how commercial cooking appliance energy loads contribute to overall energy consumption at the facility, sector and state levels. Developing a comprehensive database will support continuing efforts to raise the minimum efficiency standards of commercial cooking appliances in California and expand the ENERGY STAR® program for commercial foodservice equipment nationwide.
Overall recommendations are:
• Promote reforming local and national‐level program standards to more accurately reflect the large contribution of commercial cooking appliances to overall building energy use.
• Increase funding to improve the administration, marketing efforts, education and outreach of such programs in the state.
• Expand the database of standard efficiency cooking appliances to make possible Title 20 minimum efficiency standards.
• Quantify the total energy load and energy efficiency potential of electric commercial cooking equipment.
• Identify a need for and catalyze developing information systems integration between the demographic and statistical offices of key state departments and agencies (these include educational services, health care & social services, correctional services), for statewide (energy) reporting.
Based on the current appliance inventory demographics and energy savings potential, R&D should focus major efforts to improve the energy efficiency of underfired broilers, convection ovens, range tops and conveyor ovens. Future RD&D efforts concentrated on reducing idle energy use and improving part‐load energy efficiency of these appliances will deliver the

7
greatest return for RD&D dollars invested. The RD&D must not only improve these performance parameters but also reduce the cost premium associated with purchasing more efficient equipment.
Benefits to California The findings and recommendations of this report hold many benefits for Californians, reducing natural gas use and costs for ratepayers and the statewide commercial foodservice industry. This study provides a roadmap for future RD&D efforts for commercial foodservice energy efficiency by increasing the understanding of the scope and magnitude of commercial gas‐fired cooking appliances and their associated energy load, while identifying the strategies for reducing that load through education, promotion, research, development and demonstration. The net result is a substantial reduction in the commercial gas load associated with commercial cooking appliances.
It is anticipated that reducing 98 million therms of the total gas cooking appliance energy load will be achieved by meeting the short‐term and long‐term goals in this report. Based on the current average California gas utility rate ($1/therm), these efficiencies would save ratepayers $98 million or a 20 percent reduction in annual appliance energy consumption
The results are also beneficial to California gas utilities as a resource to develop marketing strategies promoting energy efficiency programs based on the analysis of appliance energy load and savings potential in major market segments. This could increase the success of energy efficiency programs targeted at major market segments of commercial foodservices in the state through the using consolidated market intelligence collected and produced during this study.
The collaborative marketing, emerging technology and RD&D efforts would boost more installed efficient foodservice equipment that would consume much less energy in the future, reducing greenhouse gasses and other undesirable emissions.

A blank page is inserted to insure Chapter 1 starts on an odd number page. Blank pages are not labeled.

9
CHAPTER 1: Introduction 1.1 Background and Overview In 2008‐2009, the PG&E Food Service Technology Center (FSTC), operated by Fisher‐Nickel Inc., characterized the energy load and energy savings potential of the primary gas‐fired cooking equipment in commercial and institutional foodservices for the California Energy Commission. This report characterizes the inventory, energy load and energy efficiency potential of various primary cooking appliances found in commercial and institutional foodservice sectors in California through literature review, independent surveying and data collection and trade association reporting.
The commercial foodservice industry is a very important sector of the California economy, and the national economy as a whole. It is projected that more than a million buildings in North America contain some type of commercial or institutional foodservice.1 According to market research conducted by the NRA, in 2009 the restaurant industry is expected to number 945,000 establishments nationwide, account for $566 billion in sales, and employ 13 million people. The industry is currently one of the largest private‐sector employers, with restaurant‐sales equal to 4% of the U.S. gross domestic product.2
Recent studies suggest that foodservice operations are the most energy intensive building sub‐category of the commercial sector, consuming an average 550,000 Btu/ft2 per year.3 Therefore, a thorough analysis and understanding of the size, scope and energy load contribution of the commercial foodservices is essential when identifying opportunities in energy efficiency and conservation in commercial buildings statewide. The significantly high energy intensity that is characteristic of these facilities is driven by the knowledge that commercial cooking equipment has proven to typically exhibit poor energy performance and most foodservice facilities are constructed without thoughtful, energy efficient design and are operated with little emphasis on energy efficiency.
This general deficit of energy efficiency within the commercial foodservice industry can be attributed to several factors, including: the necessity to keep initial capital costs as low as possible, the historically small percentage of total operating cost represented by energy use, and the lack of knowledge regarding energy efficiency. The collective result is that the foodservice industry has fallen behind other industries in energy efficiency and there remains a significant potential to reduce energy consumption within foodservice operations.
1.2 Project Objectives This report analyses of the California commercial and institutional foodservice industry during the period from 2008 to 2013 with an emphasis on the current market characteristics, the baseline energy efficiencies of gas‐fired commercial cooking appliances, and their respective energy loads. The primary objective of this PIER research is to quantify the energy efficiency potential (including equivalent dollar savings) of each appliance category and type. Appliance

10
energy consumption models were developed for each appliance type, based on a combination of laboratory and end‐use monitoring data for the various appliance categories. The overall energy savings potential was then explored for each appliance category, based on currently available technology and market penetration of high‐efficiency technologies. The study includes an analysis of potential RD&D initiatives, marketing initiatives, and regulatory initiatives to reduce the overall energy consumption of commercial foodservice equipment and provides a ranking of appliance categories with the greatest potential for improved efficiency. A detailed analysis of the RD&D potential for gas‐fired commercial cooking appliances is included as an attachment to this report (Attachment 1).
From an RD&D perspective, the scope of work would identify potential improvements in appliance energy efficiency and act as a catalyst for product development. There are significant opportunities to improve the energy efficiency and performance of commercial gas cooking appliances, both by incorporating existing technologies into appliance design and by re‐engineering appliances to incorporate advanced design concepts used in other industries. The goal of an RD&D initiative for commercial cooking appliances should be to improve cooking performance (e.g., production capacity, uniformity) while reducing energy use. This can be achieved through:
• Working with manufacturers to stimulate new design initiatives that incorporate energy efficient technology not yet available on the market. These initiatives should be targeted in those categories which are least mature in terms of efficiency.
• Continuing commercial appliance testing programs that can be used to further benchmark energy performance in direct support of RD&D projects for commercial cooking equipment.
• Using benchmark performance data as justification, developing an industry strategy that will influence the purchase‐decision criteria so that customers will specify more energy efficient equipment. These strategies would encompass development and promotion of incentives in addition to outreach to equipment specifiers, distributors and dealers.
• Developing and sponsoring training courses and workshops for the foodservice and utility industries based on this report’s findings. Training courses could incorporate appropriate cooking methods using high‐efficiency technology in order to ensure market acceptability and avoid potential misuse. Promotion and education of the ancillary benefits (i.e. increased production, higher throughput, less radiant heat to the kitchen) of high‐efficiency commercial cooking equipment is critical to long‐term market acceptance and correct application of these technologies.
From the utility perspective, it would identify specific needs for incentives. The final results of this project can be used to support both utility incentive programs for the purchase of more efficient equipment and other marketing or educational campaigns, such as ENERGY STAR® and other voluntary regulatory programs operating in the state. This study will provide the means for evaluating the feasibility and energy‐saving potential of replacing standard appliances with already available high‐efficiency models. Recommendations will be made that

11
address the specific needs of improving the viability and share of these appliances in the marketplace.
This report will also explore the current legislative environment and evaluate which type of regulatory approach is immediately most well suited to improving the minimum efficiencies of commercial cooking appliances. This report will evaluate the successes and challenges of establishing and administering mandatory regulations, (through minimum appliance efficiency standards) and voluntary regulations (by means of certification and recognition programs). The findings of this study can be used to support future regulatory initiatives concerning appliance standards.
The scope of the research is as follows:
• Conduct a literature review of primary data sources that include, but are not limited to, NAFEM Equipment and Supplies Survey (1989),4 NAFEM Size and Shape of the Industry Study (2002, 5 2004,6 20087), and ReCount® Restaurant Database.8
• Conduct a literature review of secondary sources that include, but are not limited to, editorials from Foodservice Equipment and Supplies Magazine, Foodservice Equipment Reports Magazine, Nation’s
• Restaurant News Periodical, FSTC Site Survey Support Program records, and FSTC published appliance and site monitoring reports.
• Conduct informal surveys with key industry groups including, but not limited to: end‐users from institutional and commercial foodservice sectors, manufacturers and suppliers, and equipment distributers.
• Collect demographic information (e.g., facility counts, operating hours, appliance lineups) on institutional kitchens.
• Seek out additional statistical and demographic data sources in order to characterize the institutional foodservice sector.
• Estimate the current statewide shape and scope of the establishments in the commercial foodservice industry.
• Identify drivers of statewide and national building trends and equipment purchasing trends. Determine typical appliance line ups for all relevant commercial foodservice facility categories. Estimate the current statewide inventory of major gas‐fired commercial cooking appliances.
• Benchmark the current statewide market shares of low, medium, and high‐efficiency major gas‐fired commercial cooking appliances.
• Project statewide facility and appliances inventories.
• Estimate the statewide energy load associated with major gas‐fired commercial cooking appliances.

12
• Estimate the statewide energy savings potential associated with major gas‐fired commercial cooking appliances.
• Estimate the distribution of energy savings potential from RD&D, marketing, and emerging technology at the appliance level.
• Identify specific barriers and needs to developing incentive and marketing programs for energy efficient commercial cooking equipment.
• Identify specific barriers and needs to developing mandatory and voluntary regulatory programs concerning the efficiency of major commercial cooking appliances.
• Make recommendations for improving the base efficiency of gas appliances in California through technological, marketing, incentive structures.
• Assess the research, development and demonstration potential for energy efficient gas fired commercial cooking appliances.
• Identify specific appliance RD&D projects, based on their overall gas saving potential.
1.3 Report Organization Section 1 provides the background for this PIER report. Section 2 describes the overall approach of this PIER project.
Section 3 includes overview and characterization of different types of commercial and institutional foodservice sectors.
Section 4 includes the estimated inventory of commercial and institutional food service facilities.
Section 5 discusses the estimated inventory of commercial gas cooking appliances.
Section 6 includes the estimated gas load for commercial cooking appliances.
Section 7 discusses the energy efficiency potential for commercial gas cooking appliances.
Section 8 presents the broader implications of this PIER study.
13
CHAPTER 2: Project Approach Various sources were consulted and unique methodology developed in order to better characterize the nature of commercial food service facilities, more accurately determine the current shape and scope of these varied markets, and the associated energy load of their natural gas‐fired cooking appliance inventories in the state of California. The approach of this project involved characterizing the different types of facilities, establishing typical appliance lineups for the different types of foodservice facilities, projecting the daily and annual operating schedules for each facility category, projecting the baseline efficiencies of the installed base of commercial cooking appliances, estimating the overall and categorical gas loads or the statewide appliance inventory and analyzing the energy efficiency potential on an appliance‐by‐appliance basis.
2.1 Commercial Foodservice Characterization System Commercial kitchens can be found in almost every type of commercial building. These establishments can be broadly classified as either commercial or institutional foodservices. Commercial establishments are defined as foodservice facilities exclusively serving the general public at standalone or (in few cases) host retail locations. Institutional foodservices are foodservice facilities that are either located inside of a primary facility or standalone facilities located in a larger multi‐building complex. It is not the primary mission of institutional foodservices to feed the general public but, rather, building occupants and those associated with the institution. For this reason, the majority of these establishments are not captured as dedicated foodservice facilities in surveys; though their foodservice operations are typically comparable to dedicated commercial foodservice facilities (such as quick‐service and full‐service restaurants).
The first objective of this study was to review a current body of industry literature in order to determine the demographics of the California commercial foodservice equipment market. Several past and recent studies have attempted to determine the size and shape of the commercial foodservice sector, its equipment market and energy load characteristics at both the facility and overall industry level; each study employs a distinct classification scheme and methodology. The major demographic studies and classification schemes reporting on the broad industry size and scope, and published by the NRA and US Census Bureau are discussed in detail in Section 3 of this study.
The classification scheme for commercial and institutional foodservice establishments was based on the following parameters:
• Industry sector
• Menu type/dining style Service type
• Primary function
• Occupancy rating (where applicable)
14
• Additional data exploration and defining of thresholds for data inclusion1
• Summarizing facility counts per Segment, Sector, Group and Category
• Determining daily operating hours, annual operating days and weighted annual operating hours per category
Operational information about the facility may be collected from a variety of sources and is primarily informed through informal end‐user surveys (conducted specifically for this study), FSTC site survey field work and field‐monitoring projects, and business listings. This descriptive information is then combined with typical appliance line‐ups. Appliance line‐ups are assigned to facilities based on their related market segment and groups within the segment. An overview of these general data classification schemes are documented in Section 3 of this report.
The commercial market sector was broadly classified by service type (either quick‐service or full‐service), general dining style, and specific menu type in the ReCount® Restaurant Database.8 Further classifications were made based on whether the establishments were part of multi‐facility business operations (small chain or large chain) or independent business operations. Market segments and segment groups may only indicate what types of appliances are likely to be found within related facilities but do not indicate the total amount of appliances that are in operation. Distinction in facility types such as cafeteria, family style, or buffet further identified establishments with higher production needs and larger appliance inventories.
Raw data for the institutional market sector was not originally classified according to menu‐type (though general assumptions about menu offerings were made once divisions had been established), but on type of facility, and primary service. There was a clear need to further classify the institutional facilities based on their size. This type of classification scheme was not used for the commercial sector, as most quick‐service and full‐ service restaurants tend to fall into the small and medium‐size commercial building range. Institutional kitchens can range from small to large commercial types with a great deal of variation in square footage even within market groups. Contrary to past commercial buildings studies, square footage was not used as a ruling principle when deciding what energy load factors to apply, or (in this study specifically) when assigning the number of appliances that are present and what their usage patterns might be. Where available, information on the rated capacity of institutional facilities was used to classify, apply of typical appliance lineups and, ultimately, to determine inclusion in the scope of the study.
2.2 Estimating the Inventory of Commercial Cooking Appliances Detailed facility information was combined with typical appliance line‐ups and applied to the population of different kitchen types to develop inventories of the major commercial cooking appliances. The resulting total was prorated based on the estimated percentage of gas appliances within each appliance category. A total of nine categories and thirty subcategories of
1 Applicable to institutional establishments only.
15
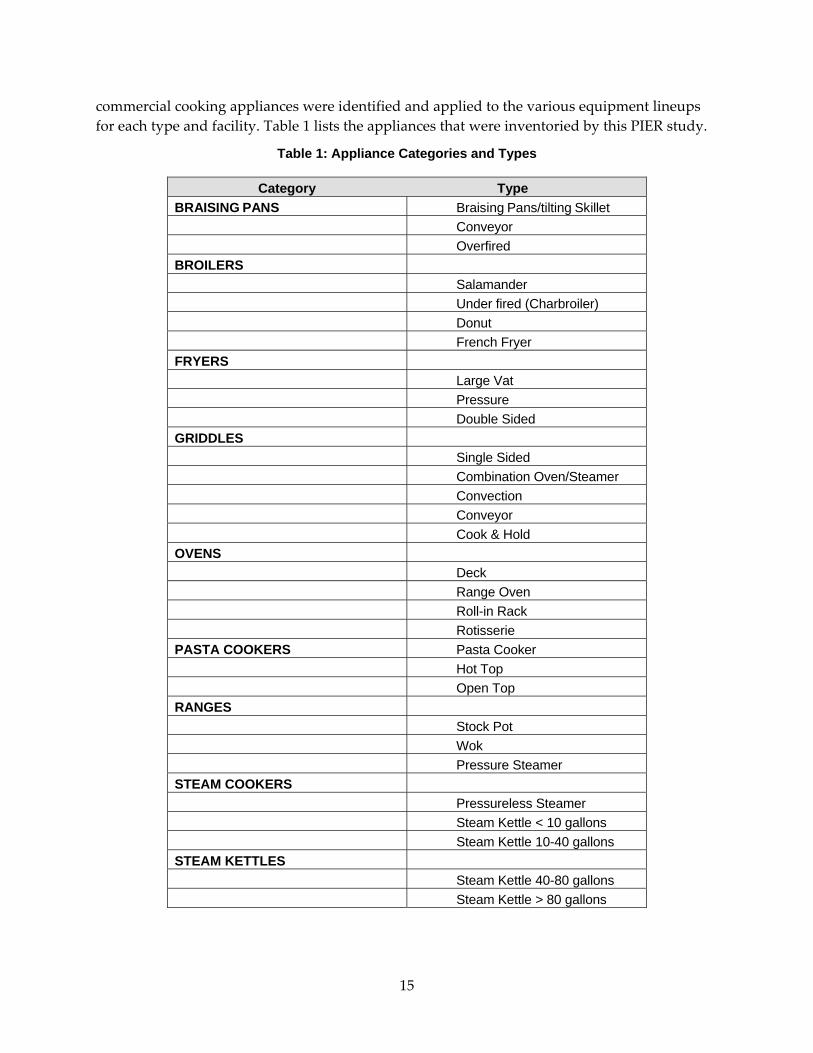
commercial cooking appliances were identified and applied to the various equipment lineups for each type and facility. Table 1 lists the appliances that were inventoried by this PIER study.
Table 1: Appliance Categories and Types
Category Type BRAISING PANS Braising Pans/tilting Skillet Conveyor Overfired BROILERS Salamander Under fired (Charbroiler) Donut French Fryer FRYERS Large Vat Pressure Double Sided GRIDDLES Single Sided Combination Oven/Steamer Convection Conveyor Cook & Hold OVENS Deck Range Oven Roll-in Rack Rotisserie PASTA COOKERS Pasta Cooker Hot Top Open Top RANGES Stock Pot Wok Pressure Steamer STEAM COOKERS Pressureless Steamer Steam Kettle < 10 gallons Steam Kettle 10-40 gallons STEAM KETTLES Steam Kettle 40-80 gallons Steam Kettle > 80 gallons
16
Primary cooking appliance varies greatly across the foodservice sectors. The size and shape of primary cooking appliance inventories are primarily determined by menu, number of patrons per day, and operating hours. In addition to menu offerings, the equipment purchasing decisions of many institutional facilities (more significantly than observed in commercial establishments) are driven by the anticipated (designed for) number of patrons (or meals) served daily. While range tops are generally sufficient for most commercial use, at the institutional level, where patrons are fed in mass, the standard range and range‐oven suite might be replaced by steam kettles and tilting skillets; the majority of the market share for appliance types such as these is found in institutional settings. Contrarily, there are many appliances that at found primarily in commercial foodservices. A perfect example is the variations on the broiler. Conveyor broilers are found primarily in commercial establishments, and, more specifically, chain restaurants. This is true of burger restaurants where operations and efficiency tend to favor conveyor broilers over under fired broilers.
Typical appliance line ups were applied to the groups and categories of the commercial sector based on their menu‐type and the style of service (family, casual, fine, etc.). For institutional facility categories (such as K‐12 school, hospitals, and residential care facilities), two to three samples were selected from past FSTC site survey data, based on each break in occupancy ratings, and typical appliance line ups were compared. Where no site survey records were available, samples were selected from the collected facility data. Sampling methods consisted of informal phone and e‐mail surveys conducted with foodservice managers and operators.
For facility data obtained by sampling, the submitted inventories were examined for accuracy and consistency across each facility group and category. At the highest level of detail possible, like appliances were tallied and summarized. Averages were then taken by dividing the sum of the reported appliances by the number of survey sample participants. The resulting averages then served as the typical equipment line‐up for each foodservice category and (where applicable) subcategory. In instances where a given appliance type was found to be used by only a portion of the overall category/group being examined, those appliances were reported as fractions when averaging across all totals. For example, a category that lists 0.5 combination ovens implies that half of the total establishments in that category may utilize a combination oven. An example of a facility category that relied entirely on informal surveys is state prisons: every state prison in California reported their actual appliance lineups. Typical appliance line ups were then multiplied by the estimated total establishment count for each category.
Once the first estimates of the commercial cooking appliance inventory had been made, assumptions were made on the distribution of gas and electric cooking appliances. The assumption come almost entirely from published NAFEM sales data, using site survey records and experience as a check and balance.
2.3 Modeling the Commercial Cooking Appliance Energy Load In order to characterize the statewide inventory foodservice facilities and their constituent food preparation systems (major cooking appliances only), information and descriptive data is collected, operating assumptions are made, and energy load profiles are made based on:
17
• classification foodservice sectors
• number of foodservice facilities
• cooking appliance inventories by facility sector, group, category and subdivision
• percentage of cooking appliances that are gas vs. electric by facility sector, group and category
• average daily hours of operation
• average annual days of operation
• distribution of average appliance efficiency values
• average daily pounds of food cooked per appliance type
Facility operational information was collected from a variety of sources and was primarily informed through end‐use customer surveys, site survey field work, and business listings. Operational information is then combined with typical appliance line‐ups. Appliance line‐ups were assigned based on segment and category of the market each facility falls under. Divisions were made within category based on available population data. Population data, such as number of beds in a given hospital or students enrolled in an elementary school, was provided (in most cases) by statistical and demographic branches of both state and federal governing agencies. From this collected information, the following parameters are calculated and used to estimate the total annual cooking appliance energy load in commercial and institutional facilities:
• Total Annual Gas Load attributed to commercial cooking appliances by appliance type/category
• Total Annual Gas Operating Costs attributed to commercial cooking appliances by appliance type/category
• Total Annual Gas Load attributed to commercial cooking appliances by facility sector
• Total Annual Gas Operating Costs attributed to commercial cooking appliances by facility sector
To determine the energy loads of each appliance, energy profiles are established by combining facility operational information with ASTM standard energy calculations coupled with appliance end‐use monitoring. Assumptions about annual operating hours were developed for every sector of institutional and commercial foodservices in order to perform energy use calculations. The distribution of standard‐efficiency, medium‐ efficiency and high‐efficiency appliance breakdown was informed largely by discussions with a substantial variety of contacts at every level of the industry.
To date, many specific commercial cooking appliance types (such as range ovens, open top ranges and Chinese ranges) lack high efficiency options in the market all together; these inventories were assumed to be composed of entirely standard‐efficiency appliances. The

18
percent of primary appliances is a factor that is applied to each appliance in a given segment to devalue the total energy consumption. It is important to note that even though there are a given number of fryers in a facility, it cannot be assumed that all of these appliances are functioning at their full‐load capacity, that is, as the primary appliance in the facility during the normal course of a day.
Because the calculations used to establish the Average Energy Consumption Rates of the appliances were based on heavy usage (and an average daily operating schedule unique to each appliance type), the final energy load calculations must be devalued (using the factor expressed by Percent of Primary Appliances) to represent a more accurate scenario: where the appliances are working infrequently or as back‐up, or where the appliances are operated with regular frequency but primarily at partial load or capacity.
2.4 Evaluating Appliance Energy Efficiency Potential The energy efficiency potential of the major commercial cooking appliances was evaluated based on the availability of energy efficient models, the potential to improve appliance efficiency by applying current technologies and by estimating the peak theoretical efficiency for each appliance type, based on research conducted by Arthur D Little (ADL Study), the Canadian Gas Research Institute (CGRI Study), the FSTC Appliance Technology Assessment and FSTC laboratory testing experience

19
CHAPTER 3: Commercial Food Service Characterization The National Restaurant Association (NRA) lists 945,000 foodservice establishments (commercial and institutional)2 currently operating in the United States.3 Prorating this accounting based on population, it can be estimated that 10%, or 94,500 of foodservice establishments would be operating in California. Projecting the size and scope of the foodservice industry and its contribution to the overall energy load of the statewide commercial sector is a very complex task, as most demographic agencies only report broadly on overall facility counts, employee counts and sales volumes. Complicating this analysis, is the reality that many demographic organizations report on the shape and scope of the commercial foodservice segment but generally neglect a large portion of the institutional foodservice segment, which provide foodservice as a secondary or auxiliary service in addition to a primary service or function.
This PIER report identifies approximately 93,300 foodservice establishments currently operating in the state of California. This estimate includes the entirety of the known commercial sector as well as a thorough accounting the institutional sector and includes only foodservice facilities that are believed to prepare food using commercial grade cooking appliances and are relevant to the objectives of this report.
3.1 Classification of the Commercial Food Service Industry There is currently a variety of different organizations that classify, characterize and report on the commercial foodservice sector in the United States. The most prominent system is the North American Industry Classification System (NAICS), which was developed and reported on by the U.S. Census Bureau. NAICS is an industry classification system used by statistical agencies to facilitate the collection, tabulation, presentation, and analysis of data relating to establishments. NAICS is erected on a production‐oriented conceptual framework that groups establishments into industries according to similarity in the process used to produce goods or services. Under NAICS, an establishment is classified to one industry based on its primary activity.10
NAICS organizes business establishments based on tax information submitted by businesses and collected by the Internal Revenue Service (IRS). The US Census Bureau breaks commercial foodservices into the following groups: full‐service restaurants; limited‐service eating places; special foodservices (such as foodservice contractors, caterers), and mobile foodservices; and drinking places. NAICS largely omits food and drink services at hotels and motels; amusement parks, theaters, casinos, country clubs, and similar recreational facilities. Additionally, civic and social organizations are included in this subsector only if these services are provided by a 2 This estimate includes a representation of school, work cafeterias.
3 The California Restaurant Associate (CRA) reports that there are more than 88,000 commercial foodservice establishments currently operating in the state (2008).
20
separate establishment primarily engaged in providing food and beverage services. Many foodservice related trade associations or organizations base their market estimates and classification standards on NAICS criteria. The National Restaurant Association (NRA), the foremost business association for the restaurant industry, tracks the health and outlook of the national foodservice industry and publishes data monthly and in a series of annual reports. NRA industry characterizations and classification schemes are essentially derived from the NAICS data.
This study does not attempt to do more than refer briefly to classification standards and criteria used by entities such as NRA and US Census Bureau. In order to fulfill the goals and objectives of this report, a large quantity of detailed information was needed on the establishments listed under each of the aforementioned industry groups. Alternative sources were sought out and consulted which allowed for a more accurate quantification, classification and characterization of the commercial foodservice industry. The classification scheme developed for this study was based on the various sources used to inventory the commercial and institutional foodservice establishments. A summary of these sources appears in Appendix A.
To analyze the commercial sector of the industry a comprehensive database (ReCount® Restaurant Database) compiled by the private market‐research firm, the NPD Group Inc., was consulted.11 This report follows the database in classifying commercial foodservice establishments as either full‐service or quick‐service restaurants. These establishments are characterized as being primarily composed of standalone locations with unique physical addresses, and includes a very small portion of facilities located in commercial host venues. The ReCount® database defined host venues as gas stations, high schools, hospitals/medical centers, hotel/motels, malls/shopping centers, military bases, movie theaters, office buildings, sports stadiums, supermarkets, tourist attractions, train stations, and travel plazas. While these designations are typically considered institutional facility types, actual database entries of such establishments were comparatively low and, for the purposes of this report, these establishments were classified by their primary designation under the commercial foodservice sector.4
Quick‐service restaurants are defined as limited‐service establishments where patrons pay before eating, generally order at a cash register or drive‐thru window and where table services are not provided (limited menu offerings). Table 2 summarizes the classification scheme of the quick‐service restaurant segment of the commercial foodservice sector.
4 A detailed discussion of all commercial foodservice establishments located in host facilities in the ReCount® database can be found in Section 3.8.4.

21
Table 2: Quick-Service Restaurant Segment Classification Scheme
Group Category
Sandwich
Hamburger A Hamburger B Mexican Other Sandwich
Specialty
Chickn Pizza Asian Other Varied Menu
Snack
Juice Donut Bagel Coffee/Tea Other Snack
This report defines a full‐service restaurant as an establishment that provides wait services and where, typically, patrons pay after they eat. Full‐service restaurants generally offer a wider variety of menu items than quick‐service restaurants and typically menu offerings will be restricted by distinct meal periods (breakfast, lunch, dinner). The majority of these are classified as free‐standing facilities with an insignificant portion of facilities located in host venues. Table 3 summarizes the full‐service segment of the commercial foodservice sector.
Table 3: Full-Service Restaurant Segment Classification Scheme
Group Category
Family Dining BBQ Cafeteria Buffet
Casual Dining
Mexican Asian Pizza/Italian Seafood Indian American Other Ethnic

22
Group Category
Fine Dining
Steak Other
The institutional foodservice segment required a wider range of demographic sources in order to generate a more comprehensive analysis. While this study found that US Census Bureau data tended to obscure, consolidate or omit key information that would identify uniquely institutional establishments in the foodservice industry, the publications of the statistical reporting and demographic branches of various industry organizations and California state agencies provided a more accurate and thorough accounting of the size, scope and characterization of these establishments. These sources are listed in detail in Appendix A.
Table 4 summarizes the general classification scheme used by this study for the institutional foodservice sector.
Table 4: Instututional Food Service Segment Classification Scheme
Segment Group
Educational Services
Public Primary (K-8) Public Secondary (High School) Private Primary (K-8) Private Secondary (High School) College & University (Post- Secondary)
Health Care & Social Services
Long Term/Skilled Nursing Hospitals Residential Care (Independent/Assisted Living)
Congregate Feeding Agency Site (Soup Kitchen)
Correctional Services
Federal Bureau of Prisons Community Correctional Facilities State Adult Institutions Adult Conservation Camps County Adult Detention Facilities State Juvenile Institutions County Juvenile Detention Facilities
Military Services Base/Station/Installments

23
Segment Group
Recreational Services
Amusement/theme/water parks & zoos Professional Stadiums College Stadiums Multi-Use Stadiums & Arenas Large Casino (Hotel/Resort) Small Casino (Cards Only) Golf Courses & Country Clubs
Accommodation Services
Hotel/Motel/Resort/Lodge/Other
Retail Services Supermarket & Discount Retailer
Employee Services
Office Building/Other
Further characterizations of the commercial and institutional foodservice sectors summarized in the tables above can be found in Appendix B and Appendix C, respectively.
3.2 Food Service Market Characteristics Overview From the ten year span of 1989‐1998, the national commercial foodservice industry (NAICS 722) experienced an average annual growth of 2%. While this is an overall industry trend, each constituent segment of the market is expected to grow at different rates. To understand the overall appliance inventory of this industry, it is necessary to first determine the general shape of the market and the relative importance of each of its constituent segments. Institutional kitchens comprise a much smaller, though significant portion of the market, representing roughly 20% of the total establishments, while commercial establishments account for the remaining 80%.5
Figure 1 represents the estimated distribution of full‐service (FSR) and quick‐service restaurants (QSR) in California.
5 Actual facility distribution estimates equate to 21% institutional and 79% commercial

24
Figure 1: Distribution of quick-service and full-service commercial food service establishments in California
The NRA reported that in 2008, full‐service restaurants experienced sales gains far below that of their annual average from 2002‐2007: a modest 1.1% compared with previous 4.8% annual sales gains. Full‐service restaurants are predicted to decline in sales in 2009 and 2010. Contrarily, sales‐based growth of quick‐service restaurants is projected to remain relatively flat. The commercial sector is dominated by independently owned and operated establishments, which account for 55% of the facilities in the state. For the purposes of this report, the independent segment is organized as all commercial establishments which only have one or two locations in California. The remaining 45% of establishments are divided between large chains (31%) and small chains (14%). Large restaurant chains are an important market segment to differentiate when investigating various energy efficiency strategies.
The industries that comprise the institutional foodservice segment are previously described in Table 4 and the distribution of commercial foodservice establishments across all major institutional sectors is illustrated in Figure 2.

25
Figure 2: Distribution of institutional food service establishments in California in 2008 by primary services
3.3 Food Service Market Trends As the economic climate of the United States continues to change, so will consumers tastes and, by extension, commercial foodservice trends. Despite the current poor economic climate in the nation, the NRA projects the foodservice industry to grow in 2010 and beyond. NRA customer and operator surveys indicated a number of key trends that will shape composition of the foodservice market in the years to come. By extension, shifts in market composition, and operator practices will have a direct effect on the overall shape of the statewide appliance inventory. An analysis of recent growth in major foodservice market segments may help to inform predictions on the future market composition, and a key variable that heavily dictates market trends is change in customer preference.
NRA research shows that customers are continuing to show a growing preference for restaurants that employ sustainable business practices. According to NRA, 44% of customers surveyed in 2008 said ʺthey are likely to make a restaurant choice based on an operation’s practices in the areas of energy and water conservationʺ.
The primary way that the customer is able to identify which foodservices employ sustainable practices is through their participation in voluntary regulatory and recognition programs. These programs verify that businesses meet a higher level of environmental performance standards at a building and operational scale. The programs also serve as a marketing/advertising tool for those businesses that meet these standards in much the same way that ENERGY STAR® does for individual qualified appliances. Green certification programs increase the visibility of, and

26
customer demand for, businesses that employ sustainable business practices; they function as a recognizable brand in the marketplace.
Currently there are a number of these programs operating at the regional, state and national level. On the regional level, they are administered through partnerships between (local, regional, state and national) governments, environmental non‐profits, and utilities. Most eminent in the state of California is the Association of Bay Area Governments (ABAG) Green Business Program. The US Green Building Council’s (USGBC) Leadership in Energy and Environmental Design (LEED) is an internationally recognized building certification system. LEED offers frameworks for certification that apply to many commercial foodservices in building types such as hospitality, retail and for businesses that lease space inside other buildings (referred to as ʺLEED for Commercial Interiorsʺ). In 2008, the National Restaurant Association (NRA) launched the Conserve Initiative to support sustainability efforts in the foodservice industry with resources, education and inspiration. The NRA Conserve initiative is currently partnering with ENERGY STAR® and the FSTC to reach its educational goals. NRA Conserve plans on developing a national green recognition program for commercial foodservices early 2010.
According to a 2008 NRA operator survey, full‐service and quick‐service restaurants almost unanimously confirm that they would spend the same amount of resources or more on green initiatives in 2009. Other key industry players in the same major market segments are also increasing educational outreach and awareness for ʺgreenʺ issues. QSR Magazine is currently dedicated to bringing green resources to their readers with a
ʺGreen News” segment on their website. Similarly, recent news indicates that major market segments of institutional foodservices are noting their customer preferences and following suit by ʺgreening” their practices. Most notable are institutions of higher education and health care.
3.4 Commercial Cooking Equipment Background As business trends and practices, as well as customer preferences continually evolve, so does the shape and size of the commercial foodservice market and, consequentially, the size of the base cooking equipment inventory. Currently, no published data exists on the installed inventory of gas‐fired commercial cooking appliances in the state of California. However biennial data, published by the North American Foodservice Equipment Manufacturers (NAFEM) Association, reports on the total published sales of commercial cooking appliances in the United States and Canada. While this does not confirm what the already installed base may look like, it does summarize some of the recent trends in equipment purchases and provides a general sense of what the current installed base might look like. In 2007, North American foodservice equipment sales were estimated to equal $9.09 billion, and have been growing at a steady rate of 4.3%. The same year, primary cooking appliances achieved the largest sales volume of any other category in the foodservice equipment and supplies market: 18.7% of the total market shares and approximately $1.7 billion in sales.
Based on informal FSTC surveys of equipment manufacturers and distributors, typically 75% of primary cooking equipment sales are replacement while only 25% of sales are new growth. The
27
FSTC finds that primary cooking equipment sales are driven by the following: menu‐offerings, production needs, user preferences and perceptions, fuel‐source economics, and initial equipment costs. The type and quantity of primary cooking appliances are specified at the kitchen‐level and are driven by menu and production demands. Purchasing decisions at the equipment‐level are determined by user preferences, fuel‐source cost and benefit and, most importantly, initial cost.
3.5 Appliance Purchasing Drivers 3.5.1 Menu Offerings In the commercial segment of the industry, equipment selection is primarily driven by menu offerings. Menu offerings in both full‐service and quick‐service segments of the commercial foodservice sector are dependent on cuisine type. Menu offerings for quick‐service establishments tend to be limited: examples include deli, bakery, subs, and hamburgers. The full‐service restaurant sector is additionally defined by dining style (e.g., family, casual or fine dining) and is generally characterized by broader menu offerings: such as Italian, French, Mexican, or American.
Menu offerings in institutional foodservice establishments generally follow similar arrangements and are primarily driven by the wants and needs of the built‐in customer demographics. Depending on the sector, menu offerings may be further outlined or restricted by institutional policies and regulations, (commonly at either a state or national level). This is especially true of educational, correctional, and health care services.
3.5.2 Production Needs While menu initially drives equipment selection for foodservice operations, an underlying determining factor for equipment selection can be attributed to the greater variation in production needs. Generally speaking, there is greater variation in the physical footprint (square footage) of the institutional kitchen when compared with commercial kitchen.16 The size of institutional foodservice kitchens, and the type and quantity of primary cooking appliances needed, are specified in accordance to industry protocol and based on the assumed, built‐ in demand for meals‐served per day. To illustrate, many smaller institutional operations may find stock pot ranges and open‐top ranges sufficient to produce menu offerings such as soups and chili, while larger establishments will find it necessary to employ braising pans or steam kettles.
3.5.3 Fuel Source Economics NAFEM industry studies and manufacturer and equipment dealer sales data (anecdotal and published) indicates that gas equipment significantly dominates the market share of annual sales and comprises the majority of the cooking equipment install base for North America.7 There are several reasons for this: it is a wide held belief among operators and chefs that gas equipment is durable and requires little maintenance. Chefs especially perceive the advantages of gas over electric when using specific appliance types, such as the range top; gas range

28
burners respond instantly, produce a visible flame, and deliver precise heat at the turn of a dial.6
Perhaps equally as important to chefs and operators are the economic benefits of reduced operating costs. Operating cost differences between comparable gas and electric cooking equipment has been one of the foremost questions in the minds of restaurant operators. Based on recent California utility rates, in most cases natural gas equipment will save a third or more in operating costs. For example, a full‐size, standard efficiency electric oven may annually cost roughly $1,500 in energy operating costs while its gas counterpart would cost roughly $1,000. This equates to approximately a 33% reduction in energy costs between standard efficiency electric vs. natural gas convection ovens.
Natural gas is generally affordable throughout North America, offering lower operating costs and reducing electric demand charges from on‐peak operation. Figure 3 shows the state and national average price trend per comparable unit of energy for natural gas and electricity from 1993‐2007.17 Units of gas and electricity have been converted to MMBtu for comparison.
Figure 3: Average commercial sector retail cost of energy (per MMBtu) in California and the nation
Source Credit: US Department of Energy, Energy Information Administration.7
6 Assumptions based on 2007 average utility rate for California of $1.01/therm of natural gas and $0.13/kWh of electricity.
7 Energy modeling is based on a cooking efficiency of 35% for standard gas convection ovens and 65% for standard electric convection ovens. Both units are rated for a production capacity of 70lb/hr and are assumed to cook 100lb/day with 12 hours of use per day for 365 days.
29
The average retail price per Btu of natural gas in California has closely followed that of the national average for the past 15 years. In contrast, the average retail price per Btu of electricity in California has significantly surpassed that of the national average, and since 2000, has continued to increase at a much higher rate. Based on these trends, it is likely that the market share of natural gas equipment will only continue to grow in California as electric prices continue to steadily rise. Unfortunately, gas equipment falls far behind electric in terms of on‐site energy‐efficiency, but not source efficiency.
3.5.4 User Perceptions General perceptions about performance are secondary drivers to initial costs when it comes to equipment selection. Production and reliability are huge potential risks to an industry whose profits are driven by food sales. It is for this reason that key, leading fast food chains have specified equipment based on performance and reliability rather than first cost. Key industry players (such as McDonalds) are directly responsible for first identifying the need for objective appliance performance data and continue to utilize such data in chain‐wide purchasing decisions.
Aside from these leading national chains, the majority of the commercial foodservice sector (and especially the independent segment) is influenced by the unverified marketing claims which dominate the sales environments of foodservice equipment and supplies. Traditionally, foodservice equipment users have been slow adopters to new technology and there is still a general industry perception that high‐efficiency appliances will not perform up to expectations. Operators may believe that new efficient technologies are not as robust as their standard efficiency technologies. It is also a common fear that the production capacity of these new appliances will not meet their requirements.
3.5.5 Initial Costs vs. Operating Costs Although the commercial foodservice industry is a very dynamic sector of the United States economy, the industry as a whole has been slow to adopt advances in modern commercial cooking appliance technology that are related to energy efficiency. Few trends in improving energy efficiency have been observed in key leading fast food chains nationwide, and, more recently, in institutions of higher education and hospitals in the state of California. These trends have been driven by the advent of life‐cycle costing for primary cooking appliances. Life‐cycle costing for cooking appliances can be attributed to the research and dissemination of information from the appliance testing program at the Food Service Technology Center.
The most recent published NRA operator surveys have shown that small responses have been made to rising energy costs. Quick‐service venues are currently believed to lead the purchase of energy‐efficient equipment; with 16% of the operators interviewed claiming they had purchased some type of energy‐efficiency appliance.2 Quick service chains, in particular, are more likely to be influenced in their purchasing policies by the general performance data that results from appliance testing.
Despite the large operating costs associated with cooking appliance end use and a growing awareness of life‐ cycle costing, first‐cost continues to be a major factor in foodservice

30
equipment purchases. Although numerous facilities can benefit from energy efficiency measures, new energy‐efficient technologies typically have a cost premium associated with them, which may deter foodservice operators from purchasing these models. This cost premium is especially pronounced with major commercial cooking appliances: where high‐efficiency designs are often bundled with other features such as all‐stainless steel construction and high‐quality components and controls. A typical high‐efficiency fryer has a street price between $3,000 and $4,000 whereas a quality standard‐efficiency fryer is priced from $1,500 to $2,0008. Similarly, an energy efficient convection oven will have a street price between $4,000 and $5,000, while a standard efficiency oven will cost between $3,000 and $4,000. In both cases, the more efficient unit can pay for itself in three years or less, with estimated energy savings of $350 to $450 per year.
The commercial foodservice market is extremely volatile: where the average restaurant may go out of business before realizing the return on investment from high efficiency appliances that require large capital expenditures. For most foodservice establishments, especially those from the independent commercial sector, cost premiums associated with advanced energy‐efficient technology have prohibited many operators from purchasing new technologies. For this reason, there has been little motivation for manufacturers to develop and promote high‐efficiency, gas‐fired cooking equipment outside of work demanded by major chain restaurant companies.
3.6 Literature Review 3.6.1 Facility and Appliance Data Collection Overview The first objective of this study was to review a current body of industry literature in order to determine the demographics of the California commercial foodservice equipment market. Several past and recent studies have attempted to determine the size and shape of the commercial foodservice sector, its equipment market and energy load characteristics at both the facility and overall industry level; each study employs a distinct classification scheme and methodology.
During the initial process of data collection and literature review, select recent major studies served to shape the development of the methodology used in this report to characterize the overall energy load attributed to natural gas‐fired commercial cooking appliances in California. The major reports that should be addressed are the California Commercial End‐Use Survey (2006) prepared by Itron, Inc. for the California Energy Commission, the California Statewide Commercial Sector Natural Gas Energy Efficiency Potential Study (2003), prepared by KEMA‐XENERGY Inc. for the California Public Utilities Commission (CPUC), the Technology Review of Commercial Food Service Equipment (1996), prepared by the Canadian Gas Research Institute (CGRI) for Natural Resources Canada, and the Characterization of Commercial Building Appliances (1993), prepared by Arthur D. Little, Inc. for the US Department of Energy (DOE). At this time, this report does not attempt to do more than briefly mention these
8 Standard‐efficiency economy (or budget) fryers may costs little as $800 and are an attractive option to small independent segment operators.
31
documents: a thorough critique and analysis of the results and the methodologies employed by these studies can be found in Appendix D. Using the general methodologies of these studies as a guideline, unique assumptions were established and estimates generated, for the purposes of this report, on all relevant variables9h utilizing the most current information collected from data sources at all levels of the industry.
The key data sources which were identified to help establish the inventory of major commercial cooking appliances, include the 1989 NAFEM Equipment and Supplies Survey, the 2008 NAFEM Size and Shape of the Study, the 2007 ReCount® Restaurant database8 for foodservice and numerous Foodservice Equipment Reports and Foodservice Equipment & Supplies publications on equipment trend projections for North America. These primary data sources were combined with information collected during on‐site visits and discussions with various chain restaurant and institutional kitchen equipment operators and suppliers.
Several secondary sources, specific to the foodservice industry, were reviewed in order to further determine what kind of typical equipment line up different foodservice facilities, both institutional and commercial, are likely to employ. This report utilized key articles published by two leading industry magazines: Foodservice Equipment & Supplies and Foodservice Equipment Reports. These contemporary sources examined typical trends in equipment selection and operations based on the nature of the business and the typical menus that were offered. This information was enhanced by the foodservice facility information gathered in the field by auditors over the more‐than‐20‐year span of the FSTC site survey support and commercial appliance end use monitoring programs. When further data was required that extended beyond the scope of existing FSTC site survey support records, information concerning typical appliance lineups and facility operating schedules was collected for the purposes of this report via informal surveys and discussions with food service managers sampled from various facility groups and categories of the institutional food service segment.
Estimating the current statewide, commercial gas cooking appliance energy load and projecting the energy efficiency potential across all gas cooking appliance categories was also achieved through the consultation an extensive variety of past and current, published and unpublished information sources. The results of discussions, conducted by the FSTC over 20 years, with manufacturer sales representatives in each appliance category and several large‐chain franchisee groups were specifically consulted to establish the efficiency breakdown trends of the commercial foodservice dataset. Equipment dealers and distributors were also surveyed for their sales percentage breakdowns, while published data from the ENERGY STAR® program for steamers and fryers provided a useful check against initial assumptions. Data collected by the Pacific Gas & Electric Company (PG&E) Sales & Service Department on the participation in their commercial foodservice energy efficiency program was also examined to provide insight into the market share of energy‐efficient appliances. Supporting data from FSTC site survey
9 Including, but not limited to: facility inventory data, facility operating hours, facility appliance inventories, appliance energy profiles, the current distribution of energy efficient cooking appliances and the theoretical limits of cooking appliance energy efficiencies

32
program records was used to supplement assumptions for the institutional foodservice segment. The summary results of this data integration can be found in detail in Section 6.3 Adjusting Appliance Energy Loads.
Data was then collected to benchmark the range of energy efficient cooking technologies that currently exist in the market. This data collection was achieved almost entirely through consultation of recent appliance technology assessments published by the Food Service Technology Center, as well as the most recent database of FSTC technology reports documenting commercial cooking appliances tested in accordance with ASTM test methods.
A discussion of the findings of the key relevant studies mentioned above and their use in shaping the methodology and outcome of this study is as follows:
3.6.2 NAFEM Size and Shape of the Industry The North American Association of Foodservice Equipment Manufacturers is an industry trade association of more than 625 foodservice equipment and supplies manufacturers, which provide products for food prep, cooking and other dining functions. The association publishes market data biennially based on the input of its members, in order to accurately reflect the state of the industry as a whole. The NAFEM 2008 Size and Shape of the Industry study was consulted to inform the modeling of the statewide natural gas‐fired commercial cooking appliance inventory Although the estimation of total units do not reflect the percentage of sales in the United States, or more specifically, the state of California, the distribution of market shares between gas and electric fueled units in each appliance category serves as a general check and balance against estimates that are derived from FSTC site surveys and sales data obtained directly from manufacturers.
3.6.3 ReCount® Restaurant Database For this PIER project, the latest available versioni of the ReCount® Restaurant database was purchased and analyzed. The 2007 ReCount® database is a verified file of retail commercial foodservice locations that is consolidated into a comprehensive list of more than 577,000 records in every type of market in the United States and Canada. The data set includes almost 270,000 chain restaurant locations and more than 307,000 independent restaurant locations. This database is generated, managed, and distributed by DataSource Technology, Inc., a private consulting company that specializes in mapping services, mapping software, geographic and demographic data and systems for business applications. The ReCount® database is updated every six months to ensure accuracy. The database is produced from a variety of commercially and publically available sources, in addition to proprietary data from the NPD Group, Inc., a leading global research firm that provides consumer and retail market research information for a wide range of industries10.
The ReCount® Restaurant database was selected over other types of databases for a variety of reasons. Most important was the great level of detail that the records were developed with. The
10 The 2007 ReCount® Restaurant database was the latest version available during the initial period of data collection and analyses for this study

33
database contains 53 major field categories and 83 subcategories: concerning everything from employee counts and sales volume to cuisine type. The proprietary methodology used to collect and manage the data was also very detail‐oriented. The database includes facilities that are not only free‐standing but exist in host locations such as airports, malls, shopping centers and gas stations.
The database was filtered and queried to include only information about establishments in the California market, and the resulting datasets analyzed in the scope of this study can be found in Appendix A. The accuracy of the database was checked against the current statistical summaries other industry authorities, such as Nations Restaurant News Periodical, and was found to be highly accurate.
3.6.4 Additional Sources All projections for quantifying and classifying the industry were based on the best available data from a variety of sources. Due to the variety of sources consulted, most state government statistical branches, the contemporariness of each source may vary depending on the frequency of which reports and statistics are published. All individual sources are listed in detail in Appendix A. Annual reports published by the National Restaurant Association were consulted to evaluate the present and future economic (and other key) trends of foodservice industry as whole. Data obtained from these reports was used to project the future growth and shape of foodservice facilities in California and the subsequent equipment inventories of these facilities.
Sources for establishing the equipment inventories and typical appliance line up assumptions were largely the amalgamation of field experience from the site survey program, and discussions with various chain restaurant and institutional kitchen equipment operators and suppliers. Where limited data existed from the site survey program, additional surveys were conducted to establish sample lineups from representative segments of the market of various size and scope. Such surveys were primarily conducted in institutional segments such as, educational services, correctional services and health care.
3.6.5 Site Monitoring Projects The characterization of the energy loads of the primary cooking appliance inventory of the foodservice sector involves the application of energy consumption modeling based on FSTC end‐use appliance monitoring and laboratory testing. Before the development of the ASTM test methods for commercial cooking appliances, it was necessary to understand how these appliances are actually being used in the field. This was accomplished through a series of site monitoring projects, where a variety of meters and data‐logging devices and minute‐ by‐minute data‐acquisition software was applied to commercial cooking appliances in a real‐world setting. The appliances were monitored in both cafeteria‐type setting and sit‐down, full‐service type settings.
From 1980‐1983 PG&E monitored cooking appliances in eight foodservice facilities, including schools, hospitals and restaurants. The goals of these building monitoring projects were to compare the gas use of the appliances to the total gas use of the building and establish typical usage patterns for different appliances. These initial trials spawned further studies which

34
successfully resulted in evaluating the following performance indices: peak energy input rates, preheat energy requirements and times, production‐energy consumption rates, base‐load energy consumption rates, and average load factors (idle‐to‐peak energy ratios). The projects tracked production levels (quantity of raw food cooked) by individual appliances and number of customers served on a daily bases. Additionally, minute‐by‐minute energy demand profiles were established which indicated how much time appliances spend in idle mode during the day. Average daily operating hours and daily pounds of food cooked were also recorded for each appliance type, which have assisted in informing basic operating hours and food production assumptions of the appliance energy profiles in this report [PG&E, 1990]. The findings of these site monitoring projects, in combination with more recent studies, generated multitude of ʺtypical dayʺ usage profiles for different appliances, which informed the baseline operating assumptions used in developing the appliance energy load profiles for this study.
3.7 Facility Data Analysis 3.7.1 Data Organization and Exploration The thresholds for inclusion and analysis of individual facilities in this study were defined on a categorical basis using soft methodology. Best available demographic data was obtained, when available, by the statistical and census taking branches of both state and federal governing agencies (and are summarized in Appendix A). In most cases (and especially throughout the institutional sector), descriptive demographic data was specific to the primary function of a given facility segment and category, and described such assorted variables as bed ratings, inmate ratings, and student enrollment11. For this reason, key demographic data of institutional food service facilities was not comparable across facility segments and categories. Unique thresholds were defined at the categorical level for most institutional segments (using the aforementioned key descriptive fields) and allowed facilities believed to have like food service establishments to be grouped for data analysis. The following example depicts sampling techniques and methodology used to organize and analyze the public primary dataset from the educational service sector:
Student enrollment data directly correlates to number of meals served per day (total pounds of food cooked per day) and can provide a good indication of the type and number of appliances needed to provide food for a given population. The enrollment values identified for this dataset range from 1‐5,297 students. Figure 4 shows the trend in enrollment data for public primary schools12.
11 To illustrate this trend, population data such as ʺstudent enrollmentʺ was used to classify the educational sector, while information such as ʺrated bedsʺ was used for institutions in the health care sector.
12 In this study, the designation ʺpublic primary schoolsʺ includes public facilities uniquely classified by the California Department of Education as: ʺK‐12ʺ, ʺelementaryʺ, ʺcounty communityʺ, ʺcommunity dayʺ, ʺmiddleʺ, ʺjunior highʺ or ʺcharterʺ.
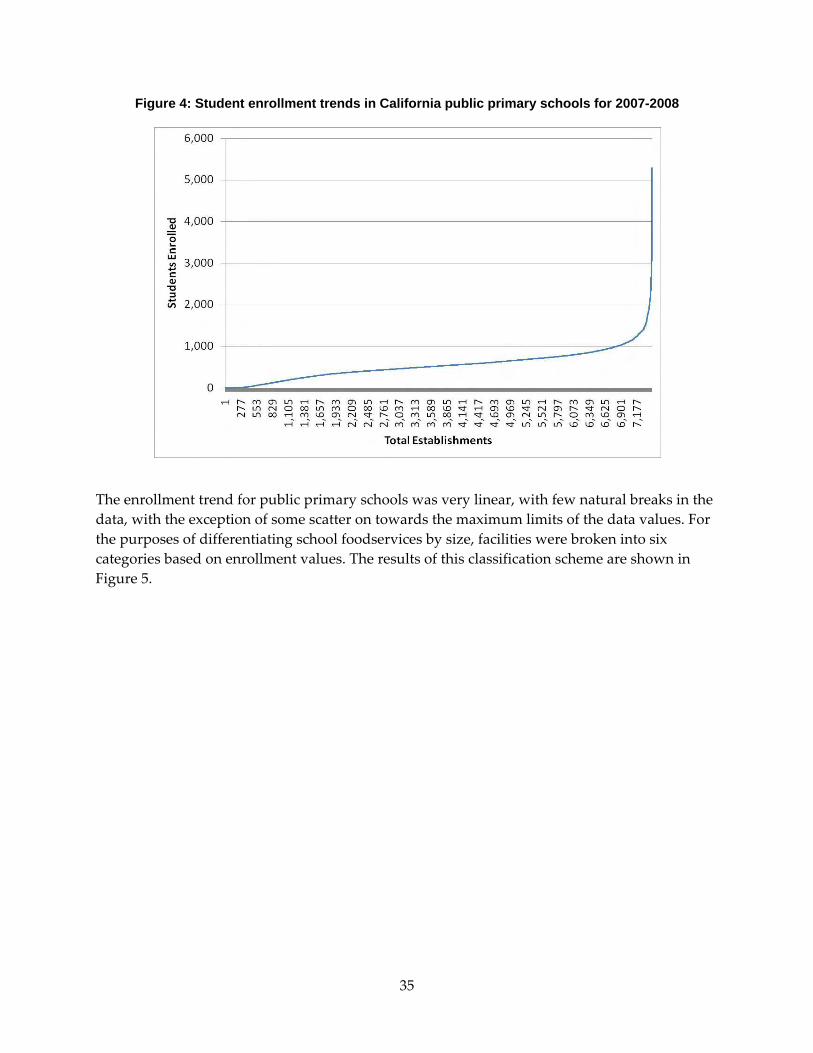
35
Figure 4: Student enrollment trends in California public primary schools for 2007-2008
The enrollment trend for public primary schools was very linear, with few natural breaks in the data, with the exception of some scatter on towards the maximum limits of the data values. For the purposes of differentiating school foodservices by size, facilities were broken into six categories based on enrollment values. The results of this classification scheme are shown in Figure 5.

36
Figure 5: Classification scheme histogram of California public primary schools in 2007-2008
Several samples were identified for the purposes of follow‐up surveying. Through surveying, it was determined that many of the smaller schools (under 200 students) did not have on‐site kitchen facilities but contracted foodservices out or were serviced by a large county‐level commissary kitchen. Schools that enrolled less than 200 students at the time of this study were omitted from the scope of this analysis: as they were not assumed to have operational kitchens using commercial grade appliances. Out of the 7,440 public primary schools recorded in the original dataset, only 6,314 were included in the scope of the study. Following the classification of this dataset, representative school samples from each enrollment range or ʺgroupʺ were identified. Additional information detailing commercial cooking appliance lineups and operating schedules was collected for these representative samples from informal surveying and discussions with foodservice managers (conducted during the time of this study), and from FSTC site survey records. This data was supplemented by data from secondary sources (such as trade publications) and was analyzed to formulate typical appliance lineups for all groups within the category.
3.7.2 Determining Facility Operating Schedules The annual operating days of the facilities are estimated in order to calculate the annual cooking appliance energy load. Typical operating assumptions were established at the categorical level of each facility to ensure greatest accuracy when calculating the total appliance energy load for each commercial foodservice segment. Assumptions were developed for average daily operating hours and total annual operating days in each facility category. Total Annual Operating Hours were then determined by multiplying average daily operating hours and

37
average annual operating days. In order to more accurately reflect the total contribution of each category to the overall appliance energy load it was necessary to determine the number of total weighted annual operating hours. This variable was calculated by multiplying the annual equivalent operating hours and the total number of facilities estimated for each facility category. Calculations and definitions are as follows:
Total Annual Operating Hours calculation and definitions:
THOUR= AHOUR x TDAY
Definitions:
THOUR= Total Annual Operating Hours (hours/year)
TDAY= Total Annual Operating Days (days/year)
AHOUR= Average Daily Operating Hours (hours/day)
Total Weighted Annual Operating Hours calculation and definitions:
EQHOUR= THOUR x nFACILITY
Definitions:
EQHOUR= Total Weighted Annual Operating Hours (hours/year)
nFACILITY= Total Number of Facilities
To illustrate the methodology used, a final calculation for determining the total categorical weighted annual operating hours is shown below for the ʺHotel/Other Lodgingʺ facility group:
EQHOUR = (AHOUR x TDAY) x nFACILITY
(20 x 365) x 1,297
9,468,100 = Total Weighted Annual Operating Hours (hrs/yr)
The tables contained in Appendix E describe the assumptions that were used to apply typical operating schedules to each facility at the category level in this project.
3.8 Summarization of Facility Data 3.8.1 Characterized Commercial Food Service Facilities There are an estimated 73,200 commercial foodservice facilities in California, based primarily on the purchased 2007 ReCount© data. 50,700 of these facilities are classified as small chains and independent foodservices. The remaining 22,500 represent large chain foodservices.

38
All commercial facilities, independent and chains, are divided between the quick‐service or full‐service restaurant segment. The classic definition for a quick‐service restaurant is a food retail establishment where patrons order at the counter and where there is no wait staff and minimal table service. The cuisine that is typically offered is categorized as casual and is fast to prepare. It is common for cuisine to be taken to go and seating is minimal. A full‐service restaurant is a retail food establishment where food is prepared, served and primarily eaten on the premises and a wait staff is present.
The characterized quick service and full service facilities represent key groups of the restaurant industry and the groupings are depicted in Figure 6. The classification schema of the quick‐service and full‐service are explained are detail in Appendix B. Operating schedules of commercial facilities vary based on independently owned vs. small and large chains and whether they are full‐service restaurants or quick‐service restaurants (with full‐service restaurants typically operating fewer days per year).
Figure 6: Breakdown of large chain, small chain and independent establishments in California
3.8.2 Characterized Institutional Food Service Facilities There is an estimated 20,000 institutional foodservice facilities in California. This facility count is based primarily on independent sources detailed in Appendix A with supporting data from the U.S. Census Bureau. The following institutional industry segments were found to have significant commercial foodservices: educational services, health & social services, recreational services, correctional services, accommodation services, military, work cafeterias and grocery retail. These industries are divided into the following facility categories: K‐12 schools, K‐12 commissary kitchens, post‐secondary schools, long‐term (skilled nursing) facilities, hospitals, residential care (independent/assisted living), congregate feeding agency sites (soup kitchens), correctional facilities, military installations, amusement/theme/water zoo parks, stadiums, casinos, golf courses/country clubs, hotels, work cafeterias, and supermarket/warehouse retail stores. Figure 7 shows the distribution of establishments across each condensed market segment.
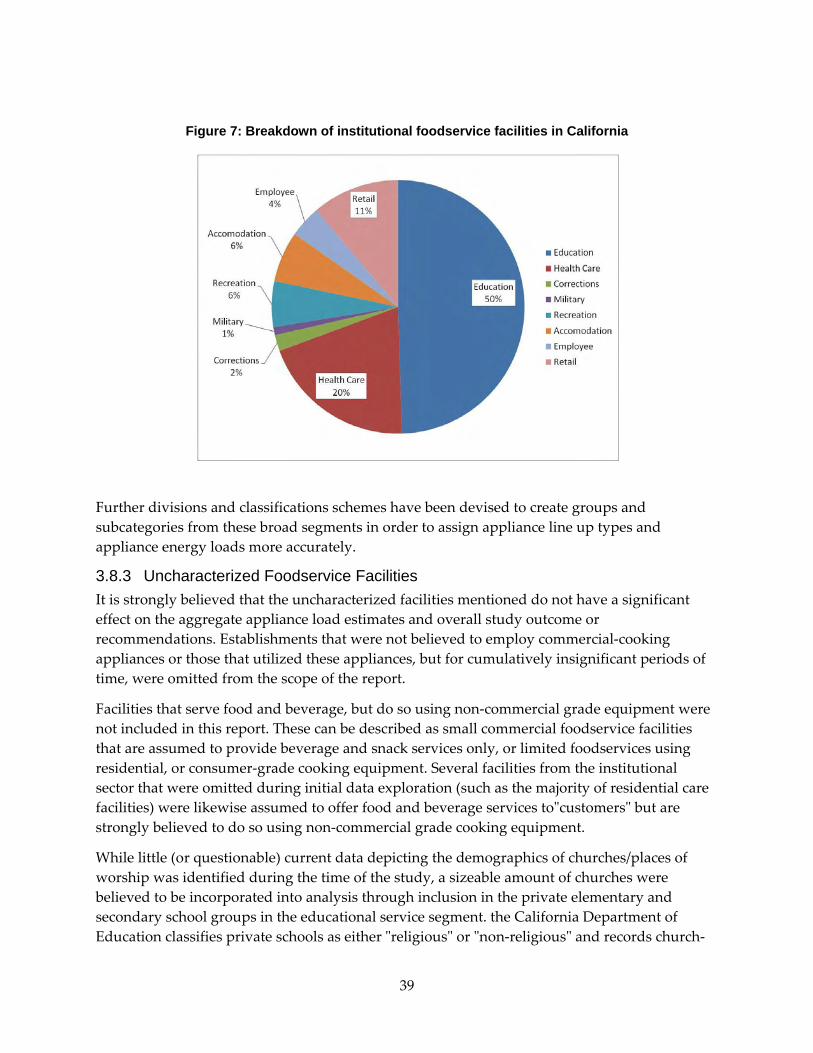
39
Figure 7: Breakdown of institutional foodservice facilities in California
Further divisions and classifications schemes have been devised to create groups and subcategories from these broad segments in order to assign appliance line up types and appliance energy loads more accurately.
3.8.3 Uncharacterized Foodservice Facilities It is strongly believed that the uncharacterized facilities mentioned do not have a significant effect on the aggregate appliance load estimates and overall study outcome or recommendations. Establishments that were not believed to employ commercial‐cooking appliances or those that utilized these appliances, but for cumulatively insignificant periods of time, were omitted from the scope of the report.
Facilities that serve food and beverage, but do so using non‐commercial grade equipment were not included in this report. These can be described as small commercial foodservice facilities that are assumed to provide beverage and snack services only, or limited foodservices using residential, or consumer‐grade cooking equipment. Several facilities from the institutional sector that were omitted during initial data exploration (such as the majority of residential care facilities) were likewise assumed to offer food and beverage services toʺcustomersʺ but are strongly believed to do so using non‐commercial grade cooking equipment.
While little (or questionable) current data depicting the demographics of churches/places of worship was identified during the time of the study, a sizeable amount of churches were believed to be incorporated into analysis through inclusion in the private elementary and secondary school groups in the educational service segment. the California Department of Education classifies private schools as either ʺreligiousʺ or ʺnon‐religiousʺ and records church‐
40
affiliation/denomination (if applicable) in official school records. In the 2007‐2008 school year, a sum of 2,261 schools were classified as religious. This study only includes private primary and secondary schools with total enrollment greater than or equal to 100 students: an estimated 1,260 religious‐affiliated schools met this criteria and were included in the scope of this study. It can be assumed that a large portion of those schools may also have some type of church or place of worship onsite.
Other facility categories were omitted from the scope and analysis of this report as ʺunknownsʺ, due to low confidence in the data collected or due to a general lack of credible and descriptive market data: foodservices in bowling alleys (other than those capture in ReCount® data), churches (or other faith‐based places of worship) on/offsite commissary production kitchens (that do not serve the educational sector) and catering kitchens were some of the identified ʺunknownsʺ.
3.8.4 Facilities in Host Locations Due to the inherent risk of duplicating or omitting data when integrating databases from multiple sources and organizations, it was assumed that a small portion of the commercial sector may have been categorized as institutional establishments (and vice versa). There were a small number of non‐freestanding establishment categories which were not believed to be thoroughly accounted for in the commercial foodservice sector. These include foodservice facilities in shopping malls, airports, and other host locations. The ReCount® Restaurant database defines ʺhost venuesʺ as gas stations, high schools, hospitals/medical centers, hotel/motels,malls/shopping centers, military bases, movie theaters, office buildings, sports stadiums, supermarkets, tourist attractions, train stations, and travel plazas. Table 5 summarizes all commercial establishments that are part of a host venue:
Overall, the ReCount® database identifies a very small portion of facilities located in commercial host venues: less than 8% or 5,674 establishments. Additionally, out of all host building types which were also classified in this study by their primary service function under the institutional foodservice segment of the industry, the ReCount® database only records 568 establishments, or less than 1%13 of all commercial foodservice establishments reported by ReCount®. The small portion of quick‐service establishments located in host venues which can be considered institutional in nature (such as hospitals, military bases, supermarkets, or office buildings) are generally outlets of large national chains, which provide limited menus (such as Starbucks, Jamba Juice)14 which were not assumed to operate gas‐fired commercial cooking appliances and are thus, not recorded/reported by this study in the institutional segment.
13 Actual amount estimated to be 0.77%
14 The majority of the facilities recorded under supermarket host venues are Starbucks or Jamba Juice

41
Table 5: Commercial Foodservices in Host Venues
Host Type Full-service Establishments
Quick-serviceEstablishments
Total Establishments
Percent of TotalFreestanding 28,987 28,405 57,392 78% # Pending 3,874 6,333 10,207 14% Airport 78 114 192 0.26%Casino 9 8 17 0.02%College/university 15 104 119 0.16%Convenience store 13 22 35 0.05%Department store 3 165 168 0.23%Food court 6 15 21 0.03%Gas station 5 53 58 0.08%Hospital/medical center 3 15 18 0.02%Hotel/motel 74 43 117 0.16%Mall/shopping center 1,271 3,321 4,592 6%Military base 1 48 49 0.07%Movie theater 4 2 6 0.01%Office building 24 35 59 0.08%Sports stadium 2 9 11 0.02%Supermarket 12 137 149 0.20%Tourist attraction 12 17 29 0.04%Train station 3 7 10 0.01%Travel plaza 12 12 24 0.03%
3.8.5 Facilities with Limited Operating Hours A small dataset of facility types (primarily) from institutional segments that were known, or assumed, to contain commercial foodservices and utilize commercial‐grade equipment were not included in the analysis of the report, as their very limited operating hours indicated that their collective cooking energy was too insignificant to warrant inclusion in the report.
Museums are one such example of facility types that were omitted from the final analysis due to the inconsistent presence, and extremely limited operating hours, of their foodservices. One hundred‐fifty free‐ standing museum establishments (not part of universities, colleges, or other institutions or virtual on‐line museums) were identified. Of these establishments, roughly one third were believed to contain commercial foodservices. These foodservices are characterized by infrequent operating hours and limited cooking equipment (as suggested by actual menu listings)
42
CHAPTER 4: Inventory of Commercial Food Service Facilities 4.1 Commercial Food Service Sector Generally speaking, commercial foodservice facilities have longer operating hours and more annual operating days than institutional foodservice facilities, where foodservice is an auxiliary function which does not solely drive overall profitability of the establishment. In general, quick‐service restaurants operate longer hours than do full‐service restaurants. However, there are several distinctions in operating trends between the independent, small chain and large chain market segments. A detailed accounting of the annual operating schedule estimates for all facilities covered in this study can be found in Appendix E.
4.1.1 Large Chains The analyzed ReCount data was broken into chain restaurants and independent restaurants. Chain restaurant companies are defined as those restaurant companies with more than two U.S. locations in their system. ReCount data included total number of U.S. locations in addition to California locations. Within the list of chain companies, the 111 restaurant companies with the most restaurant locations in California were separated out and classified as large chains. These are not necessarily the 111 largest national chains, but those chains with a minimum of 40 locations in California. The total chain dataset represents 22,077 restaurants that are both full‐service and quick service.
Operating hours for large chains are derived almost exclusively from FSTC field experience combined with operating information from official web sites was also used to supplement field experience.
Individual equipment lineups were established for these chain restaurants, based on a combination of FSTC conducted facility audits, facility plan reviews, and interviews 15 and literature review from industry trade magazines (Chain News, Foodservice Equipment reports and Foodservice Equipment and Supplies).
4.1.2 Small Chains The small chain segment represents all restaurant groups with a minimum of 3 locations and less than 40 locations in California. While this dataset includes some of the large National chains, they were included within the small chain subset for analysis purposes. There are a total of 10,490 establishments in the small chain market segment.
4.1.3 Independents The independent segment is defined as any establishment with 1‐2 locations in California. There are a total of 40,254 establishments which make up the independent market segment.
Independent quick‐service restaurant facilities may operate as many as 363 days a year. Operating schedules range from 12‐20 hours daily. Snack, pizza, chicken and Asian quick service restaurants may only operate 12 hours daily. Hamburger and Mexican (e.g., taquerias)
43
quick service restaurants operate an average of 16 hours daily. Finally, donut shops operate an average of 20 hours daily.
The family dining category of the independent segment operates much fewer days than do chain segment family dining categories. Independent dining establishments typically operate six days a week, which comes to 312 days per year.
4.2 Institutional Food Service Sector The relationship of establishment to operational kitchens is not always 1:1 in the institutional food service sector. Some facilities have multiple foodservice operations on site, such as prisons and recreational parks, or a military base with numerous quick‐service and full‐service foodservice establishments. For this reason, further analysis and research was conducted from additional sources in order to develop more accurate estimates for the total number of operational kitchens within each group and category. For each category, specific methodology and criteria were developed to determine the significance of, and inclusion of, the foodservices in given facilities.
Institutional foodservices can be categorized in the same manner as commercial foodservices, with a few exceptions. For example, a quick‐service Asian food establishment that is part of a university campus will have a very similar appliance line‐up as a quick‐service Asian restaurant in the commercial sector though markedly different operating hours. Full‐service and quick‐service restaurants located on college campuses around California are likely to have less annual operating hours than their commercial counter parts. Quick and full service restaurants on college campuses might be open an average of 260 days per year.
The operational hours depend on the amount of meals being offered and vary greatly from facility to facility. Various sectors rely on mandates and policies to dictate foodservices (corrections and education)15, which in turn assisted in estimating the total annual operating hours. In these cases, policies and independent surveying were used to make assumptions for operating hours. Other sectors list the operating hours of their foodservice facilities on business web sites. Various examples from each category were examined to determine typical or average daily operating hours as well as annual operating hours. The annual operating schedules of all facilities are detailed Appendix E.
Institutions such as hospitals, correctional facilities, military installations and hotels have foodservice facilities that operate 365 days per year. Institutions such as K‐12 schools, colleges and universities, work cafeterias and recreational facilities have foodservices that operate far fewer than 365 days per year, whereas grade school cafeterias may operate for only 180 days per year. Postsecondary dining facilities are open during the school year with 5 weeks off for fall, winter, and spring breaks. Half of the dining facilities are estimated to remain open through the summer break (11 weeks) for summer classes for a total of 290 days of operation.
15 These minimum standards policies mandate the minimum daily allowances of hot (i.e. cooked) meals for their institutions’ constituents.
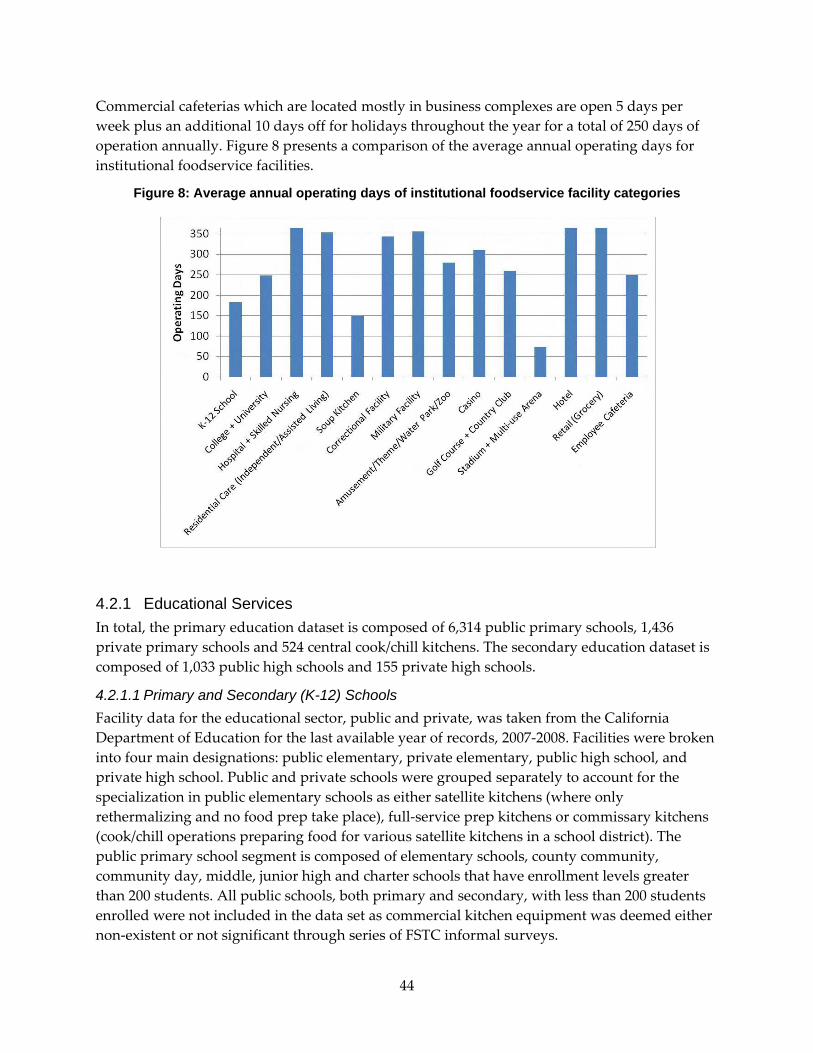
44
Commercial cafeterias which are located mostly in business complexes are open 5 days per week plus an additional 10 days off for holidays throughout the year for a total of 250 days of operation annually. Figure 8 presents a comparison of the average annual operating days for institutional foodservice facilities.
Figure 8: Average annual operating days of institutional foodservice facility categories
4.2.1 Educational Services In total, the primary education dataset is composed of 6,314 public primary schools, 1,436 private primary schools and 524 central cook/chill kitchens. The secondary education dataset is composed of 1,033 public high schools and 155 private high schools.
4.2.1.1 Primary and Secondary (K-12) Schools Facility data for the educational sector, public and private, was taken from the California Department of Education for the last available year of records, 2007‐2008. Facilities were broken into four main designations: public elementary, private elementary, public high school, and private high school. Public and private schools were grouped separately to account for the specialization in public elementary schools as either satellite kitchens (where only rethermalizing and no food prep take place), full‐service prep kitchens or commissary kitchens (cook/chill operations preparing food for various satellite kitchens in a school district). The public primary school segment is composed of elementary schools, county community, community day, middle, junior high and charter schools that have enrollment levels greater than 200 students. All public schools, both primary and secondary, with less than 200 students enrolled were not included in the data set as commercial kitchen equipment was deemed either non‐existent or not significant through series of FSTC informal surveys.
45
Assumptions on the percentage of schools which employed satellite or full‐service prep kitchens in the public elementary school sector was determined based on unpublished data collected by the California Department of Education using the Child Nutrition Information Payment System and from Los Angeles Unified School District. Samplings of Northern California public school districts were composed of 80% satellite kitchens and 20% full‐service prep kitchens. In contrast, a sampling of southern California, public school districts were composed of 80% prep kitchens and 20% satellite kitchens. These trends were applied to the remaining districts in the state to arrive at the assumption that public elementary schools split evenly between satellite kitchen sites and full‐service prep kitchen sites. This split resulted in 3,156 satellite kitchen sites and 3,156 prep kitchen sites.
The private school segment is composed of all schools, religious‐affiliated and nonsectarian with greater than 100 students enrolled. Few private schools are classified as strictly secondary schools (or high schools) because a large majority of private schools enroll students from grades K‐12. These schools are classified as private primary schools. Additionally, there is no subdivision for satellite vs. full‐service prep kitchen in the private school sector, as this trend is predominately found in public primary school districts. Similarly, private schools have not mandated dietary restrictions that prevent fried food from being served, while public primary schools have removed all fryers from kitchen operations as a result of federal and state policies.
Operating hours for public primary and secondary schools are derived from minimum requirements guidelines for the National School Lunch Program, School Breakfast Program, and Summer Foodservice Program. These minimal requirements for hot meals were integrated with FSTC working field knowledge of these facility types and further supported with operational standards articulated by foodservice workers in industry publications (FES). Standard daily cooking operating hours for public and private primary schools is 7 hours per day for 180 days per year, with high schools averaging slightly more with 8‐9 hours per day for 180 days per year. A key distinction exists between full‐service prep kitchens and satellite kitchens. Satellite or rethermalizing kitchens are assumed to operate fewer hours averaging only 4 hours a day for 180 days per year.
4.2.1.2 K-12 Commissary Kitchens There is no consolidated database that exists for centralized cook/chill kitchens that service the public elementary schools of California. Methodology was developed to estimate the characteristics and load of this type of kitchen within the education sector. It is assumed that approximately half of the public elementary schools are satellite kitchens. To determine the amount of central cook/chill kitchens that might service these schools, Los Angeles Unified School District, the largest school district, was chosen as an example. The Los Angeles Unified School Districts employs one central kitchen to support 155 primary schools. This model showed that all other school districts should need, at least, one central kitchen. Based on an estimated 50 percent of elementary public schools participating in a centralized kitchen program, it can be assumed that only one half of all elementary districts in the state will have a central commissary kitchen. Based on these assumptions, there are 524 central commissary

46
(cook/chill) kitchens in the state of California. Independent survey data indicates that these facilities may cook as many as 12 hours per day for 250 days per year.30
4.2.1.3 Postsecondary schools Facility data for post‐secondary education represents all California Community Colleges, private colleges and universities, California State Universities and Universities of California. Facility listings were derived from the California Community College Office of the Chancellor, and the California Postsecondary Education Commission documents for the 2007‐2008 academic term. The private colleges and university subdivision is composed strictly of 4‐year institutions from the Association of Independent California Colleges and Universities (AICCU). Independent 2‐year and 4‐year postsecondary educational institutions, such as specialty trade, technical schools and art schools, were not included in the dataset, as a result of preliminary investigations (internet business listings and phone solicitations) which confirmed no significant commercial foodservices. These institutions typically did not possess campuses with significant commercial food service establishments.
The post‐secondary educational sector is composed of 116 community colleges, 72 private college or universities, 23 state colleges and 10 state universities and 16 culinary academies: totaling 237 institutions. Research was conducted, using individual institution publications and food management contractor publications to identify the total amount and type of foodservices per institution. The results identified four distinct categories: 98 small cafeteria‐style operations, 130 large cafeteria‐style operations, 138 quick‐service, and 21 full‐service operations. Research also identified 45 unique culinary program kitchens that existed on the campuses of other institutions such as city colleges. A total of 446 unique foodservice establishments were identified in the post‐secondary educational sector.
Culinary programs and culinary academies were included in the post secondary segment of the facility inventory. In most cases, culinary programs existed as a program offering at a state community or junior college. There were 45 unique full‐service kitchen operations identified that were part of junior or community college culinary programs. Sixteen major stand‐alone culinary academies were identified in the state of California.
Operating hours of foodservices on the campuses of post‐secondary schools are greatly determined by the type of foodservice facility: cafeteria, quick‐service restaurant or full‐service restaurant. Large cafeterias, found on the campuses of larger private universities (generally greater than 3,000 students), UC’s and CSU’s tend to operate as many as 12 hours per day for 300 days per year. Small cafeterias, found on the campuses of community colleges and smaller four‐year colleges operate an average of 10 hours per day for 260 days per year. Many of these facilities operate independent of the academic calendar and additionally operate limited hours during summer months. Quick‐service and full‐service restaurants on campuses operate much fewer hours, and tend to follow the academic calendars. Most establishments operate minimal or reduced hours during weekends and over summer. Official web sites and calendars of the UC’s and CSUs were consulted to determine minimum operational hours for these facilities. These restaurants are assumed to operate an average of 9 hours per day for 260 days per year.
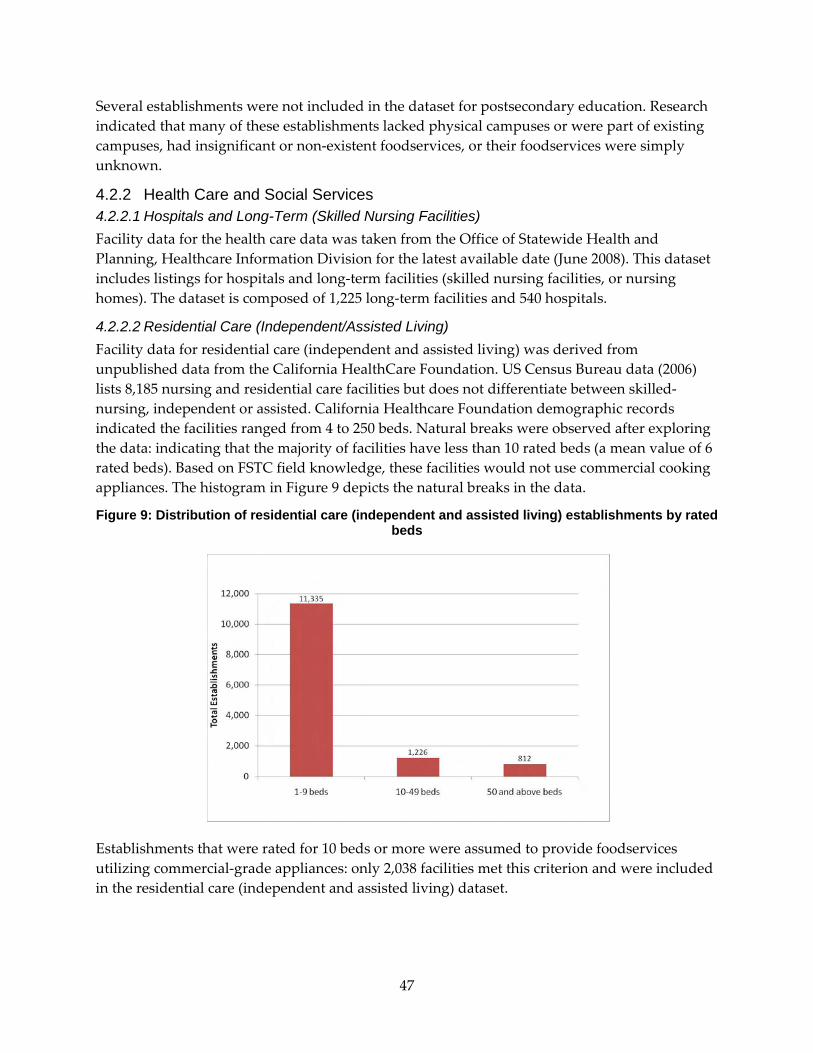
47
Several establishments were not included in the dataset for postsecondary education. Research indicated that many of these establishments lacked physical campuses or were part of existing campuses, had insignificant or non‐existent foodservices, or their foodservices were simply unknown.
4.2.2 Health Care and Social Services 4.2.2.1 Hospitals and Long-Term (Skilled Nursing Facilities) Facility data for the health care data was taken from the Office of Statewide Health and Planning, Healthcare Information Division for the latest available date (June 2008). This dataset includes listings for hospitals and long‐term facilities (skilled nursing facilities, or nursing homes). The dataset is composed of 1,225 long‐term facilities and 540 hospitals.
4.2.2.2 Residential Care (Independent/Assisted Living) Facility data for residential care (independent and assisted living) was derived from unpublished data from the California HealthCare Foundation. US Census Bureau data (2006) lists 8,185 nursing and residential care facilities but does not differentiate between skilled‐nursing, independent or assisted. California Healthcare Foundation demographic records indicated the facilities ranged from 4 to 250 beds. Natural breaks were observed after exploring the data: indicating that the majority of facilities have less than 10 rated beds (a mean value of 6 rated beds). Based on FSTC field knowledge, these facilities would not use commercial cooking appliances. The histogram in Figure 9 depicts the natural breaks in the data.
Figure 9: Distribution of residential care (independent and assisted living) establishments by rated beds
Establishments that were rated for 10 beds or more were assumed to provide foodservices utilizing commercial‐grade appliances: only 2,038 facilities met this criterion and were included in the residential care (independent and assisted living) dataset.
48
4.2.2.3 Congregate Feeding Agency Facilities (Soup Kitchens) The California Department of Social Services describes a congregate feeding agency as ʺa public or charitable institution (also known as a soup kitchen) that, as an integral part of the normal activities of the institution, maintains an established feeding operation to provide food to needy and homeless persons on a regular basis.ʺ This type of emergency feeding organization is distinct from food banks or food pantries in that it provides a common preparation, serving and dining facility: that is, it provides hot meals to be consumed onsite. Facility estimates on Congregate Feeding Agency sites/soup kitchens were taken from the California Department of Social Services, Emergency Food Assistance Program (EFAP) which identified approximately 160 registered soup kitchens throughout the state. Appliance lineups and operating schedules were established based on independent surveys and discussions with foodservice managers and from current FSTC site survey records.
Operating hours for hospitals, long‐term (skilled nursing) facilities, residential care (independent/assisted living) and congregate feeding agency sites were developed through consultations with industry trade publications and FSTC professional expertise. Long‐term (skilled nursing) establishments have limited operating hours compared with hospitals and generally operate around a minimum schedule of 2‐3 hot meals daily. Hospitals accommodate a wider range of clientele, (administration, staff, patients, and visitors) and therefore, facilities must work long hours to accommodate these guests. Hospitals, depending on the size, have a variety of foodservice operations per establishment and may operate anywhere from 10 to 14 hours daily for 365 days per year.
4.2.3 Correctional Services The correctional service sector is composed of establishments from the Federal Bureau of Prisons, Community Correctional Facilities, State Adult and Juvenile Institutions, Adult and Juvenile Conservation Camps, and County Adult and Juvenile Detention Facilities. There were a total of 331 federal, state, and county facilities examined in this report which account for an estimated 412 food service establishments. Information concerning State and Federal Prisons was obtained from the California Department of Corrections and Rehabilitation (CDCR). Facility information for County Adult and Juvenile Detention Facilities was collected from the Office of the Sherriff for each county, Correctional Standards Authority biennial reports, as well as Grand Jury investigative reports from each county.
County juvenile facilities were identified by examining the most current investigative report documents published by each County Grand Jury in the State. 16 These facilities are classified as Juvenile Halls, youth camps or rehabilitation facilities. Further descriptive data for these facilities was obtained through Grand Jury reports, official organizational websites and independent surveying. Out of 113 county juvenile facilities, 69 are presumed to have significant foodservices which utilize major cooking appliances and are included in this study.
16 Each Grand Jury is tasked with conducting annual inspections of correctional facilities in accordance with California Department of Corrections and Rehabilitation’s Correctional Standards “association, and publishing their findings publicly.

49
Figure 10 depicts the mean rated capacity for all facility groups within correctional services examined in this study.
Figure 10: Comparison of mean rated bed capacity for correctional service facility groups in California
Kitchens for this sector are subdivided into centralized commissary (cook/chill) kitchens (on site), full‐service prep kitchens, and satellite (rethermalization) kitchens. Data concerning the appliance inventories of CDCR sites was collected by an independent survey of food‐service managers. 17 Typical appliance line up for county adult detention facilities was derived from independent surveys of foodservice managers from a random selection of counties.
Operating schedule assumptions for correctional facilities were developed based on the minimum hot meal requirements set forth by the Correctional Standards Authority, and by a series of informal surveys given to CDCR food service managers. Federal Bureau of Prisons facilities were found to have full‐service kitchens that operated an average of 8 hours a day. Retherm kitchens, typically operated an average of 6 hours per day. Larger institutions, such as State adult prisons had kitchens that worked up to 10 hours per day. All correctional facility kitchens operate 365 days annually; with the exception of central cook/chill kitchens, which operate 250 days annually.
17 Actual appliance inventories were received by foodservice managers from all 33 state adult institutions during surveys conducted by the FSTC from the period of January 2009‐March 2009.
50
4.2.4 Military Services The dataset for military services is composed of all known major Air Force, Army, Navy, and Marine Corp establishments in California. The initial dataset included 29 total establishments (bases, stations, installments). Due to the expansive, multi‐building nature of these institutions a further examination of food‐service facilities, by type, was needed to accurately estimate describe the appliance inventories and energy load of the sector. Examining the most recent published documents (listed in Appendix A) from each military branch listed above, a total of 206 foodservice facilities were identified. These facilities are subdivided into full‐service, quick‐service, and cafeteria‐style facilities. Many quick‐service facilities found on military sites are recognized leading national chains, including”Burger King, Church’s Chicken, Subway and Domino’s Pizza.
Operating assumptions for food service facilities found in military service establishments were derived from website information published by each military branch (and affiliates) and FSTC field experience in military cafeterias and other foodservice facilities. Large cafeterias, commonly addressed as mess halls, and quick‐ service establishments within this sector operate an average of 14 hours daily for 365 days. Full‐service establishments, such as officers’ clubs, and banquet halls may operate slightly fewer hours (an average of 12 hours daily), for 365 days.
4.2.5 Accommodation Services The accommodation services segment was derived primarily from demographic data from the 2006 US Census Bureau, which identifies 5,186 hotels (excepting casino hotels) and motels. It is assumed that only a portion of these facilities offer commercial foodservices. In absence of a reliable organization which reports on the demographic of the accommodation and lodging industry in California, soft sampling methods were used. Hotel food service trends were observed by analyzing the current business listings of 42 major hotel chains in California, including: Doubletree, Hilton, Marriott, Ramada, Best Western, Days Inn, and Hyatt. 18 The total number of California establishments with full‐service dining facilities onsite, and without, was tallied and averages were established for each chain and then summarized. In this analysis, it was found that, on average, 49.7% of the hotels sampled had a full‐service restaurant onsite. Assumptions were then made about the composition of motels versus hotels in the 5,186 establishments identified by the US Census Bureau. It was assumed that hotels and motels were distributed evenly throughout the state of California. The trends observed in the most prevalent hotel chains were applied to the estimated 2,593 hotel establishments assumed to be operating in the state to identify 1,297 hotels with full‐service restaurants.
Hotel kitchens are typically open well into the night to accommodate guest’s needs for late night dining, entertainment, and room service. Based on a series of independent surveys, FSTC field monitoring projects and site survey records this study assumes a typical operating schedule of 20 hours per day for 365 days.
18 The analysis of the major hotel chains in California can be found in Appendix F.
51
4.2.6 Recreational Services Recreational services are composed (for the purposes of this study) of amusement, gambling and recreation industries. Establishments within these industries are further classified as amusement, theme, water and zoo parks, casinos and casino resorts, stadiums, multi‐use event centers, arenas, golf courses and country clubs. Each of these categories contains unique food service facility types with diverse operating schedules. Facility count estimations were based on a variety of primary and secondary sources, including internet business listings and industry and trade association websites, which are listed in Appendix A. The major industry groups which compose the recreational services sector are described in detail below.
4.2.6.1 Golf Courses and Country Clubs Facility data for the golf course and country club sector was exclusively from the 2006 US Census Bureau data, which identified 712 establishments. Supporting data was acquired from the most recent California Golf Economy Study report (2008), by the California Alliance for Golf.19 This document identified additional golf courses which were omitted by the US Census Bureau: courses located on universities, military installments or resorts (including casino resorts). Because these types of institutional foodservice facilities were already accounted for in the educational, military, lodging and gaming sectors, respectively, they were not included in the golf and country club sector.
The typical food service operations found at golf courses and country clubs are broadly categorized as casual American dining. The appropriate appliance line up was applied to this sector based on equipment found in casual American dining operations, although golf courses and country clubs are characterized by their limited hours of use. Through consultations of official websites and past FSTC field experience, golf and country clubs were estimated to operate only 5 days a week, 260 days per year, for approximately 8 hours per day.
4.2.6.2 Amusement/Theme/Water Parks and Zoos A total of 82 amusement/theme/water/zoo parks were included in this study. Due to the wide distribution in size from one establishment to the next, individual records of foodservice operations needed to be identified. Through phone solicitations and examination of business listings, 207 foodservice facilities were identified in this category: the majority of which were American grill‐style operations. Many of the foodservice operations in amusement parks are characterized by irregular or, infrequent use. Most amusement/theme/water parks (with the exception of zoos) are closed winter months and operate an average of 280 days annually: water parks tended to operate the least amount of annual days due to weather restrictions, amusement parks and zoos typically operate 8 hours per day.
4.2.6.3 Casinos This report identified 116 casinos and 31 casino resorts. Non‐hotel (card) casinos accounted for 111 foodservice facilities while casino resorts accounted for 123 foodservice establishments, or
19 An industry organization dedicated to research, education and advocacy for the California Golf Industry.

52
an average of four foodservice facilities per casino resort. In total, casinos represent 234 foodservice facilities in California. Foodservice facility estimates for this group were developed through a combination of business websites, phone surveys with staff and various gaming establishment directory & review sites. The foodservices in card casinos (non‐lodging) can be categorized as predominately casual American/ grill with some Chinese menu options. Operating hours as well as equipment inventories are very limited.
Foodservices in casino resorts tend to be a broad mix of American fine dining, American casual dining, buffet, Asian and/or Italian. In contrast, these casino establishments regularly operate long hours (typically around the clock). Smaller casinos and card rooms tend to operate 5 days a week all year long. Larger casinos (including Indian casinos and hotel/resort casinos) operate 365 days per year. During surveying the kitchens in smaller casinos were found to operate, on average, 8 hours daily. It is normal for kitchens in large casinos to operate as many as 12 hours per day.
4.2.6.4 Stadiums The dataset for stadiums and multi‐use event centers includes all stadiums, arenas, and multi‐use event centers used for professional and college baseball, soccer, football, hockey, and motorsports. In addition are facilities used for county‐wide fairs, musical and theater events. The dataset includes all facilities rated at 5,000 seats or more. Data for stadium and multi‐use event centers and arenas was collected by consultations with business websites were consulting various official sites for professional and college baseball, soccer, football and hockey leagues in California.
Many college‐level, and motorsports and fairgrounds establishments rely on a substantial amount of individual mobile vendors, as opposed to built‐in kitchen facilities. However, these vendors still use the basic cooking equipment suite (i.e. charbroilers, griddles and fryers) needed to serve basic American grill‐style fare: burgers, French fries, hot sandwiches and hot dogs. After extensive examination of the annual event calendars of a varied sample of sports leagues and teams, it was determined that: college‐level stadiums contain foodservices that may operate as few as 40 days per year, professional sports stadiums operate an average of 60 days per year while multiuse facilities see up to 100 days per year of use. Stadium kitchens typically operate 6 hours per day.
4.2.7 Retail Services The dataset for the supermarket and warehouse retail sector includes all establishments of the major national, state and regional chains, which offer retail food items prepared and cooked at an onsite facility. These sites can be described as extensive delis/rotisseries (offering hot meats and small meals) and bakeries.20 The major chains examined in this study were : Safeway, Albertson, Raleys, Costco, Whole Foods, Wild Oats, Gelsons, Andronicos, Mollie Stone, Holiday Quality Foods, IKE“, Walmart, Target, El Super, Nob Hill, Von’s, ”el“ir, Ranch 99, Ralph’s, and Food 4 Less. The data set is comprised of 2,239 stores that are representative of these chains.
20 Many chains also offer more diverse menus, including pizza, Asian cuisine, or American casual entrees.

53
Typical operating hours were derived by a examining past FSTC field monitoring projects involving leading supermarket chains, in combination with published operational hours for warehouse retailer foodservice operations. While a portion of supermarket chains operated cooking appliances as many as 18 hours per day, many warehouse retailers operated equipment for much less time‐ typically operating 10 hours daily. The average equivalent operating hours for the grocery retail segment are 12 hours per day for 365 days annually. Where FSTC field survey data was not available, company websites were consulted to determine typical operating hours in most cases.
4.2.8 Employee Services The dataset for the work cafeteria sector includes 261 county and state level divisional headquarters and Superior Courts and 548 corporate business headquarters. Governmental agency headquarters were identified from the California Department of Technology Services online directory. (Corporate headquarters are defined as the physical headquarters of businesses that employ equal to or greater than 200 persons in the state of California as identified by the online database retrieval system of Hoovers, Inc.21)
Typical operating hours were derived from FSTC site survey support program data and professional expertise. This report assumes work cafeterias to operate 12 hours a day, 250 days a year. This represents a five‐day weekly work schedule and does not include national holidays.
21 Hoovers, Inc., a subsidiary of Dun & Bradstreet, is an online publisher of proprietary business information. Hoovers, Inc. and currently holds a database containing information on over 65 million corporations and organizations.
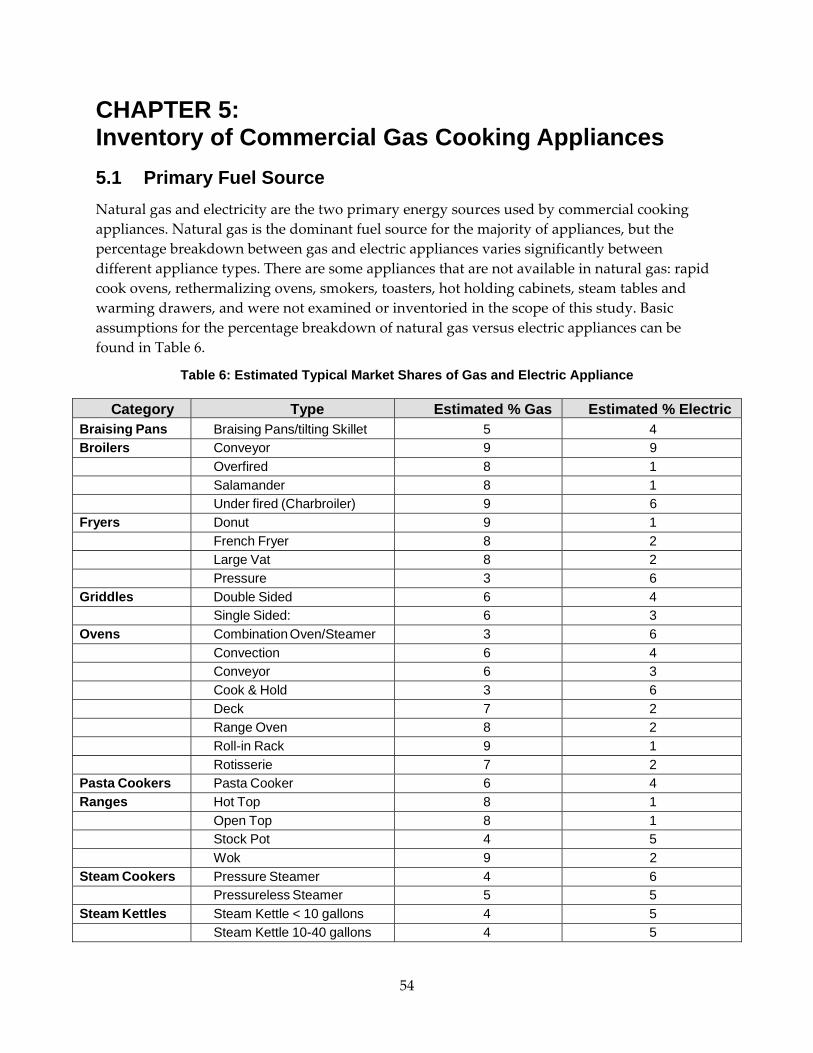
54
CHAPTER 5: Inventory of Commercial Gas Cooking Appliances 5.1 Primary Fuel Source Natural gas and electricity are the two primary energy sources used by commercial cooking appliances. Natural gas is the dominant fuel source for the majority of appliances, but the percentage breakdown between gas and electric appliances varies significantly between different appliance types. There are some appliances that are not available in natural gas: rapid cook ovens, rethermalizing ovens, smokers, toasters, hot holding cabinets, steam tables and warming drawers, and were not examined or inventoried in the scope of this study. Basic assumptions for the percentage breakdown of natural gas versus electric appliances can be found in Table 6.
Table 6: Estimated Typical Market Shares of Gas and Electric Appliance
Category Type Estimated % Gas Estimated % ElectricBraising Pans Braising Pans/tilting Skillet 5 4Broilers Conveyor 9 9 Overfired 8 1 Salamander 8 1 Under fired (Charbroiler) 9 6Fryers Donut 9 1 French Fryer 8 2 Large Vat 8 2 Pressure 3 6Griddles Double Sided 6 4 Single Sided: 6 3Ovens Combination Oven/Steamer 3 6 Convection 6 4 Conveyor 6 3 Cook & Hold 3 6 Deck 7 2 Range Oven 8 2 Roll-in Rack 9 1 Rotisserie 7 2Pasta Cookers Pasta Cooker 6 4Ranges Hot Top 8 1 Open Top 8 1 Stock Pot 4 5 Wok 9 2Steam Cookers Pressure Steamer 4 6 Pressureless Steamer 5 5Steam Kettles Steam Kettle < 10 gallons 4 5 Steam Kettle 10-40 gallons 4 5
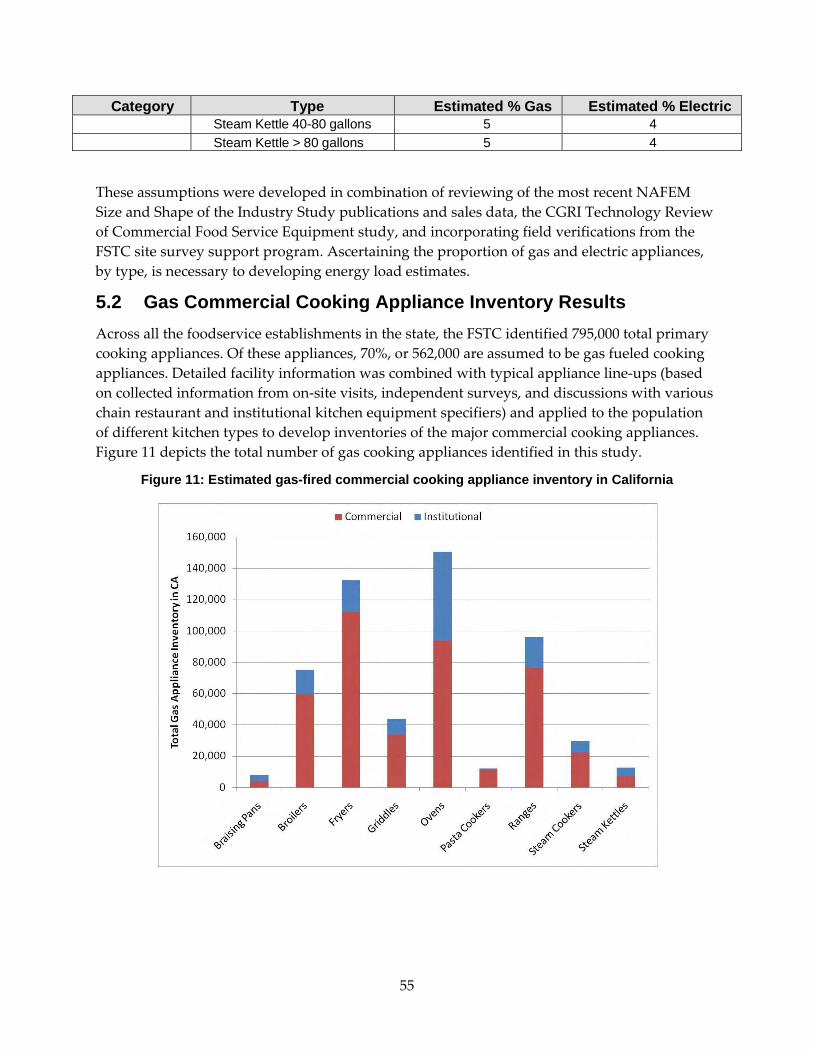
55
Category Type Estimated % Gas Estimated % Electric Steam Kettle 40-80 gallons 5 4 Steam Kettle > 80 gallons 5 4
These assumptions were developed in combination of reviewing of the most recent NAFEM Size and Shape of the Industry Study publications and sales data, the CGRI Technology Review of Commercial Food Service Equipment study, and incorporating field verifications from the FSTC site survey support program. Ascertaining the proportion of gas and electric appliances, by type, is necessary to developing energy load estimates.
5.2 Gas Commercial Cooking Appliance Inventory Results Across all the foodservice establishments in the state, the FSTC identified 795,000 total primary cooking appliances. Of these appliances, 70%, or 562,000 are assumed to be gas fueled cooking appliances. Detailed facility information was combined with typical appliance line‐ups (based on collected information from on‐site visits, independent surveys, and discussions with various chain restaurant and institutional kitchen equipment specifiers) and applied to the population of different kitchen types to develop inventories of the major commercial cooking appliances. Figure 11 depicts the total number of gas cooking appliances identified in this study.
Figure 11: Estimated gas-fired commercial cooking appliance inventory in California
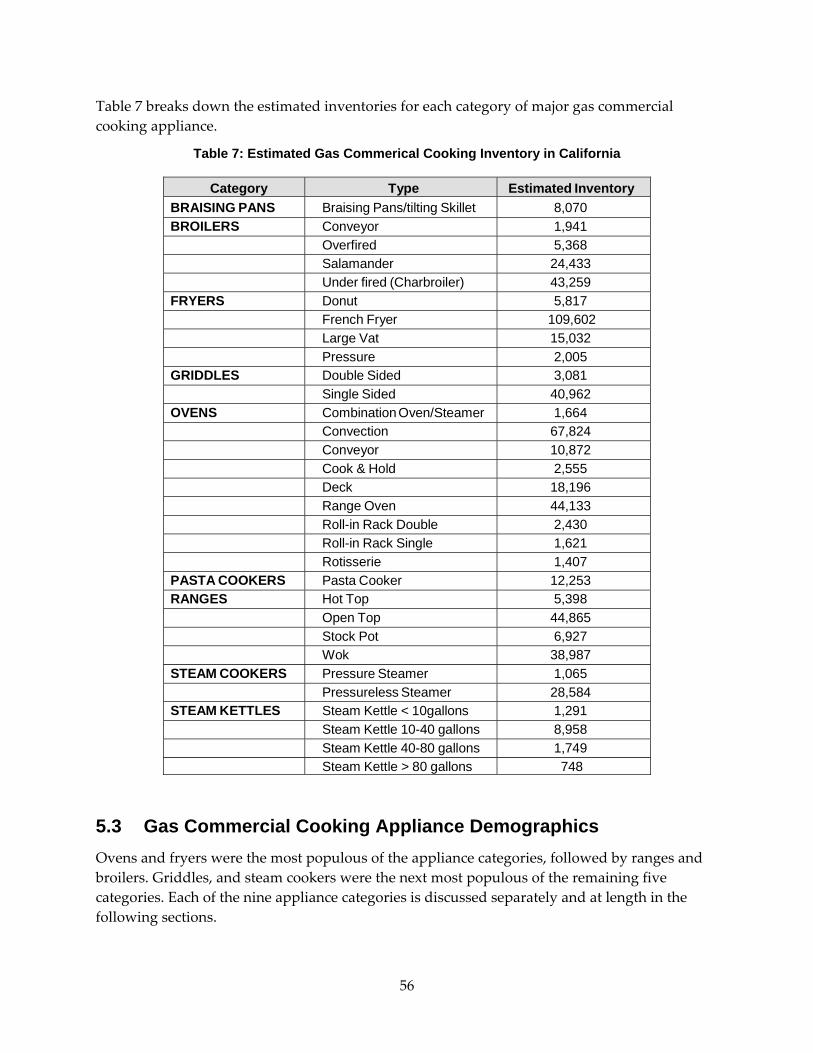
56
Table 7 breaks down the estimated inventories for each category of major gas commercial cooking appliance.
Table 7: Estimated Gas Commerical Cooking Inventory in California
Category Type Estimated Inventory BRAISING PANS Braising Pans/tilting Skillet 8,070 BROILERS Conveyor 1,941 Overfired 5,368 Salamander 24,433 Under fired (Charbroiler) 43,259 FRYERS Donut 5,817 French Fryer 109,602 Large Vat 15,032 Pressure 2,005 GRIDDLES Double Sided 3,081 Single Sided 40,962 OVENS Combination Oven/Steamer 1,664 Convection 67,824 Conveyor 10,872 Cook & Hold 2,555 Deck 18,196 Range Oven 44,133 Roll-in Rack Double 2,430 Roll-in Rack Single 1,621 Rotisserie 1,407 PASTA COOKERS Pasta Cooker 12,253 RANGES Hot Top 5,398 Open Top 44,865 Stock Pot 6,927 Wok 38,987 STEAM COOKERS Pressure Steamer 1,065 Pressureless Steamer 28,584 STEAM KETTLES Steam Kettle < 10gallons 1,291 Steam Kettle 10-40 gallons 8,958 Steam Kettle 40-80 gallons 1,749 Steam Kettle > 80 gallons 748
5.3 Gas Commercial Cooking Appliance Demographics Ovens and fryers were the most populous of the appliance categories, followed by ranges and broilers. Griddles, and steam cookers were the next most populous of the remaining five categories. Each of the nine appliance categories is discussed separately and at length in the following sections.

57
5.3.1 Braising Pans Braising pans, also known as tilting skillets or tilting‐frying pans are among the most versatile appliances found in the commercial kitchen. They are used to braise, sauté, broil, roast, boil, fry, griddle, proof, hold, simmer, melt and steam. They can also be used as a steam table to hold warm foods. In appearance, a braising pan resembles an oversized frying pan. The cooking surface may be used like a griddle plate to sear and brown food product. The addition of the sides allows the unit to accommodate liquids for sauces and stews. One characteristic feature of braising pans is the ability to tilt forward between 10 and 110 degrees for pouring and cleaning. A lever or hand wheel, or more rarely an electric motor, brings the pan forward and holds it in a tilted position (Figure 12).
The braising pan can save time, money and line space in a commercial kitchen by performing the jobs of several different appliances. Throughout the day, the braising pan may provide extra griddle space for breakfast or lunch; be used as a kettle to prepare rice or pasta; be rolled to the serving line and used as a holding cabinet; be fitted with steamer baskets to prepare vegetables or rethermalizing frozen food, with a rack to wet‐roast meat, or with fry baskets to prepare French fried potatoes and other foods typically prepared in a deep fat fryer. This appliance is particularly well suited to moving from one mode of cooking to another.
Braising pans are dominantly found in family style and casual dining in the commercial sector. Within institutions, braising pans find a wider range of distribution. Braising pans can be found in the kitchens of K‐ 12 schools, post‐secondary schools, health care facilities, corrections, military cafeterias and hotel kitchens. .
Figure 12: 40-Gallon tiliting braising pan
Photo courtesy of Cleveland Range

58
Figure 13 and Figure 14 illustrate the distribution of braising pans in commercial and institutional foodservices.
Figure 13: Distribution of braising pans in commercial facilities
Figure 14: Distribution of braising pans in institutional facilities
5.3.2 Broilers Broilers are composed of a suspended metal grate with heat applied from either above or below. Depending on size and design, broilers are used for anything from melting cheese to cooking large cuts of meat in vast quantities. By design, broilers are open to the kitchen and radiate a great deal of heat into the room. They tend to have high energy use and low efficiency, and represent one of the most expensive appliances to operate in a commercial kitchen. In
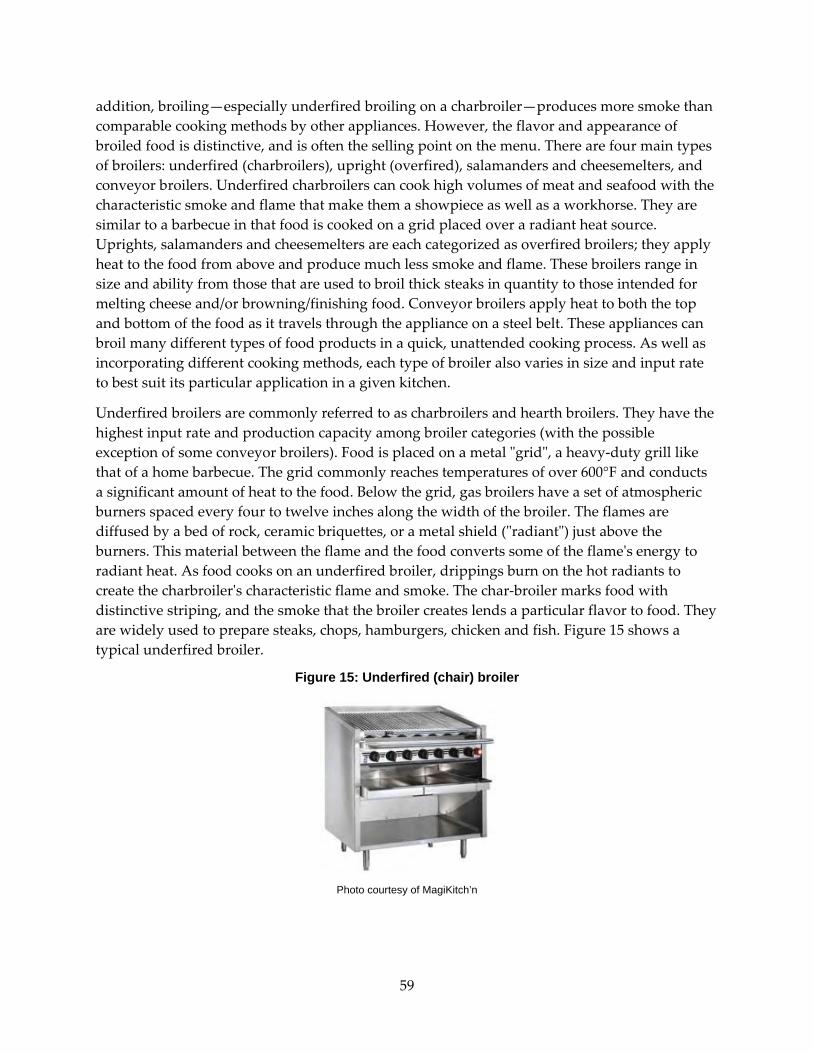
59
addition, broiling—especially underfired broiling on a charbroiler—produces more smoke than comparable cooking methods by other appliances. However, the flavor and appearance of broiled food is distinctive, and is often the selling point on the menu. There are four main types of broilers: underfired (charbroilers), upright (overfired), salamanders and cheesemelters, and conveyor broilers. Underfired charbroilers can cook high volumes of meat and seafood with the characteristic smoke and flame that make them a showpiece as well as a workhorse. They are similar to a barbecue in that food is cooked on a grid placed over a radiant heat source. Uprights, salamanders and cheesemelters are each categorized as overfired broilers; they apply heat to the food from above and produce much less smoke and flame. These broilers range in size and ability from those that are used to broil thick steaks in quantity to those intended for melting cheese and/or browning/finishing food. Conveyor broilers apply heat to both the top and bottom of the food as it travels through the appliance on a steel belt. These appliances can broil many different types of food products in a quick, unattended cooking process. As well as incorporating different cooking methods, each type of broiler also varies in size and input rate to best suit its particular application in a given kitchen.
Underfired broilers are commonly referred to as charbroilers and hearth broilers. They have the highest input rate and production capacity among broiler categories (with the possible exception of some conveyor broilers). Food is placed on a metal ʺgridʺ, a heavy‐duty grill like that of a home barbecue. The grid commonly reaches temperatures of over 600°F and conducts a significant amount of heat to the food. Below the grid, gas broilers have a set of atmospheric burners spaced every four to twelve inches along the width of the broiler. The flames are diffused by a bed of rock, ceramic briquettes, or a metal shield (ʺradiantʺ) just above the burners. This material between the flame and the food converts some of the flameʹs energy to radiant heat. As food cooks on an underfired broiler, drippings burn on the hot radiants to create the charbroilerʹs characteristic flame and smoke. The char‐broiler marks food with distinctive striping, and the smoke that the broiler creates lends a particular flavor to food. They are widely used to prepare steaks, chops, hamburgers, chicken and fish. Figure 15 shows a typical underfired broiler.
Figure 15: Underfired (chair) broiler
Photo courtesy of MagiKitch’n

60
Upright broilers are heavy‐duty freestanding units designed for high volume production of meats (particularly steaks). They have the highest input rate and production capacity among overfired broilers. Manufacturers commonly offer two identical broiler cavities or ʺdecksʺ stacked vertically as one unit (Figure 16). The grids slide out for loading and unloading, and can be raised towards the infrared burners in the top of the cavity or lowered for slower cooking. Two knobs on the left of the cavity control input to the burners. Ovens may also be stacked with an upright broiler. Some manufacturers mount a finishing oven above an upright broiler so that the heat source at the top of the broiler cavity doubles as a heat source in the bottom of the oven cavity.
The radiant heat in an overfired broiler is typically generated with gas infrared burners or gas radiants. Some manufacturers use powered burners that force premixed gas and air through a ceramic infrared burner. The high heat generated by ceramic infrared burners may incinerate some of the smoke and grease that is formed during broiling and grease does not drip onto hot coals or radiants, thus overfired broilers produce less smoke than underfired broilers. An overfired broiler typically has a lighter‐weight grid than a charbroiler, and the grid is shielded from the elements or burners when it is covered with product. The grid may not receive and retain as much heat from the burners as a charbroiler grid does, making conductive heating less significant in an overfired broiler.
Figure 16: Overfired broiler with two broiling decks
Photo courtesy of Vulcan
Salamanders are medium‐duty overfired broilers. Their input range slightly overlaps that of both uprights and cheesemelters, but they are designed to fit above a rangetop on a backshelf. The broiling cavity can be as wide as an uprightʹs but not as deep, typically 12 inches instead of 24 inches deep. A typical salamander broiler is illustrated in Figure 17. Salamanders generally have a lower input rate to match their smaller size, and deliver slightly less energy to each

61
square foot of the grid. They are intended to prepare the same range of foods as a high‐input upright broiler, but at lower volume and without occupying floor or counter space.
Cheesemelters have the lowest input rate among overfired broilers, and are generally used to melt the cheese on top of foods such as Mexican and Italian dishes, pie and French onion soup. They are usually incapable of fully cooking food items like steak and chicken, and do not have grease pans to catch fat and drippings. In appearance they resemble salamanders, although they are generally smaller and have a more lightweight construction. This type of broiler is intended for a limited set of tasks, and so the grill adjustment is usually not as sophisticated as it is for other overfired broilers. Both salamanders and cheesemelters are typically used for finishing dishes, rather than for heavy duty cooking.
Figure 17: Salamander broiler
Photo courtesy of Southbend
Conveyor or ʺchainʺ broilers employ both an overfired and an underfired heat source, cooking both sides of the food product at once. These broilers are ideally suited to broiling hamburger patties in large quantities. Model sizes range from small, tabletop broilers favored by convenience stores to large‐capacity broilers for fast‐food operations. Conveyor broilers are available with an additional section specifically for toasting buns. Multiple‐chain models are available so that more than one size patty or meat product such as chicken, steaks or hamburgers can cook at the same time. Figure 18 shows a typical gas conveyor broiler.
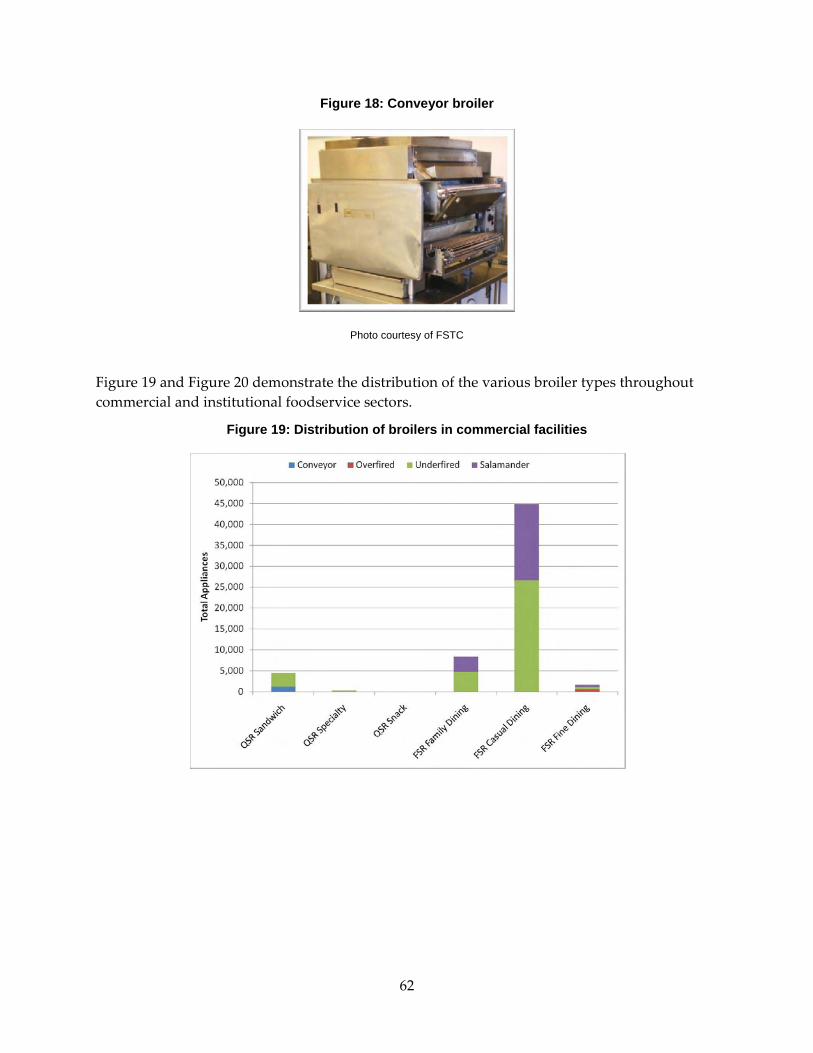
62
Figure 18: Conveyor broiler
Photo courtesy of FSTC
Figure 19 and Figure 20 demonstrate the distribution of the various broiler types throughout commercial and institutional foodservice sectors.
Figure 19: Distribution of broilers in commercial facilities

63
Figure 20: Distribution of broilers in institutional facilities
5.3.3 Fryers Fryers are available in a range of configurations but still share a common basic design. The kettle, or frypot, contains a sufficient amount of oil so that the cooking food is essentially supported by displacement of the oil rather than by the bottom of the vessel. The oil is heated by atmospheric or infrared gas burners underneath the kettle or in heated tubes that pass though the kettle walls. The kettle may be split into more than one cooking vat, allowing the operator to prepare different foods without flavor transfer. Fryers may be countertop units, freestanding floor units, and in batteries of several fryers in one housing.
The fryer menu has expanded to include various deep fried snacks such as mushrooms, zucchini, peppers and mozzarella cheese. Equipment manufacturers have responded by designing fryers that operate more efficiently, quickly, safely and conveniently. There are four main types of fryers: French fryers, pressure fryers, large vat (chicken and fish) fryers and donut fryers. Fryers range in capacity from about 15 lb of oil for a small, countertop fryer to over 200 lb of fat for the largest floor‐model fryers used for donuts and chicken. The larger sizes were designed to accommodate large products such as chicken and fish. The most common type of fryer is the standard 15‐inch French fryer. Figure 21 shows a typical 15‐inch French fryer.

64
Figure 21: French fryer
Photo courtesy of Frymaster
Pressure fryers are less common. They are mainly used for cooking chicken, and are said to reduce moisture loss and oil uptake. The pressure fryer is similar to an open‐kettle fryer, but with the addition of a heavy, gasketed lid and a pressure valve. As steam escapes from the food and builds up above the oil, the pressure inside the kettle rises. Moisture in the food reaches higher temperatures before escaping into the kettle, and the cook time is somewhat decreased. A typical pressure fryer is pictured in Figure 22.
Figure 22: Pressure fryer
Photo courtesy of Henny Penny
Most large vat fryers have a rectangular or circular kettle with a deep cold zone at the bottom below the heat source. These fryers are similar to the smaller French fryers, but have an oversized frypot to accommodate large food items, such as chicken and fish. Due to their

65
similarities with French fryers, many operations use large vat fryers to increase their cooking capacity with a nominal impact on footprint. Figure 23 shows an 18‐ inch large vat fryer.
Figure 23: Large Vat Fryer
Photo courtesy of Pitco
Donut fryers are generally wide and shallow to allow a layer of food to float as it cooks. Instead of a standard fry basket, the product is generally lowered into the oil on a screen or shallow basket that is the same size as the top of the kettle. Donut fryers may have an upper ʺsubmergerʺ screen to immerse certain types of donuts during frying. A typical donut fryer is illustrated in Figure 24.
Figure 24: Donut Fryer
Photo courtesy of Pitco
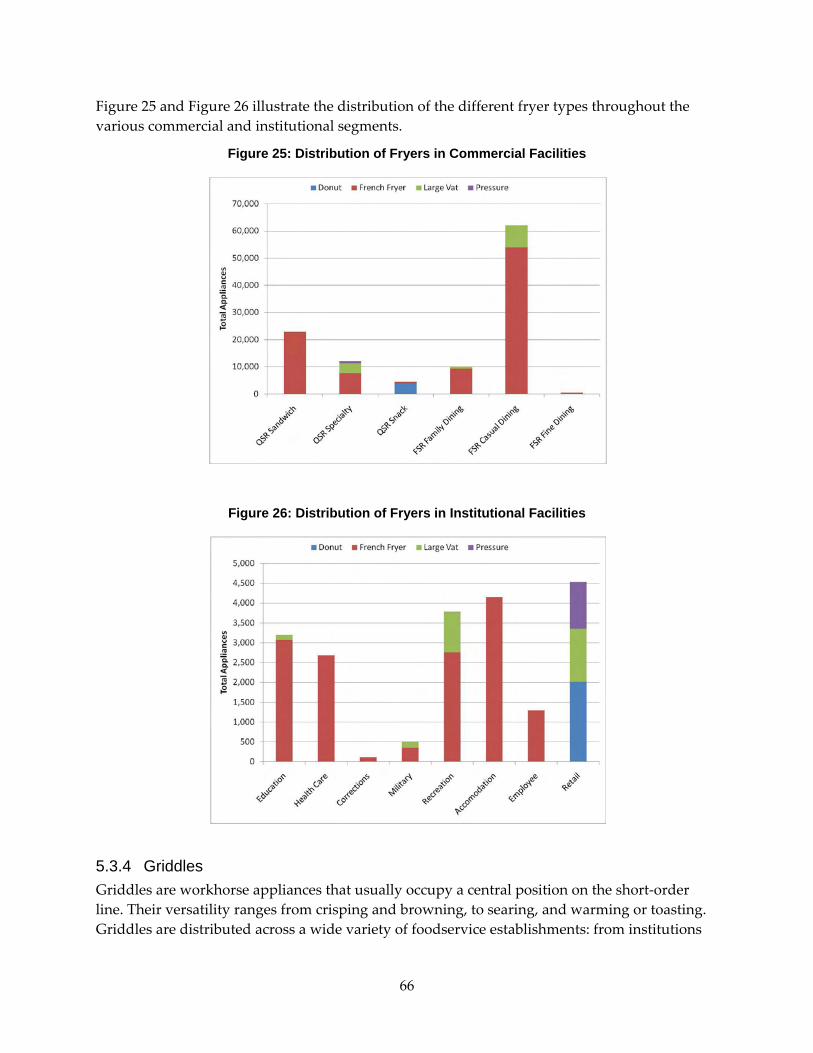
66
Figure 25 and Figure 26 illustrate the distribution of the different fryer types throughout the various commercial and institutional segments.
Figure 25: Distribution of Fryers in Commercial Facilities
Figure 26: Distribution of Fryers in Institutional Facilities
5.3.4 Griddles Griddles are workhorse appliances that usually occupy a central position on the short‐order line. Their versatility ranges from crisping and browning, to searing, and warming or toasting. Griddles are distributed across a wide variety of foodservice establishments: from institutions

67
such as correctional facilities, to full‐ service fine dining establishments. Griddles vary in size, power input, heating method, griddle‐plate construction and control strategy. All designs cook via contact with a heated metal plate that has splashguards attached to the sides and rear and a shallow trough to guide grease and scraps into a holding tray. The griddle plate is heated from underneath by gas burners or electric elements, and controls are generally located on the front of the appliance. The griddle plate is typically a polished flat surface; however, it may be grooved to give the food product a seared pattern characteristic of charbroiling without the flare‐up and smoke typically associated with broiling. griddle’s low‐profile design enables manufacturers to offer them in a variety of configurations. The same griddle can be placed on a stand (freestanding floor model), a countertop, or be incorporated into a range top. Manufacturers also commonly offer griddles as a component of a restaurant range battery. There are two primary types of griddles—single‐sided and double‐sided. Single‐sided griddles are designed for cooking food in oil or its own juices by direct contact with a flat, smooth, hot surface (i.e., flat, polished steel plate) where plate temperature is either manually or thermostatically controlled. Burners or electric elements usually are spaced between 8 and 12 inches apart beneath the plate with one control per 12‐inch section. This allows each griddle section to be maintained at a different temperature. Figure 27 shows a typical 3‐foot flat griddle while Figure 28 depicts a grooved griddle.
Figure 27: 3-Foot (flat) Griddle
Photo courtesy of Wolf Range
Figure 28: 3-Foot Grooved Griddle
Photo courtesy of American Range
Double‐sided (clamshell) griddles, have hinged upper griddle plates (platens) that swing down to contact the food, thereby cooking the food from both sides at once. The upper section typically has manual or automatic adjustment to accommodate different product widths. Figure
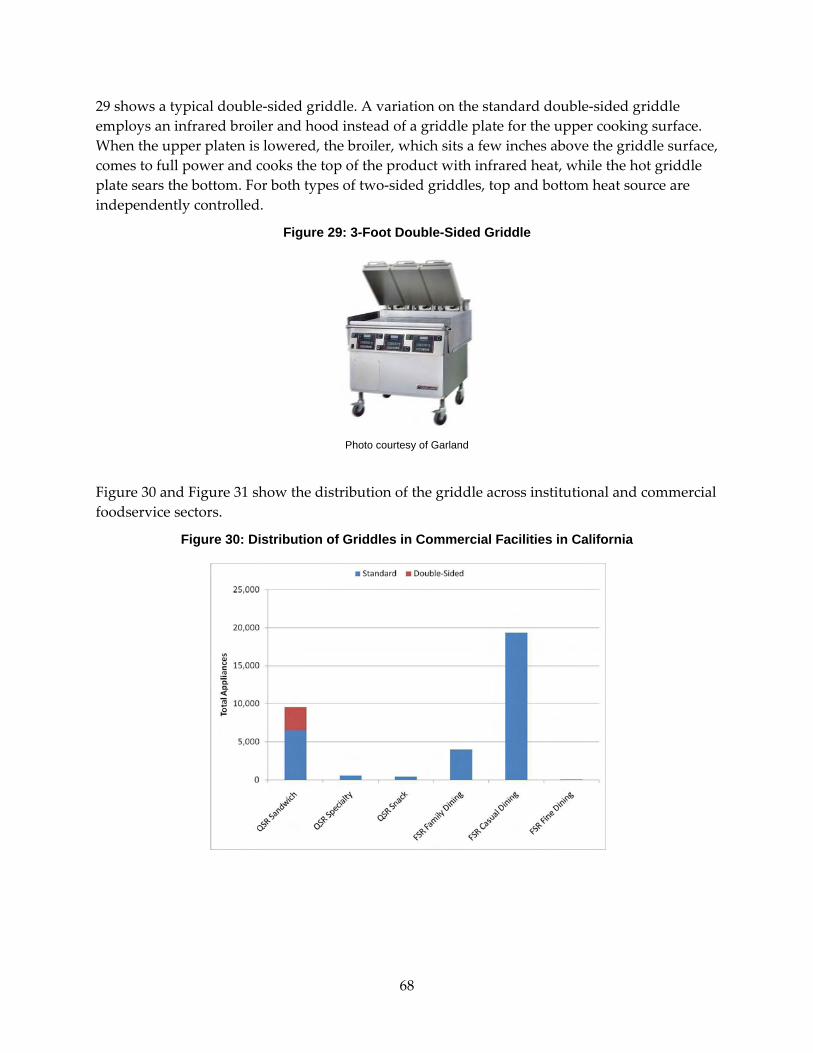
68
29 shows a typical double‐sided griddle. A variation on the standard double‐sided griddle employs an infrared broiler and hood instead of a griddle plate for the upper cooking surface. When the upper platen is lowered, the broiler, which sits a few inches above the griddle surface, comes to full power and cooks the top of the product with infrared heat, while the hot griddle plate sears the bottom. For both types of two‐sided griddles, top and bottom heat source are independently controlled.
Figure 29: 3-Foot Double-Sided Griddle
Photo courtesy of Garland
Figure 30 and Figure 31 show the distribution of the griddle across institutional and commercial foodservice sectors.
Figure 30: Distribution of Griddles in Commercial Facilities in California

69
Figure 31: Distribution of Griddles in Institutional Facilitites in California
Two factors are currently driving energy efficient griddle designs. First, quick service chains (now followed by casual dining chains) have stimulated research on energy efficient griddles because they recognize the possibility of increasing profits by specifying better equipment. Second, ASTM standard test methods developed by the Food Service Technology Center (FSTC) have allowed testing facilities to produce griddle energy performance data that can be compared between labs. This allows both manufacturers and purchasers to calculate the cost of operating specific griddle models and technologies. FSTC published data shows that energy performance can vary significantly with griddle type and construction details.
5.3.5 Ovens Commercial ovens are the largest and most diverse category of commercial foodservice equipment. This versatility and diversity mean that they can be found in almost any type of foodservice operation. They are available in many different configurations. Natural gas is the predominant fuel source for most commercial ovens, representing 55 to 60% of the installed base.4
An oven can be simply described as a fully enclosed, insulated chamber used to heat food. Within that primary design, there are many variations of the basic concept in the commercial kitchen. The most common types of commercial ovens include standard or conventional ovens, convection ovens, combination oven/steamers (also known as combination or combi ovens), conveyor (pizza) ovens, deck ovens, rack ovens and rotisseries.
A conventional, or standard, oven cooks food by utilizing hot air currents that transfer heat over the surface of the food product within a closed cavity. The burner, or elements, heats the air within the oven cavity as well as the cavity walls. The hot airʹs buoyancy carries it upward through cooler air, which then slowly sinks to the bottom of the oven as it cools off. Two familiar types of conventional ovens are the range oven and the deck/pizza oven. The range

70
oven is the most familiar, since it is frequently combined with a rangetop. Definitions for these subcategories are provided below:
Range ovens are the most common type of conventional oven. The range oven exists as part of a cooking unit or system that forms the housing or base of the rangetop (i.e., burners, electric elements or hobs). The range/oven combination usually consists of only one oven cavity and is normally specified for smaller operations. Figure 32 shows a six‐burner range with a range oven base.
Figure 32: Six-Burner Range with Oven Base
Photo courtesy of American Range
A deck oven cooks food product directly on the floor of a heated chamber. Deck ovens are similar to conventional ovens except the inside cavity has a low height, ranging from 6 to 10 inches, as there are no interior shelves. The deck oven’s low profile allows multiple units to be stacked, thereby maximizing space.
The bottom of each compartment is called the deck and heat is typically supplied by burners or elements located beneath the deck. The oven ceiling, floor, and walls are designed to absorb heat quickly and radiate that heat back slowly and evenly. To accomplish this, the deck is often made of ceramic material, steel, brick, or some other composition material. Deck ovens with firebrick hearths are particularly good for bottom‐crust baking and are widely used for cooking both bakery items (bread) and pizza (in addition to casseroles meats and fish). Figure 33 shows a typical freestanding, single, pizza deck oven.

71
Figure 33: Pizza Deck Oven
Photo courtesy of Blodgett
Convection ovens cook food by forcing hot air over the surface of the food product by a fan in a closed cavity. The rapidly moving hot air strips away the layer of cooler air next to the food and enables the food to absorb the heat energy. Convection ovens are more commonly used for general purpose baking and roasting rather than conventional ovens due to the improved speed and uniformity of cooking over convectional ovens.
Commercial convection ovens come in two basic sizes—full‐size and half‐size—based on whether the oven can accept standard full‐size (18 x 26 x 1‐inch) or half‐size (18 x 13 x 1‐inch) sheet pans. Most half‐ and full‐size ovens are capable of handling up to six sheet pans. A typical full‐size convection oven is shown in Figure 34.
Figure 34: Full-size Convection Oven
Photo courtesy of Southbend
A (Roll‐In) Rack Oven cooks by forcing hot air over the food product within a closed cavity, and is fitted with a mechanism for rotating one or more pan racks within the cavity. Rack ovens are heavily used in production baking due to their ability to bake large quantities of food in a single load. Each roll‐in rack can accommodate up to 15 full‐size sheet pans of product at a time. While their use is predominantly for production baking, rack ovens are also used for rethermalizing
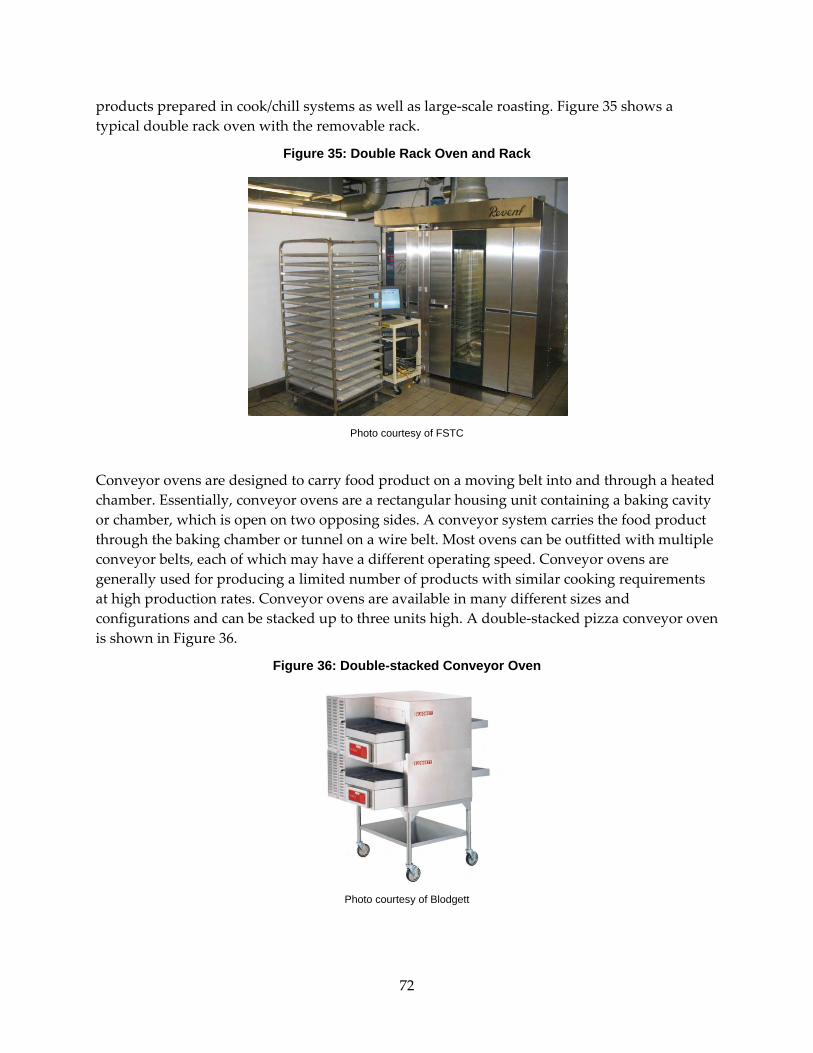
72
products prepared in cook/chill systems as well as large‐scale roasting. Figure 35 shows a typical double rack oven with the removable rack.
Figure 35: Double Rack Oven and Rack
Photo courtesy of FSTC
Conveyor ovens are designed to carry food product on a moving belt into and through a heated chamber. Essentially, conveyor ovens are a rectangular housing unit containing a baking cavity or chamber, which is open on two opposing sides. A conveyor system carries the food product through the baking chamber or tunnel on a wire belt. Most ovens can be outfitted with multiple conveyor belts, each of which may have a different operating speed. Conveyor ovens are generally used for producing a limited number of products with similar cooking requirements at high production rates. Conveyor ovens are available in many different sizes and configurations and can be stacked up to three units high. A double‐stacked pizza conveyor oven is shown in Figure 36.
Figure 36: Double-stacked Conveyor Oven
Photo courtesy of Blodgett
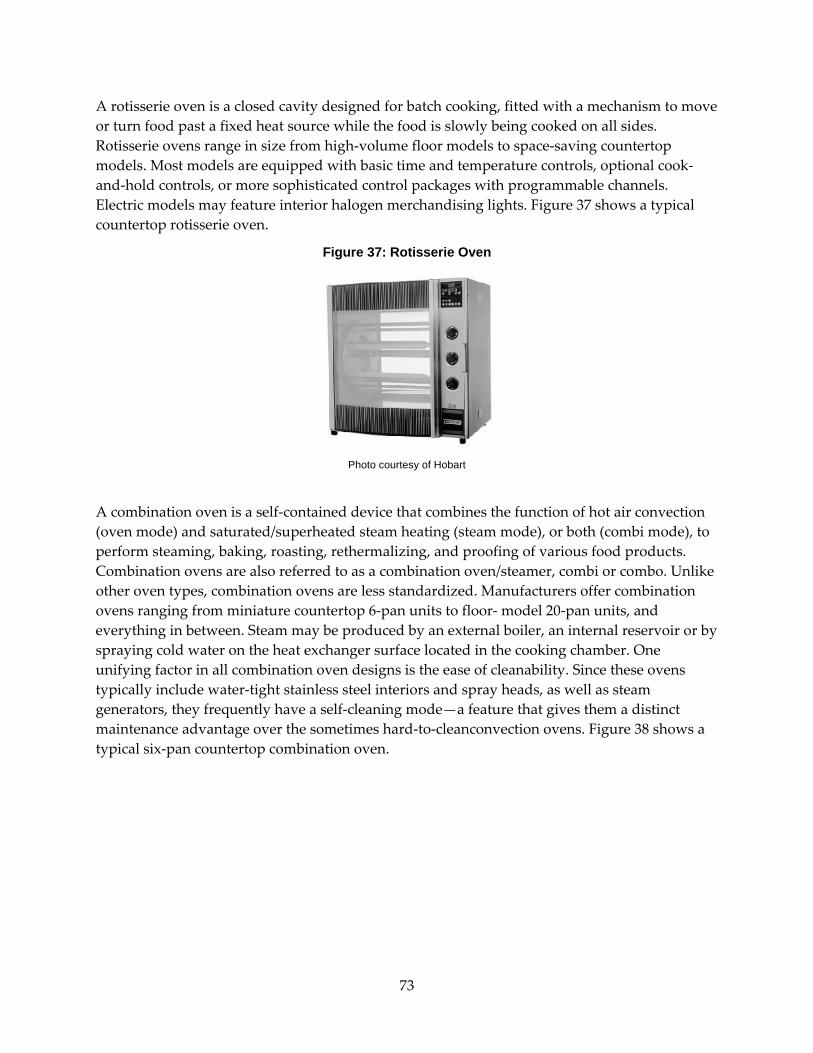
73
A rotisserie oven is a closed cavity designed for batch cooking, fitted with a mechanism to move or turn food past a fixed heat source while the food is slowly being cooked on all sides. Rotisserie ovens range in size from high‐volume floor models to space‐saving countertop models. Most models are equipped with basic time and temperature controls, optional cook‐and‐hold controls, or more sophisticated control packages with programmable channels. Electric models may feature interior halogen merchandising lights. Figure 37 shows a typical countertop rotisserie oven.
Figure 37: Rotisserie Oven
Photo courtesy of Hobart
A combination oven is a self‐contained device that combines the function of hot air convection (oven mode) and saturated/superheated steam heating (steam mode), or both (combi mode), to perform steaming, baking, roasting, rethermalizing, and proofing of various food products. Combination ovens are also referred to as a combination oven/steamer, combi or combo. Unlike other oven types, combination ovens are less standardized. Manufacturers offer combination ovens ranging from miniature countertop 6‐pan units to floor‐ model 20‐pan units, and everything in between. Steam may be produced by an external boiler, an internal reservoir or by spraying cold water on the heat exchanger surface located in the cooking chamber. One unifying factor in all combination oven designs is the ease of cleanability. Since these ovens typically include water‐tight stainless steel interiors and spray heads, as well as steam generators, they frequently have a self‐cleaning mode—a feature that gives them a distinct maintenance advantage over the sometimes hard‐to‐cleanconvection ovens. Figure 38 shows a typical six‐pan countertop combination oven.

74
Figure 38: Combination Oven
Photo courtesy of Rational
A cook‐and‐hold oven is designed specifically for low‐temperature cooking, and then automatically holding the cooked product at a specified temperature. The primary use of the cook‐and‐hold is to roast and hold large cuts of meats (roasts) in order to help retain product juiciness as well as tenderness. The basic frame, housing and interior components are similar to those in a convection oven, but with a reduced energy input rate. Figure 39 shows a typical cook‐and‐hold oven.
Figure 39: Cook-and-Hold Oven
Photo courtesy of Alto Shaam
Because of the variety of potential installations, oven manufacturers strive to be space conscious and flexible in their designs. The most common types of gas commercial ovens include standard or conventional ovens, convection ovens, combination ovens, conveyor (pizza) ovens, and rotisseries. Additionally, cook & hold ovens, deck ovens and roll‐in rack ovens are available in gas. The distribution of the various oven types across commercial and institutional foodservices are depicted in the Figure 40 and Figure 41, respectively.

75
Figure 40: Distribution of Ovens in Commercial Facilities
Figure 41: Distribution of Ovens in Institutional Facilities
5.3.6 Pasta Cookers Pasta cookers resemble a deep fat fryer but are filled with water instead of oil. Manufacturers have added features, such as: a water connection for ease of filling and maintaining the water levels in the vat, a top drain to skim off starch foam that may build up during cooking and are frequently accompanied by a cold water rinse tank to stop the pasta from overcooking. Pasta cookers can employ many of the same control systems as the more advanced fryers, including
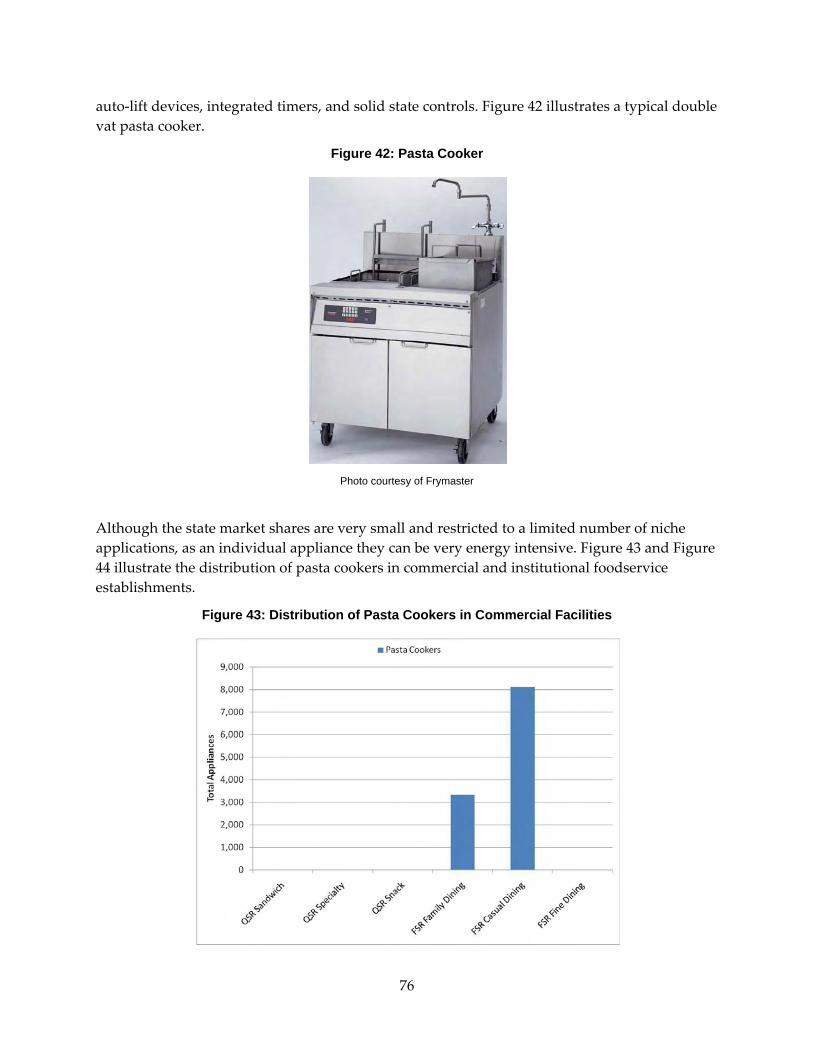
76
auto‐lift devices, integrated timers, and solid state controls. Figure 42 illustrates a typical double vat pasta cooker.
Figure 42: Pasta Cooker
Photo courtesy of Frymaster
Although the state market shares are very small and restricted to a limited number of niche applications, as an individual appliance they can be very energy intensive. Figure 43 and Figure 44 illustrate the distribution of pasta cookers in commercial and institutional foodservice establishments.
Figure 43: Distribution of Pasta Cookers in Commercial Facilities

77
Figure 44: Distribution of Pasta Cookers in Institutional Facilities
5.3.7 Ranges The commercial range top is one of the most versatile and widely used pieces of commercial cooking equipment. Ranges are available in a variety of configurations, including open top (discrete burner), hot top (solid metal top covering the heat source), fry top (griddle top) or grill top (broiler top). A single range can have any combination of the above top options and can be incorporated into a base that includes an undercounter refrigerator/freezer base, cabinet base, shelf base, or oven base. Typically, a range‐top configuration consists of six open gas burners with a standard oven incorporated underneath (see Figure 45).
Figure 45: Six-Burner Range Top with Range Oven
Photo courtesy of Imperial

78
Though the commercial range top is similar to the residential stove, the major difference is durability; a foodservice range must withstand constant use and abuse while preparing tens or hundreds of meals a day.
Gas ranges are often divided into three categories depending on their intended use: heavy‐duty or hotel ranges, medium duty or restaurant ranges, and specialty ranges such as stockpot, taco ranges or Chinese wok ranges. Heavy‐duty ranges are built for continuous use in high‐volume operations such as large restaurants, hospitals, and schools, and have more mass and typically include high‐input burners (>30,000 Btu/h per burner). Restaurant ranges are more suited to a smaller operation, such as a lunch counter or smaller restaurant. These medium‐duty ranges are not as well suited for heavy use or abuse, and often have lower‐ input burners (<24,000 per burner).
Specialty ranges are built to perform a single function, as the name implies. Stockpot ranges consist of one or two oversized high‐input (>45,000 Btu/h) open burners on a short stand with a very heavy‐duty cast iron grate. The high input rate and low‐rise design have been optimized for large (>16‐inch diameter), heavy stockpots. Due to their specialized design, stock pot ranges are not used for general‐purpose cooking. Figure 46 shows an example of a stock pot range.
Figure 46: Stock Pot Range
Photo courtesy of Imperial
Chinese wok ranges are designed for wok cooking. A gas valve at knee‐level allows the chef to adjust the heat while using both hands to cook. Energy input rates range from 50,000 Btu/h to as high as 160,000 Btu/h or more, depending on the type of burner. The purpose of the high input rates is to facilitate the short term, high temperature cooking process used in the preparation of Asian menu items. Traditional wok ranges designs feature perforated water lines to flush water across the range top to keep it from warping due to the high heat from the burners. A built‐in trough at the back of the range top allows drainage for the water. An example of a Chinese Wok is presented in Figure 47. Gas is almost universal as the primary fuel source for commercial ranges. The distribution of the various range types throughout commercial and institutional foodservices are shown in the Figure 48 and Figure 49.
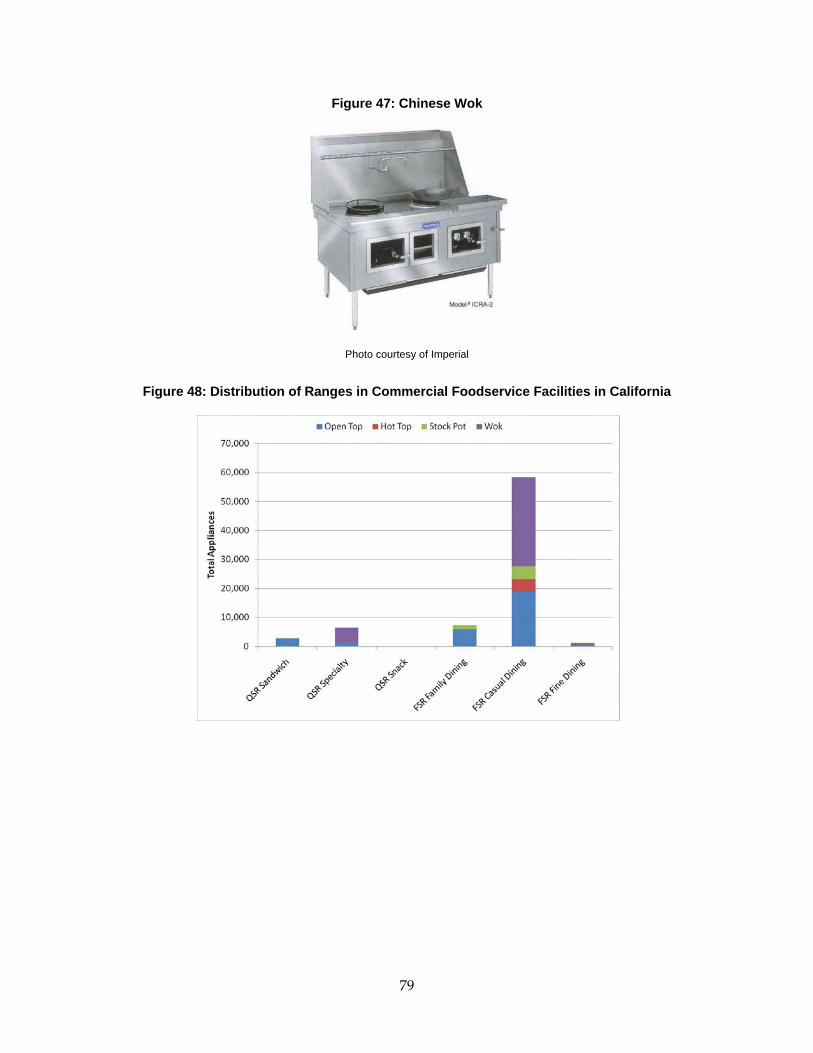
79
Figure 47: Chinese Wok
Photo courtesy of Imperial
Figure 48: Distribution of Ranges in Commercial Foodservice Facilities in California
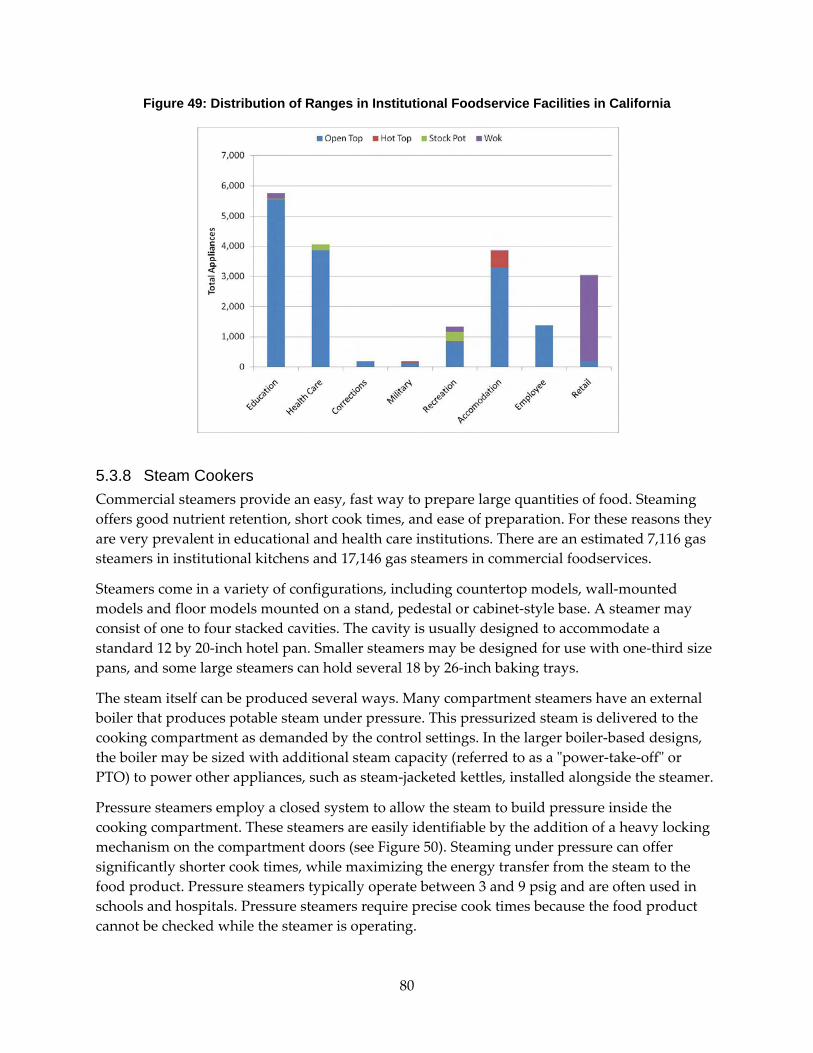
80
Figure 49: Distribution of Ranges in Institutional Foodservice Facilities in California
5.3.8 Steam Cookers Commercial steamers provide an easy, fast way to prepare large quantities of food. Steaming offers good nutrient retention, short cook times, and ease of preparation. For these reasons they are very prevalent in educational and health care institutions. There are an estimated 7,116 gas steamers in institutional kitchens and 17,146 gas steamers in commercial foodservices.
Steamers come in a variety of configurations, including countertop models, wall‐mounted models and floor models mounted on a stand, pedestal or cabinet‐style base. A steamer may consist of one to four stacked cavities. The cavity is usually designed to accommodate a standard 12 by 20‐inch hotel pan. Smaller steamers may be designed for use with one‐third size pans, and some large steamers can hold several 18 by 26‐inch baking trays.
The steam itself can be produced several ways. Many compartment steamers have an external boiler that produces potable steam under pressure. This pressurized steam is delivered to the cooking compartment as demanded by the control settings. In the larger boiler‐based designs, the boiler may be sized with additional steam capacity (referred to as a ʺpower‐take‐offʺ or PTO) to power other appliances, such as steam‐jacketed kettles, installed alongside the steamer.
Pressure steamers employ a closed system to allow the steam to build pressure inside the cooking compartment. These steamers are easily identifiable by the addition of a heavy locking mechanism on the compartment doors (see Figure 50). Steaming under pressure can offer significantly shorter cook times, while maximizing the energy transfer from the steam to the food product. Pressure steamers typically operate between 3 and 9 psig and are often used in schools and hospitals. Pressure steamers require precise cook times because the food product cannot be checked while the steamer is operating.
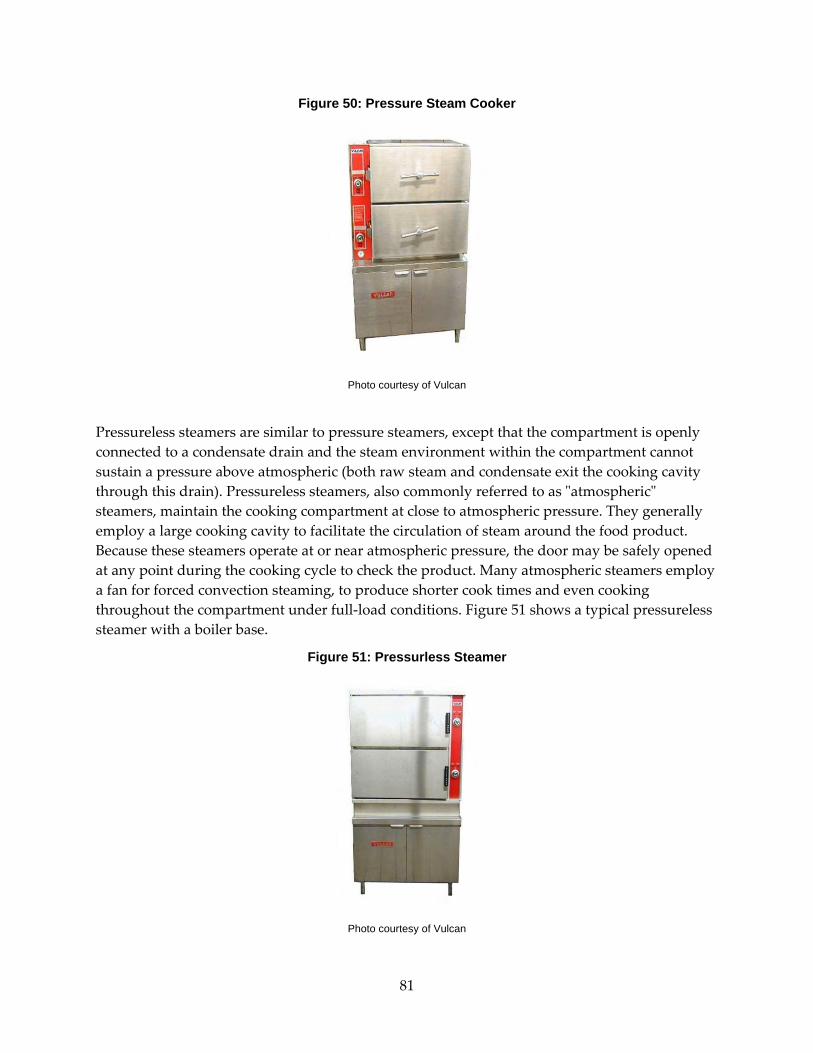
81
Figure 50: Pressure Steam Cooker
Photo courtesy of Vulcan
Pressureless steamers are similar to pressure steamers, except that the compartment is openly connected to a condensate drain and the steam environment within the compartment cannot sustain a pressure above atmospheric (both raw steam and condensate exit the cooking cavity through this drain). Pressureless steamers, also commonly referred to as ʺatmosphericʺ steamers, maintain the cooking compartment at close to atmospheric pressure. They generally employ a large cooking cavity to facilitate the circulation of steam around the food product. Because these steamers operate at or near atmospheric pressure, the door may be safely opened at any point during the cooking cycle to check the product. Many atmospheric steamers employ a fan for forced convection steaming, to produce shorter cook times and even cooking throughout the compartment under full‐load conditions. Figure 51 shows a typical pressureless steamer with a boiler base.
Figure 51: Pressurless Steamer
Photo courtesy of Vulcan
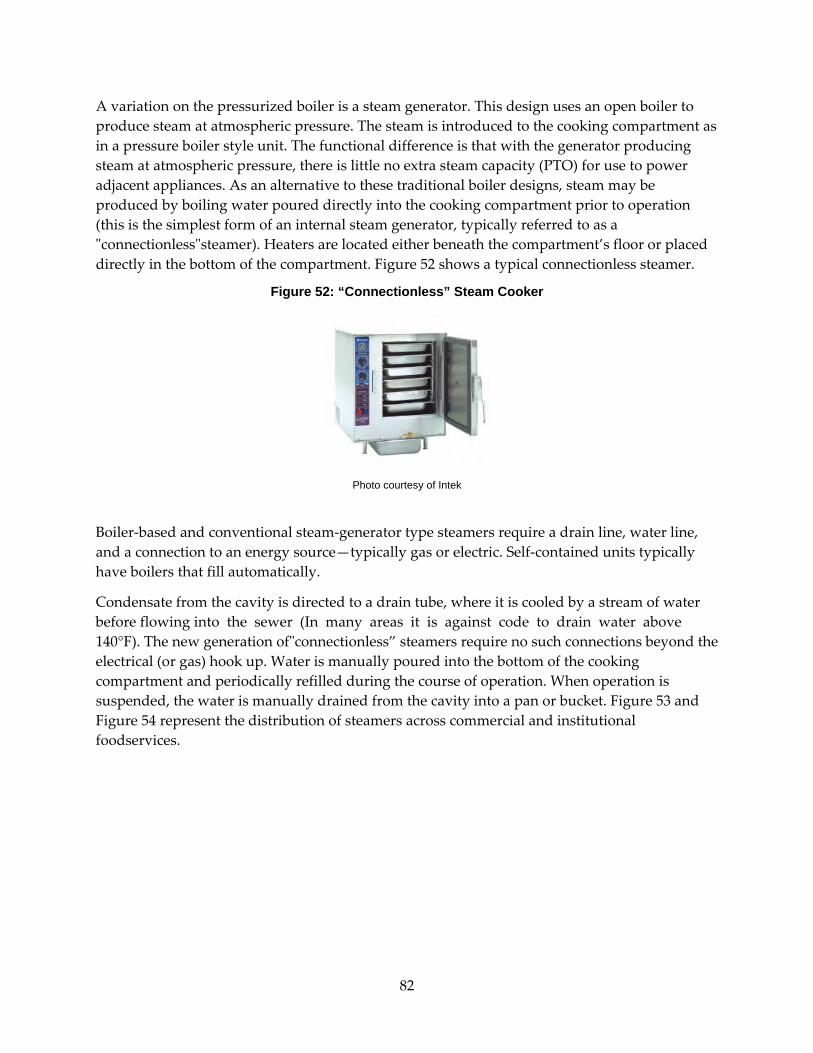
82
A variation on the pressurized boiler is a steam generator. This design uses an open boiler to produce steam at atmospheric pressure. The steam is introduced to the cooking compartment as in a pressure boiler style unit. The functional difference is that with the generator producing steam at atmospheric pressure, there is little no extra steam capacity (PTO) for use to power adjacent appliances. As an alternative to these traditional boiler designs, steam may be produced by boiling water poured directly into the cooking compartment prior to operation (this is the simplest form of an internal steam generator, typically referred to as a ʺconnectionlessʺsteamer). Heaters are located either beneath the compartment’s floor or placed directly in the bottom of the compartment. Figure 52 shows a typical connectionless steamer.
Figure 52: “Connectionless” Steam Cooker
Photo courtesy of Intek
Boiler‐based and conventional steam‐generator type steamers require a drain line, water line, and a connection to an energy source—typically gas or electric. Self‐contained units typically have boilers that fill automatically.
Condensate from the cavity is directed to a drain tube, where it is cooled by a stream of water before flowing into the sewer (In many areas it is against code to drain water above 140°F). The new generation ofʺconnectionless” steamers require no such connections beyond the electrical (or gas) hook up. Water is manually poured into the bottom of the cooking compartment and periodically refilled during the course of operation. When operation is suspended, the water is manually drained from the cavity into a pan or bucket. Figure 53 and Figure 54 represent the distribution of steamers across commercial and institutional foodservices.
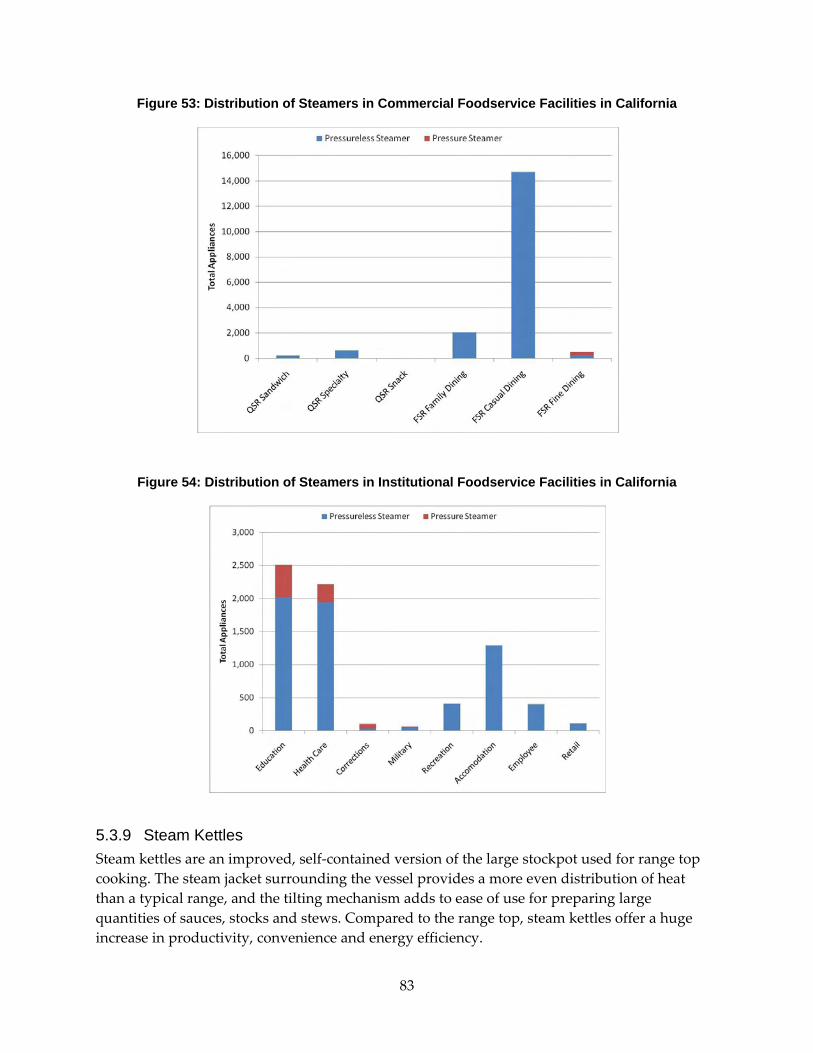
83
Figure 53: Distribution of Steamers in Commercial Foodservice Facilities in California
Figure 54: Distribution of Steamers in Institutional Foodservice Facilities in California
5.3.9 Steam Kettles Steam kettles are an improved, self‐contained version of the large stockpot used for range top cooking. The steam jacket surrounding the vessel provides a more even distribution of heat than a typical range, and the tilting mechanism adds to ease of use for preparing large quantities of sauces, stocks and stews. Compared to the range top, steam kettles offer a huge increase in productivity, convenience and energy efficiency.
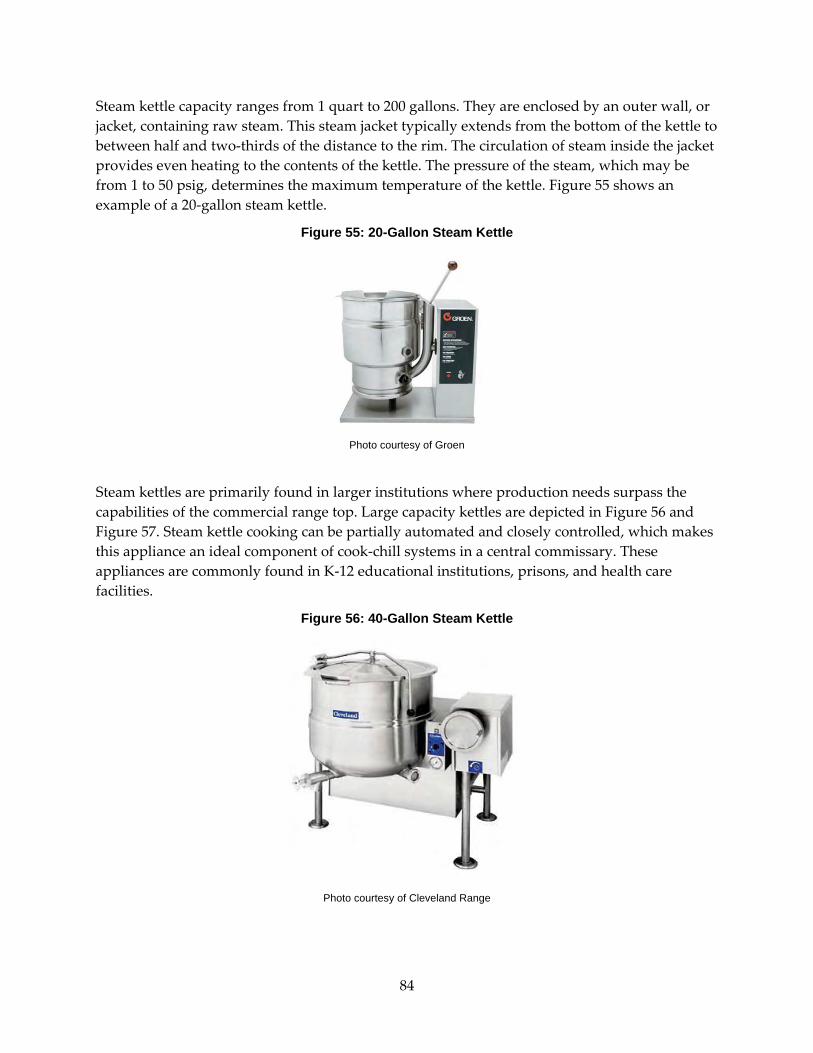
84
Steam kettle capacity ranges from 1 quart to 200 gallons. They are enclosed by an outer wall, or jacket, containing raw steam. This steam jacket typically extends from the bottom of the kettle to between half and two‐thirds of the distance to the rim. The circulation of steam inside the jacket provides even heating to the contents of the kettle. The pressure of the steam, which may be from 1 to 50 psig, determines the maximum temperature of the kettle. Figure 55 shows an example of a 20‐gallon steam kettle.
Figure 55: 20-Gallon Steam Kettle
Photo courtesy of Groen
Steam kettles are primarily found in larger institutions where production needs surpass the capabilities of the commercial range top. Large capacity kettles are depicted in Figure 56 and Figure 57. Steam kettle cooking can be partially automated and closely controlled, which makes this appliance an ideal component of cook‐chill systems in a central commissary. These appliances are commonly found in K‐12 educational institutions, prisons, and health care facilities.
Figure 56: 40-Gallon Steam Kettle
Photo courtesy of Cleveland Range

85
Figure 57: 60-Gallon Steam Kettle
Photo courtesy of Vulcan
Reliance on steam kettles in institutional operations, such as hotels and university kitchens, is diminishing asmenu preparation changes from batch cooking to accommodate the ʺfreshʺ concept so popular in today’s market. Many are moving towards cooking food items in other pieces of equipment such as combis and steamers, as batch cooking smaller quantities defines production. Figure 58 and Figure 59 depict the distribution of steam kettles across commercial and institutional foodservices.
Figure 58: Distribution of Steam Kettles in Commercial Foodservice Facilities in California

86
Figure 59: Distribution of Steam Kettles in Institutional Foodservice Facilities in California

87
CHAPTER 6: Commercial Gas Cooking Appliance Energy Load Foodservice facilities are the most intensive energy users in the commercial building sector and the FSTC estimates that, as of 2009, nationwide foodservice facility energy costs exceed $25 billion a year. Typical annual energy consumption for restaurant operation on a per‐square‐foot basis, shows that foodservice establishments use twice as much energy as hospitals and five times as much energy (550 kBtu/ft²) as schools, ware‐houses, offices and retail establishments.3 Recent findings from the California Energy Commission indicate that the total gas load of foodservice establishments approaches 40% of the overall commercial gas consumption in the state.
According to the Bureau of Labor Statistics, energy costs for commercial businesses have risen by more than 10% over the last two years alone. At a building level, research shows utility costs represent 3‐4% of sales to the average restaurant operator. While this does not seem to be significant when compared with operating costs, it is nonetheless a large ticket item that directly affects the operators bottom‐line. The FSTC estimates that a typical full‐service restaurant may pay $40,000‐$100,000 annually in energy costs.22
Figure 60 represents the distribution of energy consumption by end‐use group in a typical full‐service restaurant.
Figure 60: Typical Energy Breakdown (Btu) By End-Use in a Full-Service Restaurant
22 Figure is taken from the FSTC site survey program and is the result of analyzing the annual billing data of commercial foodservice establishments in the PG&E service territory.

88
Food preparation equipment accounts for about 35% of the total energy used in a foodservice facility. This is divided between the primary cooking appliances (fryers, ranges, ovens, steaming equipment, broilers and griddles) which make up 22% and the rest of the food preparation and holding (slicers, mixers, blenders and proofers) equipment making up 13%. Due to the fact electric cooking appliance options are limited, and gas is the preferred fuel source by operators (due primarily to lower comparative utility costs), primary cooking appliances account for a much larger portion of the natural gas load of a foodservice facility.
The Food Service Technology Center finds that natural gas consumption in commercial kitchens is dominated almost equally by hot water heating and cooking appliances. The Food Service Technology Center estimates that greater than 85% of total hot water heating energy in commercial foodservices, or an annual 340 million therms, is attributed to natural gas heating systems. In full service and institutional kitchens, the hot water heating load can represent up to 20% of the total energy consumption and up to 50% of the total gas consumption for the facility. Besides water heating, a very small percentage of the gas consumption is driven by space heating.
The remainder of the total gas consumption for the facility is attributed to the primary cooking appliances. Natural gas is the preferred cooking, fuel choice for North American foodservice operators due to comparatively low utility costs and perceived advantages in durability, usability and convenience. For these reasons electric cooking appliance options are somewhat limited.
6.1 Appliance Standard Test Methods In the past, with little data on actual appliance performance, perspective buyers have had to rely on manufacturer claims and sales brochures. If the buyer is not exposed to accurate efficiency and performance data, there is less incentive on the part of the manufacturers to improve equipment performance. If the buyer does not realize that the most energy‐efficient appliance option may also be the best performer, the hurdle is even more difficult to knock down.
In response to this situation and to requests from end‐users such as McDonaldʹs Corporation, Marriott Corporation, and the NRA, Pacific Gas and Electric Company (PG&E) initiated efforts to develop American Society for Testing and Materials (ASTM) Standard Test Methods (STMs) for commercial foodservice equipment at its Food Service Technology Center (FSTC) in San Ramon, California. These standards allow benchmarking of equipment such that users can make meaningful comparisons among available equipment choices. By collaborating with the Electric Power Research Institute (EPRI) and the Gas Technology Institute (GTI) through matching funding agreements, the test methods have remained unbiased to fuel choice. End‐use customers and commercial appliance manufacturers consider PG&E to be the national leader in commercial foodservice equipment testing and standards, sparking alliances with several major chain customers to date.
The FSTC is operated by an outside consulting firm, Fisher‐Nickel, Inc. for PG&E. Under Fisher‐Nickel’s guidance, the FSTC has developed 37 standard test methods for commercial food

89
service equipment performance. The application of an ASTM Standard Test Method (STM) to cooking equipment provides end‐ users with performance parameters that can be used to compare the energy efficiency, production capacity, cooking surface/cavity uniformity, etc. of one piece of equipment with another. Rigorous laboratory testing (in addition to field monitoring) has been performed on a variety of appliances from each of the above stated categories. Appliance testing allows the current commercial cooking appliance market to be benchmarked in terms of energy efficiency. The FSTC has tested enough different models to create a sufficient database for energy comparison and recommendation for the largest appliance categories.
6.2 Appliance Energy Efficiency Appliance cooking‐energy efficiency is a measure of how much of the energy that an appliance consumes is actually delivered to the food product during the cooking process. The ASTM test methods for measuring cooking appliance energy efficiency have been based on this fundamental definition and equations:
Cooking‐energy efficiency quantity of energy imparted to the specified food product, expressed as a percentage of energy consumed by the appliance during the cooking event:
where: ηcook = cooking‐energy efficiency
Eappliance = energy into the appliance Efood = energy to food
= Esens + Ethaw + Eevap.
where: Esens = quantity of heat added to food product, which causes its temperature to increase from the
starting temperature to the average bulk temperature of a ʺdoneʺ food product
Wi x Cp x (Tf ‐ Ti )
where: Wi = initial weight of food product, lb
Cp = specific heat of food product, Btu/lb, °F
Tf = final cooked temperature of food product, °F
Ti = initial internal temperature of food product, °F
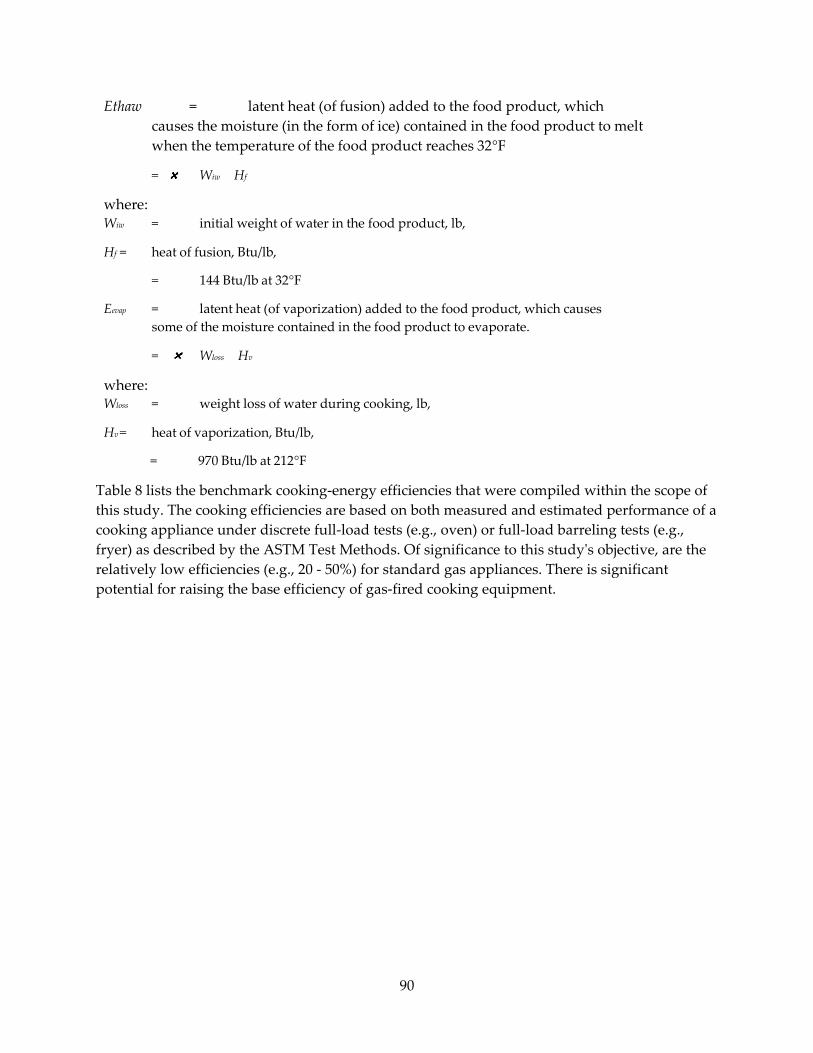
90
Ethaw = latent heat (of fusion) added to the food product, which causes the moisture (in the form of ice) contained in the food product to melt when the temperature of the food product reaches 32°F
= Wiw Hf
where: Wiw = initial weight of water in the food product, lb,
Hf = heat of fusion, Btu/lb,
= 144 Btu/lb at 32°F
Eevap = latent heat (of vaporization) added to the food product, which causes some of the moisture contained in the food product to evaporate.
= Wloss Hv
where: Wloss = weight loss of water during cooking, lb,
Hv = heat of vaporization, Btu/lb,
= 970 Btu/lb at 212°F
Table 8 lists the benchmark cooking‐energy efficiencies that were compiled within the scope of this study. The cooking efficiencies are based on both measured and estimated performance of a cooking appliance under discrete full‐load tests (e.g., oven) or full‐load barreling tests (e.g., fryer) as described by the ASTM Test Methods. Of significance to this studyʹs objective, are the relatively low efficiencies (e.g., 20 ‐ 50%) for standard gas appliances. There is significant potential for raising the base efficiency of gas‐fired cooking equipment.
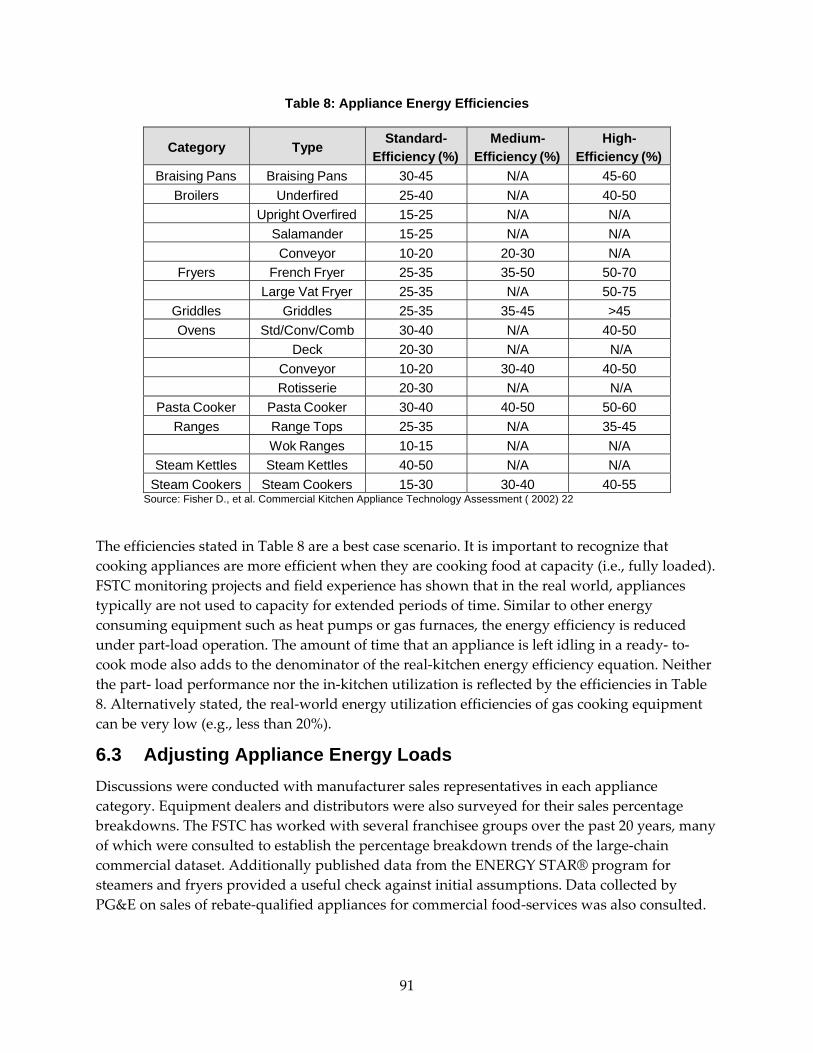
91
Table 8: Appliance Energy Efficiencies
Category
Type Standard-
Efficiency (%)Medium-
Efficiency (%)High-
Efficiency (%)Braising Pans Braising Pans 30-45 N/A 45-60
Broilers Underfired 25-40 N/A 40-50 Upright Overfired 15-25 N/A N/A Salamander 15-25 N/A N/A Conveyor 10-20 20-30 N/A
Fryers French Fryer 25-35 35-50 50-70 Large Vat Fryer 25-35 N/A 50-75
Griddles Griddles 25-35 35-45 >45 Ovens Std/Conv/Comb 30-40 N/A 40-50
Deck 20-30 N/A N/A Conveyor 10-20 30-40 40-50 Rotisserie 20-30 N/A N/A
Pasta Cooker Pasta Cooker 30-40 40-50 50-60 Ranges Range Tops 25-35 N/A 35-45
Wok Ranges 10-15 N/A N/A Steam Kettles Steam Kettles 40-50 N/A N/A
Steam Cookers Steam Cookers 15-30 30-40 40-55 Source: Fisher D., et al. Commercial Kitchen Appliance Technology Assessment ( 2002) 22
The efficiencies stated in Table 8 are a best case scenario. It is important to recognize that cooking appliances are more efficient when they are cooking food at capacity (i.e., fully loaded). FSTC monitoring projects and field experience has shown that in the real world, appliances typically are not used to capacity for extended periods of time. Similar to other energy consuming equipment such as heat pumps or gas furnaces, the energy efficiency is reduced under part‐load operation. The amount of time that an appliance is left idling in a ready‐ to‐cook mode also adds to the denominator of the real‐kitchen energy efficiency equation. Neither the part‐ load performance nor the in‐kitchen utilization is reflected by the efficiencies in Table 8. Alternatively stated, the real‐world energy utilization efficiencies of gas cooking equipment can be very low (e.g., less than 20%).
6.3 Adjusting Appliance Energy Loads Discussions were conducted with manufacturer sales representatives in each appliance category. Equipment dealers and distributors were also surveyed for their sales percentage breakdowns. The FSTC has worked with several franchisee groups over the past 20 years, many of which were consulted to establish the percentage breakdown trends of the large‐chain commercial dataset. Additionally published data from the ENERGY STAR® program for steamers and fryers provided a useful check against initial assumptions. Data collected by PG&E on sales of rebate‐qualified appliances for commercial food‐services was also consulted.

92
For each facility sector, assumptions were made about the number of primary appliances vs. those that are used less frequently as back‐up during uncharacteristically high volume production. These assumptions are based almost entirely on discussions/surveys with end‐users and operators from various representative segments of the market and site survey field experience. Greater disparity in the percent of primary vs. back‐ up appliances was identified between commercial and institutional foodservices and between Full Service Restaurant and Quick Service Restaurant segments. There are a variety of reasons for this distinction.
Square footage of the kitchen is generally much more limited in commercial foodservices. This is less true of institutional foodservices, where total kitchen floor space may be anywhere from 1,500 ft² for a corporate cafeteria, to up to 10,000 ft² for the main cafeteria kitchen of a state prison. This variability in space can serve as a good indicator of the percent breakdown of primary appliances in an establishment. In the example of the Wok, the appliance is assumed to be used with greater frequency in menu‐driven, specifically Asian, quick‐ service restaurants than in other segments, such as cafeteria‐style establishments found in educational services and health services. For this reason the percentage primary of Woks for Quick Service Restaurants is estimated to be 50% whereas in all other segments only 30% of Woks are assumed to be primary appliances.
Equipment schedules were developed for each facility type and expressed as hours of use per day and operating days per year. Weighted annual hours were developed using these two variables. Assumptions of facility operating hours can be found in Appendix E. The data used to inform these assumptions came from a variety of sources: independent facility operator surveying, field monitoring projects, field experience (site surveys) and business information listed on official websites. Calculations were performed on appliances individually in each segment due to assumptions made on the variations in the appliance operating schedules and the distribution of standard vs. medium and high efficiency appliance breakdowns. The total cooking appliance gas load is the sum of all individual appliance loads from each respective foodservice segment.
Table 9 contains the assumptions used for the distribution of high, medium, and low (standard) efficiency appliances. It can be noted that some appliances were assumed to have different primary appliance factors depending on the segment.

93
Table 9: Distribution of Appliance Efficiencies and Primary Appliances in Commercial and Institutional Foodservice
Group
Category Standard Efficiency
Medium Efficiency
High Efficiency
Primary Appliances
Braising Pans Skillets/Braising Pans 70% 0% 30% 50% a
Broiler Conveyor Broiler 80% 0% 20% 80% Overfired 100% 0% 0% 50% Salamander 100% 0% 0% 30% b
Underfired 95% 0% 5% 40%Fryers Donut 100% 0% 0% 80% c
French Fryer 75% 15% 10% 50% d
Large Vat 75% 15% 10% 60% Pressure 80% 20% 0% 50%
Griddles Double-Sided 60% 0% 40% 80% Standard 90% 0% 10% 90%
Ovens Combination 85% 0% 15% 80% Convection 85% 0% 15% 50% e
Conveyor 95% 0% 5% 50% f
Cook & Hold 100% 0% 0% 50% Deck 100% 0% 0% 30% Range Oven 100% 0% 0% 30% Roll-in Rack-Double 75% 0% 25% 50% g
Roll-in Rack-Single 75% 0% 25% 50% g
Rotisserie 100% 0% 0% 50%Pasta Cookers Pasta Cooker 90% 0% 10% 50%
Ranges Hot Top 100% 0% 0% 50% Open Top 100% 0% 0% 30% Stock Pot 100% 0% 0% 25% Wok 100% 0% 0% 30% d
SteamCookers Pressure Steamer 80% 0% 20% 80% Pressureless Steamer 95% 0% 5% 50%
Steam Kettles Steam Kettle (< 10 gal) 100% 0% 0% 40% Steam Kettle (10 gal-40 gal) 100% 0% 0% 60% Steam Kettle (40 gal-80 gal) 100% 0% 0% 50% Steam Kettle (> 80 gal) 100% 0% 0% 50%
a 60% primary appliances in Correctional Services, Health Care Services, Military Services and Full Service Restaurants b 25% primary appliances in Full Service Restaurants and Quick Service Restaurants c 75% primary appliances in Full Service Restaurants and Quick Service Restaurants d 50% primary appliances in Quick Service Restaurants e 75% primary appliances in Accommodation Services and Military Services, 60% in Full Service Restaurants f 60% primary appliances in Quick Service Restaurants g 75% primary appliances in Supermarket and Warehouse Retail, Full Service Restaurants and Quick Service Restaurants
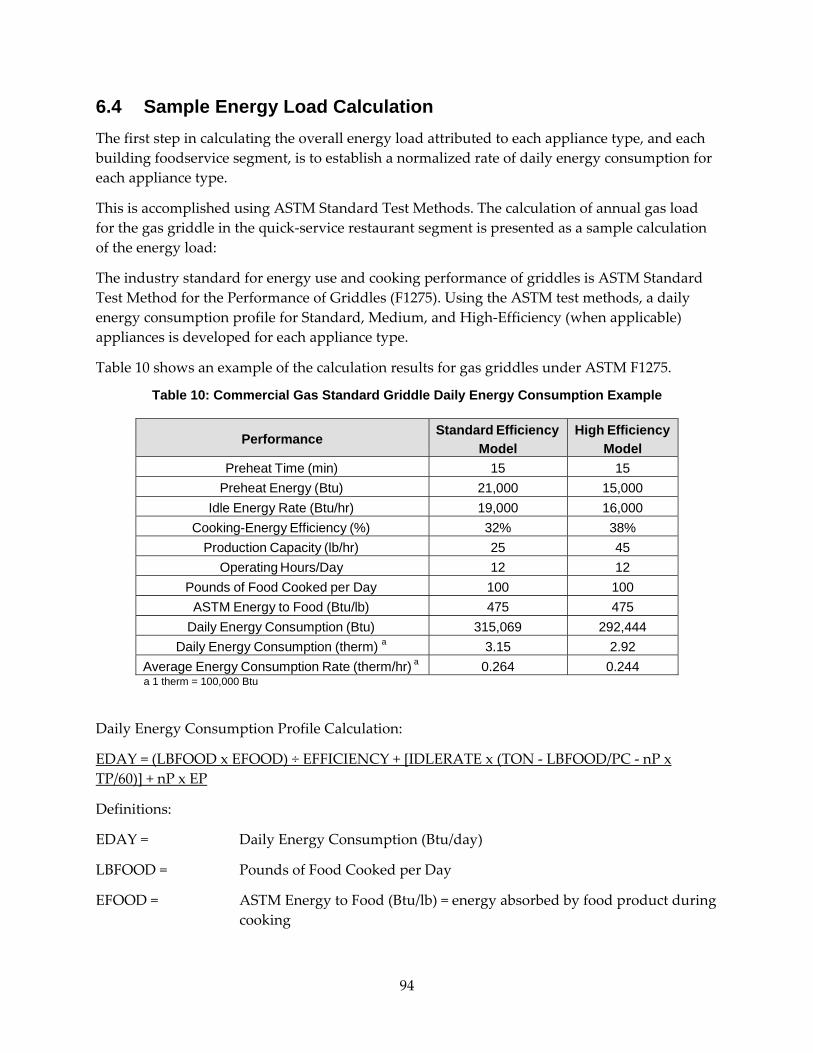
94
6.4 Sample Energy Load Calculation The first step in calculating the overall energy load attributed to each appliance type, and each building foodservice segment, is to establish a normalized rate of daily energy consumption for each appliance type.
This is accomplished using ASTM Standard Test Methods. The calculation of annual gas load for the gas griddle in the quick‐service restaurant segment is presented as a sample calculation of the energy load:
The industry standard for energy use and cooking performance of griddles is ASTM Standard Test Method for the Performance of Griddles (F1275). Using the ASTM test methods, a daily energy consumption profile for Standard, Medium, and High‐Efficiency (when applicable) appliances is developed for each appliance type.
Table 10 shows an example of the calculation results for gas griddles under ASTM F1275.
Table 10: Commercial Gas Standard Griddle Daily Energy Consumption Example
Performance Standard Efficiency
ModelHigh Efficiency
Model Preheat Time (min) 15 15
Preheat Energy (Btu) 21,000 15,000 Idle Energy Rate (Btu/hr) 19,000 16,000
Cooking-Energy Efficiency (%) 32% 38% Production Capacity (lb/hr) 25 45
Operating Hours/Day 12 12 Pounds of Food Cooked per Day 100 100
ASTM Energy to Food (Btu/lb) 475 475 Daily Energy Consumption (Btu) 315,069 292,444
Daily Energy Consumption (therm) a 3.15 2.92 Average Energy Consumption Rate (therm/hr) a 0.264 0.244 a 1 therm = 100,000 Btu
Daily Energy Consumption Profile Calculation:
EDAY = (LBFOOD x EFOOD) ÷ EFFICIENCY + [IDLERATE x (TON ‐ LBFOOD/PC ‐ nP x TP/60)] + nP x EP
Definitions:
EDAY = Daily Energy Consumption (Btu/day)
LBFOOD = Pounds of Food Cooked per Day
EFOOD = ASTM Energy to Food (Btu/lb) = energy absorbed by food product during cooking

95
EFFICIENCY = Heavy Load Cooking Energy Efficiency %
IDLE RATE = Idle Energy Rate (Btu/h)
TON = Operating Hours/Day
PC = Production Capacity (lbs/hr)
TP = Preheat Time (min)
nP = Number of preheats/Day
EP = Preheat Energy (kWh)
These calculations are based on a standard assumption of operating hours per day which is specific to each appliance and was developed using data acquired from FSTC monitoring projects. While applying these calculations results in a standardized daily energy use profile for each appliance type, in order to estimate what the appliances are consuming across establishments with extremely varied operating hours it was necessary to determine each appliance’s Average Energy Consumption Rate. The Average Energy
Consumption Rate is expressed in units of ʺtherms/hourʺ.
Average Energy Consumption Rate Calculation and Definitions:
EHOUR= EDAYtherm/TON
Definitions:
EHOUR = Average Energy Consumption Rate (therm/hour)
EDAYtherm = Daily Energy Consumption (therm/day)
TON = Operating Hours/Day
Once the Average Energy Consumption Rate for the standard griddle is established, the resulting consumption model can be applied to the known parameters of the quick‐service restaurant segment. An example of the assumed parameters of the quick‐service segment is presented below:
Quick‐Service Restaurants
2007 ReCount database
= 38,869 Facilities
65% of total Standard Griddles are gas = 7,548 gas griddles
Total number of weighted Annual Operating Hours = 5,162 hours/year
% Standard Efficiency at 90% of appliances = 6,793 gas griddles
% High Efficiency at 10% of appliances = 755 gas griddles
96
% Primary Appliances = 90% of appliances
Final calculations for determining the total categorical appliance end use energy load is shown below:
ETOT= PP x nGAS x EQHOURS x ((STDUSE x STDPER) + (MEDUSE x MEDPER) + (HIUSE x HIPRE))
Definitions:
ETOT = Total Category Energy Use
PP = Percent of Primary Appliances
nGAS = Total number of gas fired appliances
EQHOURS = Total number of weighted annual operating hours
STDUSE = Average Energy Consumption Rate (therm/hr) of standard efficiency appliance
STDPER = Percent of Standard Efficiency Appliances
MEDUSE= Average Energy Consumption Rate (therm/hr) of medium efficiency appliance
MEDPER = Percent of Medium Efficiency Appliances
HIUSE = Average Energy Consumption Rate (therm/hr) of high efficiency appliance
HIPER = Percent of high Efficiency Appliances
= 0.90 x 7,548 x 5,162 x ((0.263926940639269 x 0.90) + (0.243607305936073 x 0.10))
Total Category Energy Use = 9,183,155 therms
The above stated calculation is performed for every appliance type in every foodservice segment defined in the 2009 PIER study.
6.5 Appliance Inventory Energy Load Results This PIER study estimates that the estimated 562,000 gas‐fired cooking appliances account for an annual 475 million therms statewide. The results of this study indicate that (in order of magnitude) fryer, broiler, oven and range appliance categories are currently projected to consume the largest amounts of natural gas in the state of California. Figure 61 illustrates the estimated appliance energy loads between the institutional and commercial sector.

97
Figure 61: Estimated Gas Commercial Cooking Appliance Energy Load in California
When comparing the energy loads in Figure 61 with the appliance inventories represented in Figure 11, it can be noted that the results are not proportionately equivalent. This is primarily due to the nature of institutional foodservices, which have much fewer operating days and a shorter daily operating schedule when compared with commercial foodservices. Even though ovens are the most prevalent cooking appliance in commercial and institutional foodservices, fryers are responsible for the most energy consumption due to their general low efficiency rates, followed by broilers. Ovens consume the third most energy out of all the other commercial cooking appliances in the state. Table 11 breaks down the estimated gas energy load for the different categories of commercial gas cooking equipment in California.

98
Table 11: Estimated Gas Commercial Cooking Appliance Energy Load In California
Category Type Estimated Appliance Energy Load (Million therms)
BRAISING PANS Braising Pans/tilting Skillet 3.6 BROILERS Conveyor 6.4 Overfired 9.9 Salamander 11.7 Under fired (Charbroiler) 70.9 FRYERS Donut 2.6 French Fryer 118.8 Large Vat 13.1 Pressure 1.4 GRIDDLES Double Sided 2.0 Single Sided 37.1 OVENS Combination Oven/Steamer 1.8 Convection 28.9 Conveyor 21.5 Cook & Hold 0.9 Deck 9.2 Range Oven 9.2 Roll-in Rack Double 8.1 Roll-in Rack Single 2.7 Rotisserie 1.5 PASTA COOKERS Pasta Cooker 12.4 RANGES Hot Top 10.6 Open Top 16.6 Stock Pot 1.8 Wok 30.6 STEAM COOKERS Pressure Steamer 1.0 Pressureless Steamer 33.9 STEAM KETTLES Steam Kettle <10 gallons 0.3 Steam Kettle 10-40 gallons 5.7 Steam Kettle 40-80 gallons 0.7 Steam Kettle > 80 gallons 0.3
Within the commercial foodservice segment, the total gas cooking appliance inventory of the full‐service restaurant sector is estimated to consume as much as 273 million therms annually, while quick‐service appliances restaurants’ account for 112 million therms. The average annual gas cooking appliance energy load is 3,000 therms for quick‐service restaurants and 8,000 therms for full‐service restaurants.
Table 12 summarizes the gas cooking energy load by sector. While commercial foodservices account for an estimated 81% of the statewide gas cooking appliance load, institutional foodservices account for only 19%. However, unlike the commercial foodservice segment, gas
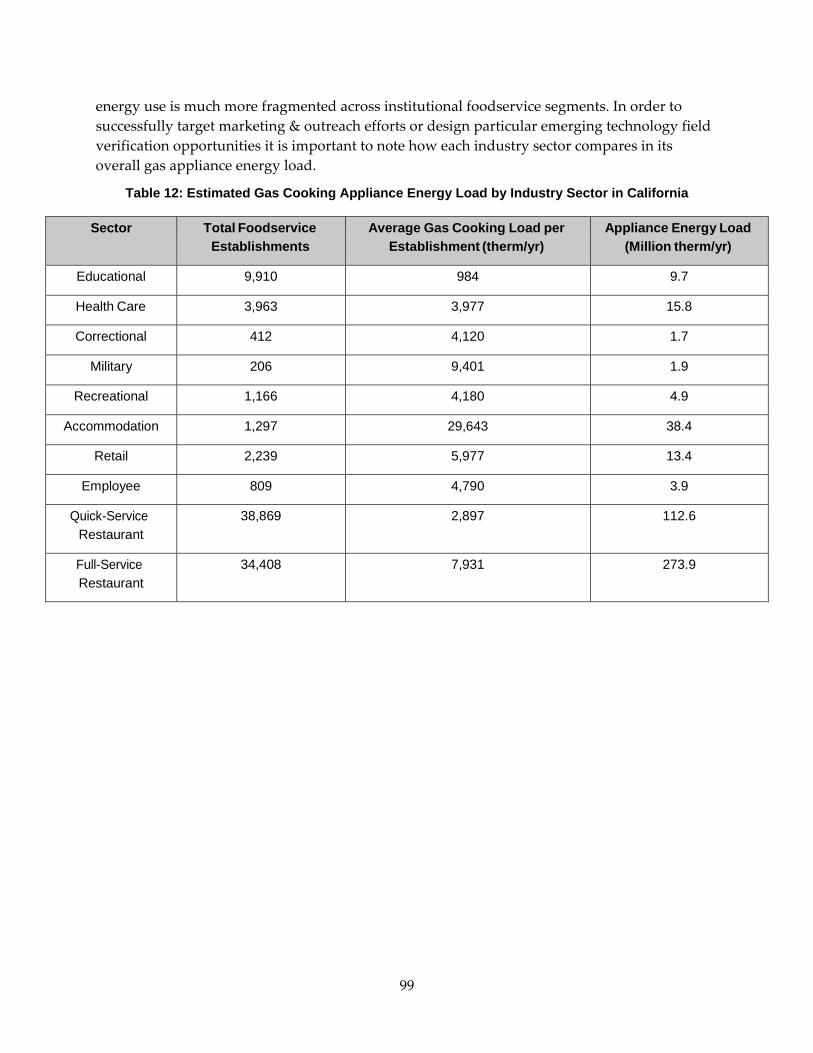
99
energy use is much more fragmented across institutional foodservice segments. In order to successfully target marketing & outreach efforts or design particular emerging technology field verification opportunities it is important to note how each industry sector compares in its overall gas appliance energy load.
Table 12: Estimated Gas Cooking Appliance Energy Load by Industry Sector in California
Sector Total Foodservice Establishments
Average Gas Cooking Load per Establishment (therm/yr)
Appliance Energy Load (Million therm/yr)
Educational 9,910 984 9.7
Health Care 3,963 3,977 15.8
Correctional 412 4,120 1.7
Military 206 9,401 1.9
Recreational 1,166 4,180 4.9
Accommodation 1,297 29,643 38.4
Retail 2,239 5,977 13.4
Employee 809 4,790 3.9
Quick-Service Restaurant
38,869 2,897 112.6
Full-Service Restaurant
34,408 7,931 273.9
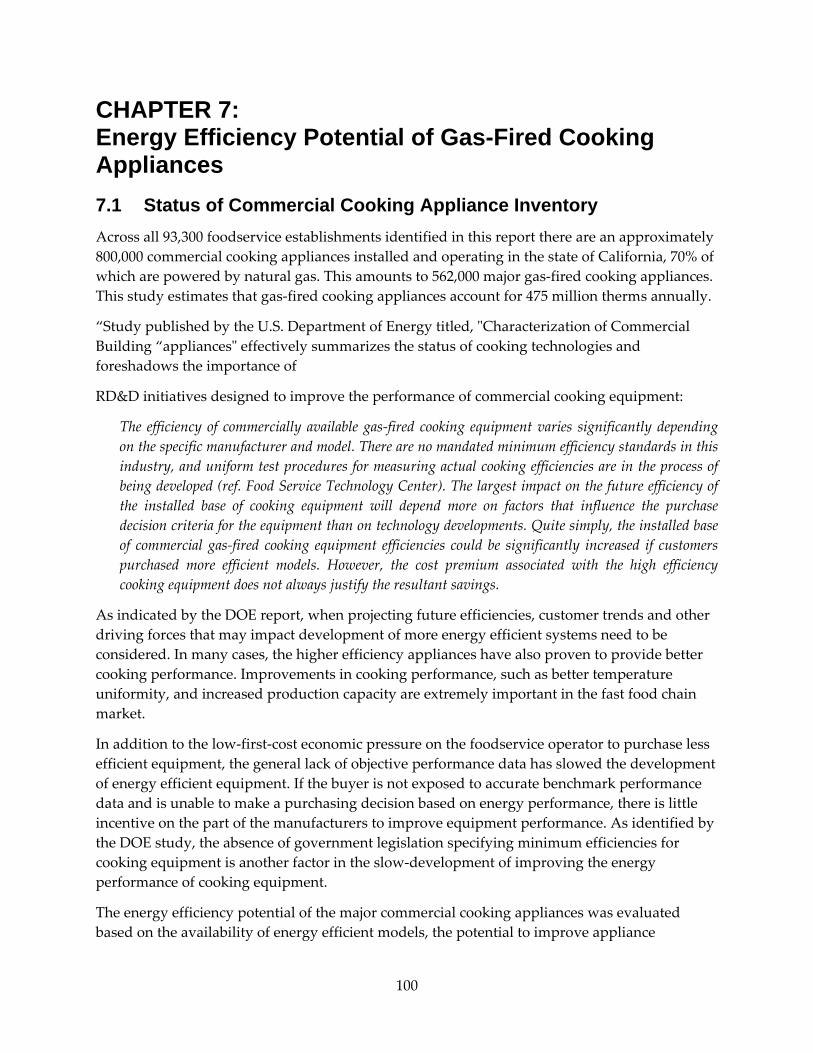
100
CHAPTER 7: Energy Efficiency Potential of Gas-Fired Cooking Appliances 7.1 Status of Commercial Cooking Appliance Inventory Across all 93,300 foodservice establishments identified in this report there are an approximately 800,000 commercial cooking appliances installed and operating in the state of California, 70% of which are powered by natural gas. This amounts to 562,000 major gas‐fired cooking appliances. This study estimates that gas‐fired cooking appliances account for 475 million therms annually.
“Study published by the U.S. Department of Energy titled, ʺCharacterization of Commercial Building “appliancesʺ effectively summarizes the status of cooking technologies and foreshadows the importance of
RD&D initiatives designed to improve the performance of commercial cooking equipment:
The efficiency of commercially available gas‐fired cooking equipment varies significantly depending on the specific manufacturer and model. There are no mandated minimum efficiency standards in this industry, and uniform test procedures for measuring actual cooking efficiencies are in the process of being developed (ref. Food Service Technology Center). The largest impact on the future efficiency of the installed base of cooking equipment will depend more on factors that influence the purchase decision criteria for the equipment than on technology developments. Quite simply, the installed base of commercial gas‐fired cooking equipment efficiencies could be significantly increased if customers purchased more efficient models. However, the cost premium associated with the high efficiency cooking equipment does not always justify the resultant savings.
As indicated by the DOE report, when projecting future efficiencies, customer trends and other driving forces that may impact development of more energy efficient systems need to be considered. In many cases, the higher efficiency appliances have also proven to provide better cooking performance. Improvements in cooking performance, such as better temperature uniformity, and increased production capacity are extremely important in the fast food chain market.
In addition to the low‐first‐cost economic pressure on the foodservice operator to purchase less efficient equipment, the general lack of objective performance data has slowed the development of energy efficient equipment. If the buyer is not exposed to accurate benchmark performance data and is unable to make a purchasing decision based on energy performance, there is little incentive on the part of the manufacturers to improve equipment performance. As identified by the DOE study, the absence of government legislation specifying minimum efficiencies for cooking equipment is another factor in the slow‐development of improving the energy performance of cooking equipment.
The energy efficiency potential of the major commercial cooking appliances was evaluated based on the availability of energy efficient models, the potential to improve appliance
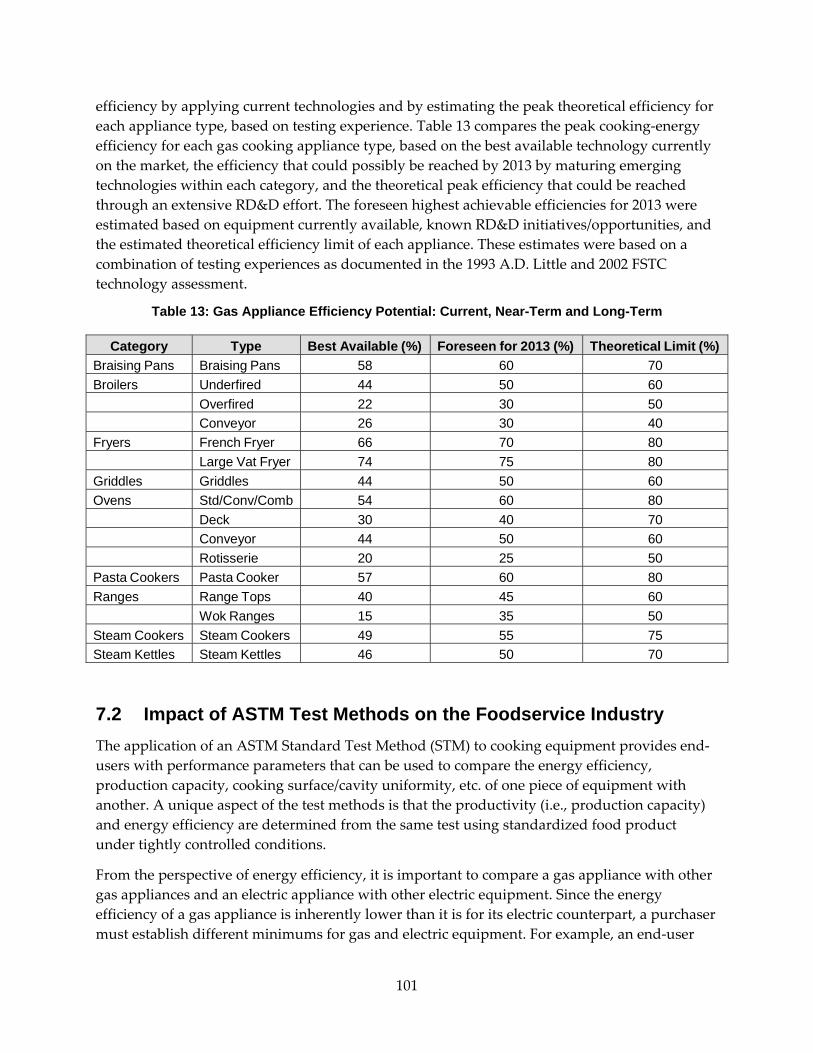
101
efficiency by applying current technologies and by estimating the peak theoretical efficiency for each appliance type, based on testing experience. Table 13 compares the peak cooking‐energy efficiency for each gas cooking appliance type, based on the best available technology currently on the market, the efficiency that could possibly be reached by 2013 by maturing emerging technologies within each category, and the theoretical peak efficiency that could be reached through an extensive RD&D effort. The foreseen highest achievable efficiencies for 2013 were estimated based on equipment currently available, known RD&D initiatives/opportunities, and the estimated theoretical efficiency limit of each appliance. These estimates were based on a combination of testing experiences as documented in the 1993 A.D. Little and 2002 FSTC technology assessment.
Table 13: Gas Appliance Efficiency Potential: Current, Near-Term and Long-Term
Category Type Best Available (%) Foreseen for 2013 (%) Theoretical Limit (%)Braising Pans Braising Pans 58 60 70Broilers Underfired 44 50 60 Overfired 22 30 50 Conveyor 26 30 40Fryers French Fryer 66 70 80 Large Vat Fryer 74 75 80Griddles Griddles 44 50 60Ovens Std/Conv/Comb 54 60 80 Deck 30 40 70 Conveyor 44 50 60 Rotisserie 20 25 50Pasta Cookers Pasta Cooker 57 60 80Ranges Range Tops 40 45 60 Wok Ranges 15 35 50Steam Cookers Steam Cookers 49 55 75Steam Kettles Steam Kettles 46 50 70
7.2 Impact of ASTM Test Methods on the Foodservice Industry The application of an ASTM Standard Test Method (STM) to cooking equipment provides end‐users with performance parameters that can be used to compare the energy efficiency, production capacity, cooking surface/cavity uniformity, etc. of one piece of equipment with another. A unique aspect of the test methods is that the productivity (i.e., production capacity) and energy efficiency are determined from the same test using standardized food product under tightly controlled conditions.
From the perspective of energy efficiency, it is important to compare a gas appliance with other gas appliances and an electric appliance with other electric equipment. Since the energy efficiency of a gas appliance is inherently lower than it is for its electric counterpart, a purchaser must establish different minimums for gas and electric equipment. For example, an end‐user
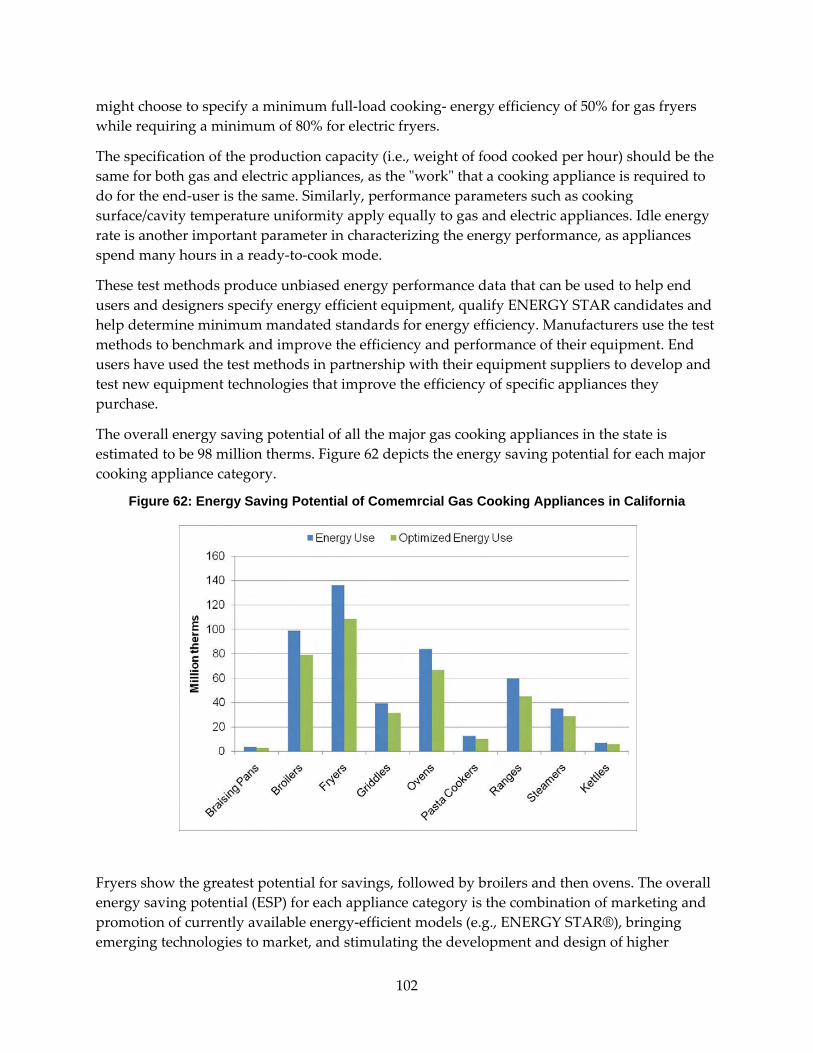
102
might choose to specify a minimum full‐load cooking‐ energy efficiency of 50% for gas fryers while requiring a minimum of 80% for electric fryers.
The specification of the production capacity (i.e., weight of food cooked per hour) should be the same for both gas and electric appliances, as the ʺworkʺ that a cooking appliance is required to do for the end‐user is the same. Similarly, performance parameters such as cooking surface/cavity temperature uniformity apply equally to gas and electric appliances. Idle energy rate is another important parameter in characterizing the energy performance, as appliances spend many hours in a ready‐to‐cook mode.
These test methods produce unbiased energy performance data that can be used to help end users and designers specify energy efficient equipment, qualify ENERGY STAR candidates and help determine minimum mandated standards for energy efficiency. Manufacturers use the test methods to benchmark and improve the efficiency and performance of their equipment. End users have used the test methods in partnership with their equipment suppliers to develop and test new equipment technologies that improve the efficiency of specific appliances they purchase.
The overall energy saving potential of all the major gas cooking appliances in the state is estimated to be 98 million therms. Figure 62 depicts the energy saving potential for each major cooking appliance category.
Figure 62: Energy Saving Potential of Comemrcial Gas Cooking Appliances in California
Fryers show the greatest potential for savings, followed by broilers and then ovens. The overall energy saving potential (ESP) for each appliance category is the combination of marketing and promotion of currently available energy‐efficient models (e.g., ENERGY STAR®), bringing emerging technologies to market, and stimulating the development and design of higher

103
efficiency appliances. Table 14 provides a quick‐reference breakdown of the anticipated savings associated with each general appliance category.
Table 14: Breakdown of Estimated Energy Saving Potential by Appliance Category
Appliance Category Contribution to statewide gas energy saving potential Braising Pans 1% Broilers 20% Fryers 28% Griddles 8%
Ovens 18% Pasta Cookers 2% Ranges 15% Steamers 7% Kettles 1%
The assumed market penetration of energy efficient appliances varies by category, depending on volume, demographics and typical rate of replacement. Table 15 depicts assumed market adoption rates utilized in this study and summarizes the estimated gas energy savings associated with improving the minimum energy efficiencies of each commercial cooking gas appliance category. For several categories, high‐efficiency options exist (e.g. ENERGY STAR® and CAIOU rebate qualified) and these appliances need more effective marketing and promotion. There is potential for many near‐term technologies where high‐efficiency options are not present. Cooking appliances such as braising pans, steam kettles and pasta cookers, where no high‐efficiency options are available, but overall categorical energy consumption is not significant compared to other appliances, would benefit from long term RD&D for developing new technologies. Figure 63 shows the breakdown of the energy savings potential for the major appliance categories based on the status of available energy‐efficient technologies. Specific recommendations for each major cooking appliance are discussed in greater detail later in this report.

104
Table 15: Market Penetration Rates and Energy Saving Potential of Improved Efficiency Gas Cooking Appliances in California
Group
Category
Assumed Market
PenetrationEnergy Use
(million therms/yr)Estimated Energy Saving Potential
(million therms) Braising Pans
Skillets/ Braising Pans
35% 3.65 0.71
Broilers Conveyor 50% 6.41 1.55 Overfired 20% 9.87 1.06 Salamander 20% 11.68 1.47 Underfired 25% 70.86 15.68Fryers Donut 20% 2.62 0.35 French Fryer 50% 118.78 24.66 Large Vat 35% 13.11 2.10 Pressure 50% 1.35 0.35 Griddles Double-Sided 50% 1.98 0.62 Standard 35% 37.14 7.17Kettles Steam Kettle 10g-40g 35% 5.74 1.13 Steam Kettle <10g 35% 0.29 0.07 Steam Kettle >80g 35% 0.35 0.07 Steam Kettle 40g-80g 35% 0.69 0.15Ovens Combination 25% 1.80 0.29 Convection 35% 28.93 8.31 Conveyor 50% 21.46 4.62 Cook & Hold 20% 0.93 0.08 Deck 25% 9.16 1.46 Range Oven 25% 9.22 1.43 Roll-in Rack-Double 35% 8.09 0.64 Roll-in Rack-Single 35% 2.70 0.31 Rotisserie 20% 1.53 0.10Pasta Cookers Pasta Cookers 35% 12.36 2.36Ranges Hot Top 25% 10.58 0.81 Open Top 35% 16.62 5.97 Stock Pot 35% 1.84 0.82 Wok 20% 30.56 7.02Steamers Pressure Steamer 20% 0.99 0.13 Pressureless Steamer 20% 33.92 6.29
105
Figure 63: Strategies for Reducing Commercial Cooking Appliance Energy Consumption
7.3 Marketing & Promoting Energy-Efficient Cooking Appliances The successful marketing & promotion of energy‐efficient gas cooking appliances must include a wide spectrum of strategies from a variety of key players. Marketing & promotion efforts centered on the development of utility energy efficiency programs, education and outreach and incentive structures may provide the most immediate improvements in the minimum efficiencies of the installed base of gas‐fired commercial cooking appliances in California.
7.3.1 Regulatory Environment of commercial cooking appliances At both federal and state levels, mandatory appliance codes and standards have historically focused on domestic appliances. While there are no regulations requiring a minimum energy efficiency level for commercial cooking appliances, other types of commercial foodservice equipment (e.g., refrigeration and ice making equipment) have been subjected to both Federal and State regulations.
Setting minimum performance levels for equipment requires a robust dataset that encompasses all the products within each appliance category. At this time, it is not feasible to mandate minimum efficiencies for commercial cooking appliances, as there is limited data on commercial appliance energy use and efficiency. A first step would be to collect energy use and efficiency data on appliances to better understand the range of efficiencies of products on the market.
In recent years, minimum standards have been adopted for various types of commercial electric and water using appliances, including refrigerators and freezers, ice makers, and pre‐rinse spray valves. In addition, several air resource boards have enacted minimum standards for the allowable emissions from gas commercial cooking processes. The following subsections describe the various federal and local standards affecting commercial foodservice equipment.
106
7.3.1.1 Energy Policy Act of 2005 (EPAct 2005) Following suit of state regulatory efforts (especially those pioneered by the state of California), the federal government first moved to regulate appliance efficiencies in the 1970s. The Energy Policy and Conservation Act of 1975 provided the foundation for national energy conservation regulation by setting targets for efficiency of household appliances only. Manufacturers consented that federal standards were preferable to individual state goals and, in 1987; the National Appliance Energy Conservation Act was passed to regulate major household appliances. It wasn’t until the enactment of the Energy Policy “ct of 1992 (EP“ct) that the minimum efficiency standards for a variety of major commercial equipment categories were created.
In 2005, EPAct was amended to include, for the first time, several major commercial foodservice equipment categories: refrigerated beverage vending machines, ice machines, refrigerators/freezers, and pre‐rinse spray valves. EPAct additionally calls for voluntary testing procedures, program enforcement, and the provision of public, customer‐oriented appliance information.
7.3.1.2 Energy Independence and Security Act of 2007(EISA) The federal Energy Independence and Security Act (P.L. 110‐140, H.R. 6) is an energy policy law that includes a wide variety of provisions designed to improve energy efficiency and the availability of renewable energy [US Senate]. EISA set minimum efficiency standards for a new equipment categories directly affecting commercial foodservice: walk‐in coolers and freezers. EISA sets goals and directs federal and state authorities to improve efficiency standards and employ life‐cycle costing in several public institutional sector buildings that indirectly affect commercial foodservice operations: government buildings, education and health care buildings, as well as public and assisted housing. EISA improves the schedule for standards updating in new areas of residential cooking equipment, ranges and ovens, but unfortunately does not specify goals for their commercial counterparts. Several subsections of EISA additionally provide for grant programs for efficiency improvements in public institutions: including demonstration projects at universities, funding for the improvement of energy efficiency in K‐12 schools.
7.3.1.3 Public Law 111-5, the American Recovery and Reinvestment Act of 2009 (ARRA) In February of 2009, President Obama signed a public law that provides a onetime appropriation of $100,000,000 for equipment assistance to school food authorities (SFAs) participating in the National School Lunch Program (NSLP). The funding specifically focuses on the purchase of equipment that improves dietary standards, health and food safety standards, and energy efficiency standards.38 According to the California Department of Education Nutrition Services Division, $12,864,683 dollars has been granted to 242 local school districts and educational agencies in California for the purchase of new equipment.
7.3.1.4 AP 42 and Emissions Factors Emission factors and inventories serve as tools for designing air quality management policy. According to the EP“, ʺan emissions factor is a representative value that attempts to relate the quantity of a pollutant released to the atmosphere with an activity associated with the release of
107
that pollutant.ʺ AP 42 may indirectly affect the energy efficiency and performance standards of commercial cooking appliances by setting maximum limits for particulate emissions. Commercial cooking appliances had traditionally been considered an ʺinsignificantʺ end‐use activity for production of particulate pollutants, however in recent years, charbroilers have been scrutinized by regional air quality management districts in the state of California. In response to recent emissions regulations with various Air Quality Management Districts in California, conveyor broilers have added a catalyst to reduce the particulate emissions from cooking meats. In FSTC lab tests, the addition of a catalyst has been proven to reduce energy consumption of conveyor broilers, providing a win‐win situation.
7.3.1.5 California Regional Air Quality Management Districts In 1999, the South Coast Area Air Quality Management District (SCAQMD) targeted conveyor broilers for mandatory regulation and enforcement due to their combined significant contribution of air pollutants such as Volatile Organic Compounds (VOCs) and Particulate Matter (PM). SCAQMD is also considering a rule that will require emissions control devises for operations using underfired broilers.
In 2008, the Bay Area Air Quality Management District (BAAQMD) adopted a similar rule to the SCAQMD 1138, which required the installation of catalytic oxidizers over conveyor broilers. BAAQMD Regulation 6, Rule 2 will extend to cover particulate emissions from underfired broilers starting in January 2010. The success (or shortcomings) of these regional legislations may be of particular significance in determining the speed and approach of any future statewide efforts to regulate major commercial cooking appliances.
7.3.1.6 California Title 20 Appliance Standards: A Performance vs. Technology-Based Approach Current California Title 20 Appliance Efficiency Standards includes a provision for reporting energy use under idle conditions for convection ovens and the cooking energy efficiency for range tops. The CEC Appliance database will provide a solid foundation for establishing minimum performance requirements, once the database becomes representative of the products on the market. As of 2009, only a small percentage of manufacturers have complied with the data reporting provisions in Title 20. A contemporary CEC project with Herschong Mahone Group, Inc was established to enforce Title 20 data reporting requirements. However, the list of products covered under Title 20 is quite large and performance data on commercial foodservice equipment is lagging.
If we are to see any regulation of commercial cooking appliances in the near future it will not be the result of performance‐based standards (idle rate, cooking efficiency, etc.). Without a comprehensive performance database, the first steps towards regulating commercial cooking appliances will have to be taken from qualitative, technology‐driven measures. A prime technological candidate for adoption into an early Title 20 regulatory program would be the use of spark‐module and flame sensor actuated electronic ignition (intermittent ignition device, or IID) for the three out of the four largest energy‐consuming gas appliance categories: broilers, ovens, and range tops. The necessitation of a catalyst for commercial gas charbroilers, by several state Air Quality Management District’s has shown that controlling commercial cooking appliances on a specific technological basis does have a measurable impact on reducing factors
108
of key interest‐ be they particulate emissions or energy consumption. Even so, amendments to Title 20 Appliance Standards will require stakeholder buy‐in (dominantly that of manufacturers) and may take several years to be realized as a viable option in reducing statewide cooking appliance energy consumption and is not considered to be a viable near‐term option at the time of this study.
7.3.2 Voluntary Regulatory Programs With no near term options for commercial cooking appliance minimum efficiency standards or building codes there exists no driving force for shifting consumer preference or advancing technological innovation. The importance of shifting the equipment purchasing trends of the commercial foodservice industry through furthering the influence of programs and organizations which recognize and/or certify businesses that adhere to higher standards of environmental performance. These organizations exist at both the local, regional, state and national level and include (but are not limited to): the USGBC LEED program, ABAG Green Business Program, NRA Conserve Initiative, and ENERGY STAR® program for commercial foodservices.
These programs offer significant promise in shifting state and nationwide equipment purchasing trends of the commercial foodservice industry by creating consumer demand for businesses that perform at a higher level of environmental responsibility. Unfortunately the virtually all of the prescriptive guidelines employed by these programs fail to integrate the realistic, energy‐modeling scenarios that are unique to commercial foodservice at the building level. Several contemporary studies have shown that the cooking end‐use category is responsible for the large majority of energy end‐use in a commercial foodservice facility. Unfortunately, prescriptive measures that directly pertain to the installation of high‐efficiency, commercial cooking appliances are either glaringly absent from current green certification programs rating systems,23 or are not accurately or appropriately weighted in current building energy models, such as those used by USGBC LEED standards. USGBC LEED for Retail and Commercial Interior 2009 requirements, which operate on a point system, award fewer credits for in‐kitchen efficiency measures (e.g. those pertaining to the installation of high‐efficiency or ENERGY STAR appliances) than measures taken outside of the kitchen. It is the recommendation of this study that revisions are made to the existing state and national array of green certification and recognition programs so that rating systems and prescriptive guidelines incentivize the installation of high‐efficiency (e.g. ENERGY STAR) commercial cooking appliances in a manner that will accurately demonstrate the substantial energy savings that are implied under the performance standards of such programs. Proving to stakeholders (such as the CEC and California Investor‐Owned Utilities) that leveraging the aforementioned voluntary programs will demonstrate sustained, statewide energy savings will hinge (in a large way) on the successful integration of ENERGY STAR® specifications into program requirements.
23 As is currently the case with many of the standards employed by counties in the California Association of Bay Area Governments (ABAG) Green Business Program which apply to restaurants and hospitality establishments.
109
7.3.3 EPA ENERGY STAR® Program As stated previously, possibly the greatest hurdle to improving the efficiency of commercial foodservice is the lack of understanding (by both manufacturers and purchasers) of benchmarking efficiency. If the buyer is not exposed to accurate efficiency data, there is less incentive on the part of the manufacturers to improve equipment performance. If the buyer does not realize that the most energy efficient appliance option may also be the best performer, the hurdle is even more difficult to knock down.
The California Energy Commission appliance database which includes energy usage information has enabled marketing programs such as utility energy efficiency incentives and ENERGY STAR to promote the purchase of energy efficient equipment. Market penetration of ENERGY STAR commercial refrigerators and freezers was so successful that the ENERGY STAR version 1.0 specifications became the minimum standard for California Title 20. ENERGY STAR® has since raised the bar to promote the next generation of energy efficient equipment.
Commercial refrigeration was the first category of foodservice equipment chosen by the EPA because of two factors: the existence of an ASHRAE method of test and a pre‐existing database of refrigerator and freezer energy performance maintained by the California Energy Commission. Both of these factors are necessary to fairly determine which pieces of equipment consume the least amount of energy within their appliance type. The inventory of standard test methods developed by the FSTC covers every major category of appliances within the scope of potential categories for ENERGY STAR® labeling; however, the necessary equipment databases only exist for a portion of these categories. Currently there are ENERGY STAR specifications for gas fryers, griddles, convection ovens, and steam cookers, as well as various electric equipment categories (e.g. refrigeration and warming cabinets).
Figure 64 shows the results of the estimated market penetration of ENERGY STAR‐qualified commercial foodservice products. This information was collected from the annual 2004‐2009 summaries of the ENERGY STAR® Unit Shipment and Market Penetration Report. Figure 64 only includes fryers and steam cookers, as griddles and convection ovens were not introduced into the ENERGY STAR® program until May of 2009.

110
Figure 64: Reported Market Penetration of Energy Star ® Rated Commercial Foodservice Products in United States
Figure 65 depicts the actual sales data received from all program partners and is represented in annual unit shipments.
Figure 65: Reported Total Annual Sales of Energy Star ® Rated Commercial Foodservice Products in United States

111
2002 was the first year for which ENERGY STAR® qualified unit shipment data was collected for the purposes of measuring and assessing the program’s success. Data was only collected from participating manufacturers and retailers for a subset of ENERGY STAR® product categories. Penetration estimates were then calculated using total U.S. product shipments (ENERGY STAR® plus non‐ENERGY STAR®) obtained from other sources. Sources of information on total US shipments varied depending on the product category and included Lawrence Berkeley National Lab, the Energy Information Administration, industry trade associations and private market research firms. This process has been repeated and is reported on annually, since 2002, though commercial foodservice equipment data was not received until 2004.
From 2004‐2008, ENERGY STAR® rated fryers experienced an overall decline in annual unit sales of 9% and a decline in overall market shares of 12% from 2004‐2008. Contrarily, shipments of ENERGY STAR® rated steam cookers increased 5% in annual unit shipments while annual market shares increased by 13%. The rising success of ENERGY STAR steamers in the market and comparative decline of ENERGY STAR fryers is likely attributed to the high cost‐premium associated with ENERGY STAR fryers. ENERGY STAR steamers have only moderate increased costs when compared with a quality non‐ENERGY STAR steamer.
With the advent of life‐cycle costing analyses and system‐wide purchasing policies, institutional kitchens (especially those in education and health care services) have initiated the process of reducing facility and system‐wide energy consumption. An easy way for decision‐makers to achieve energy savings is through the purchase of ENERGY STAR® qualified equipment. The recognizable certification program and benchmarking tool provides decision‐makers with a simple standard solution which can be easily adopted system wide. While ENERGY STAR® qualified reach‐in refrigeration appliances are prevalent in California (as per former Title 20 code), ENERGY STAR® categories for cooking appliances are less mature, and less known to operators and decision‐makers. Additional marketing and promotion of the ENERGY STAR commercial cooking appliance categories will be needed in the upcoming years if the market share of these products is to exponentially increase. The integration of ENERGY STAR rated commercial cooking appliance standards into the codes and standards of preexisting voluntary regulatory and certification programs, such as USGBC LEED, ABAG Green Business Program, and the emerging NRA Conserve green recognition program, may have a significant combined effect on promoting the early market adoption of many energy efficient gas‐fired cooking technologies.
In the case of fryers, where adoption of efficient technologies may be cost‐prohibitive for many operators, long‐term improvements in market share of energy efficient appliances will largely depend on the development of lower‐cost options. In order for ENERGY STAR‐qualified fryers to realistically gain a foothold in today’s market, the state’s investor‐owned utilities must provide financial incentives which relieve a large portion of the cost‐premium burden of these technologies on commercial foodservice operators.
112
7.3.4 Utility Energy Efficiency Programs To successfully achieve the reductions in gas cooking appliance energy use outlined in this report, the state’s IOUs must be capable of providing comprehensive energy efficiency programs which address segment‐ specific barriers to the adoption of products, services and ideas. The development of such energy efficiency programs for commercial foodservice should place a strong emphasis on financial incentives, third‐party support services, and education and outreach.
In 2006, the California Investor Owned Utilities (CAIOUs) launched a consistent and comprehensive incentive program that supports the purchase and installation of energy efficient commercial foodservice equipment. Through this initiative, Pacific Gas and Electric Company, San Diego Gas & Electric, Southern California Edison, and Southern California Gas Company made a significant commitment to reduce energy consumption within the commercial foodservice sector. Prior to 2006, CAIOU programs supported a few ENERGY STAR® commercial foodservice measures (e.g., steamers, hot food holding cabinets) within their general commercial programs; however, 2006 marked the first year a dedicated statewide effort was made to market a comprehensive package of foodservice equipment to this industry. In its first year, the CAIOU commercial foodservice program created a program to meet the needs of restaurants and other foodservice establishments in California. The program catalog currently covers 14 different equipment categories and over 40 separate products which make it the most comprehensive program offering in the nation.
Because this was a statewide effort there are economies of scale for foodservice owners and managers with multiple facilities. There are also cost effective synergies that arise among the IOUs. The utilities leveraged their relationships with various chain accounts, many of which have headquarters in Southern California, to maximize the impact of the individual utility programs. The net result was that the programs were as seamless as possible for chain accounts with locations throughout the state. By combining the experience of the different utilities, the overall program was much more effective at reaching key decision makers in the commercial foodservice industry than could have been possible without such cooperation.
FSTC is working with agencies such as the Consortium of Energy Efficiency (CEE) to further develop foodservice specifications that can be used by utilities across the nation. The commercial foodservice rebate program in California is leading to a fundamental shift in the entire foodservice equipment industry, as major chains and operators across the country increasingly specify equipment that meets the program guidelines and manufacturers respond with product redesigns to meet program qualifications.
7.4 Emerging Technologies Although the application of advanced technologies could improve the performance and energy efficiency of the existing stock of foodservice equipment, the application of existing technologies, such as insulation, improved burner and heat exchanger design, and enhanced control may provide the greatest return over the short term with the highest level of market acceptability.

113
7.4.1 Improved Insulation Today, most appliance manufacturers have realized that insulation is essential to minimizing heat loss in the cooking process—appliances with effectively incorporated insulation perform better than those without. Insulation is also the least expensive option that can have a significant effect on standby energy consumption. The addition of insulation around an appliance can reduce standby convective heat losses by as much as 25%. Some appliance groups such as ovens and steamers already incorporate some level of insulation, but many appliances do not. The proper amount or thickness and the proper R‐value of insulation are critical in minimizing the amount of conductive heat transfer through oven cavity surfaces. It is thereby an inexpensive method for reducing stand‐by losses and thereby improving part‐load energy efficiency for appliances.
7.4.2 Improved Heat Exchanger Design A major difference between high‐efficiency and low‐efficiency appliances is the effectiveness of their heat exchangers in transferring heat to the cooking surface, cavity or medium. This is especially pronounced in gas appliances that use indirect heating. It is estimated that improved heat exchanger designs could account for up to a 25% increase in cooking‐energy efficiency for gas appliances.
7.4.3 Advanced Atmospheric Burners Advanced‐design atmospheric burners focus the flame and reduce excess air, which slows down the flue gases and allows for more of the available heat to be transferred to the cooking medium. When coupled with engineered heat exchangers, these new‐generation atmospheric burners could dramatically reduce the energy consumption of gas appliances while performing the same amount of work (i.e., cooking the same quantity of product).
7.4.4 Enhanced Control Whether or not an appliance type incorporates a thermostat can impact significantly on the characteristic energy consumption of that appliance. Appliances such as range tops and broilers are generally not amenable to timers or cooking computers, and therefore, controls for these appliances are typically simple. There is most often a manually adjusted infinite‐control knob to regulate the input of each burner or element. The controls are calibrated in terms of the percentage of input, as the burner does not generally sense the temperature of the cooking medium. The energy consumption rate is adjusted directly by the operator. In contrast, an appliance such as a thermostatically controlled griddle senses variations in temperature and adjusts average input rates automatically, ensuring that a minimum amount of energy is used to maintain operating temperature. The average rate of energy consumption required to maintain a ready‐to‐cook state is 20 to 30% of the rated (or maximum) energy input for griddles. ʺSmart controlsʺ that sense the presence of cooking loads offer potential improvements to these types of appliances. A commercial kitchen includes a great number of appliances all operating independently of each other, and with no oversight beyond the restaurant staff and management. This leads to increased energy consumption because appliances are often turned on when they are not being used and there is no feedback mechanism to alert the restaurant owner that energy is being wasted. The foodservice industry has been slow to adopt these types

114
of centralized computer control systems typical in most other industrial processes because of the cost, complexity and lack of a standardized approach.
7.5 RD&D Opportunities for Gas Commercial Cooking Appliances There are significant opportunities to improve the energy efficiency and performance of commercial gas cooking appliances, both by incorporating existing technologies into appliance design and by re‐engineering appliances to incorporate advanced design concepts used in other industries. The goal of an RD&D initiative for commercial cooking appliances should be to improve cooking performance (e.g., production capacity, uniformity) while reducing energy use. The potential to reduce the overall energy consumption for each category of commercial foodservice equipment is discussed in the following sections.
7.5.1 Braising Pans It is estimated that braising pans consume 3.6 million therms annually. Based on the limited testing of braising pans currently‐available, medium‐efficiency designs show the potential to reduce the energy consumption by approximately 30% over standard‐efficiency models. While this is an impressive reduction, the application of more advanced technologies, such as infrared burners, to this otherwise simple appliance could yield even more substantial energy savings. Figure 66 shows the energy savings potential of gas braising pans.
Figure 66: Braising Pan Energy Saving Potential in California
Appliances like braising pans spend much of their operating time holding food at a consistent temperature, as in simmering. If the lid is open and the food is losing moisture freely, as much as half the energy into the appliance is working to evaporate water. Incorporating an insulated lid can reduce energy use by 40% to 60%. With the lid down, the major energy loss from the

115
appliance is radiant heat lost to the room. Insulation could further reduce this loss, but insulation is rarely used in braising pans.
7.5.2 Broilers Broilers are simple appliances with limited controls, and are one of the few appliances in the commercial kitchen where the annual energy cost can exceed the purchase price of the equipment ($6,000 annual gas bill compared to a $5,000 purchase price). Looking at the history of broilers, the growth in technology has been minimal when compared to other appliances. There hasn’t been the same type of incremental improvement that adds up to significant progress over time. This is partially due to the nature of the broiler itself, which is relatively rudimentary in design and lacking in end‐user pull for a more advanced appliance. As one of the most energy‐intensive appliances in a commercial kitchen, broilers need significant development to change to current paradigm. Figure 67 depicts the energy load and the energy savings potential for each type of broiler.
Figure 67: Broiler Energy Saving Potential
7.5.2.1 Underfired Broilers Underfired broilers are the second largest appliance type consumer of natural gas energy out of all commercial cooking appliances. Currently there are about 42,000 commercial underfired broilers in operation in California with baseline efficiency of about 30%. Underfired broilers are estimated to consume 72 million therms per year. An aggressive broiler RD&D program, coupled with marketing efforts could yield a substantial savings of 15.9 million therms, assuming a moderate market penetration rate of 35%.
7.5.2.2 Overfired Broilers Overfired broilers account for 9.9 million therms of gas consumption annually. These high‐production broilers have even lower efficiencies than their underfired counterparts, though

116
they typically produce less smoke. The radiant heat in an overfired broiler is generated with gas infrared burners or gas radiants. Some manufacturers use powered burners that force premixed gas and air through a ceramic infrared burner. GTI has identified solutions to raising the energy efficiency and lowering the standby consumption, using a radiant burner design with a sealed flame and heat recovery through a recuperator to improve efficiency. However, this project ended without the broilers reaching the full development status required for the market introduction to occur. In a mature market, overfired broiler energy consumption can be reduced by 1 million therms, assuming a market penetration rate of 20% is achieved.
7.5.2.3 Salamander Broilers Salamander broilers have an estimated annual energy load of 11.7 million therms. Salamanders are medium‐ duty overfired broilers. Salamanders generally have a lower input rate to match their smaller size, and deliver slightly less energy to each square foot of the grid. In construction, the salamander closely resembles the upright broiler, but is often of lighter weight construction and materials. Although these small broilers are often used for warming dishware or finishing dishes, they tend to operate at full input all day. One innovation that could dramatically reduce salamander energy use would be pressure‐sensitive controls that turned off the heaters when the broiler grate was empty. Incorporating high‐efficiency heat exchanger systems with a pressure controls could yield a savings of 1.5 million therms, assuming a market penetration rate of 20% is achieved.
7.5.2.4 Conveyor Broilers Conveyor broilers are estimated to use 9.9 million therms annually. In response to recent emissions regulations with various Air Quality Management Districts in California, conveyor broilers have added a catalyst. While initially designed to reduce the grease emissions, the catalyst uses waste heat from the broiler to burn the grease in the exhaust plume. The heat generated from the catalyst reflects back into the cooking chamber, thereby reducing the amount of energy required to maintain proper cooking temperatures. Other recent developments in conveyor broilers include the addition of more sophisticated controls with a standby mode that lowers the appliance temperature during non‐busy periods.
7.5.3 Fryers From an energy efficient design perspective, fryers are the most mature appliance category. Figure 68 illustrates the energy load and energy saving potential of gas fryers. Gas fryers exceeding 50% cooking‐energy efficiency have been available for more than 20 years, as a result of demands from some of the more forward‐ thinking quick‐service restaurant chains. With an expanding ENERGY STAR® category for commercial fryers and more restaurant chains pushing manufacturers to develop more efficient gas fryers, there are now many energy efficient fryers on the market.
The energy efficiency within each category or type of gas fryer varies significantly, depending primarily on the applied heating technology. Due to the many possible arrangements of the combustion and heat exchanger systems, gas fryers exhibit significant differences in efficiency. The usage of a fryer from one foodservice operation to another also impacts its energy efficiency and consumption. Fryers are less efficient under part‐ load operation due to the increased effect
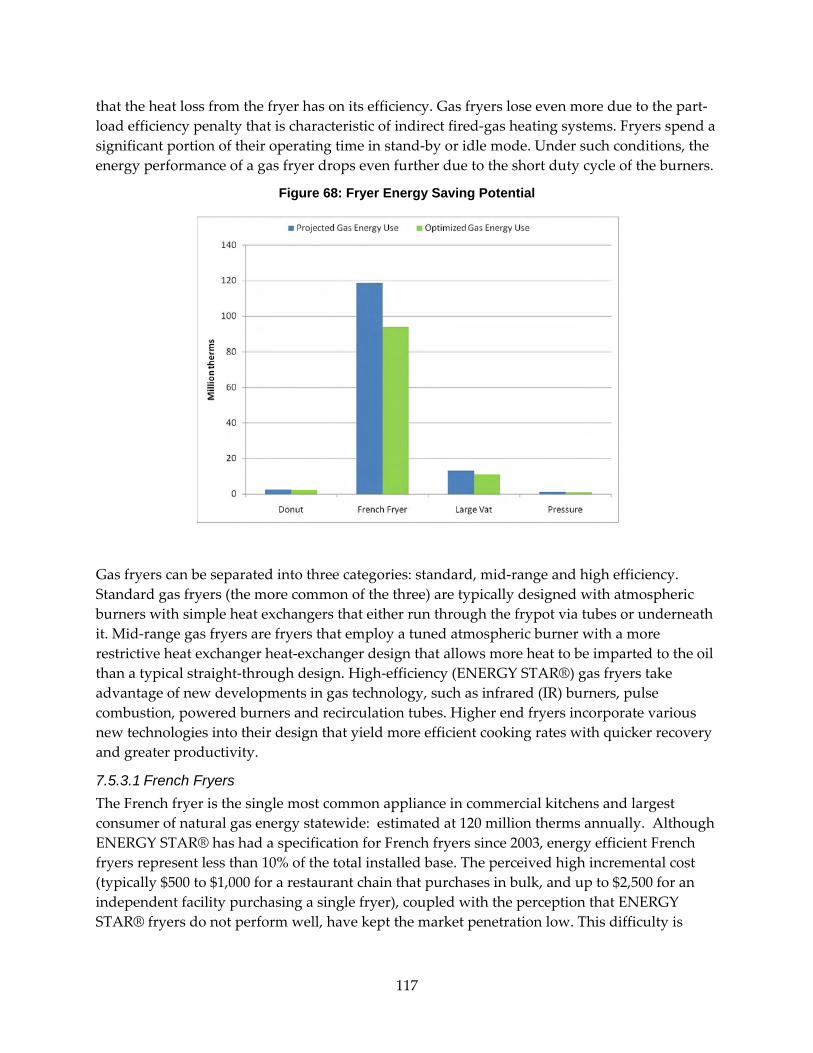
117
that the heat loss from the fryer has on its efficiency. Gas fryers lose even more due to the part‐load efficiency penalty that is characteristic of indirect fired‐gas heating systems. Fryers spend a significant portion of their operating time in stand‐by or idle mode. Under such conditions, the energy performance of a gas fryer drops even further due to the short duty cycle of the burners.
Figure 68: Fryer Energy Saving Potential
Gas fryers can be separated into three categories: standard, mid‐range and high efficiency. Standard gas fryers (the more common of the three) are typically designed with atmospheric burners with simple heat exchangers that either run through the frypot via tubes or underneath it. Mid‐range gas fryers are fryers that employ a tuned atmospheric burner with a more restrictive heat exchanger heat‐exchanger design that allows more heat to be imparted to the oil than a typical straight‐through design. High‐efficiency (ENERGY STAR®) gas fryers take advantage of new developments in gas technology, such as infrared (IR) burners, pulse combustion, powered burners and recirculation tubes. Higher end fryers incorporate various new technologies into their design that yield more efficient cooking rates with quicker recovery and greater productivity.
7.5.3.1 French Fryers The French fryer is the single most common appliance in commercial kitchens and largest consumer of natural gas energy statewide: estimated at 120 million therms annually. Although ENERGY STAR® has had a specification for French fryers since 2003, energy efficient French fryers represent less than 10% of the total installed base. The perceived high incremental cost (typically $500 to $1,000 for a restaurant chain that purchases in bulk, and up to $2,500 for an independent facility purchasing a single fryer), coupled with the perception that ENERGY STAR® fryers do not perform well, have kept the market penetration low. This difficulty is

118
exacerbated by the prevalence of economy (e.g., $800 purchase price), low‐efficiency fryers that are carried by most equipment dealers and distributors.
While end‐user education can begin to change some of the perceptions regarding the performance of ENERGY STAR® fryers, the cost gap between the throw‐away fryers and ENERGY STAR® qualified fryers continues to be a major barrier. Some of the cost difference is due to the energy efficiency design of the ENERGY STAR® fryers, but the majority of the increased price (e.g., $1,000‐$2,500) is derived from the additional features and premium materials used in most ENERGY STAR® qualified models. There is room for an entry‐level ENERGY STAR‐qualified fryer that is more cost‐competitive with the economy line of fryers. Products that could fill that niche would entice independent operators that are low on capital resources without deteriorating the market share of the premium lines preferred by many quick service chains. There is an additional need to establish typical life spans for the low efficiency and high efficiency fryers to support the anecdotal claims that ENERGY STAR® fryers enjoy longer useful lives than low‐efficiency fryers. In a fully mature market, including substantial gains in the ENERGY STAR® fryer market share and the elimination of the lowest efficiency units from the market, French fryer energy consumption can conservatively be reduced by 25 million therms.
7.5.3.2 Large Vat Fryers Large vat fryers are estimated to consume 13.5 million therms annually. Historically limited to a niche product status, large vat fryers have recently become a growing category as operators have looked to increase production from their fryer line while minimizing the impact on space and oil consumption. An energy‐ efficient 18‐inch fryer can produce one‐and‐a‐half to two times more product than a standard (15‐inch) French fryer with only a slight increase in footprint and oil volume. This interest has led to manufacturers developing a new line of energy‐efficient large vat fryers by incorporating the design elements from their ENERGY STAR® qualified French fryers.
There is some resistance from special‐interest market segments (i.e. chicken and fish specialty restaurants) to the adoption of high‐efficiency large vat fryers, due to the perception that the quick recovery times of the fryer might burn the product. This concern can be addressed by adjusting cooking practices, that is, cooking at a slightly lower temperature, when using high‐efficiency large vat fryers. There is a need for education and field demonstrations concerning these independent and chain operators, to establish a cooking method that is satisfactory. Doing so will improve the overall market acceptance of high efficiency large vat fryers for niche operations. If a market penetration rate of 35% is achieved, it will result in estimated energy savings of 2.1 million therms.
7.5.3.3 Pressure Fryers Pressure fryers account for 1.6 million therms of annual gas energy consumption. Pressure fryers require a large vat and typically use a bottom‐fired design. The benchmark performance of pressure fryers is somewhat lower than that of open deep‐fat fryers. In fact, the high‐efficiency gas pressure fryers utilize atmospheric burners, as opposed to infrared burners in the
119
open deep‐fat fryers. Energy savings of 0.3 million therms can be achieved with an assumed market penetration rate of 50%.
7.5.3.4 Donut Fryers Donut fryers consume 2.8 million therms of natural gas energy annually. Currently, there are only low‐ efficiency donut fryers. Lacking the sales volume to justify the incremental costs associated with more efficient designs, the donut fryer market continues to be dominated by economy‐level units. Achieving a market penetration rate of 35% would reduce annual energy consumption by 0.3 million therms.
7.5.4 Griddles As with fryers, commercial griddles represent one of the most mature appliance categories, from an energy‐ efficient design perspective. Two factors have driven energy efficient griddle designs. First, quick service chains, now followed by casual dining chains, have stimulated research on energy efficient griddles because they recognize the possibility of increasing profits by specifying better equipment. Second, ASTM standard test methods developed by the FSTC have allowed testing facilities to produce comparable griddle energy performance data. This allows both manufacturers and purchasers to calculate the cost of operating specific griddle models and technologies. Published data shows that energy performance can vary significantly with griddle type and construction details.
The relatively simple design of griddles (large metal plate with a heat source located beneath the plate) belies the actual complexity of the appliance design. There are different strategies for applying heat to the griddle including open flame atmospheric burners, advanced burners and heat pipe technology. Even among appliances that use the same heating technology, there can be significant variations in appliance performance and energy use due to subtleties in appliance design and control. Figure 69 illustrates the energy load and energy saving potential of gas griddles.
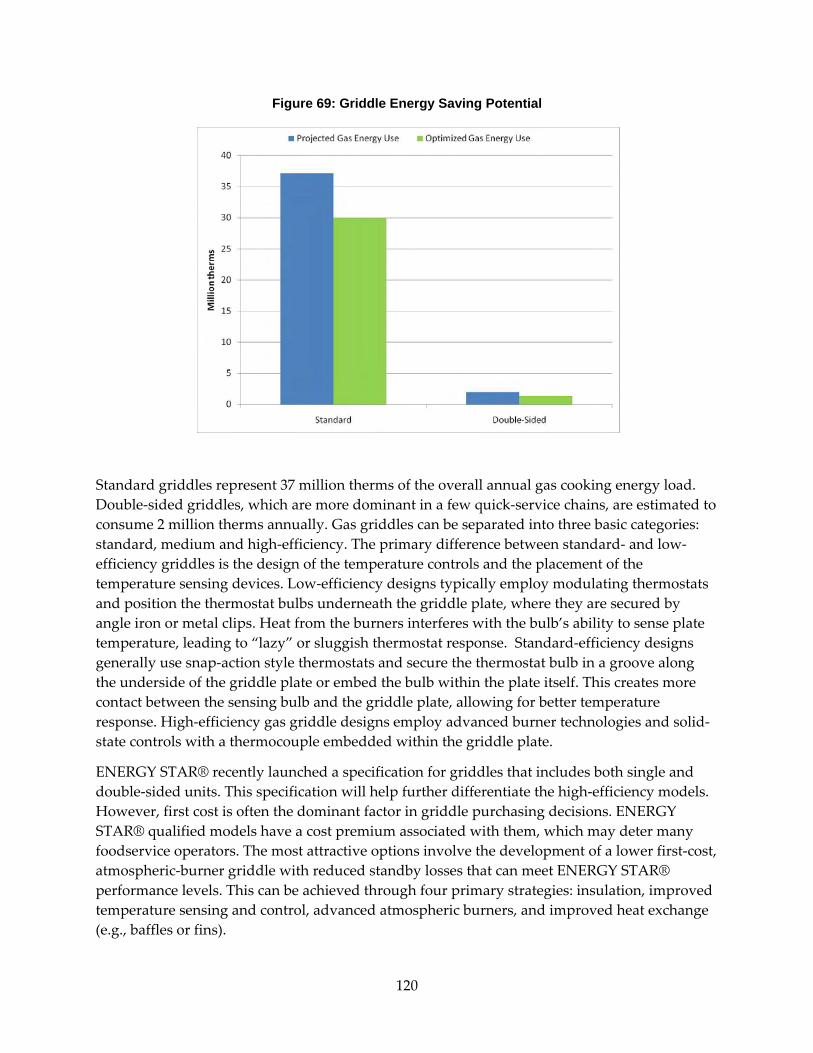
120
Figure 69: Griddle Energy Saving Potential
Standard griddles represent 37 million therms of the overall annual gas cooking energy load. Double‐sided griddles, which are more dominant in a few quick‐service chains, are estimated to consume 2 million therms annually. Gas griddles can be separated into three basic categories: standard, medium and high‐efficiency. The primary difference between standard‐ and low‐efficiency griddles is the design of the temperature controls and the placement of the temperature sensing devices. Low‐efficiency designs typically employ modulating thermostats and position the thermostat bulbs underneath the griddle plate, where they are secured by angle iron or metal clips. Heat from the burners interferes with the bulb’s ability to sense plate temperature, leading to “lazy” or sluggish thermostat response. Standard‐efficiency designs generally use snap‐action style thermostats and secure the thermostat bulb in a groove along the underside of the griddle plate or embed the bulb within the plate itself. This creates more contact between the sensing bulb and the griddle plate, allowing for better temperature response. High‐efficiency gas griddle designs employ advanced burner technologies and solid‐state controls with a thermocouple embedded within the griddle plate.
ENERGY STAR® recently launched a specification for griddles that includes both single and double‐sided units. This specification will help further differentiate the high‐efficiency models. However, first cost is often the dominant factor in griddle purchasing decisions. ENERGY STAR® qualified models have a cost premium associated with them, which may deter many foodservice operators. The most attractive options involve the development of a lower first‐cost, atmospheric‐burner griddle with reduced standby losses that can meet ENERGY STAR® performance levels. This can be achieved through four primary strategies: insulation, improved temperature sensing and control, advanced atmospheric burners, and improved heat exchange (e.g., baffles or fins).
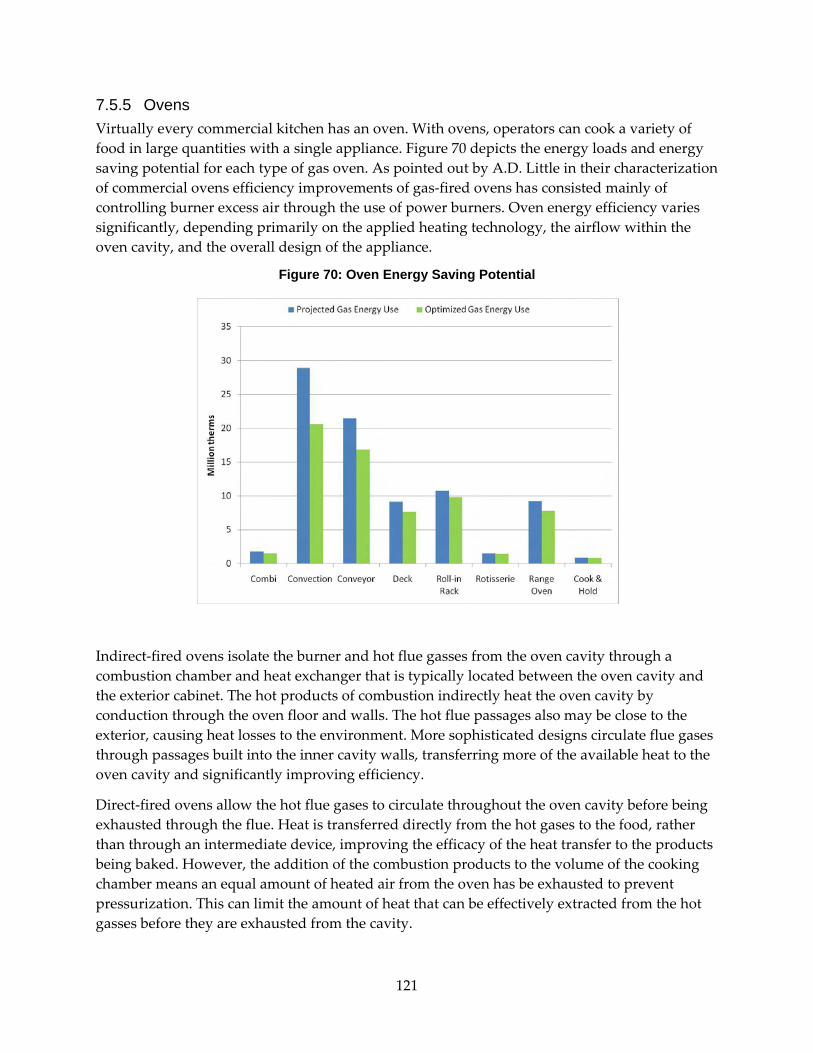
121
7.5.5 Ovens Virtually every commercial kitchen has an oven. With ovens, operators can cook a variety of food in large quantities with a single appliance. Figure 70 depicts the energy loads and energy saving potential for each type of gas oven. As pointed out by A.D. Little in their characterization of commercial ovens efficiency improvements of gas‐fired ovens has consisted mainly of controlling burner excess air through the use of power burners. Oven energy efficiency varies significantly, depending primarily on the applied heating technology, the airflow within the oven cavity, and the overall design of the appliance.
Figure 70: Oven Energy Saving Potential
Indirect‐fired ovens isolate the burner and hot flue gasses from the oven cavity through a combustion chamber and heat exchanger that is typically located between the oven cavity and the exterior cabinet. The hot products of combustion indirectly heat the oven cavity by conduction through the oven floor and walls. The hot flue passages also may be close to the exterior, causing heat losses to the environment. More sophisticated designs circulate flue gases through passages built into the inner cavity walls, transferring more of the available heat to the oven cavity and significantly improving efficiency.
Direct‐fired ovens allow the hot flue gases to circulate throughout the oven cavity before being exhausted through the flue. Heat is transferred directly from the hot gases to the food, rather than through an intermediate device, improving the efficacy of the heat transfer to the products being baked. However, the addition of the combustion products to the volume of the cooking chamber means an equal amount of heated air from the oven has be exhausted to prevent pressurization. This can limit the amount of heat that can be effectively extracted from the hot gasses before they are exhausted from the cavity.

122
A hybrid design between indirect‐fired and direct‐fired technologies employs an isolated burner with heat exchanger in the oven walls, along with a recirculating system then siphons a portion of the flue products directly into the oven cavity. Two types of recirculation systems are currently available; one uses a specially designed fan and the other uses a recycling or ʺsnorkelʺ tube. ”oth systems reuse the hot air, which would normally be vented after passing through the heat exchanger. This recirculating design combines the benefits of both indirect and direct‐fired oven designs.
7.5.5.1 Range Ovens Range ovens are typically designed for minimal production and are among the least evolved of the oven family. The majority of range ovens rely on radiant heat from the cavity walls to cook product and use only the most basic of temperature controls (often with a tolerance of ± 50˚F). Range oven manufacturers do offer convection range ovens, but these are essentially the same as standard range ovens with a fan added.
Range ovens represent a substantial (44,223 units) subclass of gas ovens, with an annual load of 9.2 million therms. Designers of range ovens have traditionally focused on durability and simplicity and included little in terms of energy efficiency or airflow optimization. The most cost effective improvements of range ovens would be improved insulation and better door seals. Under a 25% market penetration scenario, energy consumption can be reduced by 1.4 million therms.
7.5.5.2 Deck Ovens As with range ovens, deck ovens are among the least developed in the oven category. Deck ovens account for nine million therms of energy consumption annually. The basic design of a heated porous floor and radiant heat has remained relatively unchanged in over 30 years. Most deck ovens employ minimal insulation (the cavity below helps to heat the upper cavity in a stacked configuration). As other oven technologies have replaced older deck ovens, there has been little interest in improving their efficiency on the part of either the manufacturers or the end users. If a market penetration rate of 25% is achieved, energy consumption is expected to be reduced by 1.4 million therms.
7.5.5.3 Convection Ovens One of the most common cooking appliances found in a commercial kitchen is the standard convection oven, with over 65,000 units currently estimated in use in California, and an energy load of 28.9 million therms per year. Convection ovens use a cooking chamber similar in design to the oven found in most homes with the exception of using fans to force hot air through the cooking chamber to convectively cook food products. The moving air improves the cook times and uniformity of the final products. In terms of cooking performance and emissions, the typical convection oven works well and changes in air flow patterns have been able to improve the cooking performance even more.
Gas convection ovens can be separated into three categories: standard, medium, and high‐efficiency. Standard‐ and medium‐efficiency convection ovens typically use basic indirect‐fired designs and generally have minimal insulation and poor door seals. High‐efficiency gas
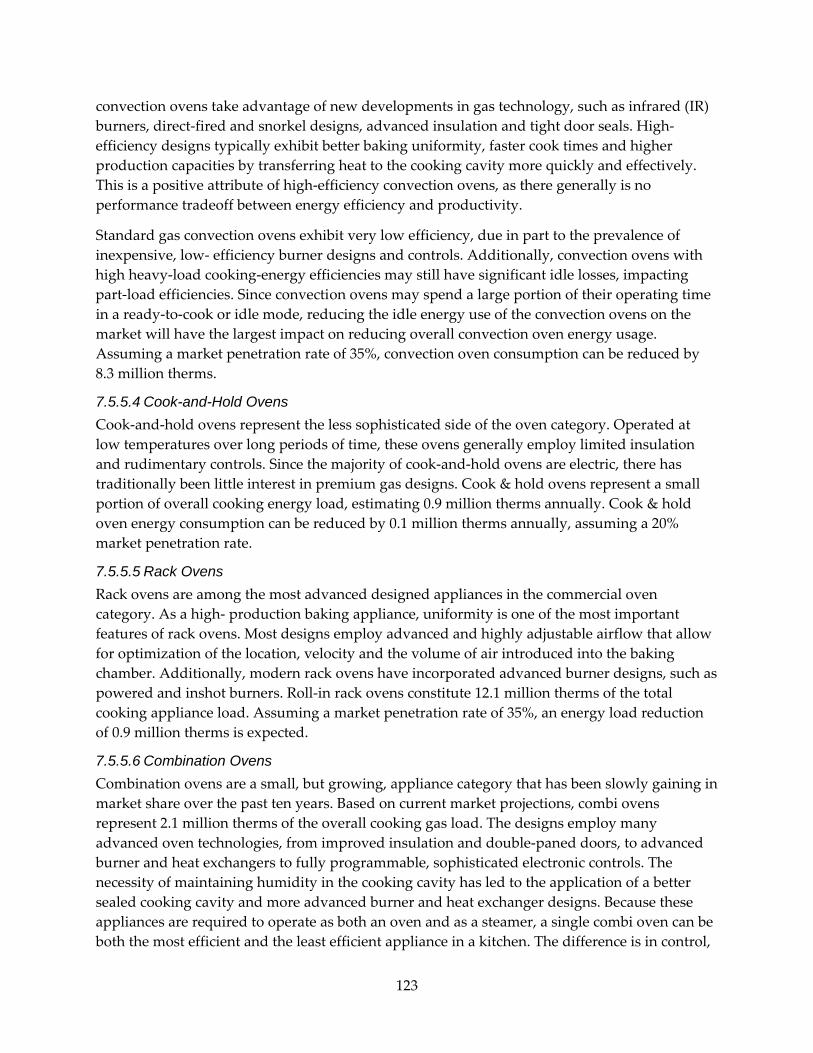
123
convection ovens take advantage of new developments in gas technology, such as infrared (IR) burners, direct‐fired and snorkel designs, advanced insulation and tight door seals. High‐efficiency designs typically exhibit better baking uniformity, faster cook times and higher production capacities by transferring heat to the cooking cavity more quickly and effectively. This is a positive attribute of high‐efficiency convection ovens, as there generally is no performance tradeoff between energy efficiency and productivity.
Standard gas convection ovens exhibit very low efficiency, due in part to the prevalence of inexpensive, low‐ efficiency burner designs and controls. Additionally, convection ovens with high heavy‐load cooking‐energy efficiencies may still have significant idle losses, impacting part‐load efficiencies. Since convection ovens may spend a large portion of their operating time in a ready‐to‐cook or idle mode, reducing the idle energy use of the convection ovens on the market will have the largest impact on reducing overall convection oven energy usage. Assuming a market penetration rate of 35%, convection oven consumption can be reduced by 8.3 million therms.
7.5.5.4 Cook-and-Hold Ovens Cook‐and‐hold ovens represent the less sophisticated side of the oven category. Operated at low temperatures over long periods of time, these ovens generally employ limited insulation and rudimentary controls. Since the majority of cook‐and‐hold ovens are electric, there has traditionally been little interest in premium gas designs. Cook & hold ovens represent a small portion of overall cooking energy load, estimating 0.9 million therms annually. Cook & hold oven energy consumption can be reduced by 0.1 million therms annually, assuming a 20% market penetration rate.
7.5.5.5 Rack Ovens Rack ovens are among the most advanced designed appliances in the commercial oven category. As a high‐ production baking appliance, uniformity is one of the most important features of rack ovens. Most designs employ advanced and highly adjustable airflow that allow for optimization of the location, velocity and the volume of air introduced into the baking chamber. Additionally, modern rack ovens have incorporated advanced burner designs, such as powered and inshot burners. Roll‐in rack ovens constitute 12.1 million therms of the total cooking appliance load. Assuming a market penetration rate of 35%, an energy load reduction of 0.9 million therms is expected.
7.5.5.6 Combination Ovens Combination ovens are a small, but growing, appliance category that has been slowly gaining in market share over the past ten years. Based on current market projections, combi ovens represent 2.1 million therms of the overall cooking gas load. The designs employ many advanced oven technologies, from improved insulation and double‐paned doors, to advanced burner and heat exchangers to fully programmable, sophisticated electronic controls. The necessity of maintaining humidity in the cooking cavity has led to the application of a better sealed cooking cavity and more advanced burner and heat exchanger designs. Because these appliances are required to operate as both an oven and as a steamer, a single combi oven can be both the most efficient and the least efficient appliance in a kitchen. The difference is in control,

124
particularly with respect to the introduction and retention of steam. Promoting advanced combi oven technologies and educating the industry on optimal combi oven cooking methods could reduce the energy load associated with combi ovens by 0.3 million therms.
7.5.5.7 Conveyor Ovens Conveyor ovens are frequently considered a direct replacement for deck ovens. The use of the conveyor to pass the food product through the oven cavity results in a more consistent product, while the introduction of high velocity hot air (impingement) dramatically shortens cook times and increases productivity. A major drawback to conveyor oven designs is heat loss through the open ends. Several methods including adding doors, air curtains and modifying the air returns in the oven have been attempted with varying levels of success. Another significant energy loss occurs when the oven sits idle in cook ready state. During the idle time, the oven is kept at cooking temperature so that it can be immediately ready to bake a pizza. However, an oven sitting at temperature, but not being used, can lose a significant amount of heat, both through the openings in the cooking chamber and through the skin of the oven. Because of these losses, the baseline efficiency of conveyor ovens fairly low (30%).
Conveyor ovens rival convection ovens in energy consumption, estimating 21.5 million therms annually. Efficiency improvements can occur for the conveyor oven by optimizing or redesigning the combustion system of each to better control heat transfer to the cooking chambers and by improved control systems for the unit. The control systems will especially improve the efficiency of the units by eliminating a significant amount of heat that is lost during the idle time for the units.
There is a clear opportunity to advance the state‐of‐the‐art of conveyor and convection ovens by developing more efficient designs that maintain the functionality required by operators. This will be accomplished by decreasing the lost energy when the oven is not cooking product, but kept in a ready‐to‐cook or idle state through improved insulation, tighter door seals and advanced controls. The overall efficiency of ovens will be most impacted through the development and application of advanced burner and heat exchanger designs. GTI has already begun exploratory development of advanced oven systems that reduce standby losses and improve the efficiency of different types of commercial ovens. A comprehensive RD&D program with sufficient marketing to the pizza industry could dramatically reduce conveyor oven energy consumption by 4.6 million therms annually.
7.5.5.8 Rotisserie Ovens It is estimated that the gas load for rotisserie ovens is as much as 2 million therms annually. Since a rotisserie oven’s glass doors allow product to be displayed while cooking, these appliances are frequently used as a merchandising tool, rather than a production appliance. As a result, there has been little demand to improve unit efficiency. The preliminary need is to establish representative benchmark performance data on rotisserie ovens and then employ standard design improvements, such as insulation, advanced burners and enhanced controls. Applying advanced design strategies to the current stock of rotisserie ovens could lead to a 0.1 million therm annual energy reduction.
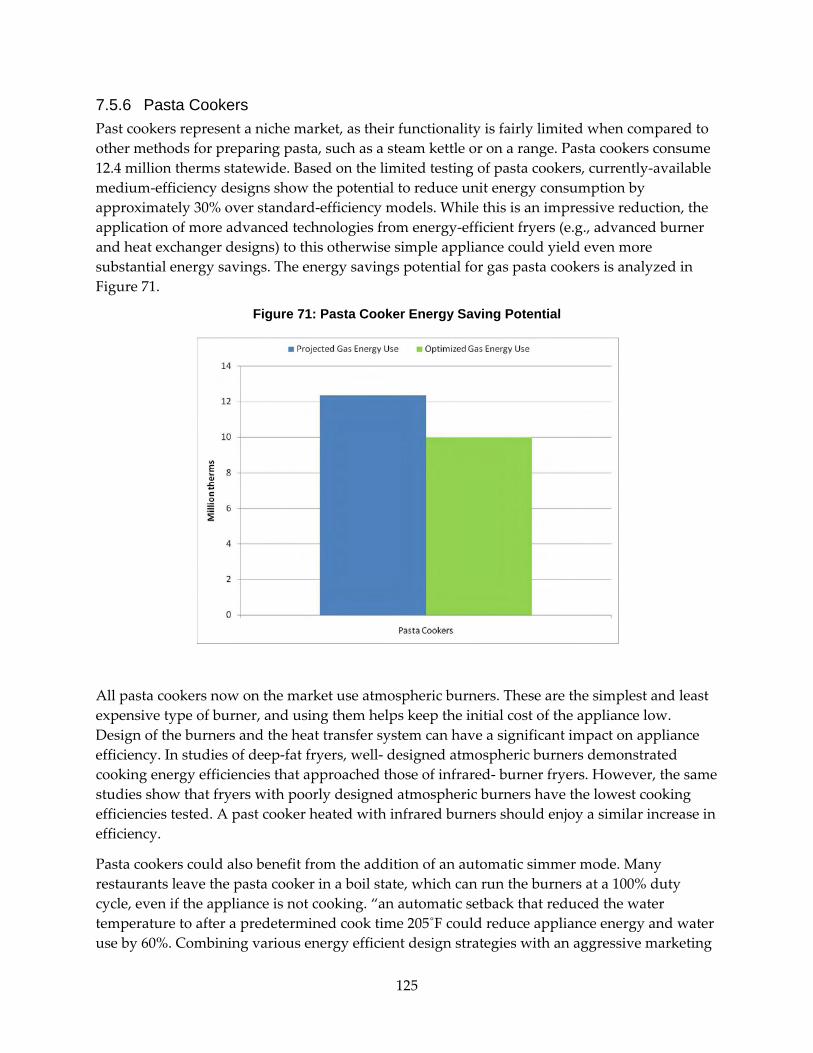
125
7.5.6 Pasta Cookers Past cookers represent a niche market, as their functionality is fairly limited when compared to other methods for preparing pasta, such as a steam kettle or on a range. Pasta cookers consume 12.4 million therms statewide. Based on the limited testing of pasta cookers, currently‐available medium‐efficiency designs show the potential to reduce unit energy consumption by approximately 30% over standard‐efficiency models. While this is an impressive reduction, the application of more advanced technologies from energy‐efficient fryers (e.g., advanced burner and heat exchanger designs) to this otherwise simple appliance could yield even more substantial energy savings. The energy savings potential for gas pasta cookers is analyzed in Figure 71.
Figure 71: Pasta Cooker Energy Saving Potential
All pasta cookers now on the market use atmospheric burners. These are the simplest and least expensive type of burner, and using them helps keep the initial cost of the appliance low. Design of the burners and the heat transfer system can have a significant impact on appliance efficiency. In studies of deep‐fat fryers, well‐ designed atmospheric burners demonstrated cooking energy efficiencies that approached those of infrared‐ burner fryers. However, the same studies show that fryers with poorly designed atmospheric burners have the lowest cooking efficiencies tested. A past cooker heated with infrared burners should enjoy a similar increase in efficiency.
Pasta cookers could also benefit from the addition of an automatic simmer mode. Many restaurants leave the pasta cooker in a boil state, which can run the burners at a 100% duty cycle, even if the appliance is not cooking. “an automatic setback that reduced the water temperature to after a predetermined cook time 205˚F could reduce appliance energy and water use by 60%. Combining various energy efficient design strategies with an aggressive marketing

126
campaign can be reduce pasta cooker energy by 2.4 million therms, assuming a moderate a market penetration of 35%.
7.5.7 Ranges Gas ranges represent a large and diverse appliance category in commercial kitchens. Within a single commercial range model line, operators may select open‐burner, hot top (covered burner), fry top (griddle) or grill top (broiler), mounted above a refrigerated base, cabinet base, shelf base, standard range oven or a convection‐style range oven. A single unit may incorporate any combination of the above options and still be considered a range. Technologies developed for commercial use have focused on improving gas burner efficiencies and on designing easy‐to‐clean closed range tops. This energy efficiency potential for ranges is focused on the open top and hot range tops. Many of the opportunities for reducing griddles, broiler and fryers would also apply to ranges with those elements. Figure 72 illustrates the energy load and energy saving potential of gas range tops.
Figure 72: Range Energy Saving Potential
The basic open cast iron burner design is consistent among all types range tops—open burner, hot top, stock pot and wok ranges—and has changed very little over the past 30 years. The open design of the standard
range burner allows secondary air around the flame and significantly reduces the ability of the burner to heat the cooking utensil (pot or wok). Another common design trait among commercial ranges is the use of a continuous standing pilot to light the burners. Despite the relatively low firing rate (~2,000 BTU/hr) of a single pilot, the volume of range burner pilots (average of 6 pilots per unit) can represent a significant portion of range top energy consumption.

127
7.5.7.1 Open Burner Ranges Open gas burners are the most common range top configuration. Although their efficiency is quite low (30 to 35%, based on ASTM testing) [FSTC, 2003], the basic functionality of the open burner design is preferred by most operators. Open tops consume 16.6 million therms per year and show significant potential for reduction (6 million therms per year) with a market penetration of 35%. The visible flame provides direct visual feedback on the amount of heat being applied to the pan, enhancing the operator’s control. Input to the burner is manually controlled by the operator, which can lead to unnecessary burner on‐time. As the operators remove the cooking utensils, the burner is frequently left on until a new utensil is placed on the burner. Since ranges are considered to be a commodity item, users of ranges have been traditionally been more concerned with the purchase price of a range rather than the potential energy costs. As a result, manufacturers have been reluctant to change the basic range design. A control that could detect the presence of a cooking utensil and shut off the burner when no utensil is detected could potentially save a significant amount of energy.
7.5.7.2 Hot Top Ranges Hot tops allow the entire surface of the range top to be used, instead of only the space directly over the burners. This allows an operation that prepares many small orders at once to fit more pans on the range top, and facilitates moving items such as soups or stews from a front hot‐ top section that is set at a high temperature (i.e., for boiling) to an alternate section that is set at a lower temperature (i.e., for continued simmering or holding). However, the metal mass of a hot top is slow to heat—it may take 30 to 60 minutes before the plate reaches its maximum temperature setting. Similarly, it is slow to respond to changes in the control setting. As a result, hot tops are typically preheated in the morning and left on at maximum input throughout the day. They consume energy at a high rate, and can radiate more heat into the kitchen than any other type of range top. Hot top range tops are estimated to consume 10.6 million therms annually. This can be reduced by 0.8 million therms with a market penetration of 25%.
7.5.7.3 Stock Pot Ranges Stock pot ranges are simply high input versions of open burner range tops. Since they are designed to operate with large (e.g., > 16‐inch) pots, the actual heat transfer efficiency of stock pot ranges is marginally better than standard open burners. However, they share the same limitations—rudimentary burner design, standing pilots and lack of a pot sensor. Employing one or more of these strategies could dramatically reduce stock pot range energy use. Stock pots represent 1.8 million therms per year of gas energy load. This can be reduced by 0.8 million therms with a market penetration of 35%.
7.5.7.4 Wok Ranges Wok ranges are a high‐input specialty range, designed for high‐temperature stir frying. The majority of wok ranges use the same basic design of a burner located in a well, on top of which sits the utensil (wok). The system is designed to provide intense heat to the bottom of the wok for quick cooking of food that seals in the natural juices. The intense heat and the constant stirring of the food rapidly cook the food to give a unique flavor. However, the combination of the intense heat and the open design of the unit results in a significant amount of waste energy.
128
Another design issue associated with the lower efficiency of existing wok range designs is the potential warping of the range surface around the wok well due to heat conduction from the burner well. To prevent this, manufacturers have resorted to continuously flowing water over the range surface.
7.5.8 Steam Cookers Steam cookers are energy intensive appliances that can exhibit a wide range in efficiency and energy consumption, depending on the fundamental design and control of the appliance. The two basic categories of steamers on the market—pressureless (atmospheric) and pressure—have different savings opportunities. Of the two categories, pressureless steamers have the most dramatic range in energy‐efficiency, primarily depending on how the steam is introduced and then maintained within the cooking compartment. Pressure steamers retain more energy by allowing the compartment pressure to build up during the cooking event. Cooking under pressure shortens cook times and results in higher cooking‐energy efficiencies. Figure 73 compares the energy load and savings potential for pressure and pressureless steam cookers. In general, the energy load of the steamer appliance category can be reduced by approximately 20%, or 6.4 million therms.
Figure 73: Steam Cooker Energy Saving Potential
Advanced controls can have a dramatic impact on the energy consumption of steam cookers. Most pressureless steamers are equipped with a continuous operation, or ʺconstant steamʺ setting. When operated in this mode, the steamer runs at maximum input, regardless of whether there is any food being cooked. The use of a simple cook timer that shuts off steam production when the timer expires can significantly reduce waste energy and water use. A field study showed that the difference in energy consumption between constant steam and timed cooking mode in a full service restaurant was two to one.49 Since most steamers spend a

129
significant amount of their operating time between cooking events, reducing the energy use during non cooking periods is the most effective strategy for reducing steamer energy use.
7.5.8.1 Pressureless Steamers Pressureless steamers consume 34 million therms annually. With a variety of strategies this can be reduced by 6.3 million therms. The dominant design is an open system in which any steam injected into the compartment that does not condense on the food escapes down the drain as unused steam. Cooling water is then injected into the steamer drain line to condense the wasted steam before it is expelled to the main sewer line. This continuous flow of steam down the drain places a continuous demand on the boiler, as cold water (to replenish the wasted steam) is added to the boiler. While the constant influx of fresh steam into the cooking compartment yields fast cook times, the speed is achieved at the expense of heavy energy and water consumption.
A variation in the design uses a drain trap and sensors to modulate steam production based on demand. When unused steam is condensing down the drain, the controls shut down steam production and stop the condensate cooling water spray. Only when the compartment pressure lowers, indicating that the food has absorbed heat from the steam, will the steam production resume. This approach has lead to dramatic increases in efficiency with only a slight impact on speed.
An alternative to this partially closed system design is a fully‐closed or connectionless design. Connectionless steamers do not need the water and drain connections typically associated with steam cookers. Water is manually poured into a reservoir at the bottom of the cooking compartment. Heating elements inside or underneath the reservoir create steam by simply boiling the water, which then rises into the cooking compartment to cook the food. Connectionless steamers are inherently more energy‐efficient than steam‐ generator type steamers, since any steam that does not condense on the food remains in the cooking compartment rather than being lost down the drain in the form of condensate. Connectionless steamers typically exhibit cooking energy efficiencies that exceed 40% (ASTM full‐load potato test).
7.5.8.2 Pressure Steamers Pressure steamers account for 1 million therms of energy consumption annually. There is an opportunity to reduce this load by 0.1 million therms. Pressure steamers have the advantage of delivering more energy per pound of steam to the food, due to the increased operating pressure inside the compartment. The increase pressure corresponds to a higher operating temperature. This efficiency gain, due to pressure, has a potential drawback: overcooking. Food continues to cook at the same fast rate, even if production of steam has been halted. There is a general lack of information on pressure steamers. The efficiency database that exists does not provide ample range between low and high efficiency models. However, it is assumed that general improvements, such as boiler design improvements and improved insulation, will result in marginal efficient gains. Additionally, boilers are typically oversized relative to cavity size and production needs for these appliances. Optimally sizing the boilers will further result in avoiding energy waste.

130
7.5.9 Steam Kettles Steam kettles account for 7.1 million therms per year of gas energy consumption. Although this is a significant load, very little benchmarking on steam kettles has been conducted. While the majority of the gas kettles share a similar design, there are nuances to the insulation of the steam jacket, innovations in the burner and heat exchanger design and advances in control technology that may yield incremental efficiency gains and reduce steam kettle energy usage. It is estimated that these incremental gains can lead to a reduction of 1.4 million therms in the energy load of the steam kettle appliance category. Figure 74 shows the energy savings potential of gas steam kettles.
Figure 74: Steam Kettle Energy Saving Potential
131
CHAPTER 8: Conclusions and Recommendations 8.1 Conclusions Across all California’s foodservice establishments, there are roughly 800,000 major commercial cooking appliances installed and operating, 70% of which are powered by natural gas. Gas‐fired cooking appliances account for 475 million therms annually. The energy efficiency potential of the major gas‐fired commercial cooking appliances was evaluated based on the availability of energy efficient models, the potential to improve appliance efficiency by applying current technologies and by estimating the peak theoretical efficiency for each appliance type.
In the absence of reliable near‐term options for mandatory regulations, this study recommends the improvement (and consolidation) of existing voluntary program standards. It is the finding of this report that improving existing appliance performance databases to more accurately reflect the significant contribution of natural gas‐fired commercial cooking appliances to overall building energy load will incentivize building‐level compliance with higher standards of appliance efficiency. By extension, increased compliance on the part of building operators will increase the statewide market shares of high efficiency appliances and push manufacturers to develop more products that comply with these voluntary standards.
Objective appliance performance data, from ASTM testing, can help utilities implement successful energy conservation initiatives by effectively pursuing market retention or expansion of energy efficient products in the restaurant sector. The better one understands how a cooking appliance or process performs, the better oneʹs position with respect to marketing the use of that appliance or process.
An example of the successful transformation of an appliance category through data generation is the ENERGY STAR® program for commercial foodservice equipment (mostly refrigeration). The labeling of commercial refrigeration equipment with its energy consumption data, utility‐incentive program data and the ENERGY STAR® program insignia has helped to promote the buying of energy efficiency commercial refrigeration equipment. Market penetration of ENERGY STAR commercial refrigerators and freezers was so successful that the ENERGY STAR® specifications have become the minimum standard for California Title 20. ENERGY STAR® has since raised the bar to promote the next generation of energy efficient equipment.
However, ENERGY STAR® is still in its infancy for the remainder of commercial foodservice categories and the market needs stimulus to further the adoption of the current ENERGY STAR® appliance categories, as well as to introduce new appliance specifications as the energy efficient offerings are developed. This effort requires a concerted education effort to increased end‐user awareness through marketing and education on the short term performance benefits and longer term cost benefits of using ENERGY STAR® qualified appliances, as well as economic incentives from utilities.

132
There are significant opportunities to improve the energy efficiency and performance of commercial gas cooking appliances, both by incorporating existing technologies into appliance design and by re‐engineering appliances to incorporate advanced design concepts used in other industries. The goal of an RD&D initiative for commercial cooking appliances should be to improve cooking performance (e.g., production capacity, uniformity) while reducing energy use. The overall energy saving potential of all the major gas cooking appliances in the state is estimated to be 98 million therms. This can be achieved through:
• Working with manufacturers to stimulate new design initiatives that incorporate energy efficient technology not yet available on the market. These initiatives should be targeted in those categories which are least mature in terms of efficiency (e.g. broilers, convection ovens and ranges).
• Continuing commercial appliance testing programs (e.g., FSTC and other CAIOU testing centers) that can be used to further benchmark energy performance in direct support of RD&D projects for commercial cooking equipment.
• Using benchmark performance data as justification, developing an industry strategy that will influence the purchase‐decision criteria so that customers will specify more energy efficient equipment. These strategies would encompass development and promotion of incentives in addition to outreach to equipment specifiers, distributors and dealers.
• Developing and sponsoring training courses and workshops for the food service and utility industries based on this report’s findings. Training courses could incorporate appropriate cooking methods using high‐efficiency technology in order to ensure market acceptability and avoid potential misuse. Promotion and education of the ancillary benefits (i.e. increased production, higher throughput, less radiant heat to the kitchen) of high‐efficiency commercial cooking equipment is critical to long‐term market acceptance and correct application of these technologies.
Specific appliance categories are believed to have the most potential for energy efficiency improvements based on total appliance inventory, appliance energy load, and the current state of their overall in‐kitchen efficiencies and sophistication of controls: these appliance categories are fryers, broilers, ovens and ranges. While some of the appliance types associated with the aforementioned categories will require specific strategies for improving efficiency, the goal of any RD&D initiative for commercial cooking appliances should be to improve cooking performance (e.g., production capacity, uniformity) while reducing unnecessary idle energy use across all appliance types with technologies that have been developed, tested and can practically be applied. Many technologic advances have been successfully applied to specific appliance categories which resulted in measureable improvements in efficiency and performance. These advances (such as thermostatic controls) are considered standards in their specific appliance fields (fryers) but have not yet been successfully applied to the more rudimentary appliance types such as underfired charbroilers.
133
8.2 Recommendations A major finding of this report is the importance of shifting the equipment purchasing trends of the commercial foodservice industry through furthering the influence of programs and organizations that recognize and/or certify, businesses that adhere to higher standards of environmental performance. These organizations exist at both the local, regional, state and national level and include (but are not limited to): the USGBC LEED program, ABAG Green Business Program, NRA Conserve Initiative, and ENERGY STAR® program for commercial foodservices.
Influence public entities (including but not limited to: as California Department of Education, Nutrition Services, UC/CSU/CCC system, California Office of Statewide Health and the California Department of Corrections and Rehabilitation) to set and adhere to energy efficiency standards for foodservice procurement policies, especially where grants are concerned.
A key element to the successfully transforming the market towards more energy efficient equipment is through the development of a comprehensive web‐based directory of ASTM appliance performance data. Such a directory would rely extensively on the efficiencies reported by FSTC and the California Utility foodservice equipment centers. To date, the combined test results of these centers include only a fraction of the available models of cooking equipment on the market. Furthering such an initiative would increase awareness in the industry, stimulating manufacturers to have their equipment tested in accordance with the ASTM test methods in other U.S. laboratories. The objective in developing a comprehensive database is to support continuing efforts to raise the minimum efficiency standards of commercial cooking appliances in California and to further the expansion of the ENERGY STAR® program for commercial foodservice equipment nationwide.
Overall recommendations are as follows:
• Promote the reformation of local and national‐level program standards to more accurately reflect the large contribution of commercial cooking appliances to overall building energy use.
• Increase funding to improve the administration, marketing efforts, education and outreach of such programs that operate in the state.
• Expand the database of standard efficiency cooking appliances in order to facilitate Title 20 minimum efficiency standards.
• Quantify the total energy load and energy efficiency potential of electric commercial cooking equipment.
Based on the appliance demographics and energy savings potential, PIER should focus major research design and development efforts on improving the energy efficiency of underfired broilers, convection ovens, range tops and conveyor ovens. Future state RD&D efforts that are focused on reducing idle energy use and improving part‐load energy efficiency of these appliances will deliver the greatest return for RD&D dollars invested. The RD&D focus needs to
134
not only improve these performance parameters but also reduce the cost premium associated with purchasing more efficient equipment.
By meeting the short‐term and long‐term goals stated in this report, an overall reduction of 98 million therms of the total gas cooking appliance energy load is expected to be achieved. Based on the current average gas utility rate ($1.00/therm), these reductions would amount to a savings of $98 million. The end result of these collaborative marketing, emerging technology and RD&D efforts would be that the installed stock of foodservice equipment would consume much less energy in the future, leading to a reduction in greenhouse gasses and other undesirable emissions.
8.3 Benefits to California Key parties benefitted by the findings and recommendations of this report, include, but are not limited to: California ratepayers (commercial foodservice operators), California Investor‐Owned Utilities (CAIOUs), municipal utilities, local, regional and State governing agencies, and environmental organizations.
The findings and recommendations of this report hold many foreseen benefits for the population of California. The benefits associated with the analysis and findings of this report are seen as comprehensive and thus, have the potential to affect different elements of the statewide commercial foodservice industry. Assist California utility ratepayers in all commercial foodservice market segments to reduce their energy use expenditures by increasing the availability of low‐cost, high efficiency commercial cooking appliances.
This study provides a roadmap for future RD&D efforts in the area of commercial foodservice energy efficiency by increasing the understanding of the scope and magnitude of commercial gas‐fired cooking appliances and their associated energy load, while identifying the strategies for reducing that load through education, promotion, research, development and demonstration. The net result is a substantial reduction in the commercial gas load associated with commercial cooking appliances.
The results are beneficial to gas utilities in California as a resource for the development of marketing strategies to promote energy efficiency programs founded on the analysis of appliance energy load and savings potential in major market segments in the state. This could increase the success of energy efficiency programs targeted at major market segments of commercial foodservices in the state through the utilization of consolidated market intelligence collected and produced during the course of this study.
Local and regional governments can use the information in this study to set priorities for reducing energy loads associated with commercial foodservice which will result in achieving program goals concerning mandated CO2 emission reductions. Identify need for and catalyze the development of demographic information systems integration for energy use reporting purposes in key state demographic agencies (these include educational services, health care & social services, correctional services).

135
The end result would be that the installed stock of foodservice equipment would consume much less energy in the future, reducing the need for additional power generation and leading to a reduction in greenhouse gasses and other undesirable emissions.

136
GLOSSARY
Cooking Energy (kWh or kBtu) ‐ The total energy consumed by an appliance as it is used to cook a specified food product.
Cooking Energy Consumption Rate (kW or kBtu/h) ‐ The average rate of energy consumption during the cooking period.
Cooking Energy Efficiency (%) ‐ The quantity of energy input to the food products; expressed as a percentage of the quantity of energy input to the appliance during the heavy‐, medium‐, and light‐load tests.
Duty Cycle (%) ‐ The average energy consumption rate (based on a specified operating period for the appli¬ance) expressed as a percentage of the measured energy input rate. Also referred to as load factor.
Energy Input Rate (kW or kBtu/h) ‐ The peak rate at which an appliance will consume energy, typically reflected during preheat. Also referred to as Energy Consumption Rate or Energy Rate.
Heating Value (Btu/ft3) ‐ The quantity of heat (energy) generated by the combustion of fuel. For natural gas, this quantity varies depending on the constituents of the gas. Also referred to as Heat Content.
Idle Energy Rate (kW or Btu/h) ‐ The rate of appliance energy consumption while it is holding or maintaining a stabilized operating condition or temperature. Also referred to as Idle Rate.
Idle Temperature (°F, Setting) ‐ The temperature of the cooking cavity/surface (selected by the appliance operator or specified for a controlled test) that is maintained by the appliance under an idle condition.
Idle Duty Cycle (%) ‐ The idle energy consumption rate expressed as a percentage of the measured energy input rate. Also referred to as Idle Energy Factor.
Measured Input Rate (kW or Btu/h) ‐ The maximum or peak rate at which an appliance consumes energy, typically reflected during appliance preheat (i.e., the period of operation when all burners or elements areʺonʺ).
Pilot Energy Rate (kBtu/h) ‐ The rate of energy consumption by the standing or constant pilot while the appliance is not being operated (i.e., when the thermostats or control knobs have been turned off by the food service operator).
Preheat Energy (kWh or Btu) ‐ The total amount of energy consumed by an appliance during the preheat period.
Preheat Rate (°F/min) ‐ The rate at which the cook zone heats during a preheat.
137
Preheat Time (minute) ‐ The time required for an appliance to ʺpre‐heatʺ from the ambient room temperature (75 ± 5°F) to a specified (and calibrated) operating temperature or thermostat set point.
Production Capacity (lb/h) ‐ The maximum production rate of an appliance while cooking a specified food product in accordance with the heavy‐load cooking test.
Production Rate (lb/h) ‐The average rate at which an appliance brings a specified food product to a specifiedʺcookedʺ condition.
Rated Energy Input Rate (kW, W or Btu/h, Btu/h) ‐ The maximum or peak rate at which an appliance consumes energy as rated by the manufacturer and specified on the nameplate. Also referred to as Nameplate Energy Input Rate.
Recovery Time (minute, second) ‐ The average time from the removal of the cooked food product until the appliance has returned to a specified ready‐to‐cook condition.
Test Method ‐ A definitive procedure for the identification, measurement, and evaluation of one or more qualities, characteristics, or properties of a material, product, system, or service that produces a test result.
Typical Day ‐ A sampled day of average appliance usage based on observations and/or operator inter‐views, used to develop an energy cost model for the appliance.
Term Definition ABAG Association of Bay Area Governments AQMD Air Quality Management District ASHRAE American Society of Heating, Refrigerating and
Air‐Conditioning EngineersASTM American Society for Testing and Materials CAIOU California Investor‐Owned Utilities CCC California Community CollegeCDCR California Department of Corrections and
Rehabilitation CEC California Energy Commission CEE Consortium for Energy EfficiencyCEUS California Commercial End‐Use Survey CGRI Canadian Gas Research Institute CPUC California Public Utilities CommissionCSU California State University DOE Department of Energy EISA Energy Independence and Security ActEPA Environmental Protection Agency EPAct Energy Policy Act
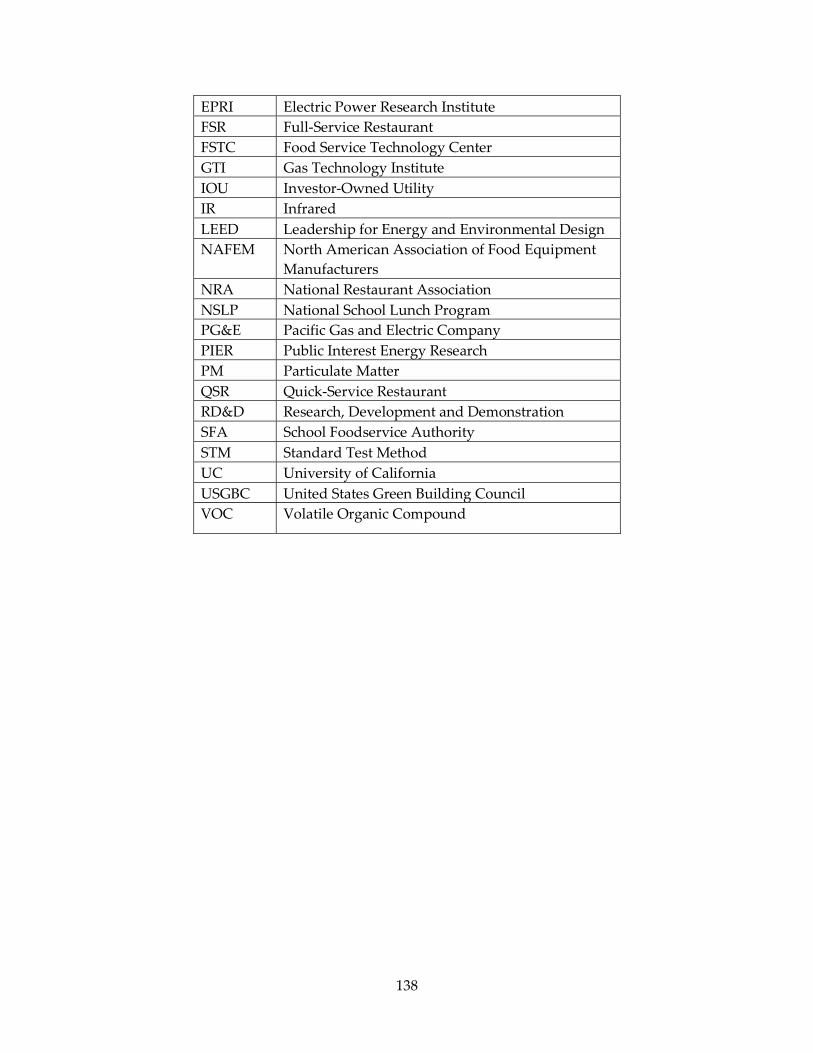
138
EPRI Electric Power Research InstituteFSR Full‐Service Restaurant FSTC Food Service Technology Center GTI Gas Technology Institute IOU Investor‐Owned Utility IR Infrared LEED Leadership for Energy and Environmental Design NAFEM North American Association of Food Equipment
Manufacturers NRA National Restaurant Association NSLP National School Lunch ProgramPG&E Pacific Gas and Electric Company PIER Public Interest Energy Research PM Particulate Matter QSR Quick‐Service Restaurant RD&D Research, Development and Demonstration SFA School Foodservice Authority STM Standard Test Method UC University of California USGBC United States Green Building CouncilVOC Volatile Organic Compound

139
REFERENCES
American Culinary Federation homepage [Internet]. Augustine (FL): American Culinary Federation.org; c2008. Accredited postsecondary programs; 2005 [cited 2009 Nov 13]. Available from:http://www.acfchefs.org/Source/Schools/Postsecondary.cfm?ID=&SECTION=Post_Secondary_properties&AC TIVESECTION=unknown#CA/.
AP‐42 Team (MD 14), Emission Factor and Inventory Group. Compilation of air pollutant emission factors, volume 1: Stationary point and area sources [Internet]. 5th ed. Research Triangle Park (NC): Environmental Protection Agency, Office of Air Quality Planning and Standards, Emissions, Monitoring, and Analysis Division; c1995 [updated 2005 Nov 2]. Introduction to AP‐42, volume 1, fifth edition; [cited 2009 Dec 15]; 10 p. Available from: http://www.epa.gov/ttn/chief/ap42/c00s00.pdf/.
AP‐42 Team (MD 14), Emission Factor and Inventory Group. Compilation of air pollutant emission factors, volume 1: Stationary point and area sources [Internet]. 5th ed. Research Triangle Park (NC): Environmental Protection Agency, Office of Air Quality Planning and Standards, Emissions, Monitoring, and Analysis Division; c1998 [updated 2005 Oct 21]. Chapter 1, External combustion sources, Section 4, natural gas combustion; [cited 2009 Dec 15]; 10 p. Available from: http://www.epa.gov/ttn/chief/ap42/ch01/final/c01s04.pdf/.
Army & Air Force Exchange Service. AAFES western locations [Internet]. Dallas (TX): US Department of Defense; 1999 Jan 1 [updated 2009 Dec 18; cited 2009 Feb 23]. Available from: http://odin.aafes.com/bases/World_Maps/western.asp/.
Association of Zoos & Aquariums [Internet]. Silver Spring, MD: Association of Zoos & Aquariums; c1997‐2009. Find an AZA‐accredited zoo or aquarium: California; 2009 Nov 19 [cited 2009 Feb 6]. Available from: http://www.aza.org/findzooaquarium/.
Boss, Donna. Valley view buffet casino dining & kitchen, valley center, California. Foodservice Equipment & Supplies [Internet]. 2008 Nov 1 [cited 2009 Feb 26]; 4th quarter(11). Available from: http://www.fesmag.com/article/CA6610871.html/.
California Bay Area Air Quality Management District (BAAQMD), Planning, Rules and Research Division. BAAQMD Regulation 6, Rule 2: Commercial Cooking Equipment [Internet]. San Francisco (CA): BAAQMD; 2007 Dec 5 [cited 2009 Dec 15]. 6 p. Available from: http://www.baaqmd.gov/~/media/Files/Planning%20and%20Research/Rules%20and%20Regs/reg%2006/rg0602.ashx/.
California Department of Corrections and Rehabilitation. California Community Correctional Facilities [Internet]. Sacramento (CA): California Department of Corrections and Rehabilitation; 2007 [updated 2007 Mar 23; cited 2009 Jan 26]. Available from: http://www.cdcr.ca.gov/Visitors/Facilities/Community_Correctional_Facilities.html/.
California Department of Corrections and Rehabilitation. California’s Correctional Facilities [Internet]. Sacramento (CA): California Department of Corrections and Rehabilitation; 2008

140
[cited January 26, 2009]. 7 p. Available from: http://www.cdcr.ca.gov/Visitors/docs/20081124‐WEBmapbooklet%202.pdf/.
California Department of Social Services. Emergency Food Assistance Program Homepage [Internet]. Sacramento (CA): California Department of Social Services; 2007 [updated 2007 Mar 23; cited 2009 Jan 12]. Available from: http://www.dss.cahwnet.gov/efap/.
California Department of Social Services. Emergency Food Assistance Program (EFAP): policy and procedure manual [Internet]. Sacramento (CA): California Department of Social Services; 2006 Aug [cited 2009 Jan 7]. Available from: http://www.dss.cahwnet.gov/efap/res/pdf/ProcedureManual.pdf/.
California Senate Bill 12, Escutia School Food Nutrition of 2004, California Education Code Sect. 1‐5(December 4, 2006).
California Restaurant Association (CRA). About the CRA [Internet]. Sacramento (CA): CRA; c2009 [cited 2009 Aug 17]. Available from: http://www.calrest.org/go/CRA/about‐the‐CRA/index.cfm/.
Carbonara, Joseph M. Dining trends impact on foodservice equipment selection. Foodservice Equipment & Supplies [Internet]. 2009 Jan 1 [cited 2009 Feb 26]; 1st quarter(1). Available from: http://www.fesmag.com/article/CA6627052.html/.
CaseNet: your destination source [Internet]. Temecula (CA): Alan Case; [copyright data unknown]. Casino information for southern California; 2009 Oct 12 [cited 2009 Feb 2]. Available from: http://www.casenet.com/concert/casinoinfo.htm/.
Casino City: Your Guide to Gaming Excitement [Internet]. Newton Center (MA): Casino City, Inc.; c1995‐2010. California Casinos and California Gambling; 2010 [cited 2009 Feb 2]. Available from: http://california.casinocity.com/.
Casinos: California [wiki on the Internet]. San Francisco (CA): Wikia, Inc. 2010 [modified 2009 Nov 26; cited 2009 Feb 2]. Available from: http://poker.wikia.com/wiki/Casinos:California/.
Center for Disease Control and Prevention. State‐level school health policies and practices: a state by state summary from the 2006 school health policy and programs study [Internet]. Atlanta (GA) Department of Health and Human Services; 2006 [cited 2009 Feb 26]. Available from: http://www.cdc.gov/HealthyYouth/shpps/2006/summaries/pdf/NS_State_Level_Summaries_SHPPS2006.pdf/.
Claar, C.N., Mazzucchi, R.P., Heidell, J.A. (Department of Architectural Engineering, Pennsylvania State University). The Project on Restaurant Energy Performance (PREP): End‐Use Monitoring and Analysis. Final Report. Washington (DC): US Department of Energy: 1985 May. Prepared for the Office of Building Energy Research and Development
Clinton, G. (Food Production Management, Los Angeles Unified School District. Los Angeles CA. [email protected]). LAUSD Central Kitchen and Prep Kitchen Sites [electronic mail on the Internet]. Message to: Lauren Mills. 2009 Feb 18 [cited 2009 Feb 19]. Accompanied by: 1 Excel file.
141
Coito, Fred & Rufo, Mike (KEMA‐XENERGY Inc., Oakland, CA). California statewide commercial sector natural gas energy efficiency potential study. Final report. San Francisco (CA): Pacific Gas & Electric Company: 2003 May. Study ID; SW061. Supported by the California Public Utilities Commission (CPUC).
CookingSchools.com: directory of cooking & culinary schools and culinary degrees [Internet]. Chicago (IL): Education.org; c2010. Search results for: California; 2009 [cited 2009 Nov 13]. Available from: http://www.cookingschools.com/cgi‐bin/schools/search.cgi?siteId=cookingschools.com®ion=CA/.
Corrections Standards Authority, California Department of Corrections and Rehabilitation. Local corrections in California: responding to critical challenges and complex issues [Internet]. Sacramento (CA): Correctional Standards Authority; 2008. Biennial Report to the Legislature 2006/07‐2007/08. [cited 2009 Nov 16]. Available from: http://www.cdcr.ca.gov/Divisions_Boards/CSA/Admin/Docs/2008_LegislativeReport.pdf/.
Deru, M., Zhivov, “., Fisher, D. et al. ʺImproving Energy Performance of “rmy Dining Facilitiesʺ, “SHR“E Journal, 15 Sep 09, Report No LO‐09‐095
DOE Appliance Standards: http://www1.eere.energy.gov/buildings/appliance_standards/
Doty, Laura. Whole lotta food: bulk preparation and production. Foodservice Equipment & Supplies [Internet]. 2005 Apr 1 [cited 2009 Feb 26]; 2nd quarter(4). Available from: http://www.fesmag.com/article/CA6506963.html/.
Editors. A focus on the future of foodservice. Foodservice Equipment & Supplies [Internet]. 2008 Jan 1 [cited 2009 Feb 26]; 1st quarter(1). Available from: http://www.fesmag.com/article/CA6550089.html/.
EERE: Building Technologies Program Home Page [Internet]. Washington (DC): US Department of Energy; c2010. Appliances & commercial equipment standards: history of federal appliance standards; 2008 Aug 19 [cited 2009 Dec 14]. Available from: http://www1.eere.energy.gov/buildings/appliance_standards/history.html/.
EERE: Building Technologies Program Home Page [Internet]. Washington (DC): US Department of Energy; c2010. Appliances & commercial equipment standards: test procedures for consumer products and certain commercial and industrial equipment; 2008 Jun 20 [cited 2009 Dec 14]. Available from: http://www1.eere.energy.gov/buildings/appliance_standards/commercial_equipment_test_procedures.html/.
Federal Bureau of Prisons. Weekly Population Report [Internet]. Washington D.C.: Federal Bureau of Prisons; 2009 [updated 2009 Jan 8; cited January 26, 2009]. Available from: http://www.bop.gov/locations/weekly_report.jsp/.
Fisher, Don & Delegah, Amin, Characterizing the Energy Efficiency Potential of gas‐fired Commercial Water‐Heating Equipment, ‐or‐ Water Heating Equipment and Systems Characterization: Heating Load and Energy Efficiency Potential in foodservice Facilities

142
Fisher, Don & Karas, Angelo. Demand ventilation in commercial kitchens, an emerging technology: Melink Intelli‐Hood® controls, supermarket application. San Ramon (CA): Food Service Technology Center: 2006. Report No.: 5011.06.13.
Foodservice Equipment & Supplies. November 1, 2008. Accessed: February 26, 2009 < http://www.fesmag.com/article/CA6610871.html>
Fisher, D., Nickel, J., Pieretti, G. et al. (Fisher Consulting, Danville, CA). Cooking Appliance Performance Report. Final Report 1990 May. San Ramon (CA): Pacific Gas & Electric Company: 1990. 179 p. Report No.: 008.1‐90.8.
Gas Foodservice Equipment Network. Gas Foodservice Equipment Network Home Page [Internet]. Worldwide: UniqueBlue; [updated 2009; cited 2009 Nov 5]. Available from: http://www.gfen.com/index.html/.
Guide to California colleges & universities [Internet]. Sacramento (CA): California Postsecondary Education Commission; 2008 [modified 2010; cited 2008 Aug 18]. Available from: http://www.cpec.ca.gov/CollegeGuide/AdvCollegeSearch.asp/.
Hart G. (Hart, McMurphy & Parks, Inc., Middleburg, VA). The Foodservice Industry: A Presentation Package with Supporting Text. Final report. Palo Alto (CA): Electric Power Research Institute; 1988. Project No.: RP2890‐1.
Hildebrand, Andrea. The Vivid Picture Project [Internet]. Portland (OR): Ecotrust; 2004. The California Food System in Numbers: A Fact Sheet. [cited 2009 Jan 13]. Available from: http://www.vividpicture.net/documents/3_CA_Food_System_in_Numbers.pdf/.
Hospitals listing: licensed as of December 31, 2008 [database on the Internet]. Sacramento (CA): California Office of Statewide Health Planning and Development, Healthcare Information Division; 2008 [modified 2010 Jan 14; cited 2009 Jan 9]. Available from: http://www.oshpd.ca.gov/HID/Products/Listings.html#LTC/.
ICF International. Water and energy: leveraging voluntary programs to save both water and energy. Prepared for US Environmental Protection Agency, Climate Protection Partnerships Division and Municipal Support Division. Washington (DC) 2008. 155 p.
Itron, Inc. California commercial end‐use survey. Consultant report. Sacramento (CA): California Energy Commission: 2006. Report No.: CEC‐400‐2006‐005. Contract No.: 300‐00‐002.
Kroger Co. Kroger Fact Book [Internet]. Cincinnati (OH): Kroger Co.; 2007 [cited 2009 Mar 4]. Available from: http://www.thekrogerco.com/finance/documents/2007_KrogerFactBook.pdf/.
Leven, Amelia. K‐12 school foodservice E&S: saved by the.cafeteria? Foodservice Equipment & Supplies [Internet]. 2007 Jan 1 [cited 2009 Feb 26]; 1st quarter(1). Available from: http://www.fesmag.com/article/CA6507062.html).
Leven, Amelia. LEED 2009 and its impact on foodservice equipment selection. Foodservice Equipment & Supplies [Internet]. 2009 Apr 1 [cited 2009 Jul 9]; 2nd quarter(4). Available from: http://www.fesmag.com/article/CA6648482.html/.

143
Long, Cynthia (director of Child Nutrition Division, US Department of Agriculture). Memorandum to: regional directors and state directors of Child Nutrition Programs in all states. 2009 Mar 9. 5 leaves. Located at: USDA Department of Food and Nutrition Service Home Page [Internet], Alexandria (VA). Available from: http://www.fns.usda.gov/FNS/recovery/memos/SP_18‐2009_sa.pdf/. Memo announcing the recipients of federal funds for commercial foodservice equipment upgrades which achieve goals in nutrition and energy efficiency.
Long‐Term health care listing: licensed as of December 31, 2008 [database on the Internet]. Sacramento (CA): California Office of Statewide Health Planning and Development, Healthcare Information Division; 2008 [modified 2010 Jan 14; cited 2009 Jan 9]. Available from: http://www.oshpd.ca.gov/HID/Products/Listings.html#LTC/.
Magness, R. (School Nutrition Programs, California Department of Education. Sacramento CA. [email protected]). Central kitchen data request: cnips central kitchen sites with contact information as of 2009‐01‐29 [electronic mail on the Internet]. Message to: Lauren Mills. 2009 Jan 29 [cited 2009 Jan 29]. Accompanied by: 1 Excel file.
Marine Corps Community Services & Navy Region Southwest. Marine Corps Installations West & Navy Region Southwest, Community Support Programs: 2008‐2009 phone directory [Internet]. Camp Pendleton (CA): Marine Corps Community Services Marketing; 2008 [cited 2009 Feb 23]. Available from: http://www.mccsmcrd.com/Downloads/Phone_Directories/USMC_Navy_Installations_West_Phone_Book_200 8_2009.pdf/.
Marks, Melisa CFSP (Energy Efficiency Customer Programs Supervisor, Southern California Gas Company.) FW: Stimulus Package [electronic mail on the Internet]. Message to: David Zabrowski. 2009 July 5, 10:10 am [cited 2009 Oct 18]. Accompanied by: 1 Excel spreadsheet file.
National Restaurant Association, Research Department (US). 2009 Restaurant industry forecast [Internet]. Washington, DC: National Restaurant Association; 2008 Dec [cited 2009 Feb 13]. 36 p. Subscription required for latest issues. After one year, articles available free from: http://www.restaurant.org/research/forecast.cfm/.
National Restaurant Association (US). NRA Launches Conserve Initiative to Educate and Inspire Restaurants to ʺGo Greenʺ[Internet]. NRA Conserve Solutions for Sustainability 2008 May 18 [cited 2009 Oct 5]; News & Events: [about 2 p.]. Available from: http://conserve.restaurant.org/news/news_20080518_conserve_launch.cfm/.
Nation’s Restaurant News Research. Top 100 Chain and Company Rankings. Nation’s Restaurant News Periodicals. 2008 Jun 30;42(26):69‐144
North American Association of Food Equipment Manufacturers (NAFEM). Equipment and Supply Study: Cooking and Reconstituting Equipment. Vol. 2. Chicago (IL): NAFEM; 1989. 76 p.
North American Association of Food Equipment Manufacturers (NAFEM). Size and shape of the industry study: primary cooking equipment results. 1st ed. Chicago (IL): NAFEM; 2002. 94 p.

144
North American Association of Food Equipment Manufacturers (NAFEM). Size and shape of the industry study: primary cooking equipment results. 2nd ed. Prepared by Fryett Consulting Group & University of
Nevada, Las Vegas’ (UNLV) College of Hotel Administration. Chicago (IL): NAFEM; 2004. 47 p.
North American Association of Food Equipment Manufacturers (NAFEM). NAFEM 2008 size and shape of the industry study: final report. 4th ed. Prepared by Fryett Consulting Group & MPI Group. Chicago (IL): NAFEM; 2008. 79 p.
North American Association of Food Equipment Manufacturers. Foodservice market research sources. Wing, Linda, market research manager. Chicago (IL): NAFEM; 2000 Nov. 24 p.
NPD Group, Inc.: About NPD Group: management and leadership in global market research information [Internet]. Port Washington (NY): NPD Group, Inc.; c2010 [updated 2009 Jul 2; cited 2009 Nov 3]. Available from: http://www.npd.com/profile.html/.
OʹMeara, J. (California HealthCare Foundation. Oakland CA. [email protected]). Residential Care Facilities [electronic mail on the Internet]. Message to: Lauren Mills. 2009 Mar 6. [cited 2009 Mar 16]. Accompanied by: 1 Excel file.
Patel, R., Teagan, P. & Dieckmann, J. (Arthur D. Little, Inc., Cambridge, MA) Characterization of commercial building appliances. Final report. Springfield (VA): Office of Building Technologies (US); 1993. 208 p. ADL Reference No.: 42520. Contract No.: DE‐AC01‐90CE23821. Prepared for the US Department of Energy, Office of Building Technologies, Building Equipment Division.
Private School Directory 2007‐2008 [database on the Internet]. Sacramento (CA): California Department of Education, Educational Demographics Office; 2009 [modified 2009 May 14; cited 2009 Jan 19]. Available from: http://www.cde.ca.gov/ds/si/ps/.
Public School Enrollment Data for 2007‐2008 School Year [database on the Internet]. Sacramento (CA): California Department of Education, Educational Demographics Office; 2009 [modified 2010 Mar 23; cited 2009 Jan 13]. Available from: http://dq.cde.ca.gov/dataquest/dataquest.asp/.
QSR Magazine. Green News Page [Internet]. Chicago: Journalistic Inc.; [updated 2009 Dec 11; cited 2009 Oct 12]. Available from: http://www.qsrmagazine.com/articles/by_topic/green/
Rahbar, S., Fisher D. et al (Canadian Gas Research Institute, Toronto, ON). Technology review of commercial food service equipment. Final report. Ontario: Canadian Gas Research Institute: 1996 May. Prepared for Natural Resources Canada, Energy Efficiency Branch, Residential Regulatory and Information Programs.
Sanchez, M., et al. (Lawrence Berkeley National Laboratory, Environmental Energy Technologies Division, Berkeley, CA). Savings estimates for the ENERGY STAR® voluntary labeling program. Status report 2007 Mar
Sissane, Fred (Division of Resources, Science and Industry, Congressional Research Service, Washington, DC). Energy Independence and Security Act of 2007: A summary of major provisions [Internet]. CRS Report for Congress. Washington (DC): US Senate Committee on

145
Energy and Natural Resources: 2007 Dec 1 [cited 2009 Nov 22]. Available from: http://energy.senate.gov/public/_files/RL342941.pdf/.
Smith, Vernon and Fisher, Donald. Estimating Food Service Loads and Profiles. ASHRAE Transactions. 2001 Oct 3; 107(Pt 2): 1‐18.
SRI International (prepared for California Alliance for Golf). The California Golf Economy Report [Internet]. [location unknown]: Golf 20/20; 2008 Jul [cited 2009 Jan 28]. Available from: http://ucrturf.ucr.edu/topics/cagolf_full_report_jul08.pdf/.
State Energy Data System (SEDS): California commercial sector energy price and expenditure estimates [database on the Internet]. Washington (DC): US Department of Energy, Energy Information Administration. 1970‐2007 [cited 2009 Nov 24]. Available from: http://www.eia.doe.gov/emeu/states/_seds.html/.
State Telephone Directory [database retrieval system on the Internet]. Rancho Cordova (CA): Office of Technology Services; 2009 [modified 2007 Jan 25; cited 2009 mar 26]. Available from: http://www.cold.ca.gov/agency_lookup.asp/.
Student demographics by academic year [database retrieval system on the Internet]. Sacramento (CA): California Community Colleges Chancellor’s Office. 2007‐2008 [cited 2008 Aug 18]. Available from:https://misweb.cccco.edu/mis/onlinestat/studdemo_annual_college.cfm/.
Theme Park City: Theme Parks, Amusement Parks, Waterparks, Carnivals, and Zoos Online [Internet]. [location unknown]: Theme Park City; c2001‐2007. California amusement parks, theme parks, waterparks & zoos; 2009 [cited 2009 Feb 5]. Available from: http://www.themeparkcity.com/USA_CA.htm/.
USA Museums Database [Internet]. Oakland (CA): International Council of Museums; [copyright date unknown]. Museums in the USA: In the state of California (187 total); 2006 Sep 1 [cited 2009 Jan 19] . Available from: http://www.museumca.org/cgi‐bin/cgiwrap/museumca/usa_search.cgi?state=ca/.
US Census Bureau. County Business Patterns 2004: California. Washington (DC); US Census Bureau; 2006 June. 334 p. Report No.: CBP/04‐6. Supported by the US Department of Commerce, Economics and Statistics Administration.
Ventura County Sherriff’s Department Home Page [Internet]. Ventura (C“): Ventura County Sherriff’s Department; c2010. Todd Road Jail; [cited 2009 Nov 16]. Available from: http://www.vcsd.org/sub‐todd‐road‐ jail.php/.
Washington (DC): US Department of Energy: 2007. Report No.: LBNL‐56380. Contract No.: DE‐AC03‐ 76SF00098. Supported by the US Environmental Protection Agency, Climate Protection Division, Office of Air and Radiation.
Wee, Kelly J. (Director of Compliance and Enforcement, California Bay Area Air Quality Management District). Compliance Advisory to: restaurant owners and operators. Subject: New requirements for restaurants with chain‐driven charbroilers. 2008 Nov 26. 2 leaves. Located at:

146
Bay Area Air Quality Management District Home Page [Internet], San Francisco (CA). [no longer available online].
Wee, Kelly J. (Director of Compliance and Enforcement, California Bay Area Air Quality Management District). Compliance Advisory to: restaurant owners and operators. Subject: Requirements for restaurants with new under‐fired charbroilers. 2009 Aug 3. 2 leaves. Located at: Bay Area Air Quality Management District Home Page [Internet], San Francisco (CA). Available from: http://www.baaqmd.gov/~/media/Files/Compliance%20and%20Enforcement/Advisories/Restaurants/Under‐ fired‐charbroilers‐advisory.ashx/.
Wee, Kelly J. (Director of Compliance and Enforcement, California Bay Area Air Quality Management District). Compliance Advisory to: manufacturers of emission control devices for under‐fired charbroilers, restaurant suppliers and consultants. Subject: Certification requirements for emission control devices. 2009 Aug 3. 2 leaves. Located at: Bay Area Air Quality Management District Home Page [Internet], San Francisco (CA). Available from: http://www.baaqmd.gov/~/media/Files/Compliance%20and%20Enforcement/Advisories/Restaurants/Advisor y‐for‐Manufacturers.ashx/.
White, Lisa. Assisted living centers. Foodservice Equipment & Supplies [Internet]. 2007 Dec 1 [cited 2009 Feb 26]; 4th quarter (12). Available from: http://www.fesmag.com/article/CA6549990.html/.
White, Lisa. Getting educated on K‐12 foodservice. Foodservice Equipment & Supplies [Internet]. 2009 Jan 1 [cited 2009 Feb 26]; 1st quarter (1). Available from: http://www.fesmag.com/article/CA6627055.html/.
White, Lisa. Hospital food goes high end. Foodservice Equipment & Supplies [Internet]. 2008 Aug 1 [cited 2009 Feb 26]; 3rd quarter(8). Available from: http://www.fesmag.com/article/CA6583212.html/.
Wittrock, Donna. Equipment trends in school foodservice. Foodservice Equipment & Supplies [Internet]. 2002 Oct 1 [cited 2009 Nov 13]; 4th quarter (10). Available from: http://www.fesmag.com/article/434345‐ Equipment_Trends_In_School_Foodservice.php/.
World Stadiums [Internet]. Gent, Belgium: World Stadiums; c1997‐2009. Stadiums in the United States: California; 2009 [cited 2009 Feb 12]. Available from: http://www.worldstadiums.com/north_america/countries/united_states/california.shtml/.
World Waterparks Association [Internet]. Overland Park (KS): World Waterparks Association; c1995‐2007. park locator profile: California; 2007 [cited 2009 Feb 5]. Available from: http://www.waterparks.org/parkSearchResults.asp/.

A‐1
APPENDIX A: Summary of Sources Commercial Foodservices
Facility data based on:
ReCount® Restaurant database: [database on CD‐ROM]. Port Washington (NY): NPD Group, Inc.; Spring 2007. 1 CD: black & white, 4 ¾ inches
Educational Services
Public Elementary/Secondary Schools
Facility data based on:
Public School Enrollment Data for 2007‐2008 School Year [database on the Internet]. Sacramento (CA): California Department of Education, Educational Demographics Office; 2009 [modified 2010 Mar 23; cited 2009 Jan 13]. Available from: http://dq.cde.ca.gov/dataquest/dataquest.asp/.
Private Elementary/Secondary Schools
Facility data based on:
Private School Directory 2007‐2008 [database on the Internet]. Sacramento (CA): California Department of Education, Educational Demographics Office; 2009 [modified 2009 May 14; cited 2009 Jan 19]. Available from: http://www.cde.ca.gov/ds/si/ps/.
Postsecondary Schools
Facility data based on:
Guide to California colleges & universities [Internet]. Sacramento (CA): California Postsecondary Education Commission; 2008 [modified 2010; cited 2008 Aug 18]. Available from: http://www.cpec.ca.gov/CollegeGuide/AdvCollegeSearch.asp/.
Student demographics by academic year [database retrieval system on the Internet]. Sacramento (CA): California Community Colleges Chancellor’s Office. 2007‐2008 [cited 2008 Aug 18]. Available from:https://misweb.cccco.edu/mis/onlinestat/studdemo_annual_college.cfm/.
Culinary Programs
Facility data based on:
American Culinary Federation homepage [Internet]. Augustine (FL): American Culinary Federation.org; c2008. Accredited postsecondary programs; 2005 [cited 2009 Nov 13]. Available from:http://www.acfchefs.org/Source/Schools/Postsecondary.cfm?ID=&SECTION=Post_Secondary_properties&ACTIVESECTI ON=unknown#CA/.
A‐2
CookingSchools.com: directory of cooking & culinary schools and culinary degrees [Internet]. Chicago (IL): Education.org; c2010. Search results for: California; 2009 [cited 2009 Nov 13]. Available from: http://www.cookingschools.com/cgi‐bin/schools/search.cgi?siteId=cookingschools.com®ion=CA/.
Commissary Kitchens
Facility data based on:
Clinton, G. (Food Production Management, Los Angeles Unified School District. Los Angeles CA. [email protected]). LAUSD Central Kitchen and Prep Kitchen Sites [electronic mail on the Internet]. Message to: Lauren Mills. 2009 Feb 18 [cited 2009 Feb 19]. Accompanied by: 1 Excel file.
Magness, R. (School Nutrition Programs, California Department of Education. Sacramento CA. [email protected]). Central kitchen data request: CNIPS central kitchen sites with contact information as of 2009‐01‐29 [electronic mail on the Internet]. Message to: Lauren Mills. 2009 Jan 29 [cited 2009 Jan 29]. Accompanied by: 1 Excel file.
Health Care & Social Services
Long Term/Skilled Nursing Facilities
Facility data based on:
Long‐Term health care listing: licensed as of December 31, 2008 [database on the Internet]. Sacramento (CA): California Office of Statewide Health Planning and Development, Healthcare Information Division; 2008 [modified 2010 Jan 14; cited 2009 Jan 9]. Available from: http://www.oshpd.ca.gov/HID/Products/Listings.html#LTC/.
Hospitals
Hospitals listing: licensed as of December 31, 2008 [database on the Internet]. Sacramento (CA): California Office of Statewide Health Planning and Development, Healthcare Information Division; 2008 [modified 2010 Jan 14; cited 2009 Jan 9]. Available from: http://www.oshpd.ca.gov/HID/Products/Listings.html#LTC/.
Facility Residential Care (Independent/ Assisted Living)
Facility data based on:
OʹMeara, J. (California HealthCare Foundation. Oakland CA. [email protected]). Residential Care Facilities [electronic mail on the Internet]. Message to: Lauren Mills. 2009 Mar 6. [cited 2009 Mar 16]. Accompanied by: 1 Excel file.
Soup Kitchen/Commissary Kitchen
Facility data based on:

A‐3
California Department of Social Services. Emergency Food Assistance Program Homepage [Internet]. Sacramento (CA): California Department of Social Services; 2007 [updated 2007 Mar 23; cited 2009 Jan 12]. Available from: http://www.dss.cahwnet.gov/efap/.
Correctional Services
Federal Bureau of Prisons
Facility data based on:
Federal Bureau of Prisons. Weekly Population Report [Internet]. Washington D.C.: Federal Bureau of Prisons; 2009 [updated 2009 Jan 8; cited January 26, 2009]. Available from: http://www.bop.gov/locations/weekly_report.jsp/.
Community Correctional Facilities
Facility data based on:
California Department of Corrections and Rehabilitation. California Community Correctional Facilities [Internet]. Sacramento (CA): California Department of Corrections and Rehabilitation; 2007 [updated 2007 Mar 23; cited 2009 Jan 26]. Available from: http://www.cdcr.ca.gov/Visitors/Facilities/Community_Correctional_Facilities.html/.
State Adult Institutions, Adult Conservation Camps, State Juvenile and Youth Conservation Camps
Facility data based on:
California Department of Corrections and Rehabilitation. California’s Correctional Facilities [Internet]. Sacramento (C“): California Department of Corrections and Rehabilitation; 2008 [cited January 26, 2009]. 7 p. Available from: http://www.cdcr.ca.gov/Visitors/docs/20081124‐WEBmapbooklet%202.pdf/.
County Adult Detention Facilities, County Juvenile Detention Facilities and Juvenile Camps
Facility data and foodservice estimates based on:
Corrections Standards Authority, California Department of Corrections and Rehabilitation. Local corrections in California: responding to critical challenges and complex issues [Internet]. Sacramento (CA): Correctional Standards Authority; 2008. Biennial Report to the Legislature 2006/07‐2007/08. [cited 2009 Nov 16]. Available from: http://www.cdcr.ca.gov/Divisions_Boards/CSA/Admin/Docs/2008_LegislativeReport.pdf/.
Additional facility data based on:
County Grand Jury and Corrections Standards Authority (CSA) investigative reports on local and county detention facilities from the 2006‐08 biennial inspection cycle, Sherriff department and county website listings for 53 California counties, and phone surveys conducted during this study with facility food service managers.

A‐4
Military Services
Military Base/Installation
Facility data based on:
Army & Air Force Exchange Service. AAFES western locations [Internet]. Dallas (TX): US Department of Defense; 1999 Jan 1 [updated 2009 Dec 18; cited 2009 Feb 23]. Available from: http://odin.aafes.com/bases/World_Maps/western.asp/.
Marine Corps Community Services & Navy Region Southwest. Marine Corps Installations West & Navy Region Southwest, Community Support Programs: 2008‐2009 phone directory [Internet]. Camp Pendleton (CA): Marine Corps Community Services Marketing; 2008 [cited 2009 Feb 23]. Available from: http://www.mccsmcrd.com/Downloads/Phone_Directories/USMC_Navy_Installations_West_Phone_Book_2008_2009.pdf.
Recreational Services
Amusement/theme/water parks & zoos
Facility data based on:
Association of Zoos & Aquariums [Internet]. Silver Spring, MD: Association of Zoos & Aquariums; c1997‐2009. Find an AZA‐accredited zoo or aquarium: California; 2009 Nov 19 [cited 2009 Feb 6]. Available from: http://www.aza.org/findzooaquarium/.
Theme Park City: Theme Parks, Amusement Parks, Waterparks, Carnivals, and Zoos Online [Internet]. [location unknown]: Theme Park City; c2001‐2007. California amusement parks, theme parks, waterparks & zoos; 2009 [cited 2009 Feb 5]. Available from: http://www.themeparkcity.com/USA_CA.htm/.
World Waterparks Association [Internet]. Overland Park (KS): World Waterparks Association; c1995‐2007. park locator profile: California; 2007 [cited 2009 Feb 5]. Available from: http://www.waterparks.org/parkSearchResults.asp/.
Stadiums & Arenas
Facility data based on:
World Stadiums [Internet]. Gent, Belgium: World Stadiums; c1997‐2009. Stadiums in the United States: California; 2009 [cited 2009 Feb 12]. Available from: http://www.worldstadiums.com/north_america/countries/united_states/california.shtml/.
Casinos
Facility data based on:
CaseNet: your destination source [Internet]. Temecula (CA): Alan Case; [copyright data unknown]. Casino information for southern California; 2009 Oct 12 [cited 2009 Feb 2]. Available from: http://www.casenet.com/concert/casinoinfo.htm/.
A‐5
Casino City: Your Guide to Gaming Excitement [Internet]. Newton Center (MA): Casino City, Inc.; c1995‐2010. California Casinos and California Gambling; 2010 [cited 2009 Feb 2]. Available from: http://california.casinocity.com/.
Casinos: California [wiki on the Internet]. San Francisco (CA): Wikia, Inc. 2010 [modified 2009 Nov 26; cited 2009 Feb 2]. Available from: http://poker.wikia.com/wiki/Casinos:California/.
Golf Courses and Country Clubs
Facility data based on:
SRI International (prepared for California Alliance for Golf). The California Golf Economy Report [Internet]. [location unknown]: Golf 20/20; 2008 Jul [cited 2009 Jan 28]. Available from: http://ucrturf.ucr.edu/topics/cagolf_full_report_jul08.pdf/.
US Census Bureau. County Business Patterns 2004: California. Washington (DC); US Census Bureau; 2006 June. 334 p. Report No.: CBP/04‐6. Supported by the US Department of Commerce, Economics and Statistics Administration.
Accommodation Services
Hotels/ Other Lodging
Facility data based on information contained in the report, County Business Patterns 2004: California, prepared by U.S. Census Bureau (2006). Additional facility data obtained from the following major chain hotel business websites:
Ayres Hotels Four Seasons Radisson
Best Western Hilton Garden Inn Ramada
Clarion Hilton Hotel Red Roof
Comfort Inn Holiday Inn Renaissance
Courtyard Hyatt Residence Inn
Crowne Plaza Joie de vivre Ritz‐Carlton
Days Inn Kimpton Sheraton
Doubletree Marriott Synxis
Embassy Suites Omni Westin
Fairfield Inn Quality Inn Wyndham
Retail Services
Supermarket/Discount Stores
Facility data based on:

A‐6
Hildebrand, Andrea. The Vivid Picture Project [Internet]. Portland (OR): Ecotrust; 2004. The California Food System in Numbers: A Fact Sheet. [cited 2009 Jan 13]. Available from: http://www.vividpicture.net/documents/3_CA_Food_System_in_Numbers.pdf/.
Kroger Co. Kroger Fact Book [Internet]. Cincinnati (OH): Kroger Co.; 2007 [cited 2009 Mar 4]. Available from: http://www.thekrogerco.com/finance/documents/2007_KrogerFactBook.pdf/.
Additional facility data obtained from the following supermarket/big box retailer business websites:
Albertson IKEA Target
Andronicos Mollie Stone Trader Joes
BelAir Nob Hill Vonʹs
Costco Raleys Walmart
El Super Ralphs Whole Foods
Food 4 Less Ranch 99 Wild Oats
Gelsons Safeway
Holiday Quality Foods Smart & Final
Employee Services
Office Cafeterias
Facility data based on:
State Telephone Directory [database retrieval system on the Internet]. Rancho Cordova (CA): Office of Technology Services; 2009 [modified 2007 Jan 25; cited 2009 mar 26]. Available from: http://www.cold.ca.gov/agency_lookup.asp/.
Corporate headquarters are defined as the physical headquarters of businesses that employ equal to or greater than 200 persons in the state of California as identified by Hoovers Inc. (www.hoovers.com).

B‐1
APPENDIX B: Commercial Facility Descriptions
Table B-1 Independent Quick-Service Restaurants
Group Category Description # Facilities Appliance InventorySandwich Hamburger A Flat Griddle 766 3 French fryers, 2 standard griddles, 1
convection ovenSandwich Hamburger B Charbroiler 192 1 underfired broiler, 3 French fryers, 1
convection ovenSandwich Mexican Mexican 1801 1 underfired broilers, 1 French fryer , 1 standard
griddle, 1 convection oven, 1 range oven, 1 open top range
Sandwich Other Sandwich
subs, roast beef, hot dogs, bakery sandwich, other
sandwich
2266 .5 standard griddle, .1 roll-in rack
Specialty Chicken Chicken 282 2 large vat fryers, 2 pressure fryers, 1 convection oven,
Specialty Pizza Pizza/Italian 1887 1 French fryer, 2 conveyor ovens,Specialty Asian Asian 612 2 French fryers, 3 Chinese rangesSpecialty Other Varied Seafood, potato, etc 210 2 French fryers, 2 standard griddles, 1 range
oven, 1 open top rangeSnack Juice Frozen sweets, juice 877 NA
Snack Donut Donut 1024 2 donut fryer, 1 convection ovenSnack Bagel Bagel 168 1 roll-rack ovenSnack Coffee/Tea Coffee/tea 1989 1 rapid cook ovenSnack Other Snack Bakery snack, other snack 275 2 convection ovens, .1 roll-in rack ovens
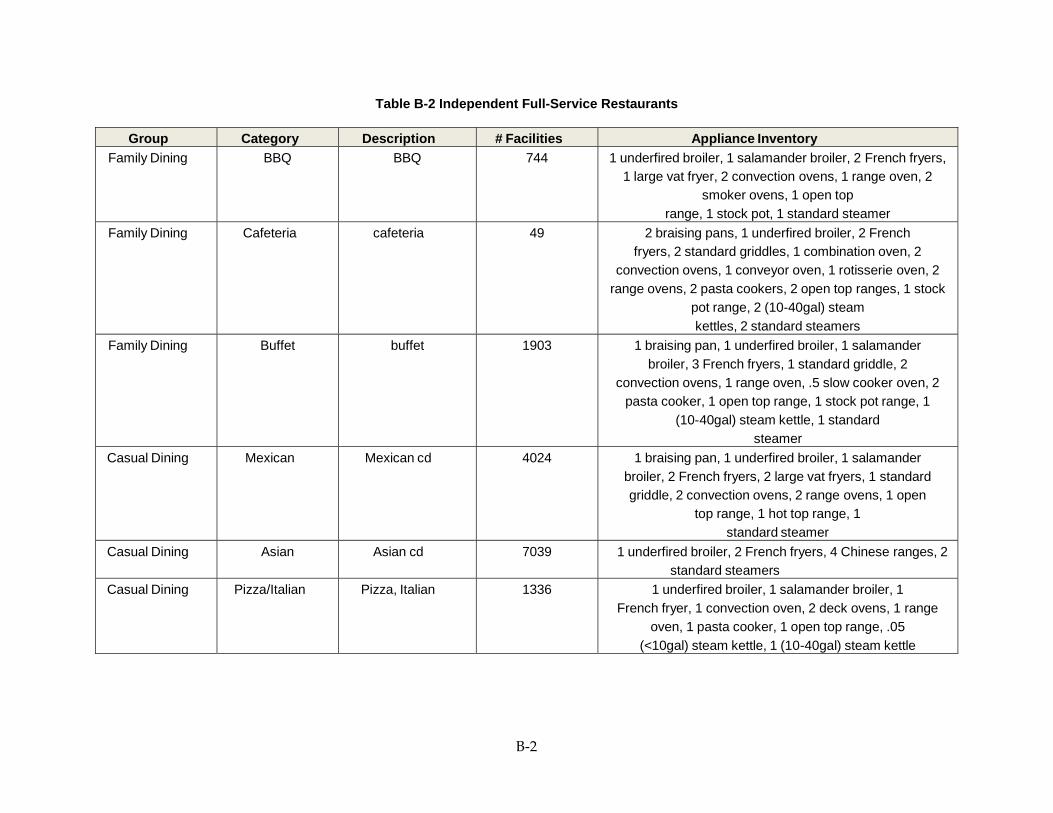
B‐2
Table B-2 Independent Full-Service Restaurants
Group Category Description # Facilities Appliance InventoryFamily Dining BBQ BBQ 744 1 underfired broiler, 1 salamander broiler, 2 French fryers,
1 large vat fryer, 2 convection ovens, 1 range oven, 2 smoker ovens, 1 open top
range, 1 stock pot, 1 standard steamerFamily Dining Cafeteria cafeteria 49 2 braising pans, 1 underfired broiler, 2 French
fryers, 2 standard griddles, 1 combination oven, 2 convection ovens, 1 conveyor oven, 1 rotisserie oven, 2
range ovens, 2 pasta cookers, 2 open top ranges, 1 stock pot range, 2 (10-40gal) steam kettles, 2 standard steamers
Family Dining Buffet buffet 1903 1 braising pan, 1 underfired broiler, 1 salamander broiler, 3 French fryers, 1 standard griddle, 2
convection ovens, 1 range oven, .5 slow cooker oven, 2 pasta cooker, 1 open top range, 1 stock pot range, 1
(10-40gal) steam kettle, 1 standard steamer
Casual Dining Mexican Mexican cd 4024 1 braising pan, 1 underfired broiler, 1 salamander broiler, 2 French fryers, 2 large vat fryers, 1 standard griddle, 2 convection ovens, 2 range ovens, 1 open
top range, 1 hot top range, 1 standard steamer
Casual Dining Asian Asian cd 7039 1 underfired broiler, 2 French fryers, 4 Chinese ranges, 2 standard steamers
Casual Dining Pizza/Italian Pizza, Italian 1336 1 underfired broiler, 1 salamander broiler, 1 French fryer, 1 convection oven, 2 deck ovens, 1 range
oven, 1 pasta cooker, 1 open top range, .05 (<10gal) steam kettle, 1 (10-40gal) steam kettle

B‐3
Group Category Description # Facilities Appliance InventoryCasual Dining Seafood Seafood cd 580 1 underfired broiler, 1 salamander broiler, 3 French
fryers, 1 standard griddle, 2 convection ovens, 1 conveyor oven, 1 pasta cooker, .05
(<10gal) steam kettle, 4 standard steamersCasual Dining Indian Indian 392 2 French fryers, 1 range oven, 1 open top range
Casual Dining American bar/grill, steak/rib, bistro, inn, grill, café, unc restaurant, unc other
10139 1 underfired broiler, 1 salamander broiler, 3 French fryers, 2 standard griddles, 2 convection ovens, 1
deck oven, 1 range oven, .25 slow cook oven, 1 pasta cooker, 1 open top range, 1 stock pot range, 1 (10-
40gal) steam kettle, 1 standard
Casual Dining Other Ethnic CD
french, greek, spanish, other ethnic
1230 1 underfired broiler, 2 French fryers, 1 standard griddle, 2 convection ovens, 1 range oven, 1 open top
range, .05 (<10gal) steam kettle, 1 standard steamer
Fine Dining Steak steak 20 2 upright broilers, 1 underfired broiler, 1 salamander broiler, 1 French fryer, 1 standard griddle, 2
convection ovens, 2 range ovens, .5 slow cook ovens, 1 smoker oven, 2 open top range, 1 stock pot range,
Fine Dining Other FD seafood fd, asian fd, italian fd, french fd, other ethnic fd, varied menu fd
449 1 upright broiler, 1 underfired broiler, 1 salamander broiler, 1 French fryer, 1 combination oven, 1
convection oven, 2 range ovens, 1 open top range, 1 hot top range, 1 stock pot range, .05 (<10gal) steam
kettle, 1 standard steamer, 1 pressure
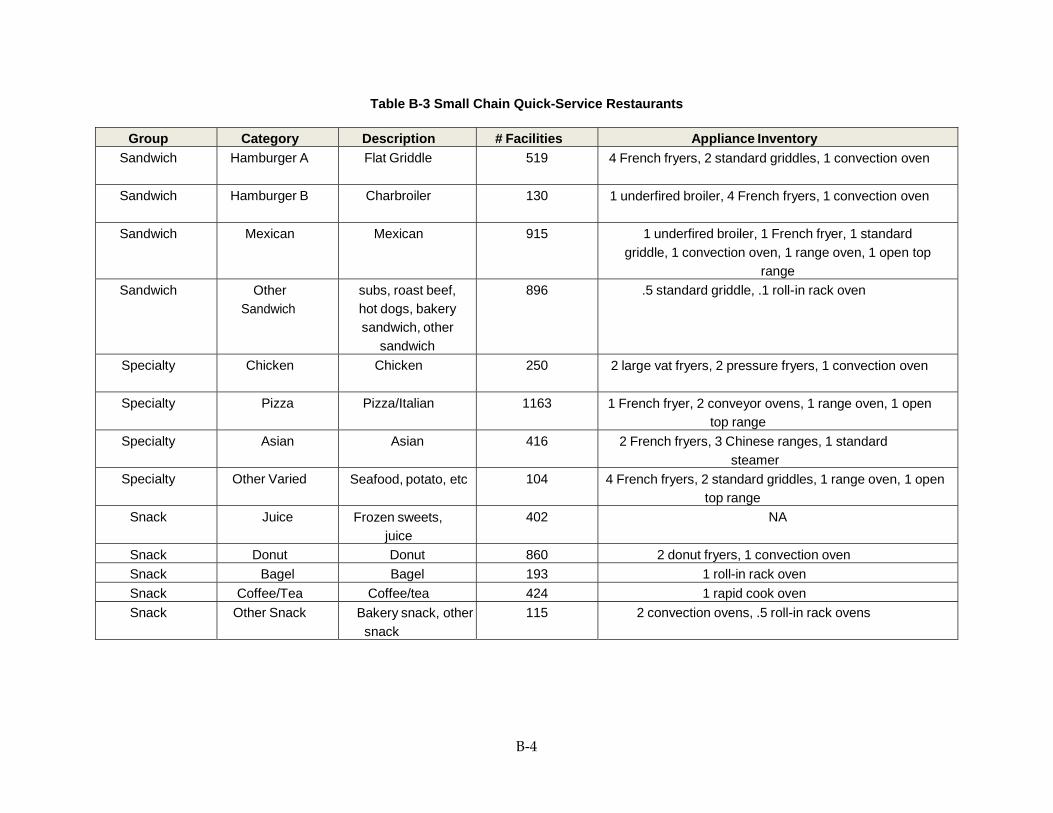
B‐4
Table B-3 Small Chain Quick-Service Restaurants
Group Category Description # Facilities Appliance InventorySandwich Hamburger A Flat Griddle 519 4 French fryers, 2 standard griddles, 1 convection oven
Sandwich Hamburger B Charbroiler 130 1 underfired broiler, 4 French fryers, 1 convection oven
Sandwich Mexican Mexican 915 1 underfired broiler, 1 French fryer, 1 standard griddle, 1 convection oven, 1 range oven, 1 open top
rangeSandwich Other
Sandwich subs, roast beef, hot dogs, bakery sandwich, other
sandwich
896 .5 standard griddle, .1 roll-in rack oven
Specialty Chicken Chicken 250 2 large vat fryers, 2 pressure fryers, 1 convection oven
Specialty Pizza Pizza/Italian 1163 1 French fryer, 2 conveyor ovens, 1 range oven, 1 open top range
Specialty Asian Asian 416 2 French fryers, 3 Chinese ranges, 1 standard steamer
Specialty Other Varied Seafood, potato, etc 104 4 French fryers, 2 standard griddles, 1 range oven, 1 open top range
Snack Juice Frozen sweets, juice
402 NA
Snack Donut Donut 860 2 donut fryers, 1 convection ovenSnack Bagel Bagel 193 1 roll-in rack ovenSnack Coffee/Tea Coffee/tea 424 1 rapid cook ovenSnack Other Snack Bakery snack, other
snack115 2 convection ovens, .5 roll-in rack ovens

B‐5
Table B-4 Small Chain Full-Service Restaurants
Group Category Description # Facilities Appliance InventoryFamily Dining BBQ BBQ 97 1 underfired broiler, 1 salamander broiler, 2 French fryers,
1 large vat fryer, 1 standard griddle, 2 convection ovens, 1 range oven, 2 smoker ovens, 1 open top range, 1 stock
pot range, 1 standard steamer
Family Dining Cafeteria cafeteria 18 2 braising pans, 1 underfired broiler, 2 French fryers, 2 standard griddles, 1 combination oven, 2
convection ovens, 1 conveyor oven, 1 rotisserie oven, 2 range ovens, 2 pasta cookers, 2 open top ranges, 1 stock
pot range, 2 (10-40gal) steam kettles, 2 standard steamers
Family Dining Buffet buffet 692 1 braising pan, 1 underfired broiler, 1 salamander broiler, 3 French fryers, 2 standard griddles, 2
convection ovens, 2 range ovens, .5 slow cook ovens, 2 pasta cookers, 2 open top ranges, 1 stock pot range,
1 (10-40gal) steam kettle, 1 standard steamer
Casual Dining Mexican Mexican cd 1004 1 braising pan, 1 underfired broiler, 1 salamander broiler, 2 French fryers, 2 large vat fryers, 1 standard griddles, 2 convection ovens, 2 range ovens, 1 open
top range, 1 hot top range, 1 standard steamer
Casual Dining Asian Asian cd 785 1 underfired broiler, 2 French fryers, 4 Chinese ranges, 2 standard steamers
Casual Dining Pizza/Italian Pizza, Italian 451 1 underfired broiler, 1 salamander broiler, 1 French fryer, 1 convection oven, 2 deck ovens, 1 range oven, 1 pasta cooker, 1 open top range, .05 (<10gal)
steam kettle, 1 (10-40gal) steam kettle

B‐6
Group Category Description # Facilities Appliance InventoryCasual Dining Seafood Seafood cd 114 1 underfired broiler, 1 salamander broiler, 3 French
fryers, 1 standard griddle, 2 convection ovens, 1 conveyor oven, 2 range ovens, 1 pasta
cooker, 2 open top ranges, 1 (<10gal) steam kettle, 4 standard steamers
Casual Dining Indian Indian 34 0.25 underfired broiler, 2 French fryers, 1 range oven, 1 open top range
Casual Dining American bar/grill, steak/rib, bistro, inn, grill, café, unc restaurant, unc th
658 1 underfired broiler, 1 salamander broiler, 3 French fryers, 2 standard griddles, 2 convection ovens, 1
deck oven, 2 range ovens, .5 slow cook oven, 1 pasta cooker 2 open top ranges 1 stock pot range 1 (10-
Casual Dining Other Ethnic CD
french, greek, spanish, other ethnic
115 1 underfired broiler, 1 salamander broiler, 2 French fryers, 1 standard griddle, 2 convection ovens, 2
range ovens, 2 open top ranges, .05 Fine Dining Steak steak 33 2 upright broilers, 1 underfired broiler, 1 salamander
broiler, 1 French fryer, 1 standard griddle, 2 convection ovens, 2 range ovens, .5 slow cook ovens,
Fine Dining Other FD seafood fd, asian fd, italian fd, french fd, other ethnic fd, varied menu fd
102 1 upright broiler, 1 underfired broiler, 1 salamander broiler, 1 French fryer, 1 combination oven, 1
convection oven, 3 range ovens, 2 open top ranges, 1 hot top range, 1 stock pot range, .05 (<10gal) steam
kettle, 1 standard steamer, 1 pressure steamer
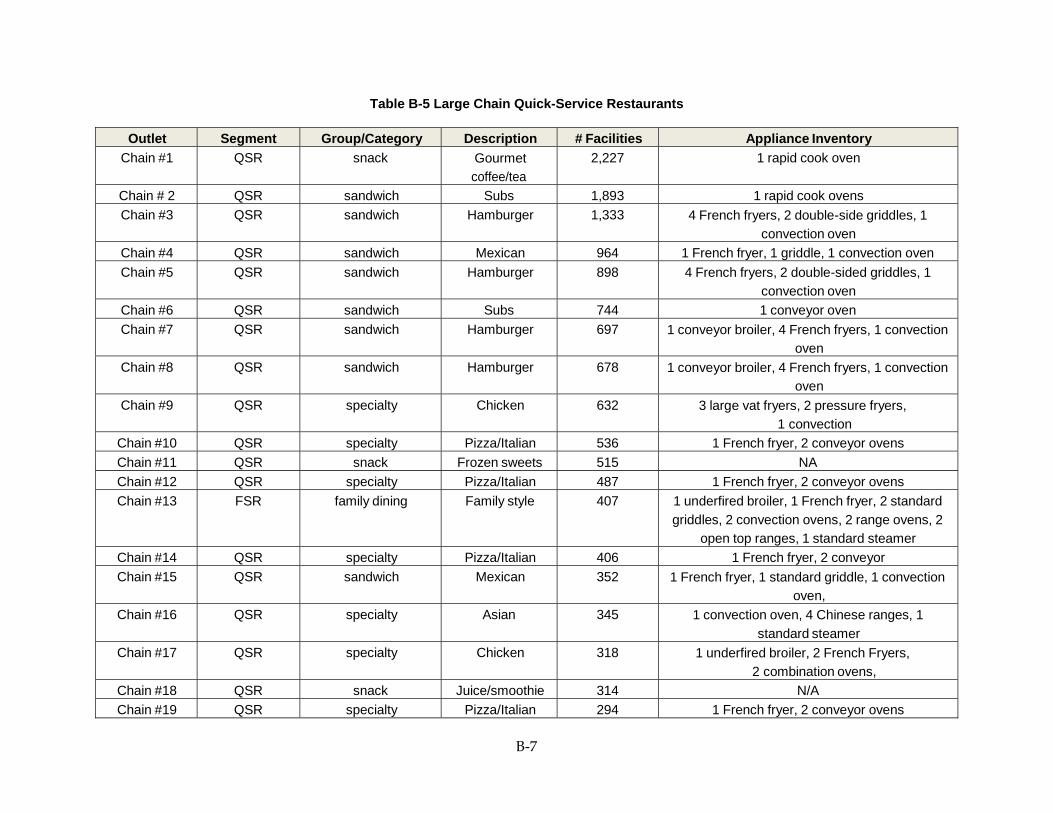
B‐7
Table B-5 Large Chain Quick-Service Restaurants
Outlet Segment Group/Category Description # Facilities Appliance InventoryChain #1 QSR snack Gourmet
coffee/tea2,227 1 rapid cook oven
Chain # 2 QSR sandwich Subs 1,893 1 rapid cook ovensChain #3 QSR sandwich Hamburger 1,333 4 French fryers, 2 double-side griddles, 1
convection ovenChain #4 QSR sandwich Mexican 964 1 French fryer, 1 griddle, 1 convection ovenChain #5 QSR sandwich Hamburger 898 4 French fryers, 2 double-sided griddles, 1
convection ovenChain #6 QSR sandwich Subs 744 1 conveyor ovenChain #7 QSR sandwich Hamburger 697 1 conveyor broiler, 4 French fryers, 1 convection
ovenChain #8 QSR sandwich Hamburger 678 1 conveyor broiler, 4 French fryers, 1 convection
ovenChain #9 QSR specialty Chicken 632 3 large vat fryers, 2 pressure fryers,
1 convectionChain #10 QSR specialty Pizza/Italian 536 1 French fryer, 2 conveyor ovensChain #11 QSR snack Frozen sweets 515 NAChain #12 QSR specialty Pizza/Italian 487 1 French fryer, 2 conveyor ovensChain #13 FSR family dining Family style 407 1 underfired broiler, 1 French fryer, 2 standard
griddles, 2 convection ovens, 2 range ovens, 2 open top ranges, 1 standard steamer
Chain #14 QSR specialty Pizza/Italian 406 1 French fryer, 2 conveyorChain #15 QSR sandwich Mexican 352 1 French fryer, 1 standard griddle, 1 convection
oven,Chain #16 QSR specialty Asian 345 1 convection oven, 4 Chinese ranges, 1
standard steamerChain #17 QSR specialty Chicken 318 1 underfired broiler, 2 French Fryers,
2 combination ovens,Chain #18 QSR snack Juice/smoothie 314 N/AChain #19 QSR specialty Pizza/Italian 294 1 French fryer, 2 conveyor ovens
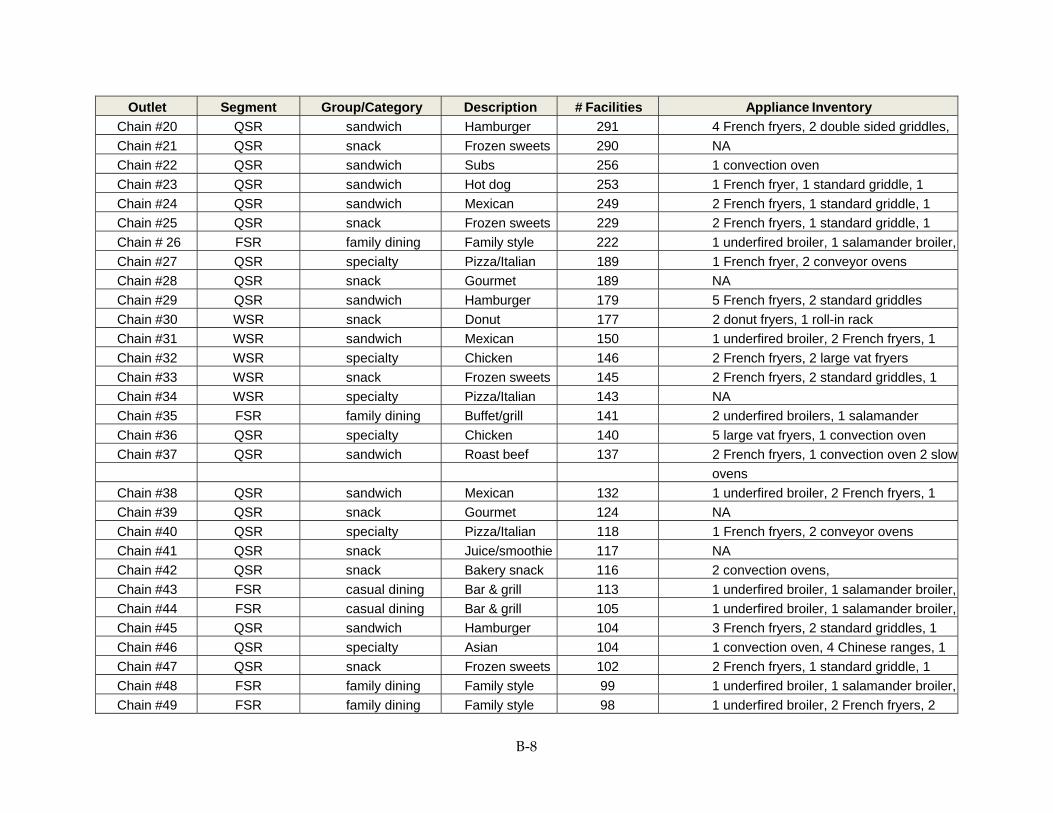
B‐8
Outlet Segment Group/Category Description # Facilities Appliance InventoryChain #20 QSR sandwich Hamburger 291 4 French fryers, 2 double sided griddles, Chain #21 QSR snack Frozen sweets 290 NA Chain #22 QSR sandwich Subs 256 1 convection oven Chain #23 QSR sandwich Hot dog 253 1 French fryer, 1 standard griddle, 1 Chain #24 QSR sandwich Mexican 249 2 French fryers, 1 standard griddle, 1 Chain #25 QSR snack Frozen sweets 229 2 French fryers, 1 standard griddle, 1 Chain # 26 FSR family dining Family style 222 1 underfired broiler, 1 salamander broiler,Chain #27 QSR specialty Pizza/Italian 189 1 French fryer, 2 conveyor ovens Chain #28 QSR snack Gourmet 189 NA Chain #29 QSR sandwich Hamburger 179 5 French fryers, 2 standard griddles Chain #30 WSR snack Donut 177 2 donut fryers, 1 roll-in rack Chain #31 WSR sandwich Mexican 150 1 underfired broiler, 2 French fryers, 1 Chain #32 WSR specialty Chicken 146 2 French fryers, 2 large vat fryers Chain #33 WSR snack Frozen sweets 145 2 French fryers, 2 standard griddles, 1 Chain #34 WSR specialty Pizza/Italian 143 NA Chain #35 FSR family dining Buffet/grill 141 2 underfired broilers, 1 salamander Chain #36 QSR specialty Chicken 140 5 large vat fryers, 1 convection oven Chain #37 QSR sandwich Roast beef 137 2 French fryers, 1 convection oven 2 slow ovens Chain #38 QSR sandwich Mexican 132 1 underfired broiler, 2 French fryers, 1 Chain #39 QSR snack Gourmet 124 NA Chain #40 QSR specialty Pizza/Italian 118 1 French fryers, 2 conveyor ovens Chain #41 QSR snack Juice/smoothie 117 NA Chain #42 QSR snack Bakery snack 116 2 convection ovens, Chain #43 FSR casual dining Bar & grill 113 1 underfired broiler, 1 salamander broiler,Chain #44 FSR casual dining Bar & grill 105 1 underfired broiler, 1 salamander broiler,Chain #45 QSR sandwich Hamburger 104 3 French fryers, 2 standard griddles, 1 Chain #46 QSR specialty Asian 104 1 convection oven, 4 Chinese ranges, 1 Chain #47 QSR snack Frozen sweets 102 2 French fryers, 1 standard griddle, 1 Chain #48 FSR family dining Family style 99 1 underfired broiler, 1 salamander broiler,Chain #49 FSR family dining Family style 98 1 underfired broiler, 2 French fryers, 2

B‐9
Outlet Segment Group/Category Description # Facilities Appliance InventoryChain #50 FSR family dining Barbecue 96 1 underfired broiler, 1 large vat fryer, 1 Chain #51 QSR snack Frozen sweets 95 NA Chain #52 FSR family dining Family style 89 1 underfired broiler, 2 French fryers, 2 Chain #53 QSR specialty Pizza/Italian 88 1 French fryer, 2 conveyor ovens Chain #54 FSR family dining Buffet/grill 87 1 underfired broiler, 2 French fryers, 2 Chain #55 QSR Sandwich Mexican 85 1 French fryer, 1 standard griddle, 1 Chain #56 QSR snack Juice/smoothie 80 NA Chain #57 QSR specialty Asian 80 2 standard griddles, 1 convection oven, 4Chain #58 QSR specialty Pizza/Italian 78 1 French fryer, 2 conveyor ovens Chain #59 QSR specialty Pizza/Italian 77 1 French fryer, 2 conveyor ovens Chain #60 FSR casual dining pizza 77 1 underfired broiler, 1 French fryer, 1 Chain #61 QSR specialty Seafood 76 2 French fryers, 2 large vat fryers, 1 Chain #62 QSR specialty Chicken 75 5 large vat fryers, 1 convection oven Chain #63 QSR snack Gourmet 74 NA Chain #64 QSR snack Bakery snack 73 2 convection ovens Chain #65 QSR sandwich Mexican 72 1 French fryer, 2 standard griddles, 1 Chain #66 QSR sandwich Hot dog 71 1 French fryer, 1 convection oven, 1 Chain #67 FSR casual dining Greek 67 1 underfired broiler, 1 salamander broiler, ovens, 2 range ovens, 2 open top Chain #68 FSR casual dining Mexican-cd 67 1 underfired broiler, 1 salamander broiler,Chain #69 QSR snack Gourmet 63 NA Chain #70 QSR snack Bagel 62 1 roll-in rack oven Chain #71 FSR casual dining Steak/rib 61 2 French fryers, 2 standard griddles, 2 Chain #72 FSR casual dining Bar & grill 60 1 conveyor broiler, 1 underfired broiler, 3 Chain #73 QSR snack Juice/smoothie 60 NA Chain #74 QSR snack Other snack 59 2 convection ovens Chain #75 FSR casual dining Italian 58 1 underfired broiler, 1 salamander broiler,Chain #76 QSR snack Juice/smoothie 57 NA Chain #77 FSR family dining Family style 56 1 underfired broiler, 2 French fryers, 2 Chain #78 QSR snack Gourmet 55 NA Chain #79 QSR snack Frozen sweets 54 NA
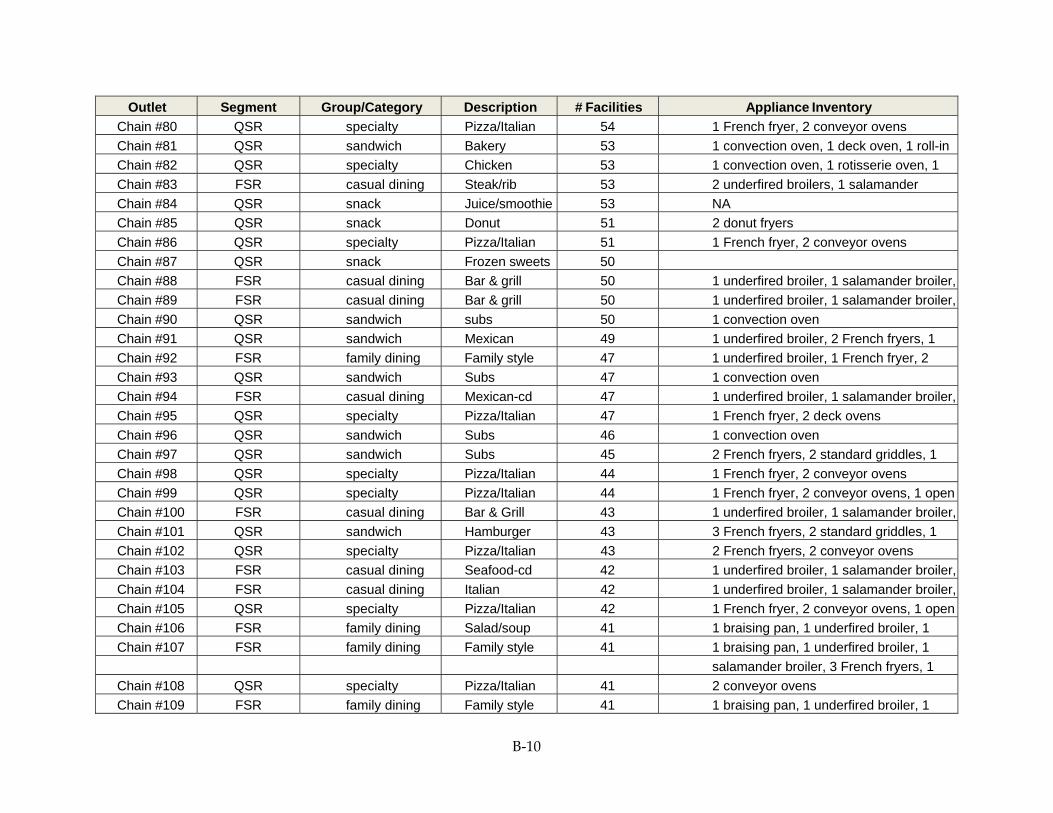
B‐10
Outlet Segment Group/Category Description # Facilities Appliance InventoryChain #80 QSR specialty Pizza/Italian 54 1 French fryer, 2 conveyor ovens Chain #81 QSR sandwich Bakery 53 1 convection oven, 1 deck oven, 1 roll-in Chain #82 QSR specialty Chicken 53 1 convection oven, 1 rotisserie oven, 1 Chain #83 FSR casual dining Steak/rib 53 2 underfired broilers, 1 salamander Chain #84 QSR snack Juice/smoothie 53 NA Chain #85 QSR snack Donut 51 2 donut fryers Chain #86 QSR specialty Pizza/Italian 51 1 French fryer, 2 conveyor ovens Chain #87 QSR snack Frozen sweets 50 Chain #88 FSR casual dining Bar & grill 50 1 underfired broiler, 1 salamander broiler,Chain #89 FSR casual dining Bar & grill 50 1 underfired broiler, 1 salamander broiler,Chain #90 QSR sandwich subs 50 1 convection oven Chain #91 QSR sandwich Mexican 49 1 underfired broiler, 2 French fryers, 1 Chain #92 FSR family dining Family style 47 1 underfired broiler, 1 French fryer, 2 Chain #93 QSR sandwich Subs 47 1 convection oven Chain #94 FSR casual dining Mexican-cd 47 1 underfired broiler, 1 salamander broiler,Chain #95 QSR specialty Pizza/Italian 47 1 French fryer, 2 deck ovens Chain #96 QSR sandwich Subs 46 1 convection oven Chain #97 QSR sandwich Subs 45 2 French fryers, 2 standard griddles, 1 Chain #98 QSR specialty Pizza/Italian 44 1 French fryer, 2 conveyor ovens Chain #99 QSR specialty Pizza/Italian 44 1 French fryer, 2 conveyor ovens, 1 openChain #100 FSR casual dining Bar & Grill 43 1 underfired broiler, 1 salamander broiler,Chain #101 QSR sandwich Hamburger 43 3 French fryers, 2 standard griddles, 1 Chain #102 QSR specialty Pizza/Italian 43 2 French fryers, 2 conveyor ovens Chain #103 FSR casual dining Seafood-cd 42 1 underfired broiler, 1 salamander broiler,Chain #104 FSR casual dining Italian 42 1 underfired broiler, 1 salamander broiler,Chain #105 QSR specialty Pizza/Italian 42 1 French fryer, 2 conveyor ovens, 1 openChain #106 FSR family dining Salad/soup 41 1 braising pan, 1 underfired broiler, 1 Chain #107 FSR family dining Family style 41 1 braising pan, 1 underfired broiler, 1 salamander broiler, 3 French fryers, 1 Chain #108 QSR specialty Pizza/Italian 41 2 conveyor ovens Chain #109 FSR family dining Family style 41 1 braising pan, 1 underfired broiler, 1

B‐11
Outlet Segment Group/Category Description # Facilities Appliance InventoryChain #110 QSR sandwich Hamburger 40 1 underfired broiler, 2 French fryers, 1 Chain #111 QSR sandwich Mexican 40 1 French fryer, 2 standard griddles, 1
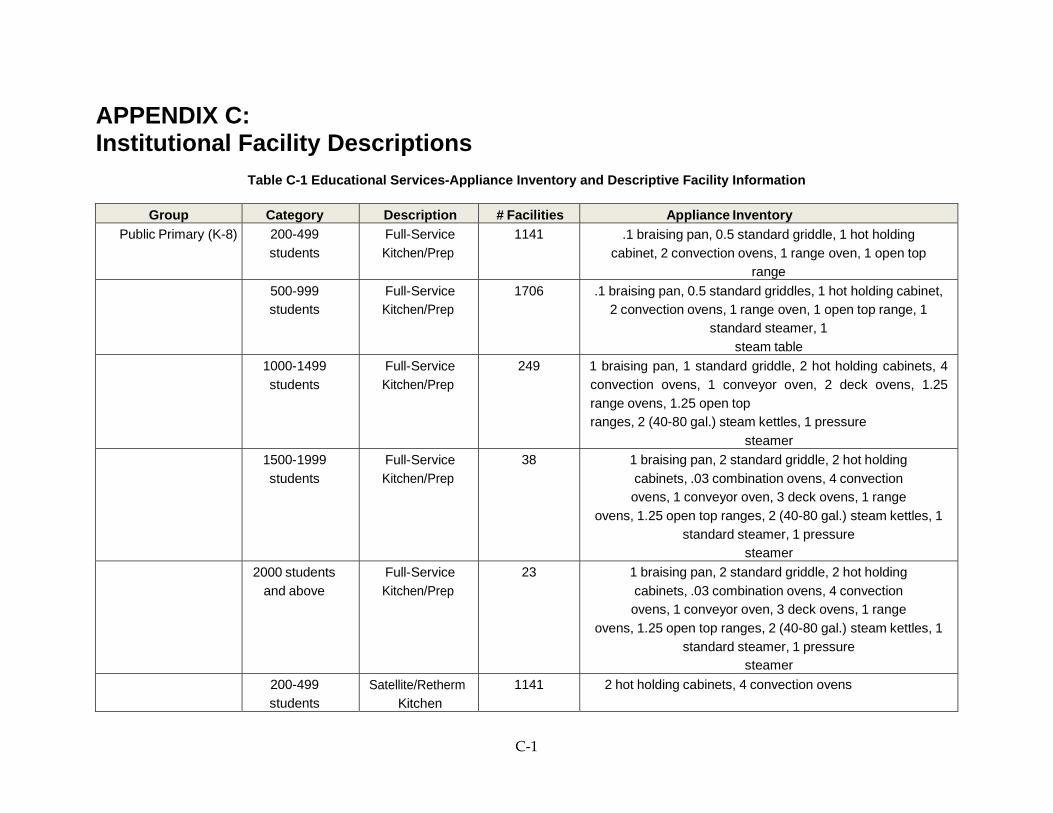
C‐1
APPENDIX C: Institutional Facility Descriptions
Table C-1 Educational Services-Appliance Inventory and Descriptive Facility Information
Group Category Description # Facilities Appliance InventoryPublic Primary (K-8) 200-499
students Full-Service Kitchen/Prep
1141 .1 braising pan, 0.5 standard griddle, 1 hot holding cabinet, 2 convection ovens, 1 range oven, 1 open top
range 500-999
students Full-Service Kitchen/Prep
1706 .1 braising pan, 0.5 standard griddles, 1 hot holding cabinet, 2 convection ovens, 1 range oven, 1 open top range, 1
standard steamer, 1 steam table
1000-1499 students
Full-Service Kitchen/Prep
249 1 braising pan, 1 standard griddle, 2 hot holding cabinets, 4 convection ovens, 1 conveyor oven, 2 deck ovens, 1.25 range ovens, 1.25 open top ranges, 2 (40-80 gal.) steam kettles, 1 pressure
steamer 1500-1999
students Full-Service Kitchen/Prep
38 1 braising pan, 2 standard griddle, 2 hot holding cabinets, .03 combination ovens, 4 convection ovens, 1 conveyor oven, 3 deck ovens, 1 range
ovens, 1.25 open top ranges, 2 (40-80 gal.) steam kettles, 1 standard steamer, 1 pressure
steamer 2000 students
and above Full-Service Kitchen/Prep
23 1 braising pan, 2 standard griddle, 2 hot holding cabinets, .03 combination ovens, 4 convection ovens, 1 conveyor oven, 3 deck ovens, 1 range
ovens, 1.25 open top ranges, 2 (40-80 gal.) steam kettles, 1 standard steamer, 1 pressure
steamer 200-499
students Satellite/Retherm
Kitchen1141 2 hot holding cabinets, 4 convection ovens
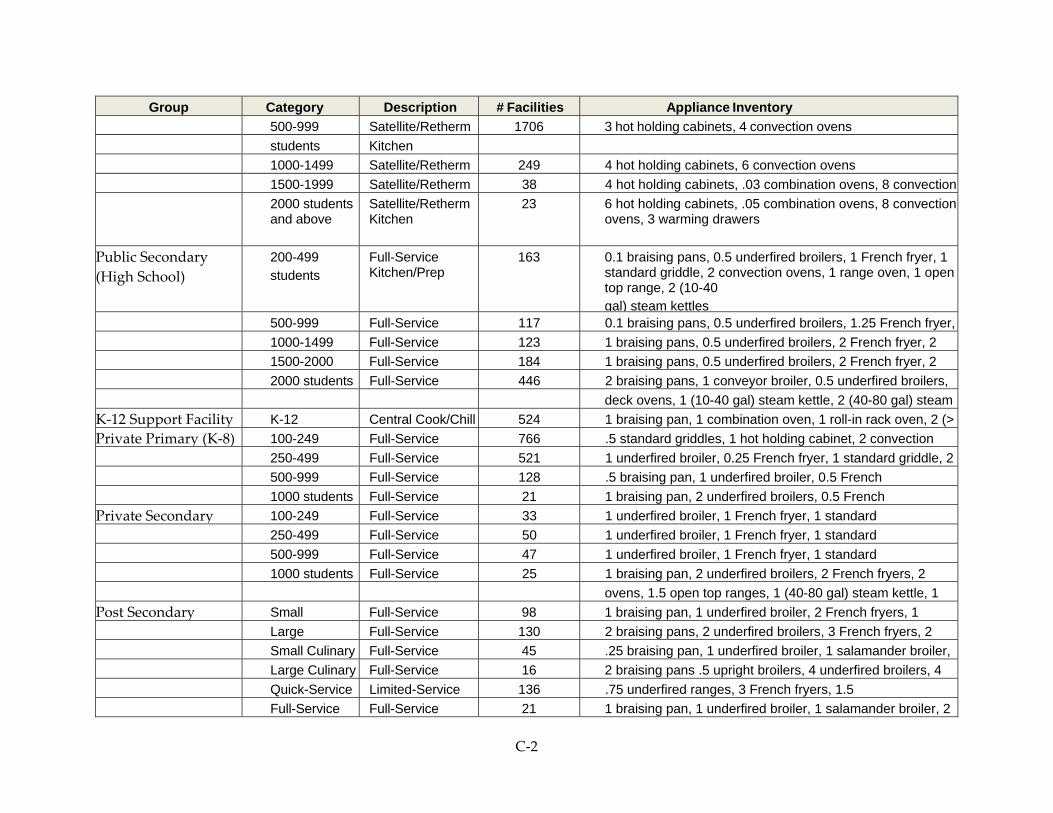
C‐2
Group Category Description # Facilities Appliance Inventory 500-999 Satellite/Retherm 1706 3 hot holding cabinets, 4 convection ovens students Kitchen 1000-1499 Satellite/Retherm 249 4 hot holding cabinets, 6 convection ovens 1500-1999 Satellite/Retherm 38 4 hot holding cabinets, .03 combination ovens, 8 convection 2000 students
and above Satellite/Retherm Kitchen
23 6 hot holding cabinets, .05 combination ovens, 8 convectionovens, 3 warming drawers
Public Secondary (High School)
200-499 students
Full-Service Kitchen/Prep
163 0.1 braising pans, 0.5 underfired broilers, 1 French fryer, 1 standard griddle, 2 convection ovens, 1 range oven, 1 opentop range, 2 (10-40 gal) steam kettles
500-999 Full-Service 117 0.1 braising pans, 0.5 underfired broilers, 1.25 French fryer, 1000-1499 Full-Service 123 1 braising pans, 0.5 underfired broilers, 2 French fryer, 2 1500-2000 Full-Service 184 1 braising pans, 0.5 underfired broilers, 2 French fryer, 2 2000 students Full-Service 446 2 braising pans, 1 conveyor broiler, 0.5 underfired broilers, deck ovens, 1 (10-40 gal) steam kettle, 2 (40-80 gal) steam K‐12 Support Facility K-12 Central Cook/Chill 524 1 braising pan, 1 combination oven, 1 roll-in rack oven, 2 (> Private Primary (K‐8) 100-249 Full-Service 766 .5 standard griddles, 1 hot holding cabinet, 2 convection 250-499 Full-Service 521 1 underfired broiler, 0.25 French fryer, 1 standard griddle, 2 500-999 Full-Service 128 .5 braising pan, 1 underfired broiler, 0.5 French 1000 students Full-Service 21 1 braising pan, 2 underfired broilers, 0.5 French Private Secondary 100-249 Full-Service 33 1 underfired broiler, 1 French fryer, 1 standard 250-499 Full-Service 50 1 underfired broiler, 1 French fryer, 1 standard 500-999 Full-Service 47 1 underfired broiler, 1 French fryer, 1 standard 1000 students Full-Service 25 1 braising pan, 2 underfired broilers, 2 French fryers, 2 ovens, 1.5 open top ranges, 1 (40-80 gal) steam kettle, 1 Post Secondary Small Full-Service 98 1 braising pan, 1 underfired broiler, 2 French fryers, 1 Large Full-Service 130 2 braising pans, 2 underfired broilers, 3 French fryers, 2 Small Culinary Full-Service 45 .25 braising pan, 1 underfired broiler, 1 salamander broiler, Large Culinary Full-Service 16 2 braising pans .5 upright broilers, 4 underfired broilers, 4 Quick-Service Limited-Service 136 .75 underfired ranges, 3 French fryers, 1.5 Full-Service Full-Service 21 1 braising pan, 1 underfired broiler, 1 salamander broiler, 2

C‐3
Group Category Description # Facilities Appliance Inventory fryer, 1 standard griddle, 4 convection ovens, 1 conveyor
Table C-2 Health Care & Social Segment-Appliance Inventory and Descriptive Facility Information
Group Category Description # Facilities Appliance InventoryLong-Term/
Skilled Nursing 1-49 beds Full-Service
Kitchen/Prep203 1 standard griddle, 1 convection oven, 1 range oven, 1
open top range, 1 standard steamerLong-Term/
Skilled Nursing 50-99 beds Full-Service
Kitchen/Prep 653 .5 French fryer, 1 standard griddle, 2 convection ovens, 1
range oven, 1 open top range, 1 standard steamer
Long-Term/ Skilled Nursing
100-249 beds Full-Service Kitchen/Prep
351 .5 braising pan, 1 underfired broiler, .5 French fryer, 2 standard griddles, 1 convection oven, 2 conveyor
ovens, 1 open top range, 3 (< 10 gal) steam kettles, 1 (10-40 gal) steam kettle, 1 (40-80 gal) steam kettle, 2
standard steamers, .5 pressure steamer
Long-Term/ Skilled Nursing
250-499 beds Full-Service Kitchen/Prep
18 1 braising pan, 2 underfired broilers, 2 French fryers, 2 standard griddles, .1 combination oven, 2
convection ovens, 2 conveyor ovens, 1 range oven, 1 open top range, 2 (10-40 gal) steam
kettles, 1 (40-80 gal) steam kettle, 1 pressure steamer
Hospital 1-49 beds Full-Service Kitchen/Prep
89 .5 braising pan, 1 French fryer, 1 standard griddle, 2 convection ovens, 1 range oven, 1 open top range,
1 standard steamerHospital 50-99 beds Full-Service
Kitchen/Prep 111 .5 braising pan, 1 French fryer, 1 standard griddle,
1 range oven, 1 open top range, 1 standard steamer
Hospital 100-249 beds Full-Service 190 1 braising pan, 1 underfired broiler, 2 French

C‐4
Group Category Description # Facilities Appliance Inventory Kitchen/Prep fryers, 2 standard griddles, 1 convection oven, 2
conveyor ovens, 1.5 open top ranges, 3 (<10 gal) steam kettles, 1 (10-40gal) steam kettle, 1 (40-80 gal)
steam kettle, 2 standard steamers, 1 pressure steamer
Hospital 250-499 beds Full-Service Kitchen/Prep
123 1.5 braising pans, 1 upright broiler, 2 underfired broilers, 2 French fryers, 2 standard griddles, 0.1
combination oven, 2 convection ovens, 2 conveyor ovens, 3 deck ovens, 1 range oven, 2 open range tops, 2 (10-40
gal) steam kettles, 1 (40-80 gal) steam kettle, 2 pressure steamers
Hospital 500 beds and above
Full-Service Kitchen/Prep
27 1.5 braising pans, 2 upright broilers, 2 underfired broilers, 2 French fryers, 2 standard griddles, .1
combination oven, 4 convection ovens, 2 conveyor ovens, 3 deck ovens, 1 range oven, 1 open range top, 2 (10-40
gal) steam kettles, 1 (40-80 gal) steam kettle, 2 pressure steamers
Residential Care
(Independent/ Assisted Living)
10-49 beds Full-Service Kitchen/Prep
1226 .25 braising pan, .5 underfired broiler, .25 French fryer, .25 standard griddle, .01 combination oven, 1 convection
oven, 1 range oven, 1 open top range, .1 (<10 gal) steam kettle, .1 (10-40 gal)
steam kettle, .7 standard steamerResidential
Care (Independent/
Assisted Living)
50 beds and above
Full-Service Kitchen/Prep
812 2 braising pans, 1 underfired broiler, 2 French fryers, 1 standard griddle, .25 combination oven,
1.75 convection ovens, 1 range oven, 1.25 open top ranges, .1 (<10 gal) steam kettle, .75 (10-40 gal)
steam kettle, 1 standard steamerCongregate
Feeding Agency
Soup Kitchen/ Commissary
Full-Service Kitchen/Prep
160 1 braising pan, 3 deck ovens, 2 range ovens, 2 open top ranges, 3 stock pot ranges, 1 (10-40 gal) steam kettle, 1
(40-80 gal) steam kettle, .5 standard steamer

C‐5
Table C-3 Correctional Services Segment-Appliance Inventory and Descriptive Facility Information
Group Category Description # Facilities Appliance InventoryFederal Bureau of
Prison Cafeteria Full-Service
Kitchen/Prep13 2 standard griddles, 6 convection ovens, 1 roll-in rack
oven,Community Correctional
Facility
Cafeteria Full-Service Kitchen/Prep
11 2 standard griddles, 6 convection ovens, 1 roll-in rack oven, 1 (40-80 gal) steam kettle, 1 pressure
steamerState Adult Institution
Cafeteria Full-Service Kitchen/Prep
40 .1 braising pan, 8 standard griddles, 6 convection ovens, 1 roll-in rack oven, 2 (40-80 gal) steam kettles, 3 (> 80 gal) steam kettles, 2 pressure
steamersState Adult Institution
Cafeteria Satellite/Retherm Kitchen
114 8 standard griddles, 8 convection ovens, 8 retherm ovens
State Adult Institution
Cafeteria Central Cook/Chill
13 2 roll-in rack ovens, 1 (< 10 gal) steam kettle, 2 (40-80 gal) steam kettles, 6 ( > 80 gal) steam
kettlesConservation
Camp Cafeteria Full-Service
Kitchen/Prep44 1 standard griddle, 2 convection ovens, 1 range oven, 1
open top range,State Juvenile
Institution Cafeteria Full-Service
Kitchen/Prep 6 1 braising pan, 2 standard griddles, 4 convection
ovens, 1 roll-in rack oven, 1 open top range, 1 (10- 40 gal) steam kettle, 2 (40-80 gal) steam kettles, 1 pressure
steamerCounty Adult
Detention Facility
Cafeteria Full-Service Kitchen/Prep
73 2 braising pan, .1 underfired broiler, .1 French fryer, 2 standard griddles, 6 convection ovens, 1.5
open top ranges, 2 ( < 10 gal) steam kettles, 1 (10- 40 gal) steam kettle, 1 pressure steamer
County Adult Detention
Facility
Cafeteria Satellite/Retherm Kitchen
22 1 standard griddle, 4 convection ovens, 6 retherm ovens,
County Adult Detention
Cafeteria Central Cook/Chill
7 1 braising pan, 1 roll-in rack oven, 1 ( < 10 gal) steam kettle, 2 (40-80 gal) steam kettles, 2 (> 80
Facility gal) steam kettles
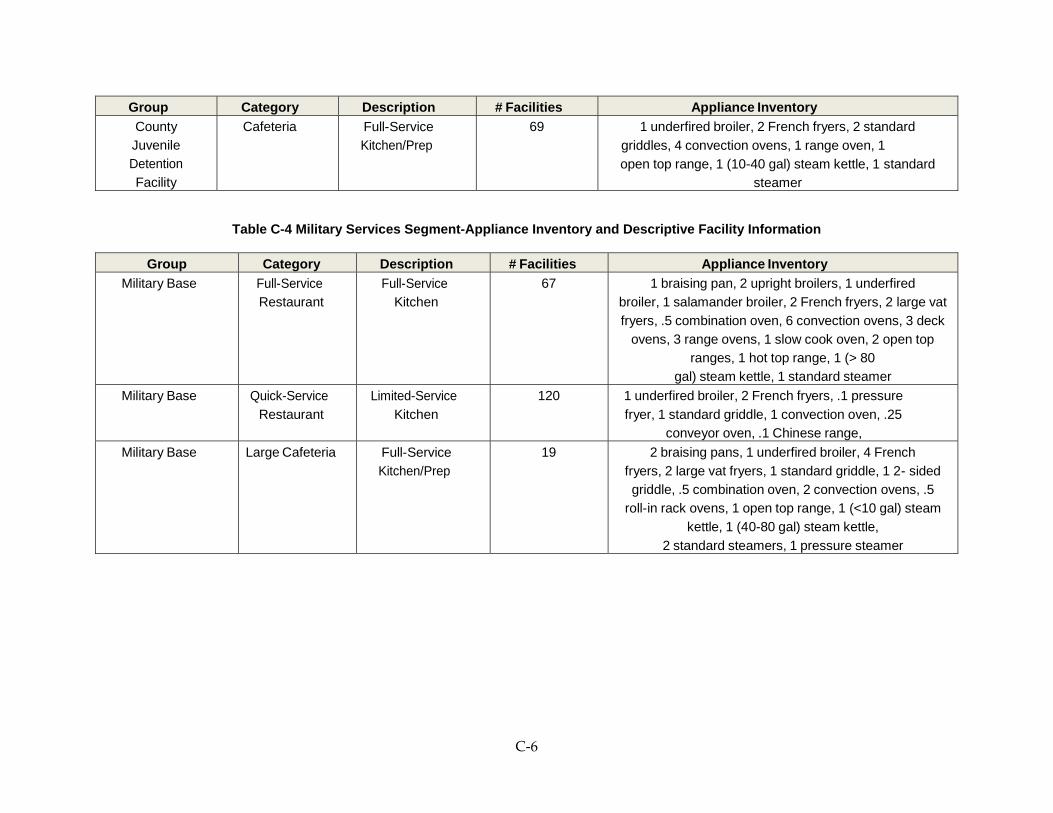
C‐6
Group Category Description # Facilities Appliance InventoryCounty Juvenile Detention Facility
Cafeteria Full-Service Kitchen/Prep
69 1 underfired broiler, 2 French fryers, 2 standard griddles, 4 convection ovens, 1 range oven, 1 open top range, 1 (10-40 gal) steam kettle, 1 standard
steamer
Table C-4 Military Services Segment-Appliance Inventory and Descriptive Facility Information
Group Category Description # Facilities Appliance InventoryMilitary Base Full-Service
Restaurant Full-Service
Kitchen 67 1 braising pan, 2 upright broilers, 1 underfired
broiler, 1 salamander broiler, 2 French fryers, 2 large vat fryers, .5 combination oven, 6 convection ovens, 3 deck
ovens, 3 range ovens, 1 slow cook oven, 2 open top ranges, 1 hot top range, 1 (> 80
gal) steam kettle, 1 standard steamerMilitary Base Quick-Service
Restaurant Limited-Service
Kitchen 120 1 underfired broiler, 2 French fryers, .1 pressure
fryer, 1 standard griddle, 1 convection oven, .25 conveyor oven, .1 Chinese range,
Military Base Large Cafeteria Full-Service Kitchen/Prep
19 2 braising pans, 1 underfired broiler, 4 French fryers, 2 large vat fryers, 1 standard griddle, 1 2- sided griddle, .5 combination oven, 2 convection ovens, .5
roll-in rack ovens, 1 open top range, 1 (<10 gal) steam kettle, 1 (40-80 gal) steam kettle,
2 standard steamers, 1 pressure steamer

C‐7
Table C-5 Accomadation Services Segment-Appliance Inventory and Descriptive Facility Information
Group Category Description # Facilities Appliance InventoryHotel/Motel/Resort/
Lodge/Other Full-Service Restaurant
Full-Service Kitchen
1297 1 braising pan, 4 upright broilers, 1.3 underfired broilers, 1 salamander broiler, 4 French fryers, 1
standard griddle, .1 combination oven, 4 convection ovens, 2 deck ovens, .25 roll-in rack ovens, 2 range ovens, 1 slow cook oven, 1 pasta cooker, 3 open top
ranges, .5 hot top ranges, .25 (<10 gal) steam kettle, 2 standard steamers
Table C-6 Recreational Services Segment-Appliance Inventory and Descriptive Facility Information
Group Category Description # Facilities Appliance InventoryGolf Course/ Country Club
Full-Service Restaurant
Full-Service Kitchen
712 .1 braising pan, 1.3 underfired broilers, 1 salamander broiler, 2 French fryers, 1 large vat fryer, 1 standard griddle, 2 convection ovens, 2 deck ovens, 1 range
oven, .5 slow cook oven, 1 open top range, 1 stock pot range, .05 (<10 gal) steam kettle, .05 (10-40 gal)
steam kettle, 1 standard steamer
Amusement/Theme/ Water Park/Zoo
Quick-Service Restaurant
Limited-Service Kitchen
209 .1 conveyor broiler, 1 underfired broiler, 4 French fryers, 2 standard griddles, 2 conveyor ovens, .1 open
top rangeProfessional
Stadium/ Arena Quick-Service
Restaurant Limited-Service
Kitchen 14 2 conveyor broilers, 2 underfired broilers, 12 French
fryers, 12 large vat fryers, 2 pressure fryers, 4 standard griddles, 1 2-sided griddle, 2 convection
ovens, 2 conveyor ovens, 1 smoker oven, 1 open top range, 2 standard steamers
Multi-Use Stadium/ Arena
Quick-Service Restaurant
Limited-Service Kitchen
38 .5 conveyor broiler, 8 French fryers, 8 large vat fryers, 2 standard griddles, 1 2-sided griddle, 2
convection ovens, 1 standard steamer

C‐8
Group Category Description # Facilities Appliance InventoryStadium/
Arena (College) Quick-Service
RestaurantLimited-Service
Kitchen48 1 underfired broiler, 4 French fryers, 2 standard
griddles,Large Casino
( Hotel/ Resort) Full-Service Restaurant
Full-Service Kitchen
39 2 braising pans, 2 upright broilers, 2 underfired broilers, 4 salamander broilers, 8 French fryers, 2 large vat fryers, 4 standard griddles, 2 combination ovens, 8 convection ovens, 1 conveyor oven, 1 roll-in rack oven, 2 range ovens, 2 slow cook ovens, .5 pasta cooker, 3 open top ranges, 1 hot top range, 1 stock pot range, 2
Chinese ranges, 2 (<10 gal) steam kettles, 2 (10-40 gal) steam kettles, 1 standard
steamer
Small Casino Quick-Service Limited-Service 108 .3 underfired broiler, 2 French fryers, 1 standard(Card Room) Restaurant Kitchen griddle, 1 convection oven, 1 range oven, 1 open top
range, 1 Chinese range,
Table C-7 Retail Services Segment-Appliance Inventory and Descriptive Facility Information
Group Category Description # Facilities Appliance InventoryGrocery Retail Supermarket/
Discount Store Bakery/Rotisserie/ Limited-Service
Kitchen
2239 .05 underfired broiler, 1 donut fryer, .75 large vat fryer, 1.5 pressure fryer, 1 combination oven, 1 roll-in
rack oven, .75 rotisserie oven, .5 rapid cook oven, .1 open top range oven, 1.3 Chinese ranges,
.1 standard steamers

C‐9
Table C-8 Employee Foodservices Segment-Appliance Inventory and Descriptive Facility Information
Group Category Description # Facilities Appliance InventoryOffice Building Small Cafeteria Full-Service
Kitchen/Prep 809 .25 braising pans, .7 underfired broilers, 2 French
fryers, 1 standard griddle, 2 convection ovens, 1 conveyor oven, 3 range ovens, 2 open top ranges,
1 standard steamer
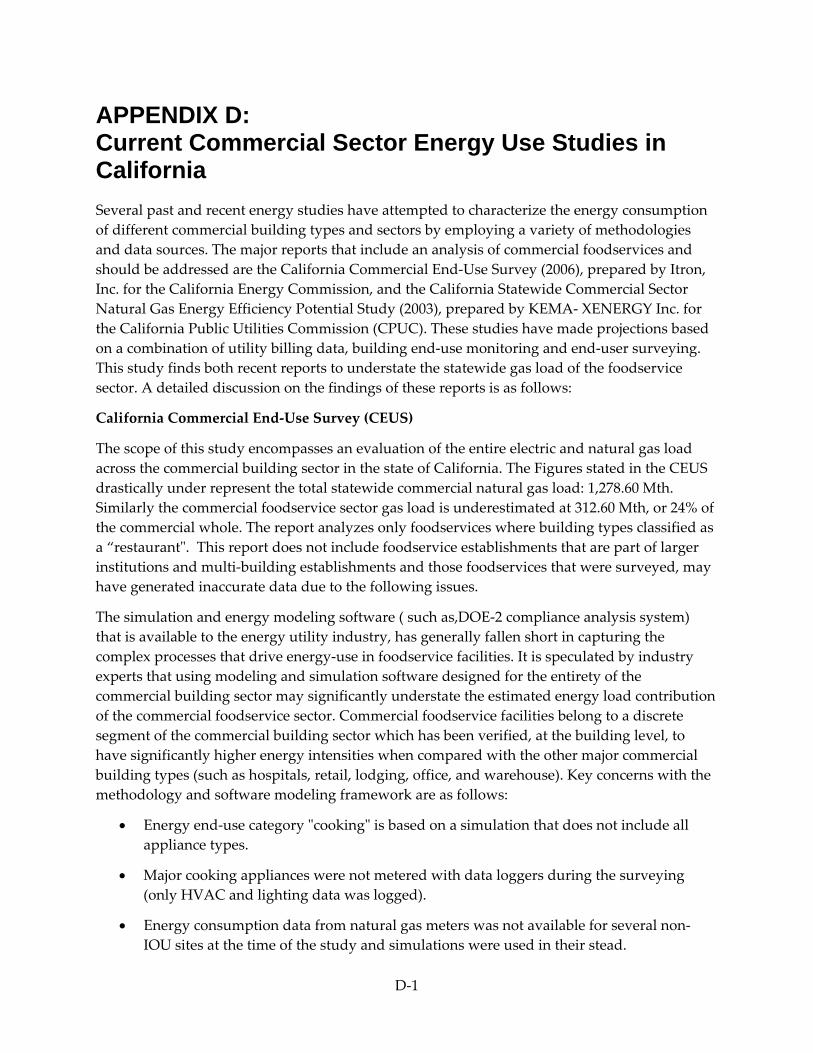
D‐1
APPENDIX D: Current Commercial Sector Energy Use Studies in California Several past and recent energy studies have attempted to characterize the energy consumption of different commercial building types and sectors by employing a variety of methodologies and data sources. The major reports that include an analysis of commercial foodservices and should be addressed are the California Commercial End‐Use Survey (2006), prepared by Itron, Inc. for the California Energy Commission, and the California Statewide Commercial Sector Natural Gas Energy Efficiency Potential Study (2003), prepared by KEMA‐ XENERGY Inc. for the California Public Utilities Commission (CPUC). These studies have made projections based on a combination of utility billing data, building end‐use monitoring and end‐user surveying. This study finds both recent reports to understate the statewide gas load of the foodservice sector. A detailed discussion on the findings of these reports is as follows:
California Commercial End‐Use Survey (CEUS)
The scope of this study encompasses an evaluation of the entire electric and natural gas load across the commercial building sector in the state of California. The Figures stated in the CEUS drastically under represent the total statewide commercial natural gas load: 1,278.60 Mth. Similarly the commercial foodservice sector gas load is underestimated at 312.60 Mth, or 24% of the commercial whole. The report analyzes only foodservices where building types classified as a “restaurantʺ. This report does not include foodservice establishments that are part of larger institutions and multi‐building establishments and those foodservices that were surveyed, may have generated inaccurate data due to the following issues.
The simulation and energy modeling software ( such as,DOE‐2 compliance analysis system) that is available to the energy utility industry, has generally fallen short in capturing the complex processes that drive energy‐use in foodservice facilities. It is speculated by industry experts that using modeling and simulation software designed for the entirety of the commercial building sector may significantly understate the estimated energy load contribution of the commercial foodservice sector. Commercial foodservice facilities belong to a discrete segment of the commercial building sector which has been verified, at the building level, to have significantly higher energy intensities when compared with the other major commercial building types (such as hospitals, retail, lodging, office, and warehouse). Key concerns with the methodology and software modeling framework are as follows:
• Energy end‐use category ʺcookingʺ is based on a simulation that does not include all appliance types.
• Major cooking appliances were not metered with data loggers during the surveying (only HVAC and lighting data was logged).
• Energy consumption data from natural gas meters was not available for several non‐IOU sites at the time of the study and simulations were used in their stead.
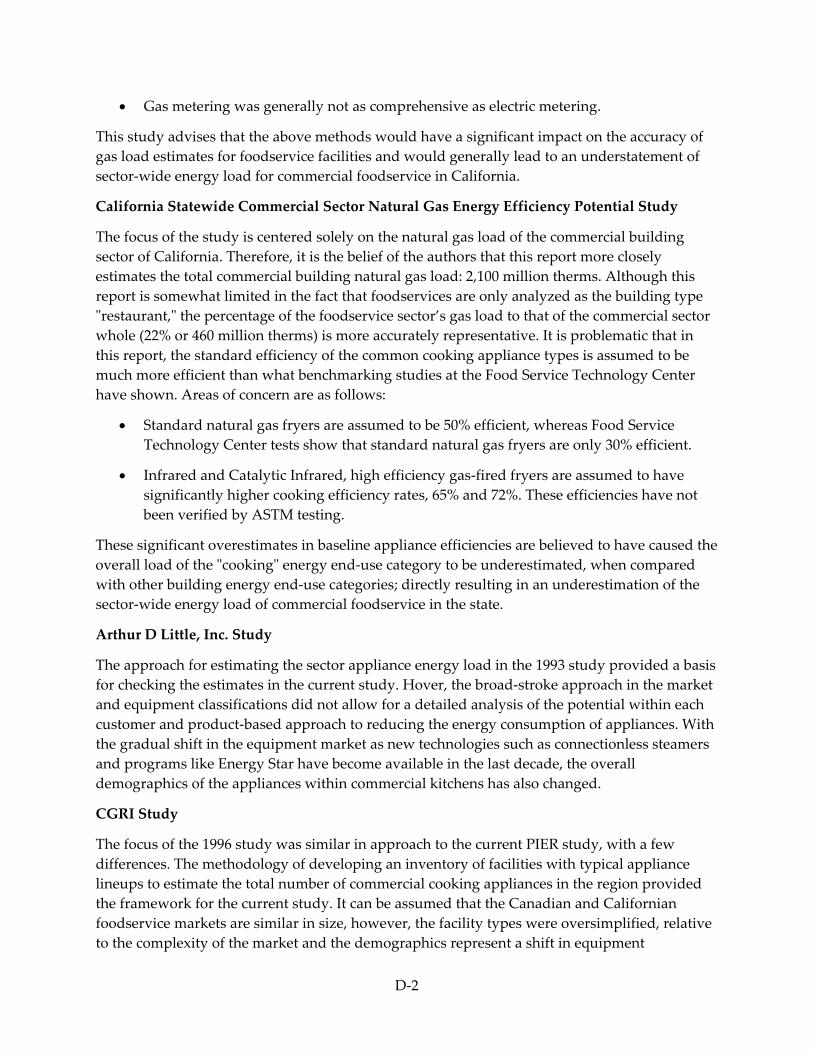
D‐2
• Gas metering was generally not as comprehensive as electric metering.
This study advises that the above methods would have a significant impact on the accuracy of gas load estimates for foodservice facilities and would generally lead to an understatement of sector‐wide energy load for commercial foodservice in California.
California Statewide Commercial Sector Natural Gas Energy Efficiency Potential Study
The focus of the study is centered solely on the natural gas load of the commercial building sector of California. Therefore, it is the belief of the authors that this report more closely estimates the total commercial building natural gas load: 2,100 million therms. Although this report is somewhat limited in the fact that foodservices are only analyzed as the building type ʺrestaurant,ʺ the percentage of the foodservice sector’s gas load to that of the commercial sector whole (22% or 460 million therms) is more accurately representative. It is problematic that in this report, the standard efficiency of the common cooking appliance types is assumed to be much more efficient than what benchmarking studies at the Food Service Technology Center have shown. Areas of concern are as follows:
• Standard natural gas fryers are assumed to be 50% efficient, whereas Food Service Technology Center tests show that standard natural gas fryers are only 30% efficient.
• Infrared and Catalytic Infrared, high efficiency gas‐fired fryers are assumed to have significantly higher cooking efficiency rates, 65% and 72%. These efficiencies have not been verified by ASTM testing.
These significant overestimates in baseline appliance efficiencies are believed to have caused the overall load of the ʺcookingʺ energy end‐use category to be underestimated, when compared with other building energy end‐use categories; directly resulting in an underestimation of the sector‐wide energy load of commercial foodservice in the state.
Arthur D Little, Inc. Study
The approach for estimating the sector appliance energy load in the 1993 study provided a basis for checking the estimates in the current study. Hover, the broad‐stroke approach in the market and equipment classifications did not allow for a detailed analysis of the potential within each customer and product‐based approach to reducing the energy consumption of appliances. With the gradual shift in the equipment market as new technologies such as connectionless steamers and programs like Energy Star have become available in the last decade, the overall demographics of the appliances within commercial kitchens has also changed.
CGRI Study
The focus of the 1996 study was similar in approach to the current PIER study, with a few differences. The methodology of developing an inventory of facilities with typical appliance lineups to estimate the total number of commercial cooking appliances in the region provided the framework for the current study. It can be assumed that the Canadian and Californian foodservice markets are similar in size, however, the facility types were oversimplified, relative to the complexity of the market and the demographics represent a shift in equipment

D‐3
preferences. Furthermore, the appliance energy loads were based on more primitive estimates, using average rated inputs from manufacturer literature and assumed duty cycles. While a simple tool for ballparking energy consumption of an equipment category, the use of duty cycles fails to reflect the range in efficiency within an appliance category. Expanded appliance testing over the past decade has increased the precision of the energy consumption estimates employed in the current study.
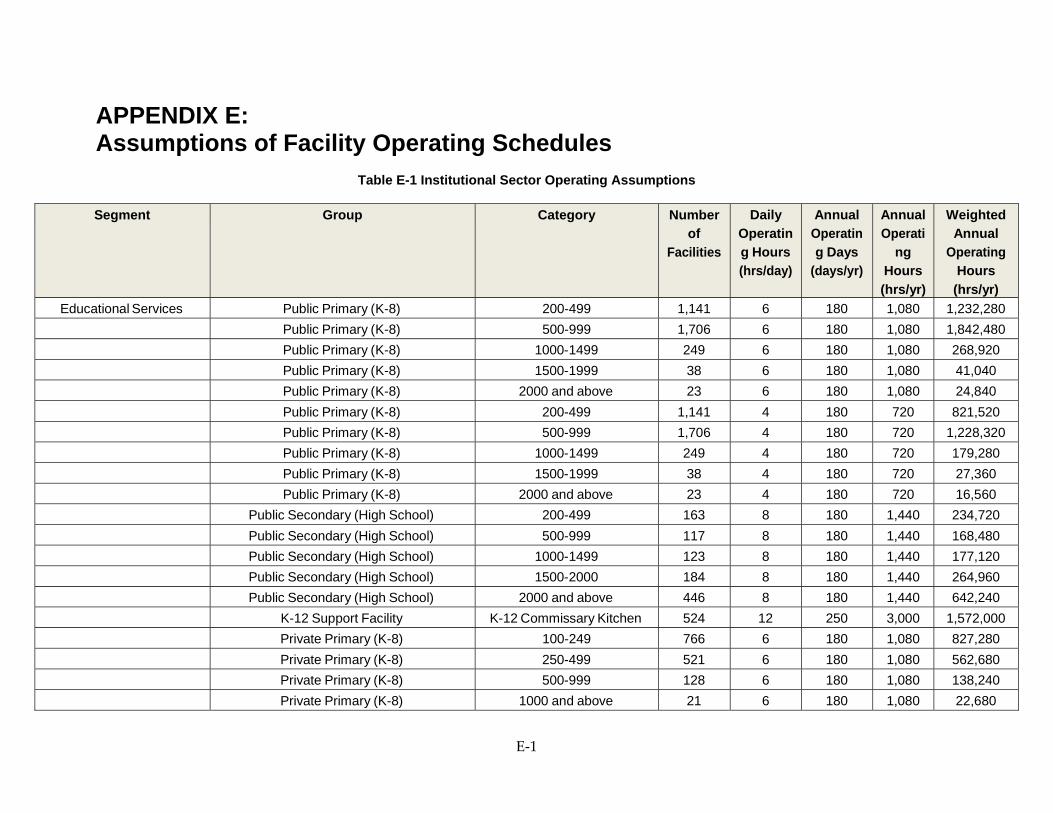
E‐1
APPENDIX E: Assumptions of Facility Operating Schedules
Table E-1 Institutional Sector Operating Assumptions
Segment Group Category Number of
Facilities
Daily Operatin g Hours (hrs/day)
Annual Operatin g Days
(days/yr)
Annual Operati
ng Hours (hrs/yr)
Weighted Annual
Operating Hours (hrs/yr)
Educational Services Public Primary (K-8) 200-499 1,141 6 180 1,080 1,232,280 Public Primary (K-8) 500-999 1,706 6 180 1,080 1,842,480 Public Primary (K-8) 1000-1499 249 6 180 1,080 268,920 Public Primary (K-8) 1500-1999 38 6 180 1,080 41,040 Public Primary (K-8) 2000 and above 23 6 180 1,080 24,840 Public Primary (K-8) 200-499 1,141 4 180 720 821,520 Public Primary (K-8) 500-999 1,706 4 180 720 1,228,320 Public Primary (K-8) 1000-1499 249 4 180 720 179,280 Public Primary (K-8) 1500-1999 38 4 180 720 27,360 Public Primary (K-8) 2000 and above 23 4 180 720 16,560 Public Secondary (High School) 200-499 163 8 180 1,440 234,720 Public Secondary (High School) 500-999 117 8 180 1,440 168,480 Public Secondary (High School) 1000-1499 123 8 180 1,440 177,120 Public Secondary (High School) 1500-2000 184 8 180 1,440 264,960 Public Secondary (High School) 2000 and above 446 8 180 1,440 642,240 K-12 Support Facility K-12 Commissary Kitchen 524 12 250 3,000 1,572,000 Private Primary (K-8) 100-249 766 6 180 1,080 827,280 Private Primary (K-8) 250-499 521 6 180 1,080 562,680 Private Primary (K-8) 500-999 128 6 180 1,080 138,240 Private Primary (K-8) 1000 and above 21 6 180 1,080 22,680

E‐2
Segment Group Category Number of
Facilities
Daily Operatin g Hours (hrs/day)
Annual Operatin g Days
(days/yr)
Annual Operati
ng Hours (hrs/yr)
Weighted Annual
Operating Hours (hrs/yr)
Private Secondary (High School) 100-249 33 8 180 1,440 47,520 Private Secondary (High School) 250-499 50 8 180 1,440 72,000 Private Secondary (High School) 500-999 47 8 180 1,440 67,680 Private Secondary (High School) 1000 and above 25 8 180 1,440 36,000 Post-Secondary School (College + Small Cafeteria 98 10 260 2,600 254,800 University) Post-Secondary School (College +
University)Large Cafeteria 130 12 300 3,600 468,000
Post-Secondary School (College + University)
Small Culinary Program Kitchen
45 6 156 936 42,120
Post-Secondary School (College + University)
Large Culinary Academy Kitchen
16 6 260 1,560 24,960
Post-Secondary School (College + University)
Quick-Service Restaurant 138 9 260 2,340 322,920
Post-Secondary School (College + University)
Full-Service Restaurant 21 9 260 2,340 49,140
Health Care & Social Services
Hospital 1-49 beds 89 10 365 3,650 324,850
Hospital 50-99 beds 111 10 365 3,650 405,150 Hospital 100-249 beds 190 12 365 4,380 832,200 Hospital 250-499 beds 123 12 365 4,380 538,740 Hospital 500 and above 27 14 365 5,110 137,970 Long Term Facilities/Skilled Nursing 1-49 beds 203 8 365 2,920 592,760 Long Term Facilities/Skilled Nursing 50-99 beds 653 8 365 2,920 1,906,760 Long Term Facilities/Skilled Nursing 100-249 beds 351 8 365 2,920 1,024,920 Long Term Facilities/Skilled Nursing 250-499 beds 18 10 365 3,650 65,700

E‐3
Segment Group Category Number of
Facilities
Daily Operatin g Hours (hrs/day)
Annual Operatin g Days
(days/yr)
Annual Operati
ng Hours (hrs/yr)
Weighted Annual
Operating Hours (hrs/yr)
Residential Care (Independent/Assisted Living)
10-49 beds 1,226 10 365 3,650 4,474,900
Residential Care (Independent/Assisted Living)
50 beds and above 812 10 365 3,650 2,963,800
Congregate Feeding Agency Soup Kitchen/Commissary 160 8 150 1,200 192,000 Correctional Services Federal Bureau of Prison Small Cafeteria 13 8 365 2,920 37,960
Community Correctional Facility Large Cafeteria 11 8 365 2,920 32,120 State Adult Institution Large Cafeteria 40 10 365 3,650 146,000 State Adult Institution Large Cafeteria 13 10 250 2,500 32,500 State Adult Institution Large Cafeteria 114 6 365 2,190 249,660 Conservation Camp Small Cafeteria 44 6 365 2,190 96,360 State Juvenile Institution Large Cafeteria 6 8 365 2,920 17,520 County Adult Detention Facility Large Cafeteria 73 10 365 3,650 266,450 County Adult Detention Facility Large Cafeteria 7 10 250 2,500 17,500 County Adult Detention Facility Large Cafeteria 22 6 365 2,190 48,180 County Juvenile Detention Facility Small Cafeteria 69 10 365 3,650 251,850
Military Services Military Base Full-Service Restaurant 67 12 365 4,380 293,460 Military Base Quick-Service Restaurant 120 14 365 5,110 613,200 Military Base Large Cafeteria 19 14 365 5,110 97,090
Accommodation Services Hotel/Motel/Resort/Lodge/Other Full-Service Restaurant 1,297 20 365 7,300 9,468,100 Recreational Services Golf Course/Country Club Full-Service Restaurant 712 8 260 2,080 1,480,960
Amusement/theme/water/zoo Quick-Service Restaurant 207 8 280 2,240 463,680 Professional Stadium/Arena Quick-Service Restaurant 14 6 70 420 5,880 College Stadium/Arena Quick-Service Restaurant 48 6 50 300 14,400 Multi-Use Stadium/Arena Quick-Service Restaurant 38 6 100 600 22,800
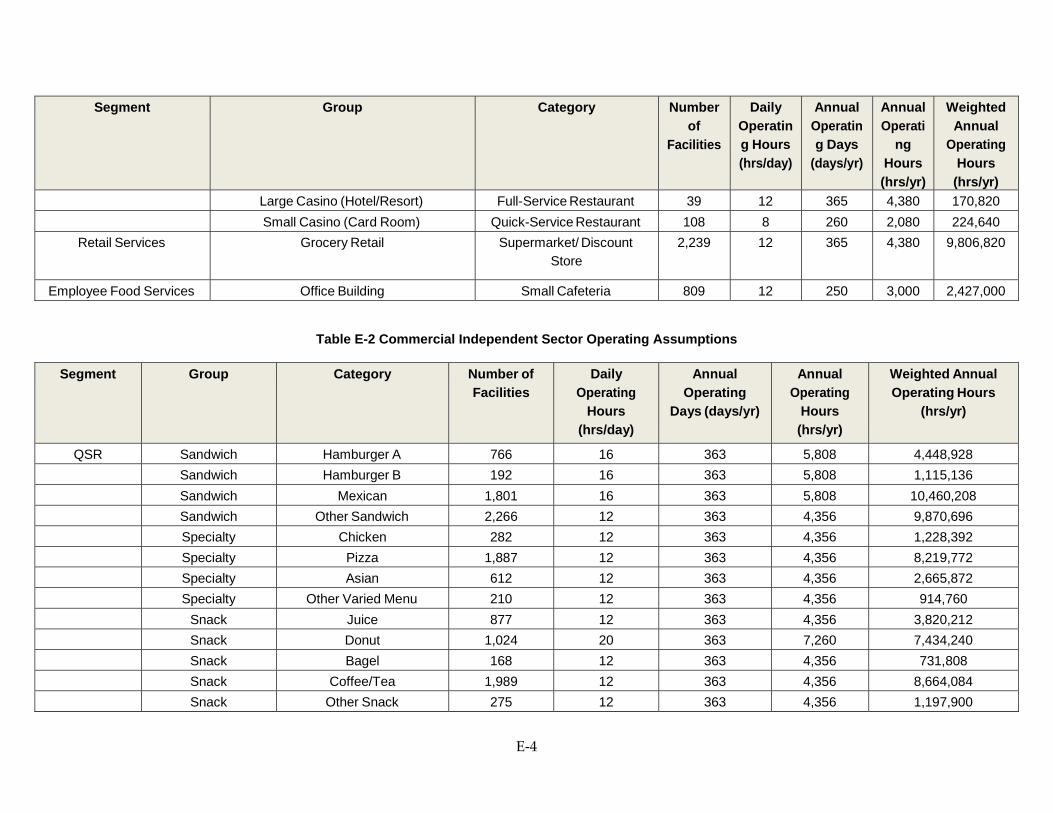
E‐4
Segment Group Category Number of
Facilities
Daily Operatin g Hours (hrs/day)
Annual Operatin g Days
(days/yr)
Annual Operati
ng Hours (hrs/yr)
Weighted Annual
Operating Hours (hrs/yr)
Large Casino (Hotel/Resort) Full-Service Restaurant 39 12 365 4,380 170,820 Small Casino (Card Room) Quick-Service Restaurant 108 8 260 2,080 224,640
Retail Services Grocery Retail Supermarket/ Discount Store
2,239 12 365 4,380 9,806,820
Employee Food Services Office Building Small Cafeteria 809 12 250 3,000 2,427,000
Table E-2 Commercial Independent Sector Operating Assumptions
Segment Group Category Number of Facilities
Daily Operating
Hours (hrs/day)
Annual Operating
Days (days/yr)
Annual Operating
Hours (hrs/yr)
Weighted Annual Operating Hours
(hrs/yr)
QSR Sandwich Hamburger A 766 16 363 5,808 4,448,928 Sandwich Hamburger B 192 16 363 5,808 1,115,136 Sandwich Mexican 1,801 16 363 5,808 10,460,208 Sandwich Other Sandwich 2,266 12 363 4,356 9,870,696 Specialty Chicken 282 12 363 4,356 1,228,392 Specialty Pizza 1,887 12 363 4,356 8,219,772 Specialty Asian 612 12 363 4,356 2,665,872 Specialty Other Varied Menu 210 12 363 4,356 914,760 Snack Juice 877 12 363 4,356 3,820,212 Snack Donut 1,024 20 363 7,260 7,434,240 Snack Bagel 168 12 363 4,356 731,808 Snack Coffee/Tea 1,989 12 363 4,356 8,664,084 Snack Other Snack 275 12 363 4,356 1,197,900

E‐5
Segment Group Category Number of Facilities
Daily Operating
Hours (hrs/day)
Annual Operating
Days (days/yr)
Annual Operating
Hours (hrs/yr)
Weighted Annual Operating Hours
(hrs/yr)
FSR Family Dining BBQ 744 12 312 3,744 2,785,536 Family Dining Cafeteria 49 12 312 3,744 183,456 Family Dining Buffet 1,903 12 312 3,744 7,124,832 Casual Dining Mexican 4,024 12 312 3,744 15,065,856 Casual Dining Asian 7,039 12 312 3,744 26,354,016 Casual Dining Pizza/Italian 1,336 12 312 3,744 5,001,984 Casual Dining Seafood 580 12 312 3,744 2,171,520 Casual Dining Indian 392 12 312 3,744 1,467,648 Casual Dining American 10,139 12 312 3,744 37,960,416 Casual Dining Other Ethnic CD 1,230 12 312 3,744 4,605,120 Fine Dining Steak 20 12 312 3,744 74,880 Fine Dining Other FD 449 12 312 3,744 1,681,056
Table E-3 Commercial Small Chain Sector Operating Assumptions
Segment
Group
Category
Number
of Facilities
Daily Operating
Hours (hrs/day)
Annual Operating
Days (days/yr)
Annual Operating
Hours (hrs/yr)
Weighted Annual
Operating Hours (hrs/yr)
QSR Sandwich Hamburger A 519 16 363 5,808 3,014,352 Sandwich Hamburger B 130 16 363 5,808 755,040 Sandwich Mexican 915 16 363 5,808 5,314,320 Sandwich Other Sandwich 896 12 363 4,356 3,902,976 Specialty Chicken 250 12 363 4,356 1,089,000 Specialty Pizza 1,163 12 363 4,356 5,066,028 Specialty Asian 416 12 363 4,356 1,812,096

E‐6
Segment
Group
Category
Number
of Facilities
Daily Operating
Hours (hrs/day)
Annual Operating
Days (days/yr)
Annual Operating
Hours (hrs/yr)
Weighted Annual
Operating Hours (hrs/yr)
Specialty Other Varied Menu 104 12 363 4,356 453,024 Snack Juice 402 12 363 4,356 1,751,112 Snack Donut 860 20 363 7,260 6,243,600 Snack Bagel 193 12 363 4,356 840,708 Snack Coffee/Tea 424 12 363 4,356 1,846,944 Snack Other Snack 115 12 363 4,356 500,940
FSR Family Dining BBQ 97 12 363 4,356 422,532 Family Dining Cafeteria 18 12 363 4,356 78,408 Family Dining Buffet 692 12 363 4,356 3,014,352 Casual Dining Mexican 1,004 12 363 4,356 4,373,424 Casual Dining Asian 785 12 363 4,356 3,419,460 Casual Dining Pizza/Italian 451 12 363 4,356 1,964,556 Casual Dining Seafood 114 12 363 4,356 496,584 Casual Dining Indian 34 12 363 4,356 148,104 Casual Dining American 658 12 363 4,356 2,866,248 Casual Dining Other Ethnic CD 115 12 363 4,356 500,940 Fine Dining Steak 33 12 312 3,744 123,552 Fine Dining Other FD 102 12 312 3,744 381,888
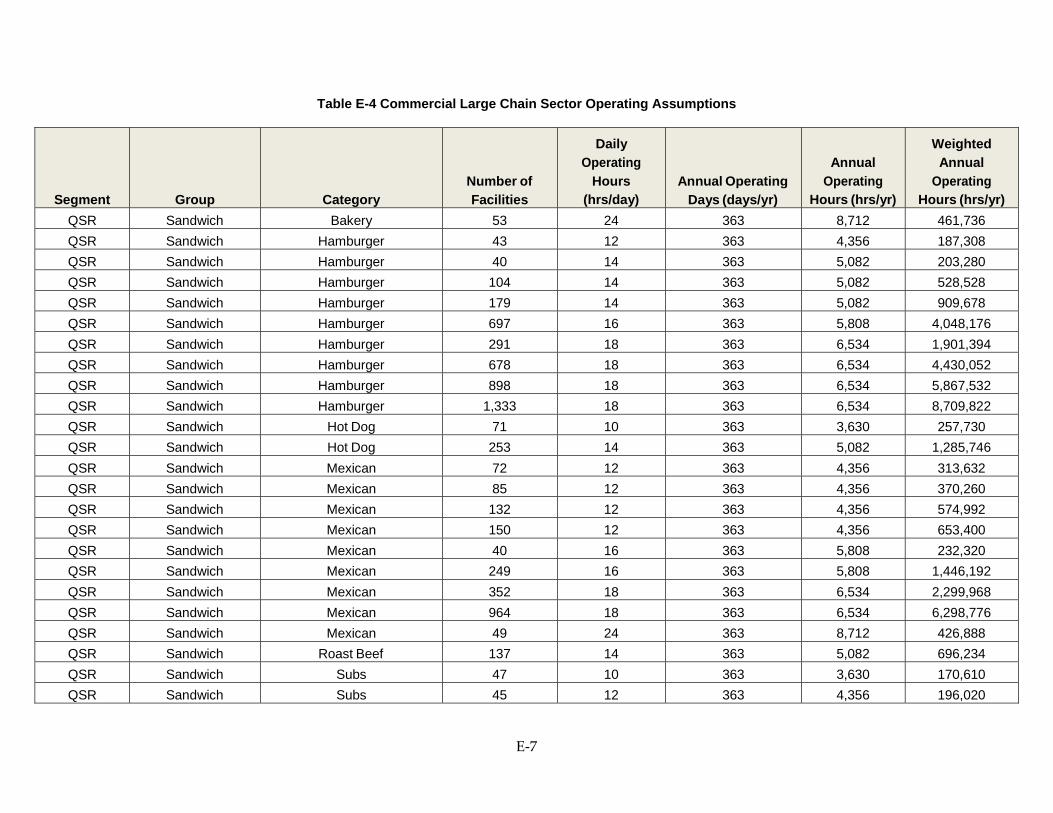
E‐7
Table E-4 Commercial Large Chain Sector Operating Assumptions
Segment
Group
Category
Number of Facilities
Daily Operating
Hours (hrs/day)
Annual Operating Days (days/yr)
Annual
Operating Hours (hrs/yr)
Weighted Annual
Operating Hours (hrs/yr)
QSR Sandwich Bakery 53 24 363 8,712 461,736 QSR Sandwich Hamburger 43 12 363 4,356 187,308 QSR Sandwich Hamburger 40 14 363 5,082 203,280 QSR Sandwich Hamburger 104 14 363 5,082 528,528 QSR Sandwich Hamburger 179 14 363 5,082 909,678 QSR Sandwich Hamburger 697 16 363 5,808 4,048,176 QSR Sandwich Hamburger 291 18 363 6,534 1,901,394 QSR Sandwich Hamburger 678 18 363 6,534 4,430,052 QSR Sandwich Hamburger 898 18 363 6,534 5,867,532 QSR Sandwich Hamburger 1,333 18 363 6,534 8,709,822 QSR Sandwich Hot Dog 71 10 363 3,630 257,730 QSR Sandwich Hot Dog 253 14 363 5,082 1,285,746 QSR Sandwich Mexican 72 12 363 4,356 313,632 QSR Sandwich Mexican 85 12 363 4,356 370,260 QSR Sandwich Mexican 132 12 363 4,356 574,992 QSR Sandwich Mexican 150 12 363 4,356 653,400 QSR Sandwich Mexican 40 16 363 5,808 232,320 QSR Sandwich Mexican 249 16 363 5,808 1,446,192 QSR Sandwich Mexican 352 18 363 6,534 2,299,968 QSR Sandwich Mexican 964 18 363 6,534 6,298,776 QSR Sandwich Mexican 49 24 363 8,712 426,888 QSR Sandwich Roast Beef 137 14 363 5,082 696,234 QSR Sandwich Subs 47 10 363 3,630 170,610 QSR Sandwich Subs 45 12 363 4,356 196,020

E‐8
Segment
Group
Category
Number of Facilities
Daily Operating
Hours (hrs/day)
Annual Operating Days (days/yr)
Annual
Operating Hours (hrs/yr)
Weighted Annual
Operating Hours (hrs/yr)
QSR Sandwich Subs 46 12 363 4,356 200,376 QSR Sandwich Subs 50 12 363 4,356 217,800 QSR Sandwich Subs 256 12 363 4,356 1,115,136 QSR Sandwich Subs 744 12 363 4,356 3,240,864 QSR Sandwich Subs 1,893 12 363 4,356 8,245,908 QSR Snack Bagel 62 12 363 4,356 270,072 QSR Snack Bakery Snack 73 10 363 3,630 264,990 QSR Snack Bakery Snack 116 10 363 3,630 421,080 QSR Snack Donut 51 24 363 8,712 444,312 QSR Snack Donut 177 24 363 8,712 1,542,024 QSR Snack Frozen Sweets 50 10 363 3,630 181,500 QSR Snack Frozen Sweets 54 10 363 3,630 196,020 QSR Snack Frozen Sweets 95 12 363 4,356 413,820 QSR Snack Frozen Sweets 515 12 363 4,356 2,243,340 QSR Snack Frozen Sweets 102 14 363 5,082 518,364 QSR Snack Frozen Sweets 145 14 363 5,082 736,890 QSR Snack Frozen Sweets 229 14 363 5,082 1,163,778 QSR Snack Frozen Sweets 290 14 363 5,082 1,473,780 QSR Snack Gourmet Coffee/Tea 55 10 363 3,630 199,650 QSR Snack Gourmet Coffee/Tea 74 12 363 4,356 322,344 QSR Snack Gourmet Coffee/Tea 124 12 363 4,356 540,144 QSR Snack Gourmet Coffee/Tea 189 12 363 4,356 823,284 QSR Snack Gourmet Coffee/Tea 63 14 363 5,082 320,166 QSR Snack Gourmet Coffee/Tea 2,227 16 363 5,808 12,934,416 QSR Snack Juice/Smoothie 53 10 363 3,630 192,390 QSR Snack Juice/Smoothie 57 10 363 3,630 206,910
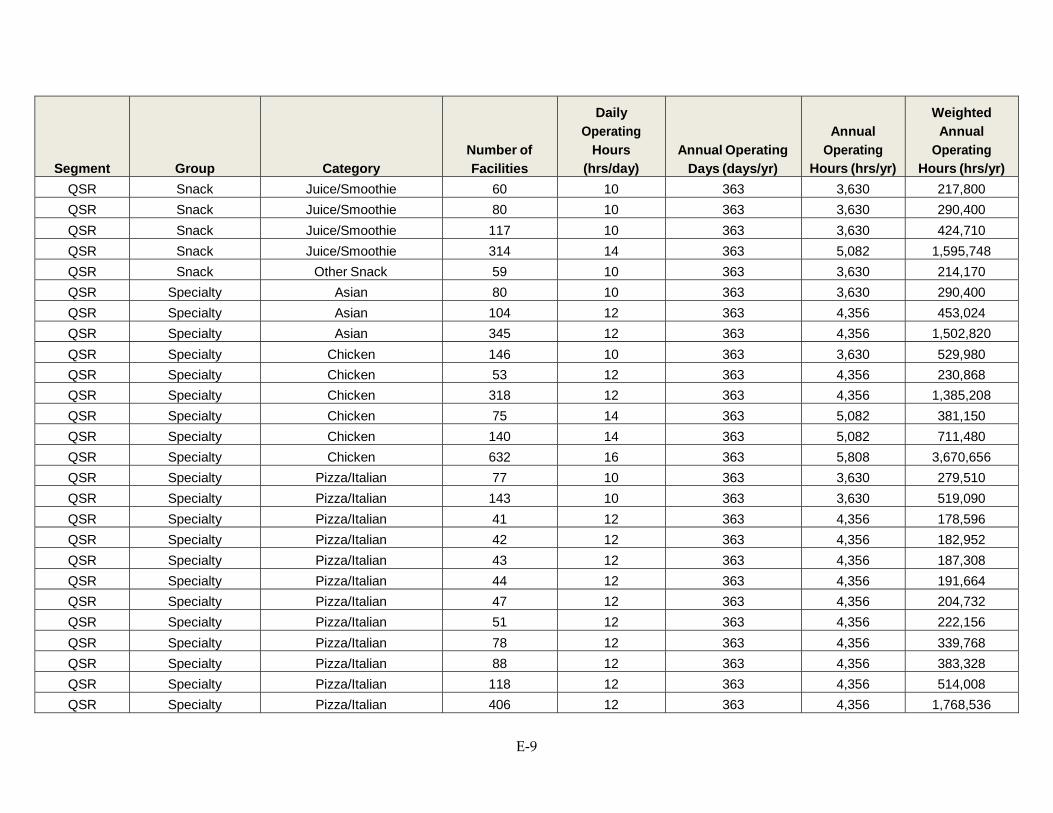
E‐9
Segment
Group
Category
Number of Facilities
Daily Operating
Hours (hrs/day)
Annual Operating Days (days/yr)
Annual
Operating Hours (hrs/yr)
Weighted Annual
Operating Hours (hrs/yr)
QSR Snack Juice/Smoothie 60 10 363 3,630 217,800 QSR Snack Juice/Smoothie 80 10 363 3,630 290,400 QSR Snack Juice/Smoothie 117 10 363 3,630 424,710 QSR Snack Juice/Smoothie 314 14 363 5,082 1,595,748 QSR Snack Other Snack 59 10 363 3,630 214,170 QSR Specialty Asian 80 10 363 3,630 290,400 QSR Specialty Asian 104 12 363 4,356 453,024 QSR Specialty Asian 345 12 363 4,356 1,502,820 QSR Specialty Chicken 146 10 363 3,630 529,980 QSR Specialty Chicken 53 12 363 4,356 230,868 QSR Specialty Chicken 318 12 363 4,356 1,385,208 QSR Specialty Chicken 75 14 363 5,082 381,150 QSR Specialty Chicken 140 14 363 5,082 711,480 QSR Specialty Chicken 632 16 363 5,808 3,670,656 QSR Specialty Pizza/Italian 77 10 363 3,630 279,510 QSR Specialty Pizza/Italian 143 10 363 3,630 519,090 QSR Specialty Pizza/Italian 41 12 363 4,356 178,596 QSR Specialty Pizza/Italian 42 12 363 4,356 182,952 QSR Specialty Pizza/Italian 43 12 363 4,356 187,308 QSR Specialty Pizza/Italian 44 12 363 4,356 191,664 QSR Specialty Pizza/Italian 47 12 363 4,356 204,732 QSR Specialty Pizza/Italian 51 12 363 4,356 222,156 QSR Specialty Pizza/Italian 78 12 363 4,356 339,768 QSR Specialty Pizza/Italian 88 12 363 4,356 383,328 QSR Specialty Pizza/Italian 118 12 363 4,356 514,008 QSR Specialty Pizza/Italian 406 12 363 4,356 1,768,536

E‐10
Segment
Group
Category
Number of Facilities
Daily Operating
Hours (hrs/day)
Annual Operating Days (days/yr)
Annual
Operating Hours (hrs/yr)
Weighted Annual
Operating Hours (hrs/yr)
QSR Specialty Pizza/Italian 44 14 363 5,082 223,608 QSR Specialty Pizza/Italian 54 14 363 5,082 274,428 QSR Specialty Pizza/Italian 189 14 363 5,082 960,498 QSR Specialty Pizza/Italian 294 16 363 5,808 1,707,552 QSR Specialty Pizza/Italian 487 16 363 5,808 2,828,496 QSR Specialty Pizza/Italian 536 16 363 5,808 3,113,088 QSR Specialty Seafood 76 14 363 5,082 386,232 FSR Casual Dining Bar & Grill 50 12 363 4,356 217,800 FSR Casual Dining Bar & Grill 60 12 363 4,356 261,360 FSR Casual Dining Bar & Grill 43 14 363 5,082 218,526 FSR Casual Dining Bar & Grill 105 14 363 5,082 533,610 FSR Casual Dining Bar & Grill 113 14 363 5,082 574,266 FSR Casual Dining Bar & Grill 50 16 363 5,808 290,400 FSR Casual Dining Greek 67 10 363 3,630 243,210 FSR Casual Dining Italian 42 12 363 4,356 182,952 FSR Casual Dining Italian 58 12 363 4,356 252,648 FSR Casual Dining Mexican 47 12 363 4,356 204,732 FSR Casual Dining Mexican 67 12 363 4,356 291,852 FSR Casual Dining Pizza 77 12 363 4,356 335,412 FSR Casual Dining Seafood 42 12 363 4,356 182,952 FSR Casual Dining Steak/Rib 53 12 363 4,356 230,868 FSR Casual Dining Steak/Rib 61 14 363 5,082 310,002 FSR Family Dining Barbecue 96 12 363 4,356 418,176 FSR Family Dining Buffet/Grill 87 10 363 3,630 315,810 FSR Family Dining Buffet/Grill 141 12 363 4,356 614,196 FSR Family Dining Family Style 41 12 363 4,356 178,596

E‐11
Segment
Group
Category
Number of Facilities
Daily Operating
Hours (hrs/day)
Annual Operating Days (days/yr)
Annual
Operating Hours (hrs/yr)
Weighted Annual
Operating Hours (hrs/yr)
FSR Family Dining Family Style 41 12 363 4,356 178,596 FSR Family Dining Family Style 56 16 363 5,808 325,248 FSR Family Dining Family Style 89 16 363 5,808 516,912 FSR Family Dining Family Style 98 16 363 5,808 569,184 FSR Family Dining Family Style 99 16 363 5,808 574,992 FSR Family Dining Family Style 47 18 363 6,534 307,098 FSR Family Dining Family Style 222 24 363 8,712 1,934,064 FSR Family Dining Family Style 407 24 363 8,712 3,545,784 FSR Family Dining Salad/Soup 41 12 363 4,356 178,596
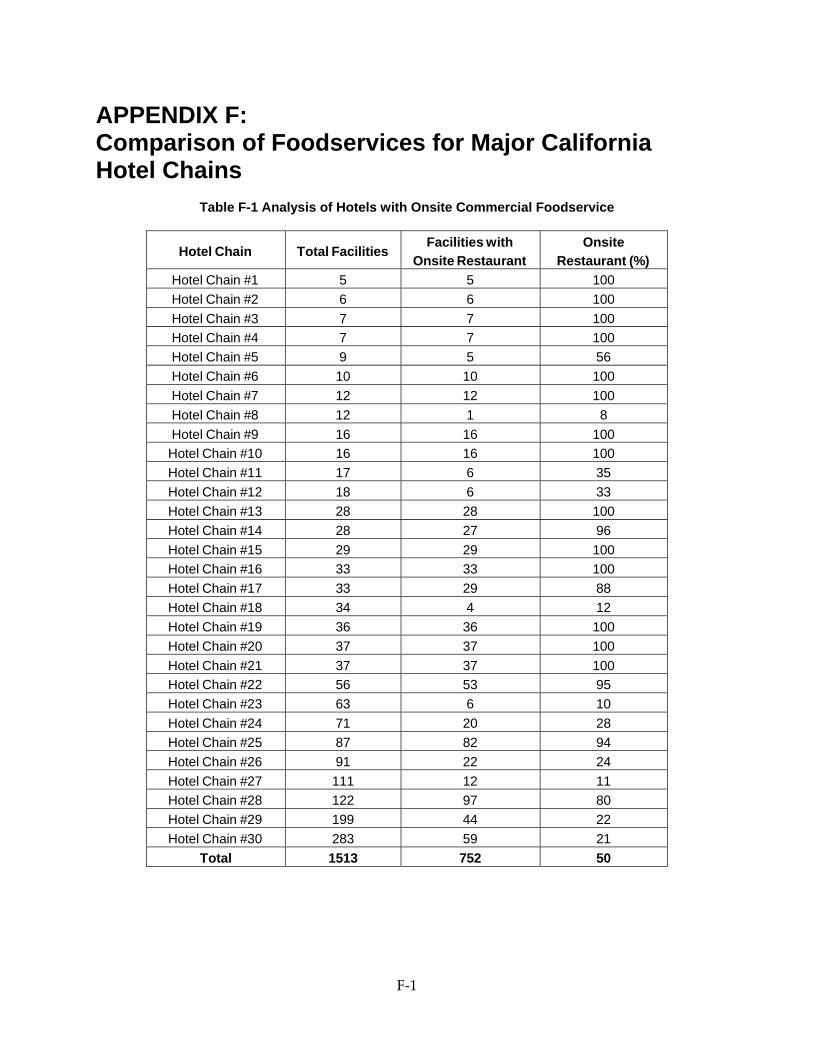
F‐1
APPENDIX F: Comparison of Foodservices for Major California Hotel Chains
Table F-1 Analysis of Hotels with Onsite Commercial Foodservice
Hotel Chain
Total Facilities Facilities with
Onsite RestaurantOnsite
Restaurant (%) Hotel Chain #1 5 5 100 Hotel Chain #2 6 6 100 Hotel Chain #3 7 7 100 Hotel Chain #4 7 7 100 Hotel Chain #5 9 5 56 Hotel Chain #6 10 10 100 Hotel Chain #7 12 12 100 Hotel Chain #8 12 1 8 Hotel Chain #9 16 16 100 Hotel Chain #10 16 16 100 Hotel Chain #11 17 6 35 Hotel Chain #12 18 6 33 Hotel Chain #13 28 28 100 Hotel Chain #14 28 27 96 Hotel Chain #15 29 29 100 Hotel Chain #16 33 33 100 Hotel Chain #17 33 29 88 Hotel Chain #18 34 4 12 Hotel Chain #19 36 36 100 Hotel Chain #20 37 37 100 Hotel Chain #21 37 37 100 Hotel Chain #22 56 53 95 Hotel Chain #23 63 6 10 Hotel Chain #24 71 20 28 Hotel Chain #25 87 82 94 Hotel Chain #26 91 22 24 Hotel Chain #27 111 12 11 Hotel Chain #28 122 97 80 Hotel Chain #29 199 44 22 Hotel Chain #30 283 59 21
Total 1513 752 50