characterizing the natural system: toward sustained
TRANSCRIPT

W&M ScholarWorks W&M ScholarWorks
VIMS Articles
2015
Characterizing the Natural System: Toward Sustained, Integrated Characterizing the Natural System: Toward Sustained, Integrated
Coastal Ocean Acidification Observing Networks to Facilitate Coastal Ocean Acidification Observing Networks to Facilitate
Resource Management and Decision Support Resource Management and Decision Support
SR Alin
RE Brainard
NN Price
JA Newton
A Cohen
See next page for additional authors
Follow this and additional works at: https://scholarworks.wm.edu/vimsarticles
Part of the Aquaculture and Fisheries Commons
Recommended Citation Recommended Citation Alin, SR; Brainard, RE; Price, NN; Newton, JA; Cohen, A; DeCarlo, EH; Shadwick, EH; and et al, "Characterizing the Natural System: Toward Sustained, Integrated Coastal Ocean Acidification Observing Networks to Facilitate Resource Management and Decision Support" (2015). VIMS Articles. 841. https://scholarworks.wm.edu/vimsarticles/841
This Article is brought to you for free and open access by W&M ScholarWorks. It has been accepted for inclusion in VIMS Articles by an authorized administrator of W&M ScholarWorks. For more information, please contact [email protected].

Authors Authors SR Alin, RE Brainard, NN Price, JA Newton, A Cohen, EH DeCarlo, EH Shadwick, and et al
This article is available at W&M ScholarWorks: https://scholarworks.wm.edu/vimsarticles/841

CITATION
Alin, S.R., R.E. Brainard, N.N. Price, J.A. Newton, A. Cohen, W.T. Peterson, E.H. DeCarlo,
E.H. Shadwick, S. Noakes, and N. Bednaršek. 2015. Characterizing the natural system:
Toward sustained, integrated coastal ocean acidification observing networks to
facilitate resource management and decision support. Oceanography 28(2):92–107,
http://dx.doi.org/ 10.5670/oceanog.2015.34.
DOI
http://dx.doi.org/ 10.5670/oceanog.2015.34
COPYRIGHT
This article has been published in Oceanography, Volume 28, Number 2, a quarterly
journal of The Oceanography Society. Copyright 2015 by The Oceanography Society.
All rights reserved.
USAGE
Permission is granted to copy this article for use in teaching and research.
Republication, systematic reproduction, or collective redistribution of any portion of
this article by photocopy machine, reposting, or other means is permitted only with the
approval of The Oceanography Society. Send all correspondence to: [email protected] or
The Oceanography Society, PO Box 1931, Rockville, MD 20849-1931, USA.
OceanographyTHE OFFICIAL MAGAZINE OF THE OCEANOGRAPHY SOCIETY
DOWNLOADED FROM HTTP://WWW.TOS.ORG/OCEANOGRAPHY

Oceanography | Vol.28, No.292
Toward Sustained, Integrated Coastal Ocean Acidification Observing Networks
to Facilitate Resource Management and Decision Support
EMERGING THEMES IN OCEAN ACIDIFICATION SCIENCE
Oceanography | Vol.28, No.292
By Simone R. Alin, Russell E. Brainard, Nichole N. Price,
Jan A. Newton, Anne Cohen, William T. Peterson, Eric H. DeCarlo,
Elizabeth H. Shadwick, Scott Noakes, and Nina Bednaršek
the Natural SystemCharacterizing

Oceanography | June 2015 93
responses to ocean acidification, as out-lined in the vision statement of the Global Ocean Acidification Observing Network (GOA-ON; Newton et al., 2014).
As part of GOA-ON, scientists, stake-holders, and resource managers at inter-national, national, regional, and local levels are jointly planning ocean acid-ification observing networks that will leverage existing programs and assets to: (1) provide a suite of consistent observations across scales, from open ocean to coastal and estuarine ecosys-tems, for detection of trends and associ-ated ecological responses to ocean acid-ification (Figure 1, Level 1 of Goals 1 and 2); (2) provide a framework for pro-cess and attribution studies relevant to individual regions (Figure 1, Level 2 of Goals 1 and 2); (3) improve predictive models for ocean biogeochemistry and
ecosystem responses (Figure 1, Goal 3); and (4) share data with indicators of the level of quality among all stakehold-ers at useful temporal and spatial scales (Figure 1, outer circles; Newton et al., 2014). Here, we discuss how the con-ceptual consensus recommendations for the coastal components of GOA-ON (Table 1, Figure 1) might be implemented in regional coastal areas where they will directly support effective decision mak-ing to address the most pressing socie-tal challenges, such as fisheries for food security and liveli hoods, community resilience, and coastal protection. We use examples from a few types of continental and island coastal ecosystems.
Coastal oceans are biogeochemically and physically dynamic environments characterized by strong spatial and tem-poral variability; consequently, coastal zone habitats are exceptionally diverse. Coastal ecosystems are also among the most productive in the world, hosting 15–30% of oceanic primary production (Gattuso et al., 1998), producing 87% of the world’s fish catch (FAO, 2014), and providing essential habitats for much of the diversity of marine life. For example, while coral reef ecosystems comprise less than 0.25% of seafloor area, they are home to over 25% of marine species (Knowlton et al., 2010), with a recent estimate of 550,000–1,330,000 species on coral reefs worldwide (Fisher et al., 2015). With greater than 50% of the world’s human population living within 50 km of a coast-line, coastal ecosystems are particularly
INTRODUCTIONOcean acidification is expected to pro-gressively impact marine ecosystems, biodiversity, fisheries, and societies at scales ranging from local to regional to global through the twenty-first century and beyond. In order to best inform and prepare coastal stakeholders and decision makers across these scales, it is critical to develop an integrated, interdisciplinary biogeochemical and ecological observ-ing network capable of robustly detect-ing and attributing changes in ocean chemistry to changes in indicators of ecosystem condition (i.e., structure and function) and human well-being. Time-series observations are needed to concur-rently characterize variability in time and space of both biogeochemical conditions and ecological processes to better under-stand biological tolerances and societal
ABSTRACT. Coastal ocean ecosystems have always served human populations—they provide food security, livelihoods, coastal protection, and defense. Ocean acidification is a global threat to these ecosystem services, particularly when other local and regional stressors combine with it to jeopardize coastal health. Monitoring efforts call for a coordinated global approach toward sustained, integrated coastal ocean health observing networks to address the region-specific mix of factors while also adhering to global ocean acidification observing network principles to facilitate comparison among regions for increased utility and understanding. Here, we generalize guidelines for scoping and designing regional coastal ocean acidification observing networks and provide examples of existing efforts. While challenging in the early stages of coordinating the design and prioritizing the implementation of these observing networks, it is essential to actively engage all of the relevant stakeholder groups from the outset, including private industries, public agencies, regulatory bodies, decision makers, and the general public. The long-term sustainability of these critical observing networks will rely on leveraging of resources and the strength of partnerships across the consortium of stakeholders and those implementing coastal ocean health observing networks.
“The long-term sustainability of these critical observing networks will rely on leveraging of
resources and the strength of partnerships across the consortium of stakeholders and those implementing
coastal ocean health observing networks.
”.

Oceanography | Vol.28, No.294
vulnerable to impacts from human activ-ities that result in habitat degradation and losses of biodiversity. In addition to local anthropogenic stressors such as coastal development and fishing, cli-mate change and ocean acidification are affecting coastal ecosystems. Sustainable ecosystem-based management of human interactions with coastal ecosystems and the ability to develop effective mitiga-tion and adaptation strategies depends on reliable and timely observations for decision support. Among many needs, coastal observations must detect ecolog-ical responses as well as facilitate attribu-tion of observed shifts to climate variabil-ity or trends, ocean acidification, other human activities, or natural processes.
Biogeochemical and ecological dyna-
mics across various coastal ecosystems may be dominated by a range of influ-ences, such as seasonal changes in winds, light, or temperature; inputs of freshwater, nutrients, or organic matter from land; and geomorphic factors (e.g., shelf width, bathymetric or coastline features). Thus, to be effective, a regional, integrated coastal ocean acidification observing network should be sufficiently consistent to facil-itate comparison and improved under-standing of biogeochemical processes and ecological responses across ecosystem types, as outlined by GOA-ON, yet must be sufficiently tailored to the dominant processes within each ecosystem type to allow for attribution of local observations to the underlying processes in that region (Figure 2). Overall, regional observing
networks should be capable of making environmental and ecological measure-ments at temporal and spatial scales suf-ficient to: (1) establish spatial patterns and magnitudes of variability, (2) detect long-term changes from these enve-lopes of variability, (3) attribute ecologi-cal responses to environmental changes, (4) facilitate projections of future condi-tions, and (5) evaluate validity of mod-els and hindcasts. In addition, observing assets within a regional network should be configured to address short-term regional stakeholder priorities.
Cognizant of diverse local to regional stressors for each ecosystem (see Breitburg et al., 2015, in this issue), as well as multiple compelling needs for long-term observations, regional observing networks are best framed when address-ing coastal ocean health in an integrated, interdisciplinary manner, rather than solely based on carbonate chemistry and its impacts. Here, we delineate general guidelines for designing and implement-ing regional coastal ocean acidification observing networks that: (1) conform to GOA-ON principles for comparability, (2) are responsive to regional and local stakeholder needs, and (3) character-ize critical attributes on local to regional scales. We offer examples highlighting key characteristics and needs for a few ecosystem types, stressing important scoping considerations (Table 2). These general guidelines and considerations apply, with some modifications, to other ecosystem types and locations.
GOA-ON AND REGIONAL COASTAL OBSERVING EFFORTSIn any nation, region, or area, a diver-sity of organizations and institutions may contribute to observations, long-term monitoring, and research on ocean acidification under various legal authori-ties or management mandates. The core goals of GOA-ON outlined above facili-tate diagnosis of spatial patterns and tem-poral trends in ocean acidification across regions, attribution of processes and driv-ers behind these patterns and trends,
DATA AND INFORMATION PRODUCTS AND TOOLS
SOCIETAL BENEFIT AND DECISION-MAKING
GOAL 3Biogeochemical and ecosystem modeling
GOAL 2 Detect
ecological response
GOAL 1Observe
ocean conditions
Regional coastal ocean health observing network with integrated environmental and ecological observations
LEVEL 2Observations for enhanced interpretation and targeted
complementary process and lab studies
LEVEL 1Critical minimum long-term observations
LEVEL 3Developing
technologies
FIGURE 1. Schematic diagram of the parts of the Global Ocean Acidification Observing Network (GOA-ON), showing the core goals of GOA-ON, the levels at which various activities address the core goals in the pyramid above, and in the outer rings, the ultimate societal needs that the activ-ities fulfilling the coastal observing network goals are designed to address. Connections between the societal drivers and coastal GOA-ON activities are particularly strong in coastal systems due to the reliance of human populations on coastal resources worldwide. Courtesy of Amanda Dillon

Oceanography | June 2015 95
TABLE 1. Global Ocean Acidification Observing Network (GOA-ON) requirements for environmental and ecological observations (consolidated from Newton et al. 2014). Requirements are broken down by priority parameters, patterns, or processes to constrain.1
GOAL 1: IMPROVE OUR UNDERSTANDING OF GLOBAL OCEAN ACIDIFICATION CONDITIONS.
Level 1: Critical minimum measurements, applied to document ocean acidification dynamics.
Parameters: Temperature, salinity, pressure (≈ water depth at which measurement is made), oxygen concentration, carbon-system constraint (including direct measurements and other means of estimating parameters2), and where feasible, fluorescence and irradiance should also be measured.
Patterns: Where photosynthetic calcifiers dominate, some measure of biomass of biota (corals, coralline algae, other photosynthesizers).
Processes: Where photosynthetic calcifiers dominate, constraining net ecosystem processes (net ecosystem calcification and net ecosystem production) is necessary.
Level 2: An enhanced suite of measurements that promote understanding of the primary mechanisms (including biologically mediated mechanisms) that govern ocean acidification dynamics; measurements applied toward understanding those dynamic processes. Dependent on site location, season, hydrographic conditions, and question, but recommendations include:
Parameters: Nutrients, bio-optical parameters, currents, meteorology, particulate organic and inorganic carbon, and atmospheric pCO2.
Patterns: Phytoplankton species.
Processes: Net community metabolism and/or export production. In some warm-water coral habitats, freshwater, nutrient, and/or sediment inputs should also be measured.
Level 3: Opportunistic or experimental measurements that may offer enhanced insights into ocean acidification dynamics and impacts. Measurements under development that may later be adapted to Level 1 or 2.
Parameters: This category may include many parameters from Levels 1 and 2 for which autonomous sensors do not yet exist or require significant improvements or commercialization to be widely available and reliable for use in GOA-ON deployments.
GOAL 2: IMPROVE OUR UNDERSTANDING OF ECOSYSTEM RESPONSE TO OCEAN ACIDIFICATION. Many of these measurements will be specific to broad climate regions or ecosystem types. The level of granularity used in the GOA-ON framing document is polar, temperate, tropical, and nearshore, and is indicated below where recommendations are not universal.
Level 1:
Parameters: Photosynthetically active radiation, turbidity/total suspended solids (tropical, nearshore), particulate inorganic carbon (polar, temperate), colored dissolved organic matter (tropical, nearshore), nutrients (nearshore). For warm- and cold-water coral habitats, further characterization of chemical environment, including sediment mineralogy/composition, organism mineral content, alkalinity anomalies, and vertical profiles of saturation state over time (cold-water corals).
Patterns: Biomass/abundance of phytoplankton, zooplankton (micro- and meso-), and benthic producers and consumers; biomass of calcified vs. non-calcified species; timing of changes in abundance (e.g., blooms, community shifts, pigment changes); phytoplankton functional types (polar, temperate); calcified to non-calcified plankton abundance (temperate, nearshore); and calcified to non-calcified benthos abundance (nearshore). For warm- and cold-water coral habitats, population structure of corals and macroalgae; biomass, population, and trophic structure of cryptobiota; population structure of urchins; and architectural complexity.
Processes: Ratio of net ecosystem production to net ecosystem calcification, food supply rate and quality, bioerosion rates at specific sites.
Level 2: Where not already included above.
Parameters: Chemical speciation (e.g., abundance of specific forms of carbon, nitrogen, phosphorus), transparent exopolymeric particles, fatty acid measurements (food quality), nutrient ratios, algal pigments, currents.
Patterns: Taxonomy, sea algae, satellite imagery (tropical), community structure (nearshore), trophic interactions (nearshore), disease (nearshore), phytoplankton species (nearshore).
Processes: Phytoplankton primary production; net community production; export flux; net community calcification; nutrient uptake; dissolution; zooplankton vertical/spatial, temporal variation; zooplankton grazing rates. Benthic habitats: burial, deposition, respiration, calcification, production.
GOAL 3: ACQUIRE AND EXCHANGE DATA AND KNOWLEDGE NECESSARY TO OPTIMIZE MODELING OF OCEAN ACIDIFICATION AND ITS IMPACTS.
Parameters: Bio-optical and chemical sensors (e.g., nitrate, oxygen, pH) on Argo floats, develop ocean acidification indicators for key locations, models for key benthic and pelagic organisms to link habitat and ocean acidification conditions and connect to integrated ecosystem assessments.
Patterns: Large-scale surveys to constrain models, better spatial coverage of moorings linked to targeted process studies, extended spatial coverage of gliders, evaluate ocean acidification monitoring networks using observing system simulation experiments (OSSEs), integrate water quality and plankton community information into physical-biogeochemical models for three-dimensional distributions on dominant temporal scales.
Processes: Model-data comparison to determine coastal impacts on open ocean biogeochemistry/ecology, short-term forecasts to evaluate model performance at ocean acidification network locations, improve linkages with physical modeling capabilities within regions, high-resolution circulation and wave models for coral reefs and extreme weather events.
1 For present purposes, parameters are terms we measure with sensors or lab analyses; patterns require abundance, area, or mass estimation; and processes require biogeochemical or hydrological rate estimates.
2 Including via empirical relationships, as in Juranek et al. (2009) and Alin et al. (2012).

Oceanography | Vol.28, No.296
prediction of future patterns and impacts, and support for informed and timely pol-icy and management decisions (Table 1).
The US National Oceanic and Atmospheric Administration (NOAA) Ocean Acidification Observing Network (NOA-ON), with many partners, is con-sistent with GOA-ON design principles (NOAA Ocean Acidification Steering Committee, 2010; Interagency Working
Group on Ocean Acidification, 2014). It provides an initial framework to guide the regional ocean acidification observ-ing networks that have started to mate-rialize through US Integrated Ocean Observing System (IOOS) regional asso-ciations. These regional observing net-works provide data on regional trends and drivers related to ocean acidifi-cation and the associated ecosystem
responses, thereby providing a founda-tion into which more detailed mechanis-tic process studies or ecosystem-specific observations of impacts can be integrated (e.g., Pfister et al., 2014).
The GOA-ON plan is a key aide for designing regional observing sys-tems that are responsive to both long-term scientific and short-term stake-holder needs. GOA-ON delineates two respective levels of observational quality (1) “climate”-quality observations, which require the lowest uncertainty and high-est confidence levels to detect long-term anthropogenic trends in carbon chem-istry and related physical and chemical parameters, such as temperature, salinity, and nutrients, and (2) “weather”-quality observations to identify “relative spa-tial patterns and short-term variability” (Newton et al., 2014). In dynamic coastal ecosystems, a mechanistic interpreta-tion of ecosystem changes attributable to ocean acidification and other inter-acting drivers requires climate- quality observations as well as high-resolution models to resolve signals with accept-able uncertainty. For many stakeholder and management needs, weather- quality measurements may suffice for correla-tion of environmental observations with ecosystem response data.
While detecting long-term global trends in ocean biogeochemistry is important, ecological responses tend to manifest primarily at local to regional scales due to the complexities of inter-actions across taxa “from the genes within species to biologically created habitats within ecosystems” (Duffy et al., 2013) and varying ecological commu-nity structure. Biogeochemical processes often vary over specific narrow frequen-cies (e.g., tidal, diel, seasonal), whereas organisms and communities within eco-systems reflect an integrated response to environmental variation over an even broader range of time scales due to vary-ing life histories of each species. These considerations make broad partnerships and integration across complementary efforts (e.g., Duffy et al., 2013) important.
FIGURE 2. The nested scales of ocean acidification observing. Globally (top left), GOA-ON encom-passes observing assets that meet consensus requirements. Map courtesy of Cathy Cosca A regional network (top right) encompasses assets designed and implemented by a consortium of stakeholders to address regional societal needs (e.g., the Northwest Association of Networked Ocean Observing Systems [NANOOS] for Washington State; http://nvs.nanoos.org). On the local scale (bottom), assets are targeted at understanding specific physical and biogeochemi-cal processes within that particular ecosystem (e.g., moored and mobile assets off La Push, WA). Modified from Alford et al. (2012), courtesy of John Mickett
GLOBAL REGIONAL
LOCAL
REGIONAL

Oceanography | June 2015 97
RECOMMENDATIONS FOR ESTABLISHING LONG-TERM, INTEGRATED COASTAL OCEAN HEALTH OBSERVATIONSWe make the following recommenda-tions to facilitate more efficient plan-ning and implementation for integrated coastal ocean acidification observing net-works to maximize leveraging of exist-ing institutional capabilities, resources, and other assets.
Recommendation 1 Identify and engage regional stakeholders with diverse interests in coastal resources, economic drivers, or uses that might be impacted by ocean acidification at the outset of the regional network design process. Stakeholders include research-ers (observations, experiments, models, social science), resource managers, water and air quality monitoring agencies, tribal nations, industries relying on the marine environment or resources (capture fisher-ies, aquaculture, tourism), policy makers, organizations with outreach and educa-tion missions (schools, aquariums, zoos, visitors centers, media), and others. We provide a set of questions that can be applied across ecosystem types and that may help identify and engage stakehold-ers who may ultimately become strong partners in designing, planning, imple-menting, and sustaining regional inter-disciplinary coastal ocean acidification observing networks (Table 2).
Recommendation 2 Identify existing observing or monitor-ing activities, assets, and programs, par-ticularly those with ongoing time-series measurements. A detailed gap analy-sis may be beyond the feasible or desired level of effort for this, but identifying rele-vant efforts that can be integrated to form a more comprehensive coastal ocean health observing network that includes partners who monitor ecological impacts attributable to ocean acidification should be identified across the region.
For the key species and ecosys-tems identified through the stakeholder
engagement process, it is helpful to iden-tify key environmental drivers, which may vary by ecosystem type within the region and may represent either natu-ral processes or additional human pres-sures on these coastal ecosystems (see Breitburg et al., 2015, in this issue). Leveraging existing activities to the extent appropriate will enhance regional observing networks and assist in efforts to attribute patterns across multiple drivers. IOOS regional associations are examples of organizing bodies that cut across and unite diverse sectors such as academia, government, and indus-try. Leveraging may provide opportuni-ties to develop insights into the historical progression of ocean acidification and related patterns or trends in ecological communities. Through judicious appli-cation of historical and proxy data sets (Juranek et al., 2009; Alin et al., 2012), estimates of historical ocean acidifica-tion trajectories might be reconstructed for comparison with biological and eco-logical time series, paleoenvironmen-tal records, or hindcast models. As an example of leveraging opportunities, it would be beneficial to couple ocean
acidification observing efforts to the nascent marine Biodiversity Observation Network (Duffy et al., 2013).
Recommendation 3 Design, prioritize, and implement ele-ments of regional observing networks to fill key gaps in understanding that will best enable the region to mitigate and/or adapt to impacts of ocean acidification and interacting environmental stressors. Integrate new observations into existing programs wherever reasonable in order to maximize leveraging and engagement of all relevant stakeholders. Stakeholders should play a key role in prioritizing com-ponents of the regional network.
To contribute to global understanding of relative rates of change and the roles of interacting drivers across regions, the regional observing network should be capable of discerning long-term trends, dominant frequencies and spatial scales of variability, and ecosystem responses to changing environmental conditions. Other assets within a region should be targeted at shorter-term manage-ment applications or acquiring process- level understanding.
TABLE 2. Scoping questions to help identify key stakeholders and important knowledge gaps within an ecosystem for coastal ocean acidification observing network.
1. Are there any species or groups of species that play a dominant role in structuring ecological or biogeochemical processes within this ecosystem, including keystone species?
2. What are the most ecologically and economically important marine species, communities, or ecosystem functions in the region?
3. What is their regional societal and economic relevance (ecosystem goods and services)?
4. What are the ecological or trophic linkages among species in the ecosystem?
5. What vulnerability do these species and ecosystems have to ocean acidification?
6. What are the dominant temporal and spatial scales of variability that affect this ecosystem?
7. What are the necessary and appropriate levels of sampling resolution for tracking changes in ecological composition and abundance through time and across the ecosystem (e.g., species vs. functional taxonomic groups, numerical abundance vs. biomass vs. percent cover)?
8. What are the dominant processes influencing variation in biogeochemistry and ecology?
9. What additional stressors are important in the region or ecosystem, and are there existing monitoring efforts relevant to these?
10. What are the key indicators of ecosystem or organismal health, disease, or toxicity risks within the ecosystem or region, and what metrics, surveys, or assays can be used to track them?
11. What are the information needs and applications of key stakeholders?
12. What are the gaps in understanding within the region or ecosystem type that need to be surmounted to provide the needed information to benefit society?

Oceanography | Vol.28, No.298
Recommendation 4Develop and disseminate key data and information products needed by stake-holders. For some stakeholders, such as shellfish aquaculture managers, the needed data product is real-time or near-real-time data about ocean conditions; leveraging existing resources, such as data portals provided by regional asso-ciations of IOOS, is a cost-effective and timely means of disseminating this infor-mation. Fisheries and coastal resource managers often need information about recent changes in and future predic-tions for the ecosystem that require dif-ferent data products. Support is needed to develop and sustain key data prod-ucts and appropriate information deliv-ery conduits to ensure timely availability to decision makers.
Recommendation 5Regularly re-engage stakeholders to assess the utility of observations and information products, and employ adap-tive strategies to better support changing societal requirements. As new impacts become known and technologies to facil-itate more efficient monitoring become available, the network will benefit from periodic, systematic evaluation and iden-tification of remaining (or new) knowl-edge gaps. New sensors and methods for making environmental and ecologi-cal observations may provide opportuni-ties to improve quality and cost effective-ness (Figure 1, Level 3 of Goals 1 and 2; e.g., Byrne, 2014; Pfister et al., 2014). Stakeholder groups should carefully con-sider the critical importance of sustained, consistent, long-term time-series obser-vations of both environmental and eco-logical conditions when deliberating
whether to continue or alter the meth-ods or locations of observations. Long-term climate monitoring principles provide a useful framework for evalu-ating such decisions (Karl et al., 1995; Trenberth et al., 2002).
KEY CONSIDERATIONS FOR REGIONAL OBSERVING NETWORKS IN A RANGE OF ECOSYSTEM TYPESWhile GOA-ON guidance helps set first-order requirements, and our rec-ommendations above and questions in Table 2 can refine them for specific regions, deciding on the key metrics of ecological variability within a given eco-system is a very complex task, given the infinite range of possibilities for combi-nations of species (and higher taxonomic levels), genotypes, and functional groups within communities. Through the use of a few examples from ecosystem types with existing regional coastal ocean acid-ification observing networks (Figure 3), we demonstrate how an observing net-work can be designed to be responsive to regional stakeholder needs. These sum-maries focus on key characteristics of the ecosystems that did or should guide the design and implementation of regional coastal ocean health observing networks, highlighting some of the distinct chal-lenges, stakeholder groups, and leverag-ing opportunities (Table 3). The myriad additional stressors affecting the four focal ecosystems are highlighted else-where in this issue (Breitburg et al., 2015). For other regions and ecosys-tem types, we highlight key attributes in Table 3, acknowledging the distinct man-agement purviews and practices asso-ciated with each.
Coral Reefs (Pacific Islands)Healthy coral reefs are among the most economically valuable ecosystems on Earth, providing vital ecosystem goods and services estimated to total between $29.8 billion and >$1 trillion annu-ally, depending on the study methods (e.g., Cesar et al., 2003; Brander et al.,
FIGURE 3. Schematic diagram of coastal ecosystem types described in the text, illustrating some key biogeochemical processes, ecosystem structures, and species. Coral reef (upper left), upwell-ing (upper right), estuaries (lower left), and Arctic (lower right). Courtesy of Amanda Dillon

Oceanography | June 2015 99
Table 3. Continued next page…
TABLE 3. Nested levels of observing network requirements for global versus regional to local types of ocean acidification observing networks. Needs listed at international and national scales should apply to some extent to all ecosystems listed in the coastal and estuarine regional ecosystems section below, where a greater level of detail is given, although some details are specific to the US context of these guidelines.
Scale or ecosystem type
Key stakeholdersKey societal
information or decision support needs
Key environmental processes driving
variation
Key ecosystem resources, species, or
conservation mandates
Key gaps in understanding
GLOBAL
Open ocean International science and policy communities.
Climate-quality observations for
trend and variability in OA conditions.
Models provide higher spatial resolution,
predictions at decade-to-century scales, and attribution of impacts of climate change vs. ocean acidification on marine ecosystems at
largest scale.
Interannual to decadal climate variability,
global ocean uptake of CO2 emissions,
anthropogenic climate change, large-scale
circulation of the ocean, wind patterns.
Open-ocean fisheries, ocean carbon sink.
Impacts of ocean acidification on lower trophic level species
that may have globally significant feedback on biogeochemical cycles.
Tipping points.
NATIONAL
Coastal oceans, estuaries, Great Lakes (generally)
Federal (Environmental Protection Agency, NOAA, US Fish and
Wildlife Service), state, and local agencies with water quality or coastal resource management mandates; Integrated
Ocean Observing System and its regional
associations; indigenous cultures; scientists.
Climate-quality water quality data and models
that can estimate human contribution to
changes in pH, oxygen, and related parameters
(related to potential for regulation of CO2
emissions under the US Clean Air Act and Clean
Water Act).
Coastal circulation, land-water interactions,
seasonality, extreme events.
Fisheries health protected by
Magnuson-Stevens Act, endangered
or threatened species protected by the Endangered
Species Act.
Seasonal to decadal variability in coastal
and estuarine biogeochemistry in
most places.
COASTAL/ESTUARINE ECOSYSTEMS
Nearshore/intertidal
Public (recreation, food harvest), tourism
industry, shellfish industry, shellfish/
fisheries managers, public health agencies
(e.g., potential for increased shellfishery closures due to ocean
acidification-related harmful algal bloom
[HAB] intensification), local- to state-scale
management.
Projected impacts on shellfish closures
due to direct and indirect impacts of ocean acidification
(e.g., impacts to viability of shellfish populations
or HABs).
Tidal cycle, extreme events, other natural (or
human) disturbance.
Shellfish, benthic fish, nursery for many pelagic fish species, seagrasses, kelps.
Expected impacts on ecological communities
due to differential susceptibility to OA and
other stressors; trophic or competitive interactions
among species.
Aquaculture
Industry, public (consumers,
environmental concerns about aquaculture).
Early warning observational and
forecast systems for carbonate system
variability on various time scales.
Storm-driven mixing, river inputs, upwelling.
Shellfish, finfish, kelp, and seaweed.
Sensitivity of many affected species.
Coral reefs
Local land/ocean managers, policymakers,
indigenous people, tourism/ecotourism industry, shellfish
(pearl oyster) industry, public (recreation, food harvesting).
Climate-quality observations to
understand long-term impacts of ocean acidification. Weather-quality observations to assess local-regional multistressor impacts. Local/state managers need information for land-use decisions
and coastal resource management. Biological
monitoring to assess changes in key reef builders.
Global change; El Niño; storms or extreme events;
nutrient, sediment, or sewage runoff or spills; coastal development and eutrophication; overfishing/harmful
fishing practices; disease; ecological
processes (production, respiration, calcification,
dissolution).
Tropical coral reef and associated finfish.
Coral species listed under the Endangered Species Act; stability
of carbonate reef framework; net
accretion vs. sea level rise rates for
low-lying atolls.
Interplay of water residence time and
biogeochemical processes driven by land-derived inputs
remain only qualitatively known; contribution of
microbial component to carbon cycling.

Oceanography | Vol.28, No.2100
2014). Warm-water coral reef ecosys-tems are structurally defined by their reef-building corals and crustose coral-line algae whose three-dimensional habi-tats support the highest levels of biodiver-sity of any marine ecosystem (Knowlton et al., 2010). From a human well-being perspective, coral reef ecosystems provide fisheries-related food security and liveli-hoods to hundreds of millions of people worldwide, with an estimated economic value of $5.7 billion; tourism-related livelihoods and revenue estimated at $9.6 billion; and protection to coastal communities from storm-induced waves, storm surges, tsunamis, and, when reef
accretion rates suffice, some of the impacts of sea level rise. In addition, long-standing cultural practices and the livelihoods of indigenous populations around the world have evolved around these reefs over mil-lennia (Bunce et al., 2000).
Major stakeholders include people liv-ing in “small island developing states” whose existence and subsistence depend on healthy coral reef resources; natural resource managers at various commu-nity, state, and federal levels; ecotourism and tourism industries; pearl oyster and aquarium trade industries; and nonprofit organizations with reef conservation missions. Stakeholder and decision-maker
information needs vary widely from long-term (decadal and longer) projections of reef health and stability to immediate con-cerns about selecting sites for sustainable economic (e.g., fisheries and tourism) and cultural uses.
According to a broad range of spe-cies response experiments under differ-ent CO2 emissions scenarios, coral reef communities will likely undergo signifi-cant ecological phase shifts this century as calcification of reef-building corals and crustose coralline algae is unable to keep pace with bioerosion and, potentially, dis-solution processes (reviewed in Brainard et al., 2012). As this occurs, many of
TABLE 3. Continued…
Scale or ecosystem type
Key stakeholdersKey societal
information or decision support needs
Key environmental processes driving
variation
Key ecosystem resources, species, or
conservation mandates
Key gaps in understanding
COASTAL/ESTUARINE ECOSYSTEMS, continued…
Upwelling/shelf to upper slope ecosystems
Benthic and pelagic fisheries industry and managers, national
environmental agencies with offshore management mandate,
state agencies with nearshore management
responsibility (where shelf is narrow).
Increased real-time information about water-column and
benthic environmental conditions and
biological response; seasonal to event-
scale forecasts; develop ecosystem indicators, including health and food quality metrics
(e.g., HABs toxin production metrics).
Upwelling, river plumes, and in situ metabolism, which can exacerbate
or mitigate acidification in coastal waters;
seasonal to long-term climate drivers; ocean circulation changes; ocean CO2 uptake.
Benthic shellfish, pelagic life stages of nearshore shellfish, finfish, and species protected by Marine Mammal Protection
Act and Endangered Species Act.
Impacts of changes in strength of any drivers (e.g., upwelling, ocean circulation, river runoff)
on environmental condition; sensitivity or ability to adapt of
many species; trophic plasticity of key species; ecosystem impacts due to food quality or health
challenges driven by climate change or ocean acidification (e.g., sea star
wasting disease).
ArcticIndigenous populations,
fisheries managers, scientists.
Weather-quality observations to assess
local and regional variations relevant to
Arctic fishery, land and ocean management; effects of short-term physical variability
on biogeochemistry (glaciers, ice seasonality).
Sea-ice changes (freshening, decreased
saturation state), enhanced surface ocean
uptake of CO2 (longer open water season),
changes in wind forcing and water temperature, longer growing season (for primary producers), stratification (impacts
nutrient supply).
Commercial species— salmon, pollock, Bering
Sea crab. Shellfish and copepods support higher trophic levels
(e.g., walrus, fish, seabirds, seals, whales).
Seasonality, interannual variability, winter
dynamics, under-ice dynamics.
Antarctic
International organizations
(e.g., Commission for the Conservation of
Antarctic Marine Living Resources), nations
with commercial fisheries (krill),
conservation groups.
Weather-quality observations to
assess role of short-term changes in the
physical system on the biogeochemistry (ice-shelf collapse, glacier
calving events, changes in seasonal ice retreat/
reformation).
Uptake of atmospheric CO2, sea-ice melt in
some regions, sea-ice gains in others, wind forcing (upwelling of CO2-rich water onto continental shelves),
Southern Ocean Oscillation (dominant
climate mode for changes in wind),
Southern Ocean is a large reservoir for anthropogenic CO2.
Krill: not commercially important in the
U.S., but supports higher trophic levels
of international conservation
concern (penguins, seals, whales).
Seasonality, interannual variability, winter
dynamics, under-ice dynamics.

Oceanography | June 2015 101
TABLE 4. Triennial coral sampling scheme used by NOAA’s Pacific Reef Assessment and Monitoring Program (Pacific RAMP) across the US-affiliated Pacific Islands.1 All measurements taken at lower Class levels are taken at all higher Class sites as well.
1 Pacific RAMP is supported jointly by NOAA’s Coral Reef Conservation Program and NOAA’s Ocean Acidification Program as the Pacific Islands component of NOAA’s National Coral Reef Monitoring Program.
2 DIC = dissolved inorganic carbon. TA = total alkalinity. S = salinity. T = temperature.3 Archipelagic regions are the Main Hawaiian Islands, Northwest Hawaiian Islands, American Samoa, Marianas, and Pacific Remote Islands Marine National Monument
Measurements2Number of locations per island or group
of islandsDepths
Duration of time measured or represented
PurposeDate
measurements started
Class 0 — Measurements done at most islands in each archipelagic region3
Stratified random water sampling for carbonate chemistry (DIC, TA, S, T, nutrients; Newton et al., 2014)
~10 samples/island Near-benthos 3–4 day snapshot every three years
To characterize long-term secular
changes in nearshore seawater chemistry
Initiated in 2006, shifted to stratified random in ~2012
Classes 1 and 1.5 — Measurements done at four to eight islands in each archipelagic region
Subsurface temperature recorders (STR)
4 cardinal direction transects
1–2, 5, 15, and 25 m
Every 30 min through 2012,
then every 5 min
To characterize long-term secular changes in near-
surface temperature
Initiated in 2001, standard depths
since 2012
Site-specific and stratified random water sampling for carbonate chemistry (DIC, TA, S, T, nutrients)
~25 samples/island
1 km offshore surface, at site
surface and near-benthos
3–4 day snapshot every three years
To characterize long-term secular
changes in nearshore seawater chemistry
Initiated in 2006, shifted to stratified random in ~2012
Deploy 5 calcification accretion units (CAUs) (Price et al., 2011)
Four at each 15 m STR site Benthos
Cumulative through triennial
cycle
To measure rates of net accretion or new production of calcium carbonate, primarily in the form of crustose
coralline algae
Initiated in 2010
Rugosity (30 vertical measurements along a 15 m long photo transect)
“ “ Snapshot every three years
To characterize topographic complexity Initiated in 2013
Photo quadrat or photomosaic surveys “ “ “ To assess benthic
taxonomic composition Initiated in 2013
Microbial water sampling “ “ “To characterize microbial
diversity of reef environments
Initiated in 2010
Class 2 — Measurements done at four islands in each archipelagic region.
Deploy three autonomous reef monitoring structures (ARMS)
At each 15 m STR site Benthos
Cumulative measurement
through triennial cycle between visits
To systematically monitor the biodiversity of the cryptic understudied
organisms living within the reef matrix
Initiated in 2010
Deploy five bioerosion measurements units (BMUs) “ “ “
To quantify rates of bioerosion of previously
scanned calcium carbonate blocks
Initiated in 2013
Deploy SeaFET pH sensors and automated water samplers during 3–4 day visits
Opportunistic, subset of Class 2 sites Near-benthos
1−3 days continuous for SeaFET, every
3−4 hours through a diel cycle for water samplers
To characterize diel cycle of carbonate chemistry Initiated in 2015
Collect coral cores “
5−15 m depending
on availability of massive coral heads
Every third triennium, decadal-scale observations
To measure changes in calcification rates of massive reef-building
corals, primarily Porites in recent decades
Initiated in 2010
Class 3 — Measurements done at one island in each archipelagic region.
Deploy high-resolution moored carbonate system sensors (e.g., MAPCO2 sensors)
Locations must be accessible for biweekly water
sampling and routine maintenance
Near surface only
Every three hours, daily telemetry, biweekly water
sampling for DIC, TA, S
To document diel and seasonal
variability in seawater carbonate chemistry
Kaneohe Bay initiated in 2012,
others sites not yet established

Oceanography | Vol.28, No.2102
the ecological, economic, cultural, and coastal protection values that coral reefs provide to tropical coastal communities could be devastatingly impacted. Coral reefs are also subject to myriad other human-related pressures that range in scale from local to global (Brainard et al., 2012; Breitburg et al., 2015, in this issue). At present, 22 coral species are protected in US waters through the US Endangered Species Act because of their vulnerabil-ity to the combined effects of these global and local stressors.
Under the National Coral Reef Moni-
toring Program (NCRMP), NOAA operates an integrated interdisciplin-ary regional coastal ocean acidification observing network for coral reefs, the Pacific Reef Assessment and Monitoring Program (Pacific RAMP) that encom-passes the US-affiliated Pacific Islands. Pacific RAMP was initiated in 2000 to begin establishing baseline conditions and monitoring the status and trends of coral reef ecosystems in the Pacific Islands (Figure 4). Standard Pacific RAMP sur-veys monitor the diversity, distribution, abundance, and condition of reef fishes,
corals, other macro- invertebrates, and benthic algae in the context of their sur-rounding habitats and varying oceano-graphic conditions (Table 4). As aware-ness and concerns about the potential impacts of ocean acidification on coral reefs grew and new stakeholders came to the table, additional approaches and methods to specifically monitor the eco-logical impacts of ocean acidification were discussed, developed, adapted, and incorporated into Pacific RAMP surveys over the period since 2005. In order to address concerns about potential losses of biodiversity and resilience due to ocean acidification, and considering the results of species response experiments on corals and crustose coralline algae, observations of seawater carbonate chemistry, crypto-biota and microbial diversity, and rates of calcification, calcium carbonate accre-tion, bioerosion, and coral growth have been added to Pacific RAMP surveys to better assess, monitor, and attribute the ecological impacts of ocean acidifica-tion on coral reefs (Figure 4). Because of financial constraints and the vastness of the region, the observing network was designed in a hierarchical manner with four levels of observations (“Classes” in Table 4 and Figure 4) spatially distrib-uted across the Pacific Islands region. Incorporation of existing complementary research has helped maximize the use of limited financial resources (e.g., NOAA’s Coral Reef Instrumented Monitoring Platform [CRIMP] buoy program). Under NCRMP, the coral monitoring approach and methods outlined are also used throughout the US coral reef ecosys-tems in the western Atlantic/Caribbean.
Design and implementation of the Pacific RAMP/NCRMP ocean acidifica-tion observing network required many discussions and decisions about what metrics to measure, what methods to use, spatial scales and temporal frequencies of sampling, and how well observations represent the ecosystem. Likewise, many resulting decisions required prioritizing the primary questions; leveraging institu-tional resources, finances, and expertise;
FIGURE 4. Schematic diagram of the hierarchical coral reef sampling scheme occupied on a triennial basis by the Pacific Reef Assessment and Monitoring Program (Pacific RAMP) and NOAA’s National Coral Reef Monitoring Program. Courtesy of Amanda Dillon

Oceanography | June 2015 103
and balancing and compromising around logistical and operational constraints. In this case, the ocean acidification observa-tions were primarily developed to align with and complement ongoing status and trends monitoring of Pacific RAMP/NCRMP, which in turn was designed to monitor all of the coral reef ecosystems of the US Pacific Islands to meet require-ments of the Coral Reef Conservation Act of 2000. The vastness and remoteness of the US Pacific Islands and budget realities constrain accessibility via relatively large ocean-going research vessels and limit surveys to a repeated three-year cycle of surveying the coral reefs of the main and Northwestern Hawaiian Islands in the first year; Commonwealth of Northern Mariana Islands, Guam, and Wake Atoll in year two; and American Samoa and Pacific Remote Islands Marine National Monument in year three.
Upwelling SystemsAlong the US West Coast, shellfish and finfish industries supported by the region’s high ecosystem productivity are economi-cally important, with $32.7 billion in sales impacts and roughly 220,000 jobs sup-ported by the commercial seafood indus-try in 2012 (NMFS, 2014). Calcifying invertebrates with benthic life stages and limited mobility represent four of the 10 most valuable commercial fisheries on the West Coast (Table 5). Recreational fishing accounted for 7.4 million fish-ing trips in 2012, supporting 18,800 jobs and yielding another $2.5 billion in sales (NMFS, 2014). Shellfish and finfish repre-sent highly valued tribal nation resources for both subsistence and ceremonial uses (i.e., non-commercial harvests; Radtke, 2011). Healthy marine ecosystems rep-resent high aesthetic and economic value for tourism and non-extractive recreation (e.g., whale watching, tidepooling).
Stakeholders are diverse. The eco-nomic importance of shellfish and finfish to West Coast state economies make these fisheries (both wild and hatchery- spawned), as well as those tasked with observing, forecasting, and managing
them, important stakeholders. Larval mortality events at Pacific Northwest shellfish hatcheries associated with cor-rosive water events galvanized regional shellfish and finfish industries in sup-port of ocean acidification monitoring, research, and mitigation efforts (Barton et al., 2015, in this issue). Fisheries man-agers require reliable forecasts of fisheries production and stock that rely on under-standing prey availability and the factors that influence it. Coastal and estuarine water quality managers are responsible for declaring water bodies impaired with respect to pH if values stray outside spec-ified limits under the Clean Water Act. Organizations with marine conservation missions, such as West Coast aquariums, are also critical stakeholders for building an ocean acidification observing network and can help both generate new results and communicate their importance to public and policy audiences.
Eastern boundary current upwelling systems like the California Current Large Marine Ecosystem (CCLME) constitute natural laboratories for studying ocean acidification in the context of multiple stressors (see Breitburg et al., 2015, in this issue). In addition to ocean acidification, wind-driven upwelling, intense produc-tion and in situ respiration on the shelf, and river inputs of waters high in CO2 and low in calcium result in a wide dynamic range of values for carbonate chemistry, oxygen, and nutrients, with strong spatial and temporal variability. Summertime conditions are frequently corrosive to calcium carbonate and become hypoxic (e.g., Grantham et al., 2004; Feely et al., 2008). A growing number of marine spe-cies exhibit reduced growth and survival when exposed to corrosive conditions, particularly when they are compounded by hypoxia. Observed sensitivity in eco-nomically or ecologically important spe-cies include early life stages of some oyster, mussel, scallop, and clam species under experimental conditions (Gobler et al., 2014; Waldbusser et al., 2014), as well as calcifying pelagic snails under in situ conditions (pteropods; Bednaršek
et al., 2014). Mortality of Dungeness crabs and other benthic organisms has been observed due to hypoxia events (e.g., Grantham et al., 2004), broaden-ing the stakeholder base and policy rel-evance. Forecasts of increasing intensity, extent, and duration of undersaturated conditions along the West Coast are con-cerning for the CCLME (Gruber et al., 2012; Hauri et al., 2013).
Efforts to monitor ocean acidifica-tion and hypoxic conditions and eco-system impacts in the CCLME have taken advantage of several complemen-tary platforms and programs, some new since 2005, others pre-existing. NOAA and many partners support a network of moored time-series stations along the West Coast that provide high- frequency ocean acidification-relevant measurements (Figure 5). Since 2009, efforts to integrate biogeochemical mea-surements into biological and fisher-ies survey cruises and vice versa have been initiated. Autonomous shipboard
TABLE 5. Commercial landings1 for most economically valuable fisheries on the US West Coast (California, Oregon, Washington) from 2003 to 2012.2 Gray shaded entries represent invertebrates with some calcium carbonate hard parts.
Species Total value(2003−2012)
Dungeness crab $1,312,233,926
California market squid $417,528,455
Pacific oyster $411,768,620
Pacific geoduck clam $400,817,096
Pacific hake (whiting) $334,971,917
Albacore tuna $291,808,355
Sablefish $271,104,039
Chinook salmon $220,238,947
Manila clam $199,346,707
Ocean shrimp $152,899,359
Pacific sardine $120,332,152
California spiny lobster $86,553,611
Dover sole $68,031,185
Sea urchin $75,240,059
1 Note: This database does not include the value of all aquaculture or of non-commercial tribal or recreational fisheries.
2 Source: http://www.st.nmfs.noaa.gov/commercial-fisheries/commercial-landings/annual-landings/index.

Oceanography | Vol.28, No.2104
analytical systems on NOAA Fisheries and other research vessels map relevant parameters at the surface. Water-column profiling surveys document subsurface conditions down to the depths of import-ant demersal fisheries. Fisheries obser-vations focused on quantifying phyto-plankton and zooplankton, including ichthyoplankton, date back as far as the 1940s on the West Coast, but due to fund-ing limitations, most only measure a sub-set of the chemical parameters needed to constrain ocean acidification and hypoxia conditions or only cover carbon measure-ments at a subset of stations. Although monitoring gaps abound, indicator spe-cies may provide insight into the time- integrated stresses on organisms that form the energetic basis of marine eco-systems and fisheries. Pteropods, which are sensitive to subtle changes in satura-tion state (Bednaršek et al., 2014), have been suggested as useful indicator taxa for monitoring ecological impacts of ocean acidification.
The first West Coast carbon cruise in 2007 and the contemporaneous shell-fish hatchery seed crisis resulted in a very effective research partnership in the Pacific Northwest and boosted efforts to create an integrated ocean acidification observing network on the West Coast (Feely et al., 2008; Barton et al., 2015, in this issue). The California Current Acidification Network (C-CAN) emerged from this partnership among West Coast ocean acidification stakeholders in 2010, as did real-time monitoring of seawater in hatcheries supported by state and fed-eral funds (Barton et al., 2015, in this issue). C-CAN facilitates communication on monitoring priorities and best prac-tices, management needs, and mitigation and adaptation strategies to diverse part-ners. Regional IOOS associations have also played a key role in coordination and communication among ocean acidi-fication stakeholders, are partners in the West Coast ocean acidification observing network, and provide invaluable access to
real-time data through Web-based por-tals. Finally, the Washington State Blue Ribbon Panel on Ocean Acidification and the West Coast Ocean Acidification and Hypoxia Science Panel have provided venues for communicating cutting-edge understanding of West Coast ocean acidi-fication conditions and ecological vulner-ability across a diverse network of stake-holders, and in so doing, have mobilized funding and political progress on ocean acidification mitigation and adaptation in West Coast states.
EstuariesEstuaries teem with life as a result of intense primary production at the land-ocean boundary. Here, organisms occupy a variety of muddy, sandy, or rocky sub-strates. Seagrass meadows, tidal wet-lands, or mangrove forests provide hab-itat and food while sequestering CO2 from the atmosphere or surface seawater. Estuaries act as nurseries for many spe-cies of fish and birds. Historically, estuar-ies and freshwater- influenced bays have been important sites for abundant oyster growth in the United States, with many East Coast estuaries having formerly extensive oyster shell reefs. Oysters and other shellfish provide a number of valued ecosystem services, including water col-umn filtration and shoreline protection.
Historically, humans have settled around estuaries, and their exploita-tion of resources has resulted in over-fishing, seafloor dredging, and eutro-phication and pollution of the waters. Yet, myriad stakeholders still depend on estuarine services and products. Those involved with monitoring and manag-ing estuaries—including marine labs and aquariums, shellfish growers, and tribal, state, and local governments—should be encouraged to monitor for ocean acidifi-cation along with their other mandates. Such partners present important lever-aging opportunities for installing car-bon sensors and collecting carbonate sys-tem water samples. Nationally, NOAA’s National Estuarine Research Reserve System is a network of 28 estuaries
FIGURE 5. Ocean acidification observing assets in the California Current Large Marine Ecosystem and Puget Sound (inset), a large urbanized fjord estuary. Symbols represent sampling stations: moored time-series stations (yellow/orange stars on coast and blue circles in Puget Sound); time-series stations sampled by ship- or land-based researchers on a recurring basis (all other symbols). Courtesy of Dana Greeley
Oceanography | June 2015 105
conducting extensive research and mon-itoring on climate change and resilience, habitat protection, and water quality, which would provide an excellent frame-work for added sensors and sampling.
The current status of ocean acidi-fication observing in estuaries varies greatly, but in general is underdeveloped. Estuarine ecosystems pose unique chal-lenges for developing regional coastal ocean health observing networks to address stressors such as ocean acidifi-cation, eutrophication, and hypoxia. The high degree of spatial heteorogeneity and temporal variability of biogeochemical processes makes it difficult to adequately characterize the natural environment (e.g., Feely et al., 2010; Wallace et al., 2014). Freshwater runoff from land into estuaries is typically enriched in inorganic and organic carbon and nutrients relative to coastal waters, and this can fuel intense estuarine outgassing and in situ metabo-lism, driving CO2, O2, and nutrient con-tent toward strong enrichment in some areas and depletion in other areas.
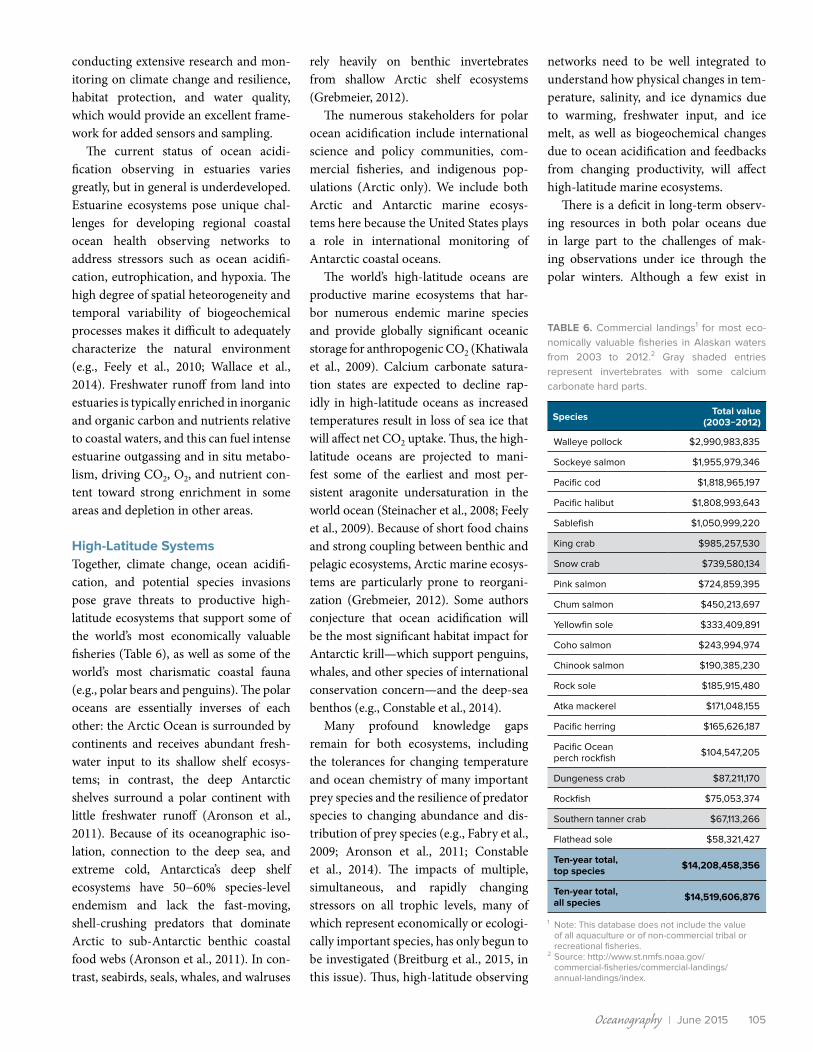
High-Latitude Systems Together, climate change, ocean acidifi-cation, and potential species invasions pose grave threats to productive high- latitude ecosystems that support some of the world’s most economically valuable fisheries (Table 6), as well as some of the world’s most charismatic coastal fauna (e.g., polar bears and penguins). The polar oceans are essentially inverses of each other: the Arctic Ocean is surrounded by continents and receives abundant fresh-water input to its shallow shelf ecosys-tems; in contrast, the deep Antarctic shelves surround a polar continent with little freshwater runoff (Aronson et al., 2011). Because of its oceanographic iso-lation, connection to the deep sea, and extreme cold, Antarctica’s deep shelf ecosystems have 50−60% species-level endemism and lack the fast-moving, shell-crushing predators that dominate Arctic to sub-Antarctic benthic coastal food webs (Aronson et al., 2011). In con-trast, seabirds, seals, whales, and walruses
rely heavily on benthic invertebrates from shallow Arctic shelf ecosystems (Grebmeier, 2012).
The numerous stakeholders for polar ocean acidification include international science and policy communities, com-mercial fisheries, and indigenous pop-ulations (Arctic only). We include both Arctic and Antarctic marine ecosys-tems here because the United States plays a role in international monitoring of Antarctic coastal oceans.
The world’s high-latitude oceans are productive marine ecosystems that har-bor numerous endemic marine species and provide globally significant oceanic storage for anthropogenic CO2 (Khatiwala et al., 2009). Calcium carbonate satura-tion states are expected to decline rap-idly in high-latitude oceans as increased temperatures result in loss of sea ice that will affect net CO2 uptake. Thus, the high- latitude oceans are projected to mani-fest some of the earliest and most per-sistent aragonite undersaturation in the world ocean (Steinacher et al., 2008; Feely et al., 2009). Because of short food chains and strong coupling between benthic and pelagic ecosystems, Arctic marine ecosys-tems are particularly prone to reorgani-zation (Grebmeier, 2012). Some authors conjecture that ocean acidification will be the most significant habitat impact for Antarctic krill—which support penguins, whales, and other species of international conservation concern—and the deep-sea benthos (e.g., Constable et al., 2014).
Many profound knowledge gaps remain for both ecosystems, including the tolerances for changing temperature and ocean chemistry of many important prey species and the resilience of predator species to changing abundance and dis-tribution of prey species (e.g., Fabry et al., 2009; Aronson et al., 2011; Constable et al., 2014). The impacts of multiple, simultaneous, and rapidly changing stressors on all trophic levels, many of which represent economically or ecologi-cally important species, has only begun to be investigated (Breitburg et al., 2015, in this issue). Thus, high-latitude observing
networks need to be well integrated to understand how physical changes in tem-perature, salinity, and ice dynamics due to warming, freshwater input, and ice melt, as well as biogeochemical changes due to ocean acidification and feedbacks from changing productivity, will affect high-latitude marine ecosystems.
There is a deficit in long-term observ-ing resources in both polar oceans due in large part to the challenges of mak-ing observations under ice through the polar winters. Although a few exist in
TABLE 6. Commercial landings1 for most eco-nomically valuable fisheries in Alaskan waters from 2003 to 2012.2 Gray shaded entries represent invertebrates with some calcium carbonate hard parts.
Species Total value(2003−2012)
Walleye pollock $2,990,983,835
Sockeye salmon $1,955,979,346
Pacific cod $1,818,965,197
Pacific halibut $1,808,993,643
Sablefish $1,050,999,220
King crab $985,257,530
Snow crab $739,580,134
Pink salmon $724,859,395
Chum salmon $450,213,697
Yellowfin sole $333,409,891
Coho salmon $243,994,974
Chinook salmon $190,385,230
Rock sole $185,915,480
Atka mackerel $171,048,155
Pacific herring $165,626,187
Pacific Ocean perch rockfish $104,547,205
Dungeness crab $87,211,170
Rockfish $75,053,374
Southern tanner crab $67,113,266
Flathead sole $58,321,427
Ten-year total, top species $14,208,458,356
Ten-year total, all species $14,519,606,876
1 Note: This database does not include the value of all aquaculture or of non-commercial tribal or recreational fisheries.
2 Source: http://www.st.nmfs.noaa.gov/commercial-fisheries/commercial-landings/annual-landings/index.

Oceanography | Vol.28, No.2106
high-latitude locations, moored time- series stations equipped with carbon sen-sors are generally lacking in Arctic and Antarctic waters. International GO-SHIP/Repeat Hydrography cruises have made decadal surveys of physical and biogeo-chemical parameters in Southern Ocean waters since the 1980s, but 2015 will bring the first Arctic decadal cruises. In Pacific Arctic waters (Bering and Chukchi Seas), a large number of biophysical moor-ings have been deployed for various peri-ods, starting in 1990, and carbon sensors (pCO2 and pH) were added to the longest deployed of them, M2 in the southern Bering Sea. In Arctic waters of the North Atlantic, the Iceland Sea time-series sta-tion established in 1983 has included carbon sensors since 2013. Recurring biological surveys to detect changes in pro-ductivity and biodiversity commenced in Arctic waters of the North Pacific in 2010, and the partners involved have facilitated international data sharing by providing online data portals. Similarly, because of the unique biodiversity in Antarctic waters, special attention was focused on analyzing biodiversity in the Southern Ocean as part of the International Polar Year (2007−2009) and the Census of Marine Life (2000−2010) (DeBroyer et al., 2014). Early efforts to develop coastal ocean acidification observing networks in Arctic and Antarctic shelf waters have rec-ognized the dearth of observing resources in high-latitude oceans, the importance of considering multiple stressors, and the need for integrating physical, chem-ical, and biological observations within existing monitoring frameworks to the extent possible in order to best address impacts of the many rapid changes occur-ring in polar marine ecosystems (NOAA Ocean Acidification Steering Committee, 2010; AMAP, 2013).
OBSERVING IN SUPPORT OF FORECASTINGAs noted from goal 3 of GOA-ON, obser-vations to support forecasts are a critical need for coastal stakeholders. Developing models, scaled by and tested with
observational data, is an important scien-tific direction; synergies with observing network development should be pursued. Observations improve oceanographic and ecosystem models through model validation; in turn, model results inform the observing community about where additional observing assets or detailed process studies may be needed to further illuminate aspects of ocean acidification (e.g., Curchitser and Batchelder, 2013). Model development is needed on sev-eral scales: to project future conditions years out so coastal resource managers and decision makers can respond and to forecast conditions days out so that aqua-culture and other fisheries can adapt their immediate practices.
CONCLUSIONSDeveloping and sustaining a linked global network of integrated coastal ocean acidification observing networks is an overwhelming but critically import-ant task in this era of rapid environmen-tal change and decreasing funding for scientific research and long-term moni-toring. Partnerships, stakeholder engage-ment, and institutional investment are imperative for the long-term sustainabil-ity of coastal ocean observing networks, but much of the needed growth in mon-itoring scope can be folded into existing water quality and natural resource mon-itoring efforts, requiring lower levels of funding than would be needed to imple-ment completely new observing efforts. In addition to validation of predictive models, coastal ocean health observing networks will provide a long-term con-text for process studies (Pfister et al., 2014), will be a framework for assessing potential adaptation and mitigation strat-egies, and will keep society, stakeholders, and decision makers abreast of evolving conditions of our coastal oceans, the rich living resources they host, and the essen-tial ecosystem goods and services they provide to coastal communities. Beyond simply gaining scientific understanding of these important and complex ecosys-tems, a sustained, long-term observing
network that will allow regular assess-ment of coastal ecosystem ocean health and the efficacy of adaptation and miti-gation efforts is needed (see Schindler and Hilborn, 2015).
ACKNOWLEDGMENTS. The authors wish to thank the Ocean Carbon and Biogeochemistry Program and its Ocean Acidification Subcommittee for organizing and hosting the Second Ocean Acidification Principal Investigators’ Meeting, where the foundation for this article was laid. We also thank the National Science Foundation, National Aeronautics and Space Administration, and the National Oceanic and Atmospheric Administration for funding the meet-ing, as well as much of the science that informed our productive discussions. We thank Jon Hare for dis-cussion that particularly improved the manuscript, as well as Richard Feely, the editors, and two anonymous reviewers for constructive reviews on earlier versions. Alin thanks NOAA’s Ocean Acidification Program and Pacific Marine Environmental Laboratory (PMEL con-tribution number 4267) for supporting her role in the meeting and paper.
REFERENCESAlford, M.H., J.B. Mickett, S. Zhang, P. MacCready,
Z. Zhao, and J. Newton. 2012. Internal waves on the Washington continental shelf. Oceanography 25(2):66–79, http://dx.doi.org/ 10.5670/oceanog.2012.43.
Alin, S.R., R.A. Feely, A.G. Dickson, J.M. Hernández-Ayón, L.W. Juranek, M.D. Ohman, and R. Goericke. 2012. Robust empirical relationships for esti-mating the carbonate system in the southern California Current System and application to CalCOFI hydrographic cruise data (2005–2011). Journal of Geophysical Research 117, C05033, http://dx.doi.org/ 10.1029/2011JC007511.
AMAP. 2013. AMAP Assessment 2013: Arctic Ocean Acidification. Arctic Monitoring and Assessment Programme (AMAP), Oslo, Norway, 99 pp.
Aronson, R.B., S. Thatje, J.B. McClintock, and K.A. Hughes. 2011. Anthropogenic impacts on marine ecosystems in Antarctica. Annals of the New York Academy of Sciences 1,223:82–107, http://dx.doi.org/10.1111/j.1749-6632.2010.05926.x.
Barton, A., G.G. Waldbusser, R.A. Feely, S.B. Weisberg, J.A. Newton, B. Hales, S. Cudd, B. Eudeline, C.J. Langdon, I. Jefferds, and others. 2015. Impacts of coastal acidification on the Pacific Northwest shellfish industry and adaptation strategies imple-mented in response. Oceanography 28(2):146–159, http://dx.doi.org/10.5670/oceanog.2015.38.
Bednaršek, N., R.A. Feely, J.C.P. Reum, B. Peterson, J. Menkel, S.R. Alin, and B. Hales. 2014. Limacina helicina shell dissolution as an indicator of declin-ing habitat suitability owing to ocean acidi-fication in the California Current Ecosystem. Proceedings of the Royal Society B 281:20140123, http://dx.doi.org/10.1098/rspb.2014.0123.
Brainard, R.E., C. Birkeland, C.M. Eakin, P. McElhany, M.W. Miller, M. Patterson, and G.A. Piniak. 2012. Status Review Report of 82 Candidate Coral Species Petitioned Under the U.S. Endangered Species Act. NOAA Technical Memorandum. NOAA-TM-NMFS-PIFSC-27, Washington, DC, 533 pp.
Brander, L.M., D. Narita, K. Rehdanz, and R.S.J. Tol. 2014. The economic impacts of ocean acidifica-tion. Pages 1–18 in Handbook on the Economics of Ecosystem Services and Biodiversity. P.A.L.D. Nunes, P. Kumar, and T. Dedeurwaerdere, eds, Edward Elgar Publishing.

Oceanography | June 2015 107
Breitburg, D.L., J. Salisbury, J.M. Bernhard, W.-J. Cai, S. Dupont, S.C. Doney, K.J. Kroeker, L.A. Levin, W.C. Long, L.M. Milke, and others. 2015. And on top of all that… Coping with ocean acidification in the midst of many stressors. Oceanography 28(2):48–61, http://dx.doi.org/10.5670/oceanog.2015.31.
Bunce, L., P. Townsley, R. Pomeroy, and R. Pollnac. 2000. Socioeconomic Manual for Coral Reef Management. Australian Institute of Marine Science, Townsville, Australia, 264 pp.
Byrne, R.H. 2014. Measuring ocean acidifi-cation: New technology for a new era of ocean chemistry. Environmental Science and Technology 48:5,352–5,360, http://dx.doi.org/ 10.1021/es405819p.
Cesar, H., L. Burke, and L. Pet-Soede. 2003. The Economics of Worldwide Coral Reef Degradation. Cesar Environmental Economics Consulting, Arnhem, The Netherlands.
Constable, A.J., J. Melbourne-Thomas, S.P. Corney, C. Barbraud, D.K.A. Barnes, N.L. Bindoff, P.W. Boyd, A. Brandt, D.P. Costa, A.T. Davidson, and others. 2014. Climate change and Southern Ocean eco-systems: Part I. How changes in physical habi-tats directly affect marine biota. Global Change Biology 20(10):3,004–3,025, http://dx.doi.org/10.1111/gcb.12623.
Curchitser, E.N., and H.P. Batchelder. 2013. Advances in physical, biological, and cou-pled ocean models during the US GLOBEC program. Oceanography 26(4):52–67, http://dx.doi.org/10.5670/oceanog.2013.75.
DeBroyer, C., P. Koubbi, H.J. Griffiths, B. Raymond, C. d’Udekem d’Acoz, A.P. Van de Putte, B. Danis, B. David, S. Grant, J. Gutt, and others, eds. 2014. Biogeographic Atlas of the Southern Ocean. Scientific Committee on Antarctic Research, Cambridge.
Duffy, J.E., L.A. Amaral-Zettler, D.G. Fautin, G. Paulay, A. Tatiana, H.M. Sosik, J.J. Stachowicz, and T.A. Rynearson. 2013. Envisioning a marine biodiversity observation network. BioScience 63:350–361, http://dx.doi.org/10.1525/bio.2013.63.5.8.
Fabry, V.J., J.B. McClintock, J.T. Mathis, and J.M. Grebmeier. 2009. Ocean acidification at high latitudes: The bell-wether. Oceanography 22(4):160–171, http://dx.doi.org/ 10.5670/oceanog.2009.105.
Feely, R.A., S.R. Alin, J. Newton, C.L. Sabine, M. Warner, A. Devol, C. Krembs, and C. Maloy. 2010. The combined effects of ocean acidifi-cation, mixing, and respiration on pH and car-bonate saturation in an urbanized estuary. Estuarine, Coastal and Shelf Science 88:442–449, http://dx.doi.org/10.1016/j.ecss.2010.05.004.
Feely, R.A., S.C. Doney, and S.R. Cooley. 2009. Ocean acidification: Present condi-tions and future changes in a high-CO2 world. Oceanography 22(4):36–47, http://dx.doi.org/ 10.5670/oceanog.2009.95.
Feely, R.A., C.L. Sabine, J.M. Hernandez-Ayon, D. Ianson, and B. Hales. 2008. Evidence for upwelling of corrosive “acidified” water onto the continental shelf. Science 320:1,490–1,492, http://dx.doi.org/10.1126/science.1155676.
Fisher, R., R.A. O’Leary, S. Low-Choy, K. Mengersen, R.E. Brainard, and M.J. Caley. 2015. Species rich-ness on coral reefs and the pursuit of conver-gent global estimates. Current Biology 4:500–505, http://dx.doi.org/10.1016/j.cub.2014.12.022.
FAO (Food and Agriculture Organization). 2014. The State of World Fisheries and Aquaculture: Opportunities and Challenges. Rome, http://www.fao.org/3/a-i3720e.pdf.
Gattuso, J.-P., M. Frankignoulle, and R. Wollast. 1998. Carbon and carbonate metabolism in coastal aquatic ecosystems. Annual Review of Ecology and Systematics 29:405–434, http://dx.doi.org/10.1146/annurev.ecolsys.29.1.405.
Gobler, C.J., E.L. DePasquale, A.W. Griffith, and H. Baumann. 2014. Hypoxia and acidification have additive and synergistic negative effects on the growth, survival, and metamorphosis of early life stage bivalves. PLoS ONE 9, http://dx.doi.org/ 10.1371/journal.pone.0083648.
Grantham, B.A., F. Chan, K.J. Nielsen, D.S. Fox, J.A. Barth, A. Huyer, J. Lubchenco, and B.A. Menge. 2004. Upwelling-driven nearshore hypoxia sig-nals ecosystem and oceanographic changes in the northeast Pacific. Nature 429:749–754, http://dx.doi.org/10.1038/nature02605.
Grebmeier, J.M. 2012. Shifting patterns of life in the Pacific Arctic and sub-Arctic seas. Annual Review of Marine Science 4:63–78, http://dx.doi.org/ 10.1146/annurev-marine-120710-100926.
Gruber, N., C. Hauri, Z. Lachkar, D. Loher, T.L. Frölicher, and G.K. Plattner. 2012. Rapid pro-gression of ocean acidification in the California Current System. Science 337:220–223, http://dx.doi.org/10.1126/science.1216773.
Hauri, C., N. Gruber, A.M.P. McDonnell, and M. Vogt. 2013. The intensity, duration, and severity of low aragonite saturation state events on the California continental shelf. Geophysical Research Letters 40:3,424–3,428, http://dx.doi.org/10.1002/grl.50618.
Interagency Working Group on Ocean Acidification. 2014. Strategic Plan for Federal Research and Monitoring of Ocean Acidification. Washington, DC, 84 pp., https://www.whitehouse.gov/sites/default/files/microsites/ostp/NSTC/iwg-oa_strategic_plan_march_2014.pdf.
Juranek, L.W., R.A. Feely, W.T. Peterson, S.R. Alin, B. Hales, K. Lee, C.L. Sabine, and J. Peterson. 2009. A novel method for determination of ara-gonite saturation state on the continental shelf of central Oregon using multi-parameter rela-tionships with hydrographic data. Geophysical Research Letters 36, L24601, http://dx.doi.org/ 10.1029/2009GL040778.
Karl, T.R., V.E. Derr, D.R. Easterling, C.K. Folland, D.J. Hofmann, S. Levitus, N. Nicholls, D.E. Parker, and G.W. Withee. 1995. Critical issues for long-term climate monitoring. Climatic Change 31:185–221, http://dx.doi.org/10.1007/BF01095146.
Khatiwala, S., F. Primeau, and T. Hall. 2009. Reconstruction of the history of anthropogenic CO2 concentrations in the ocean. Nature 462:346–349, http://dx.doi.org/10.1038/nature08526.
Knowlton, N., R.E. Brainard, R. Fisher, M. Moews, L. Plaisance, and M.J. Caley. 2010. Coral reef bio-diversity. Pp. 65–78 in Life in the World’s Oceans: Diversity, Distribution, Abundance. Wiley-Blackwell, Oxford, UK.
NMFS (National Marine Fisheries Service). 2014. Fisheries Economics of the United States 2012. Economics and Sociocultural Status and Trends Series, NOAA Technical Memorandum, NMFS-F/SPO-137, 183 pp., https://www.st.nmfs.noaa.gov/Assets/economics/documents/feus/2012/FEUS2012.pdf.
Newton, J.A., R.A. Feely, E.B. Jewett, P. Williamson, and J. Mathis. 2014. Global Ocean Acidification Observing Network: Requirements and Governance Plan. GOA-ON, 57 pp., http://goa-on.org/docs/GOA-ON_Plan_final_Sept_2014.pdf.
NOAA Ocean Acidification Steering Committee. 2010. NOAA Ocean and Great Lakes Acidification Research Plan. NOAA Special Report, National Oceanic and Atmospheric Administration, Washington, DC, 143 pp.
Pfister, C.A. A.J. Esbaugh, C.A. Frieder, H. Baumann, E.E. Bockmon, M.M. White, B.R. Carter, H.M. Benway, C.A. Blanchette, E. Carrington, and
others. 2014. Detecting the unexpected: A research framework for ocean acidification. Environmental Science & Technology 48:9,982–9,994, http://dx.doi.org/10.1021/es501936p.
Radtke, H.D. 2011. Washington State Commercial Fishing Industry: Total Economic Contribution. Prepared by H. Radtke, Natural Resource Economist for Seattle Marine Business Coalition, Yachats, OR, 19 pp.
Schindler, D.E., and R. Hilborn. 2015. Prediction, precaution, and policy under global change: Emphasize robustness, monitoring, and flexibil-ity. Science 347:953–954, http://dx.doi.org/10.1126/science.1261824.
Steinacher, M., F. Joos, T.L. Frölicher, G.-K. Plattner, and S.C. Doney. 2008. Imminent ocean acidi-fication in the Arctic projected with the NCAR global coupled carbon cycle-climate model. Biogeosciences 6:515–533, http://dx.doi.org/ 10.5194/bg-6-515-2009.
Trenberth, K.E., T.R. Karl, and T.W. Spence. 2002. The need for a systems approach to climate obser-vation. Bulletin of the American Meteorological Society 83:1,593–1,602, http://dx.doi.org/10.1175/BAMS-83-11-1593.
Waldbusser, G.G., B. Hales, C.J. Langdon, B.A. Haley, P. Schrader, E.L. Brunner, M.W. Gray, C.A. Miller, and I. Gimenez. 2014. Saturation-state sensi-tivity of marine bivalve larvae to ocean acidi-fication. Nature Climate Change 5:273–280, http://dx.doi.org/10.1038/NCLIMATE2479.
Wallace, R.B., H. Baumann, J.S. Grear, R.C. Aller, and C.J. Gobler. 2014. Coastal ocean acidi-fication: The other eutrophication problem. Estuarine, Coastal and Shelf Science 148:1–13, http://dx.doi.org/10.1016/j.ecss.2014.05.027.
AUTHORS. Simone R. Alin ([email protected]) is Supervisory Oceanographer, Pacific Marine Environmental Laboratory, National Oceanic and Atmospheric Administration (NOAA), Seattle, WA, USA. Russell E. Brainard is Division Chief and Supervisory Oceanographer, Coral Reef Ecosystem Division, Pacific Islands Fisheries Science Center, National Marine Fisheries Service, NOAA, Honolulu, HI, USA. Nichole N. Price is Senior Research Scientist, Bigelow Laboratory for Ocean Sciences, East Boothbay, ME, USA. Jan A. Newton is Co-director, Washington Ocean Acidification Center, University of Washington, Seattle, WA, USA. Anne Cohen is Associate Scientist with Tenure, Woods Hole Oceanographic Institution, Woods Hole, MA, USA. William T. Peterson is Oceanographer, Northwest Fisheries Science Center, National Marine Fisheries Service, (NOAA), Newport, OR, USA. Eric H. DeCarlo is Professor and Chair, Marine Geology and Geochemistry Division, Department of Oceanography, University of Hawaii at Manoa, Honolulu, HI, USA. Elizabeth H. Shadwick is Assistant Professor, Virginia Institute of Marine Science, College of William and Mary, Gloucester Point, VA, USA. Scott Noakes is Research Scientist, Center for Applied Isotope Studies, University of Georgia, Athens, GA, USA. Nina Bednaršek is Science Policy Specialist, School of Marine and Environmental Affairs, University of Washington, Seattle, WA, USA.
ARTICLE CITATIONAlin, S.R., R.E. Brainard, N.N. Price, J.A. Newton, A. Cohen, W.T. Peterson, E.H. DeCarlo, E.H. Shadwick, S. Noakes, and N. Bednaršek. 2015. Characterizing the natural system: Toward sustained, integrated coastal ocean acidification observing networks to facilitate resource management and decision sup-port. Oceanography 28(2):92–107, http://dx.doi.org/ 10.5670/oceanog.2015.34.