characterizing wind turbine inflow and wakes daniel a
TRANSCRIPT

Characterizing Wind Turbine Inflow and Wakes through comparison of SODAR and Met Tower Observations—A part of TWICS: The Turbine Wake Inflow Characterization Study Abstract Wind offers an inexhaustible domestic energy source with minimal greenhouse gas emissions. To maximize energy generation from wind turbines it is essential to understand the influence of inflow conditions and wakes on wind turbine energy production. In accordance with this goal, the TWICS field campaign was conducted in April and May 2011 at the National Renewable Energy Lab’s (NREL) National Wind Technology Center (NWTC) in the complex terrain downwind of Colorado’s Front Range mountains. TWICS employed meteorological monitoring towers and remote sensing systems to provide a three dimensional spatio-temporal illustration of the inflow to and wake from a 2.3 MW turbine with a 100 meter rotor diameter. An important step in analyzing the TWICS data was quantifying the performance of the different measurement devices that were used. This research compares simultaneous measurements taken during TWICS by a Second Wind Triton Sodar and from the NREL M2 80 meter meteorological tower, which were located one kilometer apart. During the TWICS campaign, we found strong linear correlations between wind speed measurements at 50 and 80 meters from the sodar and met tower. The high correlation suggests that flow is usually homogenous across the NWTC at time scales of ten minutes, but that there are also occasional periods of inhomogeneous flow. Wind speed correlations were also found to vary with time of day. This diurnal variation could represent different conditions at the sodar and tower site because of localized heating and turbulent mixing, but may also be due to changes in sodar performance as atmospheric stability changes during the course of the day. Results from this research will feed into future analysis of data collected during TWICS and help improve our understanding of turbine performance in the atmospheric boundary layer.
Daniel A. Pollak SOARS® Summer 2011
Science Research Mentors: Julie Lundquist Writing and Communications Mentor: Dave Hart Contributing Mentors: Matthew Aitken, Cody Kirkpatrick, Andy Clifton Acknowledgements The Significant Opportunities in Atmospheric Research and Science (SOARS) Program is managed by the University Corporation for Atmospheric Research (UCAR) with support from participating universities. SOARS is funded by the National Science Foundation, the National Oceanic and Atmospheric Administration (NOAA) Climate Program Office, the NOAA Oceans and Human Health Initiative, the Center for Multi-Scale Modeling of Atmospheric Processes at Colorado State University, and the Cooperative Institute for Research in Environmental Sciences. SOARS is a partner project with Research Experience in Solid Earth Science for Student (RESESS). 1 Introduction 1.1 Motivation Harnessing the wind to power our homes, businesses, and communities will spring the United States towards a cleaner energy future and will help reduce our nation’s carbon footprint. The wind resource in the United States is vast, free and is overhead, ready for use. In order to encourage exploitation of this amazing resource, the United States Department of Energy (DOE) has called for wind energy to generate 20% of America’s energy need by 2030. To answer this call, there is an increased necessity to foster strong understanding of the inflow characteristics of the atmosphere in all wind-prone landscapes and the characteristics of the wakes that are created by the wind turbines. In addition, it is important to understand the intricate interactions between the atmosphere and wind turbines, over

all land types and terrain, and the effects that the subsequent wakes have on downstream turbines. The impetus for this study is based on the need to understand these concepts. Wind energy has grown rapidly in the United States over the last decade with more than 1,000 wind turbines currently in operation that can produce greater than 2.0 Mega-Watts (MW) of power. Additionally, half of new turbines installed in 2009 had hub heights ranging from 60-100 meters above ground level (AGL) and blades extending more than 40 meters out from the hub. (DOE Wind & Water Power Program 2010). As these turbines extend higher in to the atmosphere it has become increasingly necessary to develop new ways to measure atmospheric conditions around the turbine. In addition to limitations of building meteorological towers that reach the full height of modern utility-scale turbines, the data from conventional anemometers mounted on these towers only provide data for one specific point and do not show the spatial variability and reality of wind speed, wind direction and turbulence (Lundquist et al. 2009). As a result, development and use of remote sensing technologies for this purpose have become increasingly important. The two remote sensing systems used are the SOund Detection and Ranging (SODAR) and the LIght detection and ranging (LIDAR). Similar to a weather radar, the SODAR and LIDAR send out radiation and can determine characteristics of the air through the speed and time in which the pulses of radiation return via the Doppler effect. Instead of emitting radio waves as weather radars do, the SODAR and LIDAR utilize sound and light waves, respectively. These remote sensing techniques allow for concise measurement of the volume that intersects the turbine inflow or wake. The scanning lidar makes it possible to capture these spatial temporal characteristics of turbine wakes. (Lundquist et al. 2009; Harris and Hand, 2006). To increase confidence from the data of these remote sensing systems, it is important to determine the reliability and accuracy of their measurements, especially if they are to replace the conventional met tower systems that remain the only widely accepted form of measurements
by the wind industry. (Giordano 2010, Scott et al. 2010). This study will examine the performance and consistency of SODAR observations in complex terrain and in harsh weather conditions. (Borgeois et al 2007). 1.2 Basics Wind energy is, in essence, a type of solar energy. Wind is caused by the uneven heating of the Earth’s surface (and thus atmosphere) and is modified by the various topography and landforms that appear on Earth. This wind is a form of kinetic energy and can be harnessed through wind turbines. These turbines turn the kinetic energy into mechanical energy which can then be transformed into electricity through a generator. Turbines come in various sizes, but it is the large utility-sized turbines (over 1 megaWatt (MW)) that could help provide bulk power to the power grid, propelling the United States towards its 20% wind energy by 2030 goal. (US-DOE-EERE 2011). 1.3 TWICS The Turbine Wake Inflow and Characteristic Study, or TWICS, was designed to help answer the DOE 20% by 2030 call by providing more information on how the atmosphere inflow and wind turbine interact, and the characterization of the turbulent structure of wind turbine wakes, especially over complex terrain. The insight gathered by TWICS can improve wind farm site placement and design, create more robust turbines, and provide important input into mesoscale wind models. This in turn will lead to more energy efficient wind farms and will increase production and lower the cost of this wind-generated energy. The goals of the project were to 1) assess the structure and variability of wakes from multi-MW turbines, 2) to assess how well mesoscale models perform in prediction turbine inflow in complex terrain, and 3) To assess how well turbine wake models represent observed structure and variability of wakes (Lundquist et al 2009).

The TWICS campaign took place at the National Wind Technology Center (NWTC), part of the National Renewable Energy Laboratory (NREL), just south of Boulder, Colorado. The turbine of interest was a 2.3 MegaWatt (MW) wind turbine which stands 80 meters high and has blades that extend approximately 50 meters from the hub (Figure 1). The TWICS team gathered data from NREL’s M2 met tower, SecondWind’s Triton Sodar, NOAA’s (National Oceanic and Atmospheric Administration) high resolution Doppler lidar (HRDL) and CU’s (University of Colorado) Windcube lidar. All were located upwind of the turbine (Figure 2). During the months of April and May 2011, data were taken during times of high-magnitude prevailing wind events,[which here is 292 degrees] called herein intensive observing periods (IOPs). Four IOPs occurred during the Spring 2011 study. Before diving into the intricacies of TWICS, a description of the project’s two foci will be provided in addition to results from previous studies. 1.4 Characterizing Atmospheric Inflow There are two key concepts that with better understanding can help to create more energy efficient wind farms that are located optimally. The first is understanding the atmospheric inflow characteristics incident on the wind turbine. Give that many wind turbines now reach heights of 40-story buildings and are thus located in a more complicated and variable part of the atmosphere, this need has never been greater. With increasing turbine heights, the in-situ measurements made by sonic anemometers on meteorological (met) towers become less valuable as met tower heights do not exceed those of the turbine. As a result, remote sensing systems such as the SODAR and LIDAR are used to “see” higher into the atmosphere, supplementing the sonic anemometer measurements. Comparing data from the met tower, SODAR and LIDAR can assist in determining the accuracy and calibration needed for the remote sensing devices. For wind turbines placed in mountainous or hilly locations, it is advantageous to do such a study, as
many of these areas have great potential for wind power generation. In 2008, a study sponsored by the European Union was launched in a hilly location in Bosnia-Herzegovina to increase knowledge of the turbulence intensity and inflow wind characteristics in complex terrain. This study took wind measurements carried out with a 30 meter met tower, a SODAR and a LIDAR and is much like the present study. (Borgeois et al. 2009) The Bosnia-Herzegovina site, Maligrad, was selected because it is known for its variability in wind conditions and its widely fluctuating meteorological conditions. The main prevailing wind that drives these conditions is a katabatic wind called the Bora wind (in Bosnia and Croatia) and has characteristics of high winds and large turbulence intensities. The two motivations of the study were as follows: (1) To assess the performance of the SODAR and LIDAR under various and intense wind and meteorological conditions and to (2) analyze the suitability of this site for a future wind farm and determine the wind turbine design that would best fit under the local wind conditions (Borgeois et al. 2009). Data were taken from the 30 meter met tower, SODAR and LIDAR for 18 days in November and December of 2007. All three measured wind speed and in addition, the SODAR and LIDAR measured vertical wind profiles and turbulence intensities. It was found that the SODAR and LIDAR had cohesive agreement and were able to take high-quality data up to 100m above ground level during most times (Figure 3). An exception was during events where winds were above 20 m/s due to noise interference. Turbulence intensities (TI) calculated from the SODAR and LIDAR had biases with winds greater than 15 m/s but TI were almost uniform between 30 and 100 m ABL. A summary of available data of the SODAR measurements at each height level at Maligrad is illustrated in Figure 4. (Borgeois 2008) Similar to the Mostar study, the TWICS measurement campaign took place in a location with complex terrain with a strong prevailing wind and myriad of meteorological conditions. Just downwind of the Rocky Mountains, the site experiences many of the meteorological

phenomena including downslope wind storms, microbursts, and complex stability effects such as density currents and drainage flows from Eldorado canyon located west of the National Wind Technology Center (NWTC) in Boulder, Colorado. These unique conditions make the NWTC site an appropriate site for a lidar-based study of the turbine-atmosphere interaction (Lundquist et al 2009). 1.5 Turbine Wakes The second concept involves the state of the wind directly after it passes by a wind turbine. Since kinetic energy is pulled out of the wind from turbines, the wind speed directly downstream of a turbine will be less than the original inflow speed. The wakes behind the turbine are in essence waves of wind speed deficit and are, “similar to the watery wakes behind boats” (NOAA News 2011) The wakes expand in both the vertical and lateral directions (Figure 5). In the case of a single, isolated wind turbine, the detrimental effects of these wakes will be unimportant as there are no turbines downstream that would need to harness the wind. These wakes expand downstream and eventually dissipate. A study completed in Northern Germany in July 2009 used lidar to visualize the magnitude and directionality of wind turbine wakes as they propagate downstream. Behind these 5 MW turbines wakes, (wind speed deficits) extended downstream 400 meters and about 100 meters up vertically (Figure 6a,b) (Kasler et al. 2010). This study was conducted in a relatively flat area and thus there is still a need to examine wake characterisitcs in complex terrain. In addition, it was important for this study as it fostered more knowledge that could be applied towards the study of multi-MW wind farms with numerous turbines. The effects of wakes at these wind farms are evident and important to understand. Many previous studies have focused on large offshore wind farms (Figure 7). In one study, two offshore Danish wind farms were examined—the Nysted and Horns Rev farms. Within each wind farm, an exact row (ER) was defined as a row of turbines that follow the
prevailing wind (Figure 8). In addition, three oblique angles to this ER were defined on either side of the ER (-15,-10,-5,5,10,15 degrees). Each of these wind farms had eight columns that were essentially orthogonal to the prevailing wind direction. They found that the power deficit induced by wakes reached a minimum threshold on downstream turbines. This minimum deficit value is termed the wake asymptote and in the Barthelmie and Jensen (2010) study was found to be 60% of the free stream power at the first turbine (Figure 9). This percentage is called the normalized power and is used to describe the power deficit caused by these wakes. Simply speaking, normalized power is the percentage of power output actually generated compared with the maximum possible power. While consistent, the column in which the threshold was reached depended on the ER value. When looking down the ER, the power minimum was reached at the turbine in column 2. “For higher angle wind directions, the power reduction at the second turbine was large, but reductions continued for each subsequent turbine” (until asymptote). (Barthelmie and Pryor et al. 2010) Wind farms can be located both on land and offshore. Most recent studies have focused on understanding turbine wakes at large wind farms that are located offshore. This is largely a result of the less turbulent flow that is often seen over the shallow marine boundary layer and the possibility to simplify the flow moving into the wind farm. Given the large potential for wind energy sequestration in mountainous areas, it is important to note and characterize wakes and atmospheric inflow first for individual turbines in such terrain. 1.6 Instrumentation & Current Study Having a diverse group of instruments to measure characteristics of wind and turbulence is beneficial and essential to further the understanding of atmospheric inflow and turbine wakes around wind farms. There are conventional, in-situ measurements from meteorological observations towers (the M2 met

tower) and remote measurements from instruments such as sodars and lidars. A SOund Detection and Ranging (SODAR) is much like a Doppler radar except that sound waves are used instead of radio waves for particle detection. SODAR systems are used to measure wind speeds at multiple heights above ground level and are therefore help characterize the lowest layer of the atmosphere—the planetary boundary layer (PBL) and surface layer (SL). They are commonly known as wind profilers. A lidar is very similar to a sodar and radar, but in this case light is employed. Due to light’s shorter wavelengths it can use aerosol particles as atmospheric scattering targets. By observing the Doppler shift of the light scattered by aerosols, the lidar can remotely measure air particles. Sodar measurements are not always able to produce complete time series due to factors such as surrounding noise, clouds, atmospheric stability or precipitation that in turn, leads to data gaps. These effects are filtered out (Borgeois 2008) Both sodars and lidars are useful in the study of wind inflow and turbine wakes in that they can, especially in addition to meteorological towers, provide a four dimensional (time being the fourth dimension) view. In this branch research of TWICS, focus will be given to comparing data from the M2 meteorological tower and the Triton sodar. Sodars offer a portable way to characterize wind speed, direction and turbulence intensity at multiple levels above the ground unlike their non-stationary met tower counterparts. The goal of this research is two-fold: 1) to validate Triton sodar data from M2 met tower data using the met tower as the accepted NWTC site inflow instrument, and 2) to characterize turbine inflow using both instruments (Figure 10). A successful validation of the sodar data will provide confidence that sodars offer a viable alternative to met towers in locations without access to such tower data. Additionally, successful validation will provide a robust dataset that contributes to the overall portfolio of measurements included in the analysis within the Turbine Wake Inflow and Characterization Study campaign.
Correlations of wind speed and wind direction measurements between the M2 met tower and Triton sodar were calculated generally using 37-day averages of data and also more specifically during the three intensive observing periods (IOPs) that were seen during the TWICS field campaign. More details will be discussed in the forthcoming methods section. 2 Methods The field component of the TWICS campaign took place in April and May 2011 at the National Wind Technology Center in South Boulder, Colorado. This site is located on the foothills of the Rocky Mountains and is subject to a variety of weather conditions and phenomena. The Triton Sodar, M2 met tower, HDRL Lidar, and Windcube lidar were employed in the TWICS campaign to observe inflow characteristics and indicate the wakes of a 2.3 MW wind turbine. Data were collected during three instances of sustained strong north and north-westerly flow, hereafter termed intensive observing periods (IOPs). During these events both in-situ and remote observations were taken, but on different temporal scales, thus re-formatting was necessary. This will be discussed in a later section. While both lidars were only operated during IOP events, the M2 met tower and Triton sodar are continuously operating instruments at the NWTC. Therefore it was possible to perform an analysis of both long term trends and IOP events. The 37-day period that was examined for the correlation analysis was from April 1 – May 7, 2011. The three IOPs took place on April 14-15, April 22, and April 27-28. 2.1 Instrumentation 2.1.1 2.3 MW Wind Turbine A 2.3 MW turbine (Figure 11) was selected for use in TWICS because of its relevance in industrial-style wind energy applications and because observational studies of turbines greater than 1.3 MW have been few and far between. The turbine hub stands 80 meters tall and has blades

of approximately 50 meters. Given that these turbines are used onshore and offshore, the realm of applications from the results of this study could be substantial. (Lundquist et al. 2009) 2.1.2 The Triton Sodar: The Triton sodar is a state-of-the art system that was developed by Second Wind Inc. located in Somerville, Massachusetts. Triton is a small, two feet by three feet, device (Figure 11) that uses, “a hexagonal speaker array to efficiently focus sound beams to improve signal-to-noise ratio accuracy and decrease disruption” (Scott et al. 2010). Triton collects data every few seconds but only permanently records one averaged value every ten minutes for data from ten heights between 40 meters and 200 meters above ground level (40,60,80,100,120, 140,160,180,200). Data returned at each height include wind speed (both horizontally and vertically), wind direction, and turbulence intensity. A summary of the Triton specifics is illustrated in Table 1 below. (Scott et al. 2010; Lundquist et al. 2009) 2.1.3 The M2 Meteorological Tower The 80 meter M2 meteorological tower (Figure 11) located at the western end of the NWTC site acts as the accepted site inflow observational instrument and thus the accepted tool for comparison. Mainly to check the stability of the atmospheric layer, the tower takes measurements of temperature and dew point at three different heights: 2m,50m and 80m. Additionally there are six anemometers that take wind speed and direction observations at 2m, 5m, 10m, 20m, 50m, 80m. Observations of wind speed variances and turbulence are also taken. (Lundquist et al. 2009) 2.2 Site Layout and Typical Conditions The study was performed at the National Wind Technology Center on Colorado’s Front Range in South Boulder. The climate is semi-arid
and has a large diurnal temperature range and wide range of weather conditions. Figure 12 provides an elevation profile of the site and displays the terrain located west of the NWTC. To the west of the site is the Eldorado Canyon and often times the wind is funneled through the canyon as air moves over the continental divide. Given this, an important selection factor for this site is its strong 290 degree prevailing wind [WNW]. The reliability of this wind provides appropriate siting of the lidar and sodar for consistant observation of both the turbine wake and turbine inflow conditions. The enlarged profile of the site in Figure 12 shows the two instruments that were used in this study. As the diagram depicts the sodar is oriented looking up and can gather data at only one spatial point. The instruments are located 700 meters apart and are upstream of the 2.3 MW turbine. 2.2 Data Filtering To fulfill our research project goal of correlating observations between M2 and Triton it was imperative to quality control the data so that only relevant data points were taken into consideration in the analysis. For this reason it was necessary to implement some filters that are discussed below and listed in Figure 13. Given that the M2 met tower was used as the accepted inflow values for the study, most of the filters were applied to times when M2 did not surpass the established filter specifications. When an observation at M2 was filtered out, the Triton data was also removed for the same time period regardless of its value. Only data in time periods where the wind direction was between 225 and 360 degrees was accepted for further analysis, focusing on events when the M2 and Triton were upwind of the turbine. To create the plots of wind direction, only time periods in which the wind speed was greater than 3.5 meters per second (just under eight miles per hour) were used in analysis. Calm winds have insignificant wind direction values, as they are subject to many micro-scale processes. The one filter that was initiated on raw Triton data involved the filtering scheme specified

by Second Wind (Walls 2008). This was done with the goal of creating a reliable and scientifically sound dataset in which to compare to M2. For Triton data analysis Second Wind recommended a wind speed quality factor of greater than 95%. This quality factor is a function of the signal to noise ratio and was developed by Second Wind. Furthermore, a wind speed quality factor of greater than 95% will be dubbed high quality data. Examination of data quality by height is discussed in the results section of this paper. Similar to how the Triton data was filtered out based on M2 observations during same time periods, M2 data was removed alongside non-high quality Triton data. 2.3 Data Preparation for Analysis M2 data was recorded once per minute. To compare M2 and Triton data, it was necessary to average all ten, one-minute observations for every ten minute period to create one averaged value. Averaging wind directions can prove to be a dangerous task given the wrap-around factor in degrees of wind speed measurements. To mitigate this problem, whenever wind directions were below 40 degrees, we added 360 degrees to the value. The values were then averaged over the 10-minute period. If the resulting average value was greater than 360 degrees, then a subtraction of 360 degrees was performed. This process prevented erroneous wind direction values. To ensure consistency across both datasets, it was also vital to use the same time zone so that there would not be a data offset. The Triton sodar data was in Coordinated Universal Time (UTC) which during the summer months is seven hours ahead of local mountain daylight time. Data from M2 was in local mountain time and was the time zone we selected for use in this study. We therefore converted the UTC time stamp on the Triton data to mountain daylight time. After the data filtering and quality control process it was acceptable to begin the analysis process. 3 Results & Discussion
3.1 Triton Quality with Height Second Wind puts out a quality factor for each Triton reading at all heights. This quality factor is largely reflective on the signal-to-noise ratio of the acoustic pulses sent out from the Triton. The signal-to-noise ratio is simply a ratio of the desired signal to the background noise present, or, a ratio of the number of beams send out to the number of beams that arrive back at the sodar. For each of the three intensive observing periods (IOPs) a filled contour plot illustrating Triton’s quality by height were made (Figures 14a,b,c). The dark red color indicates Triton quality of greater than 90 percent and the blues indicate quality of lower than 30 percent. To perform data analysis, Second Wind recommends a data quality value of greater than 95 percent (CITATION). By looking at these plots, most heights from 80 meters and below have >95 percent quality such that an analysis can be made. 90 percent quality extends roughly up to 100 meters. Looking at time-height cross section plots of raw triton wind speed measurements could have led to some irrational conclusions. Figure 15 displays such a chart for IOP #1. Looking at the raw data you might hypothesize there to be a low level jet. The black lines indicate the upper bounds of 95 and 50 percent quality. Therefore it is impossible to consider the low-level jet hypothesis. Given the high Triton data quality at these heights, it was conceivable to do a correlation analysis of the 50 and 80 meter observations between the M2 met tower and the Triton sodar. In some cases though, 90 and 95 percent quality is lower than the aforementioned heights. For these times of lower quality, the filtering process discussed above excludes such data. To gain an insight into the overall performance of the Triton in comparison to the Sodar, we analyze 37 days-worth of data, from April 1 through May 7, 2011. 3.2 Long-term correlations Scatterplots comparing observations of wind speed and wind direction from both the M2

and Triton at both 50 and 80 meters were generated to gauge the overall performance and correlation between the two instruments. For the entire 37 day period, there were slightly over 5,300 raw, unfiltered data points. We filtered the data so that only M2 observations of wind directions between 225 degrees (SW) and 360 degrees(N) were plotted. The data is only filtered for M2 given that it is the baseline inflow met tower for the National Wind Technology Center site. This filter is used since this is generally the prevailing wind and also when both instruments are upwind of the turbine. An additional filter was used when considering wind direction. The filter discarded wind direction data for when winds were below 3.5 meters per second (just below eight miles per hour). It was implemented to prevent calm wind and thus inappropriate wind directions from being included in the analysis. After filtering there were 2683 data points taken into consideration in the 50 meter wind speed correlation plot and 1853 data points in the 80 meter wind speed correlation plot. The number of wind direction points are subject to further analysis given the need for another filter/quality control of the data. 3.2.1 Overall Wind Speed Correlations Scatterplots reveal that wind speed correlations between the Triton sodar and M2 met tower were good with a Pearson correlation coefficient (R) value at 50 meters of 0.9635 (Figure 16) and R value at 80 meters of 0.9391 (Figure 17). As illustrated on these wind speed correlation plots, there are strongly visible linear relationships between the two datasets but also a rather large spread expanding around the linear trend line. This variability is quantified by the statistical root mean squared error that, for 50 and 80 meter speed, were 1.56 and 1.81 respectively. A similar met tower and sodar correlation study at a wind farm in Texas yielded a much more tight linear fit (Scott et al. 2010)(Figure 18) The slightly lower correlation and higher RMSE for 80 meter wind speed is possibly the result of higher variability in this part of the boundary layer and also potentially due to the
reduced number of data points that passed through the data filtering process. At 80 meters, especially during certain parts of the day, it is possible that the boundary layer is stratified and decoupled. Sodars have trouble in these air masses and thus the two instruments could be detecting different air masses and thus since further from the surface, there is more decoupling between observations from the M2 vs. Triton. 3.2.2 Overall Wind Direction Correlations A strong linear relationship is noticed in the wind direction correlation plots between Triton and M2 (Figures 19,20), however there are a few clusters of outliers. Currently, R values for 50 meter and 80 meter wind direction were 0.595 and 0.687 respectively. We now believe that these clusters and subsequently lower R values are a result of anomalous beam propagation and we are currently working to quantify and correct these errors. (Note the different axis scales; different scales are used given the 225-360 degree filter used for the M2 observations). The development of further quality controlled plots should yield better correlations. These scatterplots, that take all filtered data points into consideration, provide a good overview of Triton’s general success when compared to the M2 met tower located 700 meters away. To gain insight into intricacies behind these general trends, correlations were made that evaluated diurnal changes in wind speed correlation based on the time of day. Also wind speed correlation based on wind direction were determined. 3.2.3 Wind Speed Correlations by Time of Day:
For each day of the study period (37 days) we plotted the data from each hour, in local time. Figure 21 displays the wind speed correlation values by hour at 50 (dashed line) and 80 meters (solid line). The left y-axis is the R correlation

value by hour and the right y-axis represents the number of data points for each of the time period bins listed on the x-axis. The number of data points is represented by the red (50m) and blue (80m) bars. The two most noticeable features in the graph are 1) the lower correlations seen in 80 meter speed versus 50 meter speed, and 2) the lower correlations seen in the early and mid-morning hours and the higher correlations seen in the afternoon. Possible explanations for this trend include diurnal changes in atmospheric stability, average wind speeds, and number of filtered data points. The atmospheric boundary layer tends to be stably stratified in the morning which can increase signal to noise errors from the Triton, thus lowering its performance. Additionally, this could also be one reason behind the lower quantity of filtered data points during the morning and late evening hours. Figures 22a,b show that the average wind speed is also less at both 50 and 80 meters during the morning which could potentially allow for more diversion of the flow from directly across the site. Lastly, it is also possible that during the morning hours, as the sun begins heating the ground, differing conditions at the M2 and Triton could be exhibited as a result of localized heating and turbulent mixing. 3.2.4 Wind Speed Correlations by Wind Direction In addition to looking at correlations at various times of the day it was also of interest to see any changes in correlation based on wind direction bins of ten degrees each from 230 degrees to 360 degrees. Figure 23 shows the Pearson R correlation value of wind speeds within each ten degree sector and also the number of points that were within each of the 13 bins. Overall, correlations within each of these bins were very good with all R values above 0.95. The best correlations were realized for wind directions of around 260 to 320 degrees which surround the 292 degree directional angle between the Triton and M2. Interesting to note is that the peak in number of points by bin also coincides with the bin with highest correlations. Also interesting is that there
is a clear and substantial difference in wind direction as you go from 50 meters to 80 meters. This potentially indicates wind veer. 3.3 Intensive Observing Periods The three intensive observing periods occurred on April 14-16, April 22 and April 27-28, 2011. They were characterized by strong northwesterly or westerly flow onto the NWTC site. For these events we plotted wind speed and wind direction at 50 and 80 meters as seen by both M2 and Triton. We found similar trends across each of the IOP events. In figure 24 we use IOP#3, April 27-28, as an example. The first plot simply shows the wind direction measured by each instrument at each height. As expected the winds centered around westerly and northwesterly. Figures 25 and 26 show IOP #3 wind speed at 50 and 80m for both instruments. The black line and errorbars represent M2 measurements and standard deviation and the red line indicates Triton measurements. At 50 meters Triton stays within the M2 standard deviation error bars. At 80 meters though, Triton has slightly higher measurements in comparison to M2 and is often outside the upper bound of the error-bars. This indicates that at 80 meters the triton overestimates the wind speed. 4 Conclusions & Next Steps
The TWICS project is helping the United States reach its 20% wind energy by 2030 goal by researching and improving the understanding of turbine inflow and wakes, and this sub-study is contributing to the TWICS goals by determining which instruments provide insightful datasets. Through a validation study of the Triton sodar to the 80-meter M2 meteorological tower on the National Wind Technology Center site, we found that the sodar does prove to be a valuable dataset. At this site, downstream of Colorado’s Front Range, the Triton had reduced quality above 80 meters. Even though this line demarking high

quality is lower than in some previous studies (Borgeois et al 2009), it still allowed for a comparison of wind speed and wind direction data at 50 and 80 meters from both Triton and M2. Strong linear correlations of wind speed, R values greater than 0.93, existed at 50 and 80 meters. Wind speed correlations were found to vary with time of the day with weaker correlations occurring the morning and stronger correlations in the afternoon. Different conditions at Triton and M2 from localized heating and turbulent mixing could be one factor behind these trends. Another potential explanation for this trend is that there are changes in Triton performance due to diurnal changes in atmospheric stability; there is decreased data quality and consequently there are less data points that can be used for the correlation analysis. There were also decent linear correlations of wind direction but outliers were present in clusters and further quality control is required to determine the validity of these specific findings. Looking at the IOPs there did seem to be an overestimation of wind speed at 80 meters by Triton. However, it is important to keep in mind that the instruments were 700 meters apart and were thus subject to possible differences due to localized heating and turbulent mixing. Some next steps within this research include: examining reasons for the weak wind direction correlation, examining a larger data set (more time periods) to provide more robust correlation results for the time of day and wind direction bin correlations, looking at other available metrics such as turbulence intensity and atmospheric stability , and lastly comparing Triton and M2 data with the Windcube lidar and NOAA High Resolution Doppler Lidar that were also operated during TWICS. Overall, correlations of wind speed between the M2 met tower and Triton sodar were good and validate that the Triton dataset is a valuable piece of information within the TWICS project and would also be useful in future research and industry use.
Works Cited
Barthelmie, R. J., Jensen, L. E., 2010: Evaluation of wind farm efficiency and wind turbine wakes at the Nysted offshore wind farm. Wind Energy, 13, 573-586, doi:10.1002/we.408. Barthelmie, R. J., Pryor, S. C. et al, 2010: Quantifying the Impact of Wind Turbine Wakes on Power Output at Offshore Wind Farms. Journal of Atmospheric and Oceanic Technology, 27, doi:10.1175/2010JTECHA1398.1 Bourgeois, S., 2008: Documentation and results of the SODAR and LIDAR Measurements at the Maligrad site in Bosnia and Herzegovina: Measurement Campaign from October 30th 2007 to February 4th 2008 (SODAR) and November 20th 2007 to December 10th 2007 (LIDAR). METEOTEST, 22pp. Bourgeois, S., Winkelmeier, H., Meissner, C., 2009: Turbulence intensity and high wind speeds above complex terrain: measurements and CFD-modelling, 4pp. DOE Wind and Water Power Program, Wind Power Today, 2010, Downloaded from http://www1.eere.energy.gov/windandhy dro/pdfs/47531.pdf Giordano, S., 2010: Eliminating Uncertainty with Sodar. Wind Systems Magazine, February 2010, 50-52. Harris, M., Hand, M., Wright, A., 2006: Lidar for Turbine Control. NREL Technical Report /TP-500-39154, 55pp. Kasler, Y., Rahm, S., Simmet, R., Kuhn, M., 2010: Wake Measurements of a Multi-MW Wind Turbine with Coherent Long-Range Pulsed Doppler Wind Lidar, Journal of Atmospheric and Oceanic Technology,

Sept 2010, 1529-1532, doi:10.1175/2010JTECHA1483.1. Kelley, N.D., Jonkman, B. J., Scott, G.N., Pichugina, Y.L., 2007: Comparing Pulsed Doppler LIDAR with SODAR and Direct Measurements for Wind Assessment. Proc. AWEA WindPower 2007 Conference and Exhibition, Los Angeles, California, National Renewable Energy Lab, 21pp. Lundquist, J., Banta, R., Pichugina, Y., Kelley, N., 2009: Integration of turbine inflow and wake observations from a 2-micron lidar into a wind energy forecasting model- A Proposal in response to the DOE call from EERE/WHTP on 20% Wind by 2030: Overcoming the Challenges. LLNL/NOAA/NREL, 33pp. Scott, G., Elliott, D., Schwartz, M., 2010: Comparison of Second Wind Triton Data with Meteorological Tower Measurements. NREL Technical Report /TP-550-47429, 12 pp. U.S. Department of Energy – Energy Efficiency and Renewable Energy, Wind and Water Power Program, 2011: How Wind Turbines Work. [Available online at http://www1.eere.energy.gov/windandhy dro/wind_how.html] Walls, September 2008: Viability of Sodar for Long-Term Research Assessment, Wind Tech International, 4, 6. Wharton, S., Lundquist, J., 2011: Assessing atmospheric stability and its impacts on rotor-disk wind characteristics at an onshore wind farm submitted

Figures:
Figure 1
A turbine at the National Wind Technology Center south of Boulder, Colo.
High Resolution (Credit: CIRES)
Figure 2:
Figure 3: : Time series of the data
availability of the SODAR measurements at
Maligrad for each measurement level.
Plausible data are displayed in green, rejected
values in red.
Figure 4: : Amount of available data of
the SODAR measurements at each level at Maligrad

Figure 5:
Normally invisible, wind wind wakes take shape in the clouds behind the Horns Rev offshore wind farm west of Denmark. High Resolution (Credit: Vattenfall
Figure 6:
(a) Results for the LOS component of the wind vector for an elevation scan through the rotor blades at night. The wind was blowing from the northeast parallel to the laser beam. Wind direction and position of the wind turbine are indicated in the figure. The white vertical line indicates the rotor disc. (b) Azimuth scan at night covering the ambient wind field of several wind turbines, including the M5000-1 prototype. The vertical white lines indicate the position of the rotor discs of M5000-1 and M5000-2.
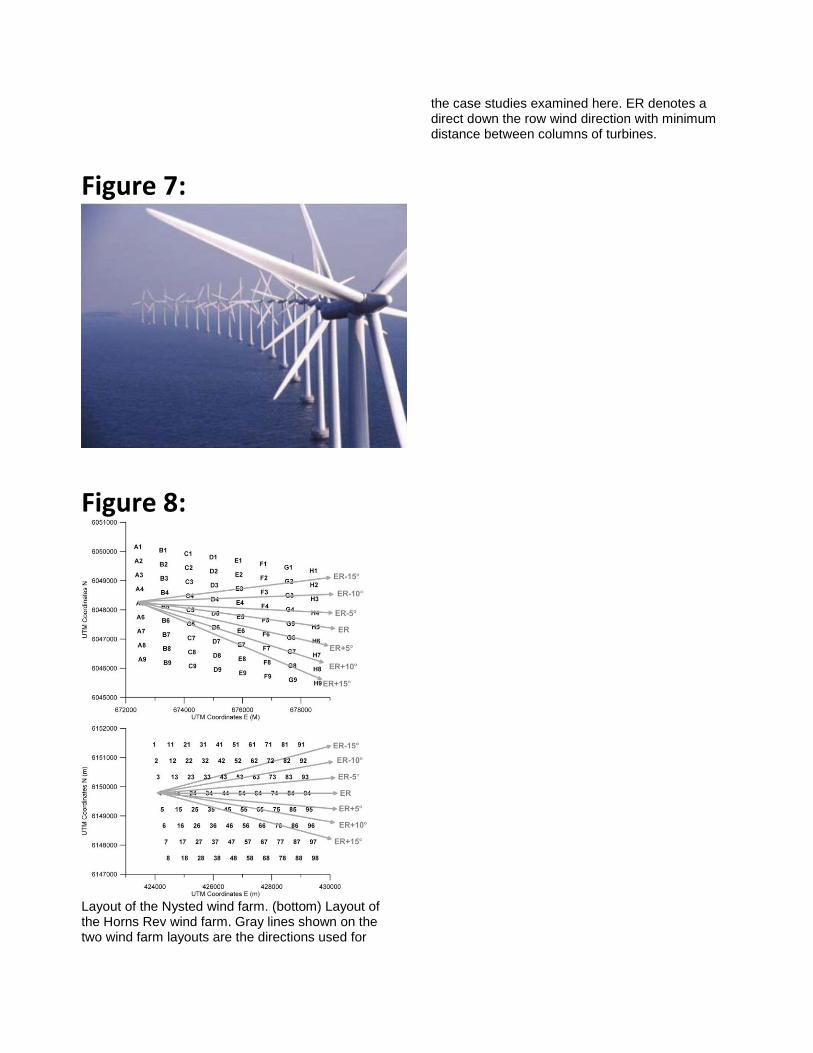
Figure 7:
Figure 8:
Layout of the Nysted wind farm. (bottom) Layout of the Horns Rev wind farm. Gray lines shown on the two wind farm layouts are the directions used for
the case studies examined here. ER denotes a direct down the row wind direction with minimum distance between columns of turbines.

Figure 9:
Figure 10:

Figure 11:
Figure 12:
Table 1:

Table 1:
Figure 13:

Figures 14a,b,c: Triton
quality with height

Figure 15:

Figure 16: Fi

Figure 17:

Figure 18: Texas Case Study of Triton
vs. Met Scott, Elliott, Schwartz 2010
Figure 19:

Figure 20: Figure 21:

Figure 22a,b:

Figure 23:
Figure 24:

Figure 25:
Figure 26: