charles county public schools local essa consolidated ... · funding other post-retirement benefits...
TRANSCRIPT
2019
Charles County Public Schools Local ESSA Consolidated Strategic Plan
Table of Contents
Cover Page 1 Executive Summary 2
Introduction 2
Budget Narrative 2
Goal Progress 3
Finance 5
Areas of Focus: Local ESSA Consolidated Strategic Plan 19
Area of Focus #1 19
Area of Focus #2 24
Area of Focus #3 27
Targeted Support and Improvement (TSI) Schools 31
COMAR Requirements 32
Gifted and Talented 32
Comprehensive Teacher Induction Program 37
CCPS 2019 Local ESSA Consolidated Strategic Plan 1
CCPS 2019 Local ESSA Consolidated Strategic Plan 2
I.A. Executive Summary Introduction Charles County Public Schools (CCPS) is a growing school system with over 27,500 students and 3,542 employees. Its mission is to “provide an opportunity for all school-aged children to receive an academically challenging, quality education that builds character, equips for leadership, and prepares for life, in an environment that is safe and conducive to learning.” The CCPS Local Every Student Succeeds Act (ESSA) Consolidated Strategic Plan supports the school system’s goals to provide “equity for all students, understanding that some students require additional resources in order to receive a quality education, and to strive to create inclusive learning environments in which every child is able to achieve her/his highest potential” (https://www.ccboe.com/index.php/beliefs-mission). Budget Narrative System Priorities
Maintain core programs and progress.
Reflect the basic needs of the system.
Support and fund special population students.
Comply with Every Student Succeeds Act (ESSA).
Funding for salary increases to place employees on proper STEPS/LEVELS.
Provide a competitive teacher salary.
Reduce the reliance on fund balance.
Maintain employment and avoid furloughs or layoffs.
Support and Fund Student enrollment growth.
Pre-Kindergarten Expansion.
Support Mental Health Initiative.
Fiscal Outlook and Climate Changes Enrollment in the county has increased over the past four-year period and will most likely lead to future increases in State funding. Free and reduced student population has been increasing which provides some financial relief in the form of an increase in State Compensatory Education funding. Enhanced funding from the Maryland General Assembly – The Kirwan Commission is a positive step for education. The general expectation is that new enrollments along with a more robust economic recovery will bring additional funding for education in the future.
Funding other post-retirement benefits (OPEB) in accordance with GASB 75 remains a concern, but a low budget priority. The tradeoff between funding OPEB (including health care costs) and staff salaries in the future will be complicated during union negotiations. The national teacher shortage has resulted in a very competitive market both in terms of salary and affordable housing. Charles County Public Schools continues to do an excellent job managing and allocating resources. Careful forecasting and management of funds produced no budget deficits or over expenditures in any category. At Board direction, the fund balance will be used over time to support the general fund and capital maintenance projects. Moving forward, there needs to be a concerted effort by management to reduce the reliance on fund balance reserves to pay for recurring costs in the operating budget. The general expectation is that new enrollments along with a more robust economic recovery will bring additional funding for education in the future.
CCPS 2019 Local ESSA Consolidated Strategic Plan 3
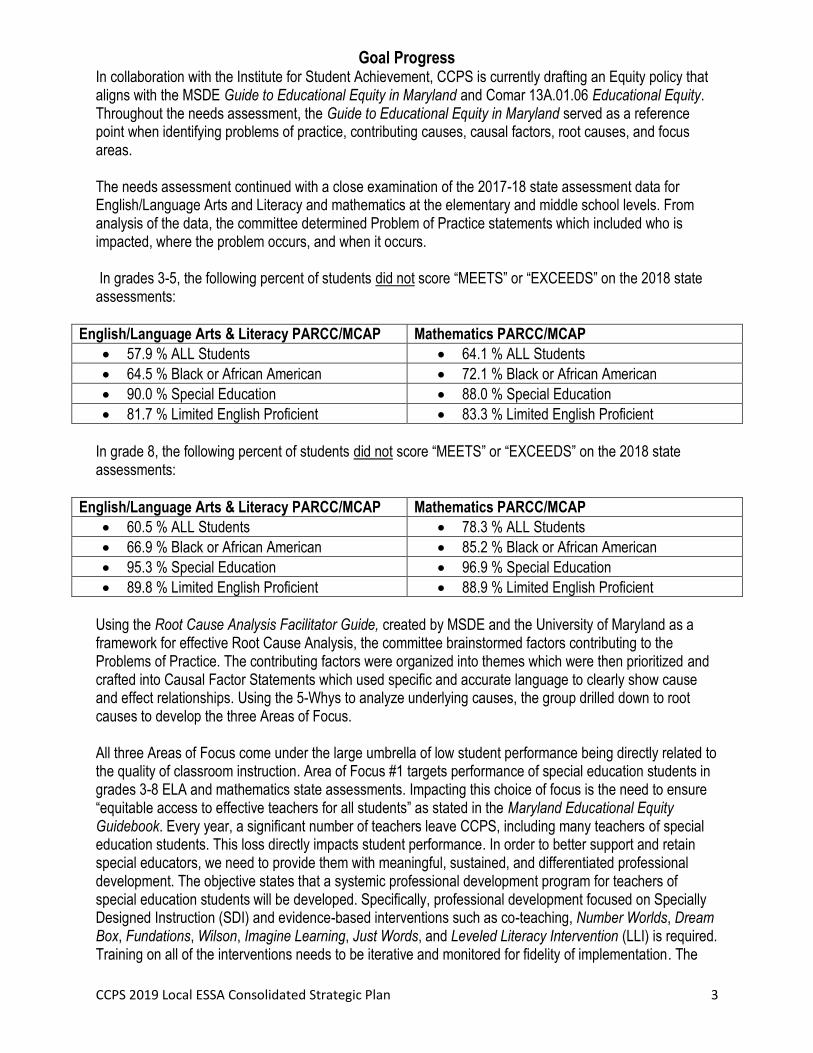
Goal Progress In collaboration with the Institute for Student Achievement, CCPS is currently drafting an Equity policy that aligns with the MSDE Guide to Educational Equity in Maryland and Comar 13A.01.06 Educational Equity. Throughout the needs assessment, the Guide to Educational Equity in Maryland served as a reference point when identifying problems of practice, contributing causes, causal factors, root causes, and focus areas. The needs assessment continued with a close examination of the 2017-18 state assessment data for English/Language Arts and Literacy and mathematics at the elementary and middle school levels. From analysis of the data, the committee determined Problem of Practice statements which included who is impacted, where the problem occurs, and when it occurs. In grades 3-5, the following percent of students did not score “MEETS” or “EXCEEDS” on the 2018 state assessments:
English/Language Arts & Literacy PARCC/MCAP Mathematics PARCC/MCAP
57.9 % ALL Students 64.1 % ALL Students
64.5 % Black or African American 72.1 % Black or African American
90.0 % Special Education 88.0 % Special Education
81.7 % Limited English Proficient 83.3 % Limited English Proficient
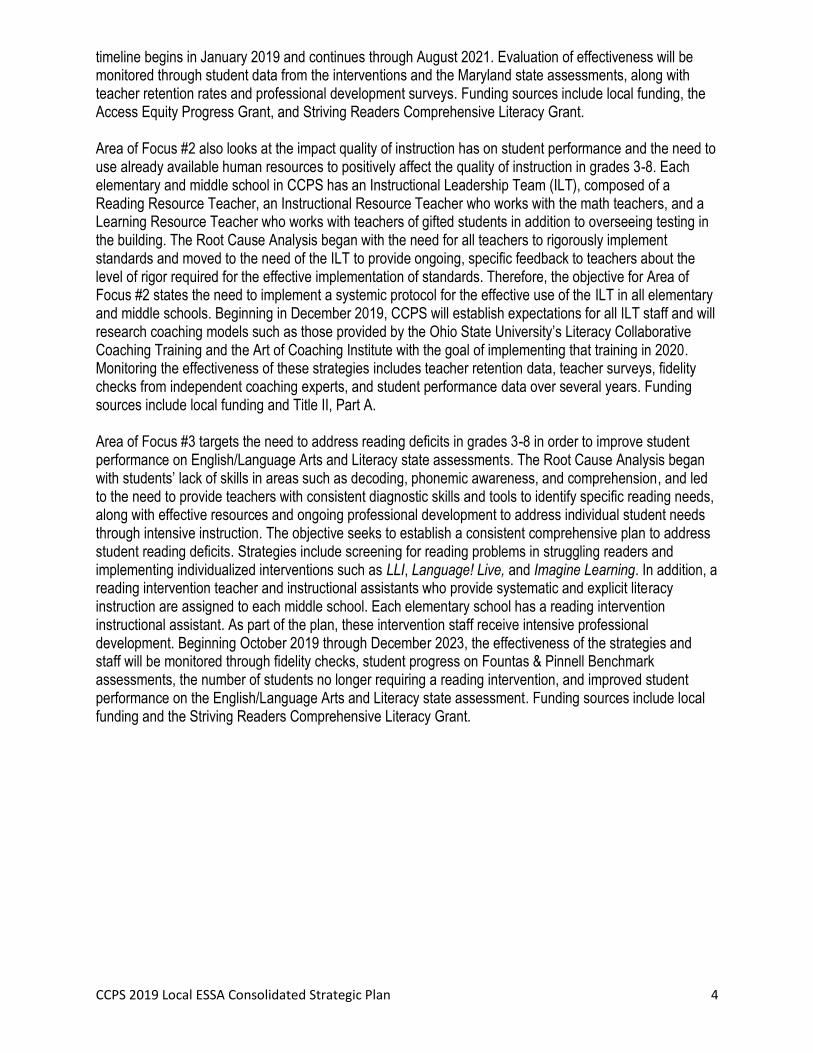
In grade 8, the following percent of students did not score “MEETS” or “EXCEEDS” on the 2018 state assessments:
English/Language Arts & Literacy PARCC/MCAP Mathematics PARCC/MCAP
60.5 % ALL Students 78.3 % ALL Students
66.9 % Black or African American 85.2 % Black or African American
95.3 % Special Education 96.9 % Special Education
89.8 % Limited English Proficient 88.9 % Limited English Proficient
Using the Root Cause Analysis Facilitator Guide, created by MSDE and the University of Maryland as a framework for effective Root Cause Analysis, the committee brainstormed factors contributing to the Problems of Practice. The contributing factors were organized into themes which were then prioritized and crafted into Causal Factor Statements which used specific and accurate language to clearly show cause and effect relationships. Using the 5-Whys to analyze underlying causes, the group drilled down to root causes to develop the three Areas of Focus. All three Areas of Focus come under the large umbrella of low student performance being directly related to the quality of classroom instruction. Area of Focus #1 targets performance of special education students in grades 3-8 ELA and mathematics state assessments. Impacting this choice of focus is the need to ensure “equitable access to effective teachers for all students” as stated in the Maryland Educational Equity Guidebook. Every year, a significant number of teachers leave CCPS, including many teachers of special education students. This loss directly impacts student performance. In order to better support and retain special educators, we need to provide them with meaningful, sustained, and differentiated professional development. The objective states that a systemic professional development program for teachers of special education students will be developed. Specifically, professional development focused on Specially Designed Instruction (SDI) and evidence-based interventions such as co-teaching, Number Worlds, Dream Box, Fundations, Wilson, Imagine Learning, Just Words, and Leveled Literacy Intervention (LLI) is required. Training on all of the interventions needs to be iterative and monitored for fidelity of implementation. The
CCPS 2019 Local ESSA Consolidated Strategic Plan 4
timeline begins in January 2019 and continues through August 2021. Evaluation of effectiveness will be monitored through student data from the interventions and the Maryland state assessments, along with teacher retention rates and professional development surveys. Funding sources include local funding, the Access Equity Progress Grant, and Striving Readers Comprehensive Literacy Grant. Area of Focus #2 also looks at the impact quality of instruction has on student performance and the need to use already available human resources to positively affect the quality of instruction in grades 3-8. Each elementary and middle school in CCPS has an Instructional Leadership Team (ILT), composed of a Reading Resource Teacher, an Instructional Resource Teacher who works with the math teachers, and a Learning Resource Teacher who works with teachers of gifted students in addition to overseeing testing in the building. The Root Cause Analysis began with the need for all teachers to rigorously implement standards and moved to the need of the ILT to provide ongoing, specific feedback to teachers about the level of rigor required for the effective implementation of standards. Therefore, the objective for Area of Focus #2 states the need to implement a systemic protocol for the effective use of the ILT in all elementary and middle schools. Beginning in December 2019, CCPS will establish expectations for all ILT staff and will research coaching models such as those provided by the Ohio State University’s Literacy Collaborative Coaching Training and the Art of Coaching Institute with the goal of implementing that training in 2020. Monitoring the effectiveness of these strategies includes teacher retention data, teacher surveys, fidelity checks from independent coaching experts, and student performance data over several years. Funding sources include local funding and Title II, Part A. Area of Focus #3 targets the need to address reading deficits in grades 3-8 in order to improve student performance on English/Language Arts and Literacy state assessments. The Root Cause Analysis began with students’ lack of skills in areas such as decoding, phonemic awareness, and comprehension, and led to the need to provide teachers with consistent diagnostic skills and tools to identify specific reading needs, along with effective resources and ongoing professional development to address individual student needs through intensive instruction. The objective seeks to establish a consistent comprehensive plan to address student reading deficits. Strategies include screening for reading problems in struggling readers and implementing individualized interventions such as LLI, Language! Live, and Imagine Learning. In addition, a reading intervention teacher and instructional assistants who provide systematic and explicit literacy instruction are assigned to each middle school. Each elementary school has a reading intervention instructional assistant. As part of the plan, these intervention staff receive intensive professional development. Beginning October 2019 through December 2023, the effectiveness of the strategies and staff will be monitored through fidelity checks, student progress on Fountas & Pinnell Benchmark assessments, the number of students no longer requiring a reading intervention, and improved student performance on the English/Language Arts and Literacy state assessment. Funding sources include local funding and the Striving Readers Comprehensive Literacy Grant.
CCPS 2019 Local ESSA Consolidated Strategic Plan 5
I.B. Finance Section Introduction Located in Southern Maryland, Charles County is considered part of the Washington, D.C. metropolitan area. Charles County Public Schools (CCPS) is the ninth largest public school system in Maryland with a fiscal year 2020 operating budget of $392.9 million. The school system is comprised of 37 schools and 3 educational centers and serves more than 27,500 students. 22 Elementary Schools 8 Middle Schools 7 High Schools 3 Centers:
F.B. Gwynn Educational Center
Robert D. Stethem Educational Center
Nanjemoy Creek Environmental Center
Mission Statement The mission of Charles County Public Schools is to provide an opportunity for all school-aged children to receive an academically challenging, quality education that builds character, equips for leadership and prepares for life, in an environment that is safe and conducive to learning. Governance and Fiscal Policy Charles County Public Schools (CCPS) is governed by a local school board, consisting of seven elected members and a non-voting student member. The majority of CCPS funding is provided by the Charles County government and the State. The Maryland State Department of Education (MSDE) exercises considerable oversight through the establishment and monitoring of various financial and academic policies and regulations, in accordance with certain provisions of the Annotated Code of Maryland. MSDE also works with CCPS to comply with the requirements and mandates of the federal Every Student Succeeds Act (ESSA) -- a law passed in December 2015 that governs the United States K–12 public education policy. The CCPS annual operational and capital budgets require approval by the Charles County government. The budget is balanced. Total anticipated revenues should equal or exceed total estimated expenditures. In the event that a fund’s projected expenditures will exceed anticipated revenues, the deficit will be eliminated by either additional revenues or reduced expenditures. Should anticipated revenues be insufficient to fund anticipated essential expenditures, then a portion of the unreserved fund balance from previous years will be used to fund the shortfall. In the event there is insufficient unreserved fund balance from previous years to fund anticipated expenditures, then such expenditures will be reduced to equal anticipated revenues. System Priorities
Maintain core programs and progress.
Reflect the basic needs of the system.
Support and fund special population students.
Comply with Every Student Succeeds Act (ESSA).
Funding for salary increases to place employees on proper STEPS/LEVELS.
Provide a competitive teacher salary.
Reduce the reliance on fund balance.
Maintain employment and avoid furloughs or layoffs.
Support and Fund Student enrollment growth.
CCPS 2019 Local ESSA Consolidated Strategic Plan 6
Pre-Kindergarten Expansion.
Support Mental Health Initiative. Fiscal Outlook and Climate Changes Enrollment in the county has increased over the past four-year period and will most likely lead to future increases in State funding. The free and reduced meal student population has been increasing which provides some financial relief in the form of an increase in State Compensatory Education funding. Enhanced funding from the Maryland General Assembly – The Kirwan Commission is a positive step for Education. The general expectation is that new enrollments along with a more robust economic recovery will bring additional funding for education in the future.
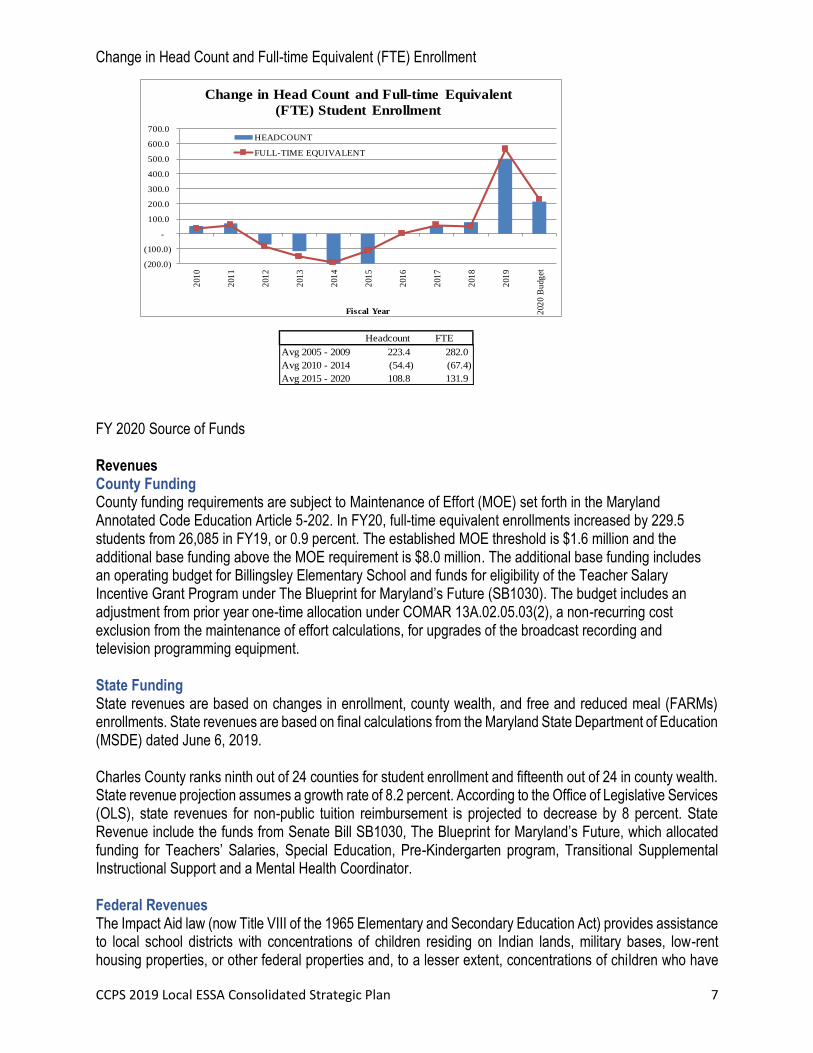
Funding other post-retirement benefits (OPEB) in accordance with GASB 75 remains a concern, but a low budget priority. The tradeoff between funding OPEB (including health care costs) and staff salaries in the future will be complicated during union negotiations. The national teacher shortage has resulted in a very competitive market both in terms of salary and affordable housing. Charles County Public Schools continues to do an excellent job managing and allocating resources. Careful forecasting and management of funds produced no budget deficits or over expenditures in any category. At Board direction, the fund balance will be used over time to support the general fund and capital maintenance projects. Moving forward, there needs to be a concerted effort by management to reduce the reliance on fund balance reserves to pay for recurring costs in the operating budget. The general expectation is that new enrollments along with a more robust economic recovery will bring additional funding for education in the future. Enrollments The change in student enrollment correlates with the need for additional teachers, support staff, transportation, supplies, textbooks, and other variable costs. This model assumes the maintenance of existing ratios for class size and teaching responsibilities. Student enrollment projections are based on historical data, birthrate change, and registration trends. Although building permits are not used in the student enrollment projections, building trends are considered in the growth rate adjustments at each school. Information provided by the Maryland Office of Planning and the Charles County Office of Planning and Growth Management is combined with historical student enrollment trends. The county ranks ninth in the state in full-time equivalent (FTE) student enrollment out of 24 counties. FY20 FTE student enrollment is expected to increase by 193.5 students from last year’s 26,314.5 FY19 student enrollment (0.7 percent). Full-time equivalent is a term used to reflect a students’ time in school or class (e.g., a student attends half day and would be counted as a .5 full-time equivalent). Full-time equivalent student enrollment is used to determine the number of students eligible for state aid and generally excludes pre-kindergarten, evening high school, and part-time students.
CCPS 2019 Local ESSA Consolidated Strategic Plan 7
Change in Head Count and Full-time Equivalent (FTE) Enrollment
FY 2020 Source of Funds Revenues County Funding County funding requirements are subject to Maintenance of Effort (MOE) set forth in the Maryland Annotated Code Education Article 5-202. In FY20, full-time equivalent enrollments increased by 229.5 students from 26,085 in FY19, or 0.9 percent. The established MOE threshold is $1.6 million and the additional base funding above the MOE requirement is $8.0 million. The additional base funding includes an operating budget for Billingsley Elementary School and funds for eligibility of the Teacher Salary Incentive Grant Program under The Blueprint for Maryland’s Future (SB1030). The budget includes an adjustment from prior year one-time allocation under COMAR 13A.02.05.03(2), a non-recurring cost exclusion from the maintenance of effort calculations, for upgrades of the broadcast recording and television programming equipment. State Funding State revenues are based on changes in enrollment, county wealth, and free and reduced meal (FARMs) enrollments. State revenues are based on final calculations from the Maryland State Department of Education (MSDE) dated June 6, 2019. Charles County ranks ninth out of 24 counties for student enrollment and fifteenth out of 24 in county wealth. State revenue projection assumes a growth rate of 8.2 percent. According to the Office of Legislative Services (OLS), state revenues for non-public tuition reimbursement is projected to decrease by 8 percent. State Revenue include the funds from Senate Bill SB1030, The Blueprint for Maryland’s Future, which allocated funding for Teachers’ Salaries, Special Education, Pre-Kindergarten program, Transitional Supplemental Instructional Support and a Mental Health Coordinator. Federal Revenues The Impact Aid law (now Title VIII of the 1965 Elementary and Secondary Education Act) provides assistance to local school districts with concentrations of children residing on Indian lands, military bases, low-rent housing properties, or other federal properties and, to a lesser extent, concentrations of children who have
Headcount FTE
Avg 2005 - 2009 223.4 282.0
Avg 2010 - 2014 (54.4) (67.4)
Avg 2015 - 2020 108.8 131.9
(200.0)
(100.0)
-
100.0
200.0
300.0
400.0
500.0
600.0
700.0
201
0
201
1
201
2
201
3
201
4
201
5
201
6
201
7
201
8
201
9
202
0 B
udg
et
Fiscal Year
Change in Head Count and Full-time Equivalent
(FTE) Student Enrollment
HEADCOUNT
FULL-TIME EQUIVALENT
CCPS 2019 Local ESSA Consolidated Strategic Plan 8
parents in the uniformed services or employed on eligible federal properties who do not live on federal property. The budget reflects current revenue trends. Local Revenues The Board of Education of Charles County annually sets the tuition rates for out-of-county living arrangement students who are placed in the school system by a state agency, licensed child care agency, or court, as provided by Section 4-122 of the Education Article, Annotated Code of Maryland. The budget reflects current revenue trends. Fund Balance Transfer The use of fund balance relies on one-time funds for designated maintenance projects at schools, such as asphalt repair, carpet replacement, and school playgrounds. Food Service Meal Price Increase The Healthy, Hunger-Free Kids Act of 2010 requires that the school system set meal prices equal to the
Federal reimbursement rate for Free and Reduced Meals (FARMs). The school system has increased
lunch prices for the past five years in order to comply with the Healthy, Hunger-Free Kids Act of 2010.
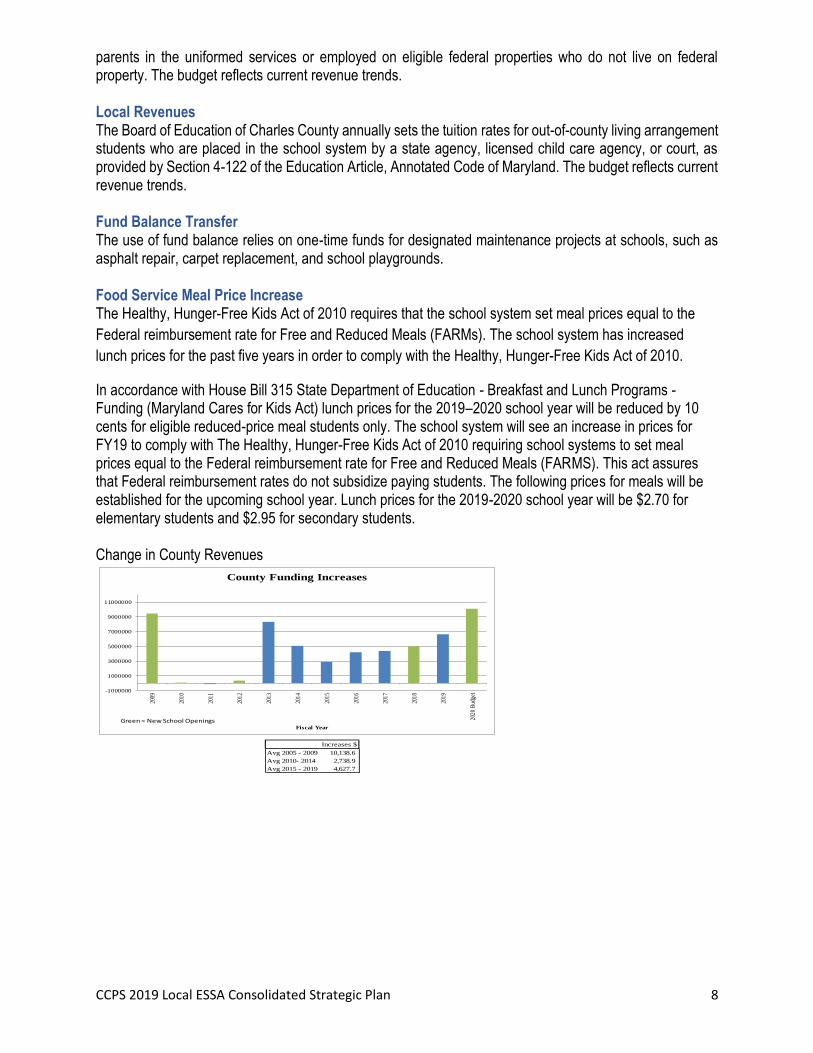
In accordance with House Bill 315 State Department of Education - Breakfast and Lunch Programs - Funding (Maryland Cares for Kids Act) lunch prices for the 2019–2020 school year will be reduced by 10 cents for eligible reduced-price meal students only. The school system will see an increase in prices for FY19 to comply with The Healthy, Hunger-Free Kids Act of 2010 requiring school systems to set meal prices equal to the Federal reimbursement rate for Free and Reduced Meals (FARMS). This act assures that Federal reimbursement rates do not subsidize paying students. The following prices for meals will be established for the upcoming school year. Lunch prices for the 2019-2020 school year will be $2.70 for elementary students and $2.95 for secondary students. Change in County Revenues
Increases $
Avg 2005 - 2009 10,138.6
Avg 2010- 2014 2,738.9
Avg 2015 - 2019 4,627.7
-1000000
1000000
3000000
5000000
7000000
9000000
11000000
2009
2010
2011
2012
2013
2014
2015
2016
2017
2018
2019
2020
Bud
get
Fiscal Year
County Funding Increases
Green = New School Openings
CCPS 2019 Local ESSA Consolidated Strategic Plan 9
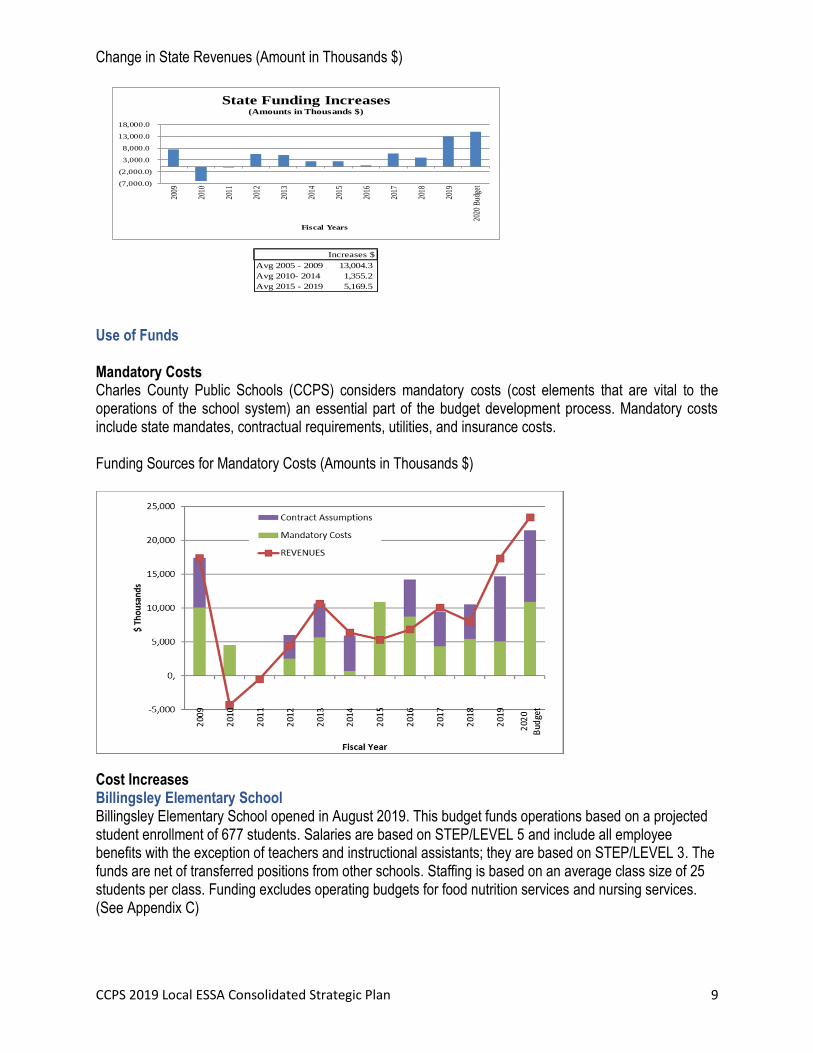
Change in State Revenues (Amount in Thousands $)
Increases $
Avg 2005 - 2009 13,004.3
Avg 2010- 2014 1,355.2
Avg 2015 - 2019 5,169.5
(7,000.0)
(2,000.0)
3,000.0
8,000.0
13,000.0
18,000.0
2009
2010
2011
2012
2013
2014
2015
2016
2017
2018
2019
2020
Bud
get
Fiscal Years
State Funding Increases(Amounts in Thousands $)
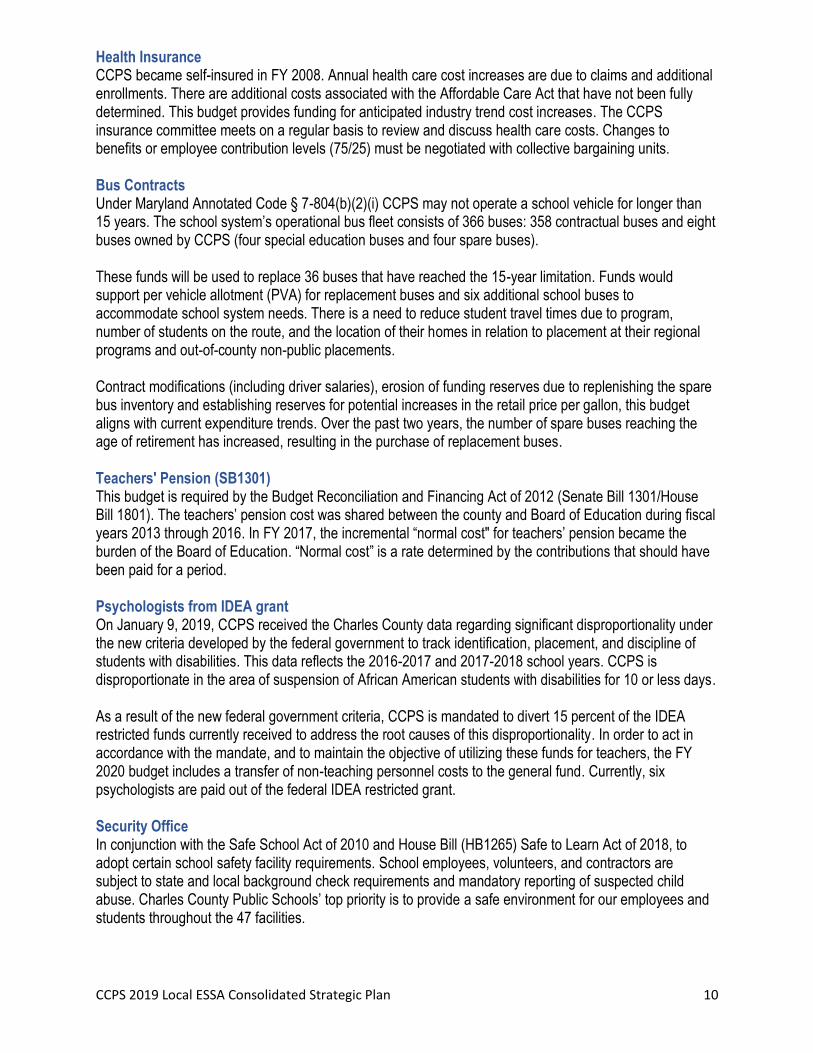
Use of Funds Mandatory Costs Charles County Public Schools (CCPS) considers mandatory costs (cost elements that are vital to the operations of the school system) an essential part of the budget development process. Mandatory costs include state mandates, contractual requirements, utilities, and insurance costs. Funding Sources for Mandatory Costs (Amounts in Thousands $)
Cost Increases Billingsley Elementary School Billingsley Elementary School opened in August 2019. This budget funds operations based on a projected student enrollment of 677 students. Salaries are based on STEP/LEVEL 5 and include all employee benefits with the exception of teachers and instructional assistants; they are based on STEP/LEVEL 3. The funds are net of transferred positions from other schools. Staffing is based on an average class size of 25 students per class. Funding excludes operating budgets for food nutrition services and nursing services. (See Appendix C)
CCPS 2019 Local ESSA Consolidated Strategic Plan 10
Health Insurance CCPS became self-insured in FY 2008. Annual health care cost increases are due to claims and additional enrollments. There are additional costs associated with the Affordable Care Act that have not been fully determined. This budget provides funding for anticipated industry trend cost increases. The CCPS insurance committee meets on a regular basis to review and discuss health care costs. Changes to benefits or employee contribution levels (75/25) must be negotiated with collective bargaining units. Bus Contracts Under Maryland Annotated Code § 7-804(b)(2)(i) CCPS may not operate a school vehicle for longer than 15 years. The school system’s operational bus fleet consists of 366 buses: 358 contractual buses and eight buses owned by CCPS (four special education buses and four spare buses). These funds will be used to replace 36 buses that have reached the 15-year limitation. Funds would support per vehicle allotment (PVA) for replacement buses and six additional school buses to accommodate school system needs. There is a need to reduce student travel times due to program, number of students on the route, and the location of their homes in relation to placement at their regional programs and out-of-county non-public placements. Contract modifications (including driver salaries), erosion of funding reserves due to replenishing the spare bus inventory and establishing reserves for potential increases in the retail price per gallon, this budget aligns with current expenditure trends. Over the past two years, the number of spare buses reaching the age of retirement has increased, resulting in the purchase of replacement buses. Teachers' Pension (SB1301) This budget is required by the Budget Reconciliation and Financing Act of 2012 (Senate Bill 1301/House Bill 1801). The teachers’ pension cost was shared between the county and Board of Education during fiscal years 2013 through 2016. In FY 2017, the incremental “normal cost" for teachers’ pension became the burden of the Board of Education. “Normal cost” is a rate determined by the contributions that should have been paid for a period. Psychologists from IDEA grant On January 9, 2019, CCPS received the Charles County data regarding significant disproportionality under the new criteria developed by the federal government to track identification, placement, and discipline of students with disabilities. This data reflects the 2016-2017 and 2017-2018 school years. CCPS is disproportionate in the area of suspension of African American students with disabilities for 10 or less days. As a result of the new federal government criteria, CCPS is mandated to divert 15 percent of the IDEA restricted funds currently received to address the root causes of this disproportionality. In order to act in accordance with the mandate, and to maintain the objective of utilizing these funds for teachers, the FY 2020 budget includes a transfer of non-teaching personnel costs to the general fund. Currently, six psychologists are paid out of the federal IDEA restricted grant. Security Office In conjunction with the Safe School Act of 2010 and House Bill (HB1265) Safe to Learn Act of 2018, to adopt certain school safety facility requirements. School employees, volunteers, and contractors are subject to state and local background check requirements and mandatory reporting of suspected child abuse. Charles County Public Schools’ top priority is to provide a safe environment for our employees and students throughout the 47 facilities.
CCPS 2019 Local ESSA Consolidated Strategic Plan 11
Funding includes one internal affairs investigator and part-time wages for administrative support, contractual obligations for Background Investigation Bureau (BIB) employment screening management software for new employees and operations for office supplies and workforce training. Maryland Association of Boards of Education (MABE) Insurance Premium Increase Founded in 1957, the Maryland Association of Boards of Education is a private, non-profit organization dedicated to serving and supporting boards of education in Maryland. Members benefit in numerous ways from participating in the MABE Insurance Trusts, the Group Insurance Pool, and the Workers' Compensation Fund. This budget reflects a 10 percent insurance premium increase for workers’ compensation, liability, and property. Nurses’ Contract Funding includes estimated contract increases of 12 percent and supports wages and benefits, Billingsley Elementary School, staff development training, and office supplies. Collective Bargaining Funds would support the estimated cost to recalibrate the Education Association of Charles County (EACC) Unit II, administrative and other professional, scales; provide Unit I, teacher scale, with a COLA of 2.62 percent, and a level increase. The American Federation of State, County and Municipal Employees (AFSCME) will receive a 3 percent COLA, along with grade increases for eligible employees. In addition, funds would support one additional STEP/Level increase for eligible employees who were due these increases for FY 2015. Other Cost Increases Supplemental Pre-kindergarten Grants The use of this supplemental grant supports eight new Pre-Kindergarten Teacher positions and eleven new Instructional Assistants. (See Appendix D) Mental Health Services Coordinator For both FY 2020 and 2021, $83,333 will be provided to fund a full-time mental health services coordinator that each local school system must appoint, pursuant to the Safe to Learn Act (Chapter 30) of 2018. Teachers for Enrollment Growth Funding supports anticipated student enrollment growth and will support a 25 to 1 ratio at all levels. Currently, the student to teacher ratio is 25 to 1 at grades K through 2 and 27 to 1 for grades 3 to 12. Mental Health Initiative Mental health concerns are continually increasing as CCPS is seeing many more students with emotional issues as well as students who have experienced traumatic events in their lives. To meet these needs, we must increase staff so mental health professionals such as school psychologists have the time to meet with students who need additional support. Every school in Charles County must be staffed with a full-time psychologist that can provide the help that many of our students require. Currently, most elementary schools must share a psychologist, which is extremely detrimental to providing these services. This budget will fund two additional full-time psychologists in an effort to eventually have a full-time psychologist in every school. Budget Reductions Communications – Television Equipment
CCPS 2019 Local ESSA Consolidated Strategic Plan 12
The budget includes a reduction on $166 thousand for a one-time allocation under COMAR 13A.02.05.03(2), a non-recurring cost exclusion from the maintenance of effort calculations, for upgrades of the broadcast recording and television programming equipment. Restricted Funds Restricted funds are anticipated to increase $1.67 million from the previous year for a total of $16.4 million. The increase is primarily due to the proposed sunset of one Judy Center location in FY 2020 and an overall Judy Center grant reduction of ($362K), and the proposed transfer of the Adult Education program to The College of Southern Maryland ($655K). The program reductions were offset by increases from the following grants: Striving Readers – Year 3 $900K focusing on increasing student achievement in literacy, Struggling Learners (Kirwan Funding) - $772K which is a two year funding source that focuses on students who perform below grade level in English/language arts or reading in kindergarten through grade 3, Title IV $166K primarily focusing on STEM and physical education initiatives. Title I $346K focusing on helping low-achieving students in high-poverty schools, School Safety $274K to enhance school safety, and IDEA Part B $236K to specifically address closing the achievement gap in the area of mathematics for special education students. FTEs are anticipated to increase by 14.80 with (6.3) proposed reductions in IDEA, (2.5) proposed reductions in Judy Center, (2.3) proposed reductions in Adult Education offset by an increase of 2.0 Resource Teachers in Striving Readers, .9 Instructional Specialist in Title II, 1.0 Title I Resource Teacher in Title I, and 22.0 Struggling Learner Interventionists. Food Service Fund Funds would support a cost-of-living adjustment (COLA). All eligible employees will receive a grade
increase and or salary adjustment. In addition, through attrition, as food service workers currently budgeted
at .5 Full-Time Equivalents (FTE) leave, their replacements are being increased to .75 FTE. This change
was approved in the FY 2018 budget. Expected Federal Revenues will cover this salary increase. The FY
2020 Food Services budget relies on the use of fund balance to ensure the budget remains balanced. This
onetime funding used to support increased labor costs impacted by increase in minimum wage.
CCPS 2019 Local ESSA Consolidated Strategic Plan 13
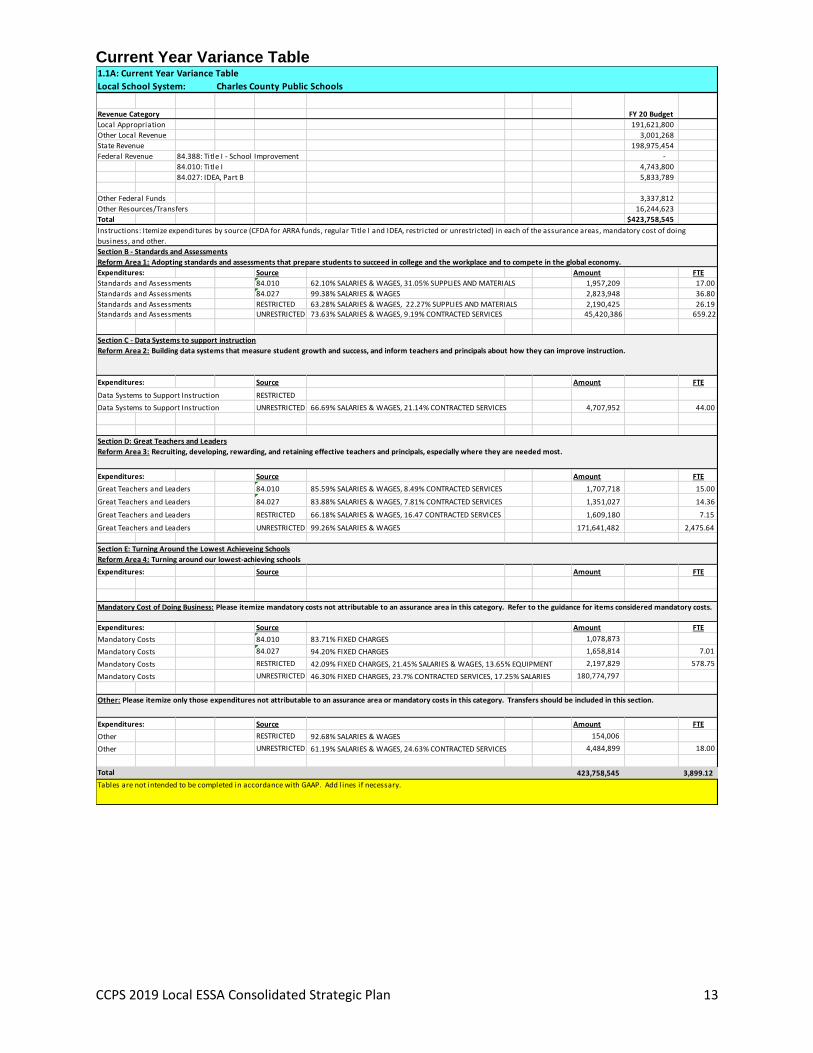
Current Year Variance Table
1.1A: Current Year Variance Table
Local School System: Charles County Public Schools
Revenue Category
Local Appropriation 191,621,800
Other Local Revenue 3,001,268
State Revenue 198,975,454
Federal Revenue 84.388: Title I - School Improvement -
84.010: Title I 4,743,800
84.027: IDEA, Part B 5,833,789
Other Federal Funds 3,337,812
Other Resources/Transfers 16,244,623
Total $423,758,545
Expenditures: Source Amount FTE
Standards and Assessments 84.010 62.10% SALARIES & WAGES, 31.05% SUPPLIES AND MATERIALS 1,957,209 17.00
Standards and Assessments 84.027 99.38% SALARIES & WAGES 2,823,948 36.80
Standards and Assessments RESTRICTED 63.28% SALARIES & WAGES, 22.27% SUPPLIES AND MATERIALS 2,190,425 26.19 Standards and Assessments UNRESTRICTED 73.63% SALARIES & WAGES, 9.19% CONTRACTED SERVICES 45,420,386 659.22
Expenditures: Source Amount FTE
Data Systems to Support Instruction RESTRICTED
Data Systems to Support Instruction UNRESTRICTED 66.69% SALARIES & WAGES, 21.14% CONTRACTED SERVICES 4,707,952 44.00
Expenditures: Source Amount FTE
Great Teachers and Leaders 84.010 85.59% SALARIES & WAGES, 8.49% CONTRACTED SERVICES 1,707,718 15.00
Great Teachers and Leaders 84.027 83.88% SALARIES & WAGES, 7.81% CONTRACTED SERVICES 1,351,027 14.36
Great Teachers and Leaders RESTRICTED 66.18% SALARIES & WAGES, 16.47 CONTRACTED SERVICES 1,609,180 7.15
Great Teachers and Leaders UNRESTRICTED 99.26% SALARIES & WAGES 171,641,482 2,475.64
Expenditures: Source Amount FTE
Expenditures: Source Amount FTE
Mandatory Costs 84.010 83.71% FIXED CHARGES 1,078,873
Mandatory Costs 84.027 94.20% FIXED CHARGES 1,658,814 7.01
Mandatory Costs RESTRICTED 42.09% FIXED CHARGES, 21.45% SALARIES & WAGES, 13.65% EQUIPMENT 2,197,829 578.75
Mandatory Costs UNRESTRICTED 46.30% FIXED CHARGES, 23.7% CONTRACTED SERVICES, 17.25% SALARIES 180,774,797
Expenditures: Source Amount FTE
Other RESTRICTED 92.68% SALARIES & WAGES 154,006
Other UNRESTRICTED 61.19% SALARIES & WAGES, 24.63% CONTRACTED SERVICES 4,484,899 18.00
Total 423,758,545 3,899.12
Tables are not intended to be completed in accordance with GAAP. Add lines if necessary.
FY 20 Budget
Instructions: Itemize expenditures by source (CFDA for ARRA funds, regular Title I and IDEA, restricted or unrestricted) in each of the assurance areas, mandatory cost of doing
business, and other.
Section B - Standards and Assessments
Reform Area 1: Adopting standards and assessments that prepare students to succeed in college and the workplace and to compete in the global economy.
Section C - Data Systems to support instruction
Reform Area 2: Building data systems that measure student growth and success, and inform teachers and principals about how they can improve instruction.
Section D: Great Teachers and Leaders
Reform Area 3: Recruiting, developing, rewarding, and retaining effective teachers and principals, especially where they are needed most.
Section E: Turning Around the Lowest Achieveing Schools
Reform Area 4: Turning around our lowest-achieving schools
Mandatory Cost of Doing Business: Please itemize mandatory costs not attributable to an assurance area in this category. Refer to the guidance for items considered mandatory costs.
Other: Please itemize only those expenditures not attributable to an assurance area or mandatory costs in this category. Transfers should be included in this section.
CCPS 2019 Local ESSA Consolidated Strategic Plan 14
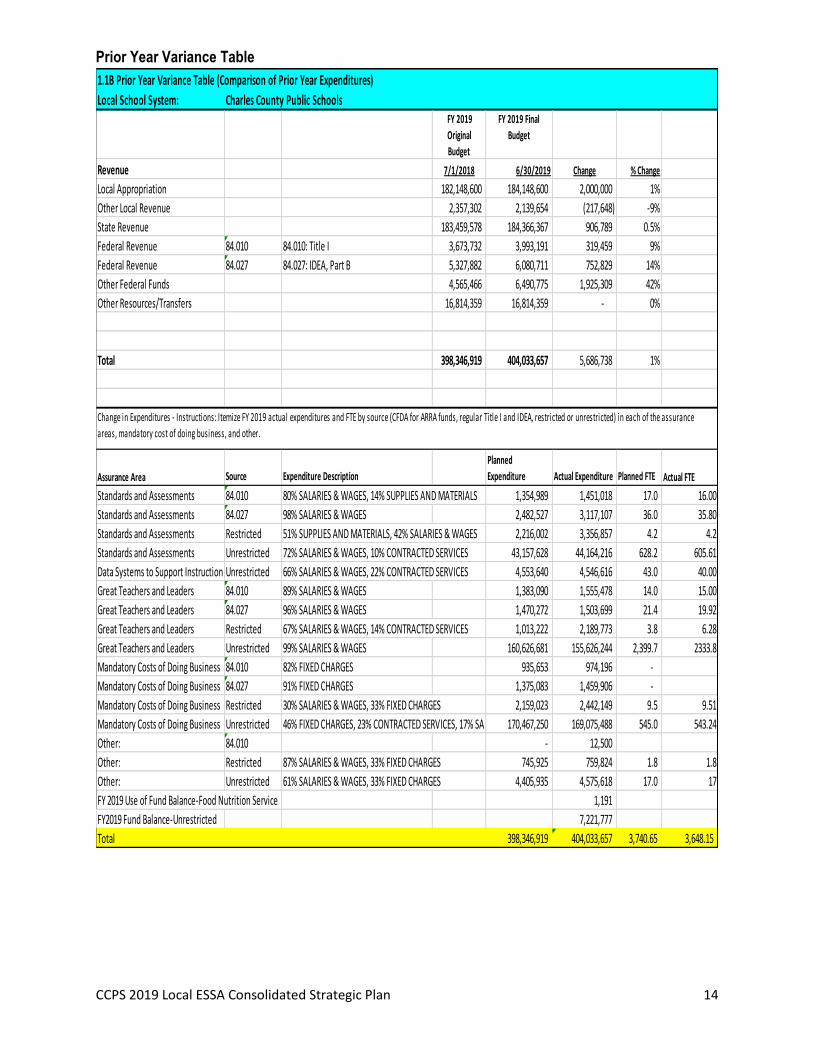
Prior Year Variance Table
1.1B Prior Year Variance Table (Comparison of Prior Year Expenditures)
Local School System: Charles County Public Schools FY 2019
Original
Budget
FY 2019 Final
Budget
Revenue 7/1/2018 6/30/2019 Change % Change
Local Appropriation 182,148,600 184,148,600 2,000,000 1%
Other Local Revenue 2,357,302 2,139,654 (217,648) -9%
State Revenue 183,459,578 184,366,367 906,789 0.5%
Federal Revenue 84.010 84.010: Title I 3,673,732 3,993,191 319,459 9%
Federal Revenue 84.027 84.027: IDEA, Part B 5,327,882 6,080,711 752,829 14%
Other Federal Funds 4,565,466 6,490,775 1,925,309 42%
Other Resources/Transfers 16,814,359 16,814,359 - 0%
Total 398,346,919 404,033,657 5,686,738 1%
Assurance Area Source Expenditure Description
Planned
Expenditure Actual Expenditure Planned FTE Actual FTE
Standards and Assessments 84.010 80% SALARIES & WAGES, 14% SUPPLIES AND MATERIALS 1,354,989 1,451,018 17.0 16.00
Standards and Assessments 84.027 98% SALARIES & WAGES 2,482,527 3,117,107 36.0 35.80
Standards and Assessments Restricted 51% SUPPLIES AND MATERIALS, 42% SALARIES & WAGES 2,216,002 3,356,857 4.2 4.2
Standards and Assessments Unrestricted 72% SALARIES & WAGES, 10% CONTRACTED SERVICES 43,157,628 44,164,216 628.2 605.61
Data Systems to Support Instruction Unrestricted 66% SALARIES & WAGES, 22% CONTRACTED SERVICES 4,553,640 4,546,616 43.0 40.00
Great Teachers and Leaders 84.010 89% SALARIES & WAGES 1,383,090 1,555,478 14.0 15.00
Great Teachers and Leaders 84.027 96% SALARIES & WAGES 1,470,272 1,503,699 21.4 19.92
Great Teachers and Leaders Restricted 67% SALARIES & WAGES, 14% CONTRACTED SERVICES 1,013,222 2,189,773 3.8 6.28
Great Teachers and Leaders Unrestricted 99% SALARIES & WAGES 160,626,681 155,626,244 2,399.7 2333.8
Mandatory Costs of Doing Business 84.010 82% FIXED CHARGES 935,653 974,196 -
Mandatory Costs of Doing Business 84.027 91% FIXED CHARGES 1,375,083 1,459,906 -
Mandatory Costs of Doing Business Restricted 30% SALARIES & WAGES, 33% FIXED CHARGES 2,159,023 2,442,149 9.5 9.51
Mandatory Costs of Doing Business Unrestricted 46% FIXED CHARGES, 23% CONTRACTED SERVICES, 17% SALARIES & WAGES170,467,250 169,075,488 545.0 543.24
Other: 84.010 - 12,500
Other: Restricted 87% SALARIES & WAGES, 33% FIXED CHARGES 745,925 759,824 1.8 1.8
Other: Unrestricted 61% SALARIES & WAGES, 33% FIXED CHARGES 4,405,935 4,575,618 17.0 17
FY 2019 Use of Fund Balance-Food Nutrition Service 1,191
FY2019 Fund Balance-Unrestricted 7,221,777
Total 398,346,919 404,033,657 3,740.65 3,648.15
Change in Expenditures - Instructions: Itemize FY 2019 actual expenditures and FTE by source (CFDA for ARRA funds, regular Title I and IDEA, restricted or unrestricted) in each of the assurance
areas, mandatory cost of doing business, and other.
CCPS 2019 Local ESSA Consolidated Strategic Plan 15
Revenues Local Appropriation The local county appropriation reflects an adjustment for one-time allocation under COMAR
13A.02.05.03(2), a non-recurring cost exclusion from the maintenance of effort calculations, to support
start-up cost for Billingsley Elementary School in the amount of $2.0 million.
State State revenues increased from the original approved budget by $906,788. Funding increases were primarily from grant awards subsequent of the beginning approved budget. The significant grant awards were School Safety (including School Survey, Heroin and Opioid Addiction), Career & Technology Case Grant, and Special Education Tele-therapy grant. Actual state grant revenues recognized were $669,712 short of grant awards, offset by revenues exceeding budgetary levels in the general fund from Special Education Non-Placements ($111,362) and Food Service fund ($13,250). Federal Revenue - Title I Title I actual revenues were more than the original budget by $319,459. This is due to a higher than budgeted finalization of Title I Part A. Federal Revenue - IDEA IDEA actual revenues were more than the original budget by $752,829. This is mainly due to timing of grant awards received and carryover. Other Federal Funds Other Federal Funds actual revenues were more than the original budget by $1.9 million due to Striving Readers Year 2, Title IV, and Title II. These grants were not initially included in the base budget at their full award amounts. There was a deficit of $156,528 in Impact Aid revenues in the General Fund. Other Local Revenue Actual revenues were less than budget by $478,707. Restricted funds contributed to $217,648 of the variance primarily due to an unfavorable variance in the E-Rate fund. The majority of the revenues are attributed to Other Sources for Nonresident Tuition and interest income. Other Resource/Transfers The $261,059 is made up of the $2,201,086 planned use of prior year fund balance which is partially offset by $250,676 over budget in food service from Federal Food Service commodity revenues.
CCPS 2019 Local ESSA Consolidated Strategic Plan 16
FY2019 General Fund Budget Reallocations The school system amended the General Fund original budget to support the FY 2019 budget changes listed below. The funding sources for the expenditure increases shown below were from budget savings related to lapsed salaries and other instructional costs expenditure categories.
1. Instruction Supplies and Materials funds supported the start-up costs for Billingsley Elementary School as well as on-line resources to enhance instructional opportunities, K12 reading resources, and materials for mental health services.
2. Student Transportation funds supported the purchase of seven new buses to aid with the opening of Billingsley elementary school, enrollment growth, and additional programs. Funds also supported actual expenditure trends for out-of-county transportation of special needs students and contractual obligations from changes to the contract.
3. Operation of Plant funds provided the replacement of laptops and computers in computer labs that are currently over five years of age, including equipment supplies. In addition, funding supported the installation of rainwater harvesting systems at several schools. This system helps to remove sediment and chemicals from rain/storm water before it is funneled back in to the ground.
4. Capital Outlay funds supported various maintenance projects including renovations at Robert D. Stethem Educational Center and Arthur Middleton Elementary School roof replacement (including miscellaneous upgrades).
Expenditures General Fund Included in the budget for 2019 was an appropriation for the use of fund balance of $3.2 million; however, a surplus of $4.4 million was achieved due to surplus in other sources of revenue. Total expenditure savings of $7.2 million from unfilled positions/turnover, fixed charges, and utilities throughout the school system were reprogrammed to computer replacements, instructional enhancements, transportation, and maintenance efforts. Food and Nutrition Services The Food and Nutrition Services expenditures came in under budget by $1,200; however, they did incur a loss of $250,676. The loss was attributed to the cost of goods sold for meals served. 84.010 – Title I A $88,779 favorable budget variance reflects savings in hourly wages and benefits offset by excess spending in supplies and materials. 84.027 – IDEA, Part B A favorable budget variance of $54,638 was attributable to savings in hourly wages offset by excess spending in all other categories.
CCPS 2019 Local ESSA Consolidated Strategic Plan 17
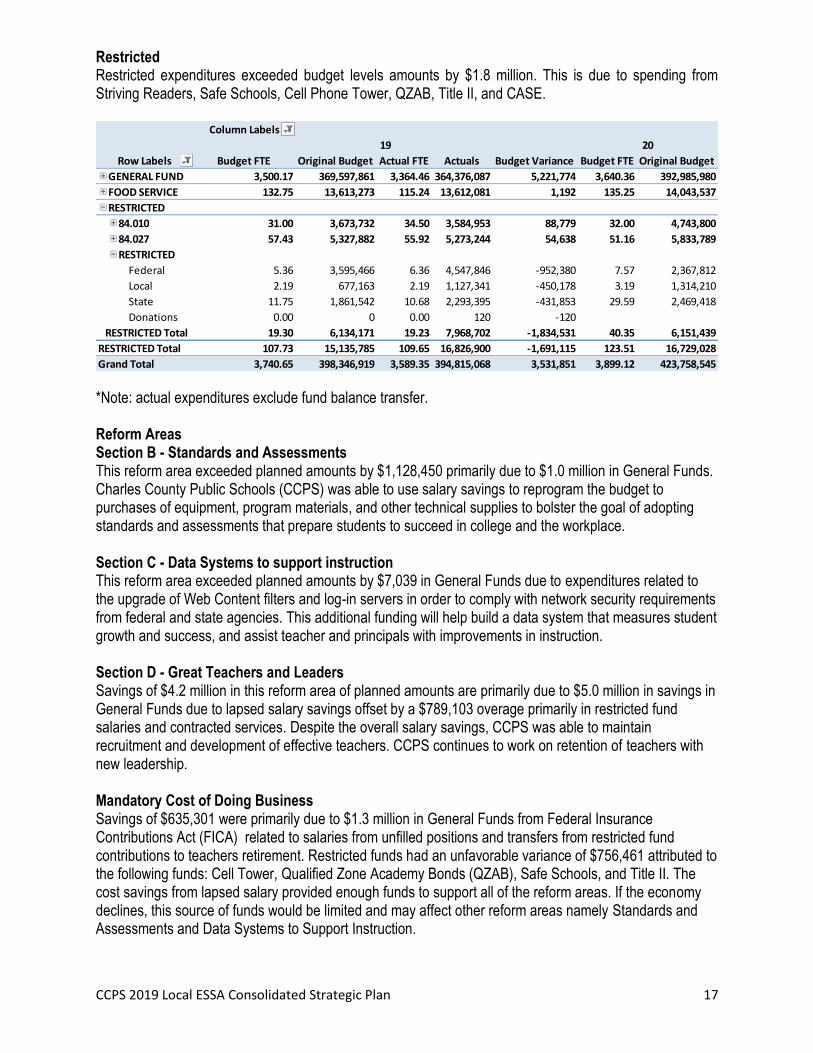
Restricted Restricted expenditures exceeded budget levels amounts by $1.8 million. This is due to spending from Striving Readers, Safe Schools, Cell Phone Tower, QZAB, Title II, and CASE.
*Note: actual expenditures exclude fund balance transfer. Reform Areas Section B - Standards and Assessments This reform area exceeded planned amounts by $1,128,450 primarily due to $1.0 million in General Funds. Charles County Public Schools (CCPS) was able to use salary savings to reprogram the budget to purchases of equipment, program materials, and other technical supplies to bolster the goal of adopting standards and assessments that prepare students to succeed in college and the workplace. Section C - Data Systems to support instruction This reform area exceeded planned amounts by $7,039 in General Funds due to expenditures related to the upgrade of Web Content filters and log-in servers in order to comply with network security requirements from federal and state agencies. This additional funding will help build a data system that measures student growth and success, and assist teacher and principals with improvements in instruction. Section D - Great Teachers and Leaders Savings of $4.2 million in this reform area of planned amounts are primarily due to $5.0 million in savings in General Funds due to lapsed salary savings offset by a $789,103 overage primarily in restricted fund salaries and contracted services. Despite the overall salary savings, CCPS was able to maintain recruitment and development of effective teachers. CCPS continues to work on retention of teachers with new leadership. Mandatory Cost of Doing Business Savings of $635,301 were primarily due to $1.3 million in General Funds from Federal Insurance Contributions Act (FICA) related to salaries from unfilled positions and transfers from restricted fund contributions to teachers retirement. Restricted funds had an unfavorable variance of $756,461 attributed to the following funds: Cell Tower, Qualified Zone Academy Bonds (QZAB), Safe Schools, and Title II. The cost savings from lapsed salary provided enough funds to support all of the reform areas. If the economy declines, this source of funds would be limited and may affect other reform areas namely Standards and Assessments and Data Systems to Support Instruction.
Column Labels
Row Labels Budget FTE Original Budget Actual FTE Actuals Budget Variance Budget FTE Original Budget
GENERAL FUND 3,500.17 369,597,861 3,364.46 364,376,087 5,221,774 3,640.36 392,985,980
FOOD SERVICE 132.75 13,613,273 115.24 13,612,081 1,192 135.25 14,043,537
RESTRICTED
84.010 31.00 3,673,732 34.50 3,584,953 88,779 32.00 4,743,800
84.027 57.43 5,327,882 55.92 5,273,244 54,638 51.16 5,833,789
RESTRICTED
Federal 5.36 3,595,466 6.36 4,547,846 -952,380 7.57 2,367,812
Local 2.19 677,163 2.19 1,127,341 -450,178 3.19 1,314,210
State 11.75 1,861,542 10.68 2,293,395 -431,853 29.59 2,469,418
Donations 0.00 0 0.00 120 -120
RESTRICTED Total 19.30 6,134,171 19.23 7,968,702 -1,834,531 40.35 6,151,439
RESTRICTED Total 107.73 15,135,785 109.65 16,826,900 -1,691,115 123.51 16,729,028
Grand Total 3,740.65 398,346,919 3,589.35 394,815,068 3,531,851 3,899.12 423,758,545
19 20
CCPS 2019 Local ESSA Consolidated Strategic Plan 18
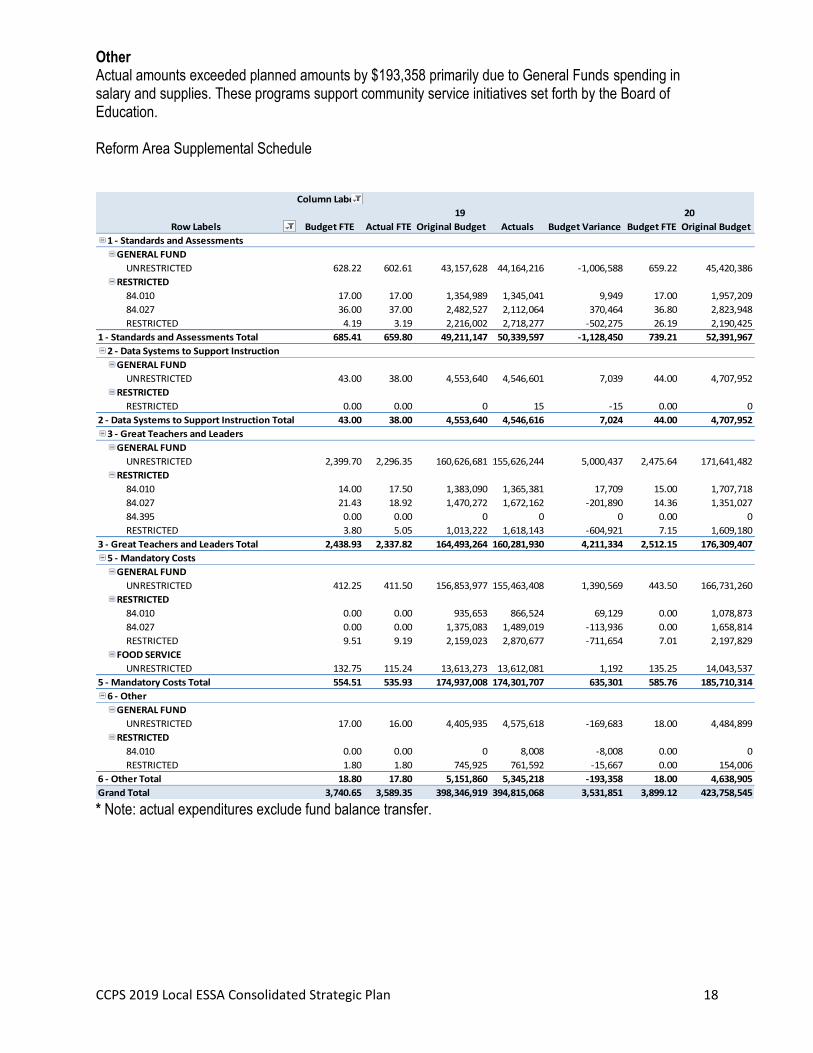
Other Actual amounts exceeded planned amounts by $193,358 primarily due to General Funds spending in salary and supplies. These programs support community service initiatives set forth by the Board of Education. Reform Area Supplemental Schedule
* Note: actual expenditures exclude fund balance transfer.
Column Labels
Row Labels Budget FTE Actual FTE Original Budget Actuals Budget Variance Budget FTE Original Budget
1 - Standards and Assessments
GENERAL FUND
UNRESTRICTED 628.22 602.61 43,157,628 44,164,216 -1,006,588 659.22 45,420,386
RESTRICTED
84.010 17.00 17.00 1,354,989 1,345,041 9,949 17.00 1,957,209
84.027 36.00 37.00 2,482,527 2,112,064 370,464 36.80 2,823,948
RESTRICTED 4.19 3.19 2,216,002 2,718,277 -502,275 26.19 2,190,425
1 - Standards and Assessments Total 685.41 659.80 49,211,147 50,339,597 -1,128,450 739.21 52,391,967
2 - Data Systems to Support Instruction
GENERAL FUND
UNRESTRICTED 43.00 38.00 4,553,640 4,546,601 7,039 44.00 4,707,952
RESTRICTED
RESTRICTED 0.00 0.00 0 15 -15 0.00 0
2 - Data Systems to Support Instruction Total 43.00 38.00 4,553,640 4,546,616 7,024 44.00 4,707,952
3 - Great Teachers and Leaders
GENERAL FUND
UNRESTRICTED 2,399.70 2,296.35 160,626,681 155,626,244 5,000,437 2,475.64 171,641,482
RESTRICTED
84.010 14.00 17.50 1,383,090 1,365,381 17,709 15.00 1,707,718
84.027 21.43 18.92 1,470,272 1,672,162 -201,890 14.36 1,351,027
84.395 0.00 0.00 0 0 0 0.00 0
RESTRICTED 3.80 5.05 1,013,222 1,618,143 -604,921 7.15 1,609,180
3 - Great Teachers and Leaders Total 2,438.93 2,337.82 164,493,264 160,281,930 4,211,334 2,512.15 176,309,407
5 - Mandatory Costs
GENERAL FUND
UNRESTRICTED 412.25 411.50 156,853,977 155,463,408 1,390,569 443.50 166,731,260
RESTRICTED
84.010 0.00 0.00 935,653 866,524 69,129 0.00 1,078,873
84.027 0.00 0.00 1,375,083 1,489,019 -113,936 0.00 1,658,814
RESTRICTED 9.51 9.19 2,159,023 2,870,677 -711,654 7.01 2,197,829
FOOD SERVICE
UNRESTRICTED 132.75 115.24 13,613,273 13,612,081 1,192 135.25 14,043,537
5 - Mandatory Costs Total 554.51 535.93 174,937,008 174,301,707 635,301 585.76 185,710,314
6 - Other
GENERAL FUND
UNRESTRICTED 17.00 16.00 4,405,935 4,575,618 -169,683 18.00 4,484,899
RESTRICTED
84.010 0.00 0.00 0 8,008 -8,008 0.00 0
RESTRICTED 1.80 1.80 745,925 761,592 -15,667 0.00 154,006
6 - Other Total 18.80 17.80 5,151,860 5,345,218 -193,358 18.00 4,638,905
Grand Total 3,740.65 3,589.35 398,346,919 394,815,068 3,531,851 3,899.12 423,758,545
19 20
CCPS 2019 Local ESSA Consolidated Strategic Plan 19
Local ESSA Consolidated Strategic Plan Reporting Requirements
(Complete a separate plan for each area of focus)
Area of Focus #1: State Assessment Performance for Special Education Students in ELA and Math – Grades 3-8
1. Based on the analysis of State and local data, identify the area of focus where the local school
system did not meet the goals (areas where the local school system is performing below expectations). In the response, provide the rationale for selecting the area of focus, include the implementation of strategies and/or evidence-based interventions to support student achievement. Describe priority strategies and/or evidence-based interventions to address disparities in achievement and to improve student performance. As school systems respond to area of focus #1, refer to page 15 to guide your response to address specific student groups.
a. Description. Describe Area of Focus #1 and how it aligns with your LSS educational
equity policy. Describe the rationale for selecting the area of focus (up to 1,000 characters).
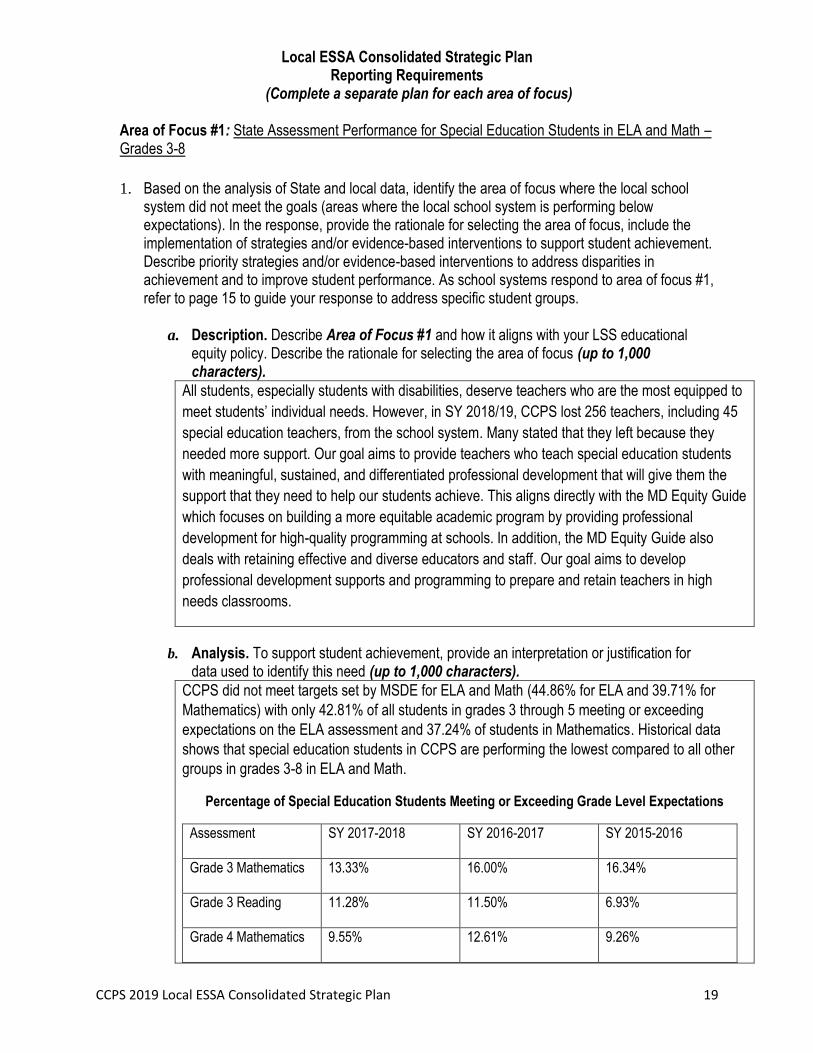
All students, especially students with disabilities, deserve teachers who are the most equipped to
meet students’ individual needs. However, in SY 2018/19, CCPS lost 256 teachers, including 45
special education teachers, from the school system. Many stated that they left because they
needed more support. Our goal aims to provide teachers who teach special education students
with meaningful, sustained, and differentiated professional development that will give them the
support that they need to help our students achieve. This aligns directly with the MD Equity Guide
which focuses on building a more equitable academic program by providing professional
development for high-quality programming at schools. In addition, the MD Equity Guide also
deals with retaining effective and diverse educators and staff. Our goal aims to develop
professional development supports and programming to prepare and retain teachers in high
needs classrooms.
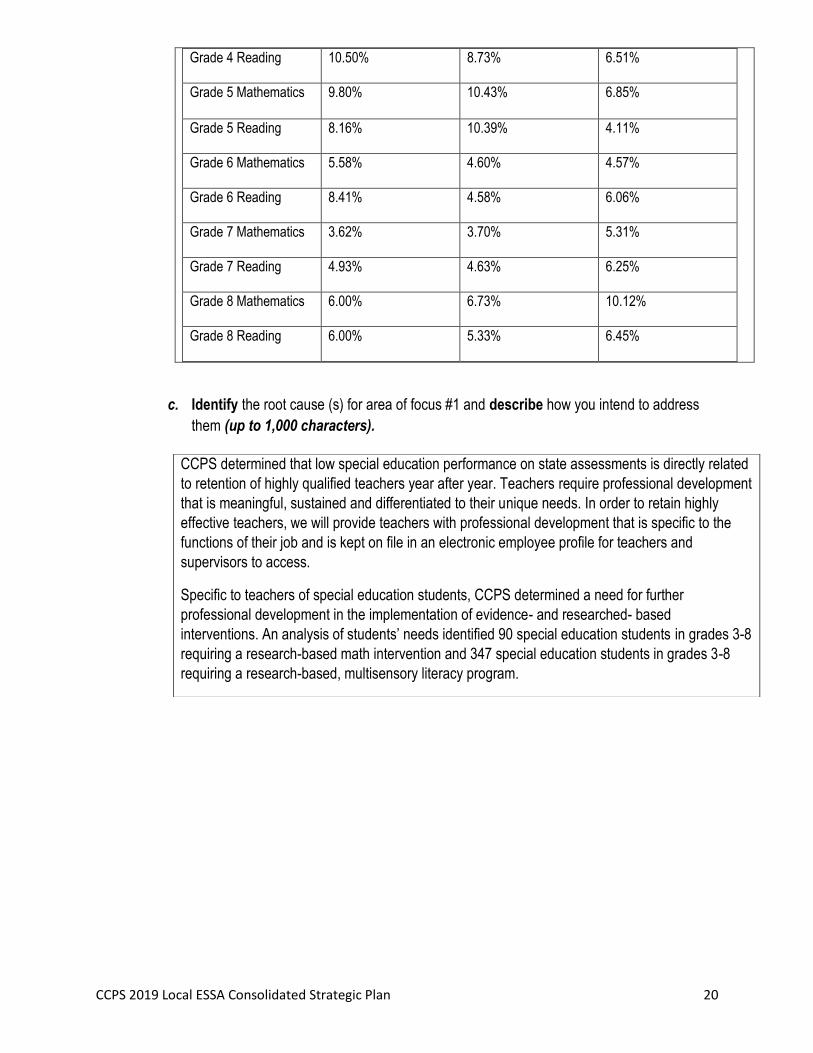
b. Analysis. To support student achievement, provide an interpretation or justification for data used to identify this need (up to 1,000 characters).
CCPS did not meet targets set by MSDE for ELA and Math (44.86% for ELA and 39.71% for
Mathematics) with only 42.81% of all students in grades 3 through 5 meeting or exceeding
expectations on the ELA assessment and 37.24% of students in Mathematics. Historical data
shows that special education students in CCPS are performing the lowest compared to all other
groups in grades 3-8 in ELA and Math.
Percentage of Special Education Students Meeting or Exceeding Grade Level Expectations
Assessment SY 2017-2018 SY 2016-2017 SY 2015-2016
Grade 3 Mathematics 13.33% 16.00% 16.34%
Grade 3 Reading 11.28% 11.50% 6.93%
Grade 4 Mathematics 9.55% 12.61% 9.26%
CCPS 2019 Local ESSA Consolidated Strategic Plan 20
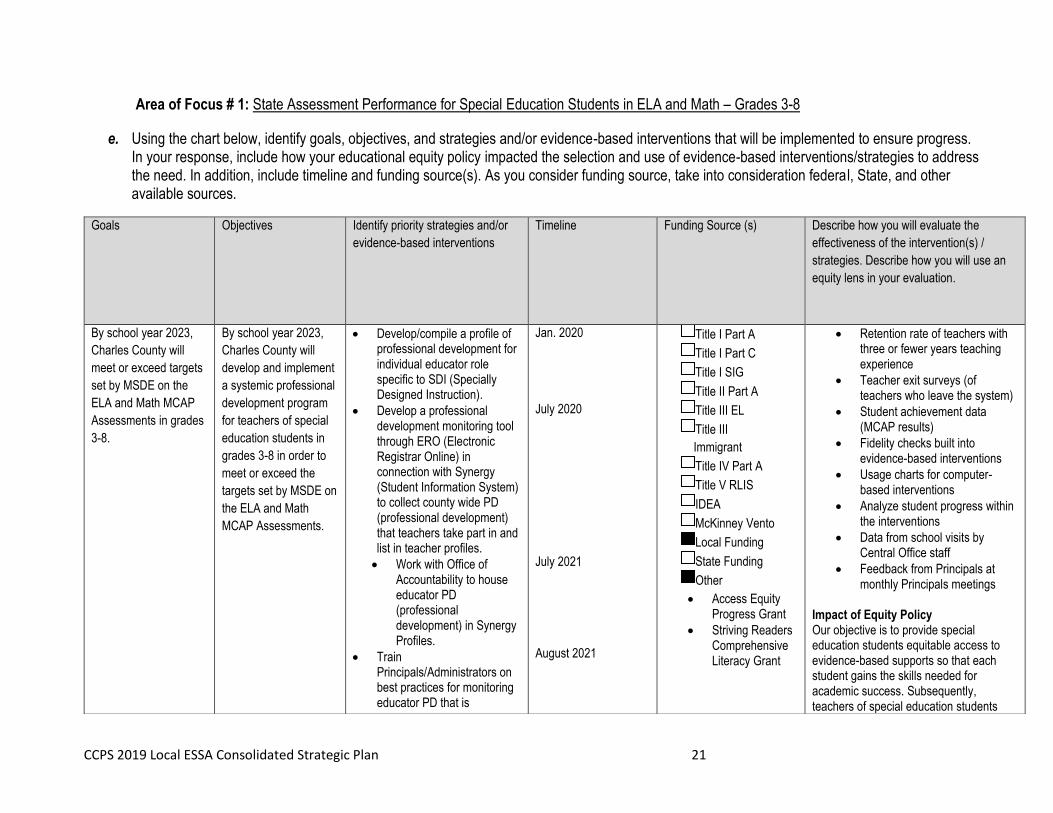
Grade 4 Reading 10.50% 8.73% 6.51%
Grade 5 Mathematics 9.80% 10.43% 6.85%
Grade 5 Reading 8.16% 10.39% 4.11%
Grade 6 Mathematics 5.58% 4.60% 4.57%
Grade 6 Reading 8.41% 4.58% 6.06%
Grade 7 Mathematics 3.62% 3.70% 5.31%
Grade 7 Reading 4.93% 4.63% 6.25%
Grade 8 Mathematics 6.00% 6.73% 10.12%
Grade 8 Reading 6.00% 5.33% 6.45%
c. Identify the root cause (s) for area of focus #1 and describe how you intend to address
them (up to 1,000 characters).
CCPS determined that low special education performance on state assessments is directly related
to retention of highly qualified teachers year after year. Teachers require professional development
that is meaningful, sustained and differentiated to their unique needs. In order to retain highly
effective teachers, we will provide teachers with professional development that is specific to the
functions of their job and is kept on file in an electronic employee profile for teachers and
supervisors to access.
Specific to teachers of special education students, CCPS determined a need for further
professional development in the implementation of evidence- and researched- based
interventions. An analysis of students’ needs identified 90 special education students in grades 3-8
requiring a research-based math intervention and 347 special education students in grades 3-8
requiring a research-based, multisensory literacy program.
CCPS 2019 Local ESSA Consolidated Strategic Plan 21
Area of Focus # 1: State Assessment Performance for Special Education Students in ELA and Math – Grades 3-8
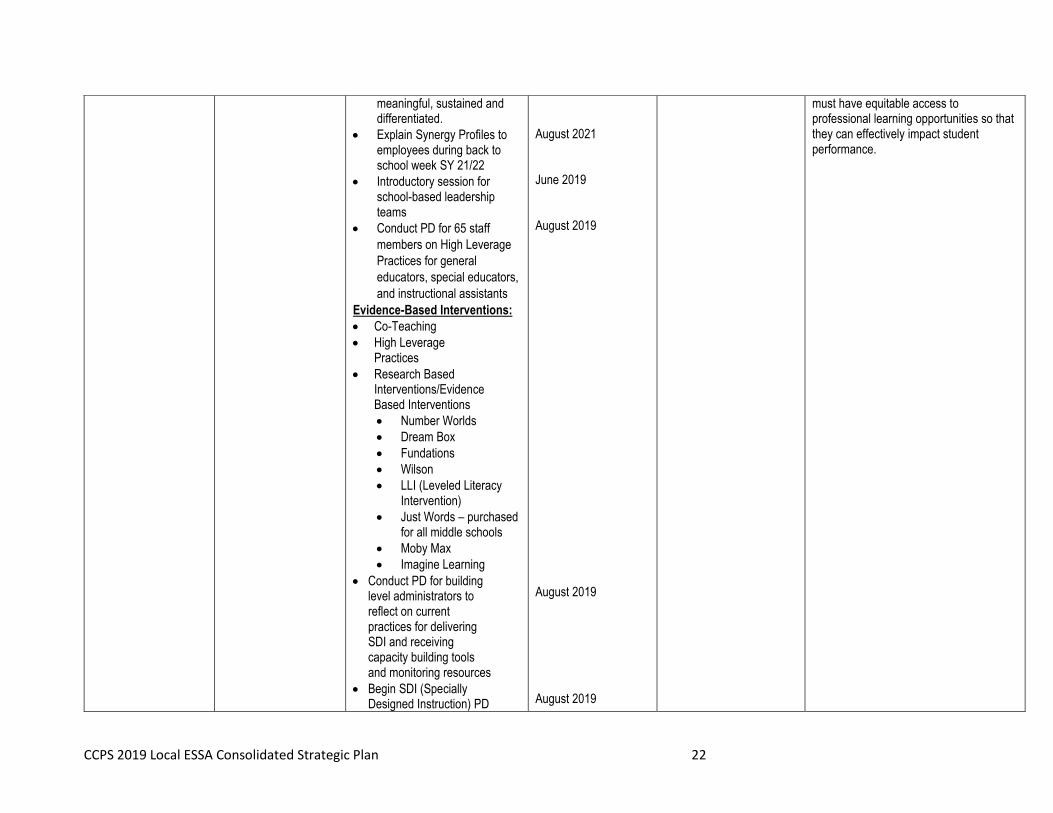
e. Using the chart below, identify goals, objectives, and strategies and/or evidence-based interventions that will be implemented to ensure progress. In your response, include how your educational equity policy impacted the selection and use of evidence-based interventions/strategies to address the need. In addition, include timeline and funding source(s). As you consider funding source, take into consideration federal, State, and other available sources.
Goals Objectives Identify priority strategies and/or
evidence-based interventions
Timeline Funding Source (s) Describe how you will evaluate the
effectiveness of the intervention(s) /
strategies. Describe how you will use an
equity lens in your evaluation.
By school year 2023,
Charles County will
meet or exceed targets
set by MSDE on the
ELA and Math MCAP
Assessments in grades
3-8.
By school year 2023,
Charles County will
develop and implement
a systemic professional
development program
for teachers of special
education students in
grades 3-8 in order to
meet or exceed the
targets set by MSDE on
the ELA and Math
MCAP Assessments.
Develop/compile a profile of professional development for individual educator role specific to SDI (Specially Designed Instruction).
Develop a professional development monitoring tool through ERO (Electronic Registrar Online) in connection with Synergy (Student Information System) to collect county wide PD (professional development) that teachers take part in and list in teacher profiles.
Work with Office of Accountability to house educator PD (professional development) in Synergy Profiles.
Train Principals/Administrators on best practices for monitoring educator PD that is
Jan. 2020 July 2020 July 2021 August 2021
Title I Part A
Title I Part C
Title I SIG
Title II Part A
Title III EL
Title III
Immigrant
Title IV Part A
Title V RLIS
IDEA
McKinney Vento
Local Funding
State Funding
Other
Access Equity Progress Grant
Striving Readers Comprehensive Literacy Grant
Retention rate of teachers with three or fewer years teaching experience
Teacher exit surveys (of teachers who leave the system)
Student achievement data (MCAP results)
Fidelity checks built into evidence-based interventions
Usage charts for computer-based interventions
Analyze student progress within the interventions
Data from school visits by Central Office staff
Feedback from Principals at monthly Principals meetings
Impact of Equity Policy Our objective is to provide special education students equitable access to evidence-based supports so that each student gains the skills needed for academic success. Subsequently, teachers of special education students
X
X
CCPS 2019 Local ESSA Consolidated Strategic Plan 22
meaningful, sustained and differentiated.
Explain Synergy Profiles to employees during back to school week SY 21/22
Introductory session for school-based leadership teams
Conduct PD for 65 staff
members on High Leverage
Practices for general
educators, special educators,
and instructional assistants
Evidence-Based Interventions:
Co-Teaching
High Leverage Practices
Research Based Interventions/Evidence Based Interventions
Number Worlds
Dream Box
Fundations
Wilson
LLI (Leveled Literacy Intervention)
Just Words – purchased for all middle schools
Moby Max
Imagine Learning
Conduct PD for building level administrators to reflect on current practices for delivering SDI and receiving capacity building tools and monitoring resources
Begin SDI (Specially Designed Instruction) PD
August 2021 June 2019 August 2019 August 2019 August 2019
must have equitable access to professional learning opportunities so that they can effectively impact student performance.

CCPS 2019 Local ESSA Consolidated Strategic Plan 23
(professional development) in 6 focus schools – observation built into training, survey teachers throughout training to assess needs
Conduct fidelity checks for implementation of interventions, co-teaching implementation and planning, rigor and engagement in self- contained classes, and writing high-quality IEPs
Analyze student progress data to determine effectiveness with intervention, evaluate results, possibly use as a model, consider expansion to additional schools.
SY 19/20 SY 20-22
CCPS 2019 Local ESSA Consolidated Strategic Plan 24
Area of Focus #2: State Assessment Performance: Math and ELA – Grade 3-8
1. Based on the analysis of State and local data, identify the area of focus where the local school system did not meet the goals (areas where the local school system is performing below expectations). In the response, provide the rationale for selecting the area of focus, include the implementation of strategies and/or evidence-based interventions to support student achievement. Describe priority strategies and/or evidence-based interventions to address disparities in achievement and to improve student performance. As school systems respond to area of focus #1, refer to page 15 to guide your response to address specific student groups.
a. Description. Describe Area of Focus #2 and how it aligns with your LSS educational
equity policy. Describe the rationale for selecting the areas of focus (up to 1,000 character).
In order to improve student performance, all students including students of color, students with disabilities, and ELs need equitable access to effective teachers who implement standards with rigor as stated in the CCPS draft equity policy. A quarter of our teachers have less than 3 years teaching experience in CCPS or are conditionally certified. Therefore, there is a need to strengthen our existing Instructional Leadership Teams (ILT) in order to build and maintain teacher capacity in elementary and middle schools.
b. Analysis. To support student achievement, provide an interpretation or justification for data used to identify this need (up to 1,000 characters).
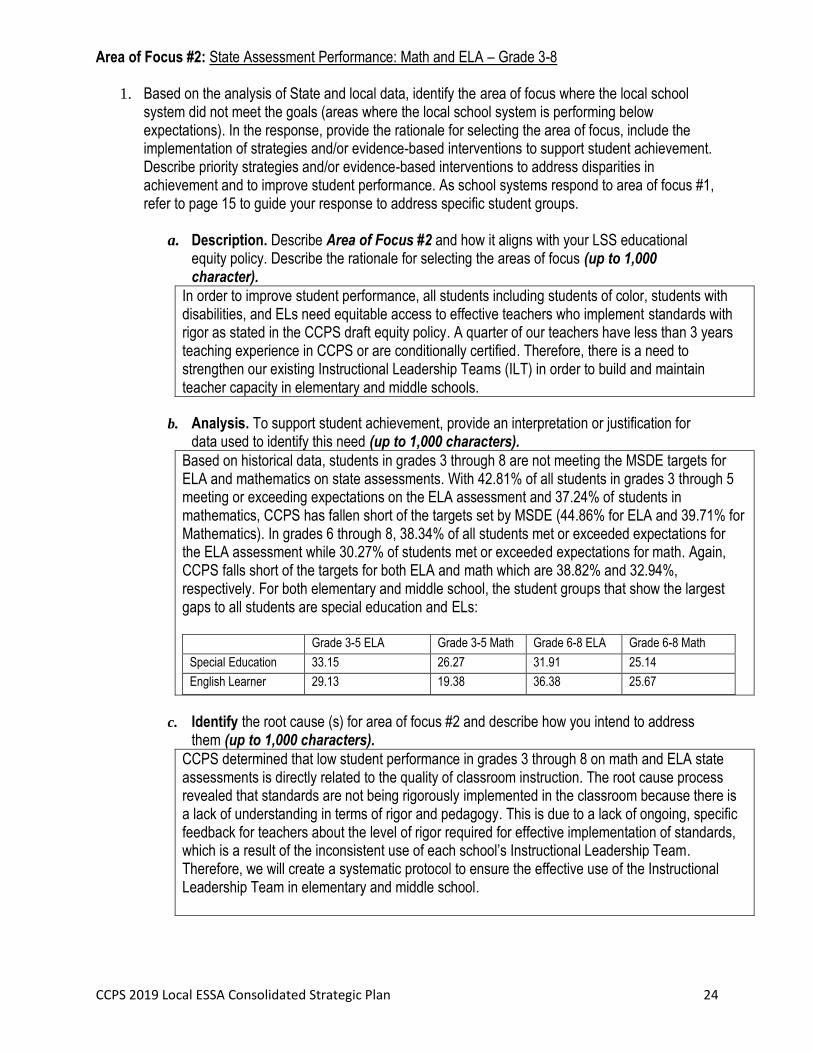
Based on historical data, students in grades 3 through 8 are not meeting the MSDE targets for ELA and mathematics on state assessments. With 42.81% of all students in grades 3 through 5 meeting or exceeding expectations on the ELA assessment and 37.24% of students in mathematics, CCPS has fallen short of the targets set by MSDE (44.86% for ELA and 39.71% for Mathematics). In grades 6 through 8, 38.34% of all students met or exceeded expectations for the ELA assessment while 30.27% of students met or exceeded expectations for math. Again, CCPS falls short of the targets for both ELA and math which are 38.82% and 32.94%, respectively. For both elementary and middle school, the student groups that show the largest gaps to all students are special education and ELs:
Grade 3-5 ELA Grade 3-5 Math Grade 6-8 ELA Grade 6-8 Math
Special Education 33.15 26.27 31.91 25.14
English Learner 29.13 19.38 36.38 25.67
c. Identify the root cause (s) for area of focus #2 and describe how you intend to address them (up to 1,000 characters).
CCPS determined that low student performance in grades 3 through 8 on math and ELA state assessments is directly related to the quality of classroom instruction. The root cause process revealed that standards are not being rigorously implemented in the classroom because there is a lack of understanding in terms of rigor and pedagogy. This is due to a lack of ongoing, specific feedback for teachers about the level of rigor required for effective implementation of standards, which is a result of the inconsistent use of each school’s Instructional Leadership Team. Therefore, we will create a systematic protocol to ensure the effective use of the Instructional Leadership Team in elementary and middle school.
CCPS 2019 Local ESSA Consolidated Strategic Plan 25
Area of Focus #2: State Assessment Performance: Math and ELA – Grade 3-8
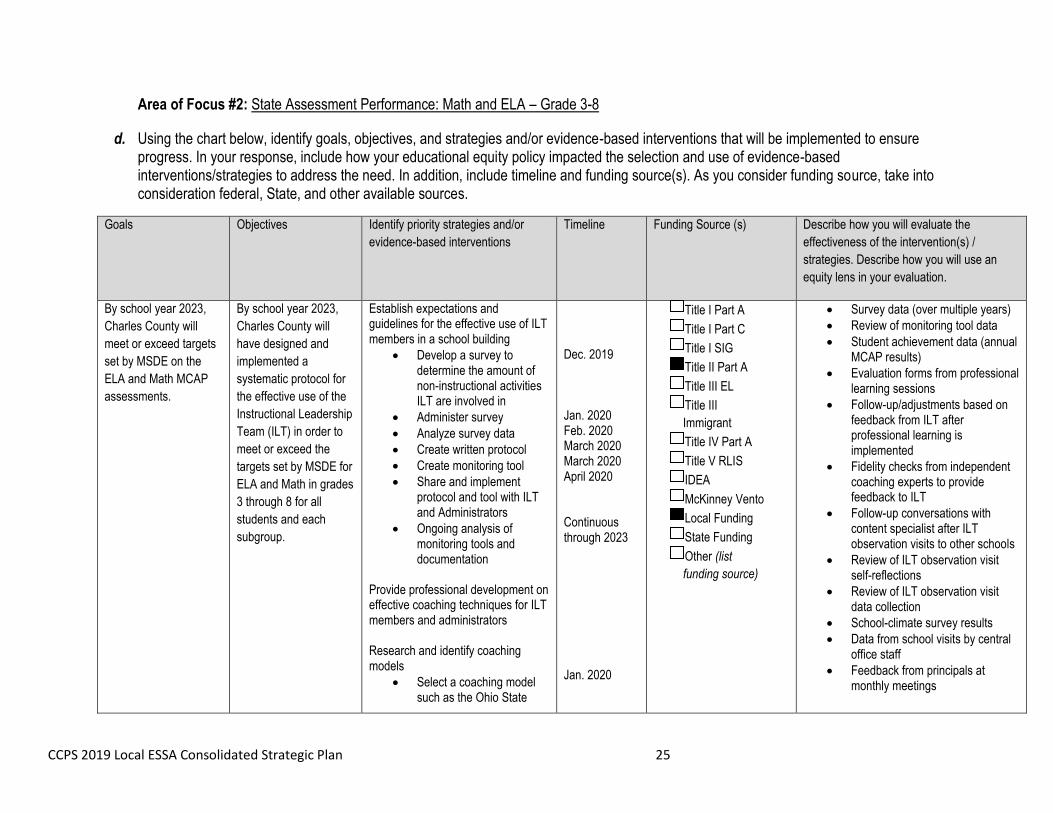
d. Using the chart below, identify goals, objectives, and strategies and/or evidence-based interventions that will be implemented to ensure progress. In your response, include how your educational equity policy impacted the selection and use of evidence-based interventions/strategies to address the need. In addition, include timeline and funding source(s). As you consider funding source, take into consideration federal, State, and other available sources.
Goals Objectives Identify priority strategies and/or
evidence-based interventions
Timeline Funding Source (s) Describe how you will evaluate the
effectiveness of the intervention(s) /
strategies. Describe how you will use an
equity lens in your evaluation.
By school year 2023,
Charles County will
meet or exceed targets
set by MSDE on the
ELA and Math MCAP
assessments.
By school year 2023,
Charles County will
have designed and
implemented a
systematic protocol for
the effective use of the
Instructional Leadership
Team (ILT) in order to
meet or exceed the
targets set by MSDE for
ELA and Math in grades
3 through 8 for all
students and each
subgroup.
Establish expectations and guidelines for the effective use of ILT members in a school building
Develop a survey to determine the amount of non-instructional activities ILT are involved in
Administer survey
Analyze survey data
Create written protocol
Create monitoring tool
Share and implement protocol and tool with ILT and Administrators
Ongoing analysis of monitoring tools and documentation
Provide professional development on effective coaching techniques for ILT members and administrators Research and identify coaching models
Select a coaching model such as the Ohio State
Dec. 2019 Jan. 2020 Feb. 2020 March 2020 March 2020 April 2020 Continuous through 2023 Jan. 2020
Title I Part A
Title I Part C
Title I SIG
Title II Part A
Title III EL
Title III
Immigrant
Title IV Part A
Title V RLIS
IDEA
McKinney Vento
Local Funding
State Funding
Other (list
funding source)
Survey data (over multiple years)
Review of monitoring tool data
Student achievement data (annual MCAP results)
Evaluation forms from professional learning sessions
Follow-up/adjustments based on feedback from ILT after professional learning is implemented
Fidelity checks from independent coaching experts to provide feedback to ILT
Follow-up conversations with content specialist after ILT observation visits to other schools
Review of ILT observation visit self-reflections
Review of ILT observation visit data collection
School-climate survey results
Data from school visits by central office staff
Feedback from principals at monthly meetings
CCPS 2019 Local ESSA Consolidated Strategic Plan 26
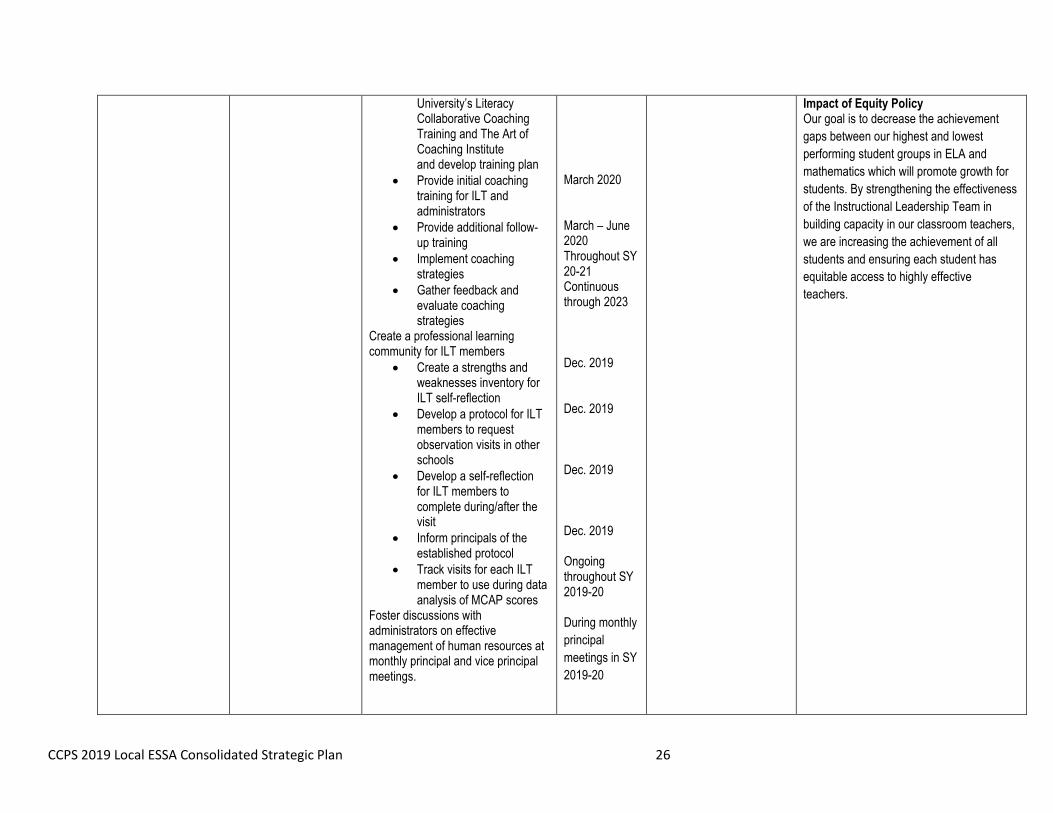
University’s Literacy Collaborative Coaching Training and The Art of Coaching Institute and develop training plan
Provide initial coaching training for ILT and administrators
Provide additional follow-up training
Implement coaching strategies
Gather feedback and evaluate coaching strategies
Create a professional learning community for ILT members
Create a strengths and weaknesses inventory for ILT self-reflection
Develop a protocol for ILT members to request observation visits in other schools
Develop a self-reflection for ILT members to complete during/after the visit
Inform principals of the established protocol
Track visits for each ILT member to use during data analysis of MCAP scores
Foster discussions with administrators on effective management of human resources at monthly principal and vice principal meetings.
March 2020 March – June 2020 Throughout SY 20-21 Continuous through 2023 Dec. 2019 Dec. 2019 Dec. 2019 Dec. 2019 Ongoing throughout SY 2019-20 During monthly
principal
meetings in SY
2019-20
Impact of Equity Policy Our goal is to decrease the achievement
gaps between our highest and lowest
performing student groups in ELA and
mathematics which will promote growth for
students. By strengthening the effectiveness
of the Instructional Leadership Team in
building capacity in our classroom teachers,
we are increasing the achievement of all
students and ensuring each student has
equitable access to highly effective
teachers.
CCPS 2019 Local ESSA Consolidated Strategic Plan 27
Area of Focus #3: State Assessment Performance: ELA – Grades 3-8
2. Based on the analysis of State and local data, identify the area of focus where the local school system did not meet the goals (areas where the local school system is performing below expectations). In the response, provide the rationale for selecting the area of focus, include the implementation of strategies and/or evidence-based interventions to support student achievement. Describe priority strategies and/or evidence-based interventions to address disparities in achievement and to improve student performance. As school systems respond to area of focus #1, refer to page 15 to guide your response to address specific student groups.
a. Description. Describe Area of Focus #3 and how it aligns with your LSS educational
equity policy. Describe the rational for selecting the area of focus (up to 1,000 characters).
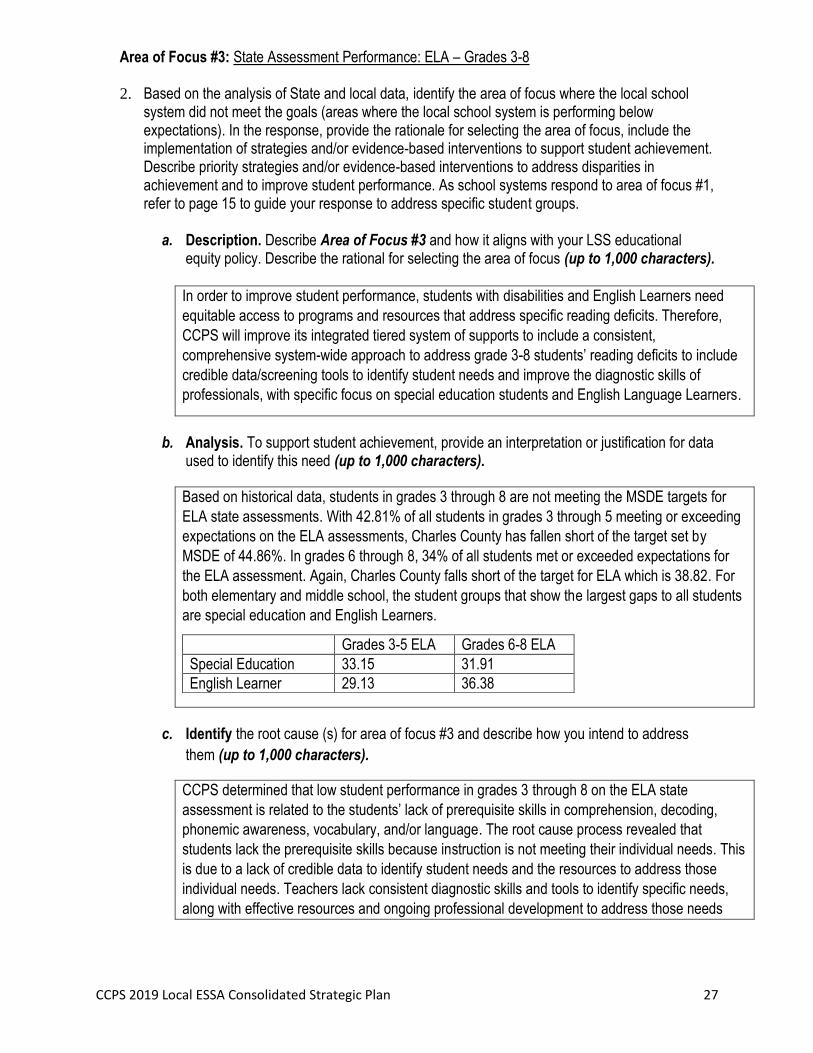
In order to improve student performance, students with disabilities and English Learners need
equitable access to programs and resources that address specific reading deficits. Therefore,
CCPS will improve its integrated tiered system of supports to include a consistent,
comprehensive system-wide approach to address grade 3-8 students’ reading deficits to include
credible data/screening tools to identify student needs and improve the diagnostic skills of
professionals, with specific focus on special education students and English Language Learners.
b. Analysis. To support student achievement, provide an interpretation or justification for data used to identify this need (up to 1,000 characters).
Based on historical data, students in grades 3 through 8 are not meeting the MSDE targets for
ELA state assessments. With 42.81% of all students in grades 3 through 5 meeting or exceeding
expectations on the ELA assessments, Charles County has fallen short of the target set by
MSDE of 44.86%. In grades 6 through 8, 34% of all students met or exceeded expectations for
the ELA assessment. Again, Charles County falls short of the target for ELA which is 38.82. For
both elementary and middle school, the student groups that show the largest gaps to all students
are special education and English Learners.
Grades 3-5 ELA Grades 6-8 ELA
Special Education 33.15 31.91
English Learner 29.13 36.38
c. Identify the root cause (s) for area of focus #3 and describe how you intend to address
them (up to 1,000 characters).
CCPS determined that low student performance in grades 3 through 8 on the ELA state
assessment is related to the students’ lack of prerequisite skills in comprehension, decoding,
phonemic awareness, vocabulary, and/or language. The root cause process revealed that
students lack the prerequisite skills because instruction is not meeting their individual needs. This
is due to a lack of credible data to identify student needs and the resources to address those
individual needs. Teachers lack consistent diagnostic skills and tools to identify specific needs,
along with effective resources and ongoing professional development to address those needs
CCPS 2019 Local ESSA Consolidated Strategic Plan 28
through intensive instruction. Therefore, we will create a consistent, comprehensive system-wide
plan to address students’ reading deficits.
CCPS 2019 Local ESSA Consolidated Strategic Plan 29
Area of Focus #3: State Assessment Performance: ELA – Grades 3-8
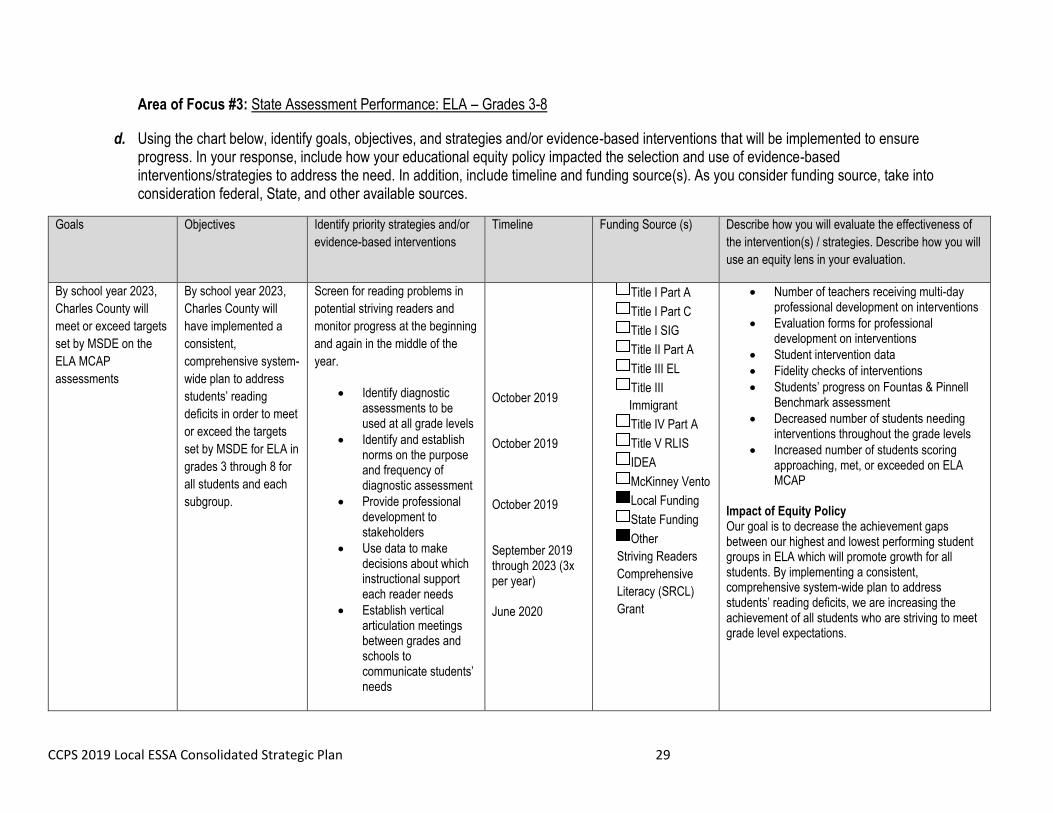
d. Using the chart below, identify goals, objectives, and strategies and/or evidence-based interventions that will be implemented to ensure progress. In your response, include how your educational equity policy impacted the selection and use of evidence-based interventions/strategies to address the need. In addition, include timeline and funding source(s). As you consider funding source, take into consideration federal, State, and other available sources.
Goals Objectives Identify priority strategies and/or
evidence-based interventions
Timeline Funding Source (s) Describe how you will evaluate the effectiveness of
the intervention(s) / strategies. Describe how you will
use an equity lens in your evaluation.
By school year 2023,
Charles County will
meet or exceed targets
set by MSDE on the
ELA MCAP
assessments
By school year 2023,
Charles County will
have implemented a
consistent,
comprehensive system-
wide plan to address
students’ reading
deficits in order to meet
or exceed the targets
set by MSDE for ELA in
grades 3 through 8 for
all students and each
subgroup.
Screen for reading problems in
potential striving readers and
monitor progress at the beginning
and again in the middle of the
year.
Identify diagnostic assessments to be used at all grade levels
Identify and establish norms on the purpose and frequency of diagnostic assessment
Provide professional development to stakeholders
Use data to make decisions about which instructional support each reader needs
Establish vertical articulation meetings between grades and schools to communicate students’ needs
October 2019 October 2019 October 2019 September 2019 through 2023 (3x per year) June 2020
Title I Part A
Title I Part C
Title I SIG
Title II Part A
Title III EL
Title III
Immigrant
Title IV Part A
Title V RLIS
IDEA
McKinney Vento
Local Funding
State Funding
Other
Striving Readers
Comprehensive
Literacy (SRCL)
Grant
Number of teachers receiving multi-day professional development on interventions
Evaluation forms for professional development on interventions
Student intervention data
Fidelity checks of interventions
Students’ progress on Fountas & Pinnell Benchmark assessment
Decreased number of students needing interventions throughout the grade levels
Increased number of students scoring approaching, met, or exceeded on ELA MCAP
Impact of Equity Policy Our goal is to decrease the achievement gaps between our highest and lowest performing student groups in ELA which will promote growth for all students. By implementing a consistent, comprehensive system-wide plan to address students’ reading deficits, we are increasing the achievement of all students who are striving to meet grade level expectations.
CCPS 2019 Local ESSA Consolidated Strategic Plan 30
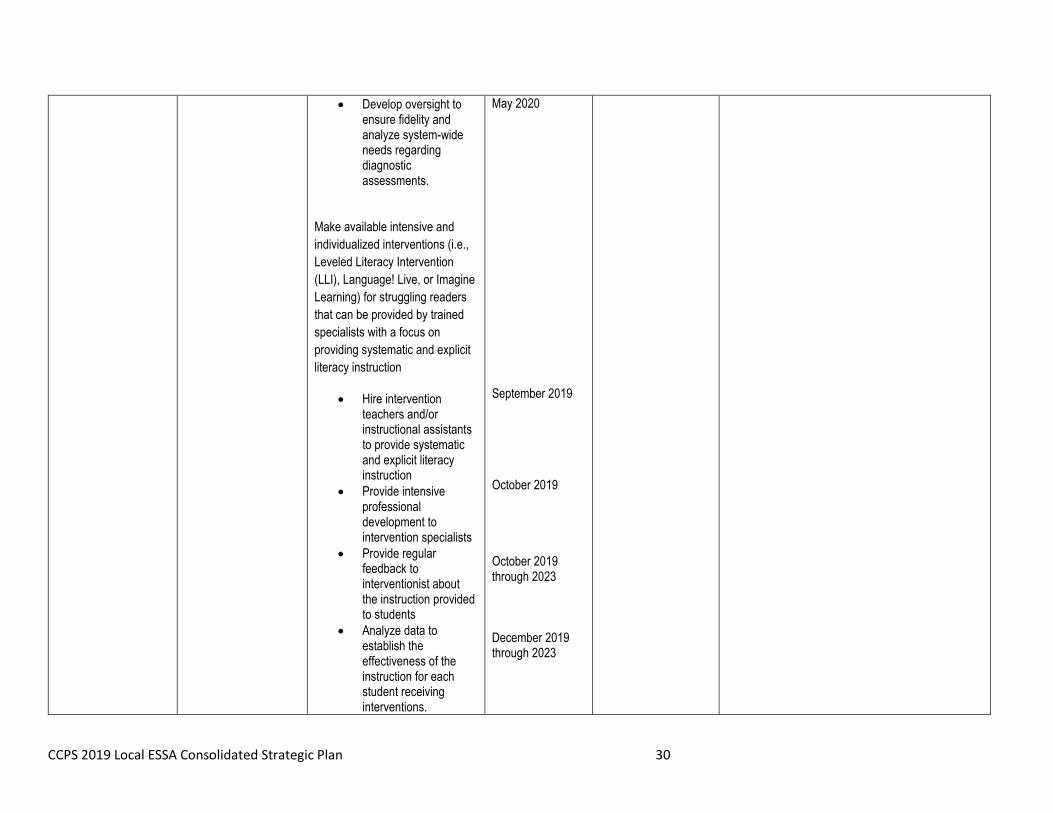
Develop oversight to ensure fidelity and analyze system-wide needs regarding diagnostic assessments.
Make available intensive and
individualized interventions (i.e.,
Leveled Literacy Intervention
(LLI), Language! Live, or Imagine
Learning) for struggling readers
that can be provided by trained
specialists with a focus on
providing systematic and explicit
literacy instruction
Hire intervention teachers and/or instructional assistants to provide systematic and explicit literacy instruction
Provide intensive professional development to intervention specialists
Provide regular feedback to interventionist about the instruction provided to students
Analyze data to establish the effectiveness of the instruction for each student receiving interventions.
May 2020 September 2019 October 2019 October 2019 through 2023 December 2019 through 2023
CCPS 2019 Local ESSA Consolidated Strategic Plan 31
Targeted Support and Improvement (TSI) Schools
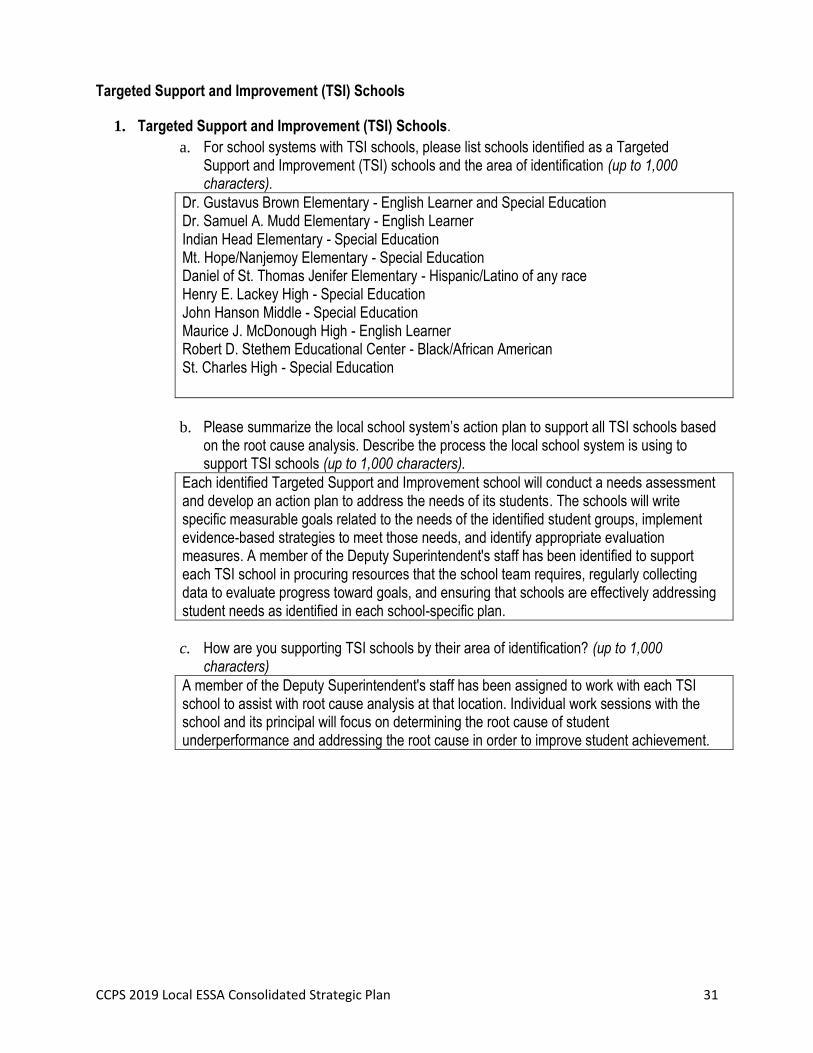
1. Targeted Support and Improvement (TSI) Schools.
a. For school systems with TSI schools, please list schools identified as a Targeted Support and Improvement (TSI) schools and the area of identification (up to 1,000 characters).
Dr. Gustavus Brown Elementary - English Learner and Special Education Dr. Samuel A. Mudd Elementary - English Learner Indian Head Elementary - Special Education Mt. Hope/Nanjemoy Elementary - Special Education Daniel of St. Thomas Jenifer Elementary - Hispanic/Latino of any race Henry E. Lackey High - Special Education John Hanson Middle - Special Education Maurice J. McDonough High - English Learner Robert D. Stethem Educational Center - Black/African American St. Charles High - Special Education
b. Please summarize the local school system’s action plan to support all TSI schools based
on the root cause analysis. Describe the process the local school system is using to support TSI schools (up to 1,000 characters).
Each identified Targeted Support and Improvement school will conduct a needs assessment and develop an action plan to address the needs of its students. The schools will write specific measurable goals related to the needs of the identified student groups, implement evidence-based strategies to meet those needs, and identify appropriate evaluation measures. A member of the Deputy Superintendent's staff has been identified to support each TSI school in procuring resources that the school team requires, regularly collecting data to evaluate progress toward goals, and ensuring that schools are effectively addressing student needs as identified in each school-specific plan.
c. How are you supporting TSI schools by their area of identification? (up to 1,000
characters)
A member of the Deputy Superintendent's staff has been assigned to work with each TSI school to assist with root cause analysis at that location. Individual work sessions with the school and its principal will focus on determining the root cause of student underperformance and addressing the root cause in order to improve student achievement.
CCPS 2019 Local ESSA Consolidated Strategic Plan 32
COMAR 13A.04.07 Gifted and Talented Education
COMAR 13A.04.07.06 specifies that local school systems (LSSs) shall report the following in their Local
ESSA Consolidated Strategic Plan. Use the chart below to provide your responses for 1, 4, 5, and 6 for the
2019-2020 school year.
1) The process for identifying gifted and talented students Charles County Public Schools conducts a universal screening using the Cognitive Abilities Test (CogAT) Screener and Post-Screener assessments in November/December of each year for all second grade students. The CogAT Screener is first administered to all second grade students and includes a section of each of the batteries, Quantitative, Verbal and Non-Verbal. Students scoring in the 70th percentile on the CogAT Screener go on to take the Cog-AT Post-Screener assessment which completes the full 9 sections of the assessment. CogAT Post-Screener scores at or above the 85th percentile move forward to the Gifted Screening Committee. All new students to CCPS in third to seventh grade will be administered the CogAT Screener in November of each year. Students in third grade scoring at the 70th percentile and students in fourth to seventh grade scoring in the 75% percentile will move on with the CogAT Post-Screener. Students in 3rd grade with Post-Screener score at or above the 85% percentile and students in fourth to seventh grade at or above the 90% percentile will move on to have further data collected for screening of gifted services as determined by a committee. In addition to using percentile data, raw scores for individual batteries are also assessed for further screening. The additional data collected for the gifted screening committee will include but is not limited to the following: Teacher and parent checklists of observable gifted characteristics, student work samples, county and state assessment data, reading levels from Fountas and Pinnell, grades, and classroom observations. In addition to the universal screening, CCPS accepts referrals from teachers, administrators, counselors, parents, and the student themselves for screening for gifted services. Once a child has been referred, the Learning Resource Teacher at each elementary and middle school will arrange for the child to take the CogAT Post-Screener and will begin to collect data for the screening committee. The screening committee normally meets in the early spring to review all students; however, exceptions can be made and the committee convene when needed. Once released, state assessment scores are analyzed to identify students who scored in the top 5% to 10% of the county. These students are automatically referred to the screening committee for placement in the gifted program. In the primary grades, teachers use the Harrison Observation form to identify students with advanced potential. The classroom teacher and the Learning Resource Teacher collaborate to provide challenging, advanced educational experiences for students identified through the observation form.
2) The number of gifted and talented students identified in each school* *The number and percentage of GT students in each school and LSS will be calculated from Attendance Data Collections provided to the MSDE Office of Accountability.
3) The percentage of gifted and talented students identified in the local school system* *The number and percentage of GT students in each school and LSS will be calculated from Attendance Data Collections provided to the MSDE Office of Accountability.
CCPS 2019 Local ESSA Consolidated Strategic Plan 33
4) The schools that have been exempted from identification of a significant number of gifted and talented students and the rationale
There are no schools that have been exempted from identification.
5) The continuum of programs and services Grades 3 through 5: Reading Students in grades 3 – 5 who have been identified for gifted services in reading receive instruction from their classroom teachers with support from the Learning Resource Teacher. Students are grouped with peers of similar academic needs for instruction that may include the use of advanced texts, shared inquiry discussion, advanced vocabulary and/or novel study. The classroom teacher may use the following resources to address the needs of students who require instruction beyond the regular curriculum.
Caesar’s English
Novel Studies
Touchpebbles
Junior Great Books; Fiction and Non-fiction series
The Jacob’s Ladder Reading Comprehension Program
Worldy Wise 3000, 2nd Edition
William and Mary Navigator Units for Novel Study
William and Mary Language Arts Units Grades 3 and 4: Mathematics Students who have been identified for gifted services in third and fourth grade math receive differentiated instruction from their classroom teachers with support from the Learning Resource Teacher. Students are grouped with peers of similar academic needs for small group instruction. The classroom teacher may use the following resources to address the needs of students who require instruction beyond the grade level curriculum:
Illustrative Math
Math in Practice
Mindset Mathematics
Motivation Math
Project M3 Mentoring Mathematical Minds
Challenging Common Core Math Lessons from William and Mary University Grade 5 Mathematics Students in grade 5 who have been identified for gifted services in mathematics are placed in an accelerated math class or cluster group for their math block. Instruction in the class is delivered by a classroom teacher with support from the Learning Resource Teacher. The accelerated math curriculum addresses both 5th and 6th grade Maryland State College and Career Readiness Standards. Grade 6 – 8 Reading Students in middle school who have been identified for gifted services in reading are placed in a Gifted Language Arts class. Curriculum has been developed to provide appropriate levels of challenge through accelerated pacing and advanced content, vocabulary, research, writing, and language study. Instructional strategies focus on critical reading; analysis of issues, themes and moral dilemmas; critical approaches to literature; author studies, and a range of inquiry-base discussion models. Each grade level commences with a study of the language and themes of the works of William Shakespeare. The classroom teacher may use
CCPS 2019 Local ESSA Consolidated Strategic Plan 34
the following resources to address the needs of students who require instruction beyond the grade level curriculum:
Jacob’s Ladder
Junior Great Books
Touchstone Discussion Method
William and Mary Language Arts Units
Literature for Though Anthologies
Lessons from Common Lit
Challenging Common Core Language Arts Lesson from William and Mary University
ELA Lesson for Gifted and Advanced Learners from Vanderbilt University Grade 6 – 8 Mathematics Students in middle school who demonstrate high levels of achievement in mathematics take accelerated courses. Under the Maryland College and Career-Ready Standards for Mathematics, students may be placed in 6th Grade Accelerated Math, 7th Grade Accelerated Math and Algebra I. Students who show an even more advanced aptitude in math may complete Honors Geometry in the middle school as well. High School Students in high school have available to them honors level courses that have curriculum that are designed for students who are motivated to go beyond the foundational knowledge of the discipline. Honors courses build upon the successes of earlier experiences and stimulate students to explore their potential. In all grades, gifted learners have an opportunity to be enrolled in honors English, an advanced math class that meets their sequence of learning, honors social studies, honors science, world languages, and performing arts classes. In addition to the honors courses, Advanced Placement courses are available beginning in the 10 th grade. These courses provide rigorous college preparatory coursework in the major subject areas. Opportunities for Gifted Learners provided by the school district include but not limited to: Destination Imagination (K – 12) History Day Projects (7 – 12) Project Lead the Way Launch (K – 2) Gateway to Technology (6 – 8) Pathway to Engineering (9 – 12) Biomedical Sciences (9 – 12) Various Robotics programs (K – 12) SeaPerch, Lego, VEX, VEX1Q, and Unmanned Aerial Vehicle MESA (3 – 12) Math Challenge (4 – 5) Math Counts (6 – 8) It’s Academic Competition (9 – 12) Chess Teams (K – 12) Envirothon Team
6) Data-informed goals, targets, strategies, and timelines. Additional spaces can be added.
CCPS 2019 Local ESSA Consolidated Strategic Plan 35
Goal: Educators of identified gifted students shall engage in professional learning aligned with the competencies of the Gifted and Talented Education Specialist endorsement in order to build their capacity of the gifted learner’s unique characteristics, needs, and achievement. Note: Teachers receive information from the learning resource teacher on gifted characteristics prior to referring students for services.
Target: Elementary and middle school teachers that instruct students identified for gifted services in reading and math
High school teachers that instruct identified students for gifted services in reading and math
Strategies: Require elementary gifted cluster teachers to attend a session on the unique characteristics and achievement of the gifted learner Create and update professional development opportunities on gifted strategies that would be presented to teachers during their PLC time.
Research, create and implement an evening professional development to be offered on social and emotional needs of the gifted learner in the high school
Timeline: County-wide in-service day on November 11, 2019 October 2019 – May 2020
October 2019 – May 2020
Goal: Curriculum in Pre-Kindergarten to second grade shall include researched based strategies to document and foster early evidence of advanced learning behaviors in students.
Target: Kindergarten to second grade teachers
Pre-K students
Strategies: Work with Science and primary specialists to determine how the Project Lead the Way program can be used to document advanced learning and foster critical thinking behaviors in K-2nd grade students Develop an observation tool to document advanced behaviors to be included with universal screening in 2nd grade
Research how data from the Preschool Early Literacy Indicators (PELI) Assessment administered three times per year can be used to identify Pre-K students with advanced learning behaviors.
Timeline: October 2019 – April 2020 May – June, 2020
October 2019 – January 2020
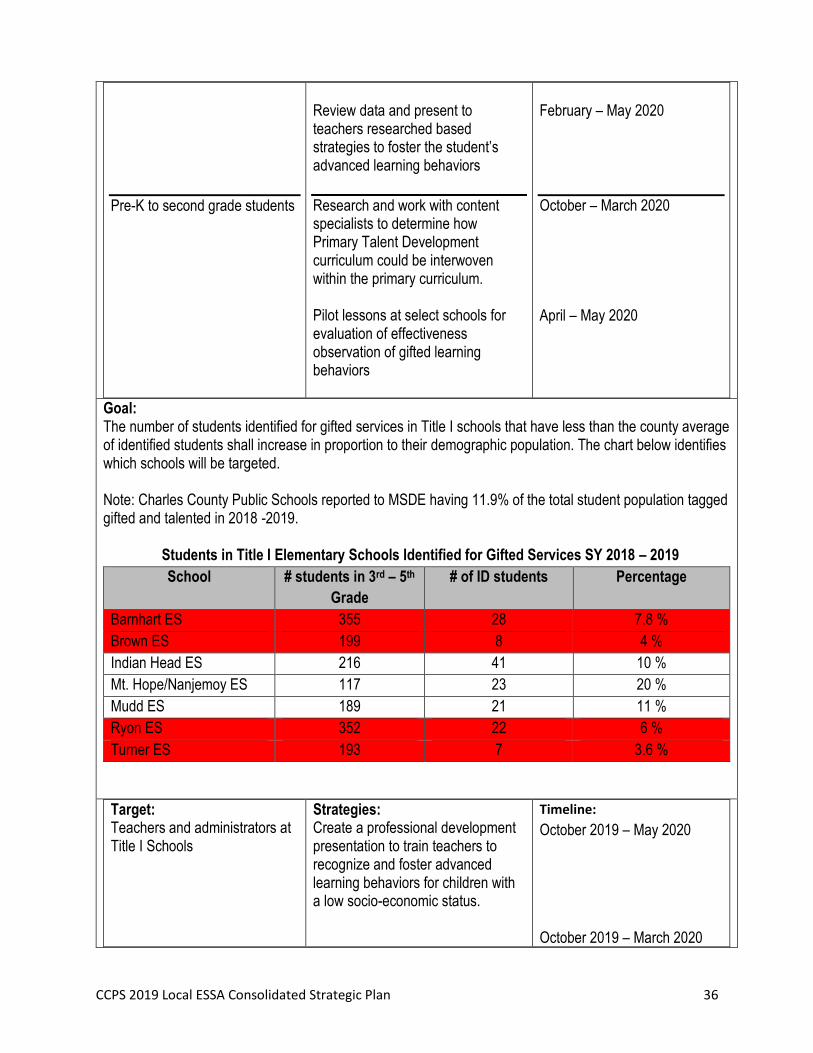
CCPS 2019 Local ESSA Consolidated Strategic Plan 36
Pre-K to second grade students
Review data and present to teachers researched based strategies to foster the student’s advanced learning behaviors
Research and work with content specialists to determine how Primary Talent Development curriculum could be interwoven within the primary curriculum. Pilot lessons at select schools for evaluation of effectiveness observation of gifted learning behaviors
February – May 2020
October – March 2020 April – May 2020
Goal: The number of students identified for gifted services in Title I schools that have less than the county average of identified students shall increase in proportion to their demographic population. The chart below identifies which schools will be targeted. Note: Charles County Public Schools reported to MSDE having 11.9% of the total student population tagged gifted and talented in 2018 -2019.
Students in Title I Elementary Schools Identified for Gifted Services SY 2018 – 2019
School # students in 3rd – 5th
Grade
# of ID students Percentage
Barnhart ES 355 28 7.8 %
Brown ES 199 8 4 %
Indian Head ES 216 41 10 %
Mt. Hope/Nanjemoy ES 117 23 20 %
Mudd ES 189 21 11 %
Ryon ES 352 22 6 %
Turner ES 193 7 3.6 %
Target: Teachers and administrators at Title I Schools
Strategies: Create a professional development presentation to train teachers to recognize and foster advanced learning behaviors for children with a low socio-economic status.
Timeline:
October 2019 – May 2020
October 2019 – March 2020
CCPS 2019 Local ESSA Consolidated Strategic Plan 37
Analyze the identification process at Title I schools to ensure equitable screening is occurring.
COMAR 13A.07.01 Comprehensive Teacher Induction and Mentoring
A. Provide a description of your Comprehensive Teacher Induction Program, including:
staffing and oversight;
orientation programs;
ongoing professional learning;
organization and schedules for mentor/mentee meetings;
opportunities for observation and co-teaching;
monitoring of new teacher needs, concerns, ongoing supports, formative review, and follow-up;
action plans; and
use of relevant and appropriate data
Staffing & Oversight -The Instructional Specialist for Staff Development (synonymous with Supervisor) hires and supervises the New Teacher Mentors, collaborates with Academic Mentors hired for the secondary levels, and facilitates training initiatives geared for new teachers. Recruiting for New Teacher Mentors is ongoing. They are hourly employees who begin with an orientation and training in August before school starts. New Teacher Mentors end the school year in late May. Mentoring training is offered as a refresher during the month of June. Regular monthly meetings are held with the mentors to provide guidance, training, and peer collaboration. The supervisor communicates with principals as needed and updates the central office leadership throughout the year on any changes or needs of the program. Orientation - All new hires receive a day of onboarding which covers important resources and benefits for employees. In August of each year, all new teachers are invited to a 3 to 5 day orientation program which includes Day 1) Classroom Management; Day 2) Content or grade level curriculum, resources, and lesson plans to start the year. Master teachers are hired to work with specific groups; Day 3) Half-day Equity Training for a culturally diverse classroom and half-day school-based orientation; Day 4 and 5) Special areas such as STEM and Special Education provide additional training for new teachers. Other orientation topics for new teachers are offered on in-service days and include School Safety Training and Darkness to Light Training dealing with child-abuse and trauma. Make-up training dates are offered in the fall and spring for teachers who are hired after the start of the year for all pertinent new teacher courses. Schools provide training for new teachers on professional responsibilities such as Student Learning Objective (SLO) creation, the observation and monitoring process, and use of professional technologies in recording of attendance and grades. Ongoing Professional Learning - CCPS conducts three in-service days to provide professional learning for all teachers. New teachers are included in curriculum updates and effective instructional strategies. New Teacher Orientation make-up topics are offered to late hires in the fall and spring. Online classroom management and content specific training is made available to new teachers when recommended by school or central office leadership. To meet the needs identified in new teacher surveys, evening professional development with
CCPS 2019 Local ESSA Consolidated Strategic Plan 38
an extra pay stipend is offered to new teachers on Evidence-based Behavior Strategies and Avoiding Power Struggles. Early childhood and special education offer extensive topics to address tier I, II, or III interventions including Fundations, Just Words, and Wilson. Content specialists continue follow-up training for their new teachers with quarterly support sessions offered in small, content, and grade level groupings. An online catalog of professional development opportunities is available to all teachers with a filter to pull relevant offerings for new teachers. Spotlight emails go out regularly to highlight specific opportunities for new teacher training. CCPS offers tuition reimbursement for approved course work. This benefit allows teachers to reach out to MSDE, MPT, or colleges for more expensive classes that meet their needs. Other ongoing, district wide, training which is very relevant for new teachers includes Formative Assessment, Restorative Practices, and Mental Health First Aid. Two MSDE CPD courses are also offered every year to improve math content knowledge of elementary teachers called Teaching and Learning Mathematics. These courses target new teachers but welcome experienced teachers as well. At the school level, regular meetings occur with a focus on new teacher professional growth. Some of the topics include: instructional practices, use of formative assessment, analysis and planning with student data, or the implementation of school-wide initiatives (ex. PBIS, reading intervention) and/or book studies. Elementary math has ongoing professional development using the Math in Practice PD Bundles. New teachers and experienced teachers meet in grade level teams throughout the year to learn best practices for math instruction. Principals can also apply for substitutes or stipends to match new teachers with experienced teachers for peer observation or support in planning instruction. Organization and Schedules for Mentor/Mentee Meetings - New Teacher Mentors work approximately 15 to 20 hours a week and schedule regular meetings with mentees during their allotted time. Academic Mentors, which are appointed on the secondary level, carry a half-day teaching load and half-day release time to provide mentoring support to new teachers. This position is in addition to the school assigned New Teacher Mentor and they work collaboratively to provide comprehensive support to all new teachers without redundancy. In addition, schools have full-time release positions (ILT - Instructional Leadership Team) to support curriculum, instruction, and assessment. They focus on all teachers but specifically target the needs of new teachers as well by scheduling group and individual meetings as needed. At the elementary and middle school level, there are 3 full-time release positions in each school specializing in reading, math, and gifted education. High schools have one Resource Teacher position. Opportunities for Observation and Co-teaching - All new teachers are encouraged to observe at least one master teacher during their first year with CCPS and can continue to request additional opportunities as needed. Arrangements are made, when possible, to allow reciprocal observations by the master teacher. Debriefing takes place with the new teacher and academic mentor following the experience. New teacher mentors co-teach and model lessons on a limited basis and typically focus support in Danielson domains 2 and 3. Academic Mentors and members of the school based Instructional Leadership Team also model lessons and co-teach depending on the individual needs of the new teachers. Specific content support is offered by the ILT, content specialists, and by partnering with role alike experienced teachers in their school.
CCPS 2019 Local ESSA Consolidated Strategic Plan 39
Monitoring of New Teacher Needs, Concerns, Ongoing Supports, Formative Review, and Follow-up - New teachers are monitored formally by the Principal and Vice Principal(s) of their school. Ongoing monitoring, goal setting, formative reviews and follow-up takes place collaboratively. The professionals providing the ongoing non-evaluative supports described above include the following: New Teacher Mentors, Academic Mentors, Instructional Leadership Team, and central office Content Specialists. The supervisor reaches out to new teachers several times a year. The online welcome survey asks new teachers to identify areas where they have questions or would like assistance. This information is made available to New Teacher Mentors. The survey also asks them to confirm that they have met their mentor. The mentor supervisor (ie... Instructional Specialist for Staff Development) can follow-up to connect new teachers with mentors or other resources to help meet their identified needs. A brief mid-year new teacher survey touches base to check on the status of new teachers. Examples of the questions are as follows: how are they doing, what assistance do they need, how is their mentor assisting them, and how likely are they to return next year? This allows the office to take action where needed. The end of year new teacher survey is completed in June. This survey lists all of the services offered to new teachers during the year and asks them to identify where they participated and how useful the services were to them. This includes Professional Development offered, school-based supports, content area supports, and mentoring supports. Action plans and use of relevant and appropriate data - Goal setting is a regular part of the mentoring program. As goals are accomplished, additional goals are set for new teachers and mentors. Mentors also utilize a mentoring checklist to ensure informal observation and discussions are meaningful. Survey data is collected on new teachers’ perceived needs throughout the year and support services are offered in the areas in need of growth. Student data is viewed and discussed with teachers at the school level to identify areas of need for professional development. Attrition data and exit interview results are reviewed to determine ways to strengthen the program, meet the needs of new teachers, and increase retention.
B. Provide a description of your District Mentoring Program. The use of the term “mentor” includes coaches and consulting teachers.
training for new mentors;
supervision of mentors;
training for school administrators and school staff as described in .04E of the regulation;
process used to measure the effectiveness of the induction/mentoring and the results of that measurement
Mentoring staff that works with new teachers are offered ongoing training. All mentors have an orientation before school starts with extra training for any newly hired mentors. All mentors attend monthly meetings for guidance, collaboration, and training. CCPS has reached out to MSDE to provide additional mentor training approved by the New Teacher Center. Academic Mentors are provided with regular school-based training and have access to the tools and resources provided to New Teacher Mentors. The Striving Readers Comprehensive Literacy grant has provided training for the full-time release Reading Resource Teachers in Coaching Conversations. This year, the middle school resource teachers will meet every other week with Language Arts teachers on guided reading skills. The Deputy Superintendent provides
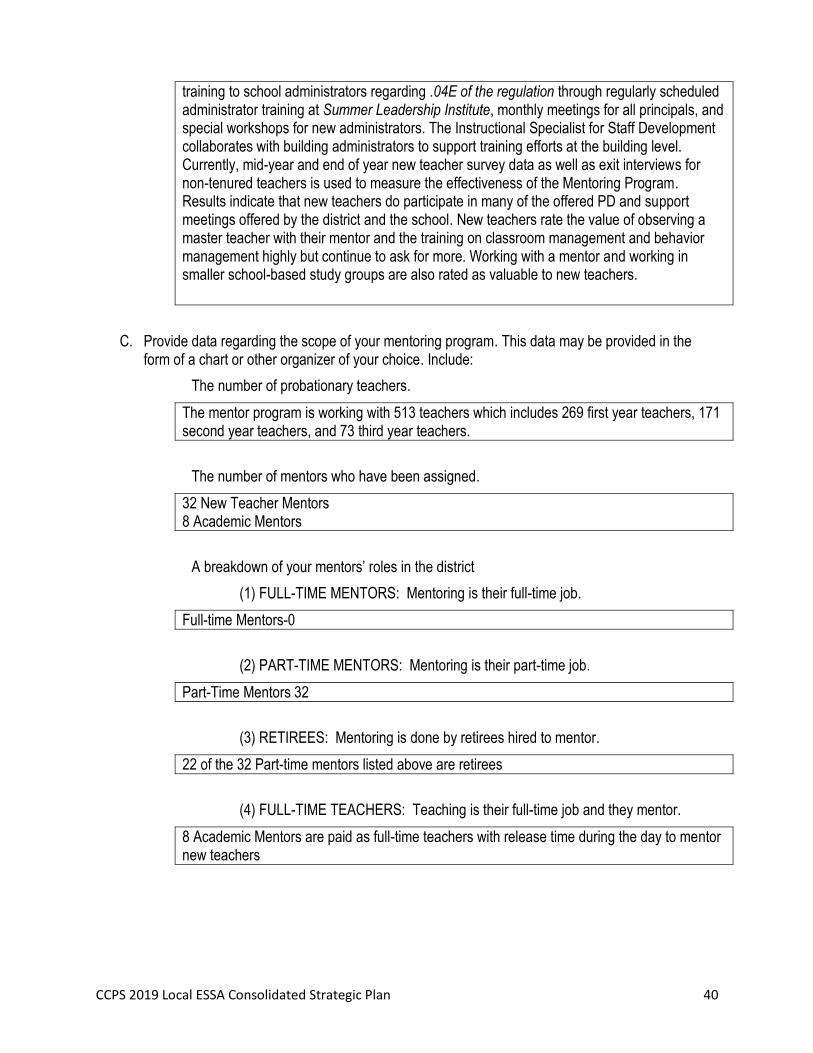
CCPS 2019 Local ESSA Consolidated Strategic Plan 40
training to school administrators regarding .04E of the regulation through regularly scheduled administrator training at Summer Leadership Institute, monthly meetings for all principals, and special workshops for new administrators. The Instructional Specialist for Staff Development collaborates with building administrators to support training efforts at the building level. Currently, mid-year and end of year new teacher survey data as well as exit interviews for non-tenured teachers is used to measure the effectiveness of the Mentoring Program. Results indicate that new teachers do participate in many of the offered PD and support meetings offered by the district and the school. New teachers rate the value of observing a master teacher with their mentor and the training on classroom management and behavior management highly but continue to ask for more. Working with a mentor and working in smaller school-based study groups are also rated as valuable to new teachers.
C. Provide data regarding the scope of your mentoring program. This data may be provided in the form of a chart or other organizer of your choice. Include:
The number of probationary teachers.
The mentor program is working with 513 teachers which includes 269 first year teachers, 171 second year teachers, and 73 third year teachers.
The number of mentors who have been assigned.
32 New Teacher Mentors 8 Academic Mentors
A breakdown of your mentors’ roles in the district
(1) FULL-TIME MENTORS: Mentoring is their full-time job.
Full-time Mentors-0
(2) PART-TIME MENTORS: Mentoring is their part-time job.
Part-Time Mentors 32
(3) RETIREES: Mentoring is done by retirees hired to mentor.
22 of the 32 Part-time mentors listed above are retirees
(4) FULL-TIME TEACHERS: Teaching is their full-time job and they mentor.
8 Academic Mentors are paid as full-time teachers with release time during the day to mentor new teachers
CCPS 2019 Local ESSA Consolidated Strategic Plan 41
Other appropriate data.
Instructional Leadership Team Members (ILT) and Resource Teachers are full-time release positions at each school who may also work part time with new teachers as assigned by the principal.
ILT (3 at each elementary school) - 78 and (3 at each middle schools) – 16
High School Resource Teachers - (1 at each high school) - 7
D. Provide a description of how your mentoring program is being evaluated. Include evaluation data and data on new teacher retention.
The CCPS program is evaluated using teacher feedback, retention data, and exit interviews. CCPS is recruiting widely to fill vacancies for new teachers. Exit interviews show that there are a wide variety of reasons for leaving which include a desire to return to their home area as well as a generalized desire for more support and behavior management. Mentor program survey data for the past year showed strengths in the following areas: building relationships, regular interactions, usefulness of observations of veteran teachers and willingness to help. Relative weaknesses were noted in the area of the amount time available for meaningful interactions, inability to assist with content or grade level material, and in some cases “feeling” the mentor did not understand the stressors on the new teacher. New teachers as well as mentors expressed a deep concern with behavior management strategies. This concern is addressed with the development of workshops covering Essential Classroom Management, Evidence-based Behavior Strategies, Avoiding Power Struggles, and Restorative Practices. On-going recruiting for New Teacher Mentors to provide support has increased the number of mentors from 22 to 32 and added 6 additional positions for the school-based, part-time release Academic Mentors.