charlevoix county, michigan county, michigan (all jurisdictions) community community name number...
TRANSCRIPT
CHARLEVOIX COUNTY, MICHIGAN (ALL JURISDICTIONS)
Community Community
Name Number BAY, TOWNSHIP OF 260796 BOYNE CITY, CITY OF 260056 *BOYNE FALLS, VILLAGE OF 260371 BOYNE VALLEY, TOWNSHIP OF 261292 *CHANDLER, TOWNSHIP OF 261293 CHARLEVOIX, CITY OF 260057 CHARLEVOIX, TOWNSHIP OF 260790 EAST JORDAN, CITY OF 260372 EVANGELINE, TOWNSHIP OF 260800 EVELINE, TOWNSHIP OF 260773
Community Community Name Number
HAYES, TOWNSHIP OF 260778 *HUDSON, TOWNSHIP OF 261294 MARION, TOWNSHIP OF 260808 MELROSE, TOWNSHIP OF 261295 NORWOOD, TOWNSHIP OF 260769 PEAINE, TOWNSHIP OF 261296 SOUTH ARM, TOWNSHIP OF 260761 ST. JAMES, TOWNSHIP OF 261297 *WILSON, TOWNSHIP OF 261298
*NO SPECIAL FLOOD HAZARD AREAS IDENTIFIED
Preliminary:
FLOOD INSURANCE STUDY NUMBER 26031CV000A
FLOOD INSURANCE STUDY NUMBER 26029CV000A
CHARLEVOIX COUNTY
NOTICE TO
FLOOD INSURANCE STUDY USERS
Communities participating in the National Flood Insurance Program have
established repositories of flood hazard data for floodplain management and flood
insurance purposes. This Flood Insurance Study (FIS) report may not contain all
data available within the Community Map Repository. Please contact the
Community Map Repository for any additional data.
The Federal Emergency Management Agency (FEMA) may revise and republish
part or all of this FIS report at any time. In addition, FEMA may revise part of
this FIS report by the Letter of Map Revision process, which does not involve
republication or redistribution of the FIS report. Therefore, users should consult
with community officials and check the Community Map Repository to obtain the
most current FIS report components.
Selected Flood Insurance Rate Map panels for this community contain
information that was previously shown separately on the corresponding Flood
Boundary and Floodway Map panels (e.g., floodways, cross sections). In addition,
former flood hazard zone designations have been changed as follows:
Old Zone(s) New Zone
Al through A30 AE
B X
C X
Initial Countywide FIS Effective Date: To Be Determined
i
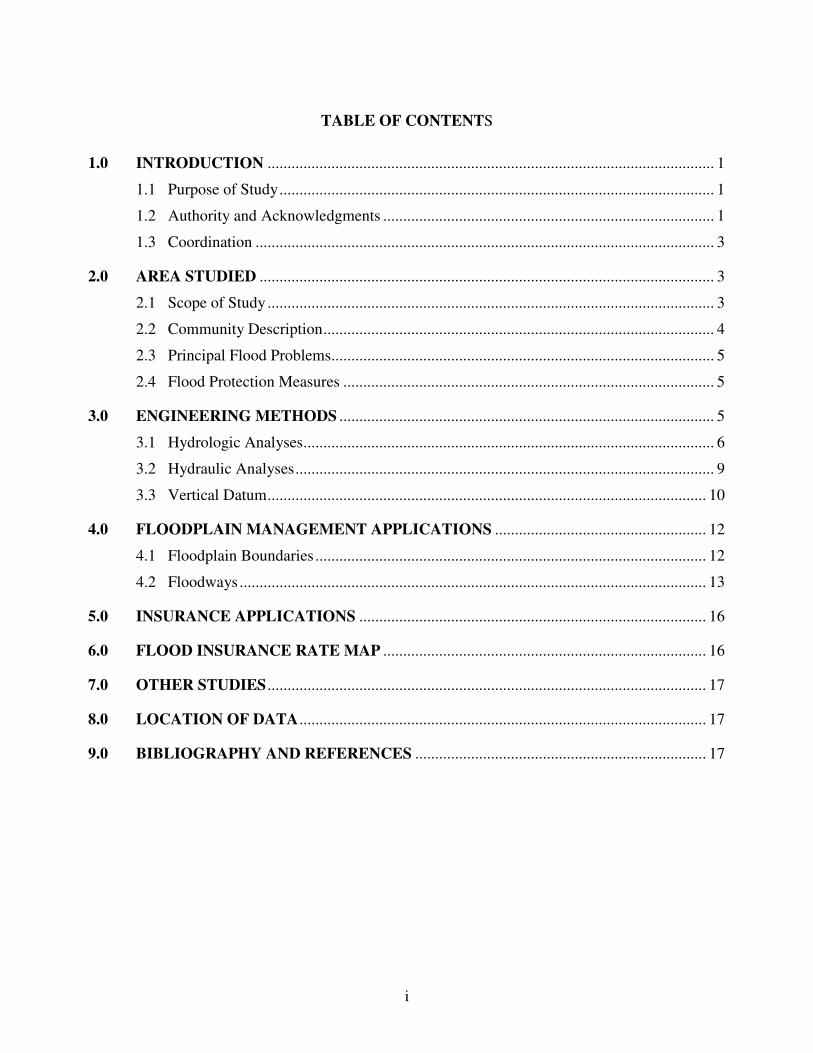
TABLE OF CONTENTS
1.0 INTRODUCTION ................................................................................................................ 1
1.1 Purpose of Study ............................................................................................................. 1
1.2 Authority and Acknowledgments ................................................................................... 1
1.3 Coordination ................................................................................................................... 3
2.0 AREA STUDIED .................................................................................................................. 3
2.1 Scope of Study ................................................................................................................ 3
2.2 Community Description .................................................................................................. 4
2.3 Principal Flood Problems ................................................................................................ 5
2.4 Flood Protection Measures ............................................................................................. 5
3.0 ENGINEERING METHODS .............................................................................................. 5
3.1 Hydrologic Analyses ....................................................................................................... 6
3.2 Hydraulic Analyses ......................................................................................................... 9
3.3 Vertical Datum .............................................................................................................. 10
4.0 FLOODPLAIN MANAGEMENT APPLICATIONS ..................................................... 12
4.1 Floodplain Boundaries .................................................................................................. 12
4.2 Floodways ..................................................................................................................... 13
5.0 INSURANCE APPLICATIONS ....................................................................................... 16
6.0 FLOOD INSURANCE RATE MAP ................................................................................. 16
7.0 OTHER STUDIES .............................................................................................................. 17
8.0 LOCATION OF DATA ...................................................................................................... 17
9.0 BIBLIOGRAPHY AND REFERENCES ......................................................................... 17
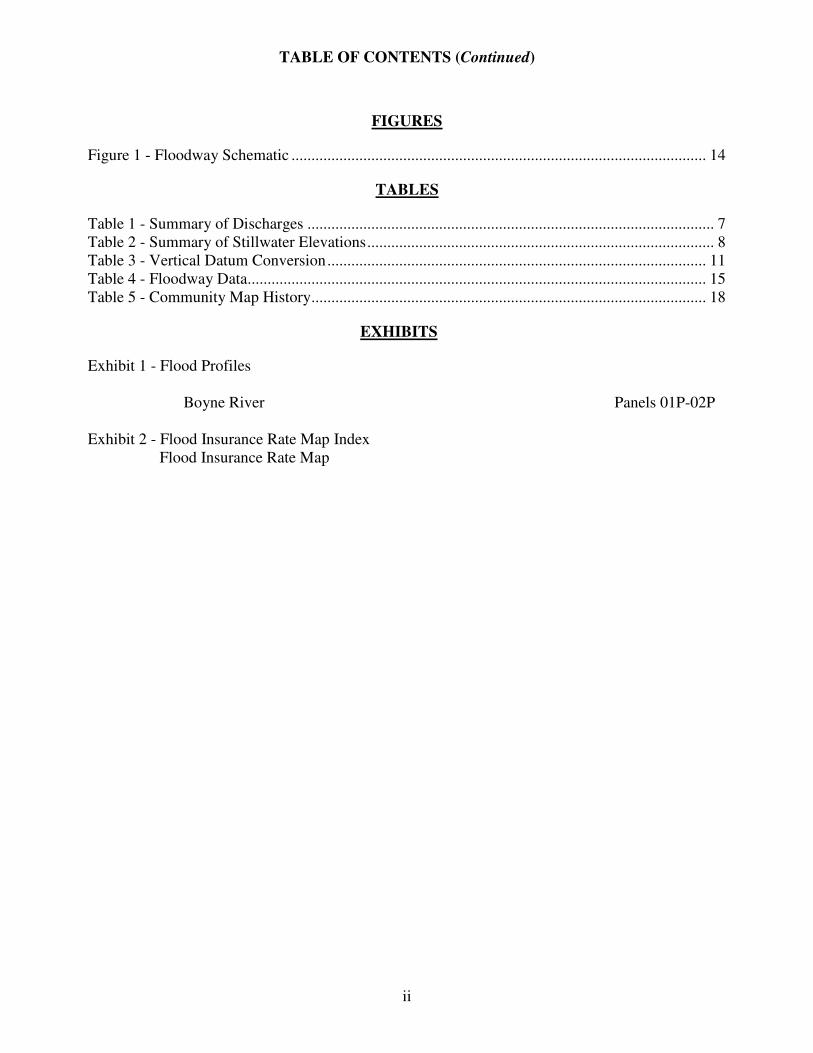
TABLE OF CONTENTS (Continued)
ii
FIGURES
Figure 1 - Floodway Schematic ........................................................................................................ 14
TABLES
Table 1 - Summary of Discharges ...................................................................................................... 7
Table 2 - Summary of Stillwater Elevations ....................................................................................... 8
Table 3 - Vertical Datum Conversion ............................................................................................... 11
Table 4 - Floodway Data................................................................................................................... 15
Table 5 - Community Map History ................................................................................................... 18
EXHIBITS
Exhibit 1 - Flood Profiles
Boyne River Panels 01P-02P
Exhibit 2 - Flood Insurance Rate Map Index
Flood Insurance Rate Map
1
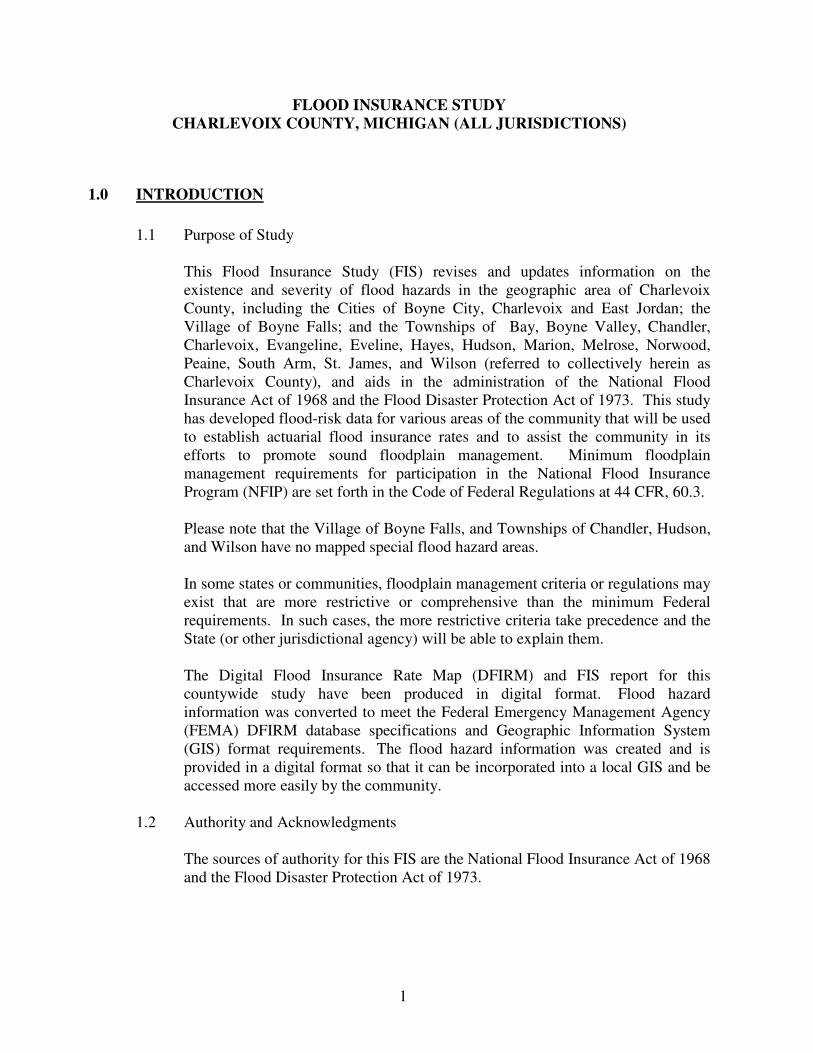
FLOOD INSURANCE STUDY
CHARLEVOIX COUNTY, MICHIGAN (ALL JURISDICTIONS)
1.0 INTRODUCTION
1.1 Purpose of Study
This Flood Insurance Study (FIS) revises and updates information on the
existence and severity of flood hazards in the geographic area of Charlevoix
County, including the Cities of Boyne City, Charlevoix and East Jordan; the
Village of Boyne Falls; and the Townships of Bay, Boyne Valley, Chandler,
Charlevoix, Evangeline, Eveline, Hayes, Hudson, Marion, Melrose, Norwood,
Peaine, South Arm, St. James, and Wilson (referred to collectively herein as
Charlevoix County), and aids in the administration of the National Flood
Insurance Act of 1968 and the Flood Disaster Protection Act of 1973. This study
has developed flood-risk data for various areas of the community that will be used
to establish actuarial flood insurance rates and to assist the community in its
efforts to promote sound floodplain management. Minimum floodplain
management requirements for participation in the National Flood Insurance
Program (NFIP) are set forth in the Code of Federal Regulations at 44 CFR, 60.3.
Please note that the Village of Boyne Falls, and Townships of Chandler, Hudson,
and Wilson have no mapped special flood hazard areas.
In some states or communities, floodplain management criteria or regulations may
exist that are more restrictive or comprehensive than the minimum Federal
requirements. In such cases, the more restrictive criteria take precedence and the
State (or other jurisdictional agency) will be able to explain them.
The Digital Flood Insurance Rate Map (DFIRM) and FIS report for this
countywide study have been produced in digital format. Flood hazard
information was converted to meet the Federal Emergency Management Agency
(FEMA) DFIRM database specifications and Geographic Information System
(GIS) format requirements. The flood hazard information was created and is
provided in a digital format so that it can be incorporated into a local GIS and be
accessed more easily by the community.
1.2 Authority and Acknowledgments
The sources of authority for this FIS are the National Flood Insurance Act of 1968
and the Flood Disaster Protection Act of 1973.
2
Precountywide Analyses
Information on the authority and acknowledgements for each jurisdiction included
in this countywide FIS, as compiled from their previously printed FIS reports, is
shown below:
Boyne City, City of: The hydrologic and hydraulic analyses for
Boyne River and Lake Charlevoix for the
January 19, 1982, FIS report (FEMA, 1982a)
were performed by US Army Corps of
Engineers (USACE), Detroit District, for
FEMA, under Interagency Agreement No.
IAA-H-9-79, Project Order No. 21. The work
was completed in January 1981.
East Jordan, City of: The hydrologic and hydraulic analyses for
Lake Charlevoix for the January 19, 1982, FIS
report (FEMA, 1982b) were performed by
USACE, Detroit District, for FEMA, under
Interagency Agreement No. IAA-H-9-79,
Project Order No. 21. The work was
completed in January 1981.
The City of Charlevoix; Village of Boyne Falls; and Townships of Bay, Boyne
Valley, Chandler, Charlevoix, Evangeline, Eveline, Hayes, Hudson, Marion,
Melrose, Norwood, Peaine, South Arm, St. James, and Wilson have no previously
printed FIS reports.
This Countywide FIS Report
For this countywide FIS, approximate analyses for flooding sources within
Charlevoix County were developed by Post Buckley Schuh & Jernigan, Inc.
(PBS&J). Flooding effects from Lake Michigan were redelineated by PBS&J,
using elevation data from the “Revised Report on Great Lakes Open-Coast Flood
Levels” and “Flood Levels Report on Grand Traverse Bay and Little Traverse
Bay” prepared by the USACE, Detroit District (USACE, 1988 and USACE,
1990). Lake Charlevoix was updated to reflect updated flood information.
Base Map Information shown on this Flood Insurance Rate Map (FIRM) was
provided in digital format by the Farm Services Administration, National Aerial
Imagery Program. This information was photogrammetrically compiled at a scale
of 1:40,000 from aerial photography dated 2005 or later. The projection used in
the preparation of this map is Universal Transverse Mercator zone 16, and the
3
horizontal datum used is the North American Datum of 1983 (NAD83), Geodetic
Reference System of 1980 spheroid.
1.3 Coordination
An initial meeting is held with representatives from FEMA, the community, and
the study contractor to explain the nature and purpose of a FIS, and to identify the
streams to be studied or restudied. A final meeting is held with representatives
from FEMA, the community, and the study contractor to review the results of the
study.
The initial and final meeting dates for previous FIS reports for Charlevoix County
and its communities are listed in the following table:
Community FIS Date Initial Meeting Final Meeting
Boyne City, City of January 19, 1982 November 15, 1978 August 26, 1981
East Jordan, City of January 19, 1982 November 15, 1978 August 21, 1981
An initial meeting is held with representatives from FEMA, the community, and
the study contractor to explain the nature and purpose of a FIS, and to identify the
streams to be studied or restudied. A final meeting is held with representatives
from FEMA, the community, and the study contractor to review the results of the
study.
For this countywide FIS the initial meeting was held in May 2008 and attended by
representatives of FEMA, Michigan Department of Natural Resources and
Environment (MDNRE), PBS&J, Charlevoix County and the incorporated areas
of the county.
The results of the study were reviewed at the final meeting held on
______________________________, and attended by representatives of
_________________________________. All problems raised at that meeting
have been addressed.
2.0 AREA STUDIED
2.1 Scope of Study
This FIS covers the geographic area of Charlevoix County, Michigan, including
the incorporated communities listed in Section 1.1. The areas studied by detailed
methods were selected with priority given to all known flood hazards and areas of
projected development or proposed construction through the time of the study.
4
The following streams and lakes were studied by detailed methods in this FIS
report:
Boyne River Lake Michigan
Lake Charlevoix
Lake Charlevoix was redelineated outside of the Cities of Boyne City and East
Jordan.
Lake Michigan was newly studied by detailed methods.
The limits of detailed study are indicated on the Flood Profiles (Exhibit 1) and on
the FIRM (Exhibit 2).
For this countywide FIS, the FIS report and FIRM were converted to countywide
format, and the flooding information for the entire county is shown. Also, the
vertical datum was converted from the National Geodetic Vertical Datum of 1929
(NGVD) to the North American Vertical Datum of 1988 (NAVD). In addition,
the Universal Transverse Mercator coordinates, previously referenced to the
North American Datum of 1927 (NAD27), are now referenced to the NAD83.
Approximate analyses were used to study those areas having low development
potential or minimal flood hazards. The scope and methods of study were
proposed to and agreed upon by FEMA, MDNRE, and PBS&J.
2.2 Community Description
Charlevoix County is located in the northwestern portion of Michigan’s Lower
Peninsula approximately 50 miles southwest of the Straits of Mackinac. It is
bordered by Emmet County to the north, Cheboygan County to the east, Otsego
County to the southeast, and Antrim County to the south. The county lies along
the eastern shore of Lake Michigan and includes the Beaver Island archipelago, a
group of islands located approximately midway between the Upper and Lower
Peninsulas.
The estimated 2008 population of Charlevoix County was 26,070 (U.S. Census
Bureau, 2010). The county encompasses 417 square miles of land (Charlevoix
County, 2010).
The average temperature is 45.1 degrees Fahrenheit. The prevailing winds are
westerly in the winter months. The average annual precipitation is 35.7 inches
and the average annual snowfall is 99 inches (The Weather Channel, 2010).
The topography of the county consists of low rolling hills with some areas in the
eastern portion of the county rising to about 1500 feet. Most of the shoreline
areas are flat, with some swampy areas occurring at the mouth of the Jordan
5
River. The shoreline area in the vicinity of the mouth of the Boyne River is
relatively flat, but the lake banks become more pronounced as they extend further
west along Lake Charlevoix.
Lake Charlevoix, the third largest lake in Michigan, has a surface area of 17,200
acres and 56 miles of shoreline. The lake extends in a southeast-northwest
direction for 13 miles and enters Lake Michigan at the City of Charlevoix
(Charlevoix County, 2009).
The majority of soils found in Charlevoix County are well drained or moderately
well drained, nearly level to gently sloping sandy soils on lake plains and valley
trains (Soil Conservation Service, 1974). These sands characteristically have a
low available water capacity and a rapid permeability. Water percolation through
the soil substantially reduces the amount of surface runoff. Poorly drained, nearly
level to gently sloping organic soils also exist in Charlevoix County in
depressional areas on till plains, outwash plains and lake plains. These soils
characteristically have a high available water capacity and a moderately rapid
permeability. Surface runoff in these soils is very slow or is subject to ponding.
2.3 Principal Flood Problems
Shoreline erosion is due primarily to high water effects caused by winds along
Lake Michigan and along Lake Charlevoix. Temporary seiche events, the sudden
rise of water levels caused by weather disturbances, on Lake Michigan can also
contribute to the erosion problems.
High water effects for Lake Charlevoix are caused by the seasonal and long term
variations in lake levels. There is approximately a one-foot seasonal change in
lake level from a low in winter to a high in early summer which is superimposed
upon longer term variations. Precipitation in the Lake Michigan watershed,
combined with evaporation, diversion, and the connecting navigational channel, is
mainly responsible for the lake level. However, diversion has only a very minor
effect on the level of Lake Michigan.
2.4 Flood Protection Measures
There are no known flood protection structures in Charlevoix County.
3.0 ENGINEERING METHODS
For the flooding sources studied by detailed methods in the community, standard
hydrologic and hydraulic study methods were used to determine the flood hazard data
required for this study. Flood events of a magnitude that are expected to be equaled or
exceeded once on the average during any 10-, 50-, 100-, or 500-year period (recurrence
interval) have been selected as having special significance for floodplain management
and for flood insurance rates. These events, commonly termed the 10-, 50-, 100-, and
6
500-year floods, have a 10-, 2-, 1-, and 0.2-percent chance, respectively, of being equaled
or exceeded during any year. Although the recurrence interval represents the long-term,
average period between floods of a specific magnitude, rare floods could occur at short
intervals or even within the same year. The risk of experiencing a rare flood increases
when periods greater than 1 year are considered. For example, the risk of having a flood
that equals or exceeds the 1-percent-annual-chance (100-year) flood in any 50-year
period is approximately 40 percent (4 in 10); for any 90-year period, the risk increases to
approximately 60 percent (6 in 10). The analyses reported herein reflect flooding
potentials based on conditions existing in the community at the time of completion of this
study. Maps and flood elevations will be amended periodically to reflect future changes.
3.1 Hydrologic Analyses
Hydrologic analyses were carried out to establish peak discharge-frequency
relationships for each flooding source studied by detailed methods affecting the
community.
Precountywide Analyses
To determine the flood elevations on Lake Charlevoix, an analysis was performed
to estimate the effects of local runoff on flood elevations. The analysis indicated
flood elevations will rise significantly from the impact of local runoff and rainfall
directly on the lake, but will be lower than the flood level associated with the
same specific frequency levels on Lake Michigan at the inlet to Lake Charlevoix
at the City of Charlevoix.
An analysis was then performed on the inlet navigation channel to determine its
capability to transfer elevation variations of Lake Michigan to Lake Charlevoix.
Due to the lack of recorded Lake Michigan elevations at the City of Charlevoix,
historical data recorded on Lake Michigan at the City of Ludington were
analyzed. Instantaneous peak rises, mean daily, and maximum monthly mean
values from 1951 through 1980 were analyzed. From these data a stage
hydrograph was developed for a significant event. Stage hydrographs for the
various open coast frequency levels were also developed using the shape of the
historical event as a guide. These stage hydrographs were then routed through the
navigation channel to determine if Lake Charlevoix could reach the same level as
Lake Michigan. The analysis indicated that gradual variations will be transferred
to Lake Charlevoix. However, the instantaneous peaks would be slightly reduced
as they pass through the navigation channel. The resulting elevations would be
higher than those caused by local runoff.
The flood elevations for Lake Michigan at Charlevoix were taken from “Report
on Great Lake's Open-Coast Flood Levels", prepared by the USACE, Detroit
District (USACE, 1977).
7
An analysis was also performed to determine the effect of additional wind set-up
on peak lake elevations at the Cities of Boyne City and East Jordan. Since no
gage records were available, wind set-up estimates were computed based on
equations developed by the USACE (USACE, 1975). The analysis indicated that
the increase in lake elevation would be negligible.
Within the city limits of East Jordan, there is a small portion of the lake which is
located southeast of the Michigan State Highway 32 bridge (Bridge Street). In
order to determine the backwater effects from this bridge, loss computations due
to flow through the bridge were analyzed using equations recommended by the
USACE (HEC, 1979). The results indicate that only a negligible amount of losses
will occur. Therefore, it was concluded that the peak flood elevations in this area
will be equal to the elevations of Lake Charlevoix.
For the Boyne River, peak discharges are the same as those listed in the “National
Dam Safety Program Inspection Report" for the Boyne River Dam (USACE,
1980a). The discharge values for the Dam Safety Report were developed by the
MDNRE. MDNRE used a drainage area ratio based on a log-Pearson Type III
analysis at US Geological Survey (USGS) gage No. 041728 on the Jordan River
(Bobee, 1975) and curves presented in the USGS Water Supply Paper 1677
(Wiitala, 1965) which involves computing the relationship between drainage
basin size, near annual flood and recurrence interval.
This Countywide FIS Report
For streams studied by approximate analyses, 1-percent-annual-chance discharges
were computed using published USGS regional regression equations (USGS,
1984) or gage analysis. Regression equations estimate peak discharges for
ungaged streams based on characteristics of nearby gaged streams.
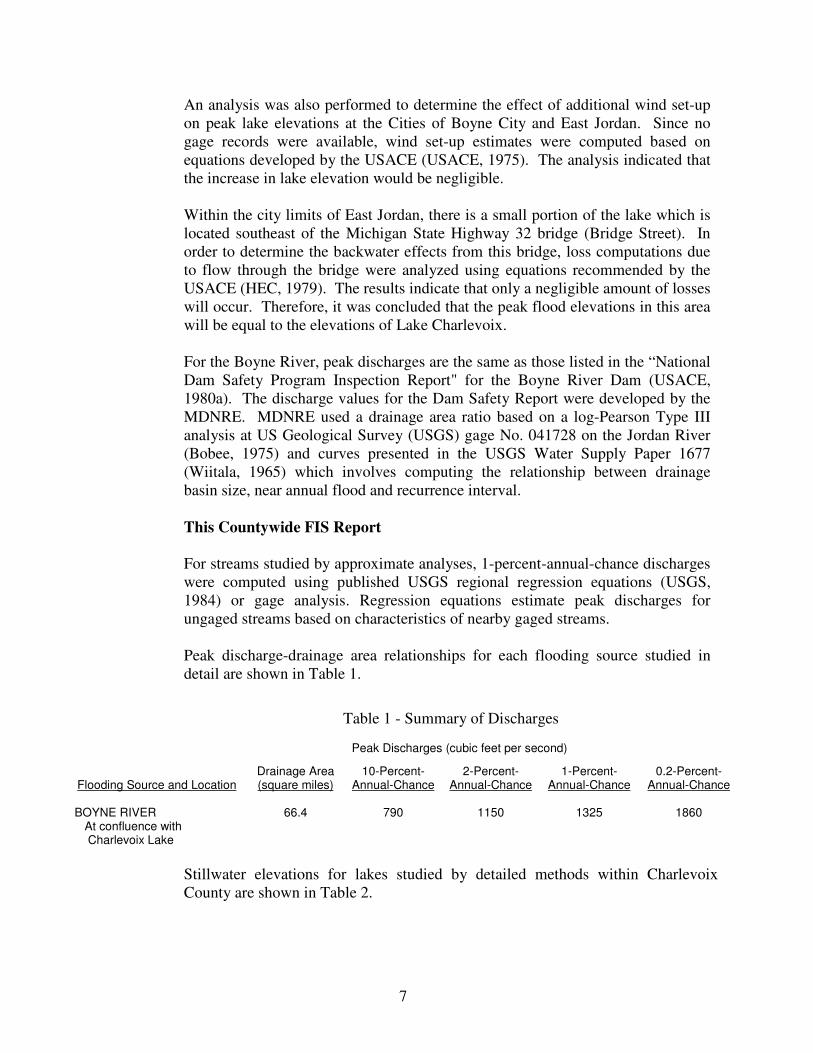
Peak discharge-drainage area relationships for each flooding source studied in
detail are shown in Table 1.
Table 1 - Summary of Discharges
Peak Discharges (cubic feet per second)
Flooding Source and Location Drainage Area (square miles)
10-Percent-Annual-Chance
2-Percent-Annual-Chance
1-Percent-Annual-Chance
0.2-Percent-Annual-Chance
BOYNE RIVER 66.4 790 1150 1325 1860 At confluence with Charlevoix Lake
Stillwater elevations for lakes studied by detailed methods within Charlevoix
County are shown in Table 2.
8
Table 2 - Summary of Stillwater Elevations
Water Surface Elevations (Feet NAVD1)
Flooding Source 10-Percent-Annual-Chance
2-Percent-Annual-Chance
1-Percent-Annual-Chance
0.2-Percent-Annual-Chance
LAKE CHARLEVOIX
582.7 583.7 584.0 584.3
LAKE MICHIGAN (Township of Hayes)
583.4 584.4 584.8 585.5
LAKE MICHIGAN (Township of Hayes)
583.1
584.1
584.5
585.3
LAKE MICHIGAN (Township of Hayes)
582.9
583.9
584.3
585.2
LAKE MICHIGAN (City of Charlevoix, Township of Charlevoix, Township of Hayes, and Township of Norwood, Township of Peaine, Township of St. James)
582.7
583.8
584.2
585.1
LAKE MICHIGAN (Township of Norwood)
582.8
583.9
584.3
585.1
1 North American Vertical Datum of 1988
Flood elevations for Lake Michigan in portions of Charlevoix County were taken
from the “Flood Levels Report on Grand Traverse Bay and Little Traverse Bay”
prepared by the USACE, Detroit District (USACE, 1990). The report lists
different WSELs for sections of Lake Michigan from Emmet County to Leelanau
County. The different WSELs are a result of additional wave run-up analyses that
were completed for the report. As a result, the Townships of Hayes and Norwood
have multiple WSELs within their community boundaries. Additional
information regarding the exact locations of these sections, and their
corresponding WSELS, can be found in the original report (USACE, 1990). All
other Lake Michigan flood levels were taken from the “Revised Report on Great
Lake’s Open-Coast Flood Levels” prepared by the USACE, Detroit District
(USACE, 1988).
Still water elevations for Lake Charlevoix are heavily influenced by Lake
Michigan and were calculated using the “Report on Great Lake’s Open-Coast
Flood Levels”, “Revised Report on Great Lake’s Open-Coast Flood Levels”, and
the Boyne City 1982 FIS (USACE, 1977; USACE 1988; FEMA 1982a). The still
water elevations were calculated by using the previous established WSELs for
Lake Charlevoix, from the Boyne City 1982 FIS, and adding an adjustment factor
of 0.8 feet. The adjustment factor is equal to the increase of the 1-percent-annual-
chance WSEL for Lake Michigan between the above-mentioned 1977 USACE
report and the 1988 USACE report.
9
The Cities of Boyne City and East Jordan; the Village of Boyne Falls; and the
Townships of Bay, Boyne Valley, Chandler, Evangeline, Eveline, Hudson,
Marion, Melrose, South Arm, and Wilson are non-coastal communities and are
not affected by these reports.
3.2 Hydraulic Analyses
Analyses of the hydraulic characteristics of flooding from the sources studied were
carried out to provide estimates of the elevations of floods of the selected
recurrence intervals. Users should be aware that flood elevations shown on the
FIRM represent rounded whole-foot elevations and may not exactly reflect the
elevations shown on the Flood Profiles or in the Floodway Data Table in the FIS
report. Flood elevations shown on the FIRM are primarily intended for flood
insurance rating purposes. For construction and/or floodplain management
purposes, users are cautioned to use the flood elevation data presented in this FIS
report in conjunction with the data shown on the FIRM.
Precountywide Analyses
Cross section data for the Boyne River was obtained by field survey with
additional overbank points obtained from topographic maps prepared from aerial
photography at a scale of 1:4800 with a contour interval of two feet (USACE,
1980b). All bridges and culverts were field surveyed to obtain elevation data and
structural geometry. Cross sections were located at close intervals upstream and
downstream of bridges and culverts in order to compute significant backwater
effects of these structures.
As recommended by the MDNRE, the mean lake levels on Lake Charlevoix were
used as the starting water-surface elevations (WSELs) for the Boyne River.
WSELs of floods of the selected recurrence intervals were developed using the
USACE Hydraulic Engineering Center’s (HEC) HEC-2 step-backwater computer
program (HEC, 1984).
For the approximate reach of the Boyne River, WSELs were determined using the
results of the detailed hydraulic analysis and normal depth calculations in the
upper reaches.
The storm surge elevations for the 10-, 2-, 1-, and 0.2-percent annual chance
floods have been determined for Lake Charlevoix. The analyses reported herein
reflect the still water elevations due to high lake levels and wind setup effects, but
do not include the contributions from wave action effect such as the wave crest
height and wave run-up. Nonetheless, this additional hazard due to wave action
effect should be considered in planning of future development.
Flood profiles were drawn showing the computed WSELs for floods of the
selected recurrence intervals.
10
Channel roughness factors (Mannings “n”) used in the hydraulic computations
were chosen by engineering judgment on the basis of field observations. The
Manning’s “n” values for all detailed studied streams are listed in the following
tabulation:
Manning's "n" Values
Stream Channel “n” Overbank “n”
Boyne River 0.03-0.05 0.05-0.10
This Countywide FIS Report
Hydraulic analyses for the approximate study flooding sources were completed
using the computer program, HEC-RAS, version 3.1.3 (HEC, 2005). Structures
were modeled as weirs, with the weir elevations approximated from the
topographic data or bridge elevations from the USGS 7.5 minute quadrangle maps.
Floodplain boundaries were delineated using the computed WSEL and GIS tool
and scripts.
A composite Manning’s “n” value of 0.05 was used for all approximately studied
streams in the county.
Locations of selected cross sections used in the hydraulic analyses are shown on
the Flood Profiles (Exhibit 1). For stream segments for which a floodway was
computed (Section 4.2), selected cross section locations are also shown on the
FIRM (Exhibit 2).
The profile baselines depicted on the FIRM represent the hydraulic modeling
baselines that match the flood profiles on this FIS report. As a result of improved
topographic data, the profile baseline, in some cases, may deviate significantly
from the channel centerline or appear outside the Special Flood Hazard Area.
The hydraulic analyses for this study were based on unobstructed flow. The flood
elevations shown on the Flood Profiles (Exhibit 1) are thus considered valid only if
hydraulic structures remain unobstructed, operate properly, and do not fail.
3.3 Vertical Datum
All FIS reports and FIRMs are referenced to a specific vertical datum. The vertical
datum provides a starting point against which flood, ground, and structure
elevations can be referenced and compared. Until recently, the standard vertical
datum in use for newly created or revised FIS reports and FIRMs was NGVD.
11
With the finalization of NAVD, many FIS reports and FIRMs are being prepared
using NAVD as the referenced vertical datum.
All flood elevations shown in this FIS report and on the FIRM are referenced to
NAVD. Structure and ground elevations in the community must, therefore, be
referenced to NAVD. It is important to note that adjacent communities may be
referenced to NGVD. This may result in differences in Base Flood Elevations
(BFEs) across the corporate limits between the communities. Some of the data
used in this study were taken from the prior effective FIS reports and adjusted to
NAVD. The average conversion factor that was used to convert the data in this
FIS report to NAVD was calculated using the National Geodetic Survey’s (NGS)
VERTCON online utility (NGS, 2009). The data points used to determine the
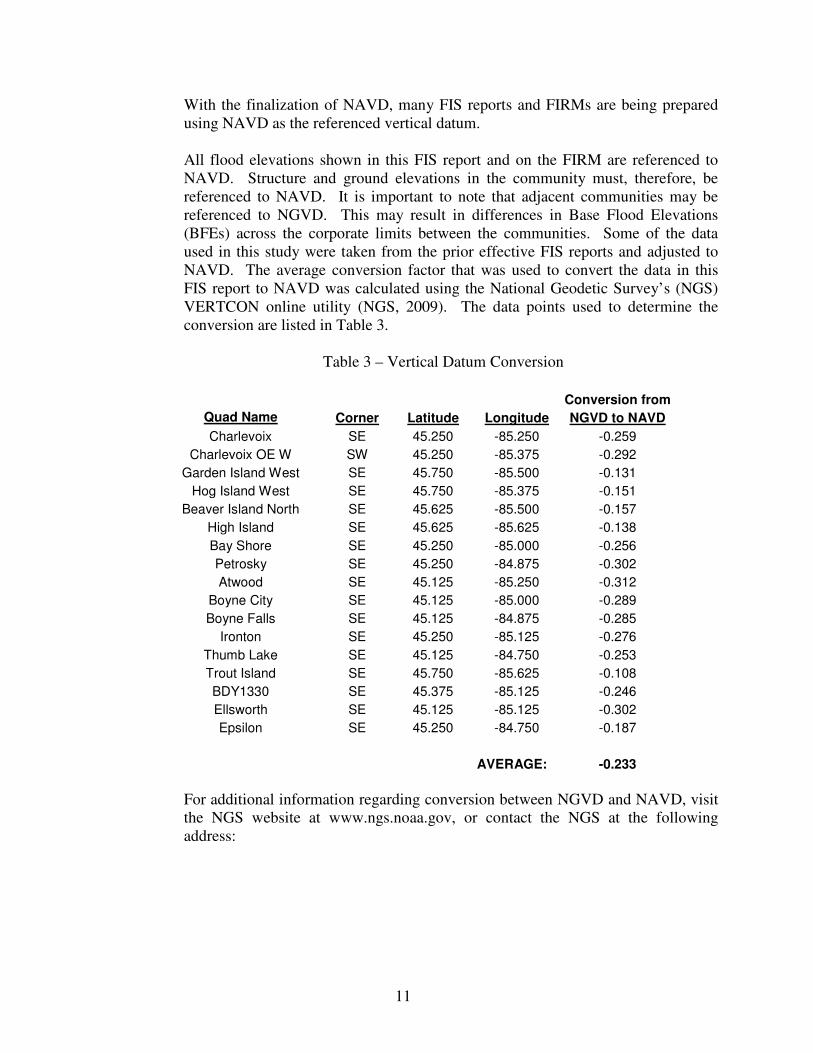
conversion are listed in Table 3.
Table 3 – Vertical Datum Conversion
Conversion from
Quad Name Corner Latitude Longitude NGVD to NAVD
Charlevoix SE 45.250 -85.250 -0.259
Charlevoix OE W SW 45.250 -85.375 -0.292
Garden Island West SE 45.750 -85.500 -0.131
Hog Island West SE 45.750 -85.375 -0.151
Beaver Island North SE 45.625 -85.500 -0.157
High Island SE 45.625 -85.625 -0.138
Bay Shore SE 45.250 -85.000 -0.256
Petrosky SE 45.250 -84.875 -0.302
Atwood SE 45.125 -85.250 -0.312
Boyne City SE 45.125 -85.000 -0.289
Boyne Falls SE 45.125 -84.875 -0.285
Ironton SE 45.250 -85.125 -0.276
Thumb Lake SE 45.125 -84.750 -0.253
Trout Island SE 45.750 -85.625 -0.108
BDY1330 SE 45.375 -85.125 -0.246
Ellsworth SE 45.125 -85.125 -0.302
Epsilon SE 45.250 -84.750 -0.187
AVERAGE: -0.233
For additional information regarding conversion between NGVD and NAVD, visit
the NGS website at www.ngs.noaa.gov, or contact the NGS at the following
address:
12
Vertical Network Branch, N/CG13
National Geodetic Survey, NOAA
Silver Spring Metro Center 3
1315 East-West Highway
Silver Spring, Maryland 20910
(301) 713-3191
Temporary vertical monuments are often established during the preparation of a
flood hazard analysis for the purpose of establishing local vertical control.
Interested individuals may contact FEMA to access these data.
To obtain current elevation, description, and/or location information for
benchmarks shown on this map, please contact the Information Services Branch of
the NGS at (301) 713-3242, or visit their website at www.ngs.noaa.gov.
4.0 FLOODPLAIN MANAGEMENT APPLICATIONS
The NFIP encourages State and local governments to adopt sound floodplain
management programs. Therefore, each FIS provides 1-percent-annual-chance (100-
year) flood elevations and delineations of the 1- and 0.2-percent-annual-chance (500-
year) floodplain boundaries and 1-percent-annual-chance floodway to assist
communities in developing floodplain management measures. This information is
presented on the FIRM and in many components of the FIS report, including Flood
Profiles, Floodway Data Table, and Summary of Stillwater Elevations Table. Users
should reference the data presented in the FIS report as well as additional information
that may be available at the local map repository before making flood elevation and/or
floodplain boundary determinations.
4.1 Floodplain Boundaries
To provide a national standard without regional discrimination, the 1-percent-
annual-chance flood has been adopted by FEMA as the base flood for floodplain
management purposes. The 0.2-percent-annual-chance flood is employed to
indicate additional areas of flood risk in the community.
In order to provide a national standard without regional discrimination, the 1-
percent annual chance flood has been adopted by FEMA as the base flood for
purposes of flood plain management measures. The 0.2-percent annual chance
flood is employed to indicate additional areas of flood risk in the community.
For each stream studied in detail, the boundaries of the 1- and 0.2-percent annual
chance floods have been delineated using the elevations determined at each cross
section; between cross sections the boundaries were interpolated using
topographic maps prepared from aerial photography at a scale of 1:4,800 with a
contour interval of two feet (USACE, 1980b and 1980c). For lake shorelines
other than Lake Michigan studied in detail, the boundaries have also been
delineated using the topographic maps referenced above.
13
For the Lake Michigan coastline, the floodplain boundaries were delineated
using a combination of USGS quad maps and coastal LiDAR data. The USGS
quad maps for Charlevoix County are a scale of 1:24,000 and have a 5-meter
contour interval. The coastal LiDAR was developed and managed by the Joint
Airborne LiDAR Bathymetry Technical Center of Expertise, and the data has a
horizontal accuracy of +/- 0.75 meters and a vertical accuracy of +/- 0.20 meters.
The coastal LiDAR data was used, where available, to map the Lake Michigan
floodplain boundaries, and in areas where the coastal LiDAR was not available,
the USGS quad maps were used.
The 1- and 0.2-percent-annual-chance floodplain boundaries are shown on the
FIRM (Exhibit 2). On this map, the 1-percent-annual-chance floodplain
boundary corresponds to the boundary of the areas of special flood hazards
(Zones A and AE), and the 0.2-percent-annual-chance floodplain boundary
corresponds to the boundary of areas of moderate flood hazards. In cases where
the 1- and 0.2-percent-annual-chance floodplain boundaries are close together,
only the 1-percent-annual-chance floodplain boundary has been shown. Small
areas within the floodplain boundaries may lie above the flood elevations but
cannot be shown due to limitations of the map scale and/or lack of detailed
topographic data.
For the streams studied by approximate methods, only the 1-percent-annual-
chance floodplain boundary is shown on the FIRM (Exhibit 2).
4.2 Floodways
Encroachment on floodplains, such as structures and fill, reduces flood-carrying
capacity, increases flood heights and velocities, and increases flood hazards in
areas beyond the encroachment itself. One aspect of floodplain management
involves balancing the economic gain from floodplain development against the
resulting increase in flood hazard. For purposes of the NFIP, a floodway is used as
a tool to assist local communities in this aspect of floodplain management. Under
this concept, the area of the 1-percent-annual-chance floodplain is divided into a
floodway and a floodway fringe. The floodway is the channel of a stream, plus any
adjacent floodplain areas, that must be kept free of encroachment so that the 1-
percent-annual-chance flood can be carried without substantial increases in flood
heights. Minimum Federal standards limit such increases to 1 foot, provided that
hazardous velocities are not produced. In the State of Michigan, though, under
Michigan Act 245, Public Act of 1929, as amended by Act 167, Public Acts of
1968 (State of Michigan, 1968), encroachment in the flood plain is limited to that
which will cause only an insignificant increase in flood heights. Thus, at the
recommendation of the Water Management Division, a floodway having no more
than 0.1-foot surcharge has been delineated for this study. The floodways in this
study are presented to local agencies as minimum standards that can be adopted
directly or that can be used as a basis for additional floodway studies.
14
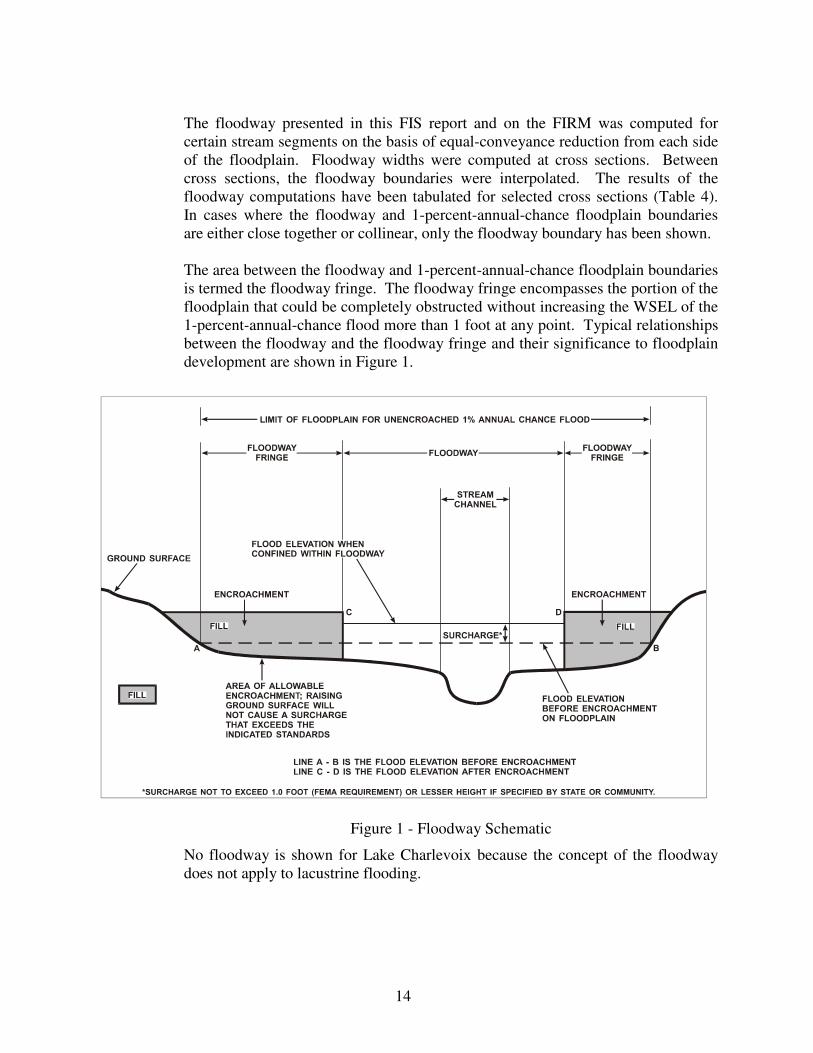
The floodway presented in this FIS report and on the FIRM was computed for
certain stream segments on the basis of equal-conveyance reduction from each side
of the floodplain. Floodway widths were computed at cross sections. Between
cross sections, the floodway boundaries were interpolated. The results of the
floodway computations have been tabulated for selected cross sections (Table 4).
In cases where the floodway and 1-percent-annual-chance floodplain boundaries
are either close together or collinear, only the floodway boundary has been shown.
The area between the floodway and 1-percent-annual-chance floodplain boundaries
is termed the floodway fringe. The floodway fringe encompasses the portion of the
floodplain that could be completely obstructed without increasing the WSEL of the
1-percent-annual-chance flood more than 1 foot at any point. Typical relationships
between the floodway and the floodway fringe and their significance to floodplain
development are shown in Figure 1.
Figure 1 - Floodway Schematic
No floodway is shown for Lake Charlevoix because the concept of the floodway
does not apply to lacustrine flooding.
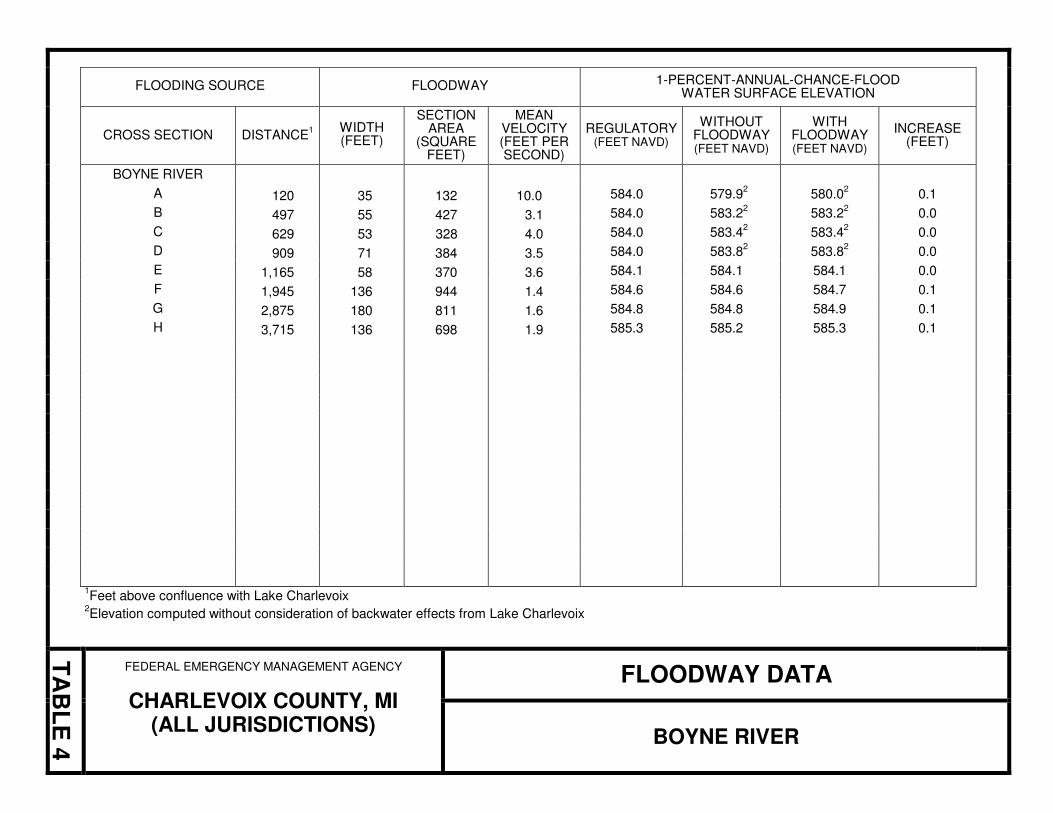
FLOODING SOURCE FLOODWAY 1-PERCENT-ANNUAL-CHANCE-FLOOD
WATER SURFACE ELEVATION
CROSS SECTION DISTANCE1
WIDTH (FEET)
SECTION AREA
(SQUARE FEET)
MEAN VELOCITY (FEET PER SECOND)
REGULATORY (FEET NAVD)
WITHOUT FLOODWAY (FEET NAVD)
WITH FLOODWAY (FEET NAVD)
INCREASE (FEET)
BOYNE RIVER
A 120 35 132 10.0 584.0 579.92 580.0
2 0.1
B 497 55 427 3.1 584.0 583.22 583.2
2 0.0
C 629 53 328 4.0 584.0 583.42 583.4
2 0.0
D 909 71 384 3.5 584.0 583.82 583.8
2 0.0
E 1,165 58 370 3.6 584.1 584.1 584.1 0.0
F 1,945 136 944 1.4 584.6 584.6 584.7 0.1
G 2,875 180 811 1.6 584.8 584.8 584.9 0.1
H 3,715 136 698 1.9 585.3 585.2 585.3 0.1
1Feet above confluence with Lake Charlevoix
2Elevation computed without consideration of backwater effects from Lake Charlevoix
TA
BL
E 4
FEDERAL EMERGENCY MANAGEMENT AGENCY
CHARLEVOIX COUNTY, MI (ALL JURISDICTIONS)
FLOODWAY DATA
BOYNE RIVER
16
5.0 INSURANCE APPLICATIONS
For flood insurance rating purposes, flood insurance zone designations are assigned to a
community based on the results of the engineering analyses. These zones are as follows:
Zone A
Zone A is the flood insurance risk zone that corresponds to the 1-percent-annual-chance
floodplains that are determined in the FIS by approximate methods. Because detailed
hydraulic analyses are not performed for such areas, no BFEs or base flood depths are
shown within this zone.
Zone AE
Zone AE is the flood insurance risk zone that corresponds to the 1-percent-annual-chance
floodplains that are determined in the FIS by detailed methods. In most instances, whole-
foot BFEs derived from the detailed hydraulic analyses are shown at selected intervals
within this zone.
Zone X
Zone X is the flood insurance risk zone that corresponds to areas outside the 0.2-percent-
annual-chance floodplain, areas within the 0.2-percent-annual-chance floodplain, areas of
1-percent-annual-chance flooding where average depths are less than 1 foot, areas of
1-percent-annual-chance flooding where the contributing drainage area is less than
1 square mile, and areas protected from the 1-percent-annual-chance flood by levees. No
BFEs or base flood depths are shown within this zone.
6.0 FLOOD INSURANCE RATE MAP
The FIRM is designed for flood insurance and floodplain management applications.
For flood insurance applications, the map designates flood insurance risk zones as
described in Section 5.0 and, in the 1-percent-annual-chance floodplains that were
studied by detailed methods, shows selected whole-foot BFEs or average depths.
Insurance agents use the zones and BFEs in conjunction with information on structures
and their contents to assign premium rates for flood insurance policies.
For floodplain management applications, the map shows by tints, screens, and symbols,
the 1- and 0.2-percent-annual-chance floodplains, floodways, and the locations of
selected cross sections used in the hydraulic analyses and floodway computations.
The countywide FIRM presents flooding information for the entire geographic area of
Charlevoix County. Previously, FIRMs were prepared for each incorporated community
17
and the unincorporated areas of the County identified as flood-prone. This countywide
FIRM also includes flood-hazard information that was presented separately on Flood
Boundary and Floodway Maps, where applicable. Historical data relating to the maps
prepared for each community are presented in Table 5.
7.0 OTHER STUDIES
This report either supersedes or is compatible with all previous studies on streams studied
in this report and should be considered authoritative for purposes of the NFIP.
8.0 LOCATION OF DATA
Information concerning the pertinent data used in the preparation of this study can be
obtained by contacting FEMA, Federal Insurance and Mitigation Division, 536 South
Clark Street, Sixth Floor, Chicago, Illinois 60605.
9.0 BIBLIOGRAPHY AND REFERENCES
Bobee, B., The Log Pearson Type 3 Distribution and Its Application in Hydrology,
Water Resources Research, Vol. 11, No. 5, October 1975, pp. 681-689.
Charlevoix County, Lake Charlevoix and Its Watershed. Retrieved June 19, 2009,
from http://www.charlevoixcounty.org/govern0224.asp.
Charlevoix County, Charlevoix County Geographic Characteristics. Retrieved
September 3, 2010, from http://www.charlevoixcounty.org/govern0177.asp.
Federal Emergency Management Agency, Flood Insurance Study, City of Boyne City,
Michigan, January 19, 1982a.
Federal Emergency Management Agency, Flood Insurance Study, City of East Jordan,
Michigan, January 19, 1982b.
Hydraulic Engineering Center, HEC-2 Water Surface Profiles, User’s Manual,
Generalized Computer Program, U.S. Army Corps of Engineers, Davis, California,
August, 1979.
Hydraulic Engineering Center, HEC-2 Water Surface Profiles, U.S. Army Corps of
Engineers, Davis, California, April 1984.
Hydrologic Engineering Center, HEC-RAS River Analysis System, Version 3.1.3, U.S.
Army Corps of Engineers, Davis, California, May 2005.
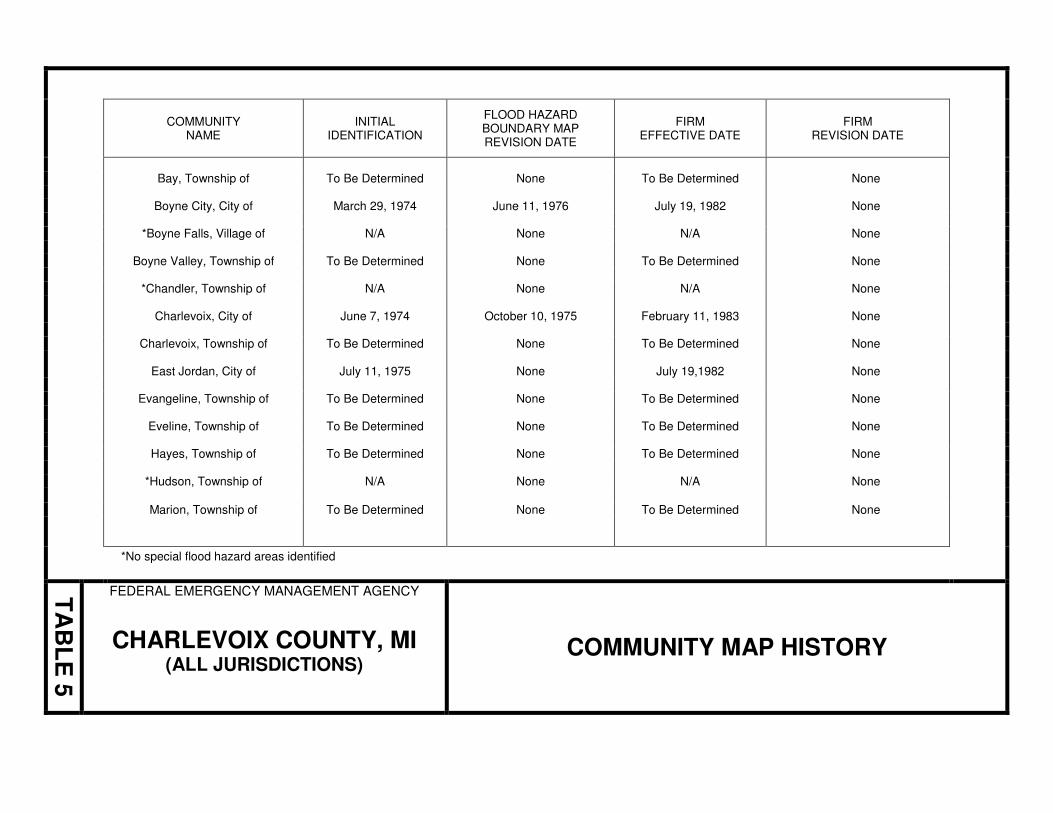
COMMUNITY NAME
INITIAL IDENTIFICATION
FLOOD HAZARD BOUNDARY MAP REVISION DATE
FIRM EFFECTIVE DATE
FIRM REVISION DATE
Bay, Township of To Be Determined None To Be Determined None
Boyne City, City of March 29, 1974 June 11, 1976 July 19, 1982 None
*Boyne Falls, Village of N/A None N/A None
Boyne Valley, Township of To Be Determined None To Be Determined None
*Chandler, Township of N/A None N/A None
Charlevoix, City of June 7, 1974 October 10, 1975 February 11, 1983 None
Charlevoix, Township of To Be Determined None To Be Determined None
East Jordan, City of July 11, 1975 None July 19,1982 None
Evangeline, Township of To Be Determined None To Be Determined None
Eveline, Township of To Be Determined None To Be Determined None
Hayes, Township of To Be Determined None To Be Determined None
*Hudson, Township of N/A None N/A None
Marion, Township of To Be Determined None To Be Determined None
*No special flood hazard areas identified
TA
BL
E 5
FEDERAL EMERGENCY MANAGEMENT AGENCY
CHARLEVOIX COUNTY, MI (ALL JURISDICTIONS)
COMMUNITY MAP HISTORY
Table 4 - Community Map History
COMMUNITY NAME
INITIAL IDENTIFICATION
FLOOD HAZARD BOUNDARY MAP REVISION DATE
FIRM EFFECTIVE DATE
FIRM REVISION DATE
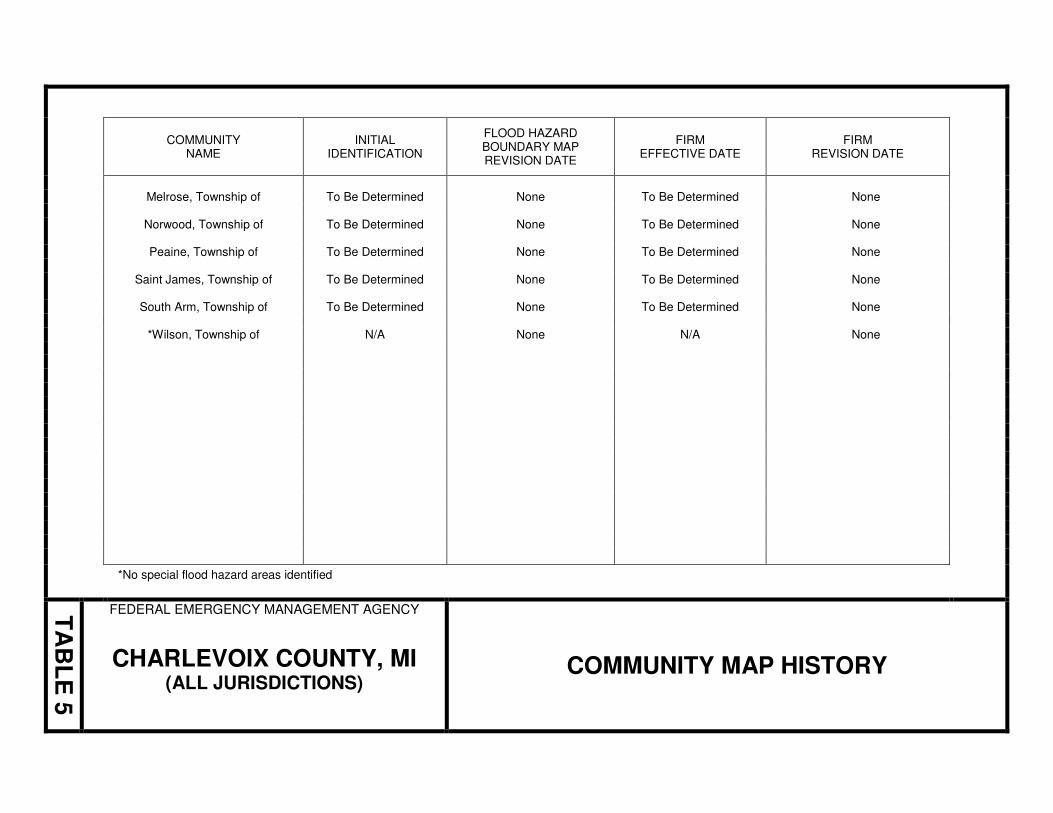
Melrose, Township of To Be Determined None To Be Determined None
Norwood, Township of To Be Determined None To Be Determined None
Peaine, Township of To Be Determined None To Be Determined None
Saint James, Township of To Be Determined None To Be Determined None
South Arm, Township of To Be Determined None To Be Determined None
*Wilson, Township of N/A None N/A None
*No special flood hazard areas identified
TA
BL
E 5
FEDERAL EMERGENCY MANAGEMENT AGENCY
CHARLEVOIX COUNTY, MI (ALL JURISDICTIONS)
COMMUNITY MAP HISTORY
20
National Geodetic Survey, VERTCON - North American Vertical Datum Conversion
Utility, Retrieved March 16, 2009, from http://www.ngs.noaa.gov.
Soil Conservation Service, Soil Survey of Charlevoix County, Michigan, US
Department of Agriculture, May 1974.
State of Michigan, Flood Plain Control Act of 1968, Act 245, Public Act of 1929, as
amended by Act 167, Public Act of 1968, Michigan Water Resources Commission,
Lansing, Michigan, 1968.
U.S. Army Corps of Engineers, Detroit District, Shore Protection Manual, Volume
One, Coastal Engineering Research Center, 1975.
U.S. Army Corps of Engineers, Detroit District, Report on Great Lakes Open Coast
Flood Levels, Detroit, Michigan, February 1977.
U.S. Army Corps of Engineers, Detroit District, Boyne River Basin, Boyne River
Dam, Charlevoix County, Michigan, Inventory No. 515, National Dam Safety Program
Inspection Report, Detroit, Michigan, June 1980a.
U.S. Army Corps of Engineers, Detroit District, Topographic Map, Scale 1:4800,
Contour Interval two feet: Boyne City, MI, Detroit, Michigan, 1980b.
U.S. Army Corps of Engineers, Detroit District, Topographic Map, Scale 1:4800,
Contour Interval two feet: East Jordan, MI, Detroit, Michigan, 1980c.
U.S. Army Corps of Engineers, Detroit District, Revised Report on Great Lakes Open-
Coast Flood Levels, Detroit, Michigan, April 1988.
U.S. Army Corps of Engineers, Detroit District, Grand Traverse Bay and Little
Traverse Bay, Detroit, Michigan, April 1990.
U.S. Census Bureau, American Fact Finder, Charlevoix County, Michigan, 2008.
Retrieved September 2010.
U.S. Geological Survey, Statistical Models for Estimating Flow Characteristics of
Michigan Streams, Water-Resources Investigations Report 84-4207, U.S. Department
of the Interior, 1984.
The Weather Channel. Monthly Averages for Charlevoix Michigan. Retrieved July,
13, 2010, from http://www.weather.com.
Wiitala, S.W., Magnitude and Frequency of Floods in the United States, Saint
Lawrence River Basin, Part Four, Geological Survey, Water Supply Paper 1677,
Washington, D.C., 1965.