charlotte b. acharya - cornell universitycbsu.tc.cornell.edu/lab/doc/2013_02 gbs workshop...
TRANSCRIPT
Genotyping By Sequencing (GBS) Method Overview
Charlotte B. AcharyaInstitute for Genomic Diversity
Cornell University
http://www.igd.cornell.edu/

• Background/Goals• GBS lab protocol• Illumina sequencing review• GBS adapter system• How GBS differs from RAD• Modifying GBS for different species• GBS Workflow
Topics Presented
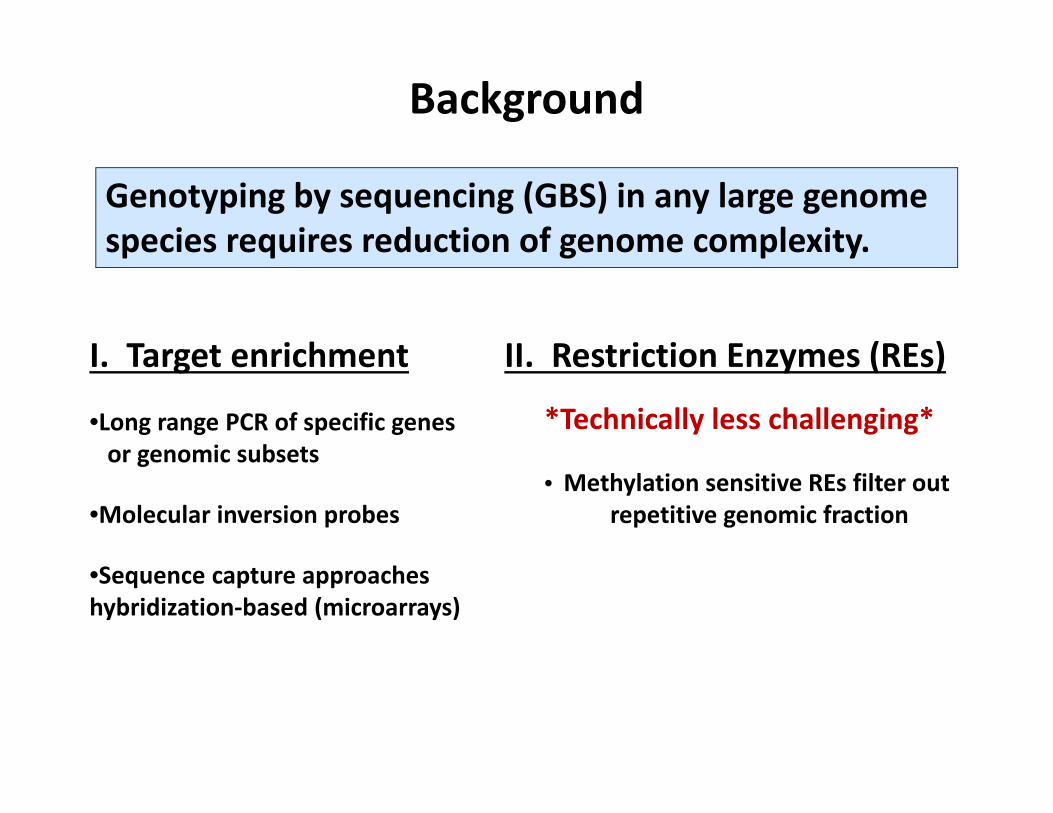
Background
Genotyping by sequencing (GBS) in any large genome species requires reduction of genome complexity.
II. Restriction Enzymes (REs)I. Target enrichment
•Long range PCR of specific genes or genomic subsets
•Molecular inversion probes
•Sequence capture approaches hybridization‐based (microarrays)
*Technically less challenging*
• Methylation sensitive REs filter out repetitive genomic fraction

QTL are often located in non‐coding regionsVgt1, Tb, B regulatory regions 60‐150kb from gene
Exon Exon Exon Exon
Exon captureMap large numbers ofgenome‐wide markers
QTL
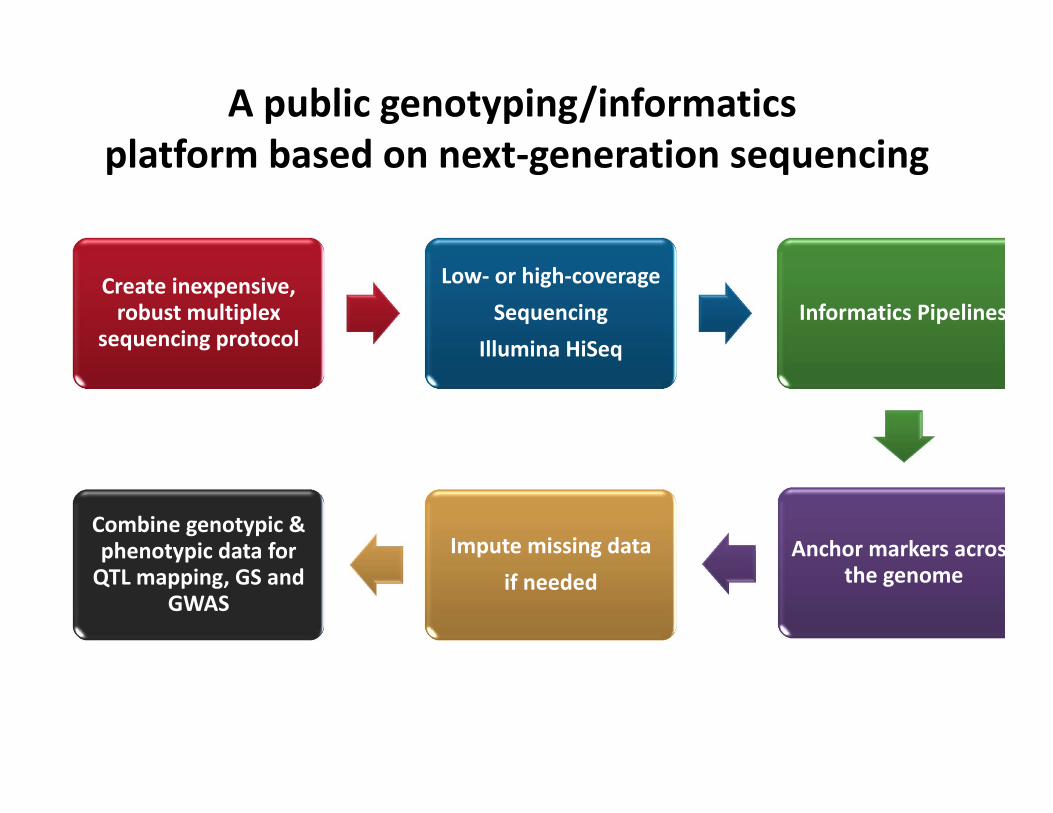
Create inexpensive, robust multiplex
sequencing protocol
Low‐ or high‐coverageSequencing
Illumina HiSeqInformatics Pipelines
Anchor markers acrosthe genome
Impute missing dataif needed
Combine genotypic & phenotypic data for QTL mapping, GS and
GWAS
A public genotyping/informatics platform based on next‐generation sequencing
Open Source
• Method available for anyone to use / modify.• Analysis pipeline details and code are public.• Promote dataset compatibility.• Method published in PLoS ONE to promote accessibility.
• Genotype calls available for public projects.

< 450 bp
Restriction SNP ( ) sequence tag
Loss of cut SNP
Sample1
Overview of Genotyping by Sequencing (GBS)
• Focuses NextGen sequencing power to ends of restriction fragments• Both SNPs and presence/absence markers can be scored• Small indels are identified but are not scored
Sample2

• Reduced sample handling• Few PCR & purification steps• No DNA size fractionation• Efficient barcoding system• Simultaneous marker discovery & genotyping• Scales very well
GBS is a simple, highly multiplexed system for constructing libraries for next‐gen sequencing

GBS 96‐ or 384‐plex Protocol(http://www.maizegenetics.net/gbs‐overview)
1. Plate DNA & adapter pair
2. Digest DNA with RE3. Ligate adapters

GBS Adapters and Enzymes
BarcodeAdapter
“Sticky Ends”
Barcode(4‐8 bp)
CommonAdapter
P1 P2
ApeKI G CWGCPstI CTGCA GEcoT22I ATGCA T
5’ 3’
Restriction Enzymes
Illumina Sequencing Primer 2
Illumina Sequencing Primer 1

GBS 96‐ or 384‐plex Protocol(http://www.maizegenetics.net/gbs‐overview)
............. ...
..... ..................... ........... ..
..
. .. ...
.
...
..... ......... .. .........
.....
...
. .. ....... ......
...
.. .......
...
. .
..
.... . .. . ....
1. Plate DNA & adapter pair
5. PCR
Primers
2. Digest DNA with RE3. Ligate adapters
Clean‐up4. Pool samples

. .
..
..
.
....
.. ...
...........
.
.
.. ........
.
.
. ... ...
..
.
.
..
.
.
.
.....
.
.
...
... ..
..
.
.
.
.
...
.. ...
.. ...
......
.
..
.....
. ......
....
... ..
...
.. ..
. .
..
..
.
........
.
. .
P1 P2 P1 P2
.
O1 O2
PCR
Insert
Pooled Digestion/Ligation Reactions
GBS“Library”
PRC primers:
Insert
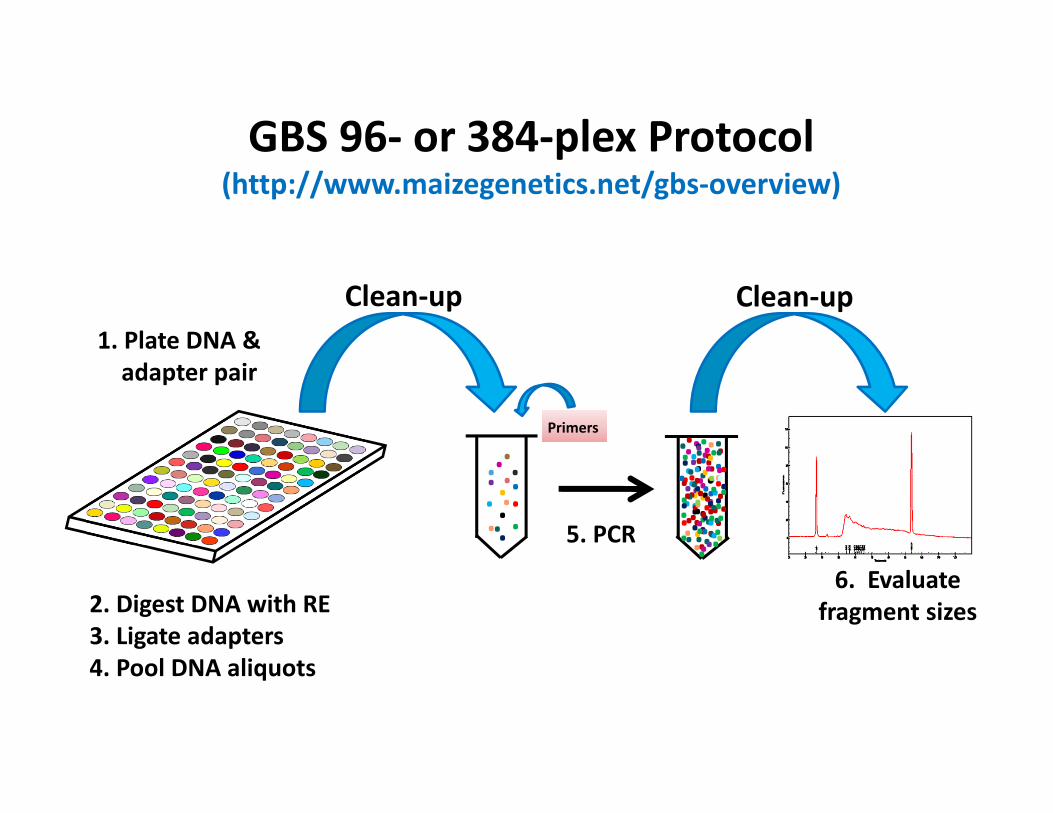
GBS 96‐ or 384‐plex Protocol(http://www.maizegenetics.net/gbs‐overview)
............. ...
..... ..................... ........... ..
..
. .. ...
.
...
..... ......... .. .........
.....
...
. .. ....... ......
...
.. .......
...
. .
..
.... . .. . ....
1. Plate DNA & adapter pair
5. PCR
Primers
2. Digest DNA with RE3. Ligate adapters4. Pool DNA aliquots
6. Evaluate fragment sizes
Clean‐upClean‐up

Size Standards
LibraryAdapterDimer
1500 bp15 bp
Fluo
rescen
ce intensity
Repetitive
Library Profiles
Time
Library
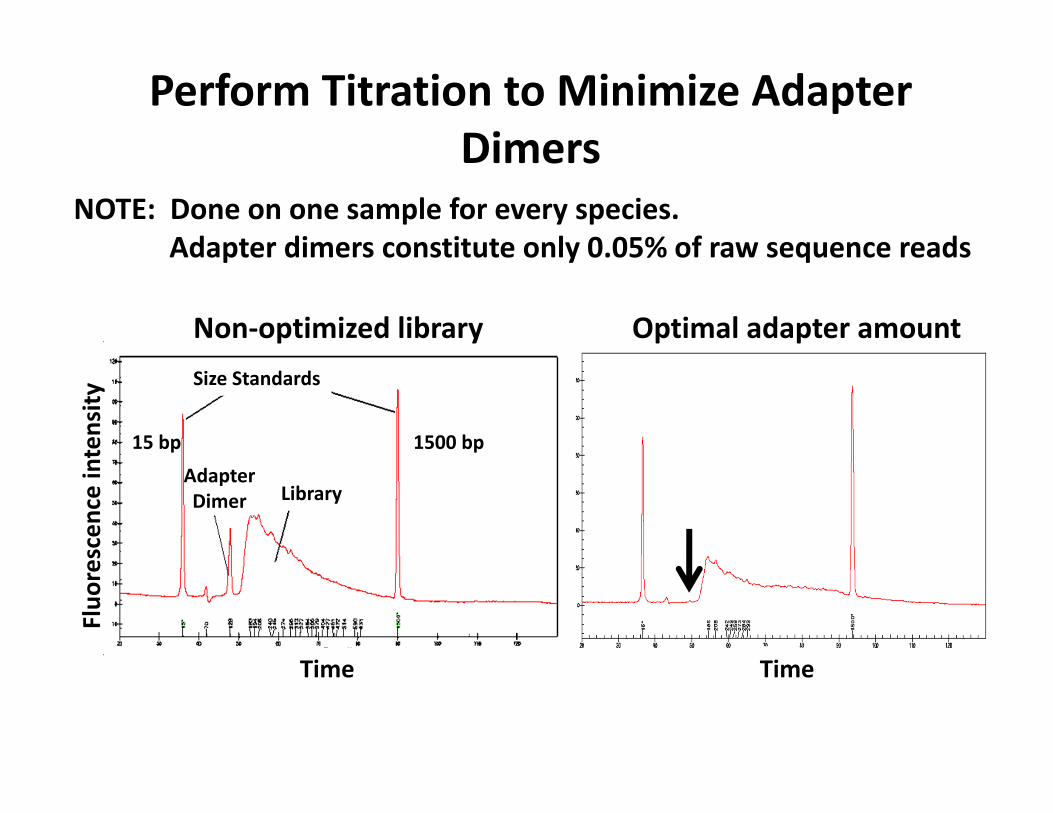
Perform Titration to Minimize Adapter Dimers
NOTE: Done on one sample for every species.Adapter dimers constitute only 0.05% of raw sequence reads
Size Standards
LibraryAdapterDimer
1500 bp15 bp
Fluo
rescen
ce intensity
Time Time
Optimal adapter amountNon‐optimized library
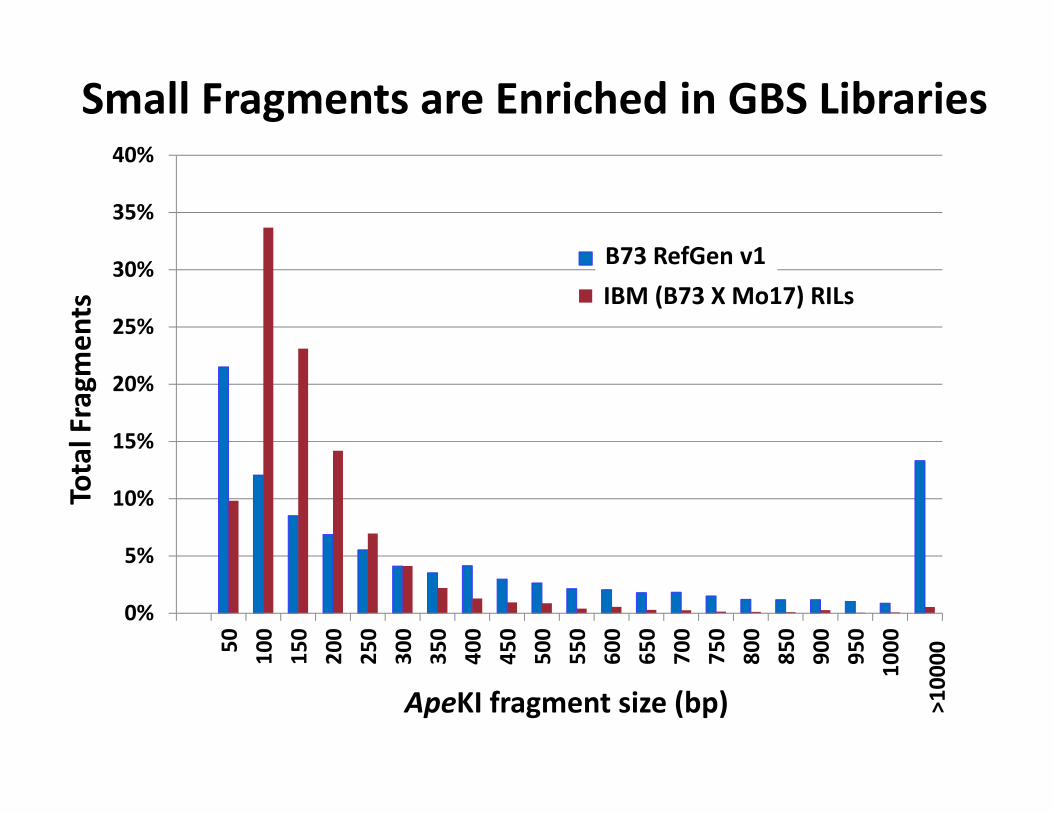
Small Fragments are Enriched in GBS Libraries Total Fragm
ents
0%
5%
10%
15%
20%
25%
30%
35%
40%
0 50 100
150
200
250
300
350
400
450
500
550
600
650
700
750
800
850
900
950
1000
1000
0000
REFGENOME
IBM
ApeKI fragment size (bp) >10000
B73 RefGen v1IBM (B73 X Mo17) RILs
0
100000
200000
300000
400000
500000
600000
700000
800000
900000
1000000
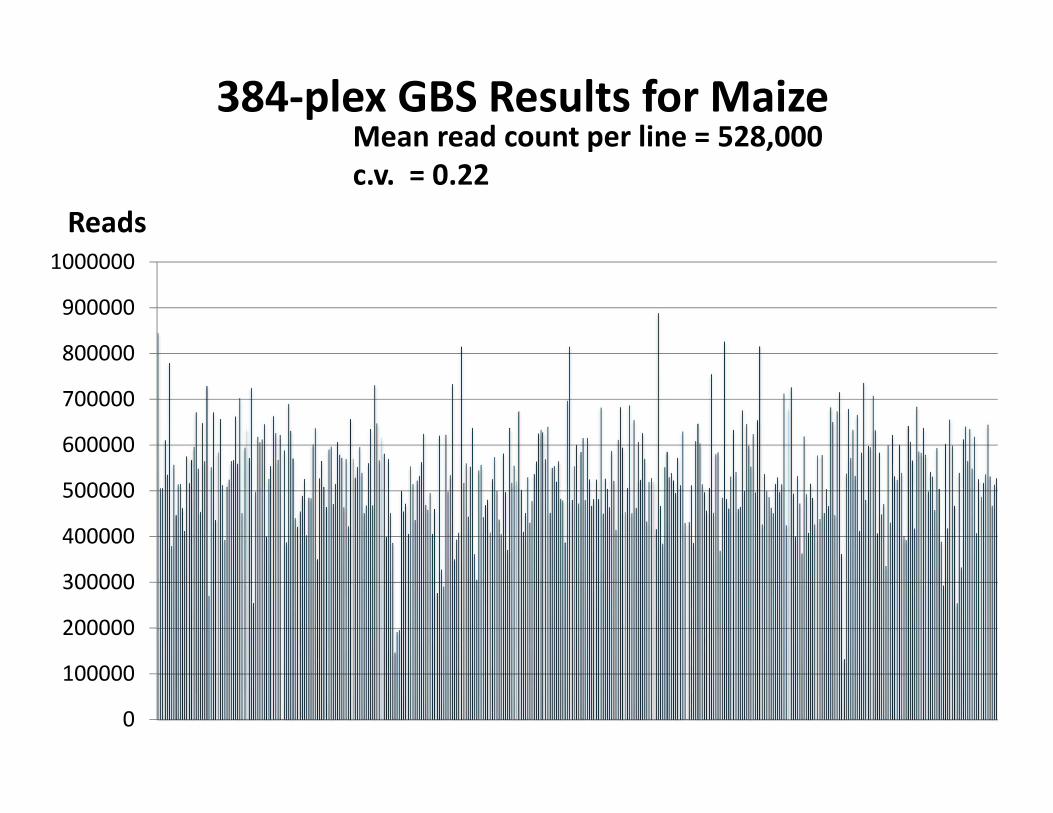
384‐plex GBS Results for Maize
Reads
Mean read count per line = 528,000c.v. = 0.22
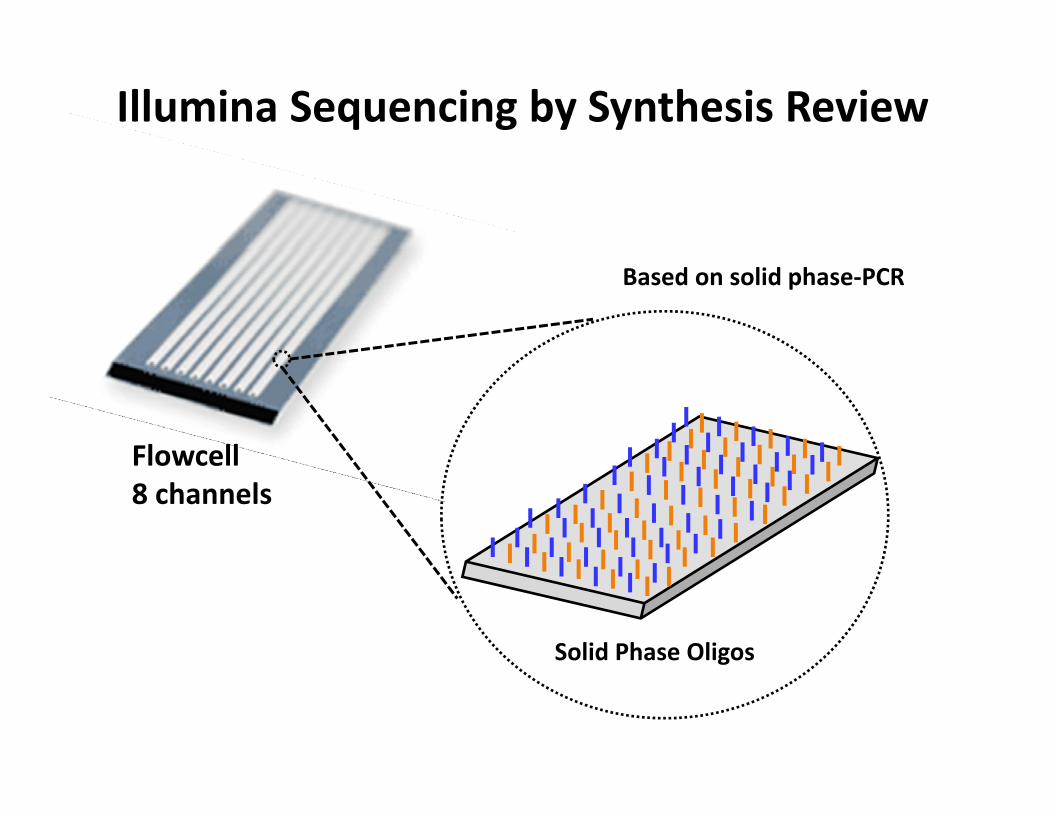
Flowcell8 channels
Solid Phase Oligos
Illumina Sequencing by Synthesis Review
Based on solid phase‐PCR

Flow cell with bound oligos
Denatured “Library”
Cluster Formation Amplifies Sequencing Signal
CBot
Bridge Amplification
PCRCleavage
Linearization

ACGTGGC
TG
P1 primer
CA
TTGTGC
Sequencing by Synthesis
FlowcellHiSeq 2000
TGCA

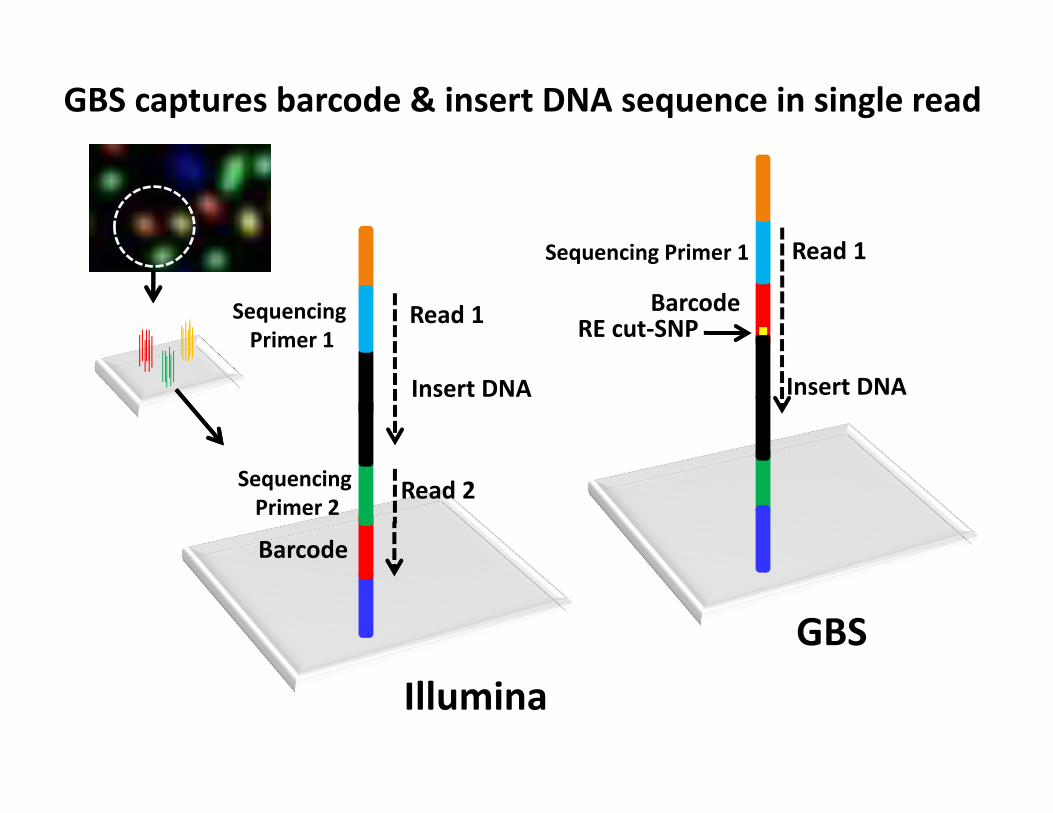
Read 1
GBS captures barcode & insert DNA sequence in single read
Insert DNA
Barcode
Sequencing Primer 1
Sequencing Primer 2
Illumina
Read 1
Read 2
Sequencing Primer 1
BarcodeRE cut‐SNP
Insert DNA
GBS

GACGT
GC
T
G
ACGTGGC
T
C
ACGT
GC
TG
G
T N
ACGTGGC
T ACGTGGC
T ACGTGGC
T
“In Phase” “Out of Phase”
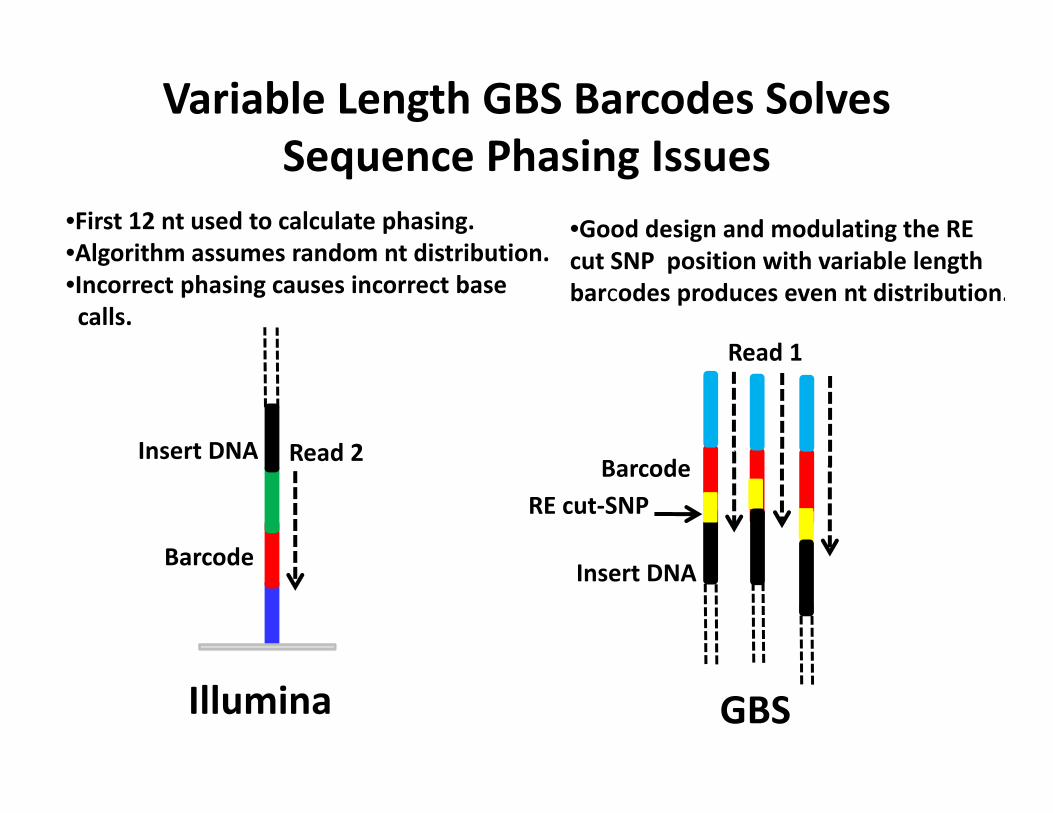
Variable Length GBS Barcodes Solves Sequence Phasing Issues
•First 12 nt used to calculate phasing.•Algorithm assumes random nt distribution.•Incorrect phasing causes incorrect base calls.
Barcode
Illumina
Insert DNA
•Good design and modulating the RE cut SNP position with variable length barcodes produces even nt distribution.
BarcodeRE cut‐SNP
GBS
Insert DNA
Read 2
Read 1
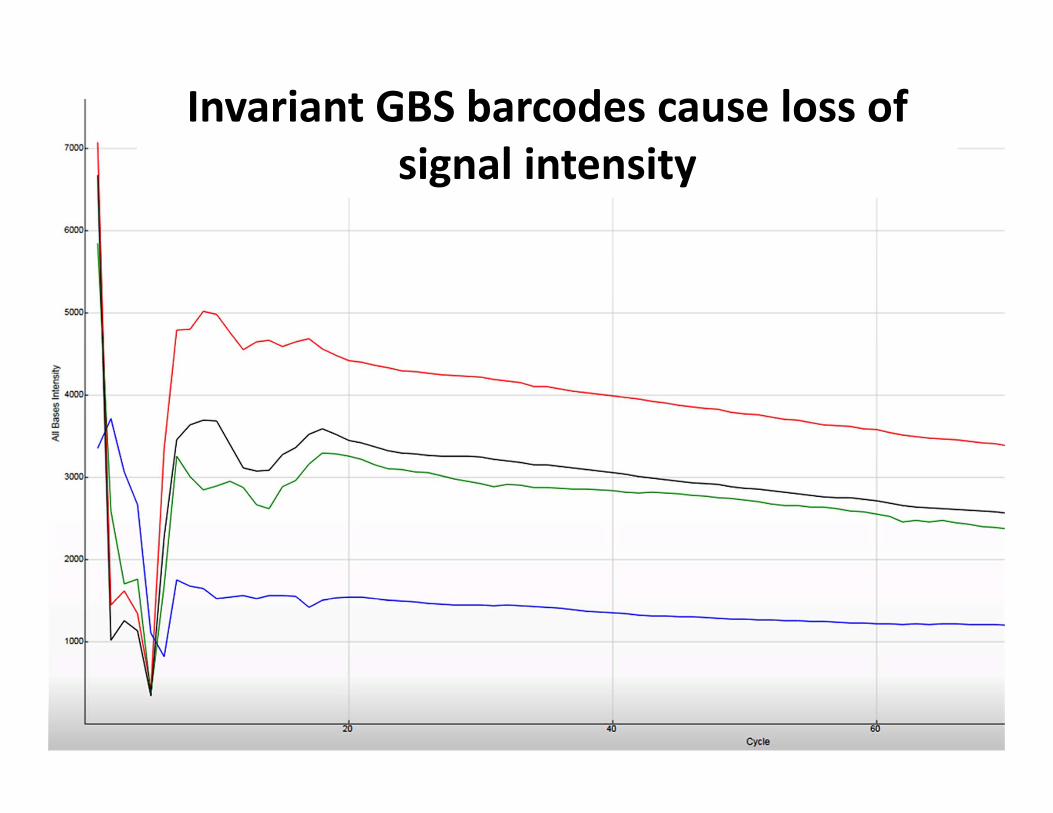
Invariant GBS barcodes cause loss of signal intensity

Successful GBS sequencing run

GBS Adapter Design

Barcode Design Considerations• Barcode sets are enzyme specific
– Must not recreate the enzyme recognition SNP – Must have complementary overhangs
• Sets must be of variable length• Bases must be well balanced at each position• Must different enough from each other to avoid confusion if
there is a sequencing error.– At least 3 bp differences among barcodes.
• Must not nest within other barcodes• No mononucleotide runs of 3 or more bases
http://www.deenabio.com
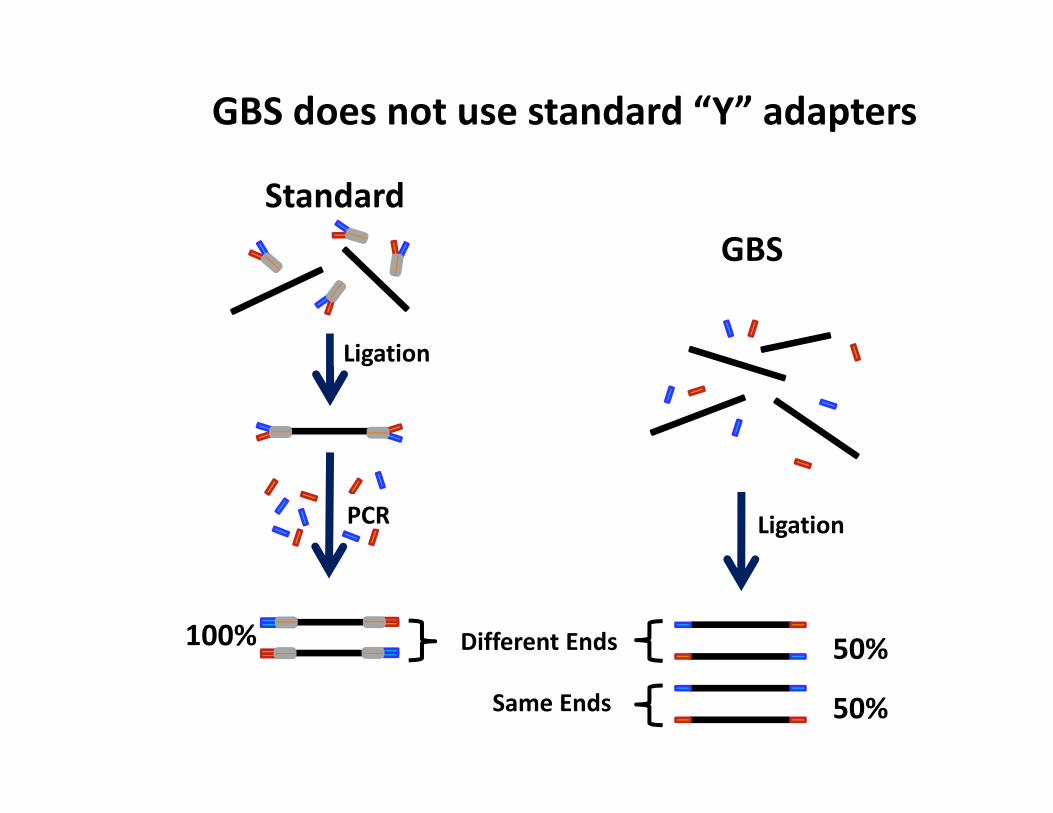
Different Ends 50%
Same Ends 50%
100%
Ligation
LigationPCR
GBSStandard
GBS does not use standard “Y” adapters
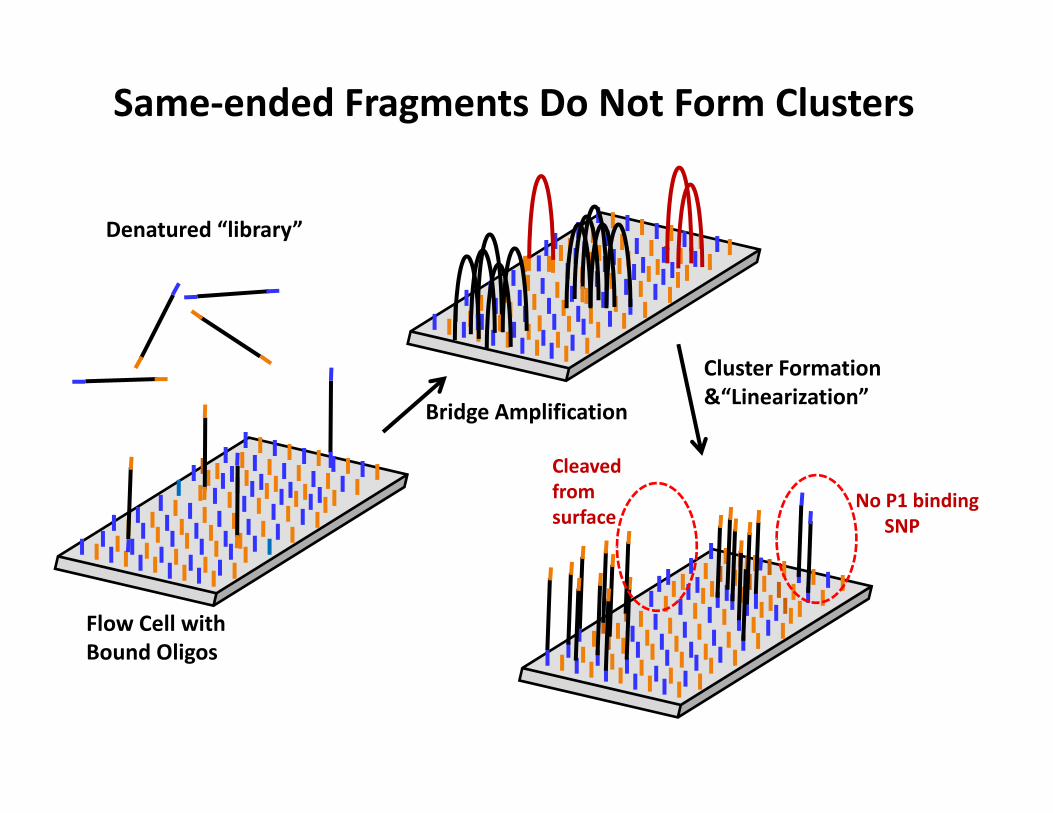
Denatured “library”
Flow Cell with Bound Oligos
Same‐ended Fragments Do Not Form Clusters
Bridge Amplification
Cluster Formation &“Linearization”
No P1 bindingSNP
Cleaved from surface

< 450 bp
Restriction SNP ( ) sequence tag
Loss of cut SNP
Sample1
vs. RAD
Sample2
GBS vs. RAD

Digest
Ligate adapters
Pool
Random shear
Size select
Ligate Y adapters
PCR
RADGBSReference
Davey et al. 2011
RAD GBS

< 450 bp
Restriction SNP ( ) sequence tag
Loss of cut SNP
Sample1
vs. RAD
• Focuses NextGen sequencing power to ends of restriction fragments• Scores both SNPs and presence/absence markers
Sample2
GBS vs. RAD

Most significant GBS technical issues?
• DNA quality
• DNA quantification
High Molecular Weight DNA

Modifying GBS
Considerations for using GBS with new species and / or different enzymes.
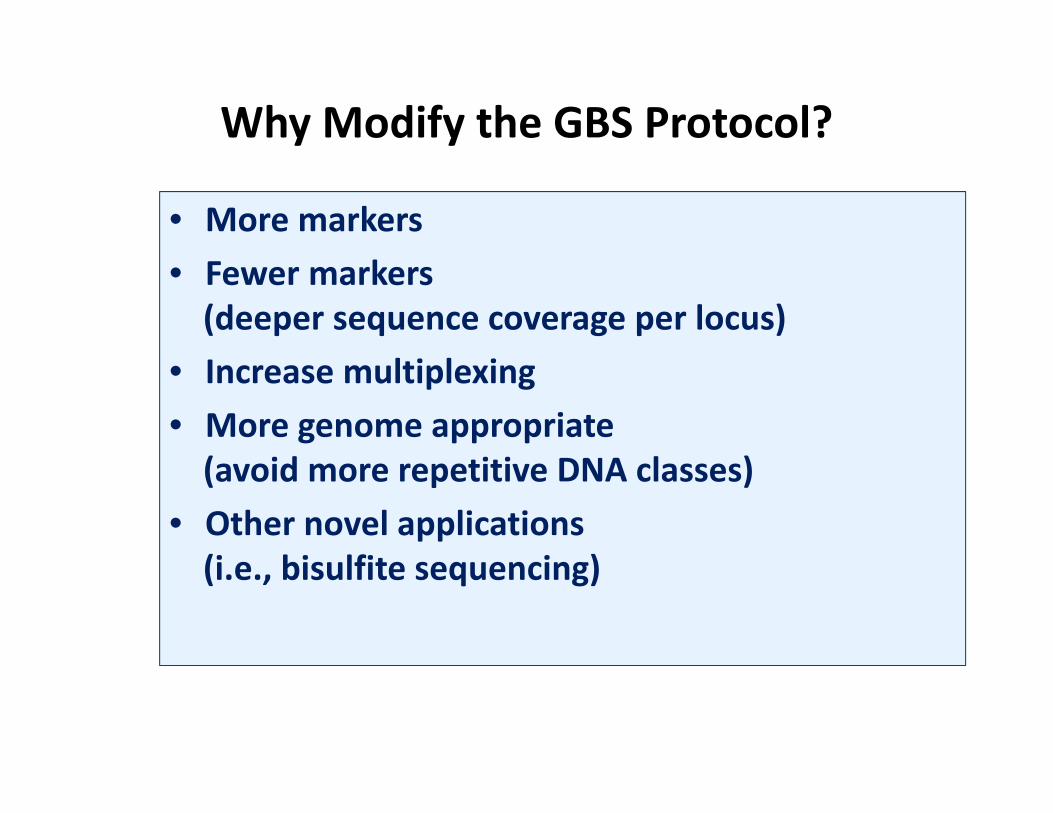
Why Modify the GBS Protocol?
• More markers• Fewer markers (deeper sequence coverage per locus)
• Increase multiplexing• More genome appropriate (avoid more repetitive DNA classes)
• Other novel applications (i.e., bisulfite sequencing)
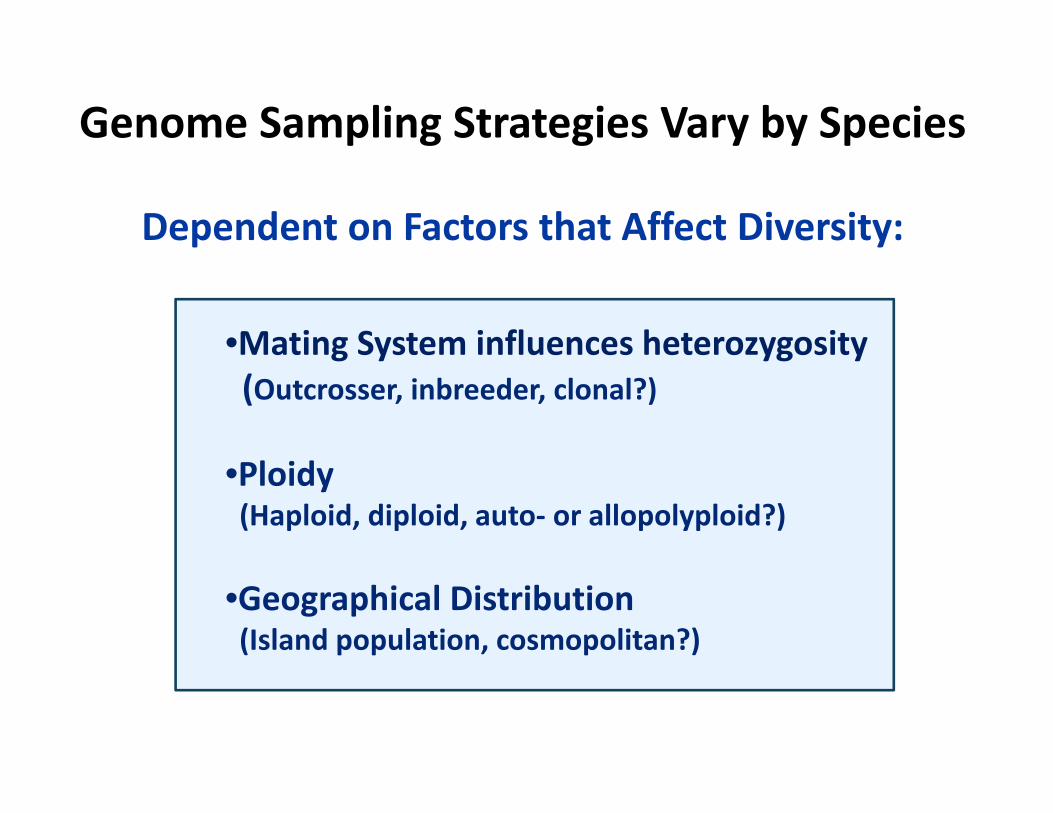
Genome Sampling Strategies Vary by Species
Dependent on Factors that Affect Diversity:
•Mating System influences heterozygosity(Outcrosser, inbreeder, clonal?)
•Ploidy(Haploid, diploid, auto‐ or allopolyploid?)
•Geographical Distribution(Island population, cosmopolitan?)
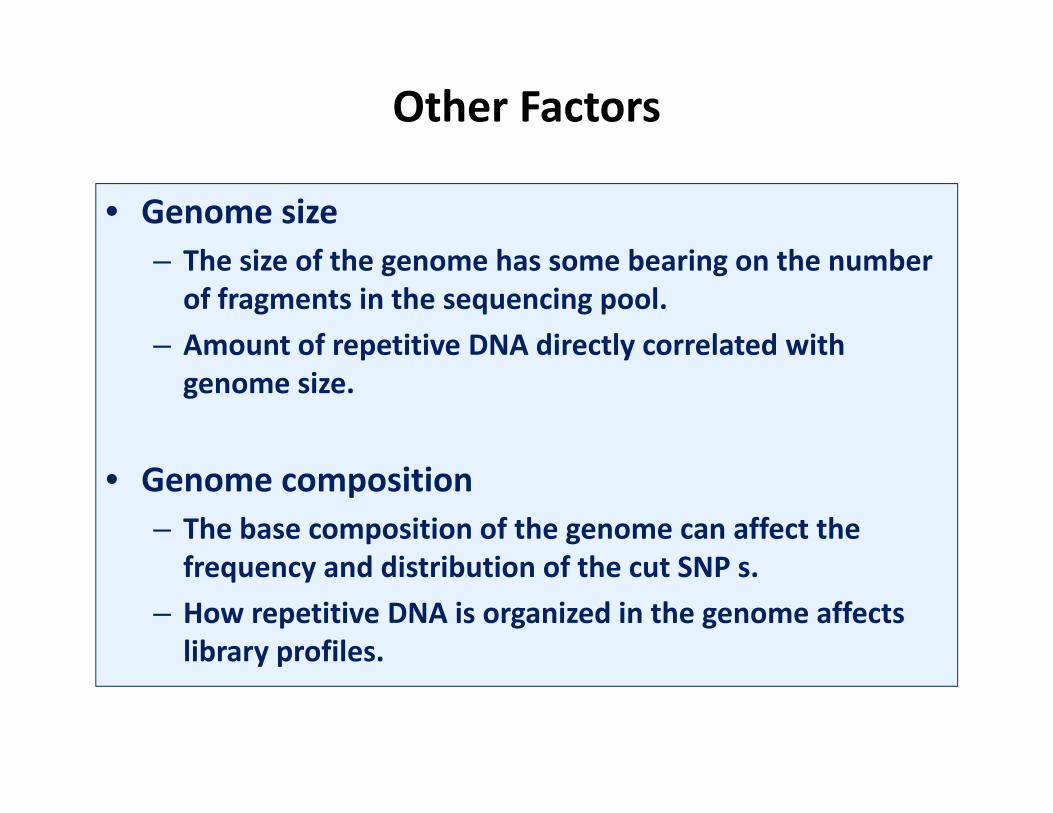
Other Factors
• Genome size– The size of the genome has some bearing on the number of fragments in the sequencing pool.
– Amount of repetitive DNA directly correlated with genome size.
• Genome composition– The base composition of the genome can affect the frequency and distribution of the cut SNP s.
– How repetitive DNA is organized in the genome affects library profiles.
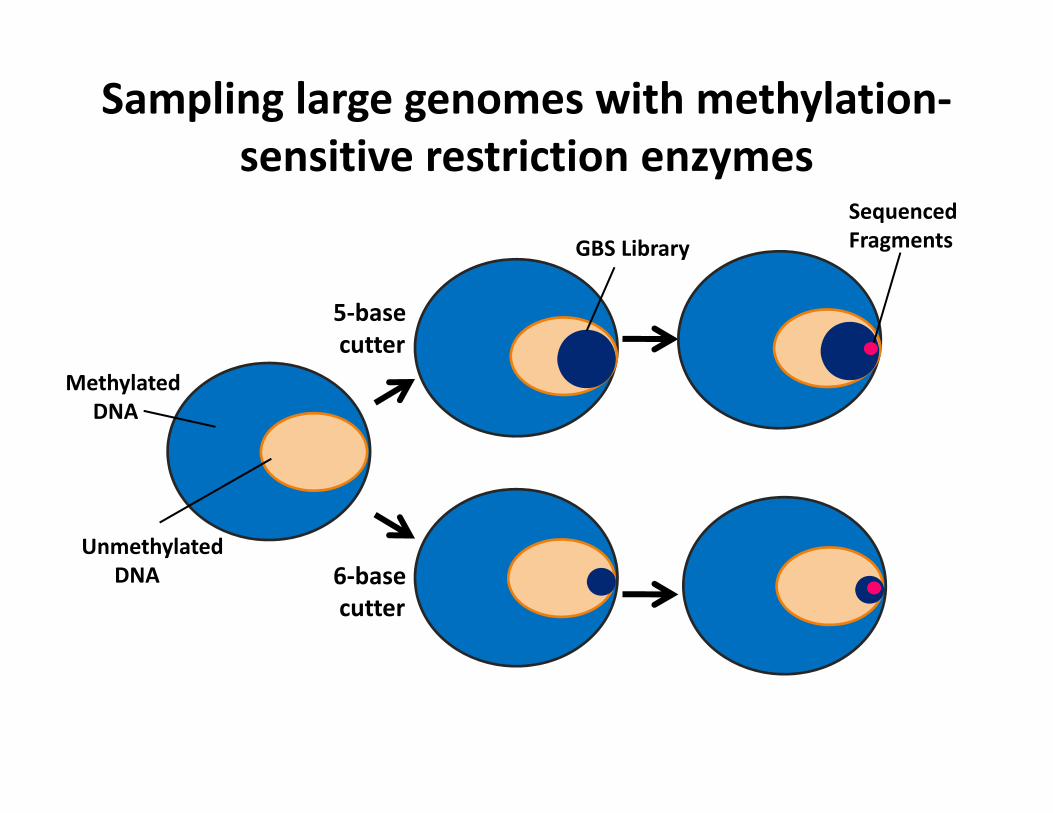
Sampling large genomes with methylation‐sensitive restriction enzymes
5‐base cutter
6‐base cutter
MethylatedDNA
UnmethylatedDNA
GBS LibrarySequenced Fragments

Scrub jay
Vole Giantsquid
Deer Mouse
TunicateYeast
Solitary Bee
Grape Maize Cacao
Rice
Raspberry
Barley
Cassava
Goose
Sorghum
Cassava
Shrub willow
Optimizing GBS in New Species

MaizeSorghum
RiceBarley
SwitchgrassBracypodiumPearl MilletTeosinte
LilyAndropogon
FonioFinger Millet
OnionYam
GrapeCassavaCacao
WatermelonAppleHopChili
CashewEucalyptusHorseradish
PineSpruce
Conifers
Flowering Plants
StrawberryRagweedSilene
SunflowerSafflowerSoybean
GoldenberryJatrophaCloverPeanut
PepperCucumberSquashPea
GourdArabidopsisWillowTea
PotatoCherryFlax

NeurosporaVerticillium
Solitary BeeCorn Ear Worm
Plant Bug
Mexican TetraKillifishCatfish
Scrub JayGoose
ChickadeeStarlingFinch
Deer MouseVole
Killer Whale
Pig
Fox
Cow
Choosing Appropriate Restriction Enzymes:Generalizations from the Bench

ApeKI
ApeKI works well for grassesMaize, sorghum, teosinte, rice, barley, millet, switchgrass, brachypodium.

PstI
PstI works well for most mammalsDeer mouse, vole, cow, pig.

Most frequently asked question for new species:
How many SNPs will I get?

Answer: It depends……
• Genome size and expected heterozygosityaffects size of fragment pool for desired amount of sequence coverage (enzyme choice and multiplex level).
• Amount of extant diversity and how well your sample reflects that diversity.
• Reference genome sequence? 3‐4X more SNPs attained by aligning to a reference sequence.
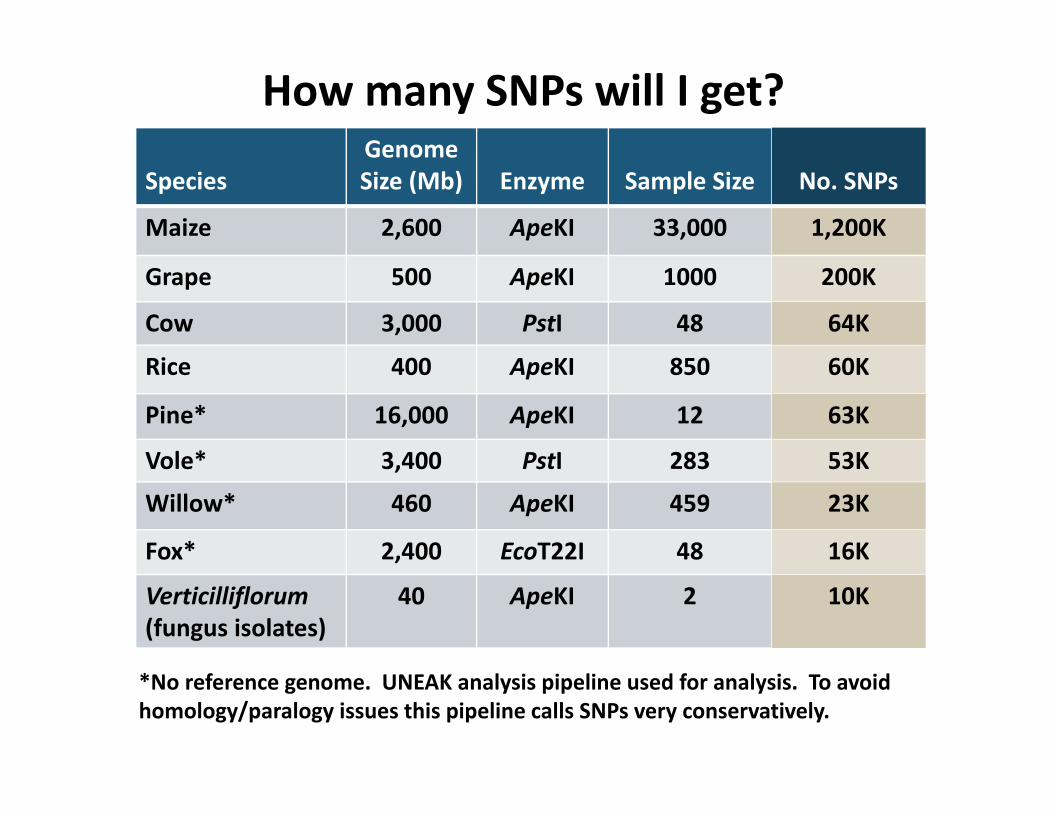
SpeciesGenome Size (Mb) Enzyme Sample Size No. SNPs
Maize 2,600 ApeKI 33,000 1,200K
Grape 500 ApeKI 1000 200K
Cow 3,000 PstI 48 64K
Rice 400 ApeKI 850 60K
Pine* 16,000 ApeKI 12 63K
Vole* 3,400 PstI 283 53K
Willow* 460 ApeKI 459 23K
Fox* 2,400 EcoT22I 48 16K
Verticilliflorum(fungus isolates)
40 ApeKI 2 10K
How many SNPs will I get?
*No reference genome. UNEAK analysis pipeline used for analysis. To avoid homology/paralogy issues this pipeline calls SNPs very conservatively.
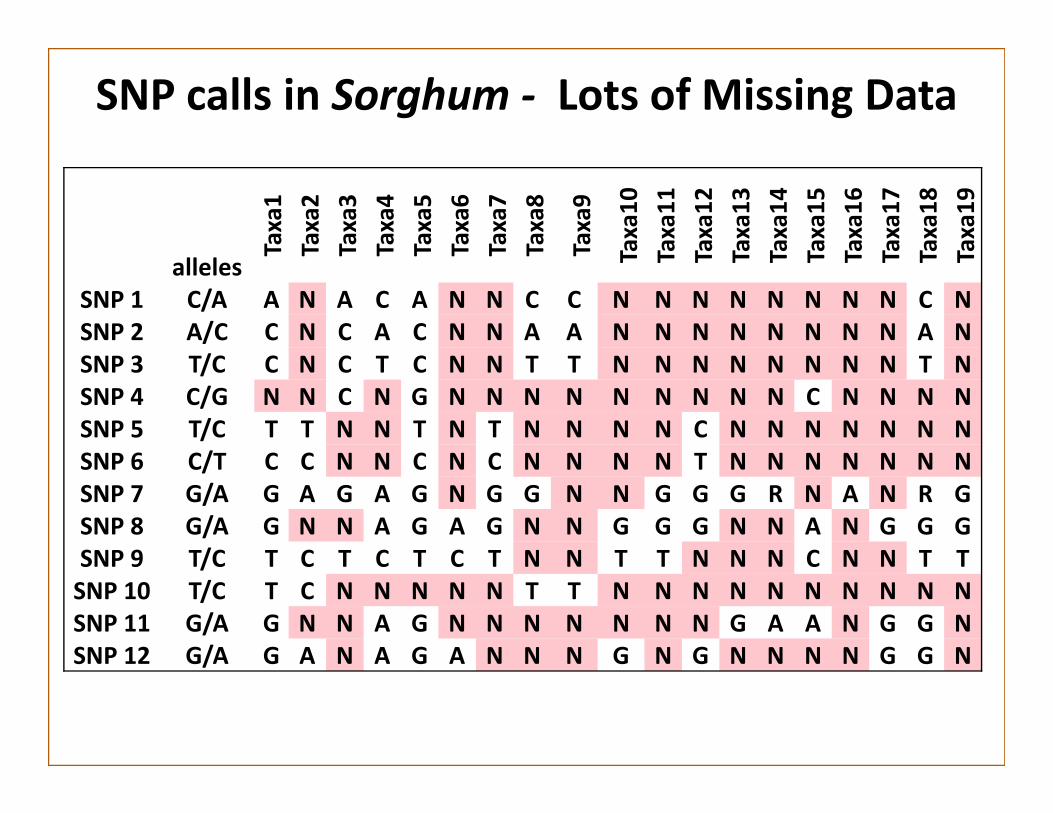
SNP calls in Sorghum ‐ Lots of Missing Data
allelesTaxa1
Taxa2
Taxa3
Taxa4
Taxa5
Taxa6
Taxa7
Taxa8
Taxa9
Taxa10
Taxa11
Taxa12
Taxa13
Taxa14
Taxa15
Taxa16
Taxa17
Taxa18
Taxa19
SNP 1 C/A A N A C A N N C C N N N N N N N N C NSNP 2 A/C C N C A C N N A A N N N N N N N N A NSNP 3 T/C C N C T C N N T T N N N N N N N N T NSNP 4 C/G N N C N G N N N N N N N N N C N N N NSNP 5 T/C T T N N T N T N N N N C N N N N N N NSNP 6 C/T C C N N C N C N N N N T N N N N N N NSNP 7 G/A G A G A G N G G N N G G G R N A N R GSNP 8 G/A G N N A G A G N N G G G N N A N G G GSNP 9 T/C T C T C T C T N N T T N N N C N N T TSNP 10 T/C T C N N N N N T T N N N N N N N N N NSNP 11 G/A G N N A G N N N N N N N G A A N G G NSNP 12 G/A G A N A G A N N N G N G N N N N G G N

Filter SNPs to remove most of the missing data
• Will be covered tomorrow in discussion of TASSEL (www.maizegenetics.net/tassel/)

Missing Data Strategies
• Impute Missing SNPs. ‐Many algorithms for doing this.
• Technical Options– Reduce the multiplexing level– Sequence the same library multiple times
• Molecular Options– Choose less frequently cutting enzymes

DNA sample info entered via webform
HTS databaseApproved?Samples shipped
GBS libraries made
Reference genome
Non‐reference genome
HapMap FileSNPs/SampleCoordinates
Lab Analysis Pipelines
DNA sequence data HapMap File
SNPs/Sample
GBS workflow at IGD
http://www.igd.cornell.edu/index.cfm/page/projects/GBS.htm

BioinformaticsJeff Glaubitz
Qi SunKatie Hyma
Fei LuRobert Bukowski
Method DevelopmentRob ElshireEd Buckler
Sharon Mitchell
GBS Team
Laboratory/ProductionCharlotte Acharya
Wenyan ZhuLisa Blanchard
Workshop CoordinatorTheresa Fulton