charlotte-mecklenburg schools 2011-2012 … end-of-year results...• performance composite– the...
TRANSCRIPT

Charlotte-Mecklenburg Schools 2011-2012
Unofficial Results

Accountability Measures• Performance Composite – The percentage of the test
scores in the school at or above Achievement Level III.
• Growth – The rate at which the students in the school learned over the past year.
• Annual Measurable Objectives (AMO) - The NCDPI will no longer designate each school as having met or not met Adequate Yearly Progress (AYP). For each school, the NCDPI will report the number of Annual Measureable Objectives (AMOs) and the number of those targets met as well as the percentage of targets met.

NC End of Grade Assessments• Levels of achievement which show proficiency
• Level III – grade level/at standard• Level IV – above grade level/above standard
• Reading and Mathematics EOGs• 64,681students tested in Grades 3 through 8
• Science EOG• 21,124 students tested in Grades 5 and 8
• EOC• Algebra I
– 11,916 students tested• Biology
– 9,872 students tested• English I
– 10,108 students tested

Performance Composite Results2010-2011 to 2011-2012
Test ChangeMath 3 +1.3Math 4 +0.7Math 5 +1.3Math 6 -0.1Math 7 +0.5Math 8 +1.6
Math 3-8 +0.8Reading 3 +2.2Reading 4 -0.4Reading 5 +1.6Reading 6 +0.4Reading 7 +1.1Reading 8 +1.0
Reading 3-8 +1.0Science 5 +2.9Science 8 +4.2
Science 5 & 8 +3.6
Test ChangeAlgebra 1 -4.0Biology +1.1
English 1 +1.4EOC Composite -1.1
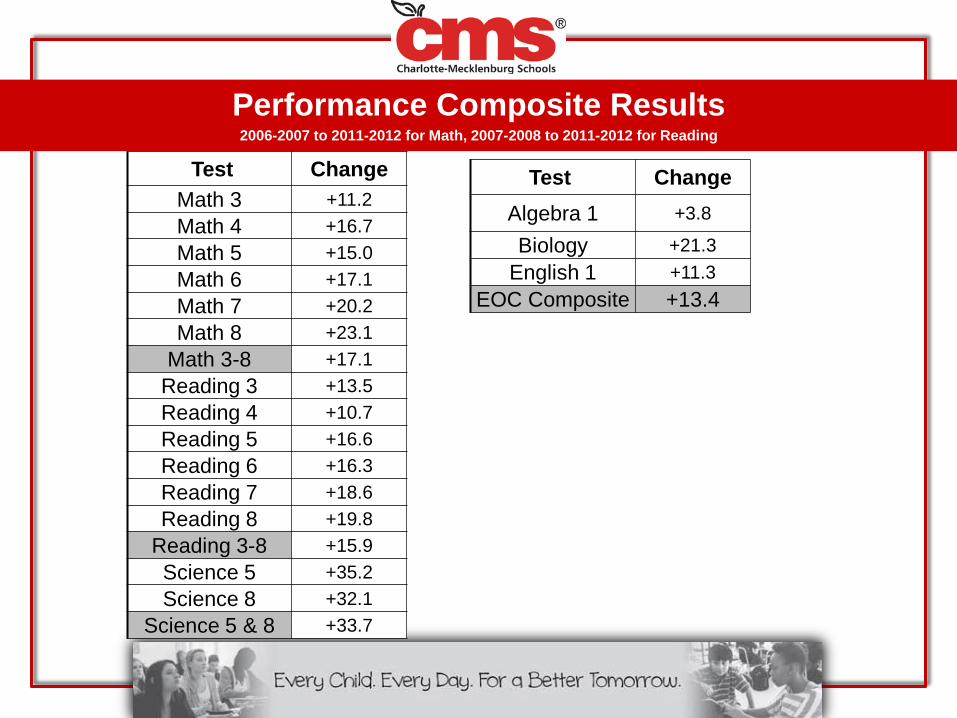
Performance Composite Results2006-2007 to 2011-2012 for Math, 2007-2008 to 2011-2012 for Reading
Test ChangeMath 3 +11.2Math 4 +16.7 Math 5 +15.0Math 6 +17.1Math 7 +20.2Math 8 +23.1
Math 3-8 +17.1Reading 3 +13.5Reading 4 +10.7Reading 5 +16.6Reading 6 +16.3Reading 7 +18.6Reading 8 +19.8
Reading 3-8 +15.9Science 5 +35.2Science 8 +32.1
Science 5 & 8 +33.7
Test ChangeAlgebra 1 +3.8
Biology +21.3English 1 +11.3
EOC Composite +13.4

Math EOG Performance Composite Results
2006-2007
2007-2008
2008-2009
2009-2010
2010-2011
2011-2012
Math 3 70.3% 69.7% 79.5% 82.1% 80.2% 81.5%
Math 4 68.5% 70.5% 80.4% 82.6% 84.5% 85.2%
Math 5 68.8% 71.7% 80.8% 82.5% 82.5% 83.8%
Math 6 61.5% 64.8% 75.8% 78.7% 78.7% 78.6%
Math 7 59.6% 63.5% 75.3% 78.8% 79.3% 79.8%
Math 8 63.3% 65.3% 79.5% 84.2% 84.8% 86.4%
Math 3-8 65.4% 67.7% 78.6% 81.5% 81.7% 82.5%

Math EOG Progress: Change in Proficiency
2010-2011 to
2011-2012
2006-2007 to
2011-2012Math 3 +1.3 +11.2
Math 4 +0.7 +16.7
Math 5 +1.3 +15.0
Math 6 -0.1 +17.1
Math 7 +0.5 +20.2
Math 8 +1.6 +23.1
Math 3-8 +0.8 +17.1
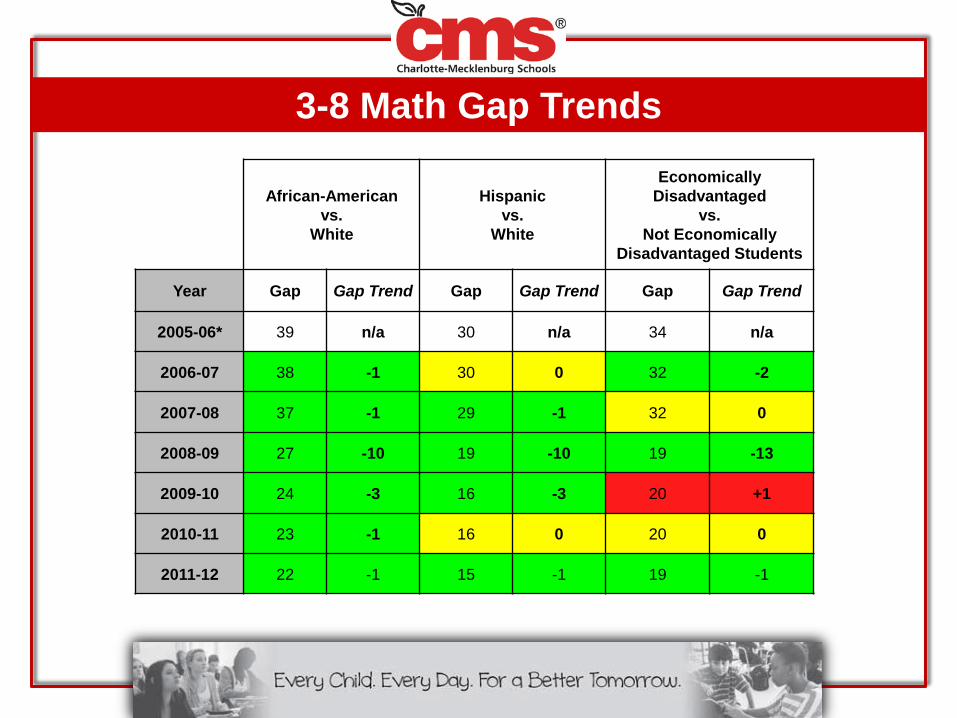
3-8 Math Gap Trends
African-American vs.
White
Hispanic vs.
White
Economically Disadvantaged
vs. Not Economically
Disadvantaged Students
Year Gap Gap Trend Gap Gap Trend Gap Gap Trend
2005-06* 39 n/a 30 n/a 34 n/a
2006-07 38 -1 30 0 32 -2
2007-08 37 -1 29 -1 32 0
2008-09 27 -10 19 -10 19 -13
2009-10 24 -3 16 -3 20 +1
2010-11 23 -1 16 0 20 0
2011-12 22 -1 15 -1 19 -1

Reading EOG Performance Composite Results
2006-2007
2007-2008
2008-2009
2009-2010
2010-2011
2011-2012
Reading 3 81.6% 55.7% 66.1% 67.7% 67.0% 69.2%Reading 4 85.2% 60.0% 70.2% 70.9% 71.1% 70.7%Reading 5 89.2% 56.9% 68.8% 72.2% 71.9% 73.5%Reading 6 78.1% 58.2% 70.0% 74.4% 74.1% 74.5%Reading 7 81.2% 49.2% 62.5% 65.8% 66.7% 67.8%Reading 8 85.0% 50.9% 65.6% 68.5% 69.7% 70.7%Reading
3-8 83.4% 55.2% 67.3% 69.9% 70.1% 71.1%

Reading EOG Progress: Change in Proficiency
2010-2011 to
2011-2012
2007-2008 to
2011-2012Reading 3 +2.2 +13.5Reading 4 -0.4 +10.7Reading 5 +1.6 +16.6Reading 6 +0.4 +16.3Reading 7 +1.1 +18.6Reading 8 +1.0 +19.8
Reading 3-8 +1.0 +15.9

3-8 Reading Gap Trends
African-American vs.
White
Hispanic vs.
White
Economically Disadvantaged
vs. Not Economically
Disadvantaged Students
Year Gap Gap Trend Gap Gap Trend Gap Gap Trend
2007-08* 41 n/a 39 n/a 37 n/a
2008-09 35 -6 34 -5 27 -10
2009-10 33 -2 32 -2 31 +4
2010-11 32 -1 31 -1 30 -1
2011-12 31 -1 30 -1 30 0

Science EOG Performance Composite Results
2006-2007
2007-2008
2008-2009
2009-2010
2010-2011
2011-2012
Science 5 - 39.6% 60.1% 68.7% 71.9% 74.8%
Science 8 - 46.8% 63.9% 69.8% 74.7% 78.9%
Science 5-8 - 43.1% 62.0% 69.2% 73.2% 76.8%

Science EOG Progress: Change in Proficiency
2010-2011 to
2011-2012
2007-2008 to
2011-2012
Science 5 +2.9 +35.2
Science 8 +4.2 +32.1
Science 5-8 +3.6 +33.7
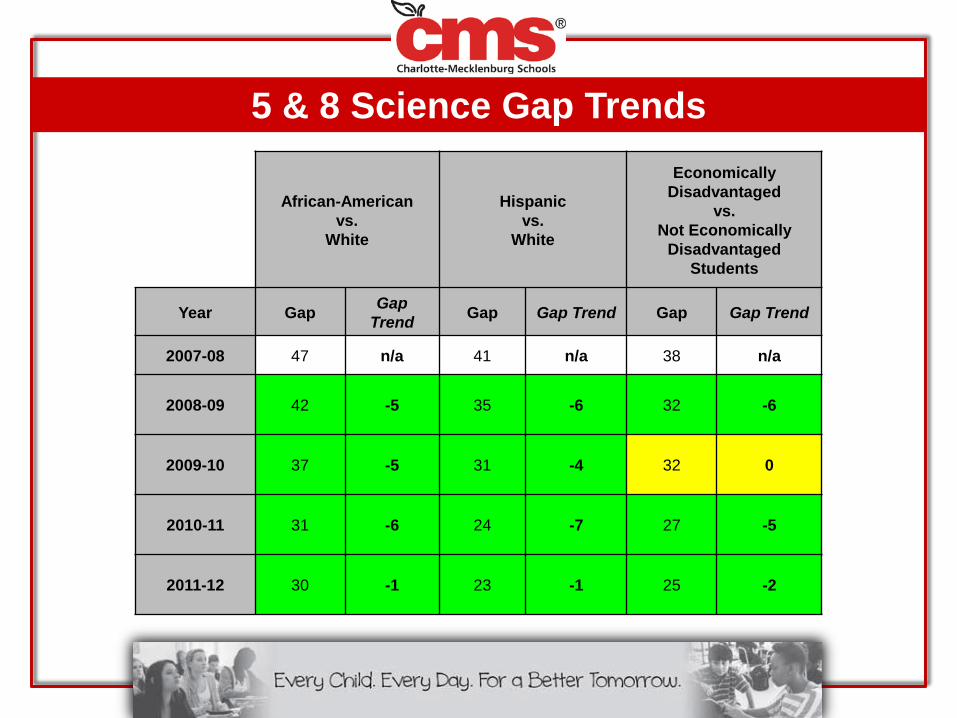
5 & 8 Science Gap Trends
African-American vs.
White
Hispanic vs.
White
Economically Disadvantaged
vs. Not Economically
Disadvantaged Students
Year Gap Gap Trend Gap Gap Trend Gap Gap Trend
2007-08 47 n/a 41 n/a 38 n/a
2008-09 42 -5 35 -6 32 -6
2009-10 37 -5 31 -4 32 0
2010-11 31 -6 24 -7 27 -5
2011-12 30 -1 23 -1 25 -2

EOC Performance Composite Results
2006-2007
2007-2008
2008-2009
2009-2010
2010-2011
2011-2012
Algebra 1 71.3% 70.6% 74.7% 84.2% 79.1% 75.1%Algebra 2 61.4% 67.3% 75.6% 84.8% 79.4% -Biology 62.9% 72.0% 78.2% 84.5% 83.1% 84.2%
C&E 66.1% 70.8% 77.1% 83.1% 81.9% -English 1 71.3% 74.1% 76.6% 85.3% 81.2% 82.6%
US History 70.9% 74.3% 78.9% 88.8% 85.9% -Physical Science - 53.1% 61.0% 71.3% 70.5% -
EOC Composite 66.9% 70.1% 75.8% 84.2% 81.4% 80.3%
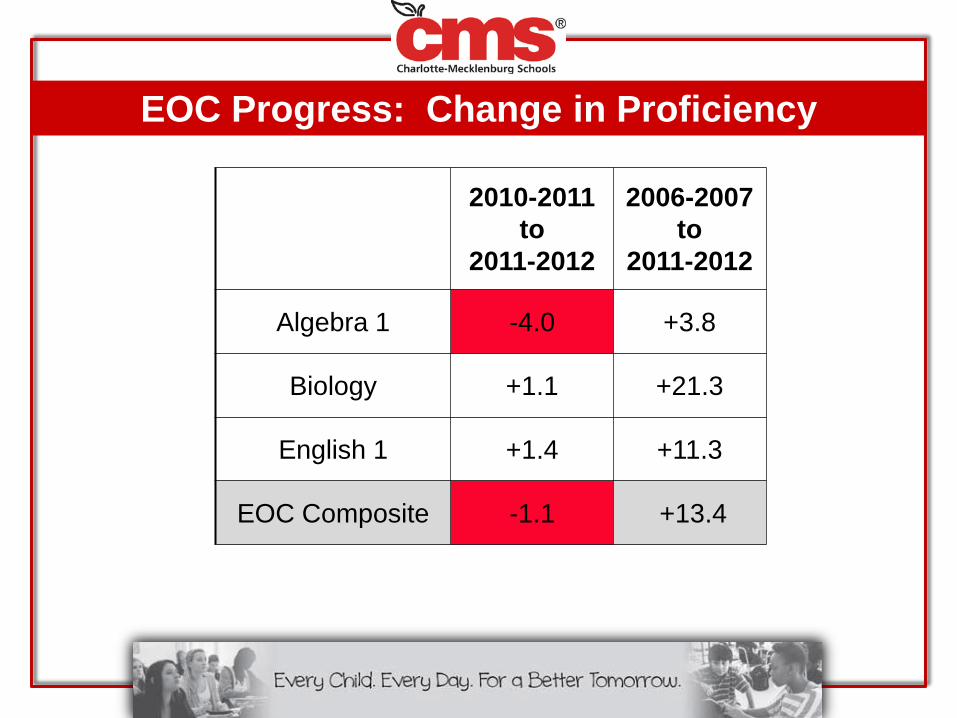
EOC Progress: Change in Proficiency
2010-2011 to
2011-2012
2006-2007 to
2011-2012
Algebra 1 -4.0 +3.8
Biology +1.1 +21.3
English 1 +1.4 +11.3
EOC Composite -1.1 +13.4

2011-2012 Cohort Graduation Rate Data
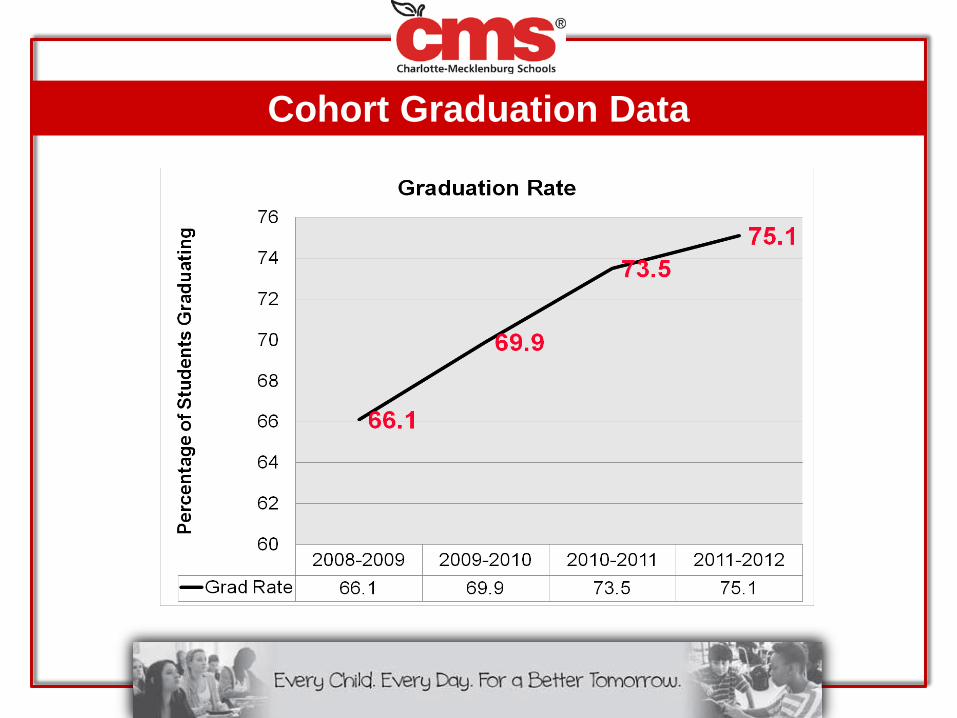
Cohort Graduation Data

Graduation Rate by School98.98 Cato Middle College High 78.62 Zebulon B. Vance High96.14 W. A. Hough High 78.57 M G Davis Military Academy94.18 Rocky River High 77.29 Hopewell High93.53 Ardrey Kell High 76.83 Int Bus & Comm Studies @ OHS92.11 Providence High 76.77 Independence High91.30 Northwest School of the Arts 76.15 East Mecklenburg High89.94 Mallard Creek High 74.74 Renaissance @ Olympic High89.71 Performance Learning Center 71.05 Hawthorne High88.10 Harding University High 70.21 New Technology @ GHS
88.05 Berry Academy Of Technology 69.15 Int Studies & GlobalEcon @ OHS86.60 Math, Sci, Pre-Eng &Tech @ OHS 69.05 International Studies @ GHS86.39 David W. Butler High 66.86 West Mecklenburg High86.38 Myers Park High 61.39 Leadership & Public Serv. at G86.04 South Mecklenburg High 57.47 Business & Finance @ GHS85.15 Biotech, Health & PubAdm @ OHS 56.98 Math and Science at Gar79.59 North Mecklenburg High 55.70 West Charlotte High

Disaggregated Graduation RateSubgroup 2008-09 2009-10 2010-11 2011-2012
All Students 66.1 69.9 73.5 75.1
Male 60.6 64.4 67.2 69.6
Female 71.3 75.6 79.7 80.6
American Indian 62.5 63.8 78.7 63.3
Asian 78.8 76.4 84.4 80.0
Black 55.5 61.6 66.8 70.4
Hispanic 57.6 54.6 58.0 64.3
Multi-Racial 55.3 72.0 72.5 72.2
White 81.1 84.9 86.6 85.1
Economically Disadvantaged 52.0 59.8 64.6 68.8
Limited English Proficient 54.4 43.9 42.7 44.9
Students With Disabilities 39.1 43.3 41.6 43.9

2011-2012 ABC Results
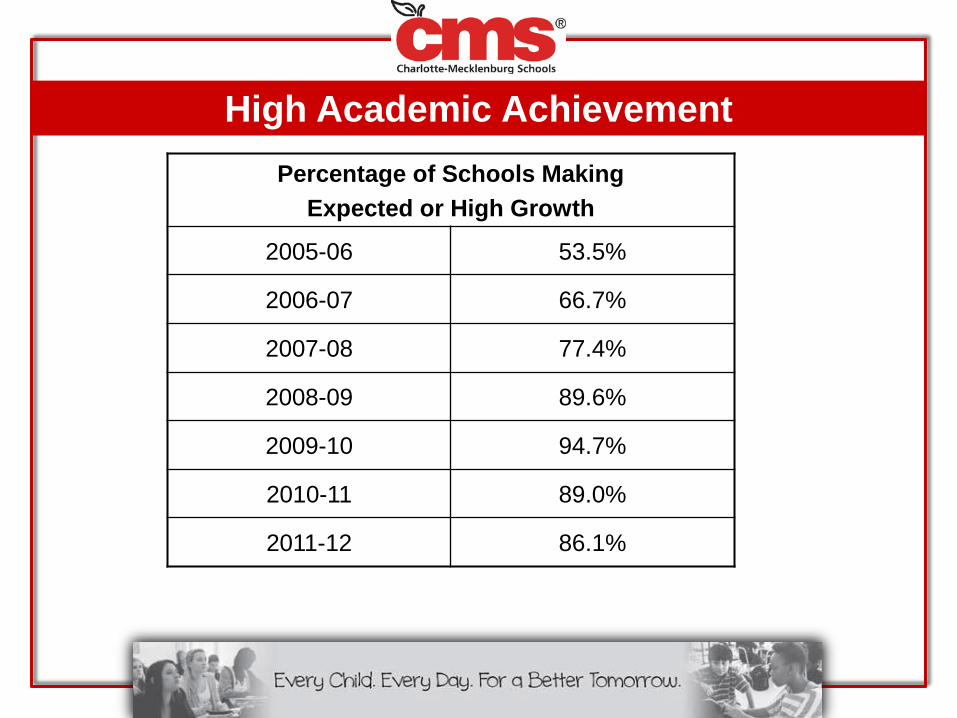
High Academic AchievementPercentage of Schools Making
Expected or High Growth
2005-06 53.5%
2006-07 66.7%
2007-08 77.4%
2008-09 89.6%
2009-10 94.7%
2010-11 89.0%
2011-12 86.1%

2011-2012 AMO Results

AMO Results
• This year instead of reporting Adequate Yearly Progress, the NorthCarolina Department of Public Instruction will report the number ofAnnual Measureable Objectives (AMOs) and the number of thosetargets met as well as the percentage of targets met eachschool/district.
• The ESEA waiver specified AMO targets will be used for reporting.These targets are (1) based on 2010-11 data and (2) identified for eachfederally reported subgroup. Per the flexibility waiver, the AMO targetswere set with the goal of reducing the percentage of non-proficientstudents by one-half within six years. The attached charts provide thetargets for English language arts and for mathematics.

AMO Reading Targets

AMO Math Targets

AMO Results
Year Number of Schools Percent of Schools
2011-2012AMO 73 out of 163 44.8%