charlotte, nc comprehensive neighborhood improvement
TRANSCRIPT
Charlotte, NC Comprehensive Neighborhood
Improvement ProgramRozzelles Ferry/West Trade Street
Market Analysis & Project Strategy BriefAddendum to Look Book and Report prepared by Stantec
©2015 by City of Charlotte, Rose & Associates Southeast, Inc. and Stantec. Text and all photos, images and data by Rose Associates unless otherwise noted. Reproduction in its entirety only, permitted with credit in print. The conclusions and recommendations set forth are based upon information provided
by public records, municipal officials, business owners, market and demographic data obtained by Rose & Associates Southeast, Inc. Neither an appraisal nor title search was performed for the Study
Area or any specific property in preparing this report. While the information included herein is believed to be accurate, no warranty or representation, expressed or implied, is made as to the
information contained herein, and is submitted subject to omission, change of market conditions, or other factors outside the scope of this report or the author’s control.
© Copyright 2015, Rose & Associates Southeast, Inc. Permission to reprint this report in its entirety only.
March 2015
ÆÖ
ÆÖ
£¤
§̈¦
§̈¦
\
ROZZELLES FERRY RD
GLEN
WO
OD DR
ASHLEY RD
TRA
DE S
T
FREEDOM DR
BROOKSHIRE FWY
WILKINSON BLVD
MOREHEAD ST
TUCKASEEGEE RD BEAT
TIES
FORD
RD
CAMP GREENECOMMUNITY
PARK
MARTINLUTHER KING
COMMUNITY PARK
CAMP GREENECONNECTOR
STEWARTCREEK
GREENWAY
STEWARTCREEK
GREENWAY
STEWARTCREEK
GREENWAY
STEWARTCREEK
GREENWAY
STEWARTCREEK
GREENWAY
STEWARTCREEK
GREENWAY
STEWARTCREEK
GREENWAY
STEWARTCREEK
GREENWAY
STEWARTCREEK
GREENWAY
STEWARTCREEK
GREENWAY
STEWARTCREEK
GREENWAY
WESLEYHEIGHTS
GREENWAY
WESLEYHEIGHTS
GREENWAY
BIDDLEVILLENEIGHBORHOOD
PARK
BRYANTNEIGHBORHOOD
PARK
DOWD HOUSEHISTORIC
SITE
ENDERLYNEIGHBORHOOD
PARK
FIVE POINTSNEIGHBORHOOD
PARK
FRAZIERNEIGHBORHOOD
PARK
HOSKINSNEIGHBORHOOD
PARK
L.C. COLEMANNEIGHBORHOOD
PARK
SEVERSVILLENEIGHBORHOOD
PARK
SOLOMANSNEIGHBORHOOD
PARK
THIRD WARDNEIGHBORHOOD
PARK
BETTE RAETHOMASCENTER
BrunsAcademy
Walter G.Byers School
Phillip O.Berry Academyof Technology
Metro School
Turning PointAcademy
Ashley ParkPreK-8School
AristotlePreparatoryAcademy Invest
Collegiate
AngelsChristianAcademy
Five PointsIntersection
JohnsonC. Smith
University
29
77
85
16
27
Comprehensive Neighborhood Improvement Program (CNIP)
[0 500 1,000
West Trade/Rozzelles Ferry Road Neighborhood
Study Area Boundary
Study Area Boundary
Parcels
Building Footprints
Contour Lines
Streams
Park Property
Railroads
Last Revised: Tuesday, December 9, 2014
Impervious Surface
College or University Property
1" = 500' at 34" X 44"
Rozzelles Ferry/West Trade Street Charlotte, NC • Rose & Associates Southeast, Inc. 22
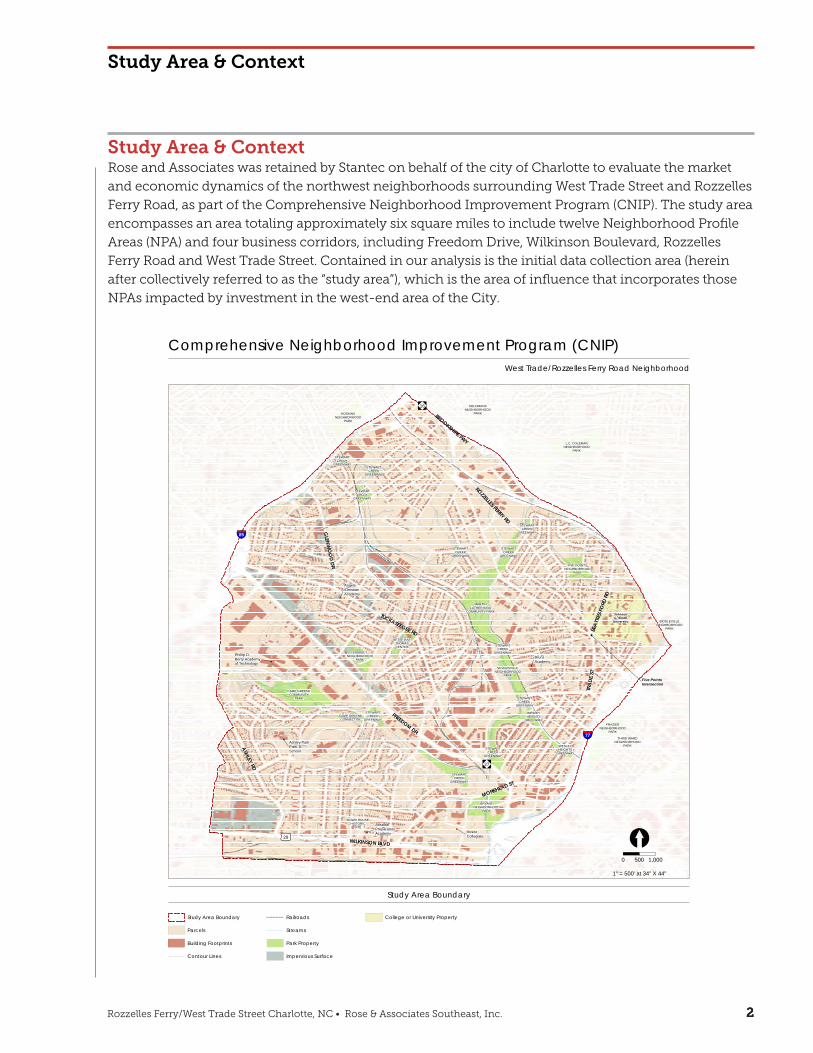
Study Area & ContextRose and Associates was retained by Stantec on behalf of the city of Charlotte to evaluate the market
and economic dynamics of the northwest neighborhoods surrounding West Trade Street and Rozzelles
Ferry Road, as part of the Comprehensive Neighborhood Improvement Program (CNIP). The study area
encompasses an area totaling approximately six square miles to include twelve Neighborhood Profile
Areas (NPA) and four business corridors, including Freedom Drive, Wilkinson Boulevard, Rozzelles
Ferry Road and West Trade Street. Contained in our analysis is the initial data collection area (herein
after collectively referred to as the “study area”), which is the area of influence that incorporates those
NPAs impacted by investment in the west-end area of the City.
Study Area & Context
ÆÖ
ÆÖ
£¤
§̈¦
§̈¦
\
ROZZELLES FERRY RD
GLEN
WO
OD DR
ASHLEY RD
TRA
DE S
T
FREEDOM DR
BROOKSHIRE FWY
WILKINSON BLVD
MOREHEAD ST
TUCKASEEGEE RD BEAT
TIES
FORD
RD
CAMP GREENECOMMUNITY
PARK
MARTINLUTHER KING
COMMUNITY PARK
CAMP GREENECONNECTOR
STEWARTCREEK
GREENWAY
STEWARTCREEK
GREENWAY
STEWARTCREEK
GREENWAY
STEWARTCREEK
GREENWAY
STEWARTCREEK
GREENWAY
STEWARTCREEK
GREENWAY
STEWARTCREEK
GREENWAY
STEWARTCREEK
GREENWAY
STEWARTCREEK
GREENWAY
STEWARTCREEK
GREENWAY
STEWARTCREEK
GREENWAY
WESLEYHEIGHTS
GREENWAY
WESLEYHEIGHTS
GREENWAY
BIDDLEVILLENEIGHBORHOOD
PARK
BRYANTNEIGHBORHOOD
PARK
DOWD HOUSEHISTORIC
SITE
ENDERLYNEIGHBORHOOD
PARK
FIVE POINTSNEIGHBORHOOD
PARK
FRAZIERNEIGHBORHOOD
PARK
HOSKINSNEIGHBORHOOD
PARK
L.C. COLEMANNEIGHBORHOOD
PARK
SEVERSVILLENEIGHBORHOOD
PARK
SOLOMANSNEIGHBORHOOD
PARK
THIRD WARDNEIGHBORHOOD
PARK
BETTE RAETHOMASCENTER
BrunsAcademy
Walter G.Byers School
Phillip O.Berry Academyof Technology
Metro School
Turning PointAcademy
Ashley ParkPreK-8School
AristotlePreparatoryAcademy Invest
Collegiate
AngelsChristianAcademy
Five PointsIntersection
JohnsonC. Smith
University
29
77
85
16
27
Comprehensive Neighborhood Improvement Program (CNIP)
[0 500 1,000
West Trade/Rozzelles Ferry Road Neighborhood
Study Area Boundary
Study Area Boundary
Parcels
Building Footprints
Contour Lines
Streams
Park Property
Railroads
Last Revised: Tuesday, December 9, 2014
Impervious Surface
College or University Property
1" = 500' at 34" X 44"
Rozzelles Ferry/West Trade Street Charlotte, NC • Rose & Associates Southeast, Inc. 33
A combination of methodologies is utilized in developing our findings and recommendations. The
analysis and forecasting of market data, comprising demographic and population estimates together
with economic and employment estimates, is both art and science. All market research analysis begins
with US Census Bureau data – which has limitations as to both accuracy and timeliness. Nonetheless,
the data provide a benchmark as much for a retrospective look as a prospective one. Four factors must
be considered when looking exclusively at such data: 1) the role of economic drivers that are a
departure from past trends; 2) growth from primary centers spilling over into outlying areas; 3)
constraints due to physical barriers; and 4) availability of land physically and legally suited for
development. Included is our analysis, observations and recommendations to assist in identifying
projects that will contribute to the transformation of this culturally and historically rich area and help to
ensure its sustainability for future generations.
Study Area & Context
Rozzelles Ferry/West Trade Street Charlotte, NC • Rose & Associates Southeast, Inc. 44
Executive Summary
Charlotte ranks second among the fastest-growing large cities in the United States, according to the
most recent data released by the U.S. Census Bureau. The CNIP study area at Rozzelles Ferry/West
Trade Street is already changing. Housing is being upgraded, streets are being improved, and
Johnson C. Smith University, a historic black college, is an activist partner in changing the
environment around its campus. Mecklenburg county’s adaptive reuse of the old Freedom Mall is a
substantial positive change, the Stewart Creek greenway and multiple parks have been established
throughout the area, industrial and business enterprises are providing jobs, and business corridors
are showing early signs of new vitality. This is an area of great history and great opportunity. The
market is a story of reconnecting and repositioning: fitting in the missing pieces of the puzzle,
completing projects, closing gaps and maximizing the existing infrastructure investment that has
already been made, rather than starting over or adding any substantial inventory. There is much to
celebrate and there is much to be done to ensure this area’s long range success. The report can be
summarized by a simple concept and five guiding principles:
IF Center City is the heart of Charlotte…The West End is its Soul
• Preserve the historical housing stock and provide additional housing options for multiple
generations.
• Celebrate the rich heritage and culture of Charlotte’s African-American community through
connecting historical and cultural assets, and consolidating and strengthening existing corridors.
• Connect the neighborhoods to the commercial corridors by completing infrastructure projects,
completing/expanding greenway connections, opening cul-de-sacs, and expanding
transportation options.
• Reposition retail and industrial developments with renovation and/or adaptive reuse for the 21st
Century.
• Inspire education and entrepreneurship to create job opportunities and small local businesses,
supporting economic mobility to stabilize real estate markets and providing community health
and wellness.
Executive Summary
Rozzelles Ferry/West Trade Street Charlotte, NC • Rose & Associates Southeast, Inc. 55
Subsumed within these concepts are the following findings regarding the real estate market and key
areas where transformation is possible:
• Housing - The success of housing in the study area is dependent upon two primary factors:
transportation and education. Therefore, the proposed Gold Line and Trolley projects, as well as
greenway and sidewalk infrastructure will have an impact on accessibility to goods and services.
There are opportunities to stabilize, rehabilitate and preserve the existing single family housing
stock – through public private initiatives and programs, including the expansion of historic
districts. Increasing the stability of owner-occupied homes would improve property values, allow
Baby Boomers and Seniors to age in place, and strengthen the commercial corridors. There are also
opportunities to further diversify multifamily housing that will provide alternative choices that
match the needs and wants of today’s Millennials and aging Baby Boomers. These include the
redevelopment of Tarleton Hills under a Choice Neighborhood Implementation program, the
adaptive reuse of the Savona Mills project, and the development of vacant parcels and
redevelopment of existing properties along the Freedom Drive and Rozzelles Ferry corridors. Much
of the housing gap in the short term will be filled with the housing proposed or under construction
in the Bryant Park and West Trade areas. Together these will provide over 350 single family and
multifamily homes to meet the gap of 700 – 1400 housing units over the next 5-10 years.
• Retail - There are opportunities for automotive sales and service, sports and sporting goods,
clothing and grocery uses, albeit limited. There is an opportunity for a small neighborhood grocery
to fill the underserved market. This is most prominent in the West Trade corridor, where no existing
quality food options exist. Current demand is primarily being met by discount/convenience stores.
In addition to a traditional neighborhood grocery in the Five Points area, a cluster of sports themed
shops: sporting goods stores and restaurants around a central core or urban park could be
considered in a location that is fitting for a regional destination. Freedom Drive is such a
destination, as a thoroughfare connecting two major interstates to each other and to the Center
City. Such a themed center with specialty retailers could separate and define a destination apart
from the larger national discount chain stores prevalent along the Freedom Drive corridor in the
past. This center could be further enhanced with a flexible hardscape which would be used for
parking and/or gathering space for outdoor markets, events or entertainment. This is also an
opportunity to re-create a place that connects and incorporates the history and culture of the
African American community that is dominant in this area – which should be celebrated. The
redevelopment and repositioning of the existing retail will reinvigorate the void of up to 300,000 –
400,000 square feet of retail, restaurant and entertainment space that could be created over the next
5-10 years.
• Industrial - Small to mid-size companies have the best potential for use of older properties, which
provide low cost space options near the interstates and provide employment opportunities for
neighborhood residents. Clusters include automotive supply and repair; distribution and light
manufacturing. Some buildings may also be suitable for re-purposing for different uses such as
breweries, senior housing, rental housing, small business incubation/education space and other
uses. Primary candidates include the Savona Mill, Greenway Business Park and the existing
buildings along lower Freedom Drive and planned Thrift St/Berry Hill roundabout. This includes
the repositioning of the Goodwill facilities. Together these would provide the 100,000 – 200,000
square feet anticipated over the next 5-10 years.
2.1 Executive Summary
Rozzelles Ferry/West Trade Street Charlotte, NC • Rose & Associates Southeast, Inc. 66
Other factors to consider include transforming these areas by leveraging public projects with private
investment, and activating these places with people:
• Education – As noted throughout the report, partnerships are key to achieving the six stated
goals of the Community Investment Plan. This includes Johnson C. Smith University, Central
Piedmont Community College, Charlotte Mecklenburg Schools, and a host of existing educators
within the community.
• Tourism – Connecting the arts, cultural and entertainment assets and opportunities will create a
destination and place for inviting visitors. These might include a Black History & Heritage Trail
from West Trade to Rozzelles Ferry and Tuckaseegee, and Sports and entertainment connections
bridging Center City and Freedom Drive. Connecting heritage, culture, sports and the arts would
create synergy that could bring a small boutique hotel to JSCU and put the west side on the map
as a destination for visitors.
• Implementation – The most productive way to encourage private investment is to reduce risk.
There is an existing robust infrastructure within the study area. However, consideration should
be given to providing a comprehensive package of existing tools and/or programs, as well as
small area plans to understand the goals of land use for developers and investors. This, together
with the “can do” attitude that is the hallmark of the region, will provide greater opportunities for
public-private partnership.
2.1 Executive Summary

Rozzelles Ferry/West Trade Street Charlotte, NC • Rose & Associates Southeast, Inc. 77
Planning Cycle 1 – Data Immersion
We began with a look at current reality; that is, the economic, demographic and social elements that
make up the community and the study area. Second, we identified the key assets and interviewed key
stakeholders to determine critical economic areas for development and key themes that would
provide the greatest impact for investment.
Based upon our findings during our work in Planning Cycles 1 and 2, we identified opportunities and
potential projects, subject to revision during our continued work with the community and the team
in Cycles 2 and 3.
1.0 Data Collection & Site TourWe reviewed a large collection of plans, reports and data provided by or compiled by the City. This
included the ULI Corridor study, the West End plan, and the Estimated Development Potential around
CityLynx Gold Line Phase I and II Transit Stations. Further, we collected and reviewed data from
other sources including the County and Urban Institute (Quality of Life Study), the Bureau of Labor
Statistics, The US Census, and the North Carolina Employment Security Commission, as well as
proprietary data from ESRI.
The market team conducted two tours of the study area to identify existing assets, understand the
transportation network, and evaluate the current conditions of housing and commercial
development. After completing a physical and photographic inventory, we set about understanding
the people who live, work and pass through the study area.
Our tour revealed a variety of characteristics in the study area that present both challenges and
opportunities.
Planning Cycle 1 – Data Immersion
Rozzelles Ferry/West Trade Street Charlotte, NC • Rose & Associates Southeast, Inc. 88
1.1 Locational & Asset AnalysisThe West Trade/Rozzelles Ferry study area is located northwest of center city (downtown) Charlotte. It
is bordered by Interstates 85 and 77, and Highway 16 (Brookshire Boulevard), which provide both
multiple access points and physical barriers to the study area. It includes four primary business
corridors: West Trade Street, Rozzelles Ferry Road, Freedom Drive and Wilkinson Boulevard. These
are auto-dominant corridors, which include regular CATS bus service. The Goldline CityLynx
streetcar extensions have recently been approved by City Council which will add additional
transportation options to the area, serving and connecting Johnson C. Smith University to the center
city and Johnson & Wales University. The area is also in close proximity to Charlotte Douglas
International Airport and its edge at Wilkinson Boulevard is a major corridor which serves the airport
and related airport operations.
The three major highways that run through or along the boundaries of the study area: I-77 to the east,
NC16 to the north, and I-85 to the west, include a total of eight full or partial interchanges as shown
on Table 2 below. Highways present both challenges and opportunities. They may bisect
neighborhoods and negatively impact attractiveness and walkability, but they also provide visibility
and access to support businesses that rely on them.
Planning Cycle 1 – Data Immersion
CNIP – Rozzelles Ferry/West Trade Market Analysis Summary Brief
9
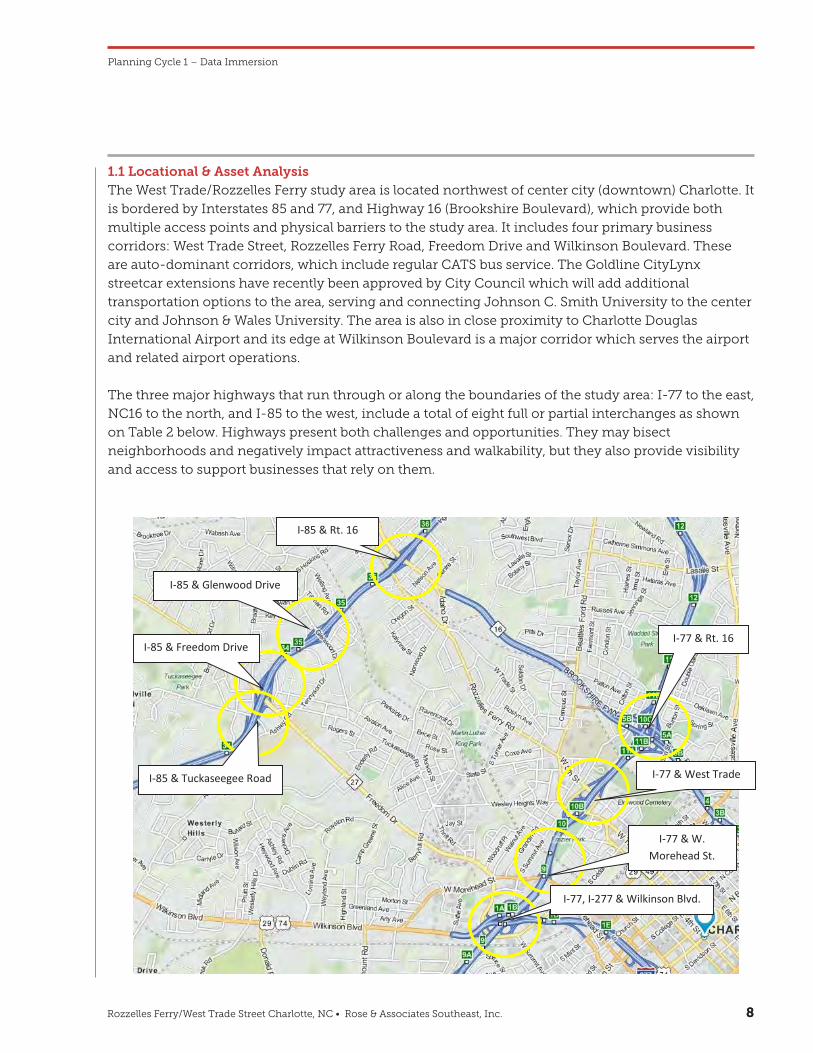
The three major highways that run through or along the boundaries of the study area: I-77 to the east, NC16 to the north, and I-85 to the west, include a total of eight full or partial interchanges as shown on Table 2 below. Highways present both challenges and opportunities. They may bisect neighborhoods and negatively impact attractiveness and walkability, but they also provide visibility and access to support businesses that rely on them.
Locational Analysis Map
Two large anchors provide employment and economic activity in this area: Johnson C. Smith University and the Valerie C. Woodard County Social Service Offices (formerly Freedom Mall). The primary land use is low density, single family homes in well-established neighborhoods, followed by civic and institutional uses. There are 288 acres of park, greenway and open space, and 375 acres of vacant parcels ripe for future development. In addition there are commercial/retail operations along the business corridors and a number of underutilized assets (vacant or under-developed), such as the former Kmart Center on Freedom Drive between Camp Greene and Alleghany Streets.
The study area also includes 12 Neighborhood Profile Areas (NPA) which further define the study area and are the subject of the bi-annual Quality of Life study compiled by the County in association with the UNCC Urban Institute. The Quality of Life study is done every two years with the new edition passed in January of 2015 for rollout. Consequently, at this time the primary source for descriptive data is the 2012 Quality of Life Study. The basic geographical unit used in the Quality of Life study is denoted as the Neighborhood Profile Area (NPA), which is most closely associated with census
I-85 & Tuckaseegee Road
I-85 & Freedom Drive
I-85 & Glenwood Drive
I-85 & Rt. 16
I-77 & Rt. 16
I-77 & West Trade St.
I-77 & W. Morehead St.
I-77, I-277 & Wilkinson Blvd.
Rozzelles Ferry/West Trade Street Charlotte, NC • Rose & Associates Southeast, Inc. 99
Two large anchors provide employment and economic activity in this area: Johnson C. Smith
University and the Valerie C. Woodard County Social Service Offices (formerly Freedom Mall). The
primary land use is low density, single family homes in well-established neighborhoods, followed by
civic and institutional uses. There are 288 acres of park, greenway and open space, and 375 acres of
vacant parcels ripe for future development. In addition, there are commercial/retail operations along
the business corridors and a number of underutilized assets (vacant or under-developed), such as the
former Kmart Center on Freedom Drive between Camp Greene and Alleghany Streets.
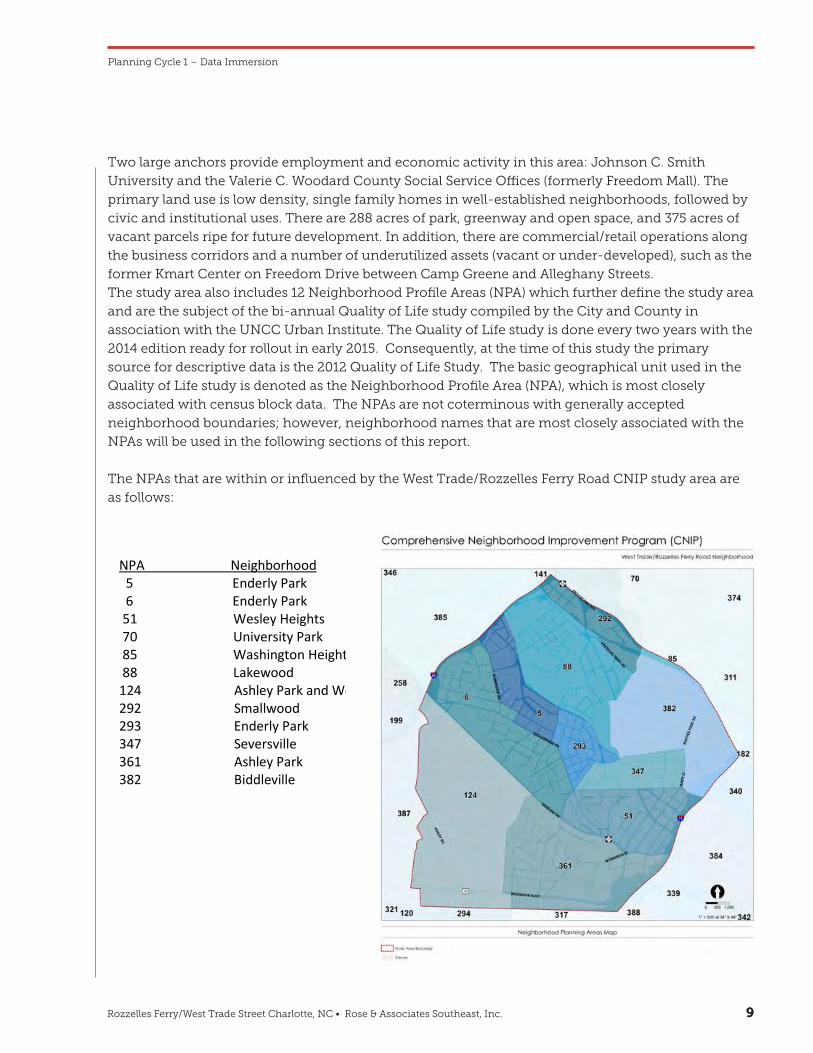
The study area also includes 12 Neighborhood Profile Areas (NPA) which further define the study area
and are the subject of the bi-annual Quality of Life study compiled by the City and County in
association with the UNCC Urban Institute. The Quality of Life study is done every two years with the
2014 edition ready for rollout in early 2015. Consequently, at the time of this study the primary
source for descriptive data is the 2012 Quality of Life Study. The basic geographical unit used in the
Quality of Life study is denoted as the Neighborhood Profile Area (NPA), which is most closely
associated with census block data. The NPAs are not coterminous with generally accepted
neighborhood boundaries; however, neighborhood names that are most closely associated with the
NPAs will be used in the following sections of this report.
The NPAs that are within or influenced by the West Trade/Rozzelles Ferry Road CNIP study area are
as follows:
Planning Cycle 1 – Data Immersion
CNIP – Rozzelles Ferry/West Trade Market Analysis Summary Brief
10
block data. The NPAs are not coterminous with generally accepted neighborhood boundaries; however, neighborhood names that are most closely associated with the NPAs will be used in the following sections of this report.
The NPAs that are within or influenced by the West Trade/Rozzelles Ferry Road CNIP study area are as follows:
NPA Neighborhood 5 Enderly Park 6 Enderly Park 51 Wesley Heights 70 University Park 85 Washington Heights 88 Lakewood 124 Ashley Park and West Boulevard 292 Smallwood 293 Enderly Park 347 Seversville 361 Ashley Park 382 Biddleville
Rozzelles Ferry/West Trade Street Charlotte, NC • Rose & Associates Southeast, Inc. 1010
1.2 Neighborhood AssetsThe neighborhood’s assets can be grouped into five categories:
Planning Cycle 1 – Data Immersion
CNIP – Rozzelles Ferry/West Trade Market Analysis Summary Brief
11
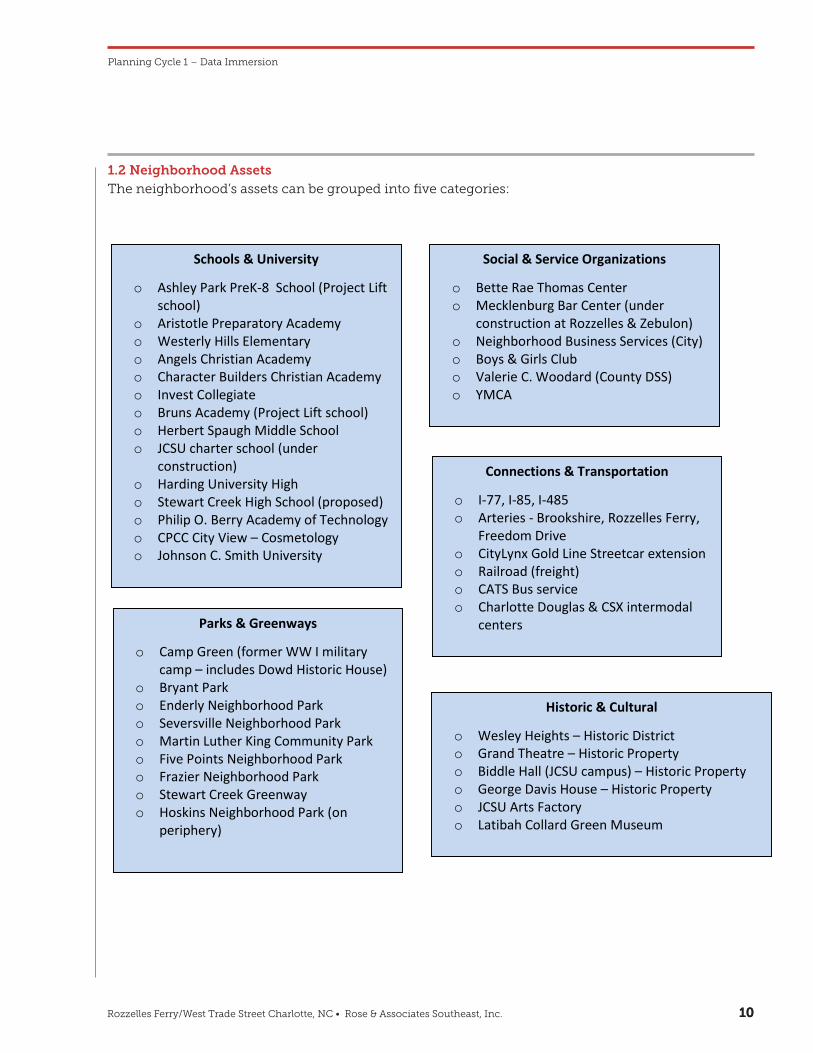
1.2 Neighborhood Assets
The neighborhood’s assets can be grouped into five categories:
Schools & University
o Ashley Park PreK-8 School (Project Lift school)
o Aristotle Preparatory Academy o Westerly Hills Elementary o Angels Christian Academy o Character Builders Christian Academy o Invest Collegiate o Bruns Academy (Project Lift school) o Herbert Spaugh Middle School o JCSU charter school (under
construction) o Harding University High o Stewart Creek High School (proposed) o Philip O. Berry Academy of Technology o CPCC City View – Cosmetology o Johnson C. Smith University
Social & Service Organizations
o Bette Rae Thomas Center o Mecklenburg Bar Center (under
construction at Rozzelles & Zebulon) o Neighborhood Business Services (City) o Boys & Girls Club o Valerie C. Woodard (County DSS) o YMCA
Connections & Transportation
o I-77, I-85, I-485 o Arteries - Brookshire, Rozzelles Ferry,
Freedom Drive o CityLynx Gold Line Streetcar extension o Railroad (freight) o CATS Bus service o Charlotte Douglas & CSX intermodal
centers
Historic & Cultural
o Wesley Heights – Historic District o Grand Theatre – Historic Property o Biddle Hall (JCSU campus) – Historic Property o George Davis House – Historic Property o JCSU Arts Factory o Latibah Collard Green Museum
Parks & Greenways
o Camp Green (former WW I military camp – includes Dowd Historic House)
o Bryant Park o Enderly Neighborhood Park o Seversville Neighborhood Park o Martin Luther King Community Park o Five Points Neighborhood Park o Frazier Neighborhood Park o Stewart Creek Greenway o Hoskins Neighborhood Park (on
periphery)
CNIP – Rozzelles Ferry/West Trade Market Analysis Summary Brief
11
1.2 Neighborhood Assets
The neighborhood’s assets can be grouped into five categories:
Schools & University
o Ashley Park PreK-8 School (Project Lift school)
o Aristotle Preparatory Academy o Westerly Hills Elementary o Angels Christian Academy o Character Builders Christian Academy o Invest Collegiate o Bruns Academy (Project Lift school) o Herbert Spaugh Middle School o JCSU charter school (under
construction) o Harding University High o Stewart Creek High School (proposed) o Philip O. Berry Academy of Technology o CPCC City View – Cosmetology o Johnson C. Smith University
Social & Service Organizations
o Bette Rae Thomas Center o Mecklenburg Bar Center (under
construction at Rozzelles & Zebulon) o Neighborhood Business Services (City) o Boys & Girls Club o Valerie C. Woodard (County DSS) o YMCA
Connections & Transportation
o I-77, I-85, I-485 o Arteries - Brookshire, Rozzelles Ferry,
Freedom Drive o CityLynx Gold Line Streetcar extension o Railroad (freight) o CATS Bus service o Charlotte Douglas & CSX intermodal
centers
Historic & Cultural
o Wesley Heights – Historic District o Grand Theatre – Historic Property o Biddle Hall (JCSU campus) – Historic Property o George Davis House – Historic Property o JCSU Arts Factory o Latibah Collard Green Museum
Parks & Greenways
o Camp Green (former WW I military camp – includes Dowd Historic House)
o Bryant Park o Enderly Neighborhood Park o Seversville Neighborhood Park o Martin Luther King Community Park o Five Points Neighborhood Park o Frazier Neighborhood Park o Stewart Creek Greenway o Hoskins Neighborhood Park (on
periphery)
Rozzelles Ferry/West Trade Street Charlotte, NC • Rose & Associates Southeast, Inc. 1111
1.3 Demographic & Economic Analysis The basic element of any market-driven plan is the demographic makeup of the community, past
trends and future potential growth or contraction. The City of Charlotte, where the CNIP study area is
located, was compared to the region, state and the nation. This includes both Mecklenburg County and
the Charlotte Metropolitan Statistical Area (MSA), which it also serves. The data in this analysis include
2010 US Census data and/or 2014 ESRI estimates which utilize national census data with local updates,
North Carolina state data and other regional/local resources. Data are also compiled from the City and
other state and federal sources. Also included are data from each Neighborhood Profile Area (NPA)
within the study area boundaries, which together, assist in determining projects that would benefit
most from CIP infrastructure investment.
A review of the demographic profile of the study and data collection areas, as compared to other
geographies from the macro to micro level, revealed that the population within the study area overall is:
• Predominately African-American;
• Multigenerational, but skewing toward young millennials;
• Low in household income and educational achievement;
• High in unemployment;
• Predominantly renters;
• More reliant on public transportation than is typical for the City as a whole.
Planning Cycle 1 – Data Immersion CNIP – Rozzelles Ferry/West Trade Market Analysis Summary Brief
12
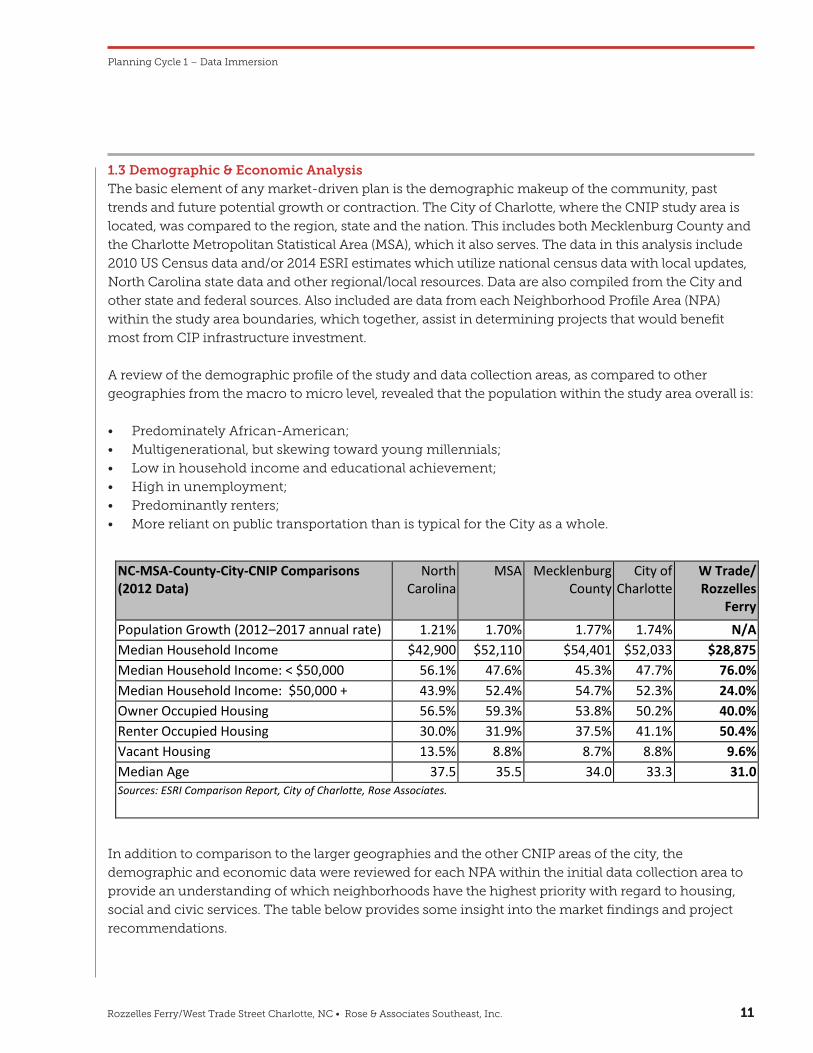
1.3 Demographic & Economic Analysis
The basic element of any market-driven plan is the demographic makeup of the community, past trends and future potential growth or contraction. The City of Charlotte, where the CNIP study area is located, was compared to the region, state and the nation. This includes both Mecklenburg County and the Charlotte Metropolitan Statistical Area (MSA), which it also serves. The data in this analysis include 2010 US Census data and/or 2014 ESRI estimates which utilize national census data with local updates, North Carolina state data and other regional/local resources. Data are also compiled from the City and other state and federal sources. Also included is data from each Neighborhood Profile Area (NPA) within the study area boundaries, which together, assist in determining projects that would benefit most from CIP infrastructure investment. A review of the demographic profile of the study and data collection areas, as compared to other geographies from the macro to micro level, revealed that the population within the study area overall is:
Predominately African-American; Multigenerational, but skewing toward young millennials; Low in household income and educational achievement; High in unemployment; Predominantly renters; More reliant on public transportation than is typical for the City as a whole.
Table 3
NC-MSA-County-City-CNIP Comparisons (2012 Data)
North Carolina
MSA Mecklenburg County
City of Charlotte
W Trade/ Rozzelles
Ferry Population Growth (2012–2017 annual rate) 1.21% 1.70% 1.77% 1.74% N/A Median Household Income $42,900 $52,110 $54,401 $52,033 $28,875 Median Household Income: < $50,000 56.1% 47.6% 45.3% 47.7% 76.0% Median Household Income: $50,000 + 43.9% 52.4% 54.7% 52.3% 24.0% Owner Occupied Housing 56.5% 59.3% 53.8% 50.2% 40.0% Renter Occupied Housing 30.0% 31.9% 37.5% 41.1% 50.4% Vacant Housing 13.5% 8.8% 8.7% 8.8% 9.6% Median Age 37.5 35.5 34.0 33.3 31.0 Sources: ESRI Comparison Report, City of Charlotte, Rose Associates.
In addition to comparison to the larger geographies and the other CNIP areas of the city, the demographic and economic data was reviewed for each NPA within the initial data collection area to provide an understanding of which neighborhoods have the highest priority with regard to housing, social and civic services. The table below provides some insight into the market findings and project recommendations.
In addition to comparison to the larger geographies and the other CNIP areas of the city, the
demographic and economic data were reviewed for each NPA within the initial data collection area to
provide an understanding of which neighborhoods have the highest priority with regard to housing,
social and civic services. The table below provides some insight into the market findings and project
recommendations.
Rozzelles Ferry/West Trade Street Charlotte, NC • Rose & Associates Southeast, Inc. 1212
Planning Cycle 1 – Data Immersion CNIP – Rozzelles Ferry/West Trade Market Analysis Summary Brief
13
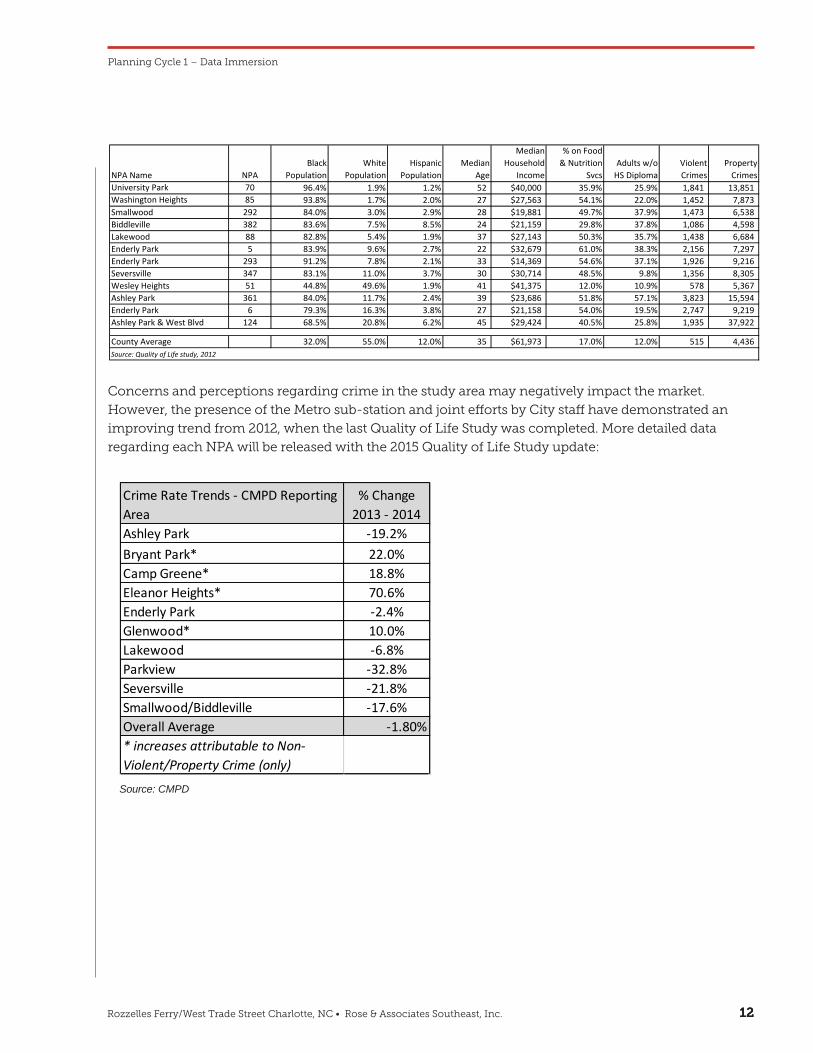
Concerns and perceptions regarding crime in the study area may negatively impact the market. However, the presence of the Metro sub-station and joint efforts by City staff have demonstrated an improving trend from 2012, when the last Quality of Life Study was completed. More detailed data regarding each NPA will be released with the 2015 Quality of Life Study update:
NPA Name NPABlack
PopulationWhite
PopulationHispanic
PopulationMedian
Age
Median Household
Income
% on Food & Nutrition
SvcsAdults w/o
HS DiplomaViolent Crimes
Property Crimes
University Park 70 96.4% 1.9% 1.2% 52 $40,000 35.9% 25.9% 1,841 13,851 Washington Heights 85 93.8% 1.7% 2.0% 27 $27,563 54.1% 22.0% 1,452 7,873 Smallwood 292 84.0% 3.0% 2.9% 28 $19,881 49.7% 37.9% 1,473 6,538 Biddleville 382 83.6% 7.5% 8.5% 24 $21,159 29.8% 37.8% 1,086 4,598 Lakewood 88 82.8% 5.4% 1.9% 37 $27,143 50.3% 35.7% 1,438 6,684 Enderly Park 5 83.9% 9.6% 2.7% 22 $32,679 61.0% 38.3% 2,156 7,297 Enderly Park 293 91.2% 7.8% 2.1% 33 $14,369 54.6% 37.1% 1,926 9,216 Seversville 347 83.1% 11.0% 3.7% 30 $30,714 48.5% 9.8% 1,356 8,305 Wesley Heights 51 44.8% 49.6% 1.9% 41 $41,375 12.0% 10.9% 578 5,367 Ashley Park 361 84.0% 11.7% 2.4% 39 $23,686 51.8% 57.1% 3,823 15,594 Enderly Park 6 79.3% 16.3% 3.8% 27 $21,158 54.0% 19.5% 2,747 9,219 Ashley Park & West Blvd 124 68.5% 20.8% 6.2% 45 $29,424 40.5% 25.8% 1,935 37,922
County Average 32.0% 55.0% 12.0% 35 $61,973 17.0% 12.0% 515 4,436 Source: Quality of Life study, 2012
Crime Rate Trends - CMPD Reporting Area
% Change 2013 - 2014
Ashley Park -19.2%Bryant Park* 22.0%Camp Greene* 18.8%Eleanor Heights* 70.6%Enderly Park -2.4%Glenwood* 10.0%Lakewood -6.8%Parkview -32.8%Seversville -21.8%Smallwood/Biddleville -17.6%Overall Average -1.80%* increases attributable to Non-Violent/Property Crime (only)
Concerns and perceptions regarding crime in the study area may negatively impact the market.
However, the presence of the Metro sub-station and joint efforts by City staff have demonstrated an
improving trend from 2012, when the last Quality of Life Study was completed. More detailed data
regarding each NPA will be released with the 2015 Quality of Life Study update:
CNIP – Rozzelles Ferry/West Trade Market Analysis Summary Brief
13
Concerns and perceptions regarding crime in the study area may negatively impact the market. However, the presence of the Metro sub-station and joint efforts by City staff have demonstrated an improving trend from 2012, when the last Quality of Life Study was completed. More detailed data regarding each NPA will be released with the 2015 Quality of Life Study update:
NPA Name NPABlack
PopulationWhite
PopulationHispanic
PopulationMedian
Age
Median Household
Income
% on Food & Nutrition
SvcsAdults w/o
HS DiplomaViolent Crimes
Property Crimes
University Park 70 96.4% 1.9% 1.2% 52 $40,000 35.9% 25.9% 1,841 13,851 Washington Heights 85 93.8% 1.7% 2.0% 27 $27,563 54.1% 22.0% 1,452 7,873 Smallwood 292 84.0% 3.0% 2.9% 28 $19,881 49.7% 37.9% 1,473 6,538 Biddleville 382 83.6% 7.5% 8.5% 24 $21,159 29.8% 37.8% 1,086 4,598 Lakewood 88 82.8% 5.4% 1.9% 37 $27,143 50.3% 35.7% 1,438 6,684 Enderly Park 5 83.9% 9.6% 2.7% 22 $32,679 61.0% 38.3% 2,156 7,297 Enderly Park 293 91.2% 7.8% 2.1% 33 $14,369 54.6% 37.1% 1,926 9,216 Seversville 347 83.1% 11.0% 3.7% 30 $30,714 48.5% 9.8% 1,356 8,305 Wesley Heights 51 44.8% 49.6% 1.9% 41 $41,375 12.0% 10.9% 578 5,367 Ashley Park 361 84.0% 11.7% 2.4% 39 $23,686 51.8% 57.1% 3,823 15,594 Enderly Park 6 79.3% 16.3% 3.8% 27 $21,158 54.0% 19.5% 2,747 9,219 Ashley Park & West Blvd 124 68.5% 20.8% 6.2% 45 $29,424 40.5% 25.8% 1,935 37,922
County Average 32.0% 55.0% 12.0% 35 $61,973 17.0% 12.0% 515 4,436 Source: Quality of Life study, 2012
Crime Rate Trends - CMPD Reporting Area
% Change 2013 - 2014
Ashley Park -19.2%Bryant Park* 22.0%Camp Greene* 18.8%Eleanor Heights* 70.6%Enderly Park -2.4%Glenwood* 10.0%Lakewood -6.8%Parkview -32.8%Seversville -21.8%Smallwood/Biddleville -17.6%Overall Average -1.80%* increases attributable to Non-Violent/Property Crime (only)
Source: CMPD
Rozzelles Ferry/West Trade Street Charlotte, NC • Rose & Associates Southeast, Inc. 1313
Generational CohortThe age distribution of the study area can best be defined by generation, which defines age,
socioeconomic and lifestyle characteristics. The study area is dominated by Millennials, followed by
Digitals (youth/children) and Baby Boomers, suggesting a substantial number of multi-generational
households. The table below compares the five CNIP study areas:
Planning Cycle 1 – Data Immersion
Educational AttainmentThe working population age 25+ by educational attainment provides insight into household income and
skills of the local labor force. This is important not only for financial stability, but for attracting business
and entrepreneurship as well. There is much discussion nationally around the “creative class” and the
economic impacts of business and activity regardless of educational attainment. The discussion balances
cultural and lifestyle amenities often described in place-making, with business and entrepreneurial
activities to create and expand a direct economic impact. This debate often takes center stage in areas
where there is imbalance between quality of life, occupational skills and employment opportunities. This
can be addressed through partnership with local education institutions and organizations.
The statistics in the study area illustrate the challenges in this area, particularly around education.
Without additional education and occupational opportunity, financial security will continue to elude a
large percentage of the population and negatively impact housing and commercial real estate within
the study area. The recently formed Economic Mobility Task Force will explore why the City of Charlotte
ranked last among the country’s 50 largest cities when it comes to providing opportunities for the poor
to lift themselves out of poverty. The work of this task force will be important as it relates to this CNIP
study area.
CNIP – Rozzelles Ferry/West Trade Market Analysis Summary Brief
14
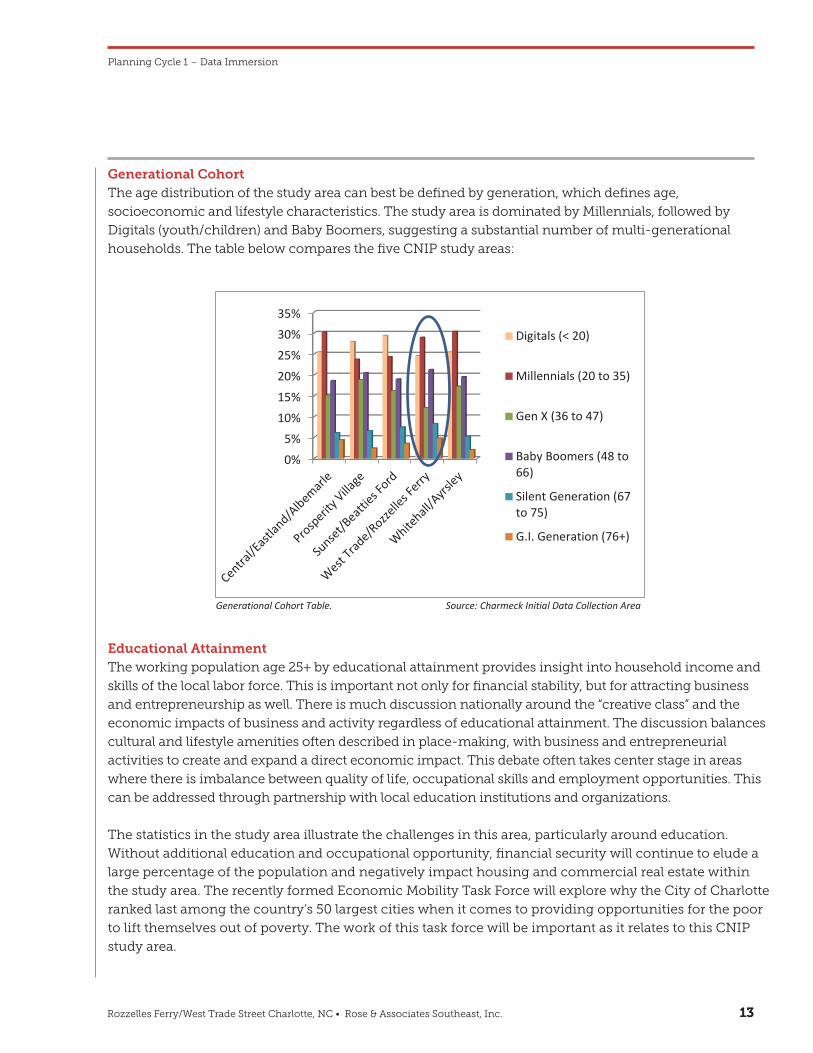
Generational Cohort
The age distribution of the study area can best be defined by generation, which defines age, socioeconomic and lifestyle characteristics. The study area is dominated by Millennials, followed by Digitals (youth/children) and Baby Boomers, suggesting a substantial number of multi-generational households.
Generational Cohort Table. Source: Charmeck Initial Data Collection Area
Educational Attainment The working population age 25+ by educational attainment provides insight into household income and skills of the local labor force. This is important not only for financial stability, but for attracting business and entrepreneurship as well. There is much discussion nationally around the “creative class” and the economic impacts of business and activity regardless of educational attainment. The discussion balances cultural and lifestyle amenities often described in place-making, with business and entrepreneurial activities to create and expand a direct economic impact. This debate often takes center stage in areas where there is imbalance between quality of life, occupational skills and employment opportunities. This can be addressed through partnership with local education institutions and organizations. The statistics in the study area illustrate the challenges in this area, particularly around education. Without additional education and occupational opportunity, financial security will continue to elude a large percentage of the population and negatively impact housing and commercial real estate within the study area. The recently formed Economic Mobility Task Force will explore why the City of Charlotte ranked last among the country’s 50 largest cities when it comes to providing opportunities for the poor to lift themselves out of poverty. The work of this task force will be important as it relates to this CNIP study area.
0%5%
10%15%20%25%30%35%
Digitals (< 20)
Millennials (20 to 35)
Gen X (36 to 47)
Baby Boomers (48 to66)
Silent Generation (67to 75)
G.I. Generation (76+)
Rozzelles Ferry/West Trade Street Charlotte, NC • Rose & Associates Southeast, Inc. 1414
Planning Cycle 1 – Data Immersion
CNIP – Rozzelles Ferry/West Trade Market Analysis Summary Brief
15
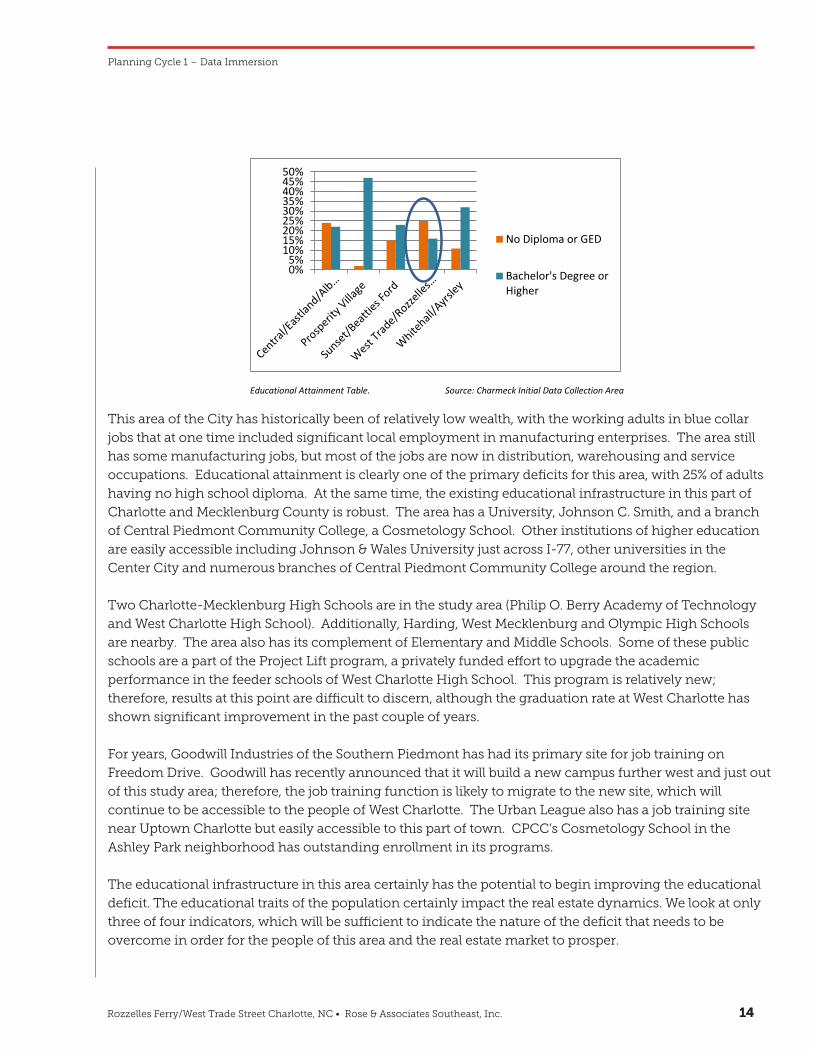
Educational Attainment Table. Source: Charmeck Initial Data Collection Area
This area of the City has historically been of relatively low wealth, with the working adults in blue collar jobs that at one time included significant local employment in manufacturing enterprises. The area still has some manufacturing jobs, but most of the jobs are now in distribution, warehousing and service occupations. Educational attainment is clearly one of the primary deficits for this area, with 25% of adults having no high school diploma. At the same time, the existing educational infrastructure in this part of Charlotte and Mecklenburg County is robust. The area has a University, Johnson C. Smith, and a branch of Central Piedmont Community College, a Cosmetology School. Other institutions of higher education are easily accessible including Johnson & Wales University just across I-77, other universities in the Center City and numerous branches of Central Piedmont Community College around the region.
Two Charlotte-Mecklenburg High Schools are in the study area (Philip O. Berry Academy of Technology and West Charlotte High School). Additionally, Harding, West Mecklenburg and Olympic High Schools are nearby. The area also has its complement of Elementary and Middle Schools. Some of these public schools are a part of the Project Lift program, a privately funded effort to upgrade the academic performance in the feeder schools of West Charlotte High School. This program is relatively new; therefore, results at this point are difficult to discern, although the graduation rate at West Charlotte has shown significant improvement in the past couple of years.
For years, Goodwill Industries of the Southern Piedmont has had its primary site for job training on Freedom Drive. Goodwill has recently announced that it will build a new campus further west and just out of this study area; therefore, the job training function is likely to migrate to the new site, which will continue to be accessible to the people of West Charlotte. The Urban League also has a job training site near Uptown Charlotte but easily accessible to this part of town. CPCC’s Cosmetology School in the Ashley Park neighborhood has outstanding enrollment in its programs.
The educational infrastructure in this area certainly has the potential to begin improving the educational deficit. The educational traits of the population certainly impact the real estate dynamics. We look at only three of four indicators, which will be sufficient to indicate the nature of the deficit that needs to be overcome in order for the people of this area and the real estate market to prosper.
In looking at educational variables, the one that is almost universally agreed upon is that if one does not have a high school diploma or its equivalent, job opportunities and economic mobility are severely restricted. Most agree that the absolute minimum threshold for functioning in the current economy is a high school diploma.
0%5%
10%15%20%25%30%35%40%45%50%
No Diploma or GED
Bachelor's Degree orHigher
This area of the City has historically been of relatively low wealth, with the working adults in blue collar
jobs that at one time included significant local employment in manufacturing enterprises. The area still
has some manufacturing jobs, but most of the jobs are now in distribution, warehousing and service
occupations. Educational attainment is clearly one of the primary deficits for this area, with 25% of adults
having no high school diploma. At the same time, the existing educational infrastructure in this part of
Charlotte and Mecklenburg County is robust. The area has a University, Johnson C. Smith, and a branch
of Central Piedmont Community College, a Cosmetology School. Other institutions of higher education
are easily accessible including Johnson & Wales University just across I-77, other universities in the
Center City and numerous branches of Central Piedmont Community College around the region.
Two Charlotte-Mecklenburg High Schools are in the study area (Philip O. Berry Academy of Technology
and West Charlotte High School). Additionally, Harding, West Mecklenburg and Olympic High Schools
are nearby. The area also has its complement of Elementary and Middle Schools. Some of these public
schools are a part of the Project Lift program, a privately funded effort to upgrade the academic
performance in the feeder schools of West Charlotte High School. This program is relatively new;
therefore, results at this point are difficult to discern, although the graduation rate at West Charlotte has
shown significant improvement in the past couple of years.
For years, Goodwill Industries of the Southern Piedmont has had its primary site for job training on
Freedom Drive. Goodwill has recently announced that it will build a new campus further west and just out
of this study area; therefore, the job training function is likely to migrate to the new site, which will
continue to be accessible to the people of West Charlotte. The Urban League also has a job training site
near Uptown Charlotte but easily accessible to this part of town. CPCC’s Cosmetology School in the
Ashley Park neighborhood has outstanding enrollment in its programs.
The educational infrastructure in this area certainly has the potential to begin improving the educational
deficit. The educational traits of the population certainly impact the real estate dynamics. We look at only
three of four indicators, which will be sufficient to indicate the nature of the deficit that needs to be
overcome in order for the people of this area and the real estate market to prosper.
Rozzelles Ferry/West Trade Street Charlotte, NC • Rose & Associates Southeast, Inc. 1515
In looking at educational variables, the one that is almost universally agreed upon is that if one does not have
a high school diploma or its equivalent, job opportunities and economic mobility are severely restricted.
Most agree that the absolute minimum threshold for functioning in the current economy is a high school
diploma.
The percentage of adults (aged 25 and above) without a high school diploma in Mecklenburg County is 12%.
Ten of the twelve NPAs in our study area are above the county average. In one of the Ashley Park NPAs (361),
57.1% of the adults do not have a high school diploma. In five of the NPAs, between 35.7% and 38.3% do not
have high school diplomas. The three NPAs that are closest to the county average are: Enderly Park (NPA 6)
with 19.5%, Wesley Heights (NPA 51) with 10.9% and Seversville (NPA 347) with 9.8%.
In some parts of North Carolina, educational attainment data like those above are indicative of an aging
population that grew up at a time when a high school diploma was not needed to do work in agriculture or in
the mill. But, the age characteristics of the population in the study area do not reflect this historical trend.
The people in the study area are relatively young, in many cases younger than the Mecklenburg average age,
and Mecklenburg County, itself, has a younger population than most places in the United States.
The low attainment scores are reflecting something else, namely dropping out before graduating from high
school. The county average dropout rate is 3.0%, and four of the twelve NPAs are very close to that average:
Smallwood (NPA 292) 1.6%, University Park (NPA 70) 2.7%, Enderly Park (NPA 293) 3.0%, and Enderly Park
(NPA 5) 3.3%. Six additional NPAs have a dropout rate between 5.1% and 13.5%. The two NPAs that are
substantially above the county norm are Ashley Park (NPA 361) 13.5% and Wesley Heights (NPA 51) 20.0%.
This last number is a surprise, and there is no ready explanation of why such a high average is occurring in
the most rapidly advancing NPA in the study area. While many of the dropout rates remain high, the
increased attention to improving this measure of educational attainment, that is, graduating from high
school, may be successfully moving the dropout numbers more toward the county average, which is
something to celebrate.
There always is a “but,” and in this case, we have a measure of the average number of students who had at
least 10 unexcused absences during the most recent school year. Unexcused absences are viewed as one of
the most powerful precursors to becoming a full-fledged dropout. The county average on this measure is
11.0%. None of our 12 NPAs is at or below the county average. Four of the NPAs have an average 10+
unexcused absence rate in the teens, another 7 NPAs have an average in the 20s and one Seversville (NPA
347) has 32.6% of its students with at least ten unexcused absences. This later number is also a surprise
considering that Seversville is doing relatively well on the other indicators. The bottom line is that with the
kind of absentee rate that is found in these data, the high schools serving this area will continue to be
challenged to keep students enrolled through graduation.
Planning Cycle 1 – Data Immersion
CNIP – Rozzelles Ferry/West Trade Market Analysis Summary Brief
16
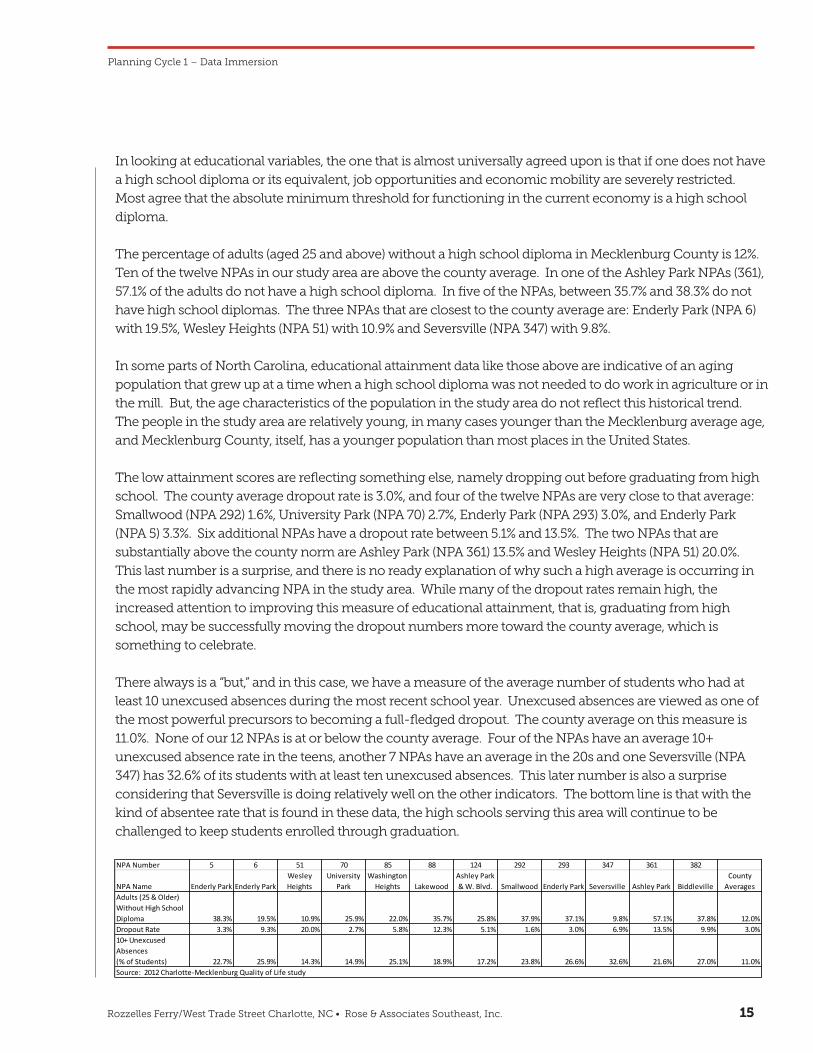
The percentage of adults (aged 25 and above) without a high school diploma in Mecklenburg County is 12%. Ten of the twelve NPAs in our study area are above the county average. In one of the Ashley Park NPAs (361), 57.1% of the adults do not have a high school diploma. In five of the NPAs, between 35.7% and 38.3% do not have high school diplomas. The three NPAs that are closest to the county average are: Enderly Park (NPA 6) with 19.5%, Wesley Heights (NPA 51) with 10.9% and Seversville (NPA 347) with 9.8%.
In some parts of North Carolina, educational attainment data like those above are indicative of an aging population that grew up at a time when a high school diploma was not needed to do work in agriculture or in the mill. But, the age characteristics of the population in the study area do not reflect this historical trend. The people in the study area are relatively young, in many cases younger than the Mecklenburg average age, and Mecklenburg County, itself, has a younger population than most places in the United States.
The low attainment scores are reflecting something else, namely dropping out before graduating from high school. The county average dropout rate is 3.0%, and four of the twelve NPAs are very close to that average: Smallwood (NPA 292) 1.6%, University Park (NPA 70) 2.7%, Enderly Park (NPA 293) 3.0%, and Enderly Park (NPA 5) 3.3%. Six additional NPAs have a dropout rate between 5.1% and 13.5%. The two NPAs that are substantially above the county norm are Ashley Park (NPA 361) 13.5% and Wesley Heights (NPA 51) 20.0%. This last number is a surprise, and there is no ready explanation of why such a high average is occurring in the most rapidly advancing NPA in the study area. While many of the dropout rates remain high, the increased attention to improving this measure of educational attainment, that is, graduating from high school, may be successfully moving the dropout numbers more toward the county average, which is something to celebrate.
There always is a “but,” and in this case, we have a measure of the average number of students who had at least 10 unexcused absences during the most recent school year. Unexcused absences are viewed as one of the most powerful precursors to becoming a full-fledged dropout. The county average on this measure is 11.0%. None of our 12 NPAs is at or below the county average. Four of the NPAs have an average 10+ unexcused absence rate in the teens, another 7 NPAs have an average in the 20s and one Seversville (NPA 347) has 32.6% of its students with at least ten unexcused absences. This later number is also a surprise considering that Seversville is doing relatively well on the other indicators. The bottom line is that with the kind of absentee rate that is found in these data, the high schools serving this area will continue to be challenged to keep students enrolled through graduation.
This part of the City continues to suffer significant educational deficits. Data taken from one point in time, as these are, cannot indicate whether there has been improvement or failure over any period of time. However, over the next few years, comparison data for all schools will be available and will be instrumental in measuring change or the lack thereof over time. This foundational issue needs to be addressed, if the goals to provide mobility for its citizens, and stabilize and improve the economic performance of this area are to be achieved.
NPA Number 5 6 51 70 85 88 124 292 293 347 361 382
NPA Name Enderly Park Enderly ParkWesley Heights
University Park
Washington Heights Lakewood
Ashley Park & W. Blvd. Smallwood Enderly Park Seversville Ashley Park Biddleville
County Averages
Adults (25 & Older) Without High School Diploma 38.3% 19.5% 10.9% 25.9% 22.0% 35.7% 25.8% 37.9% 37.1% 9.8% 57.1% 37.8% 12.0%Dropout Rate 3.3% 9.3% 20.0% 2.7% 5.8% 12.3% 5.1% 1.6% 3.0% 6.9% 13.5% 9.9% 3.0%10+ Unexcused Absences (% of Students) 22.7% 25.9% 14.3% 14.9% 25.1% 18.9% 17.2% 23.8% 26.6% 32.6% 21.6% 27.0% 11.0%Source: 2012 Charlotte-Mecklenburg Quality of Life study
Rozzelles Ferry/West Trade Street Charlotte, NC • Rose & Associates Southeast, Inc. 1616
This part of the City continues to suffer significant educational deficits. Data taken from one point in time,
as these are, cannot indicate whether there has been improvement or failure over any period of time.
However, over the next few years, comparison data for all schools will be available and will be instrumental
in measuring change or the lack thereof over time. This foundational issue needs to be addressed if the
goals to provide mobility for its citizens and stabilize and improve the economic performance of this area
are to be achieved.
Employment and Economic BaseThe Charlotte MSA has recovered substantially based upon employment and population growth over the
past three years. Aside from the sector of the economy – defined by traditional Standard Industry
Classification (SIC) or the more recent North American Industrial Classification (NAICS) – the size or
stage of each company is a factor when determining employment growth and its relationship to real
estate. The overall labor market is improving largely due to startups and small businesses growing and
company relocations. However, according to data from the Edward E. Lowe Foundation, the number of
larger business establishments from 2012-2013 in Mecklenburg County has shrunk, suggesting the
growth of small business in the region. The challenge is to assess both employment and unemployment,
as many workers in the unemployment figures may be no longer seeking a job. Below is snapshot of the
regional labor market including employment by industry sectors:
Planning Cycle 1 – Data Immersion
CNIP – Rozzelles Ferry/West Trade Market Analysis Summary Brief
17
Employment and Economic Base
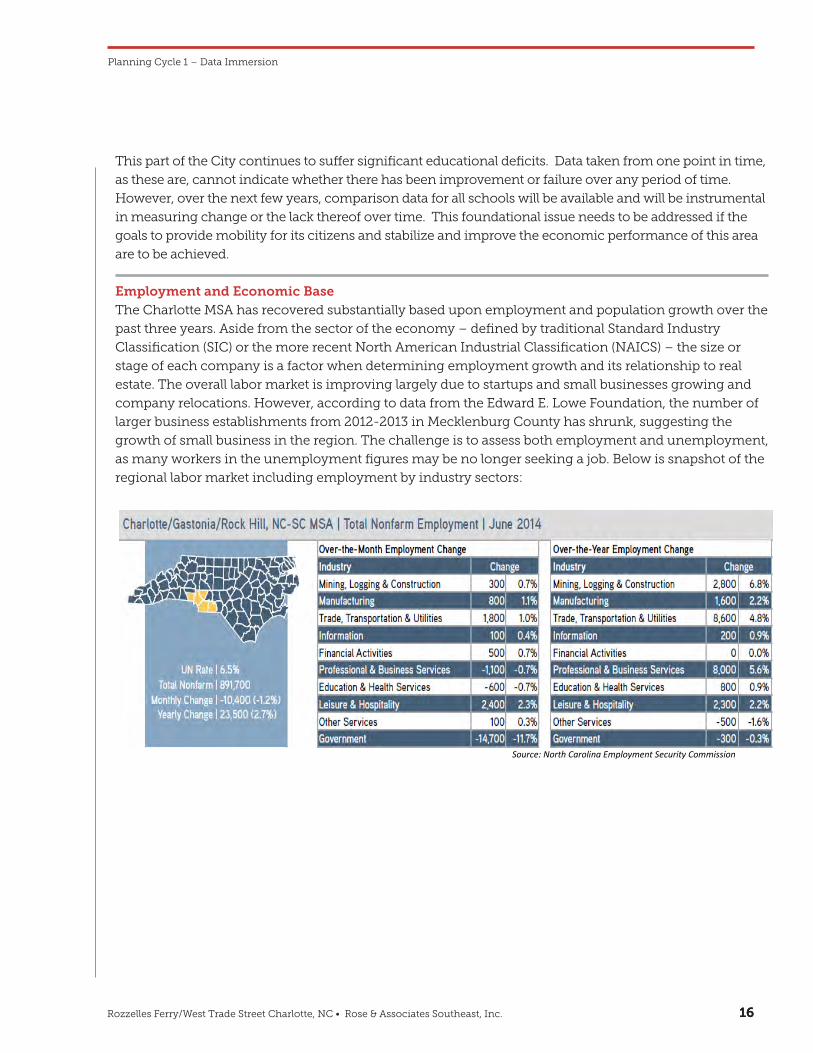
The Charlotte MSA has recovered substantially based upon employment and population growth over the past three years. Aside from the sector of the economy – defined by traditional Standard Industry Classification (SIC) or the more recent North American Industrial Classification (NAICS) – the size or stage of each company is a factor when determining employment growth and its relationship to real estate. The overall labor market is improving, largely due to startups and small businesses growing, and company relocations. However, according to data from the Edward E. Lowe Foundation, the number of larger business establishments from 2012-2013 in Mecklenburg County has shrunk, suggesting the growth of small business in the region. The challenge is to assess both employment and unemployment, as many workers in the unemployment figures maybe no longer seeking a job. Below is snapshot of the regional labor market including employment by industry sectors:
Source: North Carolina Employment Security Commission
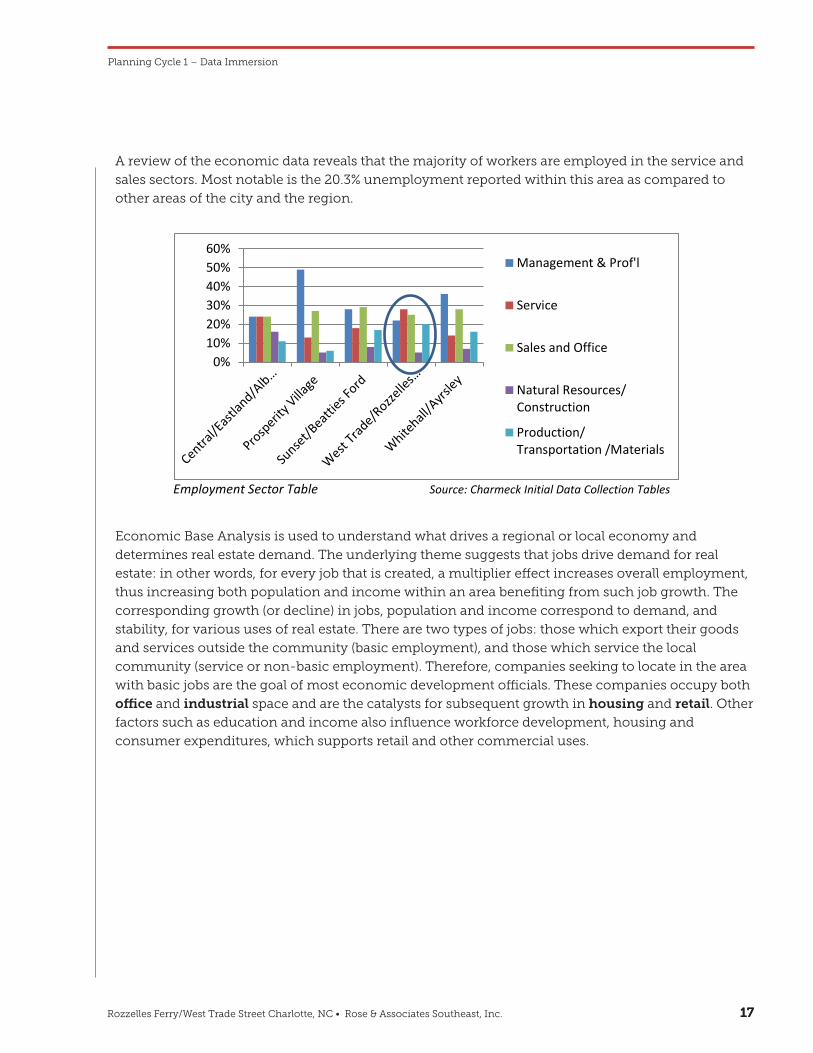
A review of the economic data reveals that the majority of workers are employed in the service and sales sectors. Most notable is the 20.3% unemployment reported within this area as compared to other areas of the city and the region.
Employment Sector Table Source: Charmeck Initial Data Collection Tables
0%10%20%30%40%50%60%
Management & Prof'l
Service
Sales and Office
Natural Resources/Construction
Production/Transportation /Materials
Rozzelles Ferry/West Trade Street Charlotte, NC • Rose & Associates Southeast, Inc. 1717
A review of the economic data reveals that the majority of workers are employed in the service and
sales sectors. Most notable is the 20.3% unemployment reported within this area as compared to
other areas of the city and the region.
Economic Base Analysis is used to understand what drives a regional or local economy and
determines real estate demand. The underlying theme suggests that jobs drive demand for real
estate: in other words, for every job that is created, a multiplier effect increases overall employment,
thus increasing both population and income within an area benefiting from such job growth. The
corresponding growth (or decline) in jobs, population and income correspond to demand, and
stability, for various uses of real estate. There are two types of jobs: those which export their goods
and services outside the community (basic employment), and those which service the local
community (service or non-basic employment). Therefore, companies seeking to locate in the area
with basic jobs are the goal of most economic development officials. These companies occupy both
office and industrial space and are the catalysts for subsequent growth in housing and retail. Other
factors such as education and income also influence workforce development, housing and
consumer expenditures, which supports retail and other commercial uses.
Planning Cycle 1 – Data Immersion
CNIP – Rozzelles Ferry/West Trade Market Analysis Summary Brief
17
Employment and Economic Base
The Charlotte MSA has recovered substantially based upon employment and population growth over the past three years. Aside from the sector of the economy – defined by traditional Standard Industry Classification (SIC) or the more recent North American Industrial Classification (NAICS) – the size or stage of each company is a factor when determining employment growth and its relationship to real estate. The overall labor market is improving, largely due to startups and small businesses growing, and company relocations. However, according to data from the Edward E. Lowe Foundation, the number of larger business establishments from 2012-2013 in Mecklenburg County has shrunk, suggesting the growth of small business in the region. The challenge is to assess both employment and unemployment, as many workers in the unemployment figures maybe no longer seeking a job. Below is snapshot of the regional labor market including employment by industry sectors:
Source: North Carolina Employment Security Commission
A review of the economic data reveals that the majority of workers are employed in the service and sales sectors. Most notable is the 20.3% unemployment reported within this area as compared to other areas of the city and the region.
Employment Sector Table Source: Charmeck Initial Data Collection Tables
0%10%20%30%40%50%60%
Management & Prof'l
Service
Sales and Office
Natural Resources/Construction
Production/Transportation /Materials
Rozzelles Ferry/West Trade Street Charlotte, NC • Rose & Associates Southeast, Inc. 1818
1.4 Economic Base and Real Estate MarketsSuccessful economic development strategies result in job growth. Job growth creates demand for
real estate. These are the result of business recruitment efforts, together with the product availability
that is attracting companies to Charlotte.
The region’s employment location quotient, or percentage of US employment ratios that exceed base
industry standards, identifies which sectors contribute the greatest local job and economic growth.
Those with quotients greater than 1.00 demonstrate higher than US averages and thus contribute to
the local economic base. Sector employment is reported at the State, Metro area and County level.
North Carolina and Mecklenburg County were reviewed and compared. The top-ranked economic
driver for the state is Management of Companies and Enterprises (NAICS 55), followed closely by
Manufacturing (NAICS 31-33). For Mecklenburg County, Management of Companies and Enterprises
is also the strongest driver, followed by Finance and Insurance (NAICS 52) and Information (NAICS
51), the next most dominant industries, which drive office demand.
However, other sectors do not correlate closely with the state. Manufacturing is not a primary driver
at the county level; however, transportation and warehousing does create demand for warehouse
and distribution space serving a growing logistics sector, influenced by the Charlotte Douglas
International Airport and adjacent multi-modal facilities south of the airport. When reviewing the
more detailed subsectors, the influence of local industries becomes even more apparent: Data
Processing, Air Transportation, and Broadcasting emerge as the drivers in Mecklenburg County’s
economy, rather than the state’s traditional industries relating to textiles and furniture. The dominate
sector fueling employment within the study area is Transportation and Warehousing – evidenced by
the number of industrial properties within the CNIP.
Planning Cycle 1 – Data Immersion
Rozzelles Ferry/West Trade Street Charlotte, NC • Rose & Associates Southeast, Inc. 1919
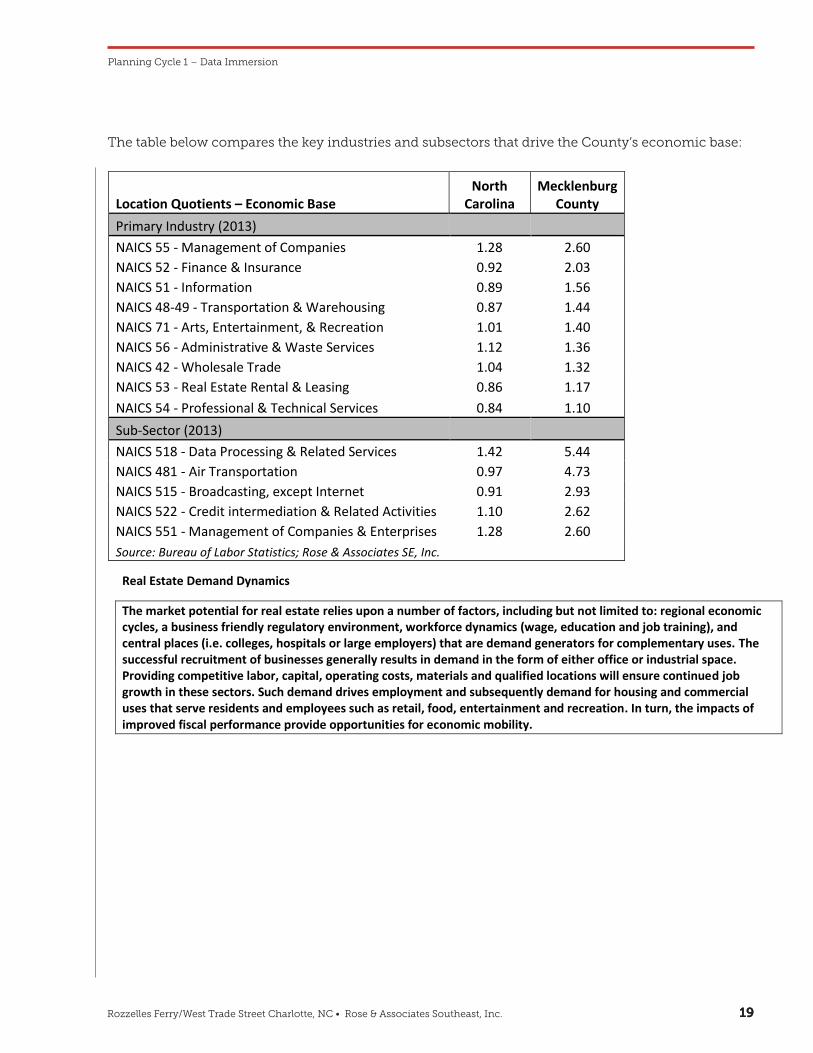
The table below compares the key industries and subsectors that drive the County’s economic base:
Planning Cycle 1 – Data Immersion
CNIP – Rozzelles Ferry/West Trade Market Analysis Summary Brief
19
The table below compares the key industries and subsectors that drive the County’s economic base:
Location Quotients – Economic Base North
Carolina Mecklenburg
County Primary Industry (2013) NAICS 55 - Management of Companies 1.28 2.60 NAICS 52 - Finance & Insurance 0.92 2.03 NAICS 51 - Information 0.89 1.56 NAICS 48-49 - Transportation & Warehousing 0.87 1.44 NAICS 71 - Arts, Entertainment, & Recreation 1.01 1.40 NAICS 56 - Administrative & Waste Services 1.12 1.36 NAICS 42 - Wholesale Trade 1.04 1.32 NAICS 53 - Real Estate Rental & Leasing 0.86 1.17 NAICS 54 - Professional & Technical Services 0.84 1.10 Sub-Sector (2013) NAICS 518 - Data Processing & Related Services 1.42 5.44 NAICS 481 - Air Transportation 0.97 4.73 NAICS 515 - Broadcasting, except Internet 0.91 2.93 NAICS 522 - Credit intermediation & Related Activities 1.10 2.62 NAICS 551 - Management of Companies & Enterprises 1.28 2.60 Source: Bureau of Labor Statistics; Rose & Associates SE, Inc.
Real Estate Demand Dynamics
The market potential for real estate relies upon a number of factors, including but not limited to: regional economic cycles, a business friendly regulatory environment, workforce dynamics (wage, education and job training), and central places (i.e. colleges, hospitals or large employers) that are demand generators for complementary uses. The successful recruitment of businesses generally results in demand in the form of either office or industrial space. Providing competitive labor, capital, operating costs, materials and qualified locations will ensure continued job growth in these sectors. Such demand drives employment and subsequently demand for housing and commercial uses that serve residents and employees such as retail, food, entertainment and recreation. In turn, the impacts of improved fiscal performance provide opportunities for economic mobility.
1.5 Land Use Demand – Office
Existing Supply & Pricing
The West Trade/Rozzelles Ferry study area is located within the North office submarket of the Charlotte region, which includes the suburban communities of Huntersville, Cornelius, and Davidson. Although this is a large area geographically, it is relatively small in terms of the quantity of developed space. It must also be kept in mind that inclusion of the northern suburbs, with their recently constructed general and medical office complexes, produces a more favorable
Rozzelles Ferry/West Trade Street Charlotte, NC • Rose & Associates Southeast, Inc. 2020
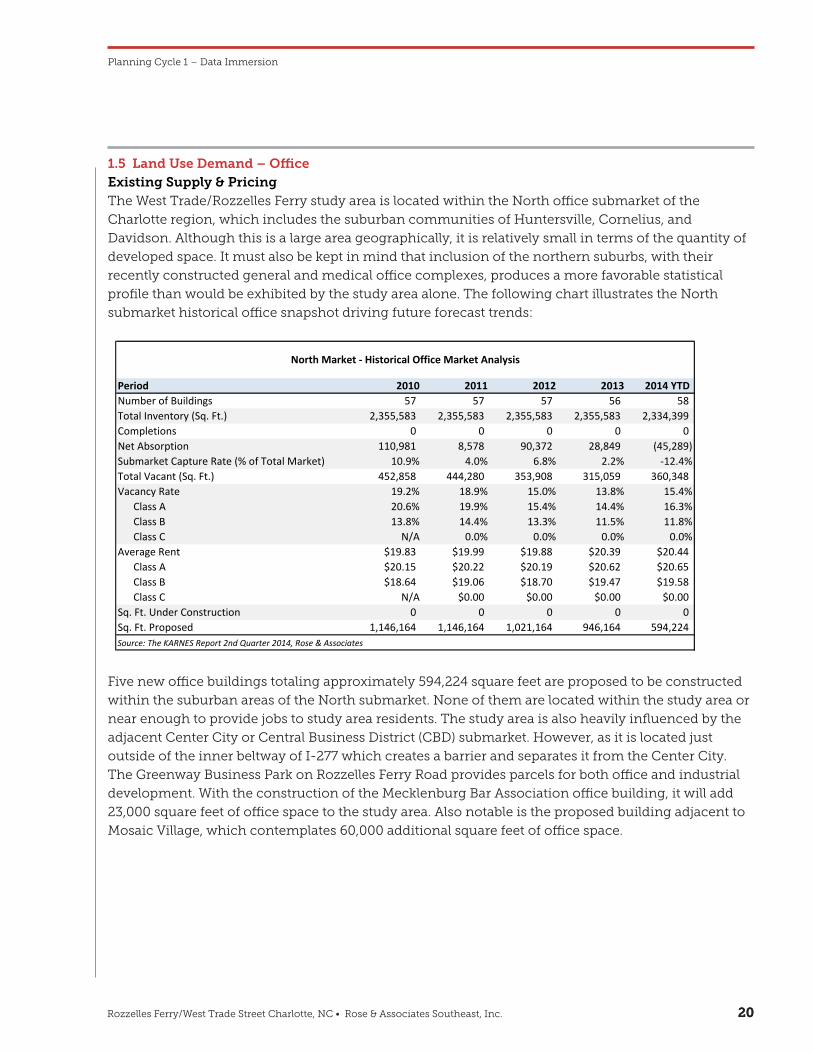
1.5 Land Use Demand – Office Existing Supply & PricingThe West Trade/Rozzelles Ferry study area is located within the North office submarket of the
Charlotte region, which includes the suburban communities of Huntersville, Cornelius, and
Davidson. Although this is a large area geographically, it is relatively small in terms of the quantity of
developed space. It must also be kept in mind that inclusion of the northern suburbs, with their
recently constructed general and medical office complexes, produces a more favorable statistical
profile than would be exhibited by the study area alone. The following chart illustrates the North
submarket historical office snapshot driving future forecast trends:
Five new office buildings totaling approximately 594,224 square feet are proposed to be constructed
within the suburban areas of the North submarket. None of them are located within the study area or
near enough to provide jobs to study area residents. The study area is also heavily influenced by the
adjacent Center City or Central Business District (CBD) submarket. However, as it is located just
outside of the inner beltway of I-277 which creates a barrier and separates it from the Center City.
The Greenway Business Park on Rozzelles Ferry Road provides parcels for both office and industrial
development. With the construction of the Mecklenburg Bar Association office building, it will add
23,000 square feet of office space to the study area. Also notable is the proposed building adjacent to
Mosaic Village, which contemplates 60,000 additional square feet of office space.
Planning Cycle 1 – Data Immersion
CNIP – Rozzelles Ferry/West Trade Market Analysis Summary Brief
20
statistical profile than would be exhibited by the study area alone. The following chart illustrates the North submarket historical office snapshot driving future forecast trends:
Five new office buildings totaling approximately 594,224 square feet are proposed to be constructed within the suburban areas of the North submarket. None of them are located within the study area, or near enough to provide jobs to study area residents. The study area is also heavily influenced by the Center City or Central Business District (CBD) market, as it is located just outside of the inner beltway of I-277. The Greenway Business Park on Rozzelles Ferry Road provides parcels for both office and industrial development. With the construction of the Mecklenburg Bar Association office building, it will add 23,000 square feet of office space to the study area. Also notable is the proposed building adjacent to Mosaic Village, which contemplates 60,000 square feet of office space adjacent to the existing parking deck.
Period 2010 2011 2012 2013 2014 YTD Number of Buildings 57 57 57 56 58 Total Inventory (Sq. Ft.) 2,355,583 2,355,583 2,355,583 2,355,583 2,334,399 Completions 0 0 0 0 0Net Absorption 110,981 8,578 90,372 28,849 (45,289) Submarket Capture Rate (% of Total Market) 10.9% 4.0% 6.8% 2.2% -12.4%Total Vacant (Sq. Ft.) 452,858 444,280 353,908 315,059 360,348 Vacancy Rate 19.2% 18.9% 15.0% 13.8% 15.4%
Class A 20.6% 19.9% 15.4% 14.4% 16.3%Class B 13.8% 14.4% 13.3% 11.5% 11.8%Class C N/A 0.0% 0.0% 0.0% 0.0%
Average Rent $19.83 $19.99 $19.88 $20.39 $20.44Class A $20.15 $20.22 $20.19 $20.62 $20.65Class B $18.64 $19.06 $18.70 $19.47 $19.58Class C N/A $0.00 $0.00 $0.00 $0.00
Sq. Ft. Under Construction 0 0 0 0 0Sq. Ft. Proposed 1,146,164 1,146,164 1,021,164 946,164 594,224
North Market - Historical Office Market Analysis
Source: The KARNES Report 2nd Quarter 2014, Rose & Associates
Rozzelles Ferry/West Trade Street Charlotte, NC • Rose & Associates Southeast, Inc. 2121
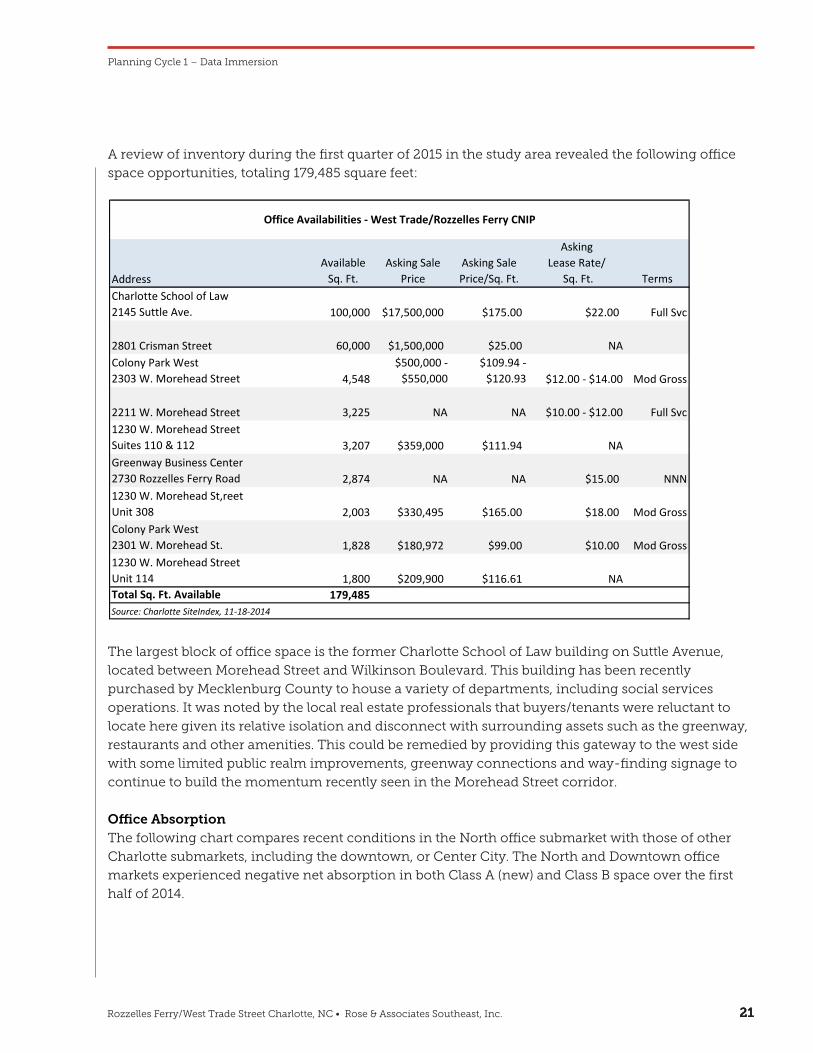
A review of inventory during the first quarter of 2015 in the study area revealed the following office
space opportunities, totaling 179,485 square feet:
The largest block of office space is the former Charlotte School of Law building on Suttle Avenue,
located between Morehead Street and Wilkinson Boulevard. This building has been recently
purchased by Mecklenburg County to house a variety of departments, including social services
operations. It was noted by the local real estate professionals that buyers/tenants were reluctant to
locate here given its relative isolation and disconnect with surrounding assets such as the greenway,
restaurants and other amenities. This could be remedied by providing this gateway to the west side
with some limited public realm improvements, greenway connections and way-finding signage to
continue to build the momentum recently seen in the Morehead Street corridor.
Office AbsorptionThe following chart compares recent conditions in the North office submarket with those of other
Charlotte submarkets, including the downtown, or Center City. The North and Downtown office
markets experienced negative net absorption in both Class A (new) and Class B space over the first
half of 2014.
Planning Cycle 1 – Data Immersion
CNIP – Rozzelles Ferry/West Trade Market Analysis Summary Brief
21
A review of inventory during the first quarter of 2015 in the study area revealed the following office space opportunities, totaling 179,485 square feet:
The largest block of office space is the former Charlotte School of Law building on Suttle Avenue, which is located between Morehead Street and Wilkinson Boulevard. This building has been recently purchased by Mecklenburg County, to house a variety of departments, including social services operations. In the past, it was noted by the local real estate professionals that buyers/tenants are reluctant, given its relative isolation and disconnect with surrounding assets such as the greenway, restaurants and other amenities. This could be remedied by providing this gateway to the west side some limited public realm improvements, greenway connections and way-finding signage to continue to build the momentum recently seen in the Morehead Street corridor.
Office Absorption
The following chart compares recent conditions in the North office submarket with those of other Charlotte submarkets, including the downtown, or Center City. The North and Downtown office markets experienced negative net absorption in both Class A (new) and Class B space over the first half of 2014.
AddressAvailable
Sq. Ft.Asking Sale
PriceAsking Sale Price/Sq. Ft.
Asking Lease Rate/
Sq. Ft. TermsCharlotte School of Law2145 Suttle Ave. 100,000 $17,500,000 $175.00 $22.00 Full Svc
2801 Crisman Street 60,000 $1,500,000 $25.00 NAColony Park West2303 W. Morehead Street 4,548
$500,000 -$550,000
$109.94 -$120.93 $12.00 - $14.00 Mod Gross
2211 W. Morehead Street 3,225 NA NA $10.00 - $12.00 Full Svc1230 W. Morehead StreetSuites 110 & 112 3,207 $359,000 $111.94 NAGreenway Business Center2730 Rozzelles Ferry Road 2,874 NA NA $15.00 NNN1230 W. Morehead St,reetUnit 308 2,003 $330,495 $165.00 $18.00 Mod GrossColony Park West2301 W. Morehead St. 1,828 $180,972 $99.00 $10.00 Mod Gross1230 W. Morehead Street Unit 114 1,800 $209,900 $116.61 NATotal Sq. Ft. Available 179,485 Source: Charlotte SiteIndex, 11-18-2014
Office Availabilities - West Trade/Rozzelles Ferry CNIP
Rozzelles Ferry/West Trade Street Charlotte, NC • Rose & Associates Southeast, Inc. 2222
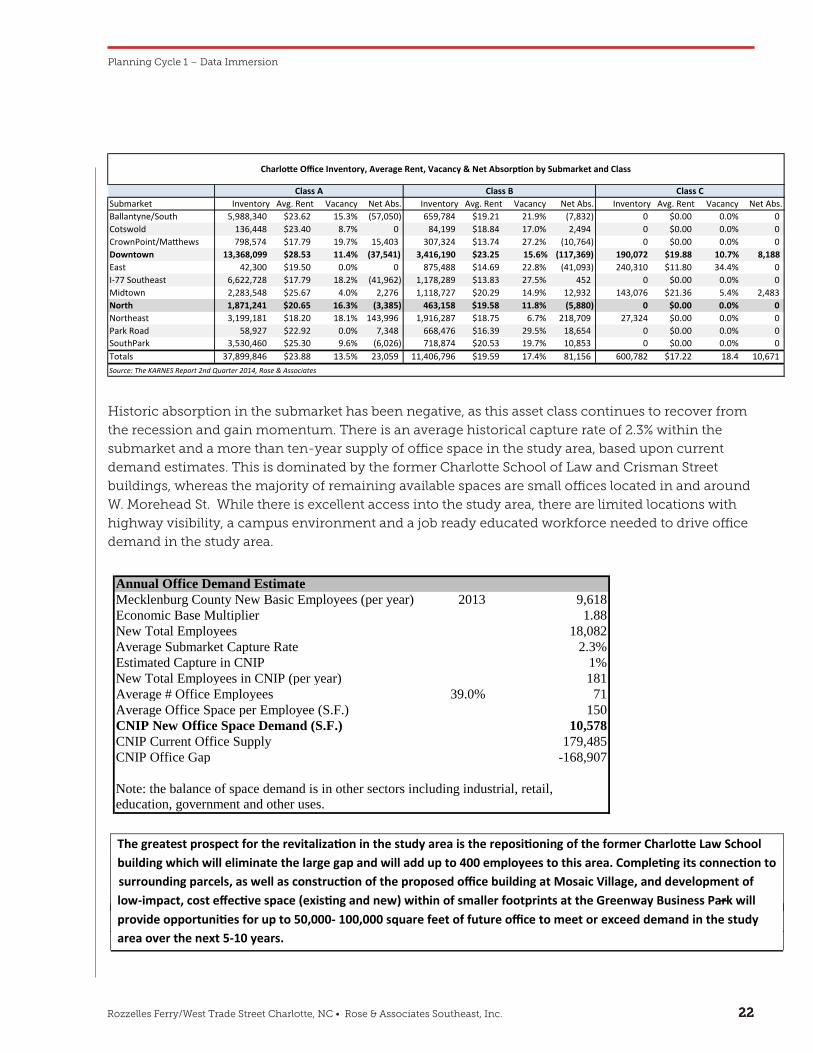
Historic absorption in the submarket has been negative, as this asset class continues to recover from
the recession and gain momentum. There is an average historical capture rate of 2.3% within the
submarket and a more than ten-year supply of office space in the study area, based upon current
demand estimates. This is dominated by the former Charlotte School of Law and Crisman Street
buildings, whereas the majority of remaining available spaces are small offices located in and around
W. Morehead St. While there is excellent access into the study area, there are limited locations with
highway visibility, a campus environment and a job ready educated workforce needed to drive office
demand in the study area.
Planning Cycle 1 – Data Immersion
CNIP – Rozzelles Ferry/West Trade Market Analysis Summary Brief
22
Historic absorption in the submarket has been negative, as this asset class continues to recover from the recession and gain momentum. There is an average historical capture rate of 2.3% within the submarket and a more than ten-year supply of office space in the study area, based upon current demand estimates. This is dominated by the former Charlotte School of Law and Crisman Street buildings, while the majority of remaining available spaces are small offices located in and around W. Morehead St. While there is excellent access into the study area, there are limited locations with highway visibility, a campus environment and a job ready educated workforce needed to drive office demand in the study area.
The greatest prospect for the revitalization in the study area is the repositioning of the former Charlotte Law School building which will eliminate the large gap and will add up to 400 employees to this area. Completing its connection to surrounding parcels, as well as construction of the proposed office building at Mosaic Village, and development of low-impact, cost effective space (existing and new) within of smaller footprints at the Greenway Business Park will–provide opportunities for up to 50,000- 100,000 square feet of future office to meet or exceed demand in the studyarea over the next 5-10 years.
Submarket Inventory Avg. Rent Vacancy Net Abs. Inventory Avg. Rent Vacancy Net Abs. Inventory Avg. Rent Vacancy Net Abs.Ballantyne/South 5,988,340 $23.62 15.3% (57,050) 659,784 $19.21 21.9% (7,832) 0 $0.00 0.0% 0Cotswold 136,448 $23.40 8.7% 0 84,199 $18.84 17.0% 2,494 0 $0.00 0.0% 0CrownPoint/Matthews 798,574 $17.79 19.7% 15,403 307,324 $13.74 27.2% (10,764) 0 $0.00 0.0% 0Downtown 15.6% (117,369) 190,072 $19.88 10.7% 8,188East 42,300 $19.50 0.0% 0 875,488 $14.69 22.8% (41,093) 240,310 $11.80 34.4% 0I-77 Southeast 6,622,728 $17.79 18.2% (41,962) 1,178,289 $13.83 27.5% 452 0 $0.00 0.0% 0Midtown 2,283,548 $25.67 4.0% 2,276 1,118,727 $20.29 14.9% 12,932 143,076 $21.36 5.4% 2,483North 1,871,241 $20.65 16.3% (3,385) 463,158 $19.58 11.8% (5,880) 0 $0.00 0.0% 0Northeast 3,199,181 $18.20 18.1% 143,996 1,916,287 $18.75 6.7% 218,709 27,324 $0.00 0.0% 0Park Road 58,927 $22.92 0.0% 7,348 668,476 $16.39 29.5% 18,654 0 $0.00 0.0% 0SouthPark 3,530,460 $25.30 9.6% (6,026) 718,874 $20.53 19.7% 10,853 0 $0.00 0.0% 0Totals 648,998,73 697,604,11950,32%5.3188.32$ $19.59 17.4% 81,156 600,782 $17.22 18.4 10,671
Charlotte Office Inventory, Average Rent, Vacancy & Net Absorption by Submarket and Class
Class A Class B Class C
Source: The KARNES Report 2nd Quarter 2014, Rose & Associates
Annual Office Demand EstimateMecklenburg County New Basic Employees (per year) 2013 9,618Economic Base Multiplier 1.88New Total Employees 18,082Average Submarket Capture Rate 2.3%Estimated Capture in CNIP 1%New Total Employees in CNIP (per year) 181Average # Office Employees 39.0% 71Average Office Space per Employee (S.F.) 150CNIP New Office Space Demand (S.F.) 10,578CNIP Current Office Supply 179,485CNIP Office Gap -168,907
Note: the balance of space demand is in other sectors including industrial, retail,education, government and other uses.
CNIP – Rozzelles Ferry/West Trade Market Analysis Summary Brief
22
Historic absorption in the submarket has been negative, as this asset class continues to recover from the recession and gain momentum. There is an average historical capture rate of 2.3% within the submarket and a more than ten-year supply of office space in the study area, based upon current demand estimates. This is dominated by the former Charlotte School of Law and Crisman Street buildings, while the majority of remaining available spaces are small offices located in and around W. Morehead St. While there is excellent access into the study area, there are limited locations with highway visibility, a campus environment and a job ready educated workforce needed to drive office demand in the study area.
The greatest prospect for the revitalization in the study area is the repositioning of the former Charlotte Law School building which will eliminate the large gap. Completing its connection to surrounding parcels, as well as construction of the proposed office building at Mosaic Village, and development of low-impact, cost effective space (existing and new) within of smaller footprints at the Greenway Business Park will provide opportunities for up to 50,000 – 100,000 square feet of future office to meet or exceed demand in the study area over the next 5-10 years.
Submarket Inventory Avg. Rent Vacancy Net Abs. Inventory Avg. Rent Vacancy Net Abs. Inventory Avg. Rent Vacancy Net Abs.Ballantyne/South 5,988,340 $23.62 15.3% (57,050) 659,784 $19.21 21.9% (7,832) 0 $0.00 0.0% 0Cotswold 136,448 $23.40 8.7% 0 84,199 $18.84 17.0% 2,494 0 $0.00 0.0% 0CrownPoint/Matthews 798,574 $17.79 19.7% 15,403 307,324 $13.74 27.2% (10,764) 0 $0.00 0.0% 0Downtown 13,368,099 $28.53 11.4% (37,541) 3,416,190 $23.25 15.6% (117,369) 190,072 $19.88 10.7% 8,188East 42,300 $19.50 0.0% 0 875,488 $14.69 22.8% (41,093) 240,310 $11.80 34.4% 0I-77 Southeast 6,622,728 $17.79 18.2% (41,962) 1,178,289 $13.83 27.5% 452 0 $0.00 0.0% 0Midtown 2,283,548 $25.67 4.0% 2,276 1,118,727 $20.29 14.9% 12,932 143,076 $21.36 5.4% 2,483North 1,871,241 $20.65 16.3% (3,385) 463,158 $19.58 11.8% (5,880) 0 $0.00 0.0% 0Northeast 3,199,181 $18.20 18.1% 143,996 1,916,287 $18.75 6.7% 218,709 27,324 $0.00 0.0% 0Park Road 58,927 $22.92 0.0% 7,348 668,476 $16.39 29.5% 18,654 0 $0.00 0.0% 0SouthPark 3,530,460 $25.30 9.6% (6,026) 718,874 $20.53 19.7% 10,853 0 $0.00 0.0% 0Totals 37,899,846 $23.88 13.5% 23,059 11,406,796 $19.59 17.4% 81,156 600,782 $17.22 18.4 10,671
Charlotte Office Inventory, Average Rent, Vacancy & Net Absorption by Submarket and Class
Class A Class B Class C
Source: The KARNES Report 2nd Quarter 2014, Rose & Associates
Annual Office Demand EstimateMecklenburg County New Basic Employees (per year) 2013 9,618Economic Base Multiplier 1.88New Total Employees 18,082Average Submarket Capture Rate 2.3%Estimated Capture in CNIP 1%New Total Employees in CNIP (per year) 181Average # Office Employees 39.0% 71Average Office Space per Employee (S.F.) 150CNIP New Office Space Demand (S.F.) 10,578CNIP Current Office Supply 179,485CNIP Office Gap -168,907
Note: the balance of space demand is in other sectors including industrial, retail,education, government and other uses.
CNIP – Rozzelles Ferry/West Trade Market Analysis Summary Brief
22
Historic absorption in the submarket has been negative, as this asset class continues to recover from the recession and gain momentum. There is an average historical capture rate of 2.3% within the submarket and a more than ten-year supply of office space in the study area, based upon current demand estimates. This is dominated by the former Charlotte School of Law and Crisman Street buildings, while the majority of remaining available spaces are small offices located in and around W. Morehead St. While there is excellent access into the study area, there are limited locations with highway visibility, a campus environment and a job ready educated workforce needed to drive office demand in the study area.
The greatest prospect for the revitalization in the study area is the repositioning of the former Charlotte Law School building which will eliminate the large gap and will add up to 400 employees to this area. Completing its connection to surrounding parcels, as well as construction of the proposed office building at Mosaic Village, and development of low-impact, cost effective space (existing and new) within of smaller footprints at the Greenway Business Park will–provide opportunities for up to 50,000- 100,000 square feet of future office to meet or exceed demand in the studyarea over the next 5-10 years.
Submarket Inventory Avg. Rent Vacancy Net Abs. Inventory Avg. Rent Vacancy Net Abs. Inventory Avg. Rent Vacancy Net Abs.Ballantyne/South 5,988,340 $23.62 15.3% (57,050) 659,784 $19.21 21.9% (7,832) 0 $0.00 0.0% 0Cotswold 136,448 $23.40 8.7% 0 84,199 $18.84 17.0% 2,494 0 $0.00 0.0% 0CrownPoint/Matthews 798,574 $17.79 19.7% 15,403 307,324 $13.74 27.2% (10,764) 0 $0.00 0.0% 0Downtown 15.6% (117,369) 190,072 $19.88 10.7% 8,188East 42,300 $19.50 0.0% 0 875,488 $14.69 22.8% (41,093) 240,310 $11.80 34.4% 0I-77 Southeast 6,622,728 $17.79 18.2% (41,962) 1,178,289 $13.83 27.5% 452 0 $0.00 0.0% 0Midtown 2,283,548 $25.67 4.0% 2,276 1,118,727 $20.29 14.9% 12,932 143,076 $21.36 5.4% 2,483North 1,871,241 $20.65 16.3% (3,385) 463,158 $19.58 11.8% (5,880) 0 $0.00 0.0% 0Northeast 3,199,181 $18.20 18.1% 143,996 1,916,287 $18.75 6.7% 218,709 27,324 $0.00 0.0% 0Park Road 58,927 $22.92 0.0% 7,348 668,476 $16.39 29.5% 18,654 0 $0.00 0.0% 0SouthPark 3,530,460 $25.30 9.6% (6,026) 718,874 $20.53 19.7% 10,853 0 $0.00 0.0% 0Totals 648,998,73 697,604,11950,32%5.3188.32$ $19.59 17.4% 81,156 600,782 $17.22 18.4 10,671
Charlotte Office Inventory, Average Rent, Vacancy & Net Absorption by Submarket and Class
Class A Class B Class C
Source: The KARNES Report 2nd Quarter 2014, Rose & Associates
Annual Office Demand EstimateMecklenburg County New Basic Employees (per year) 2013 9,618Economic Base Multiplier 1.88New Total Employees 18,082Average Submarket Capture Rate 2.3%Estimated Capture in CNIP 1%New Total Employees in CNIP (per year) 181Average # Office Employees 39.0% 71Average Office Space per Employee (S.F.) 150CNIP New Office Space Demand (S.F.) 10,578CNIP Current Office Supply 179,485CNIP Office Gap -168,907
Note: the balance of space demand is in other sectors including industrial, retail,education, government and other uses.
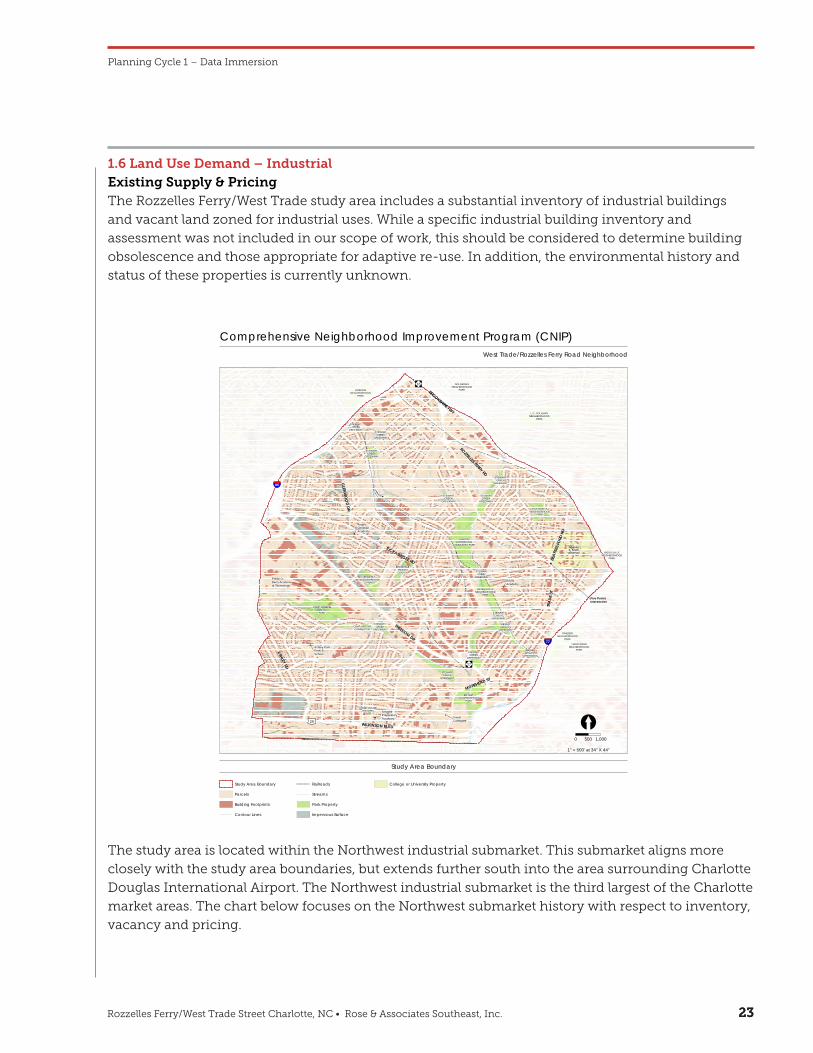
Rozzelles Ferry/West Trade Street Charlotte, NC • Rose & Associates Southeast, Inc. 2323
1.6 Land Use Demand – Industrial Existing Supply & PricingThe Rozzelles Ferry/West Trade study area includes a substantial inventory of industrial buildings
and vacant land zoned for industrial uses. While a specific industrial building inventory and
assessment was not included in our scope of work, this should be considered to determine building
obsolescence and those appropriate for adaptive re-use. In addition, the environmental history and
status of these properties is currently unknown.
The study area is located within the Northwest industrial submarket. This submarket aligns more
closely with the study area boundaries, but extends further south into the area surrounding Charlotte
Douglas International Airport. The Northwest industrial submarket is the third largest of the Charlotte
market areas. The chart below focuses on the Northwest submarket history with respect to inventory,
vacancy and pricing.
Planning Cycle 1 – Data Immersion
ÆÖ
ÆÖ
£¤
§̈¦
§̈¦
\
ROZZELLES FERRY RD
GLEN
WO
OD DR
ASHLEY RD
TRA
DE S
T
FREEDOM DR
BROOKSHIRE FWY
WILKINSON BLVD
MOREHEAD ST
TUCKASEEGEE RD BEAT
TIES
FORD
RD
CAMP GREENECOMMUNITY
PARK
MARTINLUTHER KING
COMMUNITY PARK
CAMP GREENECONNECTOR
STEWARTCREEK
GREENWAY
STEWARTCREEK
GREENWAY
STEWARTCREEK
GREENWAY
STEWARTCREEK
GREENWAY
STEWARTCREEK
GREENWAY
STEWARTCREEK
GREENWAY
STEWARTCREEK
GREENWAY
STEWARTCREEK
GREENWAY
STEWARTCREEK
GREENWAY
STEWARTCREEK
GREENWAY
STEWARTCREEK
GREENWAY
WESLEYHEIGHTS
GREENWAY
WESLEYHEIGHTS
GREENWAY
BIDDLEVILLENEIGHBORHOOD
PARK
BRYANTNEIGHBORHOOD
PARK
DOWD HOUSEHISTORIC
SITE
ENDERLYNEIGHBORHOOD
PARK
FIVE POINTSNEIGHBORHOOD
PARK
FRAZIERNEIGHBORHOOD
PARK
HOSKINSNEIGHBORHOOD
PARK
L.C. COLEMANNEIGHBORHOOD
PARK
SEVERSVILLENEIGHBORHOOD
PARK
SOLOMANSNEIGHBORHOOD
PARK
THIRD WARDNEIGHBORHOOD
PARK
BETTE RAETHOMASCENTER
BrunsAcademy
Walter G.Byers School
Phillip O.Berry Academyof Technology
Metro School
Turning PointAcademy
Ashley ParkPreK-8School
AristotlePreparatoryAcademy Invest
Collegiate
AngelsChristianAcademy
Five PointsIntersection
JohnsonC. Smith
University
29
77
85
16
27
Comprehensive Neighborhood Improvement Program (CNIP)
[0 500 1,000
West Trade/Rozzelles Ferry Road Neighborhood
Study Area Boundary
Study Area Boundary
Parcels
Building Footprints
Contour Lines
Streams
Park Property
Railroads
Last Revised: Tuesday, December 9, 2014
Impervious Surface
College or University Property
1" = 500' at 34" X 44"
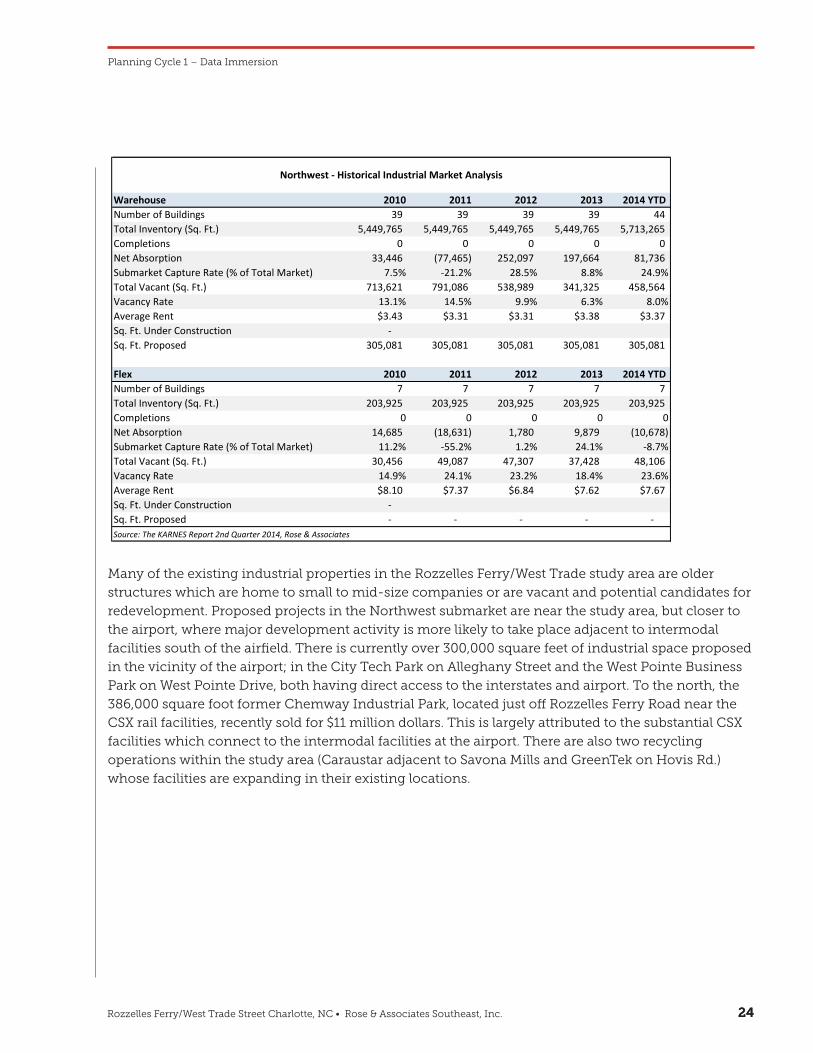
Rozzelles Ferry/West Trade Street Charlotte, NC • Rose & Associates Southeast, Inc. 2424
Many of the existing industrial properties in the Rozzelles Ferry/West Trade study area are older
structures which are home to small to mid-size companies or are vacant and potential candidates for
redevelopment. Proposed projects in the Northwest submarket are near the study area, but closer to
the airport, where major development activity is more likely to take place adjacent to intermodal
facilities south of the airfield. There is currently over 300,000 square feet of industrial space proposed
in the vicinity of the airport; in the City Tech Park on Alleghany Street and the West Pointe Business
Park on West Pointe Drive, both having direct access to the interstates and airport. To the north, the
386,000 square foot former Chemway Industrial Park, located just off Rozzelles Ferry Road near the
CSX rail facilities, recently sold for $11 million dollars. This is largely attributed to the substantial CSX
facilities which connect to the intermodal facilities at the airport. There are also two recycling
operations within the study area (Caraustar adjacent to Savona Mills and GreenTek on Hovis Rd.)
whose facilities are expanding in their existing locations.
Planning Cycle 1 – Data Immersion
CNIP – Rozzelles Ferry/West Trade Market Analysis Summary Brief
23
1.6 Land Use Demand – Industrial
Existing Supply & Pricing
The Rozzelles Ferry/West Trade study area includes a substantial inventory of industrial buildings and vacant land zoned for industrial uses. While a specific industrial building inventory and assessment was not included in our scope of work, this should be considered to determine building obsolescence and those appropriate for adaptive re-use. In addition, the environmental history and status of these properties is currently unknown.
[Stantec – insert map with industrial land uses]
The study area is located within the Northwest industrial submarket. This submarket aligns more closely with the study area boundaries, but extends further south into the area surrounding Charlotte Douglas International Airport. The Northwest industrial submarket is the third largest of the Charlotte market areas. The chart below focuses on the Northwest submarket history with respect to inventory, vacancy and pricing.
Many of the existing industrial properties in the Rozzelles Ferry/West Trade study area are older structures which are home to small to mid-size companies, or are vacant and potential candidates for redevelopment. Proposed projects in the Northwest submarket are near the study area, but closer to the airport, where major development activity is more likely to take place adjacent to intermodal facilities south of the airfield. There is currently over 300,000 square feet of industrial space proposed in the vicinity of the airport, in the City Tech Park on Alleghany Street and the West Pointe
Warehouse 2010 2011 2012 2013 2014 YTD Number of Buildings 39 39 39 39 44Total Inventory (Sq. Ft.) 5,449,765 5,449,765 5,449,765 5,449,765 5,713,265Completions 0 0 0 0 0Net Absorption 33,446 (77,465) 252,097 197,664 81,736Submarket Capture Rate (% of Total Market) 7.5% -21.2% 28.5% 8.8% 24.9%Total Vacant (Sq. Ft.) 713,621 791,086 538,989 341,325 458,564Vacancy Rate 13.1% 14.5% 9.9% 6.3% 8.0%Average Rent $3.43 $3.31 $3.31 $3.38 $3.37Sq. Ft. Under Construction - Sq. Ft. Proposed 305,081 305,081 305,081 305,081 305,081
Flex 2010 2011 2012 2013 2014 YTD Number of Buildings 7 7 7 7 7 Total Inventory (Sq. Ft.) 203,925 203,925 203,925 203,925 203,925 Completions 0 0 0 0 0Net Absorption 14,685 (18,631) 1,780 9,879 (10,678) Submarket Capture Rate (% of Total Market) 11.2% -55.2% 1.2% 24.1% -8.7%Total Vacant (Sq. Ft.) 30,456 49,087 47,307 37,428 48,106 Vacancy Rate 14.9% 24.1% 23.2% 18.4% 23.6%Average Rent $8.10 $7.37 $6.84 $7.62 $7.67Sq. Ft. Under Construction - Sq. Ft. Proposed - - - - - Source: The KARNES Report 2nd Quarter 2014, Rose & Associates
Northwest - Historical Industrial Market Analysis
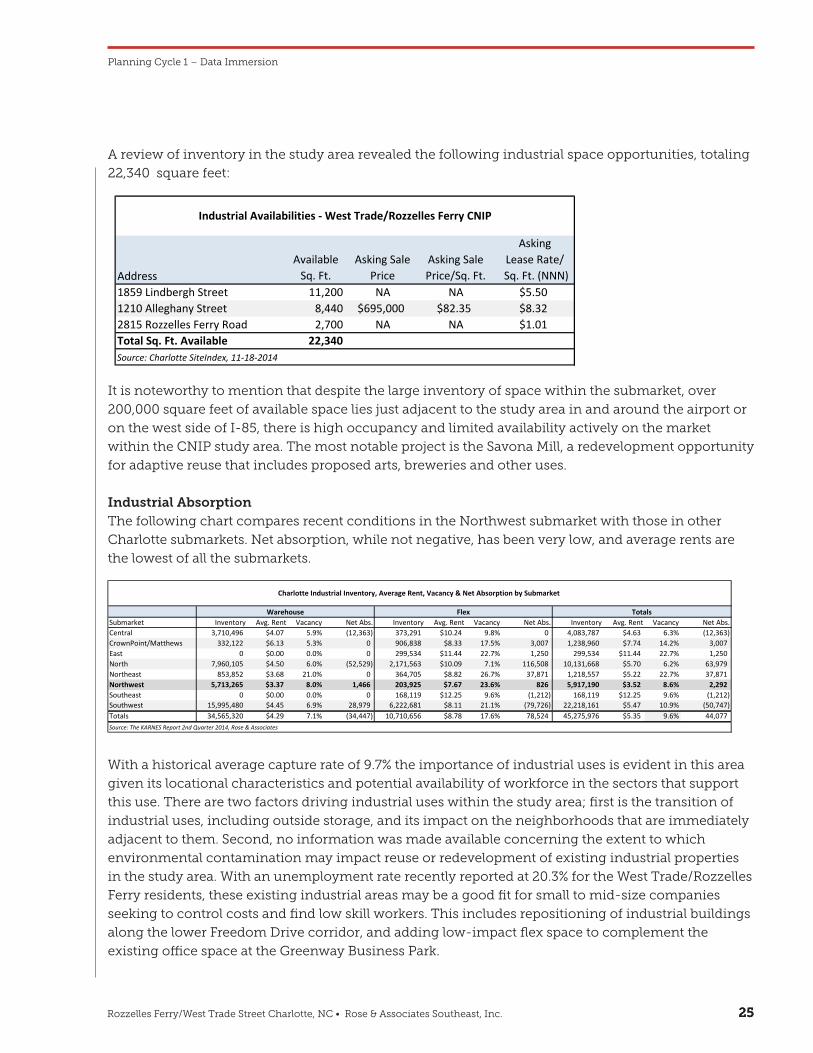
Rozzelles Ferry/West Trade Street Charlotte, NC • Rose & Associates Southeast, Inc. 2525
A review of inventory in the study area revealed the following industrial space opportunities, totaling
22,340 square feet:
It is noteworthy to mention that despite the large inventory of space within the submarket, over
200,000 square feet of available space lies just adjacent to the study area in and around the airport or
on the west side of I-85, there is high occupancy and limited availability actively on the market
within the CNIP study area. The most notable project is the Savona Mill, a redevelopment opportunity
for adaptive reuse that includes proposed arts, breweries and other uses.
Industrial AbsorptionThe following chart compares recent conditions in the Northwest submarket with those in other
Charlotte submarkets. Net absorption, while not negative, has been very low, and average rents are
the lowest of all the submarkets.
With a historical average capture rate of 9.7% the importance of industrial uses is evident in this area
given its locational characteristics and potential availability of workforce in the sectors that support
this use. There are two factors driving industrial uses within the study area; first is the transition of
industrial uses, including outside storage, and its impact on the neighborhoods that are immediately
adjacent to them. Second, no information was made available concerning the extent to which
environmental contamination may impact reuse or redevelopment of existing industrial properties
in the study area. With an unemployment rate recently reported at 20.3% for the West Trade/Rozzelles
Ferry residents, these existing industrial areas may be a good fit for small to mid-size companies
seeking to control costs and find low skill workers. This includes repositioning of industrial buildings
along the lower Freedom Drive corridor, and adding low-impact flex space to complement the
existing office space at the Greenway Business Park.
Planning Cycle 1 – Data Immersion
CNIP – Rozzelles Ferry/West Trade Market Analysis Summary Brief
24
Business Park on West Pointe Drive, both having direct access to the interstates and airport. To the north, the 386,000 square foot former Chemway Industrial Park, located just off Rozzelles Ferry Road near the CSX rail facilities, recently sold for $11 million dollars. This is largely attributed to the substantial CSX facilities, which connect to the intermodal facilities at the airport. There are also two recycling operations within the study area (Caraustar adjacent to Savona Mills and GreenTek on Hovis Rd.) whose facilities are expanding in their existing locations.
A review of inventory in the study area revealed the following industrial space opportunities, totaling 22,340 square feet:
It is noteworthy to mention that despite the large inventory of space within the submarket, over 200,000 square feet of available space lies just adjacent to the study area in and around the airport or on the west side of I-85, there is high occupancy and limited availability actively on the market within the CNIP study area. The most notable project is the Savona Mill, a redevelopment opportunity for adaptive reuse that includes proposed arts, breweries and other uses.
Industrial Absorption
The following chart compares recent conditions in the Northwest submarket with those in other Charlotte submarkets. Net absorption, while not negative, has been very low, and average rents are the lowest of all the submarkets.
With a historical average capture rate of 9.7% the importance of industrial uses is evident in this area given its locational characteristics and potential availability of workforce in the sectors that support this use. There are two factors driving industrial uses within the study area: first is the transition of industrial uses, including outside storage, and its impact on the neighborhoods that are immediately adjacent to them. Second, no information was made available concerning the extent to which environmental contamination may impact reuse or redevelopment of existing industrial properties in
AddressAvailable
Sq. Ft.Asking Sale
PriceAsking Sale Price/Sq. Ft.
Asking Lease Rate/
Sq. Ft. (NNN)1859 Lindbergh Street 11,200 NA NA $5.501210 Alleghany Street 8,440 $695,000 $82.35 $8.322815 Rozzelles Ferry Road 2,700 NA NA $1.01Total Sq. Ft. Available 22,340 Source: Charlotte SiteIndex, 11-18-2014
Industrial Availabilities - West Trade/Rozzelles Ferry CNIP
Submarket Inventory Avg. Rent Vacancy Net Abs. Inventory Avg. Rent Vacancy Net Abs. Inventory Avg. Rent Vacancy Net Abs.Central 3,710,496 $4.07 5.9% (12,363) 373,291 $10.24 9.8% 0 4,083,787 $4.63 6.3% (12,363) CrownPoint/Matthews 332,122 $6.13 5.3% 0 906,838 $8.33 17.5% 3,007 1,238,960 $7.74 14.2% 3,007 East 0 $0.00 0.0% 0 299,534 $11.44 22.7% 1,250 299,534 $11.44 22.7% 1,250 North 7,960,105 $4.50 6.0% (52,529) 2,171,563 $10.09 7.1% 116,508 10,131,668 $5.70 6.2% 63,979 Northeast 853,852 $3.68 21.0% 0 364,705 $8.82 26.7% 37,871 1,218,557 $5.22 22.7% 37,871 Northwest 5,713,265 $3.37 8.0% 1,466 203,925 $7.67 23.6% 826 5,917,190 $3.52 8.6% 2,292 Southeast 0 $0.00 0.0% 0 168,119 $12.25 9.6% (1,212) 168,119 $12.25 9.6% (1,212) Southwest 15,995,480 $4.45 6.9% 28,979 6,222,681 $8.11 21.1% (79,726) 22,218,161 $5.47 10.9% (50,747) Totals 34,565,320 $4.29 7.1% (34,447) 10,710,656 $8.78 17.6% 78,524 45,275,976 $5.35 9.6% 44,077
Warehouse Flex Totals
Charlotte Industrial Inventory, Average Rent, Vacancy & Net Absorption by Submarket
Source: The KARNES Report 2nd Quarter 2014, Rose & Associates
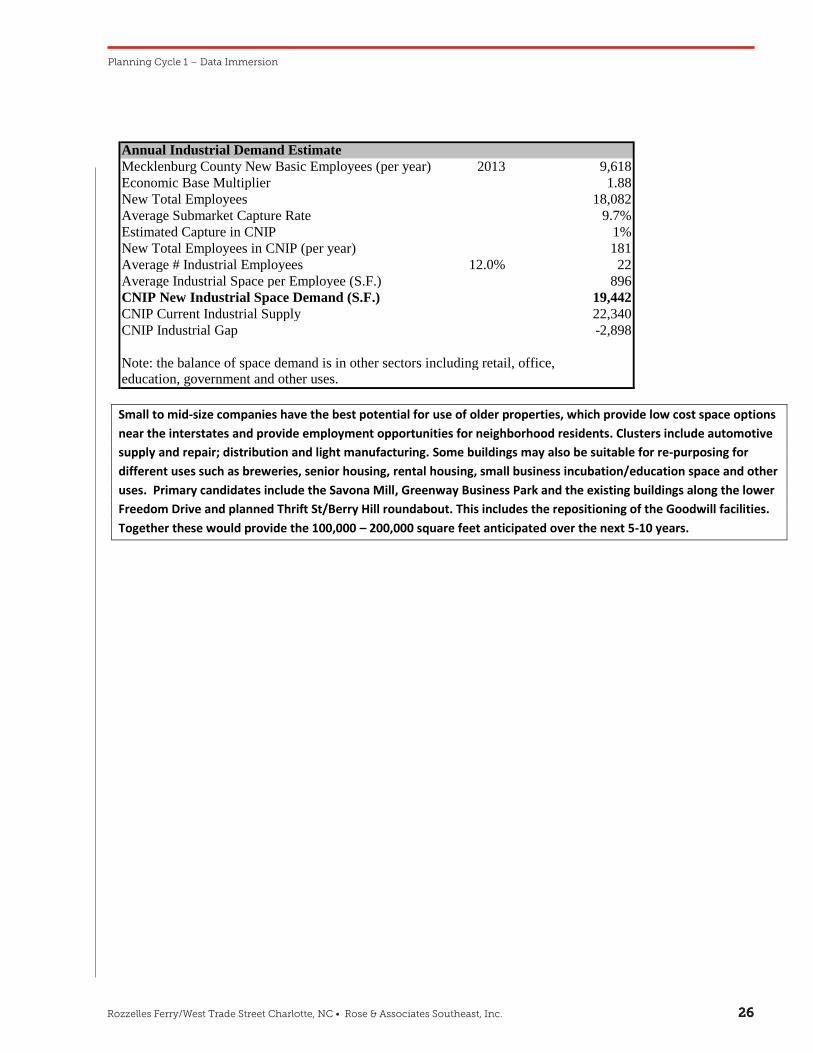
Rozzelles Ferry/West Trade Street Charlotte, NC • Rose & Associates Southeast, Inc. 2626
Planning Cycle 1 – Data Immersion
CNIP – Rozzelles Ferry/West Trade Market Analysis Summary Brief
25
the study area. With an unemployment rate recently reported at 20.3% for the West Trade/Rozzelles Ferry residents, these existing industrial areas may be a good fit for small to mid-size companies seeking to control costs and find low skill workers. This includes repositioning of industrial buildings along the lower Freedom Drive corridor, and adding low-impact flex space to complement the existing office space at the Greenway Business Park.
Small to mid-size companies have the best potential for use of older properties, which provide low cost space options near the interstates and provide employment opportunities for neighborhood residents. Clusters include automotive supply and repair; distribution and light manufacturing. Some buildings may also be suitable for re-purposing for different uses such as breweries, senior housing, rental housing, small business incubation/education space and other uses. Primary candidates include the Savona Mill, Greenway Business Park and the existing buildings along the lower Freedom Drive and planned Thrift St/Berry Hill roundabout. This includes the repositioning of the Goodwill facilities. Together these would provide the 100,000 – 200,000 square feet anticipated over the next 5-10 years.
1.7 Land Use Demand - Retail
The demand dynamics for retail differ from office/industrial uses, as demand comes not only primarily from job growth, but also from disposable income. The demographic benchmarks for retail include population and households, but most importantly disposable income to spend on goods/services. Consumer Expenditures outline the average dollars spent in any given category for those items on an annual basis. Within each trade area there are a number of components that determine which retail operators might find adequate demand for their goods/services, or retail sales potential.
Trade Areas
Unlike geographic areas – such as census block, or other boundaries, trade areas identify the market potential for goods and services within a specific distance to the consumer. These assist in determining threshold demographics such as population, income, workers, education and other factors required to support various sectors. The primary method for determining a trade area for data collection and real estate survey has become commonly defined as a prescribed distance radius around a specific intersection/location. This is predominately used to analyze threshold population and consumer dollars for retail uses. The secondary method, becoming more common with urbanization and growing traffic volumes, is the drive-time analysis. Drive time analysis evaluates the dynamics in a more urban environment where
Annual Industrial Demand EstimateMecklenburg County New Basic Employees (per year) 2013 9,618Economic Base Multiplier 1.88New Total Employees 18,082Average Submarket Capture Rate 9.7%Estimated Capture in CNIP 1%New Total Employees in CNIP (per year) 181Average # Industrial Employees 12.0% 22Average Industrial Space per Employee (S.F.) 896CNIP New Industrial Space Demand (S.F.) 19,442CNIP Current Industrial Supply 22,340CNIP Industrial Gap -2,898
Note: the balance of space demand is in other sectors including retail, office, education, government and other uses.
Rozzelles Ferry/West Trade Street Charlotte, NC • Rose & Associates Southeast, Inc. 2727
1.7 Land Use Demand - RetailThe demand dynamics for retail differ from office/industrial uses, as demand comes not only
primarily from job growth, but also from disposable income. The demographic benchmarks for retail
include population and households, but most importantly disposable income to spend on goods/
services. Consumer Expenditures outline the average dollars spent in any given category for those
items on an annual basis. Within each trade area there are a number of components that determine
which retail operators might find adequate demand for their goods/services or retail sales potential.
Trade Areas Unlike geographic areas – such as census block or other boundaries, trade areas identify the market
potential for goods and services within a specific distance to the consumer. These assist in
determining threshold demographics such as population, income, workers, education and other
factors required to support various sectors. The primary method for determining a trade area for data
collection and real estate survey has become commonly defined as a prescribed distance radius
around a specific intersection/location. This is predominately used to analyze threshold population
and consumer dollars for retail uses. The secondary method, becoming more common with
urbanization and growing traffic volumes, is the drive-time analysis. Drive time analysis evaluates the
dynamics in a more urban environment where traffic congestion can impact the time versus mileage
traveled to determine customer trade areas. In other words, consumers may choose locations based
upon destination in time versus miles, depending on time of day and traffic status. Commuting
patterns determine the ability for a company to attract both consumers and employees.
Convenience oriented goods/services contemplate those goods/services that are local and
convenience oriented for those living and/or working in the immediate area such as within 1-5 miles
or a 5-10 minute drive time. Destination oriented goods/services contemplate a trade area that
provides employment opportunities and goods/services on a more regional level. This would include
destination-oriented goods/services such as specialty retail, major goods, entertainment/recreation
venues and employment centers. This would attract those within the local area as well as those from
outside the area, with distances in excess of 5-7 miles or drive times in excess of 15+ minutes.
Since trade areas are based upon site specific locations, these are based upon their accessibility, traffic
volumes and likelihood to attract customers from either the local or more regional trade area. The
following intersections were reviewed and considered as both convenience and destination oriented
locations: Freedom Drive at Ashley Road (Valerie C Woodard County offices, the former Freedom Mall
site) and West Trade at Rozzelles Ferry (JCSU/Mosiac). When considering the impact of these central
places, these trade areas assist to identify the dynamics of consumer behavior and retail demand
potential for major industry group segments.
Planning Cycle 1 – Data Immersion
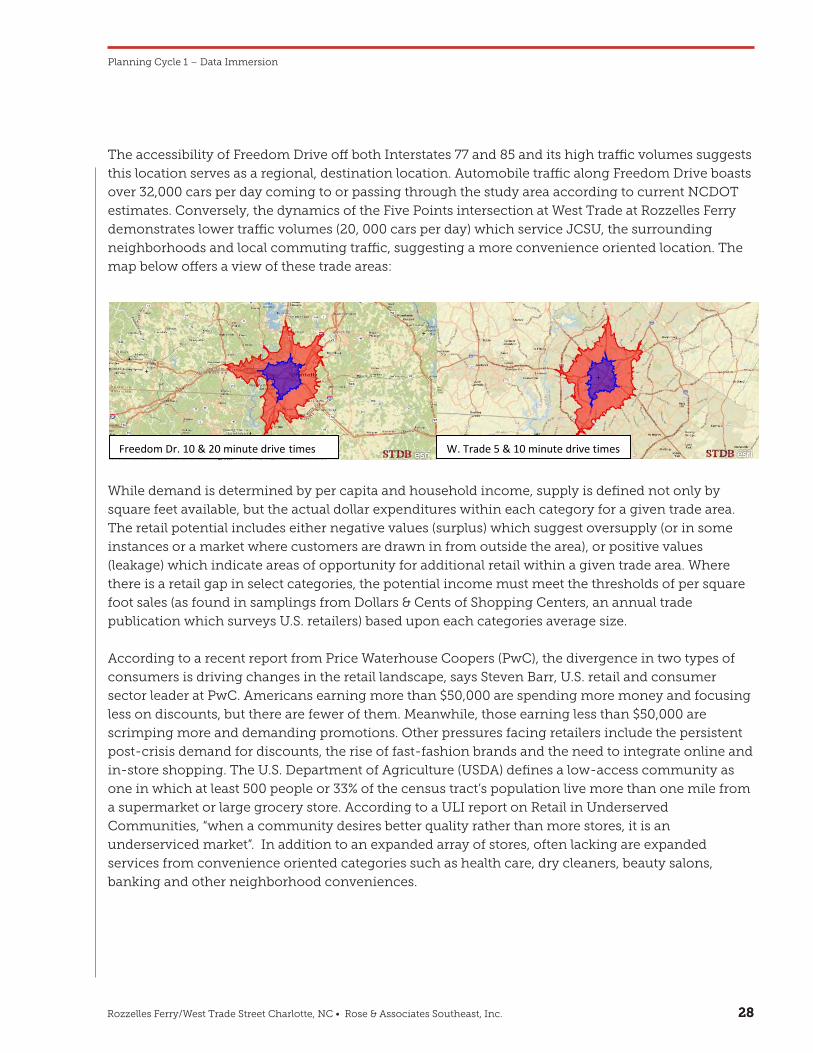
Rozzelles Ferry/West Trade Street Charlotte, NC • Rose & Associates Southeast, Inc. 2828
The accessibility of Freedom Drive off both Interstates 77 and 85 and its high traffic volumes suggests
this location serves as a regional, destination location. Automobile traffic along Freedom Drive boasts
over 32,000 cars per day coming to or passing through the study area according to current NCDOT
estimates. Conversely, the dynamics of the Five Points intersection at West Trade at Rozzelles Ferry
demonstrates lower traffic volumes (20, 000 cars per day) which service JCSU, the surrounding
neighborhoods and local commuting traffic, suggesting a more convenience oriented location. The
map below offers a view of these trade areas:
While demand is determined by per capita and household income, supply is defined not only by
square feet available, but the actual dollar expenditures within each category for a given trade area.
The retail potential includes either negative values (surplus) which suggest oversupply (or in some
instances or a market where customers are drawn in from outside the area), or positive values
(leakage) which indicate areas of opportunity for additional retail within a given trade area. Where
there is a retail gap in select categories, the potential income must meet the thresholds of per square
foot sales (as found in samplings from Dollars & Cents of Shopping Centers, an annual trade
publication which surveys U.S. retailers) based upon each categories average size.
According to a recent report from Price Waterhouse Coopers (PwC), the divergence in two types of
consumers is driving changes in the retail landscape, says Steven Barr, U.S. retail and consumer
sector leader at PwC. Americans earning more than $50,000 are spending more money and focusing
less on discounts, but there are fewer of them. Meanwhile, those earning less than $50,000 are
scrimping more and demanding promotions. Other pressures facing retailers include the persistent
post-crisis demand for discounts, the rise of fast-fashion brands and the need to integrate online and
in-store shopping. The U.S. Department of Agriculture (USDA) defines a low-access community as
one in which at least 500 people or 33% of the census tract’s population live more than one mile from
a supermarket or large grocery store. According to a ULI report on Retail in Underserved
Communities, “when a community desires better quality rather than more stores, it is an
underserviced market”. In addition to an expanded array of stores, often lacking are expanded
services from convenience oriented categories such as health care, dry cleaners, beauty salons,
banking and other neighborhood conveniences.
Planning Cycle 1 – Data Immersion
CNIP – Rozzelles Ferry/West Trade Market Analysis Summary Brief
26
traffic congestion can impact the time versus mileage traveled to determine customer trade areas. In other words, consumers may choose locations based upon destination in time versus miles, depending on time of day and traffic status. Commuting patterns determine the ability for a company to attract both consumers and employees.
Convenience oriented goods/services contemplate those goods/services that are local and convenience oriented for those living and/or working in the immediate area such as within 1-5 miles; or a 5-10 minute drive time. Destination oriented goods/services contemplate a trade area that provides employment opportunities and goods/services on a more regional level. This would include destination-oriented goods/services such as specialty retail, major goods, entertainment/recreation venues and employment centers. This would attract those within the local area as well as those from outside the area, with distances in excess of 5-7 miles or drive times in excess of 15+ minutes.
Since trade areas are based upon site specific locations, these are based upon their accessibility, traffic volumes and likelihood to attract customers from either the local or more regional trade area. The following intersections were reviewed and considered as both convenience and destination oriented locations: Freedom Drive at Ashley Road (Valerie Woodword County offices, the former Freedom Mall site) and West Trade at Rozzelles Ferry (JCSU/Mosiac). When considering the impact of these central places, these trade areas assist to identify the dynamics of consumer behavior and retail demand potential for major industry group segments.
The accessibility of Freedom Drive off both Interstates 77 and 85 and its high traffic volumes suggests this location serves as a regional, destination location. Automobile traffic along Freedom Drive boasts over 32,000 cars per day coming to or passing through the study area according to current NCDOT estimates. Conversely, the dynamics of the Five Points intersection at West Trade at Rozzelles Ferry demonstrates lower traffic volumes (20, 000 cars per day) which service JCSU, the surrounding neighborhoods and local commuting traffic, suggesting a more convenience oriented location. The map below offers a view of these trade areas:
While demand is determined by per capita and household income, supply is defined not only by square feet available, but the actual dollar expenditures within each category for a given trade area. The retail potential includes either negative values (surplus) which suggest oversupply (or in some instances or a market where customers are drawn in from outside the area), or positive values (leakage) which indicate areas of opportunity for additional retail within a given trade area. Where there is a retail gap in select categories, the potential income must meet the thresholds of per square foot sales (as found in samplings from Dollars & Cents of Shopping Centers, an annual trade publication which surveys U.S. retailers) based upon each categories average size.
Freedom Dr. 10 & 20 minute drive times W. Trade 5 & 10 minute drive times
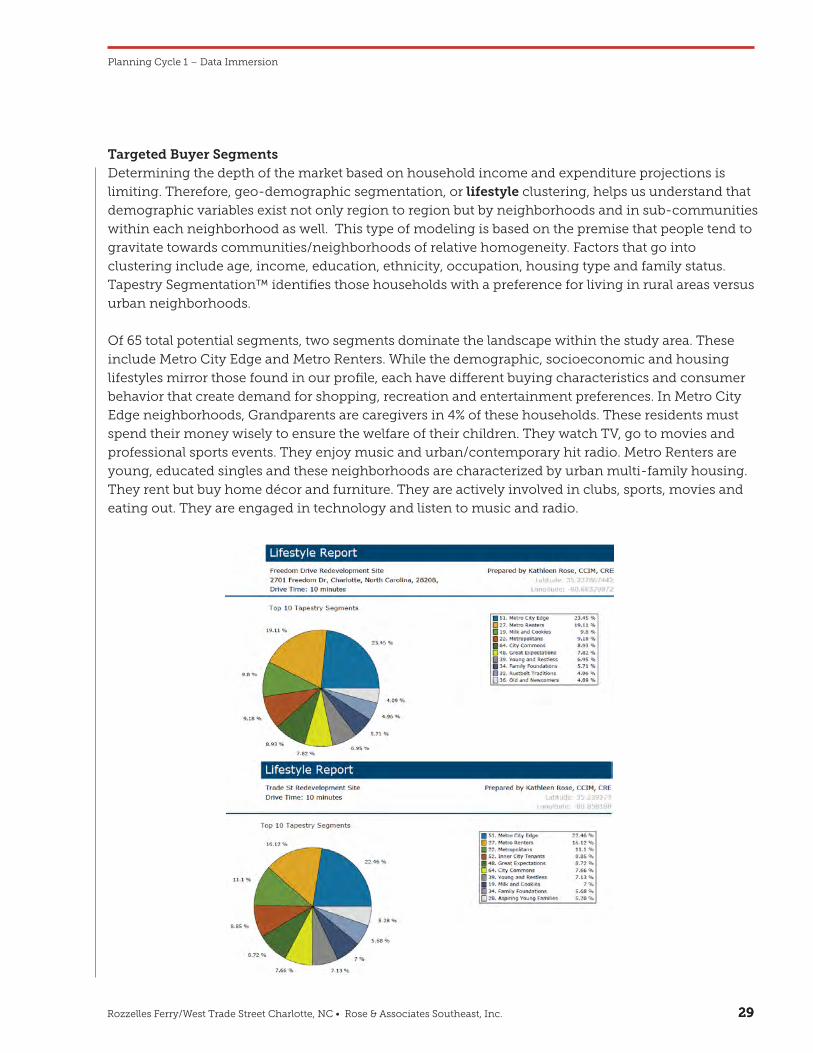
Rozzelles Ferry/West Trade Street Charlotte, NC • Rose & Associates Southeast, Inc. 2929
Targeted Buyer SegmentsDetermining the depth of the market based on household income and expenditure projections is
limiting. Therefore, geo-demographic segmentation, or lifestyle clustering, helps us understand that
demographic variables exist not only region to region but by neighborhoods and in sub-communities
within each neighborhood as well. This type of modeling is based on the premise that people tend to
gravitate towards communities/neighborhoods of relative homogeneity. Factors that go into
clustering include age, income, education, ethnicity, occupation, housing type and family status.
Tapestry Segmentation™ identifies those households with a preference for living in rural areas versus
urban neighborhoods.
Of 65 total potential segments, two segments dominate the landscape within the study area. These
include Metro City Edge and Metro Renters. While the demographic, socioeconomic and housing
lifestyles mirror those found in our profile, each have different buying characteristics and consumer
behavior that create demand for shopping, recreation and entertainment preferences. In Metro City
Edge neighborhoods, Grandparents are caregivers in 4% of these households. These residents must
spend their money wisely to ensure the welfare of their children. They watch TV, go to movies and
professional sports events. They enjoy music and urban/contemporary hit radio. Metro Renters are
young, educated singles and these neighborhoods are characterized by urban multi-family housing.
They rent but buy home décor and furniture. They are actively involved in clubs, sports, movies and
eating out. They are engaged in technology and listen to music and radio.
Planning Cycle 1 – Data Immersion
CNIP – Rozzelles Ferry/West Trade Market Analysis Summary Brief
28
Existing Retail Supply & Pricing
The subject site is located in the Northwest submarket. The majority of retail space in the West Trade/Rozzelles Ferry CNIP is currently scattered along the Freedom Drive corridor. The map below shows retail centers by type within the study area, showing the area serviced by Neighborhood Grocery and smaller Retail Service Centers:
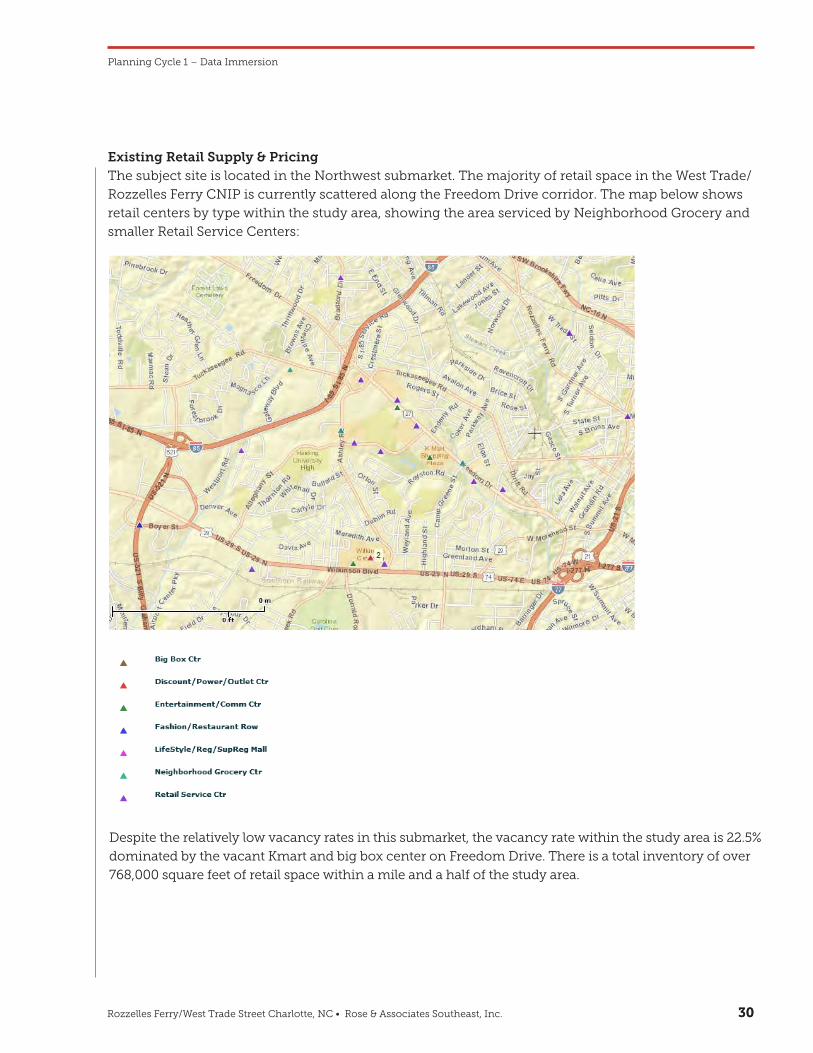
Rozzelles Ferry/West Trade Street Charlotte, NC • Rose & Associates Southeast, Inc. 3030
Planning Cycle 1 – Data Immersion
Existing Retail Supply & PricingThe subject site is located in the Northwest submarket. The majority of retail space in the West Trade/
Rozzelles Ferry CNIP is currently scattered along the Freedom Drive corridor. The map below shows
retail centers by type within the study area, showing the area serviced by Neighborhood Grocery and
smaller Retail Service Centers:
Despite the relatively low vacancy rates in this submarket, the vacancy rate within the study area is 22.5%
dominated by the vacant Kmart and big box center on Freedom Drive. There is a total inventory of over
768,000 square feet of retail space within a mile and a half of the study area.
CNIP – Rozzelles Ferry/West Trade Market Analysis Summary Brief
29
Despite the relatively low vacancy rates in this submarket, the vacancy rate within the study area is 22.5% dominated by the vacant Kmart and big box center on Freedom Drive. There is a total inventory of over 768,000 square feet of retail space within a mile and a half within and surrounding the study area.
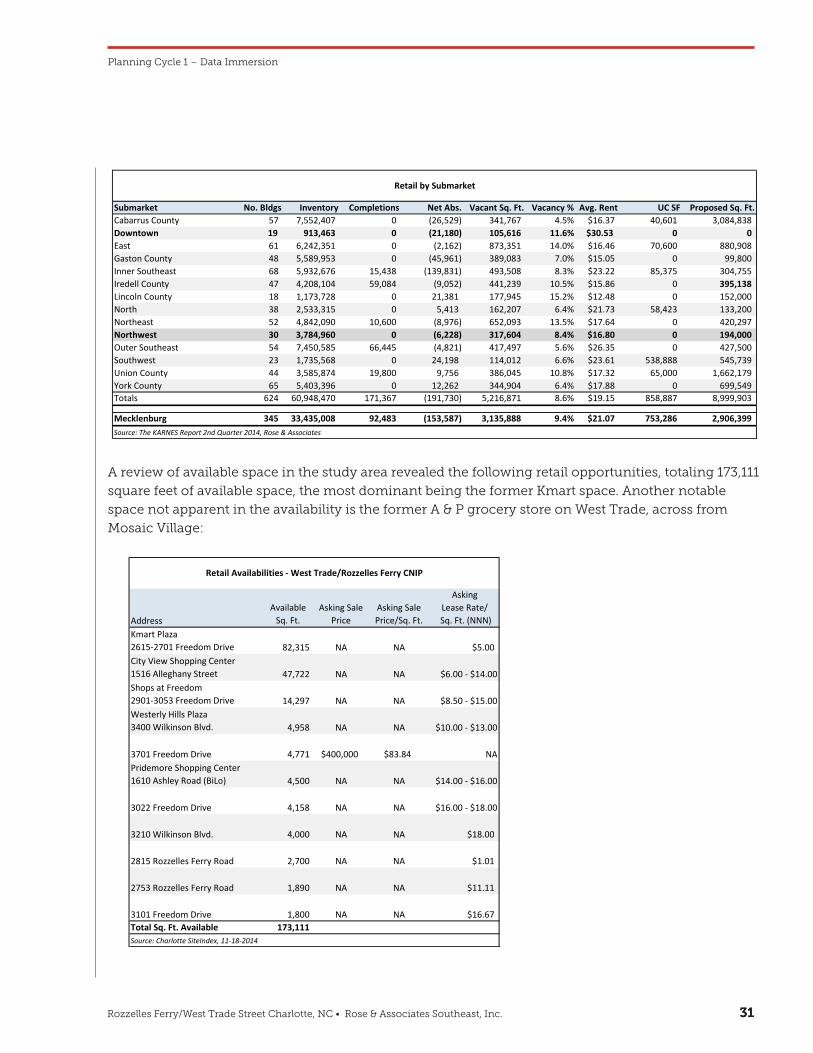
Rozzelles Ferry/West Trade Street Charlotte, NC • Rose & Associates Southeast, Inc. 3131
Planning Cycle 1 – Data Immersion
A review of available space in the study area revealed the following retail opportunities, totaling 173,111
square feet of available space, the most dominant being the former Kmart space. Another notable
space not apparent in the availability is the former A & P grocery store on West Trade, across from
Mosaic Village:
CNIP – Rozzelles Ferry/West Trade Market Analysis Summary Brief
30
A review of available space in the study area revealed the following retail opportunities, totaling 173,111 square feet of available space, the most dominant being the former Kmart space. Another notable space not apparent in the availability is the former A & P grocery store on West Trade, across from Mosaic Village:
Submarket No. Bldgs Inventory Completions Net Abs. Vacant Sq. Ft. Vacancy % Avg. Rent UC SF Proposed Sq. Ft.Cabarrus County 57 7,552,407 0 (26,529) 341,767 4.5% $16.37 40,601 3,084,838Downtown 19 913,463 0 (21,180) 105,616 11.6% $30.53 0 0East 61 6,242,351 0 (2,162) 873,351 14.0% $16.46 70,600 880,908Gaston County 48 5,589,953 0 (45,961) 389,083 7.0% $15.05 0 99,800Inner Southeast 68 5,932,676 15,438 (139,831) 493,508 8.3% $23.22 85,375 304,755Iredell County 47 4,208,104 59,084 (9,052) 441,239 10.5% $15.86 0 395,138Lincoln County 18 1,173,728 0 21,381 177,945 15.2% $12.48 0 152,000North 38 2,533,315 0 5,413 162,207 6.4% $21.73 58,423 133,200Northeast 52 4,842,090 10,600 (8,976) 652,093 13.5% $17.64 0 420,297Northwest 30 3,784,960 0 (6,228) 317,604 8.4% $16.80 0 194,000Outer Southeast 54 7,450,585 66,445 (4,821) 417,497 5.6% $26.35 0 427,500Southwest 23 1,735,568 0 24,198 114,012 6.6% $23.61 538,888 545,739Union County 44 3,585,874 19,800 9,756 386,045 10.8% $17.32 65,000 1,662,179York County 65 5,403,396 0 12,262 344,904 6.4% $17.88 0 699,549Totals 624 60,948,470 171,367 (191,730) 5,216,871 8.6% $19.15 858,887 8,999,903
Mecklenburg 345 33,435,008 92,483 (153,587) 3,135,888 9.4% $21.07 753,286 2,906,399
Retail by Submarket
Source: The KARNES Report 2nd Quarter 2014, Rose & Associates
AddressAvailable
Sq. Ft.Asking Sale
PriceAsking Sale Price/Sq. Ft.
Asking Lease Rate/
Sq. Ft. (NNN)Kmart Plaza2615-2701 Freedom Drive 82,315 NA NA $5.00City View Shopping Center1516 Alleghany Street 47,722 NA NA $6.00 - $14.00Shops at Freedom2901-3053 Freedom Drive 14,297 NA NA $8.50 - $15.00Westerly Hills Plaza3400 Wilkinson Blvd. 4,958 NA NA $10.00 - $13.00
3701 Freedom Drive 4,771 $400,000 $83.84 NAPridemore Shopping Center1610 Ashley Road (BiLo) 4,500 NA NA $14.00 - $16.00
3022 Freedom Drive 4,158 NA NA $16.00 - $18.00
3210 Wilkinson Blvd. 4,000 NA NA $18.00
2815 Rozzelles Ferry Road 2,700 NA NA $1.01
2753 Rozzelles Ferry Road 1,890 NA NA $11.11
3101 Freedom Drive 1,800 NA NA $16.67Total Sq. Ft. Available 173,111 Source: Charlotte SiteIndex, 11-18-2014
Retail Availabilities - West Trade/Rozzelles Ferry CNIP
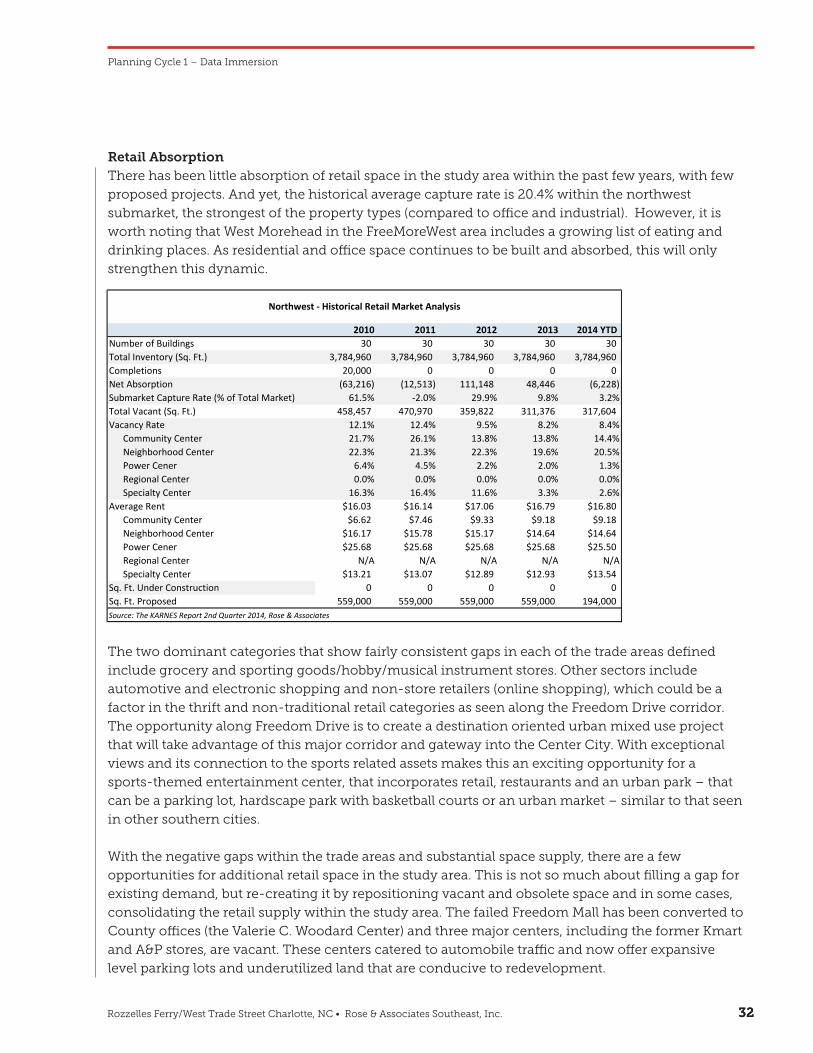
Rozzelles Ferry/West Trade Street Charlotte, NC • Rose & Associates Southeast, Inc. 3232
Planning Cycle 1 – Data Immersion
Retail AbsorptionThere has been little absorption of retail space in the study area within the past few years, with few
proposed projects. And yet, the historical average capture rate is 20.4% within the northwest
submarket, the strongest of the property types (compared to office and industrial). However, it is
worth noting that West Morehead in the FreeMoreWest area includes a growing list of eating and
drinking places. As residential and office space continues to be built and absorbed, this will only
strengthen this dynamic.
The two dominant categories that show fairly consistent gaps in each of the trade areas defined
include grocery and sporting goods/hobby/musical instrument stores. Other sectors include
automotive and electronic shopping and non-store retailers (online shopping), which could be a
factor in the thrift and non-traditional retail categories as seen along the Freedom Drive corridor.
The opportunity along Freedom Drive is to create a destination oriented urban mixed use project
that will take advantage of this major corridor and gateway into the Center City. With exceptional
views and its connection to the sports related assets makes this an exciting opportunity for a
sports-themed entertainment center, that incorporates retail, restaurants and an urban park – that
can be a parking lot, hardscape park with basketball courts or an urban market – similar to that seen
in other southern cities.
With the negative gaps within the trade areas and substantial space supply, there are a few
opportunities for additional retail space in the study area. This is not so much about filling a gap for
existing demand, but re-creating it by repositioning vacant and obsolete space and in some cases,
consolidating the retail supply within the study area. The failed Freedom Mall has been converted to
County offices (the Valerie C. Woodard Center) and three major centers, including the former Kmart
and A&P stores, are vacant. These centers catered to automobile traffic and now offer expansive
level parking lots and underutilized land that are conducive to redevelopment.
CNIP – Rozzelles Ferry/West Trade Market Analysis Summary Brief
31
Retail Absorption
There has been little absorption of retail space in the study area within the past few years, with no active proposed projects. And yet, the historical average capture rate is 20.4% within the northwest submarket, the strongest of the property types (compared to office and industrial). However, it is worth noting that West Morehead in the FreeMoreWest area includes a growing list of eating and drinking places. As residential and office space continues to be built and absorbed, this will only strengthen this dynamic.
The two dominant categories that show fairly consistent gaps in each of the trade areas defined include grocery and sporting goods/hobby/musical instrument stores. Other sectors include automotive and electronic shopping and non-store retailers (online shopping), which could be a factor in the thrift and non-traditional retail categories as seen along the Freedom Drive corridor. The opportunity along Freedom Drive is to create a destination oriented urban mixed use project that will take advantage of this major corridor and gateway into the Center City. With exceptional views and its connection to the sports related assets makes this an exciting opportunity for a sports-themed entertainment center, that incorporates retail, restaurants and an urban park – that can be a parking lot, hardscape park with basketball courts or an urban market – similar to that seen in other southern cities.
With the negative gaps within the trade areas and substantial space supply, there are a few opportunities for additional retail space in the study area. This is not so much about filling a gap for existing demand, but re-creating it by repositioning vacant and obsolete space and in some cases, consolidating the retail supply within the study area. The failed Freedom Mall has been converted to County offices (the Valerie Woodward Center) and three major centers, including the former Kmart and A&P stores, are vacant. These centers catered to automobile traffic and now offer expansive level parking lots and underutilized land that are conducive to redevelopment.
2010 2011 2012 2013 2014 YTD Number of Buildings 30 30 30 30 30 Total Inventory (Sq. Ft.) 3,784,960 3,784,960 3,784,960 3,784,960 3,784,960 Completions 20,000 0 0 0 0Net Absorption (63,216) (12,513) 111,148 48,446 (6,228) Submarket Capture Rate (% of Total Market) 61.5% -2.0% 29.9% 9.8% 3.2%Total Vacant (Sq. Ft.) 458,457 470,970 359,822 311,376 317,604 Vacancy Rate 12.1% 12.4% 9.5% 8.2% 8.4%
Community Center 21.7% 26.1% 13.8% 13.8% 14.4%Neighborhood Center 22.3% 21.3% 22.3% 19.6% 20.5%Power Cener 6.4% 4.5% 2.2% 2.0% 1.3%Regional Center 0.0% 0.0% 0.0% 0.0% 0.0%Specialty Center 16.3% 16.4% 11.6% 3.3% 2.6%
Average Rent $16.03 $16.14 $17.06 $16.79 $16.80Community Center $6.62 $7.46 $9.33 $9.18 $9.18Neighborhood Center $16.17 $15.78 $15.17 $14.64 $14.64Power Cener $25.68 $25.68 $25.68 $25.68 $25.50Regional Center N/A N/A N/A N/A N/ASpecialty Center $13.21 $13.07 $12.89 $12.93 $13.54
Sq. Ft. Under Construction 0 0 0 0 0Sq. Ft. Proposed 559,000 559,000 559,000 559,000 194,000 Source: The KARNES Report 2nd Quarter 2014, Rose & Associates
Northwest - Historical Retail Market Analysis
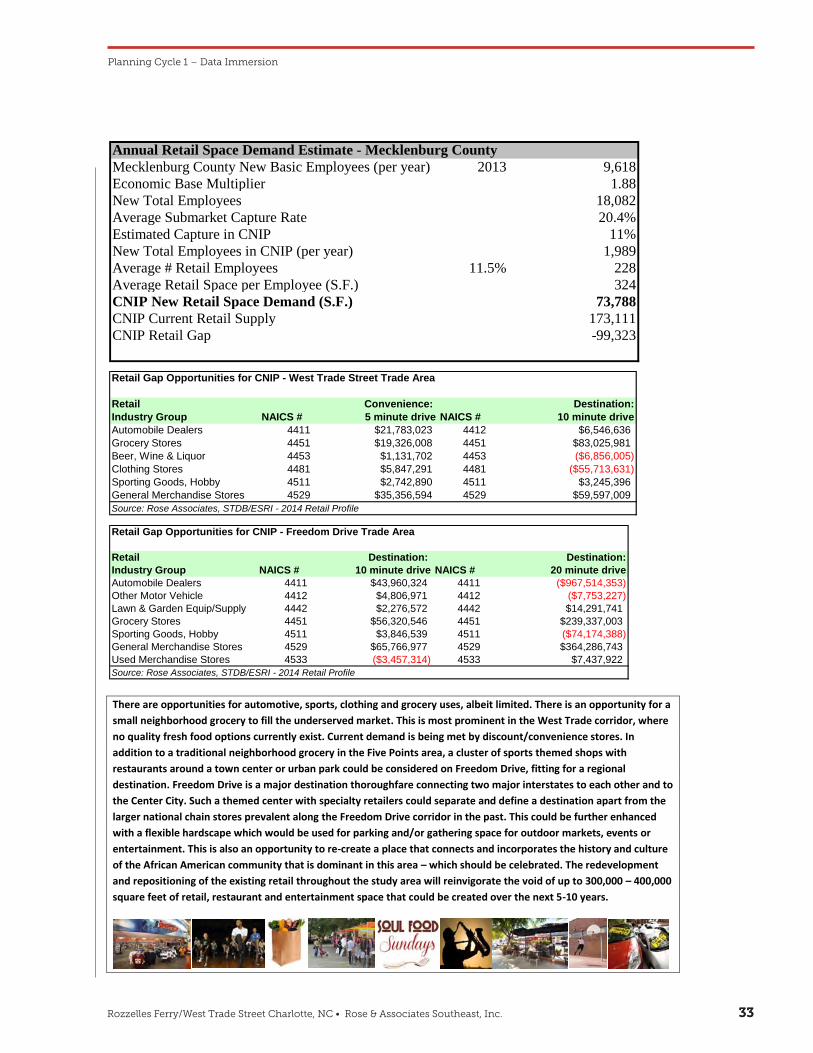
Rozzelles Ferry/West Trade Street Charlotte, NC • Rose & Associates Southeast, Inc. 3333
Planning Cycle 1 – Data Immersion
CNIP – Rozzelles Ferry/West Trade Market Analysis Summary Brief
32
Annual Retail Space Demand Estimate - Mecklenburg CountyMecklenburg County New Basic Employees (per year) 2013 9,618Economic Base Multiplier 1.88New Total Employees 18,082Average Submarket Capture Rate 20.4%Estimated Capture in CNIP 11%New Total Employees in CNIP (per year) 1,989Average # Retail Employees 11.5% 228Average Retail Space per Employee (S.F.) 324CNIP New Retail Space Demand (S.F.) 73,788CNIP Current Retail Supply 173,111CNIP Retail Gap -99,323
Retail Gap Opportunities for CNIP - West Trade Street Trade Area
Retail Convenience: Destination:Industry Group NAICS # 5 minute drive NAICS # 10 minute driveAutomobile Dealers 4411 $21,783,023 4412 $6,546,636Grocery Stores 4451 $19,326,008 4451 $83,025,981Beer, Wine & Liquor 4453 $1,131,702 4453 ($6,856,005)Clothing Stores 4481 $5,847,291 4481 ($55,713,631)Sporting Goods, Hobby 4511 $2,742,890 4511 $3,245,396General Merchandise Stores 4529 $35,356,594 4529 $59,597,009Source: Rose Associates, STDB/ESRI - 2014 Retail Profile
Retail Gap Opportunities for CNIP - Freedom Drive Trade Area
Retail Destination: Destination:Industry Group NAICS # 10 minute drive NAICS # 20 minute driveAutomobile Dealers 4411 $43,960,324 4411 ($967,514,353)Other Motor Vehicle 4412 $4,806,971 4412 ($7,753,227)Lawn & Garden Equip/Supply 4442 $2,276,572 4442 $14,291,741Grocery Stores 4451 $56,320,546 4451 $239,337,003Sporting Goods, Hobby 4511 $3,846,539 4511 ($74,174,388)General Merchandise Stores 4529 $65,766,977 4529 $364,286,743Used Merchandise Stores 4533 ($3,457,314) 4533 $7,437,922Source: Rose Associates, STDB/ESRI - 2014 Retail Profile
CNIP – Rozzelles Ferry/West Trade Market Analysis Summary Brief
33
There are opportunities for automotive, sports, clothing and grocery uses, albeit limited. There is an opportunity for a small neighborhood grocery to fill the underserved market. This is most prominent in the West Trade corridor, where no quality fresh food options currently exist. Current demand is being met by discount/convenience stores. In addition to a traditional neighborhood grocery in the Five Points area, a cluster of sports themed shops with restaurants around a town center or urban park could be considered on Freedom Drive, fitting for a regional destination. Freedom Drive is a major destination thoroughfare connecting two major interstates to each other and to the Center City. Such a themed center with specialty retailers could separate and define a destination apart from the larger national chain stores prevalent along the Freedom Drive corridor in the past. This could be further enhanced with a flexible hardscape which would be used for parking and/or gathering space for outdoor markets, events or entertainment. This is also an opportunity to re-create a place that connects and incorporates the history and culture of the African American community that is dominant in this area – which should be celebrated. The redevelopment and repositioning of the existing retail throughout the study area will reinvigorate the void of up to 300,000 – 400,000 square feet of retail, restaurant and entertainment space that could be created over the next 5-10 years.
1.8 Land Use Demand - Housing
There is a consistent pattern of housing in this study area. The housing stock is relatively old. Some of it has architectural and/or historic significance. The housing in this area is primarily composed of single family, detached homes. Rentals are common, and while the vacancy rate is higher than the county average, most of the NPAs are fairly close to that average. The values of the housing stock vary significantly; however, the rental rates occur within a fairly narrow range and, with one exception, are all below the county average.
To understand the character of the housing stock in the West Trade/ Rozzelles Ferry Road study area, data from the 2012 Charlotte-Mecklenburg Quality of Life study will serve as the base for the descriptive analysis. This roughly divides this study area into five zones: The Ashley Park and West Boulevard NPAs (124 and 361) are the southernmost part of the study area and are found between Wilkinson Boulevard and Freedom Drive; NPAs 51, 347, and 382 are the easternmost part of the area and are most impacted by being near Uptown Charlotte and Johnson C. Smith University; Enderly Park is a large neighborhood that makes up most of three NPAs (5, 6, and 293); NPAs 88 and 292 are generally found between Brookshire Highway and Tuckaseegee Road and are bordered on the northerly side by I-85; and, University Park and Washington Heights are located between Brookshire Highway and Beatties Ford Road.
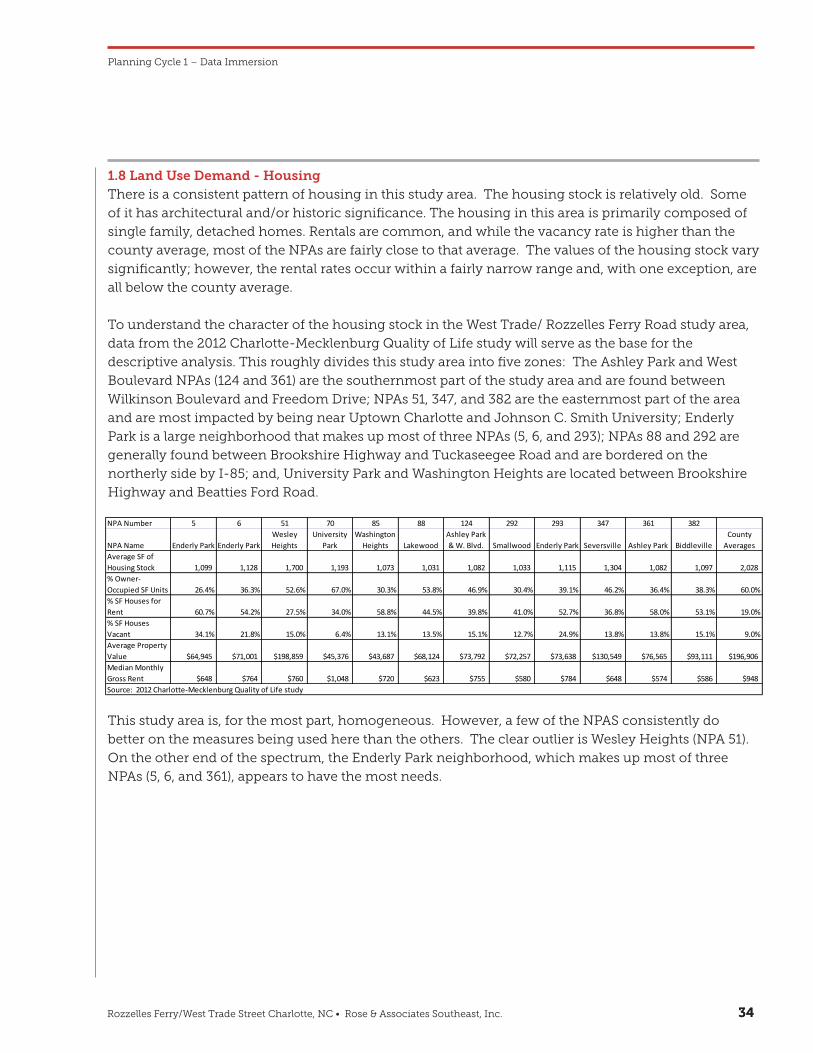
Rozzelles Ferry/West Trade Street Charlotte, NC • Rose & Associates Southeast, Inc. 3434
Planning Cycle 1 – Data Immersion
1.8 Land Use Demand - HousingThere is a consistent pattern of housing in this study area. The housing stock is relatively old. Some
of it has architectural and/or historic significance. The housing in this area is primarily composed of
single family, detached homes. Rentals are common, and while the vacancy rate is higher than the
county average, most of the NPAs are fairly close to that average. The values of the housing stock vary
significantly; however, the rental rates occur within a fairly narrow range and, with one exception, are
all below the county average.
To understand the character of the housing stock in the West Trade/ Rozzelles Ferry Road study area,
data from the 2012 Charlotte-Mecklenburg Quality of Life study will serve as the base for the
descriptive analysis. This roughly divides this study area into five zones: The Ashley Park and West
Boulevard NPAs (124 and 361) are the southernmost part of the study area and are found between
Wilkinson Boulevard and Freedom Drive; NPAs 51, 347, and 382 are the easternmost part of the area
and are most impacted by being near Uptown Charlotte and Johnson C. Smith University; Enderly
Park is a large neighborhood that makes up most of three NPAs (5, 6, and 293); NPAs 88 and 292 are
generally found between Brookshire Highway and Tuckaseegee Road and are bordered on the
northerly side by I-85; and, University Park and Washington Heights are located between Brookshire
Highway and Beatties Ford Road.
This study area is, for the most part, homogeneous. However, a few of the NPAS consistently do
better on the measures being used here than the others. The clear outlier is Wesley Heights (NPA 51).
On the other end of the spectrum, the Enderly Park neighborhood, which makes up most of three
NPAs (5, 6, and 361), appears to have the most needs.
CNIP – Rozzelles Ferry/West Trade Market Analysis Summary Brief
34
This study area is, for the most part, homogeneous. However, a few of the NPAS consistently do better on the measures being used here than the others. The clear outlier is Wesley Heights (NPA 51). On the other end of the spectrum, the Enderly Park neighborhood, which makes up most of three NPAs (5, 6, and 361), appears to have the most needs.
Age of Housing Stock
Most of the units were built immediately after World War II, as part of the post war housing boom to house returning veterans and the growing families (the baby boom). Historic Camp Greene is evidence of this period, and the Quality of Life data support this conclusion.
The average age of the housing in 3 of the 12 NPAS is in the 1940s. Six of the NPAs have an average age in the 1950s. Two of the NPAs have an average age in the 1960s. The Smallwood NPA (292) has an average age of 1978.
Size of Single Family Housing Units
The single family units are small. The Quality of Life Study provides the following data to illustrate this point:
The average square footage for 6 of the 12 NPAs is between 1,000 and 1,100. Four of the NPAs have an average square footage of between 1,100 and 1,200. The Seversville NPA(347) has an average square footage of 1,304. The Wesley Heights NPA (5) has an average square footage of 1,700. The average for all of Mecklenburg County is 2.028 square feet.
Owner-Occupied, Rental and Vacant Housing Units
The percentage of the single family housing that is owner occupied is quite low compared to the county average. For the county as a whole, 60% of the single family units are occupied by the owner of the property. The percentage of owner occupied units in eleven of the twelve NPAS in this study area is below the county average. The only NPA (75) above the county average is University Park (67%). The percentage of single family houses that are for rent is 19% for the county. None of the NPAS are anywhere close to this number with one having 60.7% of its single family units for rent. The county average for vacant units is 9.0%, and all of the NPAs, except University Park, in the study area are higher than the county average.
Housing Values
NPA Number 5 6 51 70 85 88 124 292 293 347 361 382
NPA Name Enderly Park Enderly ParkWesley Heights
University Park
Washington Heights Lakewood
Ashley Park & W. Blvd. Smallwood Enderly Park Seversville Ashley Park Biddleville
County Averages
Average SF of Housing Stock 1,099 1,128 1,700 1,193 1,073 1,031 1,082 1,033 1,115 1,304 1,082 1,097 2,028 % Owner-Occupied SF Units 26.4% 36.3% 52.6% 67.0% 30.3% 53.8% 46.9% 30.4% 39.1% 46.2% 36.4% 38.3% 60.0%% SF Houses for Rent 60.7% 54.2% 27.5% 34.0% 58.8% 44.5% 39.8% 41.0% 52.7% 36.8% 58.0% 53.1% 19.0%% SF Houses Vacant 34.1% 21.8% 15.0% 6.4% 13.1% 13.5% 15.1% 12.7% 24.9% 13.8% 13.8% 15.1% 9.0%Average Property Value $64,945 $71,001 $198,859 $45,376 $43,687 $68,124 $73,792 $72,257 $73,638 $130,549 $76,565 $93,111 $196,906Median Monthly Gross Rent $648 $764 $760 $1,048 $720 $623 $755 $580 $784 $648 $574 $586 $948Source: 2012 Charlotte-Mecklenburg Quality of Life study
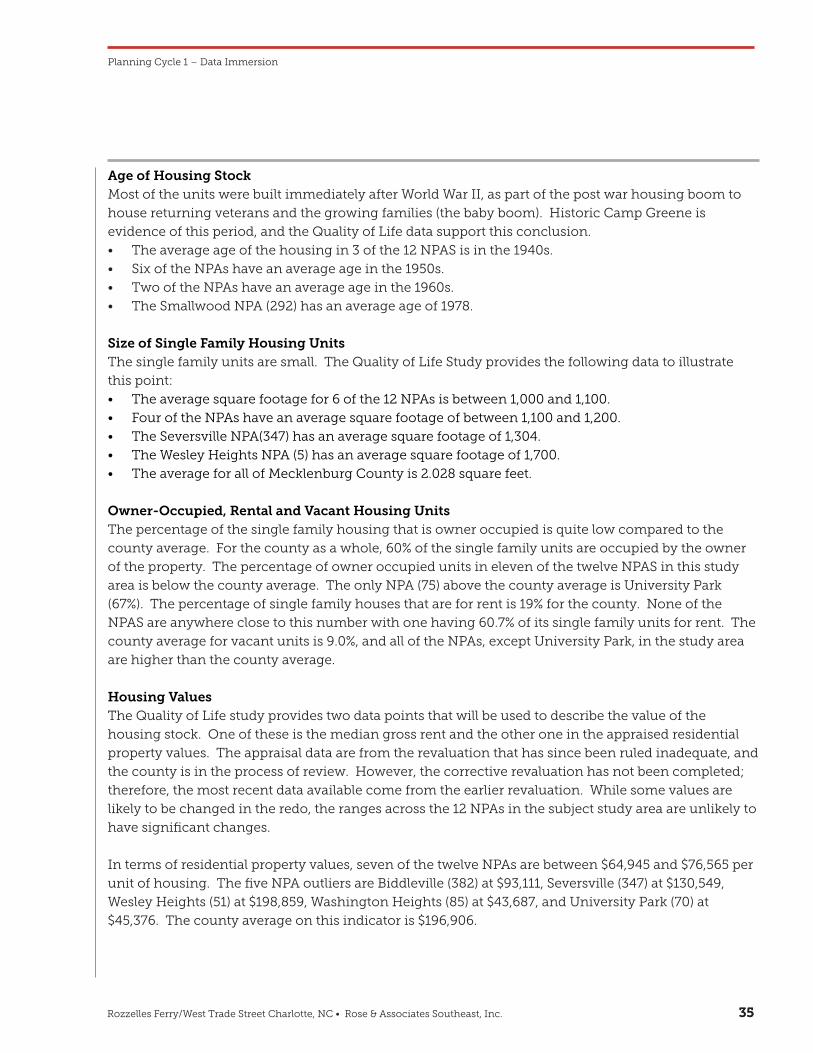
Rozzelles Ferry/West Trade Street Charlotte, NC • Rose & Associates Southeast, Inc. 3535
Planning Cycle 1 – Data Immersion
Age of Housing StockMost of the units were built immediately after World War II, as part of the post war housing boom to
house returning veterans and the growing families (the baby boom). Historic Camp Greene is
evidence of this period, and the Quality of Life data support this conclusion.
• The average age of the housing in 3 of the 12 NPAS is in the 1940s.
• Six of the NPAs have an average age in the 1950s.
• Two of the NPAs have an average age in the 1960s.
• The Smallwood NPA (292) has an average age of 1978.
Size of Single Family Housing UnitsThe single family units are small. The Quality of Life Study provides the following data to illustrate
this point:
• The average square footage for 6 of the 12 NPAs is between 1,000 and 1,100.
• Four of the NPAs have an average square footage of between 1,100 and 1,200.
• The Seversville NPA(347) has an average square footage of 1,304.
• The Wesley Heights NPA (5) has an average square footage of 1,700.
• The average for all of Mecklenburg County is 2.028 square feet.
Owner-Occupied, Rental and Vacant Housing UnitsThe percentage of the single family housing that is owner occupied is quite low compared to the
county average. For the county as a whole, 60% of the single family units are occupied by the owner
of the property. The percentage of owner occupied units in eleven of the twelve NPAS in this study
area is below the county average. The only NPA (75) above the county average is University Park
(67%). The percentage of single family houses that are for rent is 19% for the county. None of the
NPAS are anywhere close to this number with one having 60.7% of its single family units for rent. The
county average for vacant units is 9.0%, and all of the NPAs, except University Park, in the study area
are higher than the county average.
Housing ValuesThe Quality of Life study provides two data points that will be used to describe the value of the
housing stock. One of these is the median gross rent and the other one in the appraised residential
property values. The appraisal data are from the revaluation that has since been ruled inadequate, and
the county is in the process of review. However, the corrective revaluation has not been completed;
therefore, the most recent data available come from the earlier revaluation. While some values are
likely to be changed in the redo, the ranges across the 12 NPAs in the subject study area are unlikely to
have significant changes.
In terms of residential property values, seven of the twelve NPAs are between $64,945 and $76,565 per
unit of housing. The five NPA outliers are Biddleville (382) at $93,111, Seversville (347) at $130,549,
Wesley Heights (51) at $198,859, Washington Heights (85) at $43,687, and University Park (70) at
$45,376. The county average on this indicator is $196,906.
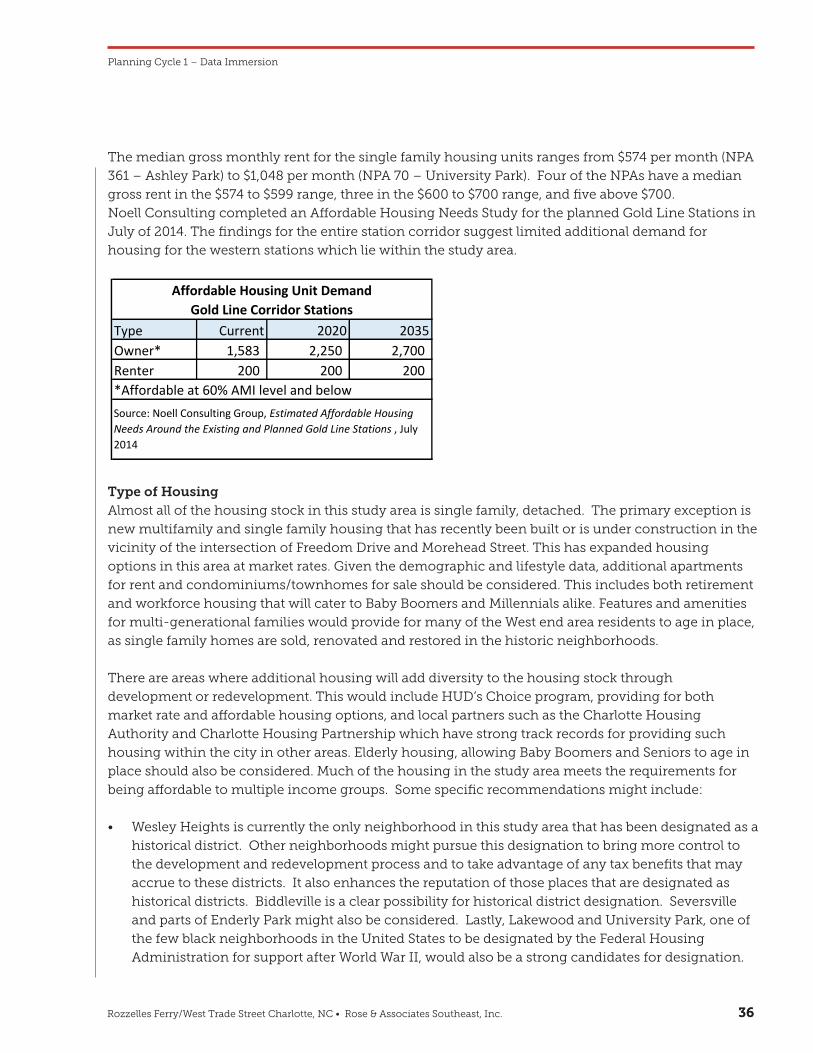
Rozzelles Ferry/West Trade Street Charlotte, NC • Rose & Associates Southeast, Inc. 3636
Planning Cycle 1 – Data Immersion
The median gross monthly rent for the single family housing units ranges from $574 per month (NPA
361 – Ashley Park) to $1,048 per month (NPA 70 – University Park). Four of the NPAs have a median
gross rent in the $574 to $599 range, three in the $600 to $700 range, and five above $700.
Noell Consulting completed an Affordable Housing Needs Study for the planned Gold Line Stations in
July of 2014. The findings for the entire station corridor suggest limited additional demand for
housing for the western stations which lie within the study area.
Type of HousingAlmost all of the housing stock in this study area is single family, detached. The primary exception is
new multifamily and single family housing that has recently been built or is under construction in the
vicinity of the intersection of Freedom Drive and Morehead Street. This has expanded housing
options in this area at market rates. Given the demographic and lifestyle data, additional apartments
for rent and condominiums/townhomes for sale should be considered. This includes both retirement
and workforce housing that will cater to Baby Boomers and Millennials alike. Features and amenities
for multi-generational families would provide for many of the West end area residents to age in place,
as single family homes are sold, renovated and restored in the historic neighborhoods.
There are areas where additional housing will add diversity to the housing stock through
development or redevelopment. This would include HUD’s Choice program, providing for both
market rate and affordable housing options, and local partners such as the Charlotte Housing
Authority and Charlotte Housing Partnership which have strong track records for providing such
housing within the city in other areas. Elderly housing, allowing Baby Boomers and Seniors to age in
place should also be considered. Much of the housing in the study area meets the requirements for
being affordable to multiple income groups. Some specific recommendations might include:
• Wesley Heights is currently the only neighborhood in this study area that has been designated as a
historical district. Other neighborhoods might pursue this designation to bring more control to
the development and redevelopment process and to take advantage of any tax benefits that may
accrue to these districts. It also enhances the reputation of those places that are designated as
historical districts. Biddleville is a clear possibility for historical district designation. Seversville
and parts of Enderly Park might also be considered. Lastly, Lakewood and University Park, one of
the few black neighborhoods in the United States to be designated by the Federal Housing
Administration for support after World War II, would also be a strong candidates for designation.
CNIP – Rozzelles Ferry/West Trade Market Analysis Summary Brief
35
The Quality of Life study provides two data points that will be used to describe the value of the housing stock. One of these is the median gross rent and the other one in the appraised residential property values. The appraisal data are from the revaluation that has since been ruled inadequate, and the county is in the process of review. However, the corrective revaluation has not been completed; therefore, the most recent data available come from the earlier revaluation. While some values are likely to be changed in the redo, the ranges across the 12 NPAs in the subject study area are unlikely to have significant changes.
In terms of residential property values, seven of the twelve NPAs are between $64,945 and $76,565 per unit of housing. The five NPA outliers are Biddleville (382) at $93,111, Seversville (347) at $130,549, Wesley Heights (51) at $198,859, Washington Heights (85) at $43,687, and University Park (70) at $45,376. The county average on this indicator is $196,906.
The median gross monthly rent for the single family housing units ranges from $574 per month (NPA 361 – Ashley Park) to $1,048 per month (NPA 70 – University Park). Four of the NPAs have a median gross rent in the $574 to $599 range, three in the $600 to $700 range, and five above $700.
Noell Consulting completed an Affordable Housing Needs Study for the planned Gold Line Stations in July of 2014. The findings for the entire station corridor suggest limited additional demand for housing for the western stations, which lie within the study area.
Type of Housing
Almost all of the housing stock in this study area is single family, detached. The primary exception is new multifamily and single family housing that has recently been built or is under construction in the vicinity of the intersection of Freedom Drive and Morehead Street. This has expanded housing options in this area at market rates. Given the demographic and lifestyle data, additional apartments for rent and condominiums/townhomes for sale should be considered. This includes both retirement and workforce housing that will cater to Baby Boomers and Millennials alike. Features and amenities for multi-generational families would provide for many of the West end area residents to age in place, as single family homes are sold, renovated and restored in the historic neighborhoods.
There are areas where additional housing will add diversity to the housing stock through development or redevelopment. This would include HUD’s Choice program, providing for both market rate and affordable housing options, and local partners such as the Charlotte Housing Authority and Charlotte Housing Partnership have strong track records for providing such housing within the city in other areas. Elderly housing, allowing Baby Boomers and Seniors to age in place should also be considered. Much of the housing in the study area meets the requirements for being affordable to multiple income groups. Some specific recommendations might include:
Type Current 2020 2035Owner* 1,583 2,250 2,700 Renter 200 200 200
Source: Noell Consulting Group, Estimated Affordable Housing Needs Around the Existing and Planned Gold Line Stations , July2014
*Affordable at 60% AMI level and below
Affordable Housing Unit Demand Gold Line Corridor Stations
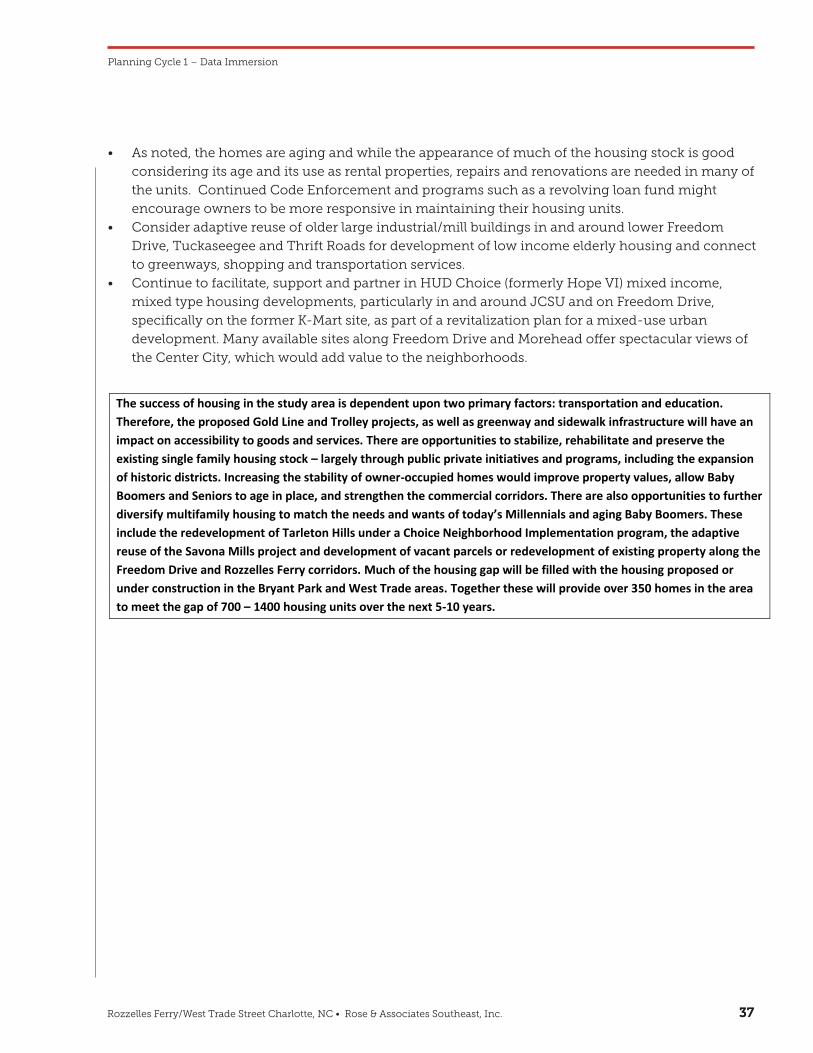
Rozzelles Ferry/West Trade Street Charlotte, NC • Rose & Associates Southeast, Inc. 3737
Planning Cycle 1 – Data Immersion
• As noted, the homes are aging and while the appearance of much of the housing stock is good
considering its age and its use as rental properties, repairs and renovations are needed in many of
the units. Continued Code Enforcement and programs such as a revolving loan fund might
encourage owners to be more responsive in maintaining their housing units.
• Consider adaptive reuse of older large industrial/mill buildings in and around lower Freedom
Drive, Tuckaseegee and Thrift Roads for development of low income elderly housing and connect
to greenways, shopping and transportation services.
• Continue to facilitate, support and partner in HUD Choice (formerly Hope VI) mixed income,
mixed type housing developments, particularly in and around JCSU and on Freedom Drive,
specifically on the former K-Mart site, as part of a revitalization plan for a mixed-use urban
development. Many available sites along Freedom Drive and Morehead offer spectacular views of
the Center City, which would add value to the neighborhoods.
CNIP – Rozzelles Ferry/West Trade Market Analysis Summary Brief
36
Wesley Heights is currently the only neighborhood in this study area that has been designated as ahistorical district. Other neighborhoods might pursue this designation to bring more control to thedevelopment and redevelopment process and to take advantage of any tax benefits that may accrue tothese districts. It also enhances the reputation of those places that are designated as historical districts.Biddleville is a clear possibility for historical district designation. Seversville and parts of Enderly Parkmight also be considered. Lastly, Lakewood and University Park, one of the few black neighborhoods inthe United States to be designated by the Federal Housing Administration for support after World WarII, would also be a strong candidates for designation.
As noted, the homes are aging and while the appearance of much of the housing stock is goodconsidering its age and its use as rental properties, repairs and renovations are needed in many of theunits. Continued Code Enforcement and programs such as a revolving loan fund might encourageowners to be more responsive in maintaining their housing units.
Consider adaptive reuse of older large industrial/mill buildings in and around lower Freedom Drive,Tuckaseegee and Thrift Roads for development of low income elderly housing, and connect togreenways, shopping and transportation services.
Continue to facilitate, support and partner in HUD Choice (formerly Hope VI) mixed income, mixed typehousing developments, particularly in and around JCSU and on Freedom Drive, specifically on theformer K-Mart site, as part of a revitalization plan for a mixed-use urban development. Many availablesites along Freedom Drive and Morehead offer spectacular views of the Center City, which would addvalue to the neighborhoods.
The success of housing in the study area is dependent upon two primary factors: transportation and education. Therefore, the proposed Gold Line and Trolley projects, as well as greenway and sidewalk infrastructure will have an impact on accessibility to goods and services. There are opportunities to stabilize, rehabilitate and preserve the existing single family housing stock – largely through public private initiatives and programs, including the expansion of historic districts. Increasing the stability of owner-occupied homes would improve property values, allow Baby Boomers and Seniors to age in place, and strengthen the commercial corridors. There are also opportunities to further diversify multifamily housing to match the needs and wants of today’s Millennials and aging Baby Boomers. These include the redevelopment of Tarleton Hills under a Choice Neighborhood Implementation program, the adaptive reuse of the Savona Mills project and development of vacant parcels or redevelopment of existing property along the Freedom Drive and Rozzelles Ferry corridors. Much of the housing gap will be filled with the housing proposed or under construction in the Bryant Park and West Trade areas. Together these will provide over 350 homes in the area to meet the gap of 700 – 1400 housing units over the next 5-10 years.
Planning Cycle 2 – General Framework
2.1 Land Use – Planning Framework
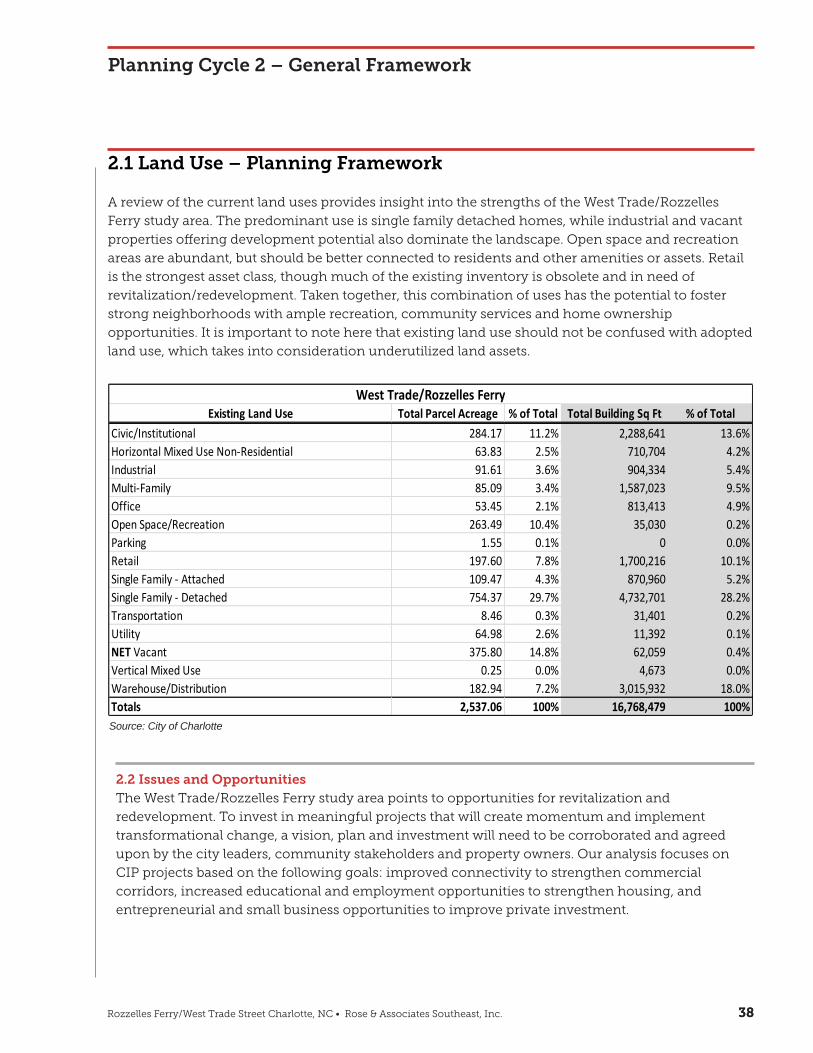
Rozzelles Ferry/West Trade Street Charlotte, NC • Rose & Associates Southeast, Inc. 3838
2.1 Land Use – Planning Framework
A review of the current land uses provides insight into the strengths of the West Trade/Rozzelles
Ferry study area. The predominant use is single family detached homes, while industrial and vacant
properties offering development potential also dominate the landscape. Open space and recreation
areas are abundant, but should be better connected to residents and other amenities or assets. Retail
is the strongest asset class, though much of the existing inventory is obsolete and in need of
revitalization/redevelopment. Taken together, this combination of uses has the potential to foster
strong neighborhoods with ample recreation, community services and home ownership
opportunities. It is important to note here that existing land use should not be confused with adopted
land use, which takes into consideration underutilized land assets.
Planning Cycle 2 – General Framework
CNIP – Rozzelles Ferry/West Trade Market Analysis Summary Brief
37
A review of the current land uses provides insight into the strengths of the West Trade/Rozzelles Ferry study area. The predominant use is single family detached homes, while industrial and vacant properties offering development potential also dominate the landscape. Open space and recreation areas are abundant, but should be better connected to residents and other amenities or assets. Retail is the strongest asset class, thought much of the existing inventory is obsolete and in need of revitalization/redevelopment. Taken together, this combination of uses has the potential to foster strong neighborhoods with ample recreation, community services and home ownership opportunities. It is important to note here that existing land use should not be confused with adopted land use, which takes into consideration underutilized land assets.
[Stantec – check this chart against GIS – see email to Matt with Excel Demand Analysis File]
2.2 Issues and Opportunities
The West Trade/Rozzelles Ferry study area points to opportunities for revitalization and redevelopment. To invest in meaningful projects that will create momentum and implement transformational change, a vision, plan and investment will need to be corroborated and agreed upon by the city leaders, community stakeholders and property owners. Our analysis focuses on CIP projects based on the following goals: improved connectivity to strengthen commercial corridors, increased educational and employment opportunities to strengthen housing, and entrepreneurial and small business opportunities to improve private investment.
The identified assets, issues and opportunities must be linked together to weave a tapestry that considers the unique characteristics of the study area, bound together by the threads of infrastructure investment.
Existing Land Use Total Parcel Acreage % of Total Total Building Sq Ft % of TotalCivic/Institutional 284.17 11.2% 2,288,641 13.6%Horizontal Mixed Use Non-Residential 63.83 2.5% 710,704 4.2%Industrial 91.61 3.6% 904,334 5.4%Multi-Family 85.09 3.4% 1,587,023 9.5%Office 53.45 2.1% 813,413 4.9%Open Space/Recreation 263.49 10.4% 35,030 0.2%Parking 1.55 0.1% 0 0.0%Retail 197.60 7.8% 1,700,216 10.1%Single Family - Attached 109.47 4.3% 870,960 5.2%Single Family - Detached 754.37 29.7% 4,732,701 28.2%Transportation 8.46 0.3% 31,401 0.2%Utility 64.98 2.6% 11,392 0.1%NET Vacant 375.80 14.8% 62,059 0.4%Vertical Mixed Use 0.25 0.0% 4,673 0.0%Warehouse/Distribution 182.94 7.2% 3,015,932 18.0%Totals 2,537.06 100% 16,768,479 100%
West Trade/Rozzelles Ferry
2.2 Issues and Opportunities The West Trade/Rozzelles Ferry study area points to opportunities for revitalization and
redevelopment. To invest in meaningful projects that will create momentum and implement
transformational change, a vision, plan and investment will need to be corroborated and agreed
upon by the city leaders, community stakeholders and property owners. Our analysis focuses on
CIP projects based on the following goals: improved connectivity to strengthen commercial
corridors, increased educational and employment opportunities to strengthen housing, and
entrepreneurial and small business opportunities to improve private investment.
Source: City of Charlotte
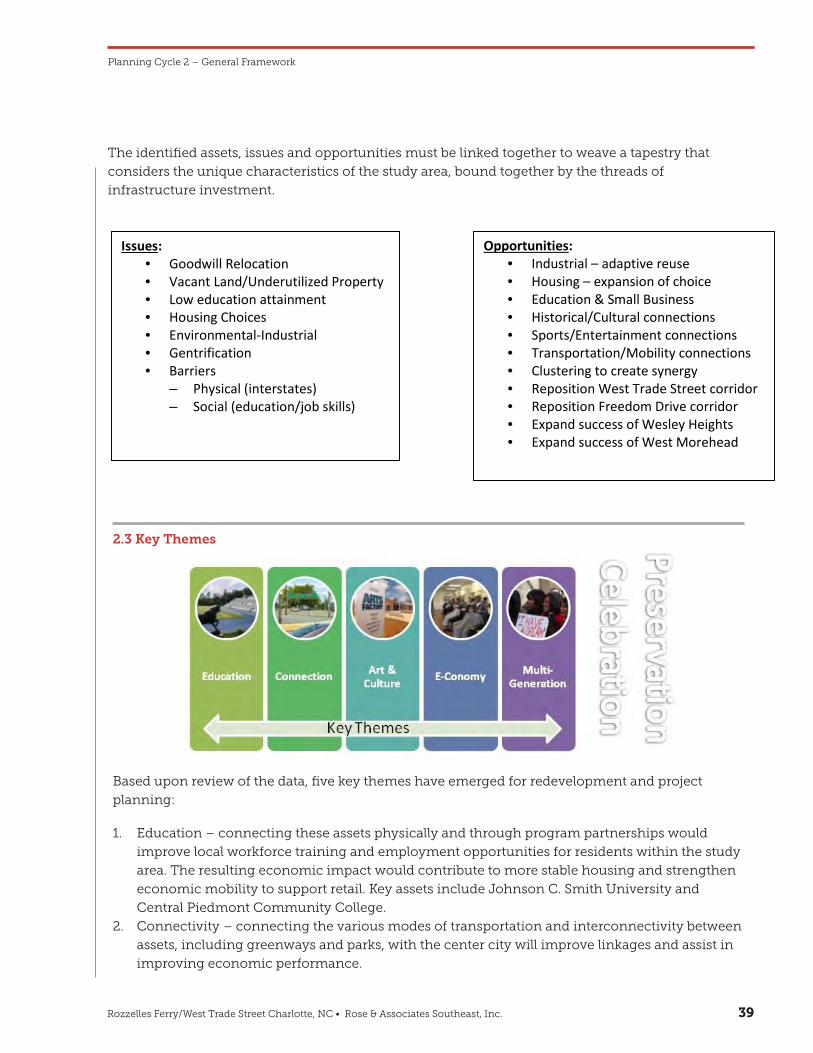
Rozzelles Ferry/West Trade Street Charlotte, NC • Rose & Associates Southeast, Inc. 3939
Planning Cycle 2 – General Framework
The identified assets, issues and opportunities must be linked together to weave a tapestry that
considers the unique characteristics of the study area, bound together by the threads of
infrastructure investment.
2.3 Key Themes
Based upon review of the data, five key themes have emerged for redevelopment and project
planning:
1. Education – connecting these assets physically and through program partnerships would
improve local workforce training and employment opportunities for residents within the study
area. The resulting economic impact would contribute to more stable housing and strengthen
economic mobility to support retail. Key assets include Johnson C. Smith University and
Central Piedmont Community College.
2. Connectivity – connecting the various modes of transportation and interconnectivity between
assets, including greenways and parks, with the center city will improve linkages and assist in
improving economic performance.
CNIP – Rozzelles Ferry/West Trade Market Analysis Summary Brief
38
[Stantec – apply the boxes below over map images]
2.3 Key Themes
Based upon review of the data, five key themes have emerged for redevelopment and project planning:
1) Education – connecting these assets physically and through program partnerships would improve local workforce training and employment opportunities for residents within the study area. The resulting economic impact would contribute to more stable housing and strengthen economic mobility to support retail. Key assets include Johnson C. Smith University and Central Piedmont Community College.
2) Connectivity – connecting the various modes of transportation and interconnectivity between assets, including greenways and parks, with the center city will improve linkages and assist in improving economic performance.
3) Arts & Culture – integrating (what remains of) the African American cultural assets of the study area into a retail, entertainment and tourism strategy will drive demand, improve occupancy and create additional tax base to contribute to the economic stability and mobility of the area.
4) E-conomy – as part of an education strategy, programs to assist with small business and entrepreneurship will enable more local residents to either find a job or create their own through entrepreneurship. This also includes creating opportunities, such as façade improvement grants and other tools to assist growing new local businesses.
Opportunities: • Industrial – adaptive reuse • Housing – expansion of choice • Education & Small Business • Historical/Cultural connections • Sports/Entertainment connections • Transportation/Mobility connections • Clustering to create synergy • Reposition West Trade Street corridor • Reposition Freedom Drive corridor • Expand success of Wesley Heights • Expand success of West Morehead
Issues: • Goodwill Relocation • Vacant Land/Underutilized Property • Low education attainment • Housing Choices • Environmental-Industrial • Gentrification • Barriers
– Physical (interstates) – Social (education/job skills)
Rozzelles Ferry/West Trade Street Charlotte, NC • Rose & Associates Southeast, Inc. 4040
Planning Cycle 2 – General Framework
3. Arts & Culture – integrating (what remains of) the African American cultural assets of the study
area into a retail, entertainment and tourism strategy will drive demand, improve occupancy
and create additional tax base to contribute to the economic stability and mobility of the area.
4. E-conomy – as part of an education strategy, programs to assist with small business and
entrepreneurship will enable more local residents to either find a job or create their own
through entrepreneurship. This also includes creating opportunities, such as façade
improvement grants and other tools to assist growing new local businesses.
5. Multi-generational – addressing the multi-generational needs of the local families includes a
housing strategy that allows for older populations to age in place, and opportunities to add
more diversity of housing stock that could impact densities, which would also strengthen the
retail sector.
Rozzelles Ferry/West Trade Street Charlotte, NC • Rose & Associates Southeast, Inc. 4141
3.1 Economic Mobility: Healthy E-Conomy = Healthy Community (Quality of Life)
A key component of community health and wellness is economic opportunity. This is the result of
the economic multiplier of three key factors: education, opportunity, and financial security. People
with financial security contribute to, and support, their community. Education and occupational
opportunity are two main drivers to increase the chances for financial security. E-Conomy refers
to opportunities for both residents and businesses in providing education, job training or
entrepreneurial support for creative and inspired individuals to create their own occupation or
small business.
The West End contains valuable resources, both physically and structurally with untapped
educational and partnership opportunities that can be leveraged to raise the level of attained
education, create entrepreneurial experiences and support the financial health for the people in
this community.
Planning Cycle 3 – Inviting Success• Development Impact Analysis
• Community Investment Strategy