charting a new course together - stockproinfo
TRANSCRIPT
C H A RT I N G A N EW C OU RS E … TOGETHER
2 0 1 2A N N U A L R E P O R T

Letter to ShareholdersBy every measure, 2012 was another
groundbreaking year for our company. It was a
year of singular importance in the merger of SXC
and Catalyst to form Catamaran. It was a year
of great opportunity as our unique approach
to pharmacy benefit management continued
to resonate with the most sophisticated buyers
with the most challenging needs. Lastly, it was
a year of strategic development, ensuring that
our company and services are best positioned
to guide clients through the changes coming to
healthcare in 2013 and beyond.
Let’s start by taking a look at all we
accomplished in 2012.
First and foremost, 2012 was a year of important
acquisitions. SXC’s growth was fueled early in
the year through the acquisition of HealthTran, a
privately held healthcare management solutions
company. Later in the year, the acquisition of
Catalyst led to the formation of Catamaran,
bringing together two of the industry’s most
successful, innovative and fastest-growing
pharmacy benefit management companies.
SXC had the leading technology position in
the marketplace for years and Catalyst was
known for the best service delivery model in
the business. Now Catamaran brings vision,
size and scale, the flexibility clients want, and a
proven track record of success across a diverse
client base. It’s a winning combination we
believe will be hard to beat.
Second, 2012 was another year of record results
for our company. We achieved record earnings,
sales and cash flow. Revenue was $9.9 billion
last year, up 99.8% compared to 2011. Net
income attributable to the company was $116.7
million, an increase of 27.1% on a year-over-
year basis. EBITDA grew to $362.7 million from
$166.4 million in 2011. Our sales team generated
the largest selling season in our company’s
history. This stellar financial performance earned
Catamaran the 11th spot on Fortune magazine’s
list of fastest-growing companies in 2012. It’s
more proof that we’ve captured the attention
of the industry by challenging the traditional
models and offering a compelling alternative for
healthcare payers.
Finally, over the past year we continued to lay
the strategic foundation necessary to bring the
most flexible and effective solutions to market.
Our team is leading the charge with powerful
clinical services that target interventions to
the right members at the right time in the right
ways, to improve outcomes and control costs.
We are helping our clients plan and prepare
for the Affordable Care Act as more uninsured
people gain access to the healthcare system,
prescription drug utilization increases and
management models move from transactions
to outcomes. And as specialty drug spend
continues to escalate, we’re well positioned
with our newly branded and rapidly growing
BriovaRx™ specialty offering.
Now let’s take a look at what we’ve got
coming up.
Expect to see Catamaran move up market and
compete for and win the largest opportunities.
Increasingly, Fortune 500 buyers are looking
for a better way to buy managed pharmacy
services — one that offers the size and scale
of the largest players without sacrificing the
flexibility to address their unique needs.
C A T A M A R A N | 2 0 1 2 A N N U A L R E P O R T
Dear Shareholder,
1

2
Expect to see an expanding suite of clinical
services that influence member behavior and
choice. There are some daunting statistics
about the declining health of the American
population. We believe that personalized
member engagement presents some of the best
opportunities for our clients to get ahead of
these burgeoning problems.
Expect to see Catamaran continue to innovate in
the area of specialty pharmacy. Specialty drugs
represent the fastest-growing and most costly
segment of the pharmaceutical industry, and
Catamaran is bringing a unique and powerful
offering to the market.
Finally, expect to see Catamaran take a market
leadership position with new payment models
and the formation of Healthcare Insurance
Exchanges.
As I wrap up this year’s letter to shareholders,
I would like to thank the Pharmaceutical Care
Management Association for my appointment as
chairman of the Board of Directors in 2012. I am
committed to furthering the PCMA vision and
helping to shape the future of the PBM industry.
I’m pleased to welcome four new board
members: Steven Epstein, Betsy Holden, Karen
Katen and Harry Kraemer. Steven is the senior
health partner at Epstein Becker & Green,
P.C., with a focus on healthcare law. Betsy is
a senior advisor to McKinsey & Company, and
Karen is a senior advisor to Essex Woodlands
Health Ventures and Growth Equity. Harry is
an executive partner with Madison Dearborn
Partners and a clinical professor of management
and strategy at Northwestern University’s
Kellogg School of Management. These
accomplished men and women have extensive
corporate experience and long track records
of success. We are very pleased these four
distinguished professionals have joined our board
to help take our company to the next level.
Lastly, I would like to thank the entire Catamaran
team. In my opinion, we have assembled one of
the finest management teams in the business.
As we work in partnership and collaboration
with our clients, our goal is to build lasting
business relationships that endure — what we
call “Clients for Life.” Together, we will continue
to create meaningful growth as we capture new
opportunities in a time of great change. Together,
we will continue to challenge convention and the
status quo. Together, we will continue to charge
ahead to solve the most pressing challenges.
On behalf of the Board of Directors, the
management team and the talented men and
women of Catamaran, thank you for your strong
and continued support. We look forward to all that
2013 will bring.
C A T A M A R A N | 2 0 1 2 A N N U A L R E P O R T
‘‘ We’ve captured the attention of the industry by challenging the traditional models and offering a compelling alternative for healthcare payers.”
—Mark A. Thierer
Mark A. Thierer Chairman & CEO

Together, we are…
the projected growth in chronic diseases is putting Specialty pharmacy front and center for most of our clients. the holistic approach employed by Briovarx™ goes beyond drug access, connecting communities and engaging and caring for people.”
3
Catamaran is charting a new course. 2012 was another record year for our company. expect to see us build on this success as we move up market and win the largest opportunities, expand our clinical services to deliver even more personalized care and innovate in the area of specialty pharmacy — the fastest-growing segment of the pBm industry.
Creating Growth
‘‘ —Albert Thigpen Senior Vice president, pharmacy operations
We are Catamaran. C a t a m a r a n | 2 0 1 2 a n n u a l r e p o r t

733.4 m2012 gross profit
362.7 m 2012 eBItDa
a 137% increase over 2011…
9.9 B2012 gross revenue
… a 99.8% increase over 2011
… a 118% increase over 2011
$
$
$
4
C a t a m a r a n | 2 0 1 2 a n n u a l r e p o r t

Challenging There’s a sea change in the PBM industry. Positively impacting the health of the 25 million lives we serve, navigating the rapidly evolving healthcare landscape and meeting our clients’ complex needs requires that we challenge conventional methods. That’s why Catamaran’s winning combination of leading technology, scale, flexibility, member choice and innovative clinical services resonates with organizations demanding a smarter alternative to the traditional PBM.
Together, we are…
In 2012, we launched BriovaRx™, a specialty pharmacy, delivering
personalized care to patients with
complex conditions.
5
We are Catamaran. C A T A M A R A N | 2 0 1 2 A N N U A L R E P O R T
for enhanced COB™

Convention
Centers of Excellence
Clinical and analytical resources are deployed locally to support quality healthcare delivery.
While the changes to healthcare are happening nationally, care is delivered locally. At Catamaran, we’ve aligned our resources and experience to create national strategies, shaped for local differences and personalized for individual patients.”
‘‘
6
C A T A M A R A N | 2 0 1 2 A N N U A L R E P O R T
—Sumit Dutta, M.D., M.B.A. Senior Vice President and Chief Medical Officer

Together, we are…
In the post-reform period, we’re poised and prepared to capture new marketshare. Our flexible technology and deep expertise in deploying programs for complex markets brings unique and compelling solutions in this groundbreaking environment.”
‘‘—Ellen Nelson, M.S.W., Ph.D.
Senior Vice President, Government Relations
7
Now is the time for leadership. In the face of unprecedented change and increasing complexity brought on by the Affordable Care Act, managing pharmacy benefits is a more challenging endeavor than ever. As we enter this new era, we’re standing up and gaining early recognition as a leading PBM that offers a unique blend of knowledge, flexibility and innovation. The trends are daunting, but this is a time of tremendous opportunity, as every single American becomes eligible to receive pharmacy benefits.
ChargingAhead
We are Catamaran. C A T A M A R A N | 2 0 1 2 A N N U A L R E P O R T
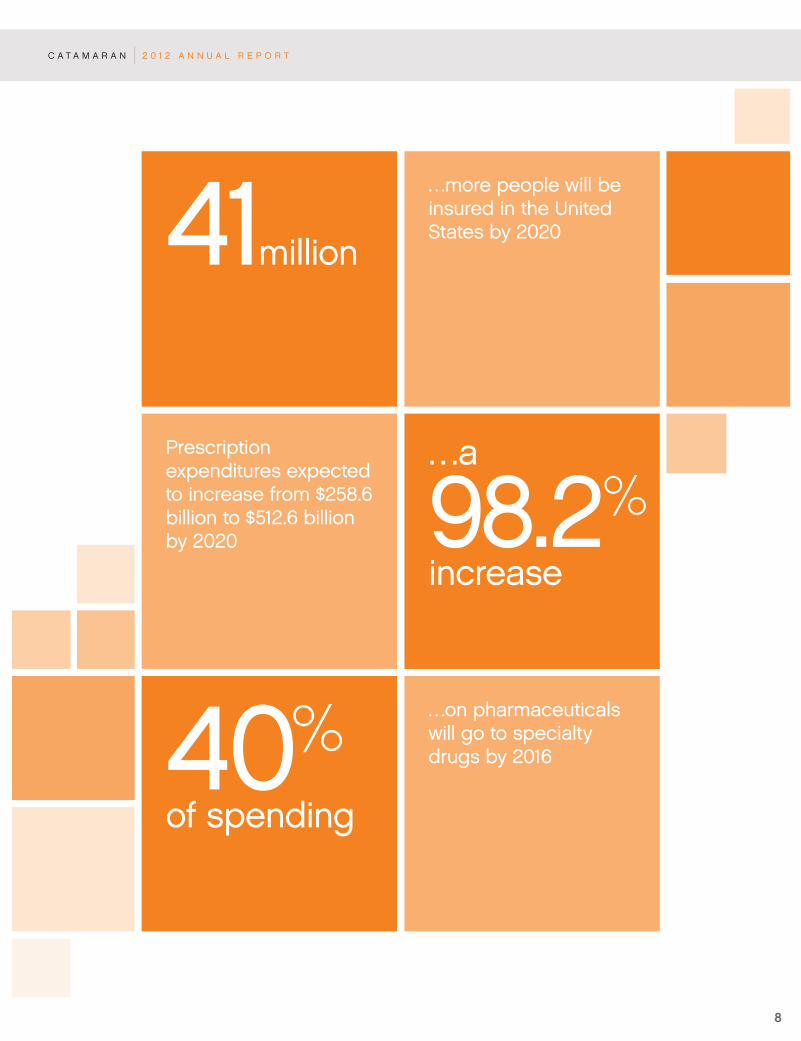
…on pharmaceuticals will go to specialty drugs by 201640%
of spending
Prescription expenditures expected to increase from $258.6 billion to $512.6 billion by 2020
…a
98.2%increase
…more people will be insured in the United States by 202041million
8
C A T A M A R A N | 2 0 1 2 A N N U A L R E P O R T
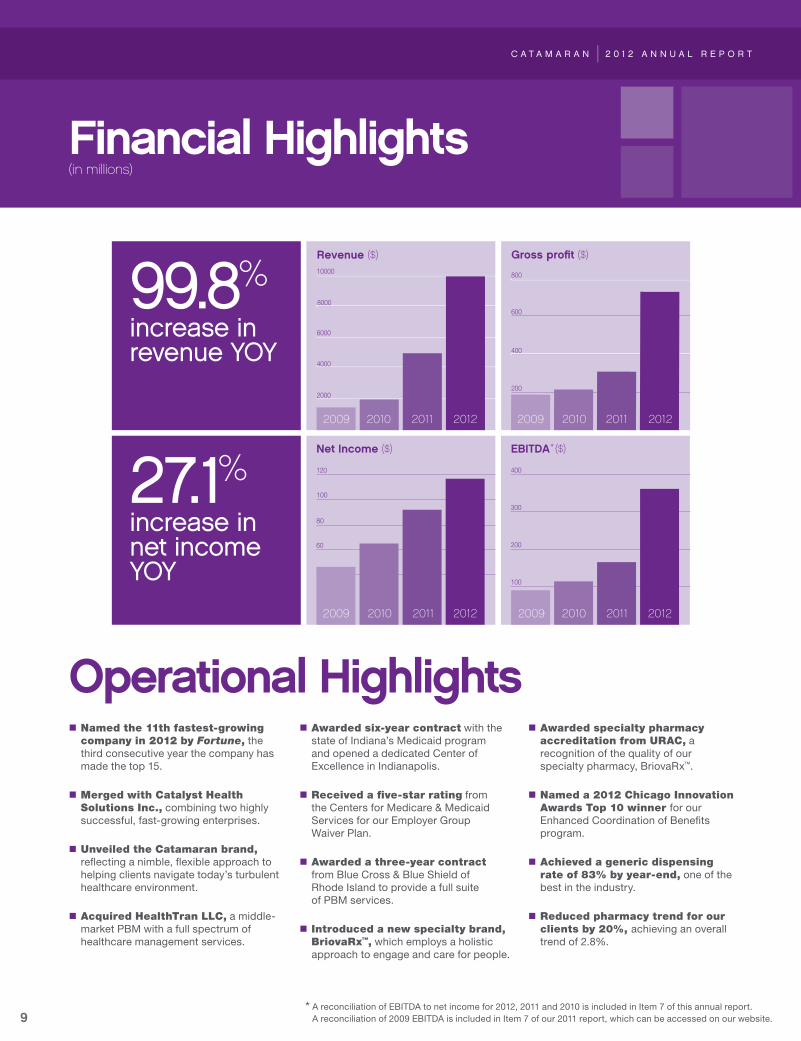
4000
6000
2000
10000
8000
Revenue ($)
2009 2010 2011 2012
400
800
200
600
Gross profit ($)
2009 2010 2011 2012
99.8% increase in revenue YOY
Net Income ($)
60
80
120
200
100
2009 2010 2011 2012
100
200
300
400
EBITDA* ($)
2009 2010 2011 2012
27.1% increase in net income YOY
* A reconciliation of EBITDA to net income for 2012, 2011 and 2010 is included in Item 7 of this annual report.
A reconciliation of 2009 EBITDA is included in Item 7 of our 2011 report, which can be accessed on our website. 9
Financial Highlights
Operational Highlights
C A T A M A R A N | 2 0 1 2 A N N U A L R E P O R T
(in millions)
Named the 11th fastest-growing company in 2012 by Fortune, the
third consecutive year the company has
made the top 15.
Merged with Catalyst Health Solutions Inc., combining two highly
successful, fast-growing enterprises.
Unveiled the Catamaran brand, reflecting a nimble, flexible approach to
helping clients navigate today’s turbulent
healthcare environment.
Acquired HealthTran LLC, a middle-
market PBM with a full spectrum of
healthcare management services.
Awarded six-year contract with the
state of Indiana’s Medicaid program
and opened a dedicated Center of
Excellence in Indianapolis.
Received a five-star rating from
the Centers for Medicare & Medicaid
Services for our Employer Group
Waiver Plan.
Awarded a three-year contract from Blue Cross & Blue Shield of
Rhode Island to provide a full suite
of PBM services.
Introduced a new specialty brand, BriovaRx™, which employs a holistic
approach to engage and care for people.
Awarded specialty pharmacy accreditation from URAC, a
recognition of the quality of our
specialty pharmacy, BriovaRx™.
Named a 2012 Chicago Innovation Awards Top 10 winner for our
Enhanced Coordination of Benefits
program.
Achieved a generic dispensing rate of 83% by year-end, one of the
best in the industry.
Reduced pharmacy trend for our clients by 20%, achieving an overall
trend of 2.8%.
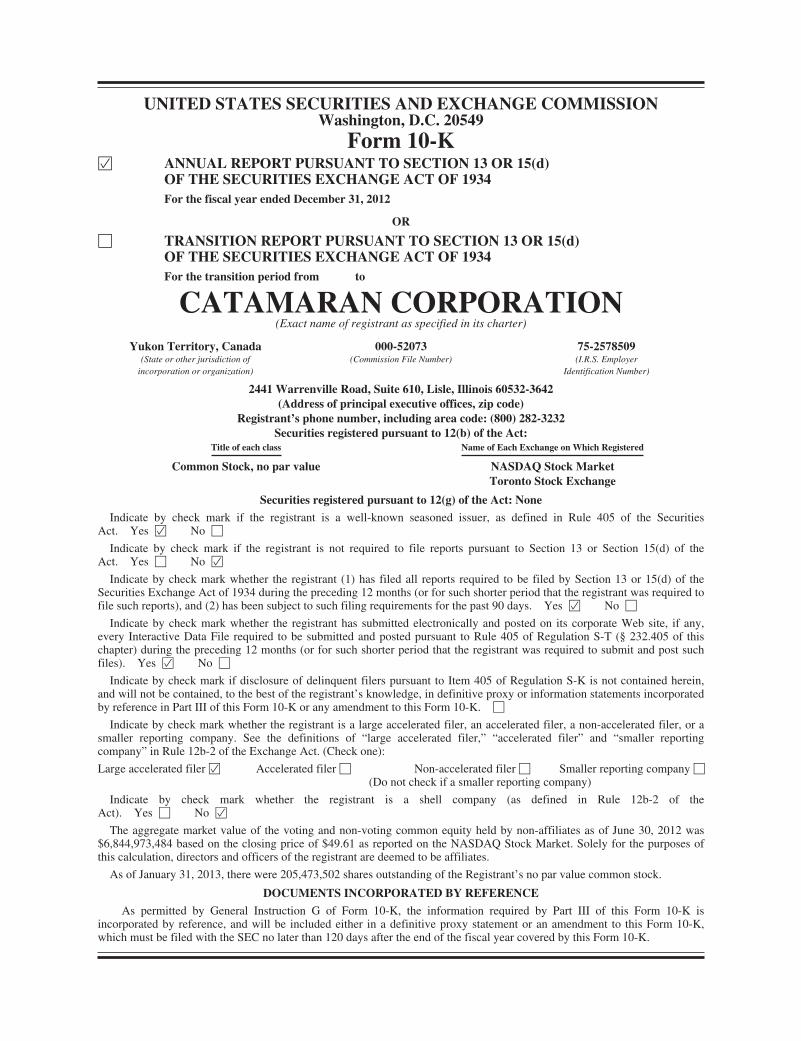
UNITED STATES SECURITIES AND EXCHANGE COMMISSIONWashington, D.C. 20549
Form 10-KÍ ANNUAL REPORT PURSUANT TO SECTION 13 OR 15(d)
OF THE SECURITIES EXCHANGE ACT OF 1934For the fiscal year ended December 31, 2012
OR
‘ TRANSITION REPORT PURSUANT TO SECTION 13 OR 15(d)OF THE SECURITIES EXCHANGE ACT OF 1934For the transition period from to
CATAMARAN CORPORATION(Exact name of registrant as specified in its charter)
Yukon Territory, Canada 000-52073 75-2578509(State or other jurisdiction ofincorporation or organization)
(Commission File Number) (I.R.S. EmployerIdentification Number)
2441 Warrenville Road, Suite 610, Lisle, Illinois 60532-3642(Address of principal executive offices, zip code)
Registrant’s phone number, including area code: (800) 282-3232Securities registered pursuant to 12(b) of the Act:
Title of each class Name of Each Exchange on Which Registered
Common Stock, no par value NASDAQ Stock MarketToronto Stock Exchange
Securities registered pursuant to 12(g) of the Act: None
Indicate by check mark if the registrant is a well-known seasoned issuer, as defined in Rule 405 of the SecuritiesAct. Yes Í No ‘
Indicate by check mark if the registrant is not required to file reports pursuant to Section 13 or Section 15(d) of theAct. Yes ‘ No Í
Indicate by check mark whether the registrant (1) has filed all reports required to be filed by Section 13 or 15(d) of theSecurities Exchange Act of 1934 during the preceding 12 months (or for such shorter period that the registrant was required tofile such reports), and (2) has been subject to such filing requirements for the past 90 days. Yes Í No ‘
Indicate by check mark whether the registrant has submitted electronically and posted on its corporate Web site, if any,every Interactive Data File required to be submitted and posted pursuant to Rule 405 of Regulation S-T (§ 232.405 of thischapter) during the preceding 12 months (or for such shorter period that the registrant was required to submit and post suchfiles). Yes Í No ‘
Indicate by check mark if disclosure of delinquent filers pursuant to Item 405 of Regulation S-K is not contained herein,and will not be contained, to the best of the registrant’s knowledge, in definitive proxy or information statements incorporatedby reference in Part III of this Form 10-K or any amendment to this Form 10-K. ‘
Indicate by check mark whether the registrant is a large accelerated filer, an accelerated filer, a non-accelerated filer, or asmaller reporting company. See the definitions of “large accelerated filer,” “accelerated filer” and “smaller reportingcompany” in Rule 12b-2 of the Exchange Act. (Check one):
Large accelerated filerÍ Accelerated filer‘ Non-accelerated filer‘ Smaller reporting company‘(Do not check if a smaller reporting company)
Indicate by check mark whether the registrant is a shell company (as defined in Rule 12b-2 of theAct). Yes ‘ No Í
The aggregate market value of the voting and non-voting common equity held by non-affiliates as of June 30, 2012 was$6,844,973,484 based on the closing price of $49.61 as reported on the NASDAQ Stock Market. Solely for the purposes ofthis calculation, directors and officers of the registrant are deemed to be affiliates.
As of January 31, 2013, there were 205,473,502 shares outstanding of the Registrant’s no par value common stock.
DOCUMENTS INCORPORATED BY REFERENCE
As permitted by General Instruction G of Form 10-K, the information required by Part III of this Form 10-K isincorporated by reference, and will be included either in a definitive proxy statement or an amendment to this Form 10-K,which must be filed with the SEC no later than 120 days after the end of the fiscal year covered by this Form 10-K.

TABLE OF CONTENTS
Page
PART I
Item 1. Business . . . . . . . . . . . . . . . . . . . . . . . . . . . . . . . . . . . . . . . . . . . . . . . . . . . . . . . . . . . . . . . . . . . . . . . . . . . . . 4
Item 1A. Risk Factors . . . . . . . . . . . . . . . . . . . . . . . . . . . . . . . . . . . . . . . . . . . . . . . . . . . . . . . . . . . . . . . . . . . . . . . . . . 21
Item 1B. Unresolved Staff Comments . . . . . . . . . . . . . . . . . . . . . . . . . . . . . . . . . . . . . . . . . . . . . . . . . . . . . . . . . . . . . . 34
Item 2. Properties . . . . . . . . . . . . . . . . . . . . . . . . . . . . . . . . . . . . . . . . . . . . . . . . . . . . . . . . . . . . . . . . . . . . . . . . . . . . 34
Item 3. Legal Proceedings . . . . . . . . . . . . . . . . . . . . . . . . . . . . . . . . . . . . . . . . . . . . . . . . . . . . . . . . . . . . . . . . . . . . . . 34
Item 4. Mine Safety Disclosures . . . . . . . . . . . . . . . . . . . . . . . . . . . . . . . . . . . . . . . . . . . . . . . . . . . . . . . . . . . . . . . . . 34
PART II
Item 5. Market for Registrant’s Common Equity, Related Stockholder Matters and Issuer Purchases of EquitySecurities . . . . . . . . . . . . . . . . . . . . . . . . . . . . . . . . . . . . . . . . . . . . . . . . . . . . . . . . . . . . . . . . . . . . . . . . . . . . . 35
Item 6. Selected Consolidated Financial Data . . . . . . . . . . . . . . . . . . . . . . . . . . . . . . . . . . . . . . . . . . . . . . . . . . . . . . 38
Item 7. Management’s Discussion and Analysis of Financial Condition and Results of Operations . . . . . . . . . . . . . 39
Item 7A. Quantitative and Qualitative Disclosures about Market Risk . . . . . . . . . . . . . . . . . . . . . . . . . . . . . . . . . . . . . 57
Item 8. Financial Statements and Supplementary Data . . . . . . . . . . . . . . . . . . . . . . . . . . . . . . . . . . . . . . . . . . . . . . . . 59
Item 9. Changes in and Disagreements with Accountants on Accounting and Financial Disclosure . . . . . . . . . . . . . 98
Item 9A. Controls and Procedures . . . . . . . . . . . . . . . . . . . . . . . . . . . . . . . . . . . . . . . . . . . . . . . . . . . . . . . . . . . . . . . . . 98
Item 9B. Other Information . . . . . . . . . . . . . . . . . . . . . . . . . . . . . . . . . . . . . . . . . . . . . . . . . . . . . . . . . . . . . . . . . . . . . . 98
PART III
Item 10. Directors, Executive Officers and Corporate Governance . . . . . . . . . . . . . . . . . . . . . . . . . . . . . . . . . . . . . . . 99
Item 11. Executive Compensation . . . . . . . . . . . . . . . . . . . . . . . . . . . . . . . . . . . . . . . . . . . . . . . . . . . . . . . . . . . . . . . . 99
Item 12. Security Ownership of Certain Beneficial Owners and Management and Related Stockholder Matters . . . 99
Item 13. Certain Relationships and Related Transactions, and Director Independence . . . . . . . . . . . . . . . . . . . . . . . . 100
Item 14. Principal Accountant Fees and Services . . . . . . . . . . . . . . . . . . . . . . . . . . . . . . . . . . . . . . . . . . . . . . . . . . . . . 100
PART IV
Item 15. Exhibits and Financial Statement Schedules . . . . . . . . . . . . . . . . . . . . . . . . . . . . . . . . . . . . . . . . . . . . . . . . . 100
Signatures . . . . . . . . . . . . . . . . . . . . . . . . . . . . . . . . . . . . . . . . . . . . . . . . . . . . . . . . . . . . . . . . . . . . . . . . . . . . . . . . . . . . . . 101
EX-4.1
EX-12.1
EX-21.1
EX-23.1
EX-10.25
EX-10.29
EX-10.38
EX-31.1
EX-31.2
EX-32.1
EX-32.2
EX-101 INSTANCE DOCUMENT
EX-101 SCHEMA DOCUMENT
EX-101 CALCULATION LINKBASE DOCUMENT
EX-101 DEFINITION LINKBASE DOCUMENT
EX-101 LABEL LINKBASE DOCUMENT
EX-101 PRESENTATION LINKBASE DOCUMENT
2
Special Note Regarding Forward-Looking Statements
This Annual Report on Form 10-K contains certain forward-looking statements, including without limitation,statements concerning Catamaran Corporation’s operations, economic performance and financial condition. Theseforward-looking statements are made pursuant to the safe harbor provisions of the Private Securities LitigationReform Act of 1995. Forward-looking statements are developed by combining currently available information withCatamaran Corporation’s beliefs and assumptions and are generally identified by the words “believe,” “expect,”“anticipate” and other similar expressions. Forward-looking statements do not guarantee future performance, whichmay be materially different from that expressed in, or implied by, any such statements. Readers are cautioned not toplace undue reliance on these forward-looking statements, which speak only as of their dates.
These forward-looking statements are based largely on Catamaran Corporation’s current expectations and aresubject to a number of risks and uncertainties, including, without limitation, those identified under “Risk Factors” andelsewhere in this Annual Report on Form 10-K. Actual results could differ materially from results referred to in theforward-looking statements. In addition, important factors to consider in evaluating such forward-looking statementsinclude changes in external market factors, changes in Catamaran Corporation’s business or growth strategy or aninability to execute its strategy due to changes in its industry or the economy in general. In light of these risks anduncertainties, there can be no assurances that the results referred to in the forward-looking statements contained inthis Annual Report on Form 10-K will in fact occur. Catamaran Corporation undertakes no obligation to, andexpressly disclaims any such obligation to, update or revise any forward-looking statements to reflect changedassumptions, the occurrence of anticipated or unanticipated events, changes to future results over time or otherwise.
3
PART I
THE COMPANY
ITEM 1. BUSINESS
The following description of the business should be read in conjunction with the information included elsewhere in thisAnnual Report on Form 10-K for the year ended December 31, 2012. This description contains forward-looking statementsthat involve risks and uncertainties. Actual results could differ significantly from the results discussed in the forward-lookingstatements due to the factors set forth in “Risk Factors” and elsewhere in this Annual Report on Form 10-K.
In July 2012, following the completion of its merger (the “Merger”) with Catalyst Health Solutions, Inc. (“Catalyst”),SXC Health Solutions Corp. unveiled a new name and brand for the combined company. The new name, CatamaranCorporation, reflects the union of two of the industry’s fastest-growing pharmacy benefit management (“PBM”) companies.In conjunction with the name change, Catamaran Corporation’s common shares began trading under the ticker “CTRX” onthe NASDAQ Stock Market and as “CCT” on the Toronto Stock Exchange. References in this Annual Report on Form 10-K to“we,” “our,” “us,” “Catamaran” or the “Company” refer to Catamaran Corporation and its directly and indirectly ownedsubsidiaries as a combined entity.
OVERVIEW
The Company is a leading provider of pharmacy benefit management (“PBM”) services and healthcare informationtechnology (“HCIT”) solutions to the healthcare benefit management industry. The Company’s product offerings andsolutions combine a wide range of applications and PBM services designed to assist its customers in reducing the cost andmanaging the complexity of their prescription drug programs. The Company’s customers include many of the largestorganizations in the pharmaceutical supply chain, such as pharmacy benefit managers, managed care organizations, self-insured employer groups, unions, third party health care plan administrators, and state and federal government entities.
The Company’s PBM services, which are marketed under the Catamaran PBM brand, include electronic point-of-salepharmacy claims management, retail pharmacy network management, mail pharmacy claims management, specialtypharmacy claims management, Medicare Part D services, benefit design consultation, preferred drug management programs,drug review and analysis, consulting services, data access, and reporting and information analysis. The Company’s PBMservices include owning and operating a network of mail and specialty pharmacies. In addition, the Company is a nationalprovider of drug benefits to its customers under the federal government’s Medicare Part D program.
The Company’s HCIT solutions include RxCLAIM®, an on-line transaction processing system that provides instantadjudication of prescription drug claims, RxMAX®, the Company’s rebate management system, RxTRACK®, the Company’sdata warehouse and analysis system, Zynchros, the Company’s suite of on-demand formulary management tools, theCompany’s pharmacy management system for retail, chain, institutional and mail-order pharmacies, as well as a number ofother software products for customers in the pharmaceutical supply chain. The Company’s HCIT solutions are available on alicense basis with on-going maintenance and support or on a transaction fee basis using an application service provider(“ASP”) model.
The Company conducts business in both the United States and Canada. For the years ended December 31, 2012, 2011and 2010, the Company recognized revenue of $9.9 billion, $5.0 billion, and $1.9 billion, respectively, in the United States,and $12.5 million, $7.5 million and $4.1 million, respectively, in Canada.
On September 6, 2012, the Company announced that its board of directors had declared a nominal dividend on the issuedand outstanding common shares of the Company to effect a two-for-one stock split. Shareholders of record at the close ofbusiness on September 20, 2012 were issued one additional common share for each share owned as of that date. Theadditional common shares were distributed on October 1, 2012. All share and per share data presented in this report have beenadjusted to reflect this stock split.
On April 17, 2012, the Company entered into a definitive merger agreement (the “Merger Agreement”) to combine theCompany and Catalyst in a cash and stock merger transaction. On July 2, 2012, the Company completed the Merger withCatalyst, a full-service PBM serving more than 18 million lives in the United States and Puerto Rico. The transaction creates acombined PBM company with an annual prescription volume of more than 250 million adjusted PBM prescription claims.Adjusted prescription claim volume equals the Company’s retail and specialty pharmacy prescriptions, plus mail pharmacyprescriptions multiplied by three. The mail pharmacy prescriptions are multiplied by three to adjust for the fact that theytypically include approximately three times the amount of product days supplied compared with retail and specialtyprescriptions. Each share of Catalyst common stock outstanding immediately prior to the effective time of the Merger (other
4
than shares held by the Company, Catalyst or any of their respective wholly-owned subsidiaries, was converted in the Mergerinto the right to receive 1.3212 Company common shares (0.6606 of a Company common share prior to the October 2012two-for-one stock split) and $28.00 in cash. This resulted in the Company issuing approximately 66.8 million shares ofcommon stock, issuing approximately 0.5 million warrants and paying $1.4 billion in cash to Catalyst shareholders tocomplete the Merger.
In January 2012, the Company completed its acquisition of HealthTran LLC (“HealthTran”), a middle market PBMbased in Denver, Colorado, in exchange for $250 million in cash, subject to certain customary post-closing adjustments.HealthTran was an existing HCIT customer of the Company and utilizes a Company platform for its claims adjudicationservices.
On October 3, 2011, the Company completed the acquisition of PTRX, Inc. (“PTRX”), a full-service PBM, and itsexclusive mail-order pharmacy provider, SaveDirectRx, Inc. (“SaveDirectRx”), both based in San Antonio, Texas. Theaggregate purchase price was $77.2 million in cash, subject to certain customary post-closing adjustments, with anopportunity for the former owners of SaveDirectRx to earn an additional $4.5 million, subject to the achievement of certainfinancial performance targets through 2012. The acquisitions of PTRX and SaveDirectRx continue upon the Company’sstrategy to acquire assets that currently utilize the Company’s technology platform in order to ease the integration into theCompany’s business.
The Company completed its acquisition of MedfusionRx, LLC (“MedfusionRx”), a leading independent specialtypharmacy provider, on December 28, 2010. The purchase price for MedfusionRx was $101.5 million in cash with anadditional $5.5 million potential earn-out payment subject to the achievement of certain financial performance targets through2012 fiscal year. The acquisition has helped expand the Company’s specialty pharmacy business and enhance its capabilitiesin this rapidly growing sector of the PBM industry.
The Company is a corporation continued under the Business Corporations Act of the Yukon Territory, Canada. TheCompany’s principal executive offices are located at 2441 Warrenville Road, Suite 610, Lisle, Illinois 60532, and thetelephone number for the Company’s principal executive office is 800-282-3232. The Company maintains a website atwww.catamaranrx.com. The information contained in, or that can be accessed through, the Company’s website is not part of,and is not incorporated into, this Annual Report on Form 10-K or other filings the Company makes with the Securities andExchange Commission (the “SEC”). The Company will make available free of charge on its website this Annual Report onForm 10-K, future quarterly reports on Form 10-Q, current reports on Form 8-K, and any amendments to those reports filed orfurnished pursuant to Section 13(a) or 15(d) of the Securities Exchange Act of 1934 as soon as reasonably practicable after theCompany electronically files such material with, or furnishes it to, the SEC.
Products, Solutions and Services
The Company’s solutions address the challenges faced by payors in the pharmaceutical supply chain. The Companyprovides comprehensive PBM systems and services, pharmacy dispensing operations and related prescription managementservices focused on reducing overhead pharmacy costs and providing members with excellent care. The Company believes itis unique in that it can deploy its solutions as:
• PBM solutions — pharmacy network management, clinical and member programs to manage drug costs using theCompany’s own system software and services;
• Web-enabled technology — the Company provides on-line transaction processing and clinical solutions throughweb-enabled, real-time technology; and
• Software solutions — licensed software products can be sold in addition to systems implementation and consultingservices and maintenance.
Payor Products and Services Offered by the Company
PBM Services
The Company’s PBM service offering consists of a broad suite of customizable services that provide a flexible and cost-effective alternative to traditional PBM offerings typically employed by health plans, government agencies and employers.The Company provides a broad range of pharmacy spend management solutions and information technology capabilities tomanaged care organizations, self-insured employer groups, unions, third party health care plan administrators, worker’scompensation payors and state and federal government entities. The Company’s customers have gained increased control of
5
their pharmacy benefit dollars and maximized cost control and quality of care through a full range of pharmacy spendmanagement services, including:
Formulary Administration — Provide support for customers’ existing formularies and preferred drug lists orcollaborate to create best-in-class models supported by formulary predictive modeling and impact analysis. Pharmacist,physician and member-focused intervention protocols provide quality controls to drive generics, preferred drug productsand appropriate use. Formularies are administered based on specific plan designs, or by enabling customers with thetools to maintain their own custom formularies online.
Benefit Plan Design and Management — Accommodate any plan design option required and support an unlimitednumber of benefit design variations. The Company specializes in applying data-driven insights to help customersunderstand the medical risk drivers within their population and take a strategic approach to plan design. The Companyprovides benefit design configuration and support to customers, in accordance with mutually developed processes.Benefit designs can be modified online, in real time, by the Company or by the customer’s staff.
Pharmacy Network Management — A wide range of retail network options, including supporting existing networksor assisting customers in developing proprietary networks that meet specific geographic access requirements, desiredprice discounts, or other service requirements. A proprietary national retail network, which consists of pharmacies in all50 states and in Puerto Rico, Guam and the Virgin Islands, provides excellent access to the Company’s customers. Weanticipate that our proprietary preferred retail network combined with targeted member communications will facilitatedeeper discounts for payers to achieve increased savings on retail prescriptions.
Drug Utilization Review (“DUR”) — Pre-dispensing DUR edit checks are performed on an online, real-time basisbetween mail and retail pharmacies to encourage appropriate drug utilization, enhance member outcomes, and reducedrug costs. All prescriptions are checked for member eligibility and plan design features and are then compared againstprevious histories of prescriptions filled by the same pharmacy, by other participating retail network pharmacies and bythe mail service pharmacy.
Clinical Services and Consulting — Clinical and technical expertise are used to develop, deploy, and support theCompany’s clinical programs. Customers have the option of using selected or the full suite of the Company’s clinicalprograms, which incorporate complete prescription drug information to reduce prescription drug costs and increase thequality of care and member safety. These programs incorporate real-time risk prediction profiling technology, givingforward-looking insights needed to improve member outcomes and better manage utilization trends. The Company offerscomprehensive clinical management strategies which help reduce undesirable events, increase medication compliance,decrease medication waste, and promote plan member well-being.
Reporting and Information Analysis Solutions — Providing two main levels of reporting: A comprehensivereporting package (which includes a large menu of unique reports), and an online analytical decision support tool,RxTRACK®, designed to provide flexibility for customized reporting. The Company uses customer plan data andindustry benchmark data to drive proactive discussions regarding opportunities to increase savings.
Mail and Specialty Pharmacy Services — The Company offers mail and specialty services to its PBM members, aswell as other members of its pharmacy network. Mail service gives members flexibility, privacy, and easy access to theirmaintenance medications while offering significant plan savings to the customer. To provide a higher standard of serviceand to assert greater control over outcomes for clients, the Company offers full-service, state of the art mail servicepharmacies that provide high quality service, member support and convenient, easy-to-use mail service deliverythroughout the U.S. Projected savings for mail service are dependent on plan design features, including co-payments andincentives, and utilization patterns.
Specialty service offers customers the ability to control spending on specialty medications and ensure patientsreceive the necessary, personalized support for complex medication, in one of the fastest growing sectors ofpharmaceutical spending. The Company’s specialty therapy medication management program uses a highly-trained andspecialized clinical staff organized in disease pods, a patient-centric approach and evidence-based clinical treatmentprotocols. The patient care team communicates with the patient, patient’s physician, and other caregivers as needed toobtain a complete medical and pharmacy history and then craft an individualized treatment plan including patienteducation, counseling and expected therapy outcomes. Plan savings are achieved as the cost for specialty medicationusing this program is generally lower than retail pricing.
Web Services — A suite of web-based services that enables customers to interact with the claims processing systemusing a standardized protocol in a secure environment. This method of access provides the Company’s clients with thefreedom to build products, tools, and reports that utilize data throughout their enterprises. Once the raw data is collectedin house, it can be used by the customer as appropriate, thus providing far greater flexibility and return on investment.
6
A member website, RxPORTAL™, invites members to learn more about their prescription benefit programs,medication histories, drug information and related industry news. This site also features a real-time trial adjudicationprogram that gives members the information they need to make informed, cost-effective choices regarding theirprescription therapy. This site can be customized with a customer’s logo and name, and links to the organization’sinternal website.
A member mobile application enables members to make smart prescription choices. The application is a member-focused application that includes functionality similar to the member website and is available for multiple mobile deviceplatforms. The application also extends standard website features possible with a GPS-enabled device.
RxPROVIDER PORTALTM is a web-based interface that allows pharmacists and physicians to obtain informationfrom RxCLAIM® on a member’s plan to assist in providing more cost effective prescription medications. The portalgives providers the ability to view claim details, remittance advice and eligibility, and perform prior authorizationsonline.
Healthcare IT
The Company’s HCIT offerings deliver applications on a license, ASP, or fee-for-service basis to customers whoadminister and manage pharmacy benefits. Catamaran has achieved a broad industry footprint by deploying technology tohelp healthcare companies manage the rising prescription drug costs and enhance the level of care they provide.
HCIT products and services serve a diversified group of payor customers that include health plans, federal, state andprovincial government programs, pharmacy benefit managers, workers’ compensation programs, and long-term and/orchronic care facility operators. In addition, Catamaran’s robust and flexible technology serves as the engine for theCompany’s full-service PBM solutions.
Technology Products and Services
RxCLAIM® is an on-line transaction processing system designed to provide real-time on-line adjudication of third-partyprescription drug claims at the point of service, including claims management and cost-effective review, as well as paymentand billing support and real-time functionality for updating benefit, price, member, provider and drug details. RxCLAIM® isdesigned to provide the Company’s customers with automation efficiencies, flexibility and control by facilitating the real-timeprocessing of pharmacy claims and payments against eligibility, plan benefits, formularies, price, drug utilization review,prior authorization, and rebates in addition to many other features.
Other products
• RxBUILDERTM is a web-based interface for formulary creation and maintenance utilizing a Medi-Span® basedproduct file. This rules-based approach minimizes the work of list building and maintenance operations and capturesefficiencies in sharing formulary information between lines of business.
• RxPORTALTM allows customers to interact with the patient’s formulary and drug history in a secure environmentallowing patients and health plans to access industry leading tools and the most recently available information.
• RxAUTHTM is a prior authorization (“PA”) management solution which offers flexibility and efficiency inautomating the PA process from end-to-end. Built upon the powerful PA capabilities housed in RxCLAIM®,RxAUTHTM supports the entire PA lifecycle, from receipt of the request, through rules adjudication, to execution ofthe resulting decision. RxAUTHTM is also available in a web-based application.
• RxMAX® is a rebate management system that is designed to assist health plans in managing their relationships withpharmaceutical manufacturers through contract management, record keeping, calculating market share, and creatingbilling details and summaries.
• Zynchros provides a suite of on-demand formulary management tools to help payors effectively manage theirformulary programs, and to maintain Medicare Part D compliance in their programs.
• Enhanced Coordination of Benefits integrates external data sources with unique algorithms and eligibility data toidentify beneficiaries with other coverage. This enables accurate identification of third party liability in real-timeprior to the claim being paid.
7
Medicare Part D
Since the inception of the Medicare Part D program, the Company has offered a comprehensive array of services to theMedicare marketplace, all compliant with Centers for Medicare and Medicaid Services (“CMS”) regulations and configuredto meet the challenges of a rapidly changing and growing pharmaceutical landscape.
As a full-service PBM and a National Prescription Drug Plan, the Company supports a wide variety of Medicare Part DPlan Sponsors. The Company provides prescription benefit management support for Medicare Advantage Prescription Drugplans (“MAPDs”) and prescription drug plans (“PDPs”), including implementation of specific Medicare Part D plan designs,creation and maintenance of Medicare Part D formularies (including CMS submission), CMS reporting requirements andconsultative, proactive account management.
The Industry
The Company believes the key market factors that influence spending on information technology solutions and servicesby participants in the pharmaceutical supply chain are the amount spent on prescription drugs and the associated volume ofprescription drugs dispensed and insurance claims processed each year. According to IMS Health (“IMS”), approximately4.4 billion pharmacy prescriptions were written and filled in the United States during 2011 — representing a retail value inexcess of $320 billion. Based on the factors described below, the Company expects drug utilization rates to continue to rise inthe future. The Company estimates that the current market opportunity for its information technology and services in itsindustry is significant, and is growing at a rate in excess of the drug utilization rate alone due to the following factors:
Aging population. According to the U.S. Census Bureau, the U.S. population is expected to age rapidly through2030, when 19.5% of the population will be over the age of 65, compared to 12.0% in 2000. Older Americans requiremore medications than their younger counterparts — often 20 to 40 prescriptions annually, according to CMS. Accordingto the Kaiser Family Foundation (“Kaiser”), the number of prescriptions purchased in the U.S. increased 39% from 1999to 2009, while the population only grew 9%. The increase in prescriptions due to an aging population is expected to drivedemand for senior-focused clinical programs and benefit plans, as well as information technology decision support toolsto facilitate on-line analytical assessment of specific population trends, which will address the PBM needs of an agingpopulation.
Rising drug prices. According to Canadian Imperial Bank of Commerce (“CIBC”), healthcare costs in the U.S. areprojected to increase at a compounded annual growth rate of 5.5% from $2.6 trillion in 2010 to $4.6 trillion in 2020.Retail prescription prices have increased on average 3.6% annually between 2000 and 2009, according to Kaiser, a ratewhich is higher than the average inflation rate during that same period of 2.5%. Prescription drug costs are expected torise at a compounded annual growth rate of 6.4% over the next 10 years. Industry solutions to counter rising drug pricesinclude tools to identify clinically appropriate cost-savings opportunities, supporting clinical programs that help promotegeneric and clinically equivalent, lower-cost preferred drug products, utilization management programs, such as PA andstep-therapy, to help ensure that patients who can benefit from therapies are identified and that cost-effective treatment isencouraged, and tools to identify clinically appropriate, cost-saving opportunities.
Health information technology stimulus. During 2009, the U.S. government enacted an approximately $20 billionstimulus package to spur the usage of electronic health records in the U.S. The package provides incentive payments toproviders or hospitals to become meaningful users of electronic health records. The goal is to create a nationalinfrastructure of health information technology to help improve health care quality, reduce health care costs, and addsecurity to patient health records. The Company believes this program will fundamentally change the methods andmanner in which health information records are shared, stored, and utilized.
Health care reform. The Company is focused on three pillars of healthcare reform:
1. Delivery Reforms — access, adequacy, consumer -centric care and choice, accountable partnering ofproviders, organization and care delivery teams. The Company is developing new paradigms for pharmacy benefitmanagement and technology as tools to assist with delivery reform. Examples of delivery reforms are Accountable CareOrganizations, Consumer Oriented and Operated Health Plans and Dual Demonstration Projects.
2. Reimbursement Reforms — consumers will select insurance through private and public health insuranceexchanges. All Americans will be eligible. The public sector will be the largest payer. As such, we anticipate that thegovernment will set the ‘floor’ for benefits and regulate standards of care and fee for service will increasingly yield topay for performance. The Company is examining emerging reimbursement reforms and is developing new approaches tomake pharmacy benefits affordable, manageable and performance oriented.
8

3. Outcomes or Evidenced Based Practice Reforms — the Company will be helping to design, manage andprice pharmacy benefits along a continuum with multiple payers including the federal, state, employer and the individualemployee/citizen, in an effort to manage and document the results of effective pharmacy management.
Health care reform creates opportunities for growth for the Company and cost-effective options for its clients.
Medicare Part D. Medicare Part D is a program that subsidizes the costs of prescription drugs for Medicarebeneficiaries. This program is heavily regulated with rules that can and do change on a regular basis. Ongoing regulatorychanges by CMS will continue to fuel the future demands of this program. Medicare Part D has impacted the demand forpharmacy benefit management as well as information technology, as the Company’s customers are required to updatetheir systems, and the Company believes they will continue to require support to maintain these systems.
Growth in Specialty Drug Class. During 2011, specialty drug spend continued to grow at a double digit pace andaccording to Health Industries Research Company (“HIRC”), specialty drug spend will increase from $49 billion, or18%, of the prescription drug spend in 2006 to $162 billion or 40% of the prescription drug spend by 2016. There is amove to shift coverage of these drugs from the medical benefit to the pharmacy benefit. The Company believes thismovement presents opportunities for its specialty pharmacy program. In addition, we believe growth in new medicationsand development of biosimilars will create market share and rebate opportunities.
Generic Pipeline. According to IMS, products representing approximately $7 billion in annual sales that arecurrently subject to patent protection in the U.S. are expected to expire and face the prospect of generic competition in2013. Also according to IMS, over the next five years, branded drugs representing approximately $39 billion in annualsales that are currently subject to patent protection in the U.S. are expected to expire, fueling growth in the availability ofgeneric equivalents. Key drugs with patents expiring between 2013 and 2016 include Cymbalta, Abilify, Nexium,Copaxone, Celebrex, Gleevec and Crestor. The Company believes that this presents an opportunity for cost savings forthe Company and its customers.
Competition
The Company competes with numerous companies that provide the same or similar services. Its competitors range fromlarge publicly traded companies to several small and privately owned companies which compete for a significant part of themarket. The principal competitive factors are quality of service, scope of available services, and price. The ability to becompetitive is influenced by the Company’s ability to negotiate prices with pharmacies, drug manufacturers, and third partyrebate administrators. Market share for PBM services in the United States is highly concentrated, with a few national firms,such as Express Scripts, Inc., CVS/Caremark Corporation and OptumRx, a UnitedHealth Group Company, controlling asignificant share of prescription volume. Some of the Company’s competitors have been in existence for longer periods oftime and are better established. Some of them also have broader public recognition and substantially greater financial andmarketing resources. In addition, some of the Company’s customers and potential customers may find it desirable to performfor themselves those services now being rendered by the Company.
The Company’s ability to attract and retain customers is substantially dependent on its capability to provide competitivepricing, efficient and accurate claims management, utilization review services and related reporting and consulting services.
The payer and pharmaceutical supply chain markets require solutions which address the unique needs of eachconstituent. The Company’s customers require robust and scalable technology solutions, as well as the ability to ensure costefficiency for themselves and their customers. The Company’s product offerings include a wide range of PBM services andsoftware products for managing prescription drug programs and for drug prescribing and dispensing. The Company’s payersuite of products includes a wide range of pharmacy benefits management and claims adjudication systems.
Competitive Strengths
The Company believes that the following competitive strengths are the keys to its success:
Flexible, customized and independent services: The Company believes a key differentiator between itself and itscompetitors is not only the Company’s ability to provide innovative PBM services, but also to deliver these services onan à la carte basis. The Catamaran suite offers the flexibility of broad product choice along the entire PBM continuum,enabling enhanced customer control, solutions tailored to the Company’s customers’ specific requirements, and flexiblepricing. The market for the Company’s products is divided between large customers that have the sophisticatedtechnology infrastructure and staff required to operate a 24-hour data center and other customers that are not able orwilling to operate these sophisticated systems.
9

The Company’s business model allows its large customers to license the Company’s products and operate theCompany’s systems themselves (with or without taking advantage of the Company’s significant customization,consulting and systems implementation services) and allows its other customers to utilize the Company’s systems’capabilities on a fee-per-transaction or subscription basis through ASP processing from the Company’s data center.
Leading technology and platform: The Company’s technology is robust, scalable, and web-enabled. The platform isable to instantly cross-check multiple processes, such as reviewing claim eligibility, adverse drug reaction and properlycalculating member, pharmacy and payer payments. The Company’s technology is built on flexible, database-driven rulesets and broad functionality applicable for most any type of business. The Company believes it has one of the mostcomprehensive claims processing platforms in the market.
The Company’s technology platform allows it to provide more comprehensive PBM services by offering customersa selection of services to choose from to meet their unique needs versus requiring them to accept a one-size-fits-allsolution. The Company believes this à la carte offering is a key differentiator from its competitors.
Measurable cost savings for customers: The Company provides its customers with increased control over traditionaland specialty prescription drug costs and drug benefit programs. The Company’s pricing model and flexible productofferings are designed to deliver measurable cost savings to the Company’s customers. The Company believes its pricingmodel is a key differentiator from its competitors for the Company’s customers who want to gain control of theirprescription drug costs. For customers who select the Company’s pharmacy network and manufacturer rebate services ona fixed fee per transaction basis, there is clarity to the rebates and other fees payable by the pharmaceutical manufactureror third party rebate administrator to the customer. The Company believes that its pricing model together with theflexibility to select from a broad range of customizable services helps the customers realize measurable results and costsavings.
Business Strategy
The Company seeks to enhance its position as a leading provider of technology-enabled PBM services to thepharmaceutical supply chain in North America. The Company’s primary strategies are:
• Expand the breadth of the Company’s PBM services for health plans, self-insured employers and governmentagencies that sponsor pharmacy benefit plans: Within the Company’s suite of products, several key initiatives areunderway which the Company believes will help it to expand its revenue per claim and make the Company morecompetitive in the broader market. The Company combines its scale and its claims processing capabilities with afull suite of PBM services to offer competitively priced pharmacy networks, specialty drug and mail orderprograms, manufacturer rebate contracts and clinical programs to enable the Company’s customers to have morecontrol over their drug spending. With the Company’s diversified product portfolio and the market demand forgreater transparency in pricing of prescription drugs, the Company believes it is in an attractive market environmentto prosper.
• Target Fortune 500 employers: With the consolidation of the PBM industry, these employers have fewer choicesand often have the need for customized solutions. The Company believes that its scale and flexible approach makethis an attractive market.
• Provide additional PBM services to the Company’s existing payer customer base: Based on the success theCompany has had to date, the Company intends to cross-sell additional services to the Company’s existingcustomers through its suite of PBM products which include the Company’s mail and specialty pharmacy services, aswell as the Company’s competitive pharmacy network and clinical offerings. The Company may also make capitalinvestments in technology to further improve the quality of its products. By providing a broader range of services,the Company believes that it can increase its customer base and the breadth of products utilized by each customer,thereby increasing the Company’s revenue base.
• Target HCIT clients for “pull-through” PBM sales opportunities: The Company has been successful in workingwith current HCIT clients to provide PBM services, such as the retail pharmacy network and formularyadministration. The Company will continue to pursue “pull-through” opportunities with existing HCIT clients aspart of its organic growth strategy.
• Target large public sector fee-for-service opportunities: Based on the success the Company has had to date withpublic sector opportunities, it intends to sell additional services to state, federal, and provincial Medicaid plans. TheCompany sells PBM technology solutions to support pharmacy claims processing, Medicaid rebate management,and sophisticated pharmacy claims prior authorization workflow and processing, among other services.
10

• Continue to target Medicare Part D opportunities: The Company has expanded its presence in the Medicare Part Dmarket and continues to develop compliance, clinical and information technology capabilities to effectively managethe dynamic nature of this market.
• Aggressively pursue large health plan technology upgrades: The Company’s goal is to be the industry’s leadingprovider of tools, technology and services to help its customers better manage pharmacy programs, and in turn, toreduce the cost of drug delivery and enhance the healthcare experience for their plan members.
• Pursue strategic acquisition opportunities: The Company actively evaluates opportunities to expand its productofferings and customer base through strategic acquisitions, such as the recent Merger with Catalyst, as well as therecent acquisition of HealthTran. The Company’s acquisition strategy focuses on identifying acquisitionopportunities that expand its core footprint in the PBM market, add new products and services in potential highgrowth areas and provide additional scale in areas such as specialty pharmacy management, oncology or publicsector pharmacy (including state Medicaid). The Company believes that its management team’s proven ability tosuccessfully identify acquisition opportunities that are complementary and synergistic to its business and tointegrate them into its existing operations with minimal disruption has played, and will continue to play, animportant role in the expansion of its business.
• Continue to expand and adapt capabilities to create opportunities related to healthcare reform: The Company isdeveloping new paradigms to support healthcare delivery reform, which include accountable care organizations,Health Plan Co-ops and dual demonstration projects. The Company is also examining emerging reimbursementreforms and adapting new approaches that make pharmacy benefits affordable, manageable and performance-oriented. Finally, the Company will continue to develop the technology and other resources to track consumersacross public and private insurance exchanges, to manage requirements and to document the pharmacy performanceagainst payment and quality standards. The Company believes that healthcare reform will create expansionopportunities.
• Continue to evolve and expand the specialty offering: The Company will continue to invest in development ofeffective cost management programs for its specialty pharmacy services. In addition, the Company will continue todevelop clinical and reporting capabilities to help drive pharmacy and physician referrals.
• Broaden the Company’s services, technology and markets through next generation growth opportunities: TheCompany continues to pursue next generation growth opportunities through proprietary development of newtechnology applications and new PBM services. The Company currently has a number of tools that are available toits HCIT customers to facilitate coordination of benefits, e-prescribing and other electronic health record keeping.The Company believes that this market will continue to grow and offers an excellent opportunity to complement theCompany’s PBM services and further enhance its product offerings. In addition, the Company believes that thehealthcare reform law, which contemplates an expansion of coverage and emphasis on technology improvements inhealthcare services (such as e-prescribing), offers a number of potential growth opportunities.
GOVERNMENT REGULATION
Various aspects of our business are governed by federal and state laws and regulations. Because sanctions may beimposed for violations of these laws, compliance is a significant operational requirement. We believe that we are insubstantial compliance with all existing legal requirements material to the operation of our businesses. There are, however,significant uncertainties involving the application of many of these legal requirements to our business. In addition, there arenumerous proposed health care laws and regulations at the federal and state levels, many of which could adversely affect ourbusiness, results of operations, and financial condition. We are unable to predict what additional federal or state legislation,regulations or enforcement initiatives may be enacted or taken in the future relating to our business or the health care industryin general, or what effect any such legislation, regulations or actions might have on us. We cannot provide any assurance thatfederal or state government authorities will not impose additional restrictions or adopt interpretations of existing laws orregulations that could have a material adverse effect on our business or consolidated results of operations, financial position orcash flow from operations.
Federal Laws and Regulations Affecting Our PBM Business
The following descriptions identify various federal laws and regulations that affect or may affect aspects of our PBMbusiness:
Legislation and Litigation Affecting Drug Prices.
Average wholesale price, or AWP, is a standard pricing metric published by third party data sources and currently usedthroughout the pharmacy benefits industry as the basis for determining drug pricing under contracts with clients, pharmacies,
11

and pharmaceutical manufacturers. The calculation and reporting of AWP have been the subject of investigations by federaland state governments and litigation brought against pharmaceutical manufacturers, as well as data services that report AWP.While we are not responsible for calculations, reports or payments of AWP, investigations or lawsuits involving AWP couldaffect our business because many of our customer contracts, pharmaceutical purchase agreements, retail network contractsand other agreements use AWP as a pricing benchmark. In March 2009, a federal district court gave final approval to thesettlement of class action lawsuits brought against First DataBank, or FDB, and Medi-Span, two primary sources of AWPreporting. Under the terms of the settlement, FDB and Medi-Span agreed to reduce the reported AWP of certain prescriptiondrugs by four percent, effective September 26, 2009. In response to this action, we, as authorized in most of our standardcustomer contracts, adopted a revised pricing benchmark to assure cost neutrality for us, our customers, and pharmacies as towhat they paid or received, as applicable, for prescription drug products using the AWP pricing benchmark beforeSeptember 26, 2009 and what they would pay or receive on or after September 26, 2009. In addition, FDB discontinued thepublishing of AWP in September 2011. Although Medi-Span continues to publish AWP, it is possible that the pharmaceuticalindustry may evaluate or develop an alternative pricing reference to replace AWP. We will continue to work with our PBMclients and other payers to anticipate and mitigate the impact of possible future changes to applicable references for pricingpharmaceuticals.
Legislation and Regulation of Medicare Advantage and Medicare Part D.
The Medicare voluntary outpatient prescription drug benefit, known as Part D, established under the MedicarePrescription Drug, Improvement, and Modernization Act of 2003, or MMA, became effective on January 1, 2006. The MMAalso created new guidelines for Medicare health maintenance organizations, or HMOs, termed Medicare Advantage Plans(“MA-PDs”), which offer both an outpatient prescription drug benefit and health care coverage.
Medicare beneficiaries who elect Medicare Part D coverage pay a monthly premium for the covered outpatient drugbenefit. Assistance with premiums and cost sharing for outpatient drugs are provided to eligible low-income beneficiaries.The voluntary outpatient prescription drug benefit requires coverage of essentially the same pharmaceuticals that are approvedfor the Medicaid program, although selection may be restricted through a formulary. Beneficiaries can enroll in the outpatientprescription drug benefit through standalone Prescription Drug Plans (“PDPs”), available in 34 regions across the UnitedStates and the District of Columbia, as well as five separate regions for the U.S. territories, or through MA-PDs that offerintegrated drug coverage with other health care coverage in 26 regions across the United States.
As a PDP sponsor and in our capacity as a subcontractor with certain PDP sponsor clients (including employer groupwaiver plans, or “EGWPs”) and MA-PD sponsor clients (collectively, “Part D Plans”) to provide PBM services, we aresubject to certain federal rules, regulations, and sub-regulatory guidance pertaining to the operation of Medicare Part D. IfCMS determines that we have not performed satisfactorily as a subcontractor, CMS may request our Part D Plan client torevoke its Medicare Part D activities or responsibilities. While we believe that we provide an appropriate level of serviceunder our respective contract and subcontracts, we can give no assurances that CMS or a Part D Plan will not terminate ourbusiness relationships insofar as they pertain to Medicare Part D.
Among other things, Part D Plans are subject to provisions of the MMA intended to deter “fraud, waste and abuse” andare strictly monitored by CMS and its Medicare Drug Integrity Contractors to ensure that Part D program funds are not spentinappropriately. In addition, the fraud, waste and abuse provisions of CMS Medicare Prescription Drug Benefit Manual cite,among others, the following examples of potential PBM fraud, waste and abuse risks in connection with Part D: prescriptiondrug switching, unlawful remuneration, inappropriate formulary decisions, prescription drug splitting or shorting, and failureto offer negotiated prices. CMS has offered additional sub-regulatory guidance regarding some of these risk areas, particularlywith respect to the Part D formulary decision making process which is highly regulated by CMS. No assurance can be giventhat we will not be subject to scrutiny or challenge under one or more of the underlying laws by the government enforcers orprivate litigants.
CMS requires Part D Plans to report 100% of all price concessions received for PBM services, and Part D Plans must usethe amount paid to a pharmacy as the basis for determining cost sharing for beneficiaries and for reporting a plan’s drug coststo CMS. This CMS guidance suggests that best practices would mandate Part D Plans to contractually require the right toaudit their PBMs, as well as require complete transparency as to manufacturer rebates paid for drugs provided under the PartD Plan, including the portion of such rebates retained by the PBM as part of the price concession for the PBM’s services.Additionally, CMS requires Part D Plans to ensure through their contractual arrangements with first tier, downstream andrelated entities (which would include PBMs) that CMS has access to such entities’ books and records pertaining to servicesperformed in connection with Medicare Part D. CMS also suggests that Part D Plans should contractually require their firsttier, downstream and related entities to comply with certain elements of the Part D Plan’s compliance program.
12
The Patient Protection and Affordable Care Act (Public Law 111-148) (“PPACA”), as amended by the Health Care andEducation Reconciliation Act of 2010 (Public Law 111-152) (collectively, the “Health Care Reform Laws”), made changes toMA-PDs that are likely to result in significant reductions in government payments to the plans and reduced enrollmentnumbers. Those individuals leaving an MA-PD are expected to transition into the traditional Medicare program, making thenet financial effect on our activities uncertain. The Health Care Reform Laws also made changes to the Medicare Part Dprogram that could have an impact on our business. These new provisions include changes in the way drugs are paid for underthe so called “coverage gap,” creation of protected classes of drugs that have an impact on formularies and allow thegovernment more control over formularies, reductions in the subsidies provided to higher income individuals and changes indispensing requirements in long-term care facilities. Some of these changes may have a positive impact and others may have anegative impact on our revenues and business model.
Federal Anti-Kickback Laws.
The federal Anti-Kickback Statute (the “AKS”) is a criminal law that prohibits, among other things, an individual orentity from knowingly or willfully paying or receiving, subject to certain statutory exceptions and regulatory safe harbors, anyremuneration, directly or indirectly, intended to induce: (1) a referral for the furnishing of any item or service for whichpayment may be made in whole or in part under a federal health care program, such as Medicare, Medicaid and theDepartment of Defense health care program, known as the Tricare Program, or (2) the purchase, lease, order or the arrangingfor or recommending of the purchase, lease, or order of items or services for which payment may be made in whole or in partunder federal health care programs. Penalties for violating the AKS may include imprisonment, criminal and civil fines, andexclusion from participation in the federally-funded health care programs.
The AKS has been interpreted broadly by courts; the U.S. Department of Health & Human Services (“HHS”), Office ofInspector General (the “OIG”), the agency charged with the enforcement of the AKS; and other administrative bodies.Because of the statute’s broad scope and limited statutory exceptions, the OIG has established certain regulatory safe harborswhich, if fully met, should immune the parties from liability under the AKS. For example, safe harbors exist for certainproperly disclosed and reported discounts received from vendors, certain investment interests, certain properly disclosedpayments made by vendors to group purchasing organizations, certain personal services arrangements, and certain discountand payment arrangements between PBMs and HMO risk contractors serving Medicaid and Medicare members. A practicethat does not fall within a statutory exception or a regulatory safe harbor is not necessarily unlawful, but may be subject toscrutiny and challenge. Some, though not all, court opinions interpreting the AKS have focused primarily on the law’s intentrequirement and have held that an arrangement will violate the AKS if any one purpose of the arrangement is to inducereferrals or purchases, even if the payments at issue are also intended for a legitimate purpose. Thus, a violation of the statutemay occur even if only one purpose of a payment arrangement is to induce patient referrals or purchases of products orservices that are reimbursed by federal health care programs. Among the practices that have been identified by the OIG aspotentially improper under the statute are certain product conversion programs in which benefits are given by drugmanufacturers to pharmacists or physicians for changing a prescription, or recommending or requesting such a change, fromone drug to another. The AKS has been cited as a partial basis, along with state consumer protection laws discussed below, forinvestigations and multi-state settlements relating to financial incentives provided by drug manufacturers to retail pharmaciesand to PBMs in connection with such programs.
In May 2003, the OIG issued the “Final OIG Compliance Program Guidance for Pharmaceutical Manufacturers” (the“Compliance Guidance”). The Compliance Guidance provides the OIG’s views on the fundamental elements ofpharmaceutical manufacturer compliance programs. The Compliance Guidance also highlights several potentially riskyarrangements involving pharmaceutical manufacturers, including the provision of grants, “prebates” and “upfront payments”to PBMs to support disease management programs and therapeutic interchanges. In addition, the Compliance Guidanceindicates that the provision of rebates or other payments to PBMs by pharmaceutical manufacturers may potentially triggerliability under the AKS, if not properly structured and disclosed.
The Health Care Reform Laws made two important clarifications that significantly strengthen the government’s ability toenforce the AKS. First, the Health Care Reform Laws clarified that a person need not have actual knowledge of or specificintent to violate the AKS. Second, the Health Care Reform Laws made clear that a claim resulting from an AKS violationconstitutes a false claim under the federal False Claims Act (the “FCA”). The provision codifies what some federal districtcourts had already held and significantly heightens the civil penalties we could face for any alleged AKS violation.
Additionally, it is a crime under the Public Contract Anti-Kickback Act, for any person to knowingly and willfully offeror provide any remuneration to a prime contractor to the United States, including a contractor servicing federally fundedhealth programs, in order to obtain favorable treatment in a subcontract. Violators of this law also may be subject to civilmonetary penalties.
13

We believe that we are in substantial compliance with the legal requirements imposed by such anti-kickback laws andregulations. However, there can be no assurance that we will not be subject to scrutiny or challenge under such laws orregulations. Any such challenge could have a material adverse effect on our business, results of operations, financial conditionor cash flows.
Federal Statutes Prohibiting False Claims.
The FCA imposes liability for knowingly making or causing to be made false claims to the government, includingfederal health care programs such as Medicare and Medicaid. For example, potential false claims include claims for servicesnot rendered, or claims that misrepresent actual services rendered in order to obtain higher reimbursement. Private individualsmay bring qui tam or whistleblower lawsuits against providers under the FCA, which authorizes the payment of a portion ofany recovery to the individual bringing suit. Such actions are initially required to be filed under seal, pending their review bythe Department of Justice (the “DOJ”). Federal district courts have interpreted the FCA as applying to claims forreimbursement that violate the AKS or the federal physician self-referral law, commonly referred to as the “Stark Law,” undercertain circumstances. The Health Care Reform Laws expanded false claims liability by clarifying that an AKS violation canbe a predicate for a false claim under the FCA and by adding a provision that imposes FCA liability on an individual or entitythat fails to make a timely return of any overpayments received from Medicare or Medicaid. The FCA generally provides forthe imposition of civil penalties and for treble damages, resulting in the possibility of substantial financial penalties for smallbilling errors that are replicated in a large number of claims, as each individual claim could be deemed to be a separateviolation of the FCA. Criminal provisions that are similar to the FCA provide that a corporation may be fined if it is convictedof presenting to any federal agency a claim or making a statement that it knows to be false, fictitious or fraudulent to anyfederal agency. A number of qui tam cases have been brought against PBMs under the FCA and various analogous state laws,several of which have involved significant civil settlements. In recent years, federal and state government authorities havelaunched several initiatives aimed at uncovering practices that violate false claims or fraudulent billing laws, and they haveconducted numerous investigations of pharmaceutical manufacturers, PBMs, pharmacies and health care providers withrespect to false claims, fraudulent billing and related matters.
We directly contract with the federal government to provide services to beneficiaries of federally funded health careprograms and, in that role, submit claims directly to the federal government. In addition, we contract with and provideservices to entities or organizations that are federal government contractors, such as Part D Plans. There can be no assurancethat the government would not potentially view one or more of our actions in providing services to federal governmentcontractors as causing or assisting in the presentment of a false claim, particularly in light of the amendments to the FCAunder the Fraud Enforcement and Recovery Act of 2009 (“FERA”). FERA expands the scope of FCA liability to includereverse false claims, which apply to anyone who knowingly conceals, or knowingly and improperly avoids or decreases anobligation to pay or transmit money or property to the government. The Health Care Reform Laws also significantly expandthe reach of the FCA to include new and strengthened mechanisms for combating fraud, waste, and abuse in federal and statehealth care programs.
ERISA Regulation.
The Employee Retirement Income Security Act of 1974, as amended (“ERISA”), regulates certain aspects of employeepension and health benefit plans, including self-funded corporate health plans. We have agreements with self-fundedcorporate health plans to provide PBM services, and therefore, are a service provider to ERISA plans. ERISA imposes dutieson any person or entity that is a fiduciary with respect to the ERISA plan. We administer pharmacy benefits for ERISA plansin accordance with plan design choices made by the ERISA plan sponsors. We do not believe that the general conduct of ourbusiness subjects us to the fiduciary obligations set forth by ERISA, except to the extent we have specifically contracted withan ERISA plan sponsor to accept fiduciary responsibility for the limited purpose of addressing benefit claims and appeals.However, there can be no assurance that the U.S. Department of Labor, or the DOL, or a private litigant would not assert thatthe fiduciary obligations imposed by ERISA apply to certain aspects of our operations.
Numerous lawsuits have been filed against various PBMs by private litigants, including Plan participants on behalf of anERISA plan and by ERISA Plan sponsors, alleging that the PBMs are ERISA fiduciaries and that, in such capacity, theyallegedly violated ERISA fiduciary duties in connection with certain business practices related to their respective contractswith retail pharmacy networks or pharmaceutical manufacturers.
ERISA also imposes civil and criminal liability on service providers to health plans and certain other persons if certainforms of illegal remuneration are made or received. These provisions of ERISA are similar, but not identical, to the federalhealthcare Anti-Kickback Statute discussed above. In particular, ERISA does not provide the statutory and regulatory safeharbor exceptions incorporated into the federal healthcare Anti-Kickback Statute. Like the health care anti-kickback laws, thecorresponding provisions of ERISA are written broadly and their application to particular cases is often uncertain.
14
In addition, the DOL has recently issued several regulations that impose new fee disclosure rules on certain ERISA plansand their service providers. Those regulations do not currently apply to self-funded corporate health plans and their serviceproviders, but the DOL has held hearings to discuss extending them in the future. As a result, we are not yet able to assess theeffect the regulations may have on our business.
FDA Regulation.
The U.S. Food and Drug Administration (“FDA”) generally has authority to regulate drug promotional materials that aredisseminated by or on behalf of a drug manufacturer. The FDA also may inspect facilities in connection with proceduresimplemented to effect recalls of prescription drugs. In addition, the FDA has authority to require the submission andimplementation of a risk evaluation and mitigation strategy (“REMS”) if the FDA determines that a REMS is necessary forthe safe and effective marketing of a drug. To the extent we dispense products subject to REMS requirements or provideREMS services to a pharmaceutical manufacturer, we are subject to audit by the pharmaceutical manufacturer.
Antitrust Regulation.
Various federal and state antitrust laws regulate trade and commerce with the objective of protecting the competitiveprocess. Successful plaintiffs in federal antitrust actions are entitled to recover treble damages, as well as their attorneys’ fees.In addition, virtually all states have antitrust statutes analogous to the Sherman Act, often including automatic treble damagesand attorneys’ fees. Numerous retail pharmacies in the U.S. have filed lawsuits against pharmaceutical manufacturers, drugwholesalers and PBMs challenging certain branded drug pricing practices under federal and state antitrust laws. Thecomplaints alleged, in part, that the manufacturers gave, and the PBMs accepted, rebates and discounts on purchases of brandname prescription drugs, in violation of the Robinson-Patman Act, which prohibits discriminating in price among differentcustomers in different circumstances, and that the manufacturers, drug wholesalers, and PBMs conspired in violation of theSherman Act not to provide similar rebates and discounts to the plaintiff retail pharmacies. The Sherman Act allegations havebeen resolved, often with substantial settlements. Certain Robinson-Patman Act claims continue to be litigated. In 2012,summary judgment was granted in favor of the remaining manufacturer and PBM defendants with respect to the Robinson-Patman Act claims of a small subset of the retail pharmacy plaintiffs, which is on appeal before the U.S. Court of Appeals forthe Second Circuit. The plaintiffs seek unspecified monetary damages, including trebled damages, injunctive relief against thealleged price discrimination, and attorneys’ fees.
State Laws and Regulations Affecting Our PBM Business
The following descriptions identify various state laws and regulations that affect or may affect aspects of our PBMbusiness:
State Anti-Kickback/False Claims Laws.
Many states have laws or regulations similar to the AKS and the FCA described above, while several others are currentlyconsidering passing or strengthening false claims laws. Such state laws are not necessarily limited to services or items forwhich government-funded health care program payments may be made. Such state laws may be broad enough to includeimproper payments made in connection with services or items that are paid by commercial payers. Penalties for violatingthese state anti-kickback and false claims laws may include injunction, imprisonment, criminal and civil fines and exclusionfrom participation in the state Medicaid programs. Additionally, under the Deficit Reduction Act of 2005, discussed in greaterdetail below, states are incentivized to pass broad false claims legislation similar to the FCA, and there has been activity inseveral states during the past several years to do so.
State Consumer Protection Laws.
Most states have enacted consumer protection and deceptive trade practices laws that generally prohibit payments andother broad categories of conduct deemed harmful to consumers. These statutes may be enforced by states or private litigants.Such laws have been and continue to be the basis for investigations, prosecutions, and settlements of PBMs, initiated by stateprosecutors as well as by private litigants.
State Comprehensive PBM Regulation.
Legislation directly regulating PBM activities in a comprehensive manner has been introduced in a number of states. Inaddition, legislation has been proposed in some states seeking to impose fiduciary obligations or disclosure requirements onPBMs. The District of Columbia has enacted a statute imposing fiduciary and disclosure obligations on PBMs. Similarly, bothNorth Dakota and South Dakota have relatively comprehensive PBM laws that, among other things, increase financial
15

transparency and regulate therapeutic interchange programs. Each state that enacts such legislation requires us to adapt ouroperations in that state, which could materially adversely impact us.
Many states have licensure or registration laws governing certain types of ancillary health care organizations, includingpreferred provider organizations, third-party administrators, or TPAs, companies that provide utilization review services, andcompanies that engage in the practices of a pharmacy. The scope of these laws differs significantly from state to state, and theapplication of such laws to the activities of PBMs often is unclear.
In addition, certain quasi-regulatory organizations, including the National Association of Boards of Pharmacy, or NABP,and the National Association of Insurance Commissioners, or NAIC, have issued model regulations or may propose futureregulations concerning PBMs or PBM activities, and the National Committee for Quality Assurance, or NCQA, theUtilization Review Accreditation Commission, or URAC, or other credentialing organizations may provide voluntarystandards regarding PBM activities. In 2007, for example, URAC finalized PBM accreditation standards for PBMs serving thecommercially insured market. Since 2009, we have been awarded full PBM accreditation from URAC. While the actions ofthese quasi-regulatory organizations do not have the force of law, they may influence states to adopt their requirements orrecommendations as well as influence customer requirements for PBM services. Moreover, any standards established by theseorganizations could also impact our health plan customers or the services we provide to them.
Network Access Legislation.
A majority of states now have some form of legislation affecting our ability to limit access to a pharmacy providernetwork, commonly referred to as “any willing provider” statutes, or removal of a network provider, known as “due process”statutes. Such legislation may require us, or our clients, to admit any retail pharmacy willing to meet the plan’s price and otherterms for network participation, or may provide that a provider may not be removed from a network except in compliancewith certain procedures. Similarly, there are any willing pharmacy provisions applicable to Medicare Part D plans.
State Legislation Affecting Plan or Benefit Design.
Some states have enacted legislation that prohibits certain types of managed care plan sponsors from implementingcertain restrictive design features, and many states have legislation regulating various aspects of managed care plans,including provisions relating to the plan’s pharmacy benefits. For example, some states, under so-called freedom of choicelegislation, provide that members of the plan may not be required to use network providers, but must instead be provided withbenefits even if they choose to use non-network providers. Other states have enacted legislation purporting to prohibit healthplans from offering members financial incentives for use of mail service pharmacies. Legislation has been introduced in somestates to prohibit or restrict therapeutic intervention, to require coverage of all FDA-approved drugs or to require coverage foroff-label uses of drugs where those uses are recognized in peer-reviewed medical journals or reference compendia. Otherstates mandate coverage of certain benefits or conditions and require health plan coverage of specific drugs, if deemedmedically necessary by the prescribing physician. Such legislation does not generally apply to us directly, but may apply tocertain of our clients, such as HMOs and health insurers. If legislation were to become widely adopted, it could have the effectof limiting the economic benefits achievable through PBMs. This development could have a material adverse effect on ourbusiness, results of operations, financial condition or cash flows.
State Regulation of Financial Risk Plans.
Fee-for-service prescription drug plans are generally not subject to financial regulation by the states. However, if a PBMoffers to provide prescription drug coverage on a capitated basis or otherwise accepts material financial risk in providing thebenefit, laws in various states may regulate the plan. Such laws may require that the party at risk establish reserves orotherwise demonstrate financial responsibility. Laws that may apply in such cases include insurance laws, HMO laws orlimited prepaid health service plan laws. Currently, we do not believe that our PBM business incurs financial risk of the typesubject to such regulation. However, if we choose to become a regional PDP for the Medicare outpatient prescription drugbenefit at some time in the future, we would need to comply with state laws governing risk-bearing entities in the states wherewe operate a PDP.
State Discount Drug Card Regulation.
Numerous states have laws or regulations regulating the selling, marketing, promoting, advertising or distributing ofcommercial discount drug cards for cash purchases. Such laws and regulations provide, generally, that any person may bringan action for damages or seek an injunction for violations. We believe the administration of our commercial discount drugcard program is in substantial compliance with various state laws.
16

Combined Federal and State Laws, Regulations and Other Standards Affecting Our PBM Business
Certain aspects of our PBM business are or may be affected by bodies of law that exist at both the federal and state levelsand by other standard setting entities. Among these are the following:
Deficit Reduction Act of 2005.
The Deficit Reduction Act of 2005 (“DRA”) enacted significant changes to the Medicaid program, a state and federallyfunded program, with respect to prescription drugs. Among other things, the DRA revises the methodology used to determinefederal upper payment limits, to pharmacies, and the maximum amount a state can reimburse for generic drugs underMedicaid. In addition, the DRA permits stronger cost-sharing requirements applicable to Medicaid prescription drugs, andcontains provisions intended to reduce fraud, waste and abuse in the Medicaid program. The DRA’s fraud, waste and abuseprovisions, among other things, incentivize states to enact their own false claims acts, mirrored on the FCA, described above,and provides for appropriate federal funding to increase oversight of the Medicaid program. The DRA’s fraud, waste andabuse provisions also include a provision intended to strengthen Medicaid’s status as payor of last resort relative to privatehealth insurance by specifying that PBMs and self-insured plans may be liable third parties. The provisions in the DRA havethe potential to impact the PBM industry by means of increased prosecutorial and private litigant scrutiny of thepharmaceutical industry in general, which may include PBMs. Additionally, the DRA mandates the public availability ofpharmaceutical manufacturer average manufacturer prices (“AMPs”) and creates incentives to states to use AMPs forMedicaid reimbursement, potentially paving the way for a more general market shift in reimbursement mechanisms fromAWP-based methodologies to AMP-based methodologies. Additionally, the third party recovery provisions in the DRA maylead to greater financial recoveries from third party PBMs in cases where Medicaid was not properly a primary payor on adrug claim, even where a PBM is not financially at risk.
Privacy and Confidentiality Legislation. Our activities involve the receipt, use and disclosure of confidential healthinformation, including disclosure of the confidential information to a customer’s health benefit plan, as permitted inaccordance with applicable federal and state privacy laws. In addition, we use and disclose de-identified data for analyticaland other purposes. Many state laws restrict the use and disclosure of confidential medical information, and similar newlegislative and regulatory initiatives are underway at the state and federal level. To date, no such laws presently have amaterial adverse impact on our ability to provide our services, but there can be no assurance that federal or state governmentswill not enact such legislation, impose restrictions or adopt interpretations of existing laws that could have a material adverseeffect on our business, results of operations, financial condition or cash flows.
The Health Insurance Portability and Accountability Act of 1996 and the regulations issued thereunder (collectively“HIPAA”) impose extensive requirements on the way in which health plans, healthcare providers that engage in certainelectronic financial and administrative transactions covered by HIPAA, and healthcare clearinghouses (known as “coveredentities”) and the persons or entities that create, receive, maintain, or transmit protected health information (“PHI”) to provideservices to covered entities or to perform functions on their behalf (known as “business associates”), use, disclose andsafeguard PHI, including requirements to protect the integrity, availability and confidentiality of electronic PHI. Many ofthese obligations were expanded under the Health Information Technology for Economic and Clinic Health Act (the“HITECH Act”), passed as part of the American Recovery and Reinvestment Act of 2009. In January 2013, the Office forCivil Rights (“OCR”) of HHS issued a final rule under the HITECH Act that makes sweeping changes to the privacy,security, breach notification and enforcement regulations promulgated under HIPAA (the “Final Omnibus Rule”). The FinalOmnibus Rule, which also implements certain provisions under HITECH and the Genetic Information Nondiscrimination Actof 2008 (“GINA”), enhances individual privacy protections, provides individuals new rights to their health information, andstrengthens the government’s ability to enforce HIPAA. Generally, covered entities and business associates must come intocompliance with the Final Omnibus Rule by September 23, 2013, though some exceptions exist (e.g., a later deadline formodification of certain business associate agreements, discussed herein).
The privacy regulations (the “Privacy Rule”) issued by OCR pursuant to HIPAA, give individuals the right to know howtheir PHI is used and disclosed, as well as the right to access, amend and obtain information concerning certain disclosures ofPHI. Covered entities, such as pharmacies and health plans, are required to provide a written Notice of Privacy Practices(“NPPs”) to individuals that describes how the entity uses and discloses PHI, and how individuals may exercise their rightswith respect to their PHI. For most uses and disclosures of PHI other than for treatment, payment, healthcare operations, andcertain public policy purposes, HIPAA generally requires that covered entities obtain a valid written individual authorization.In most cases, use or disclosure of PHI must be limited to the minimum necessary to achieve the purpose of the use ordisclosure. The Final Omnibus Rule modifies the content of NPPs in significant ways, requiring, among other things,statements informing individuals of their rights to receive notifications of any breaches of unsecured PHI and to restrictdisclosures of PHI to a health plan where the individual pays out of pocket.
17
We are a covered entity under HIPAA in connection with our operation of mail order and specialty service pharmacies.In connection with our other PBM and some HCIT services that require access to PHI, we are not considered a covered entity.However, our health plan clients and pharmacy customers are covered entities, and are required to enter into businessassociate agreements with vendors, such as PBMs, that perform a function or activity for the covered entity, or provide aservice to the covered entity, that involves the creation, receipt, maintenance, or transmission of individually identifiablehealth information. The business associate agreements mandated by the Privacy Rule create a contractual obligation for thebusiness associate to perform our duties for the covered entity in compliance with the Privacy Rule. Additionally, effectiveFebruary 2010, the HITECH Act created a statutory obligation for us, when we act as a business associate, to satisfy certainaspects of the Privacy Rule and the HIPAA security regulations. Regulations to this effect were recently implemented underthe Final Omnibus Rule, imposing direct liability on business associates for, among other things, impermissible uses anddisclosures of PHI; failure to implement certain administrative, physical, and technical safeguards for PHI; and failure toprovide access to a copy of electronic PHI to the covered entity, the individual, or the individual’s designee (whichever isspecified in the business associate agreement).
The Final Omnibus Rule also extends the business associate provisions of the HIPAA Rules to subcontractors where thefunction, activity, or service delegated by the business associate to the subcontractor involves the creation, receipt,maintenance, or transmission of PHI. As such, business associates are required to enter into business associate agreementswith subcontractors for services involving access to PHI.
Importantly, the Final Omnibus Rule greatly expands the types of product- and service-related communications topatients or enrollees that will require individual authorizations by requiring individual authorization for all treatment andhealth care operations communications where the covered entity receives payment in exchange for the communication from oron behalf of a third party whose product or service is being described. While OCR has established limited exceptions to thisrule where individual authorization is not required, for example with regard to refill reminders when certain criteria are met,the marketing provisions finalized in the Final Omnibus Rule could potentially have an adverse impact on our business andrevenues.
If we fail to comply with HIPAA or our policies and procedures are not sufficient to prevent the unauthorized disclosureof PHI, we could be subject to liability, fines and lawsuits under federal and state privacy laws, consumer protection statutesand other laws. Criminal penalties and civil sanctions may be imposed for failing to comply with HIPAA standards either as acovered entity or business associate, and these penalties and sanctions have significantly increased under the HITECH Act.Covered entities may also be excluded from federal health care programs for violating the Transaction Rule. In February2011, OCR, the agency responsible for enforcing HIPAA and HITECH, issued the first civil monetary penalty ever imposedfor a covered entity’s violation of the HIPAA Privacy Rule. Moreover, the Final Omnibus Rule now also imposes civilmonetary penalties on covered entities and business associates for the acts and omissions of their agents (i.e., businessassociates and subcontractors, respectively).
In addition to imposing potential monetary penalties, the HITECH Act also requires OCR to conduct periodiccompliance audits. Furthermore, HITECH provides authority to state attorneys general to bring actions in federal court forviolations of HIPAA on behalf of state residents harmed by such violations. Several such actions have already been broughtagainst both covered entities and a business associate, and continued enforcement actions are likely to occur in the future.
If we experience a security breach, which can occur despite our best efforts to safeguard our data, we could be subject toliability, fines and lawsuits. The expenses associated with investigating and remediating a breach can be significant. Finally, asecurity breach can have a detrimental impact on our business reputation.
The transactions and code sets regulation (the “Transaction Rule”) promulgated under HIPAA requires that all coveredentities that engage in certain electronic transactions, directly or through a third party agent, use standardized formats andcode sets. We, in our role as a business associate of a covered entity, must conduct such transactions in accordance with theTransaction Rule and related regulations that require the use of operating rules in connection with HIPAA transactions. We, inour role as a specialty pharmacy, must also conduct such transactions in accordance with such regulations or engage aclearinghouse to process their covered transactions. HHS promulgated a National Provider Identifiers (“NPI”) Final Rulewhich requires covered entities to utilize NPIs in all Standard Transactions. NPIs replaced NABP numbers for pharmacies,Drug Enforcement Agency numbers for physicians and similar identifiers for other health care providers for purposes ofidentifying providers in connection with HIPAA standard transactions.
The security regulations (the “Security Rule”) issued pursuant to HIPAA mandate the use of administrative, physical,and technical safeguards to protect the confidentiality of electronic PHI. The Security Rule applies to covered entities andbusiness associates.
18

We must also comply with the “breach notification” regulations, which implement provisions of the HITECH Act. In thecase of a breach of “unsecured PHI,” covered entities must promptly notify affected individuals and the HHS Secretary, aswell as the media in cases where a breach affects more than 500 individuals. Breaches affecting fewer than 500 individualsmust be reported to the HHS Secretary on an annual basis. The regulations also require business associates of covered entitiesto notify the covered entity of such breaches by the business associate.
Final regulations governing the accounting of disclosures are expected to be issued by OCR in 2013. The applicableproposed rule, if finalized, would require covered entities to develop systems to monitor and record (1) which of theiremployees and business associates access an individual’s electronic PHI contained in a designated record set, (2) the time anddate access occurs, and (3) the action taken during the access session (e.g., modification, deletion, viewing). The finalregulations could impose significant burdens on covered entities and business associates.
The Health Care Reform Laws require the Secretary of HHS to develop new health information technology standardsthat could require changes to our existing software products. For example, the statute requires the establishment ofinteroperable standards and protocols to facilitate electronic enrollment of individuals in federal and state health and humanservices programs and provides the government with authority to require incorporation of these standards and protocols inhealth information technology investments as a condition of receiving federal funds for such investments.
While new and future legal interpretations could alter our assessment of our efforts to comply with provisions of HIPAA,the HITECH Act, and the Health Care Reform Laws that govern the privacy, security and standardization of health careinformation and transactions, we currently believe that compliance with these legal authorities should not have a materialadverse effect on our business operations.
Pursuant to HIPAA, state laws that are more protective of PHI are not pre-empted. Therefore, to the extent statescontinue to enact more protective legislation, we could be required to make significant changes to our business operations. Inaddition, independent of any regulatory restrictions, individual health plan clients could increase limitations on our use ofmedical information, which could prevent us from offering certain services.
The Health Care Reform Laws. In March 2010, the federal government enacted the Health Care Reform Laws, whichcontain a variety of provisions that could have a significant impact on us and our customers. The Health Care Reform Lawsprovide the opportunity for significant expansion of our PBM and health information technology activities. These potentialbenefits are the result of an expected increase in the number of individuals with health insurance and the potential increase indemand for pharmaceutical products and health information technology services. However, the Health Care Reform Lawsalso present great uncertainty for us and potential risks to our operations and financial success. The Health Care Reform Lawscontain many provisions intended to reduce the government’s healthcare costs through reimbursement reductions, alternativepayment methods, and ongoing studies of healthcare reimbursement systems. For example, the Health Care Reform Lawsestablish the Independent Payment Advisory Board, or IPAB, which is designed to make proposals as early as 2014 to reducethe per capita rate of growth in Medicare spending in years when that growth exceeds established targets. Another potentialsource of reimbursement uncertainty is the newly established Center for Medicare and Medicaid Innovation, or CMMI, whichis designed to test the cost-cutting efficacy of innovative payment service delivery systems through demonstration projects.These types of provisions could have a significant impact on our profitability and that of our customers, particularly becauseof the unpredictability of the proposals that could be generated by the IPAB and the CMMI.
The Health Care Reform Laws also require PBMs to disclose certain information, including discounts and rebatesobtained from pharmaceutical manufacturers, to Part D Plans or qualified health benefits plans offered through an exchange.In addition, the Health Care Reform Laws change the calculation of Medicaid rebates in a way that could increase or decreasepharmaceutical manufacturers’ incentives to provide discounts and rebates to PBMs. These changes could have a negativeimpact on our revenues or business model. Additionally, as noted above, the Health Care Reform Laws expand existing fraudand abuse provisions and significantly increase the resources available to the federal government to pursue fraud and abuseissues, which could expose us to greater scrutiny and possibly significant financial liability. For example, the Health CareReform Laws extend the treble damages available for violations of the FCA to violations relating to the state-based healthinsurance exchanges created by the Health Care Reform Laws. The Health Care Reform Laws also establish new civilmonetary penalties: $15,000 daily for failure to grant timely access to the OIG for the purposes of audits or investigations and$50,000 for each false record or statement knowingly submitted or caused to be submitted for payment of items furnishedunder a federal health care program. As a result, we may be forced to expend greater resources on monitoring and complianceprograms and legal fees. Similarly, our customers may be subject to greater scrutiny and financial liability, which couldindirectly put pressure on our financial relationships with those customers.
Aside from the particular provisions of the Health Care Reform Laws, there is significant uncertainty about how theHealth Care Reform Laws will be implemented, likely through hundreds of new regulations, guidance documents, and otherpolicy statements that could result in significant changes to our business model and the healthcare industry as a whole.
19
Laws and Regulations Specifically Related to Our Mail Order and Specialty Pharmacy Operations
We operate mail order pharmacy facilities in Colorado, Florida, Ohio and Texas and specialty pharmacies in Alabama,Georgia, Kansas, Louisiana, Maine, Massachusetts, Mississippi, Nevada, Tennessee, Texas, and West Virginia. In addition tothe laws and regulations discussed above that may affect mail order and specialty pharmacy operations, we are subject to stateand federal statutes and regulations governing the operation of pharmacies, repackaging of drug products and dispensing ofcontrolled substances. Among these are the following:
Pharmacy Licensure and Regulation.
We are subject to state and federal statutes and regulations governing the operation of mail order and specialtypharmacies and the dispensing of controlled substances. Our pharmacies deliver prescription drugs and supplies to individualsin all 50 states. The practice of pharmacy is generally regulated at the state level by state boards of pharmacy. Each of ourpharmacies must be licensed in the state in which it is located. Also, many of the states where we deliver pharmaceuticals,including controlled substances, have laws and regulations that require out-of-state mail service pharmacies to register withthat state’s board of pharmacy or similar regulatory body. Federal statutes and regulations govern the labeling, packaging,advertising and adulteration of prescription drugs and the dispensing of controlled substances. Federal controlled substancelaws require us to register our pharmacies with the U.S. Drug Enforcement Administration, or DEA, and to comply withsecurity, record keeping, inventory control and labeling standards in order to dispense controlled substances. We are alsosubject to certain federal and state laws affecting Internet-based pharmacies because we dispense prescription drugs pursuantto refill orders received through our websites, among other methods. Several states have proposed new laws to regulateInternet-based pharmacies, and federal regulation of Internet-based pharmacies by the FDA or another federal agency has alsobeen proposed. Other statutes and regulations may affect our mail service operations. For example, the Federal TradeCommission, or FTC, requires mail service sellers of goods generally to engage in truthful advertising, to stock a reasonablesupply of the products to be sold, to fill mail service orders within thirty days and to provide clients with refunds whenappropriate. In addition, the U.S. Postal Service has statutory authority to restrict the transmission of drugs and medicinesthrough the mail. Our pharmacists are subject to state regulation of the profession of pharmacy and employees engaged in aprofessional practice must satisfy applicable state licensing requirements.
Regulation of Controlled Substances.
Our mail order facilities must register with the DEA and individual state-controlled substance authorities in order todispense controlled substances. Federal law requires us to comply with the DEA’s security, record keeping, inventory controland labeling standards in order to dispense controlled substances. State-controlled substance law requires registration andcompliance with state pharmacy licensure, registration or permit standards promulgated by the state pharmacy licensingauthority.
Other Regulations.
Federal law prohibits the restocking and double billing of prescription drugs in connection with the Medicaid program.Additionally, the FTC regulates advertising by mail order pharmacies and requires such facilities to stock a sufficientinventory or have adequate sources of supply to meet the anticipated demand for an advertised product, to fill mail orderswithin the time stated at the time the order was placed or within 30 days if no shipment statement was made, and to providefull or partial customer refunds when an order is appropriately cancelled or cannot be filled when or as required. The FTC alsohas authority to protect consumer privacy and personal information, which authority it has historically exercised broadly. Inaddition, the FDA sets standards for the packaging of prescription drugs. Federal and state anti-kickback laws also apply toour mail order and specialty pharmacies. We believe that we are in substantial compliance with state and federal requirementspertaining to our mail order and specialty pharmacy operations.
EMPLOYEES
As of December 31, 2012, the Company had approximately 3,300 employees, primarily located in Lisle, Illinois,Rockville, Maryland and Scottsdale, Arizona, whose services are devoted full time to Catamaran and its subsidiaries. TheCompany has never had a work stoppage. The Company’s personnel are not represented by any collective bargaining unit andare not unionized. The Company considers its relations with its personnel to be good. The Company’s future success willdepend, in part, on its ability to continue to attract, retain, and motivate highly qualified technical and managerial personnel,for whom competition is intense.
20

FINANCIAL INFORMATION ABOUT SEGMENTS
The Company operates in two reportable operating segments, PBM and HCIT. Financial information about theCompany’s segments is described in Note 16—Segment Information to our consolidated financial statements included inItem 8 of this Annual Report on Form 10-K.
CUSTOMERS
The Company generates a significant portion of its revenue from a small number of customers and for the year endedDecember 31, 2012, HealthSpring, Inc. (“HealthSpring”) accounted for 31% of total revenue. The loss of, or substantialchanges in the services provided to, these significant customers, or the loss of other customers that could be significant in theaggregate, could have a material adverse effect on the Company’s results of operations. See “Item 1A.—Risk Factors—Business Risks—We are dependent on key customers” below for additional information regarding our relationship withHealthSpring and other significant customers.
ITEM 1A. RISK FACTORS
BUSINESS RISKS
Our future growth is dependent on further market acceptance and increased market penetration of our products.
Our business model depends on our ability to sell our products and services. Achieving increased market acceptance ofour products and services will require substantial sales and marketing efforts and the expenditure of significant financial andother resources to create awareness and demand by participants in the pharmaceutical supply chain. Additionally, payers,which may have invested substantial resources in other methods of conducting business and exchanging information, may bereluctant to purchase our products and services.
We cannot be assured that payers will purchase our products and services. If we fail to achieve broad acceptance of ourproducts and services by payers, and other healthcare industry participants, or if we fail to position our services as a preferredmethod for information management and pharmaceutical healthcare delivery, our business, financial condition, and results ofoperations will be materially adversely affected.
The electronic healthcare information market is rapidly evolving. A number of market entrants have introduced ordeveloped products and services that are competitive with one or more components of our offerings. We expect that additionalcompanies will continue to enter this market. In new and rapidly evolving industries, there is significant uncertainty and riskas to the demand for, and market acceptance of, products and services. Because the markets for our products and services areevolving, we are not able to predict the size and growth rate of the markets with any certainty. We cannot be assured that themarkets for our products and services will continue to grow or, if they do, that they will be strong and continue to grow at asufficient pace. If markets fail to grow, grow more slowly than expected or become saturated with competitors, our business,financial condition, and results of operations could be materially adversely affected.
Competition in our industry is intense and could reduce or eliminate our profitability.
The PBM industry is very competitive. If we do not compete effectively, our business, results of operations, financialcondition or cash flows could suffer. The industry is highly consolidated and dominated by a few large companies withsignificant resources, purchasing power, and other competitive advantages, which we do not have. A limited number of firms,including national PBM companies, such as Express Scripts Holding Company and CVS Caremark Corporation havesignificant market share of the prescription volume, and recent PBM merger activity may further increase the market share ofour competitors. Our competitors also include drug retailers, physician practice management companies, and insurancecompanies/health maintenance organizations. We may also experience competition from other sources in the future. PBMcompanies compete primarily on the basis of price, service, reporting capabilities and clinical services. In most cases, ourcompetitors are large, profitable, and well-established companies with substantially greater financial and marketing resourcesthan our resources. Some of our services, such as disease management services, informed decision counseling services andmedical information management services, also compete with those being offered by pharmaceutical manufacturers,specialized disease management companies, and information service providers. We may also experience competition fromother sources in the future.
We are dependent on key customers.
We generate a significant portion of our revenue from a small number of customers. Our largest customer, HealthSpring,accounted for approximately 31% of Catamaran’s total revenue for the year ended December 31, 2012. On January 31, 2012,Cigna Corporation (“Cigna”) announced the completion of its acquisition of HealthSpring in an all-cash transaction. The
21
Company’s contract with HealthSpring (the “HealthSpring contract”) was effective on January 1, 2011 and has an initialthree-year term (with two additional one-year extensions). Neither party to the HealthSpring contract has the right to terminatethe agreement prior to the end of the initial term, except in the event of a material breach. While the Company does notcurrently anticipate any adverse impact to its financial results through the initial term of the HealthSpring contract as a resultof the acquisition, we can give no assurances that we will be able to continue to generate a substantial portion of our revenuesfrom HealthSpring for the foreseeable future, or that we will be able to extend or renew the HealthSpring contract past theinitial period.
Although we continually seek to diversify our customer base, we may be unable to offset the effects of an adversechange in one of our key customer relationships. For example, if our existing customers elect not to renew their contracts withus at the expiry of the current terms of those contracts, or reduce the level of service offerings we provide thereunder, ourrecurring revenue base will be reduced, which could have a material adverse effect on our results of operations. Furthermore,we sell most of our computer software and services to PBM organizations, Blue Cross/Blue Shield organizations, managedcare organizations and retail/mail-order pharmacy chains. If the healthcare benefits industry or our customers in the healthcarebenefits industry experience problems, they may curtail spending on our products and services and our business and financialresults could be materially adversely affected. For example, we may suffer a loss of customers if there is any significantconsolidation among firms in the healthcare benefits industry or other participants in the pharmaceutical supply chain, ifdemand for pharmaceutical claims processing services should decline or if the financial condition of any of our customersotherwise deteriorates.
Many of our clients put their contracts out for competitive bidding prior to expiration. Competitive bidding requirescostly and time-consuming efforts on our behalf and, even after we have won such bidding processes, we can incur significantexpenses in proceedings or litigation contesting the adequacy or fairness of these bidding processes. We could lose clients ifthey cancel their agreements with us, if we fail to win a competitive bid at the time of contract renewal, if the financialcondition of any of our clients deteriorates or if our clients are acquired by, or acquire, companies with which we do not havecontracts. Over the past several years, self-funded employers, third party administrators and other managed care companieshave experienced significant consolidation. Consolidations by their very nature reduce the number of clients who may needour services. A client involved in a merger or acquisition by a company that is not a client of ours may not renew, and in someinstances may terminate, its contract with us. Our clients (such as HealthSpring) have been and may continue to be, subject toconsolidation pressure.
Demands by our customers for enhanced service levels or possible loss or unfavorable modification of contracts withour customers could negatively affect our profitability.
As our customers face the continued rapid growth in prescription drug costs, they may demand additional services andenhanced service levels and/or lower prices to help mitigate the increase in spending. Additionally, increasing downwardpressure of federal and state reimbursements for pharmaceuticals and other medical services may cause our customers todemand lower fees, and changes in existing, or the adoption of new, laws or regulations relating to purchase discount andrebate arrangements with pharmaceutical manufacturers, or to formulary management or other PBM services, could alsoreduce the discounts or rebates we receive. Further, we operate in a very competitive environment, and as a result, may not beable to increase our fees to compensate for these increased services. Accordingly, margin pressure resulting from these trendscould negatively affect our profitability.
Due to the term of our contracts with customers, if we are unable to renew those contracts at the same service levelspreviously provided, or at all, or replace any lost customers, our future business and results of operations would beadversely affected.
Our contracts with customers generally do not have terms longer than three years and, in some cases, are terminable bythe customer on relatively short notice. Our larger customers generally seek bids from other PBM providers in advance of theexpiration of their contracts. In addition, we believe the managed care industry is undergoing substantial consolidation, andanother party that is not our customer could acquire some of our managed care customers. In such a case, the likelihood suchcustomer would renew its PBM contract with us could be reduced, and the likelihood of a reduction in services wouldincrease.
Consolidation in the healthcare industry could materially adversely affect our business, financial condition and resultsof operations.
Many healthcare industry participants are consolidating to create integrated healthcare delivery systems with greatermarket power. As provider networks and managed care organizations consolidate, thereby decreasing the number of market
22

participants, competition to provide products and services like ours will become more intense, and the importance ofestablishing relationships with key industry participants will become greater. In the past, we have lost customers as a result ofindustry consolidation. In addition, industry participants may try to use their market power to negotiate price reductions forour products and services. Further, consolidation of management and billing services through integrated delivery systems maydecrease demand for our products. If we are forced to reduce prices as a result of either an imbalance of market power ordecreased demand for our products, revenue would be reduced and we could become significantly less profitable.
Our business strategy of expansion through acquisitions may result in unexpected integration costs and challenges, lossof acquired business and/or dilution to existing shareholders.
We look to the acquisition of other businesses, such as the Merger with Catalyst, and acquisitions of National MedicalHealth Card Systems, Inc. (“NMHC”), MedfusionRx, PTRX, SaveDirectRx, and HealthTran as a way to achieve our strategyof expanding our product offerings and customer base. The successful implementation of this acquisition strategy depends onour ability to identify suitable acquisition candidates, acquire companies on acceptable terms, integrate the acquiredcompany’s operations and technology successfully with our own, and maintain the goodwill of the acquired business. We areunable to predict whether or when we will be able to identify any suitable additional acquisition candidates or the likelihoodthat any potential acquisition will be completed. It is also possible that a potential acquisition will be dilutive to existingshareholders. Refer below for specific risks related to acquisitions.
Our future success depends upon the ability to grow, and if we are unable to manage our growth effectively, we mayincur unexpected expenses and be unable to meet our customers’ requirements.
An important part of our business strategy is to expand the scope of our operations, both organically and throughacquisitions. We cannot be certain that our systems, procedures, controls, and space will be adequate to support expansion ofour operations, and we may be unable to expand and upgrade our systems and infrastructure to accommodate any futuregrowth. Growth in operations will place significant demands on our management, financial and other resources. Our futureoperating results will depend on the ability of our management and key employees to successfully manage changing businessconditions and to implement and improve our technical, administrative, financial control and reporting systems. Our inabilityto finance future growth, manage future expansion or hire and retain the personnel needed to manage our businesssuccessfully could have a material adverse effect on our business, financial condition and results of operations.
Changes in the industry pricing benchmarks could adversely affect our financial performance.
Contracts in the prescription drug industry, including our contracts with our retail network pharmacies and with our PBMcustomers, have traditionally used certain published benchmarks to establish pricing for prescription drugs. These benchmarksinclude Average Wholesale Price (“AWP”), Average Sales Price (“ASP”), Average Manufacturer Price (“AMP”), WholesaleAcquisition Cost, and Direct Price. Most of our contracts with pharmacies and customers historically utilized the AWPstandard. In March 2009, class action litigation settlements with the two primary entities that publish AWP, First DataBank(“FDB”) and Medi-Span, have raised uncertainties as to whether payors, pharmacy providers, PBMs and others in theprescription drug industry will continue to utilize AWP as it has previously been calculated or whether other pricingbenchmarks will be adopted for establishing prices within the industry.
In March 2009, a federal district court gave final approval to the settlements of class action lawsuits brought against FDBand Medi-Span, two primary sources of AWP price reporting. Under the terms of the settlements, FDB and Medi-Span agreedto reduce the reported AWP of certain drugs by four percent, effective September 26, 2009. In response to this action, theCompany, as authorized in most of the Company’s standard customer contracts, adopted a revised pricing benchmark toensure cost neutrality for the Company, its customers and pharmacies as to what they paid or received, as applicable, forprescription drug products using the AWP pricing benchmark before September 26, 2009 and what they would pay or receiveon or after September 26, 2009. While that transition has been accomplished to date with no material adverse effect on theCompany, there can be no assurances that customers and pharmacies, in reviewing the results of the transition may notchallenge the way in which the transition occurred and/or whether it preserved cost neutrality as intended, or that the results ofsuch challenges will not have a material adverse effect on our financial performance, results of operations and financialcondition in future periods.
Further, changes in the reporting of any applicable pricing benchmarks, including the expected introduction of a newpricing benchmark in place of AWP by FDB and Medi-Span, or in the basis for calculating reimbursements proposed by thefederal government and certain states, and other legislative or regulatory adjustments that may be made regarding thereimbursement of payments for drugs by Medicaid and Medicare, including CMS’s proposed retail survey-based alternative toAWP, could impact our pricing to customers and other payors and could impact our ability to negotiate discounts with
23
manufacturers, wholesalers, or retail pharmacies. In some circumstances, such changes could also impact the reimbursementthat we receive in our mail order and specialty pharmacies or that we receive from Medicare or Medicaid programs for drugscovered by such programs and from managed care organizations that contract with government health care programs toprovide prescription drug benefits. In addition, it is possible that payors and pharmacy providers will disagree with the use orapplication of the changes we have put in place or begin to evaluate other pricing benchmarks as the basis for contracting forprescription drugs and PBM services in the future, and the effect of this development on our business cannot be predicted atthis time. Due to these and other uncertainties, we can give no assurance that the short or long-term impact of changes toindustry pricing benchmarks will not have a material adverse effect on our financial performance, results of operations andfinancial condition in future periods.
If we lose our relationship, or our relationship otherwise changes in an unfavorable manner, with one or more keypharmacy providers, or if significant changes occur within the pharmacy provider marketplace, or if other issues arisewith respect to our pharmacy networks, our business could be impaired.
Our operations are dependent to a significant extent on our ability to obtain discounts on prescription purchases fromretail pharmacies that can be utilized by our clients and their members. Our contracts with retail pharmacies, which are non-exclusive, are generally terminable by either party on short notice. If one or more of our top pharmacy chains elects toterminate its relationship with us, or if we are only able to continue our relationship on terms less favorable to us, access toretail pharmacies by our clients and their health plan members, and consequently our business, results of operations, financialcondition or cash flows could suffer. In addition, several large retail pharmacy chains either own or have strategic allianceswith PBMs or could attempt to acquire or enter into these kinds of relationships in the future. Ownership of, or alliances with,PBMs by retail pharmacy chains, particularly large pharmacy chains, could have material adverse effects on our relationshipswith those retail pharmacy chains, particularly the discounts they are willing to make available, and on our business, results ofoperations, financial condition and cash flows.
If we lose relationships with one or more key pharmaceutical manufacturers or third party rebate administrators or ifrebate payments we receive from pharmaceutical manufacturers and rebate processing service providers decline, ourbusiness, results of operations, financial condition or cash flows could be negatively impacted.
We receive fees from our clients for administering a rebate program with pharmaceutical manufacturers based on the useof selected drugs by members of health plans sponsored by our clients, as well as fees for other programs and services. Webelieve our business, results of operations, financial condition or cash flows could suffer if:
• we lose relationships with one or more key pharmaceutical manufacturers or third party rebate administrators;
• we are unable to finalize rebate contracts with one or more key pharmaceutical manufactures in the future, or areunable to negotiate interim arrangements;
• rebates decline due to the failure of our health plan sponsors to meet market share or other thresholds;
• legal restrictions are imposed on the ability of pharmaceutical manufacturers to offer rebates or purchase our programservices;
• pharmaceutical manufacturers choose not to offer rebates or purchase our programs or services; or
• rebates decline to contract branded products losing their patients
Over the next few years, as patents expire covering many brand name drugs that currently have substantial market share,generic products will be introduced that may substantially reduce the market share of these brand name drugs. Historically,manufacturers of generic drugs have not offered formulary rebates on their drugs. Our profitability could be adverselyaffected if the use of newly approved, brand name drugs added to formularies, does not offset any decline in use of brandname drugs whose patents expire.
Changes in laws or regulations in the healthcare industry could adversely affect our business.
The healthcare industry is highly regulated and is subject to changing political, economic, and regulatory influences. Forexample, the Balanced Budget Act of 1997 (Public Law 105-32) contained significant changes to Medicare and Medicaid andhad an impact for several years on healthcare providers’ ability to invest in capital intensive systems. In addition, the HealthInsurance Portability and Accountability Act of 1996 (Public Law 104-191) (“HIPAA”), as amended by the 2009 HealthInformation Technology for Economic and Clinical Health Act (Public Law 111-5) (“HITECH”), and Canadian privacystatutes directly impact the healthcare industry by requiring various security and privacy measures in order to ensure theprotection of patient health information. Over the years, the government has become increasingly involved in healthcare
24
issues, and healthcare related legislation continues to impact the industry, including, for example, the Medicare PrescriptionDrug, Improvement and Modernization Act of 2003 (Public Law 108-173) (“Medicare Modernization Act” or “MMA”),which introduced the Medicare Part D benefit, effective January 1, 2006; the Deficit Reduction Act of 2005 (Public Law 109-171) (“DRA”); the Medicare Improvements for Patients and Providers Act of 2008 (Public Law 110-275) (“MIPPA”); theAmerican Recovery and Reinvestment Act of 2009; the Patient Protection and Affordable Care Act (Public Law 111-148)(“PPACA”); and the Health Care and Education Reconciliation Act of 2010 (Public Law 111-152), which amended thePPACA (collectively, the “Health Care Reform Laws”). In addition, other U.S. initiatives at both the federal and state levelscould lower reimbursement rates and otherwise change the business environment of our customers and the other entities withwhich we have a business relationship. Further, existing laws and regulations are subject to changing interpretation by courts,regulatory agencies, and agency officials. PBMs have also increasingly become the target of federal and state litigation overalleged practices relating to prescription drug switching, soliciting and receiving unlawful remuneration, handling of rebates,and fiduciary duties, among others.
These factors affect PBMs directly, as well as impacting the purchasing practices and operation of healthcareorganizations. For example, the Health Care Reform Laws impose new transparency requirements on PBMs, and the Centersfor Medicare and Medicaid Services (“CMS”) issued a final rule implementing these requirements in April 2012. Amongother requirements, the new transparency regulations require PBMs to report certain data to the Medicare Part D plan sponsor,who in turn must provide such information to CMS, including, for example, the total number of prescriptions that weredispensed, the aggregate rebates and discounts received by the PBM and attributable to patient utilization under the plan, thepercentage of all prescriptions that were provided through retail pharmacies compared to mail order pharmacies, and theaggregate amount of rebates received by the PBM and passed through to a Medicare Part D sponsor. The Health Care ReformLaws also contain programs to reform or amend the U.S. healthcare system and to change healthcare financing andreimbursement systems. These reforms are expected to increase the number of individuals who have health insurancecoverage and expand the market for pharmaceutical products. However, healthcare industry participants may also respond byreducing their investments or postponing investment decisions, including investments in our product offerings. Importantly, inJanuary 2013, the Department of Health and Human Services (“HHS”) Office for Civil Rights (“OCR”) issued a final rulewhich makes sweeping changes to the privacy, security, breach notification and enforcement regulations promulgated underthe Administrative Simplification provisions of HIPAA (the “Final Omnibus Rule”). The Final Omnibus Rule, whichimplements certain provisions under HITECH and the Genetic Information Nondiscrimination Act of 2008 (“GINA”),enhances individual privacy protections, provides individuals new rights to their health information, and strengthens thegovernment’s ability to enforce HIPAA. The healthcare industry is expected to continue to undergo significant changes for theforeseeable future, and we cannot predict the effect of possible future legislation and regulation on our business, financialcondition and results of operations.
The worker’s compensation industry is also highly regulated and subject to various political, economic and regulatoryinfluences. State Departments of Insurance in many key states have set forth maximum state fee schedules for worker’scompensation provider reimbursement. These maximum fee schedules may be reduced by regulators at any time to thedetriment of PBMs and providers. Any willing provider statutes are also significant in worker’s compensation because non-network pharmacies may seek reimbursement at rates higher than Company contracted pharmacies, thereby driving upreimbursement costs. Moreover, while the Company believes that all in-network pharmacies should be reimbursed atcontracted rates, many providers and third-party billers believe that such reimbursement should be at the higher of the statemaximum fee schedule or the contracted rates. If such providers and positions are held valid, the Company may be subject tosignificant economic risk.
Government efforts to reduce health care costs and alter health care financing practices could lead to a decreaseddemand for our services or to reduced rebates from manufacturers.
The Health Care Reform Laws and other proposals considered by Congress related to health care, could impact PBMsdirectly (e.g., requiring disclosure of information about pricing and product switches), or indirectly (e.g., modifyingreimbursement rates for pharmaceutical manufacturers participating in government programs). The Health Care Reform Lawsand other health care related proposals may increase government involvement in healthcare and regulation of PBM, pharmacyservices and managed care plans, or otherwise change the way we do business. Some of these initiatives would, among otherthings, require that health plan members have greater access to drugs not included on a plan’s formulary and give health planmembers the right to sue their health plans for malpractice when they have been denied care. Health plan sponsors may reactto the Health Care Reform Laws or other health care related proposals, and the uncertainty surrounding them, by cutting backor delaying the purchase of our PBM services, and manufacturers may react by reducing rebates or reducing supplies ofcertain products. These proposals could lead to a decreased demand for our services or to reduced rebates from manufacturers.We cannot predict what effect, if any, these proposals may have on our businesses. PBMs have recently been subject toenhanced political scrutiny as certain U.S. Senators have criticized PBMs for entering into agreements with manufacturers to
25

allegedly limit access to generic products and for allegedly contributing to over-utilization and off-label use of someantipsychotic drugs. This enhanced scrutiny may result in increased audits or examination of the PBM industry. Further, in itsFY 2013 Workplan, the HHS Office of Inspector General (“OIG”) has indicated an intent to focus on PBMs, with plans to(i) review the rebates collected by Medicare Part D sponsors and PBMs and analyze whether there are any discrepanciesbetween the rebate amounts negotiated between PBMs and manufacturers and the actual rebates paid and (ii) assess MedicarePart D sponsors’ abilities to oversee the ways in which PBMs carry out their responsibilities to administer their formulariesand manage prescription drug use. Other legislative or market-driven changes in the healthcare system that we cannotanticipate could also materially adversely affect our business, financial condition and results of operations.
We are subject to potential lawsuits under ERISA and the potential liabilities associated with being found to be afiduciary of a health plan governed by ERISA.
As a service provider to ERISA plans, we are subject to potential litigation under ERISA claims and could face potentialliabilities if we are found to be acting as a fiduciary of a plan in carrying out the services for which we are under contract.While we do not believe that the general conduct of our business subjects us to the fiduciary obligations set forth by ERISA,except when we have specifically contracted with an ERISA plan sponsor to accept fiduciary responsibility and be named as afiduciary for certain functions, recent litigation has revealed uncertainties with respect to whether, and under whatcircumstances, courts will find PBMs to be acting as plan fiduciaries.
Due to the complex laws and regulations governing the Medicare program in which we participate, our recordedestimates may materially change in the future, and our failure to fully comply with such laws and regulations mayadversely impact our business and financial results.
The Medicare Part D program in which we participate is based upon extremely complex laws and regulations that aresubject to interpretation. As a result, there is at least a reasonable possibility that our recorded estimates of receivables fromCMS may change by a material amount in the near term. Additionally, any non-compliance with such laws and regulationscould result in fines, penalties and exclusion from the Medicare program.
Although we are not aware of any allegations of non-compliance that could have a material adverse effect on ourconsolidated financial statements, we cannot assure you that any instances of non-compliance will not have a material adverseeffect on our consolidated financial statements or results of operations.
Uncertainty regarding the impact of Medicare Part D may adversely impact our business and financial results.
MMA created a new, voluntary prescription drug benefit for Medicare beneficiaries entitled to Medicare benefits underMedicare Part A or enrolled in Medicare Part B effective January 1, 2006. We currently participate in the administration ofthe Medicare drug benefit: (i) through the provision of PBM services to our health plan customers and other customers thathave qualified as a PDP or a “Medicare Advantage” prescription drug plan, (ii) by assisting employers, unions and otherhealth plan customers that qualify for the retiree drug subsidy available under Medicare Part D by collecting and submittingeligibility and/or drug cost data to CMS for them in order to obtain the subsidy, and (iii) by operating as a CMS approvedEmployer/Union Group Waiver PDP contract with CMS (S8841). Our existing PBM business could be adversely affected ifour customers decide to discontinue providing prescription drug benefits altogether to their Medicare-eligible members. Weare not yet able to assess the impact that Medicare Part D will have on our customers’ decisions to continue to offer aprescription drug benefit to their Medicare-eligible members.
In addition, as an approved PDP sponsor, we are a direct contractor to the federal government and are subject to therules, regulations, and enforcement authority of the federal government over its contractors. Our subsidiary, CatamaranInsurance of Ohio, Inc, holds a contract with CMS to offer PDP services to employer groups. As required by CMS regulationsto become a PDP sponsor, Catamaran Insurance of Ohio, Inc. is licensed as a domestic insurance company in its domicilestate, Ohio, and is further licensed as a non-resident insurer in 47 other states. We are currently able to offer non-risk basedand risk bearing Medicare benefits to employer groups. We do not currently offer our PDP services directly to individualMedicare Part D enrollees and we would require a contract with CMS authorizing us to do so.
We face additional regulatory risks associated with our specialty pharmacy business which could subject us to additionalregulatory scrutiny and liability and which could adversely affect the profitability of the specialty pharmacy business.
With our acquisition of MedfusionRx and its pharmacies in December 2010, additional state regulations becameapplicable to us. Various aspects of the specialty pharmacy business are governed by state laws and regulations not previouslyapplicable to us or which may now be applicable in different ways. Significant sanctions may be imposed for violations ofthese laws and compliance programs are a significant operational requirement of our business. There are significant
26
uncertainties involving the application of many of these legal requirements to us. Accordingly, we may be required to incuradditional administrative and compliance expenses in determining the applicable requirements and in adapting our compliancepractices, or modifying our business practices, in order to satisfy changing interpretations and regulatory policies.
Our mail and specialty pharmacies are dependent on our relationships with a limited number of suppliers and the loss ofany of these relationships could significantly impact our ability to sustain and/or improve our financial performance.
We acquire a substantial percentage of our mail and specialty pharmacies prescription drug supply from a limitednumber of suppliers. Our agreements with these suppliers may be short-term and cancelable by either party without causewith a relatively short time-frame of prior notice. These agreements may limit our ability to provide services for competingdrugs during the term of the agreement and allow the supplier to distribute through channels other than us. Further, certain ofthese agreements allow pricing and other terms of these relationships to be periodically adjusted for changing marketconditions or required service levels. A termination or modification to any of these relationships could have a material adverseeffect on our business, financial condition and results of operations. An additional risk related to supply is that many productsdistributed by our specialty pharmacy business are manufactured with ingredients that are susceptible to supply shortages. Ifany products we distribute are in short supply for long periods of time, this could result in a material adverse effect on ourbusiness, financial condition and results of operations.
Our ability to grow our specialty pharmacy business could be limited if we do not expand our existing base of drugs or ifwe lose patients.
Our specialty pharmacy business focuses on complex and high cost medications that serve a relatively small patientpopulation. Due to the limited patient populations utilizing the medications that our specialty pharmacy business handles, ourfuture growth relies in part on expanding our base of drugs or penetration in certain treatment categories. Further, a loss ofpatient base or reduction in demand for any reason for the medications we currently dispense could have a material adverseeffect on our business, financial condition and results of operations.
The operations of our specialty pharmacy business may be adversely affected by industry trends in managed carecontracting and consolidation.
A growing number of health plans are contracting with a single provider for specialty pharmacy services. Likewise,manufacturers may not be eager to contract with regional providers of specialty pharmacy services. If we are unable to obtainmanaged care contracts in the areas in which we provide specialty pharmacy services or are unable to obtain specialtypharmacy products at reasonable costs or at all, our business could be adversely affected.
Prescription volumes may decline, and our net revenues and profitability may be negatively impacted, if the safety riskprofiles of drugs increase or if drugs are withdrawn from the market, including as a result of manufacturing issues, or ifprescription drugs transition to over-the-counter products.
We dispense significant volumes of brand-name and generic drugs from our mail-order pharmacies and throughnetworks of retail pharmacies. When increased safety risk profiles or manufacturing issues of specific drugs or classes ofdrugs result in utilization decreases, physicians may cease writing or otherwise reduce the numbers of prescriptions for thesedrugs. Additionally, negative press regarding drugs with higher safety risk profiles may result in reduced global consumerdemand for such drugs. On occasion, products are withdrawn by their manufacturers or transition to over-the-counterproducts. In cases where there are no acceptable prescription drug equivalents or alternatives for these prescription drugs, ourvolumes, net revenues, profitability and cash flows may decline.
Due to complex calculations within our customer contracts, we may be required to issue significant credit memos to ourcustomers that could adversely affect our business, profitability and growth prospects.
Contracts with our customers have complex calculations. We are consistently in the process of implementing proceduresto improve our monitoring of material contractual obligations. We continue to issue credit memos to customers related tomeeting, among other things, pricing performance guarantees and service level requirements. The continued issuance of creditmemos could adversely affect our business, profitability and growth prospects.
Failure of our health plan customers to pay for prescription claims or a delay in payment of those claims could have amaterial adverse effect on our business, results of operations, financial condition or cash flows.
Our contracts with retail pharmacies that participate in our network generally obligate us to make payments forprescription claims even if we are not reimbursed by our customers. If our customers delay their reimbursement payments or
27
fail to make payments for prescription claims, it could have a material adverse effect on our business, results of operations,financial condition or cash flows.
If we become subject to liability claims that are not covered by our insurance policies, we may be liable for damages andother expenses that could have a material adverse effect on our business, results of operations, financial condition orcash flows.
Various aspects of our business may subject us to litigation and liability for damages, such as the performance of PBMservices and the operation of our call centers and website. A successful product or professional liability claim in excess of ourinsurance coverage where we are required to pay damages, incur legal costs or face negative publicity could have a materialadverse effect on our business, results of operations, financial condition or cash flows, our business reputation and our abilityto attract and retain clients, network pharmacies, and employees. While we intend to maintain professional and generalliability insurance coverage at all times, we cannot provide assurance that we will be able to maintain insurance in the future,that insurance will be available on acceptable terms or that insurance will be adequate to cover any or all potential product orprofessional liability claims.
Continuing economic challenges and uncertainties have affected, and are likely to continue to affect, our business,results of operations, financial condition and cash flows.
Unprecedented national and global market and economic conditions that began in 2008 have been and continue to bechallenging because of high unemployment, tighter credit conditions and minimal economic recovery in most majoreconomies. Continued concerns about the systemic impact of potential long-term and wide-spread recession, energy costs,geopolitical issues, the availability and cost of credit, non-U.S. government debt, and the global housing and mortgagemarkets have contributed to increased market volatility and diminished expectations for the U.S. and many other economies.These factors have lead to a decrease in spending by businesses and consumers alike, which may adversely affect ourbusiness, results of operations, financial condition and cash flows, to the extent they impact the liquidity and financialcondition of our customers, reduces the extent to which employers are able to offer pharmacy benefits or reduces the numberof employees receiving pharmacy benefits through their employer.
Our software products are susceptible to undetected errors or similar problems, which may cause our systems to fail toperform properly.
Complex software such as ours often contains defects or errors that are difficult to detect, even through testing, anddespite testing by us, our existing and future software products may contain errors. We strive to regularly introduce newsolutions and enhancements to our products and services. If we detect any errors before introducing a product, we may have todelay commercial release for an extended period of time while the problem is addressed and in some cases may lose sales as aresult of the delay. If we do not discover software errors that affect our products until after they are sold and becomeoperational, we would need to provide enhancements to correct such errors, which would result in unexpected additionalexpense and diversion of resources to remedy such errors.
Any errors in our software or enhancements, regardless of whether or when they are detected or remedied, may result inharm to our reputation, product liability claims, license terminations or renegotiations, or delays in, or loss of, marketacceptance of our product offerings.
Furthermore, our customers might use our software together with products from other companies. As a result, whenproblems occur, it might be difficult to identify the source of the problem. Even when our software does not directly causethese problems, the existence of these errors might cause us to incur significant costs, divert the attention of our technicalpersonnel from development efforts, impact our reputation or cause significant customer relations problems.
We may be liable for the consequences of the use of incorrect or incomplete data that we provide.
We provide data, including patient clinical information, to pharmaceutical providers for their use in dispensingprescription drugs to patients. Third-party contractors provide us with most of this data. If this data is incorrect or incomplete,adverse consequences, including severe injury or death, may occur and give rise to product liability and other claims againstus. In addition, a court or government agency may take the position that our delivery of health information directly, includingthrough pharmaceutical providers, or delivery of information by a third-party site that a consumer accesses through ourwebsites, exposes us to personal injury liability, or other liability for wrongful delivery or handling of healthcare services orerroneous health information. While we maintain product liability insurance coverage in an amount that we believe issufficient for our business, we cannot be assured that this coverage will prove to be adequate or will continue to be available
28
on acceptable terms, if at all. A claim brought against us that is uninsured or under-insured could materially harm ourbusiness, financial condition and results of operations. Even unsuccessful claims could result in substantial costs and diversionof management resources.
It is difficult to predict the length of the sales cycle for our solutions.
The length of the sales cycle for our solutions is difficult to predict, as it depends on a number of factors, including thenature and size of the potential customer and the extent of the commitment being made by the potential customer. Our salesand marketing efforts with respect to pharmaceutical providers and payors generally involve a lengthy sales cycle due to theseorganizations’ complex decision-making processes. Additionally, in light of increased government involvement in healthcareand related changes in the operating environment for healthcare organizations, our current and potential customers may reactby curtailing or deferring investments, including those for our services. In many cases, our acquisition of new business isdependent on us successfully bidding pursuant to a competitive bidding process. If potential customers take longer than weexpect to decide whether to purchase our solutions, our selling expenses could increase and our revenues could decrease or bedelayed, which could materially harm our business, financial condition and results of operations.
If our security is breached, outsiders could gain access to information we are required to keep confidential, and wecould be subject to liability and customers could be deterred from using our services.
Our business relies on using the Internet to transmit confidential information. However, the difficulty of securelytransmitting confidential information over the Internet has been a significant barrier to engaging in sensitive communicationsover the Internet, and is an important concern of our existing and prospective customers. Publicized compromise of Internetsecurity, including third-party misappropriation of patient information or other data, or a perception of any such securitybreach, may deter people from using the Internet for these purposes, which would result in an unwillingness to use oursystems to conduct transactions that involve transmitting confidential healthcare information. Further, if we are unable toprotect the physical and electronic security and privacy of our databases and transactions, we could be subject to potentialliability and regulatory action, our reputation and customer relationships would be harmed, and our business, operations, andfinancial results may be materially adversely affected.
Our operations are vulnerable to interruption by damage from a variety of sources, many of which are not within ourcontrol.
The success of our business depends in part on our ability to operate our systems without interruption. Our products andservices are susceptible to all the threats inherent in computer software and other technology-based systems. Our systems arevulnerable to, among other things, power loss and telecommunications failures, software and hardware errors, failures or crashes,computer viruses and similar disruptive problems, and fire, flood, and other natural disasters. Although we take precautions toguard against and minimize damage from these and other potential risks, including implementing disaster recovery systems andprocedures, they are often unpredictable and beyond our control. Any significant interruptions in our services could damage ourreputation in the marketplace and have a material adverse effect on our business, financial condition and results of operations.
Our business depends on our intellectual property rights, and if we are unable to protect them, our competitive positionmay suffer.
We do not have any patents on our technology. Nonetheless, our business plan is predicated on our proprietary systemsand technology. Accordingly, protecting our intellectual property rights is critical to our continued success and our ability tomaintain our competitive position. We protect our proprietary rights through a combination of trademark, trade secret andcopyright law, confidentiality and non-disclosure agreements with our employees, consultants, customers and suppliers, andlimiting access to our trade secrets and technology. We cannot be assured that the steps we have taken will preventmisappropriation of our technology, which could have a material adverse effect on our competitive position. Also, despite ourefforts to protect our proprietary rights, unauthorized parties may attempt to copy aspects of our intellectual property byreverse-engineering the functionality of our systems or otherwise obtain and use information that we regard as proprietary.Policing unauthorized use of our intellectual property is difficult and expensive, and we are unable to determine the extent, ifany, to which piracy of our intellectual property exists.
In addition, we may have to engage in litigation in the future to enforce or protect our intellectual property rights, and wemay incur substantial costs and the diversion of management’s time and attention as a result.
We may become subject to claims that we infringe the intellectual property rights of others, which, even if notsuccessful, could have a material adverse impact on our business.
We could be subject to intellectual property infringement claims from third parties as the number of our competitorsgrows and our applications’ functionality overlaps with their products. There has been a substantial amount of intellectual
29
property litigation in the information technology industries. While we do not believe that we have infringed or are infringingon any proprietary rights of third parties, we cannot assure that infringement claims will not be asserted against us or thatthose claims will be unsuccessful. Even if a claim brought against us is ultimately unsuccessful, we could incur substantialcosts and diversion of management resources in defending any infringement claims. Furthermore, a party making a claimagainst us could secure a judgment awarding substantial damages as well as injunctive or other equitable relief that couldeffectively block our ability to develop and market our products and services. We may be required to license intellectualproperty from third parties in order to continue using our products, and we cannot assure that we will be able to obtain suchlicenses on commercially reasonable terms, or at all.
We may be unable to obtain, retain the right to use or successfully integrate third-party licenses for the use in oursolutions, which could prevent us from offering the products and services which use those technologies.
We use third-party licenses for some of the technology used in our solutions, and intend to continue licensingtechnologies from third parties. These licenses are the type that ordinarily accompany the business that we conduct. However,these licenses might not continue to be available to us on commercially reasonable terms or at all in the future. Most of theselicenses can be renewed only by mutual consent and may be terminated if we breach the terms of the license and fail to curethe breach within a specified period of time. Although we are not dependent upon any individual license and believe thatsubstitutes are generally available, our inability to obtain or renew any of these licenses could delay development of our newproduct offerings or prevent us from selling our existing solutions until equivalent technology can be identified, licensed andintegrated, or developed by us, and there is no assurance as to when we would be able to do so, if at all. Lack of access torequired licenses from third parties could harm our business, financial condition, and results of operations.
Most of our third-party licenses are non-exclusive. Our competitors may obtain the right to use any of the technologycovered by these licenses and use the technology to attempt to compete more effectively with us. Our use of third-partytechnologies exposes us to risks associated with the integration of components from various sources into our solutions, suchas unknown software errors or defects or unanticipated incompatibility with our systems and technologies. In addition, if ourvendors choose to discontinue support of the licensed technology in the future or are unsuccessful in their continued researchand development efforts, are unable to continue their business, decide to discontinue dealings with us or are acquired by acompetitor or other party that does not wish to deal with us, we may not be able to modify or adapt our own solutions to useother available technologies in a timely manner, if at all.
We are highly dependent on senior management and key employees. Competition for our employees is intense, and wemay not be able to attract and retain the highly skilled employees that we need to support our business.
Our success largely depends on the skills, experience, and continued efforts of our management and other key personnel,and on our ability to continue to attract, motivate, and retain highly qualified individuals. Competition for senior managementand other key personnel is intense, and the pool of suitable candidates is limited. If we lose the services of one or more of ourkey employees, we may not be able to find a suitable replacement and our business, financial condition and results ofoperations could be materially adversely affected.
Our ability to provide high-quality services to our customers also depends in large part upon the experience and expertiseof our employees generally. We must attract and retain highly qualified personnel with a deep understanding of the healthcare,PBM and HCIT industries. We compete with a number of companies for experienced personnel and many of these companies,including customers and competitors, have greater resources than we have and may be able to offer more attractive terms ofemployment. In addition, we invest significant time and expense in training our employees, which increases their value tocustomers and competitors who may seek to recruit them and increases the cost of replacing them. If we are unable to attractor retain qualified employees, the quality of our services could diminish and we may be unable to meet our business andfinancial goals.
Actual financial results may vary from our publicly disclosed forecasts.
Our actual financial results may vary from our publicly disclosed forecasts and these variations could be material andadverse. We periodically provide guidance on future financial results. These forecasts reflect numerous assumptionsconcerning our expected performance, as well as other factors, which are beyond our control and which may not turn out to becorrect. Although we believe that the assumptions underlying our guidance and other forward-looking statements arereasonable when we make such statements, actual results could be materially different. Our financial results are subject tonumerous risks and uncertainties, including those identified throughout these risk factors. If our actual results vary from ourannounced guidance, the price of our common shares may decline, and such a decline could be substantial. We do notundertake to update any guidance or other forward-looking information we may provide.
30

The covenants and restrictions in our credit facilities could adversely affect our business, financial condition and resultsof operations.
In December 2011, we entered into a five-year $350 million unsecured revolving credit facility (the “2011 RevolvingFacility”), of which $100 million in borrowings were drawn in January 2012 to finance in part the acquisition of HealthTranLLC. In July, 2012, we terminated our 2011 Revolving Facility and entered into a $1.8 billion senior secured term loan andrevolving credit agreement with a group of lenders led by JP Morgan Chase Bank, N.A. (the “2012 Credit Agreement”).Concurrently with the Merger with Catalyst, we borrowed $1.4 billion under the 2012 Credit Agreement to partially financethe Merger. Our indebtedness under our credit facilities could adversely affect our financial condition. We will be required todevote a portion of our cash flows from operating activities to service our indebtedness, and therefore, such cash flows willnot be available for other corporate purposes. If we are unable to generate sufficient cash flow from operations in the future toservice our debt obligations, we may be required to refinance all or a portion of our existing debt facilities, or to obtainadditional financing and facilities. However, we may not be able to obtain such refinancing or additional facilities onfavorable terms or at all.
The operating and financial restrictions and covenants contained in the agreements governing our outstanding and futureindebtedness may limit our ability to finance future operations or capital needs, borrow additional funds for development andmake certain investments. For example, our 2012 Credit Agreement restricts our ability to, among other things: incur certainadditional debt or issue guarantees; incur or permit certain liens to exist; make certain investments, acquisitions or otherrestricted payments; dispose of assets; engage in certain types of transactions with affiliates; and merge, consolidate ortransfer all or substantially all of our assets.
If we are required to write off goodwill or other intangible assets, our financial position and results of operations wouldbe adversely affected.
We have significant goodwill and other intangible assets totaling approximately $5.7 billion as of December 31, 2012.We are required to periodically evaluate goodwill and other intangible assets for impairment. In the future we may takecharges against earnings resulting from impairment. Any determination requiring the write-off of a significant portion of ourgoodwill or other intangible assets could adversely affect our results of operations and our financial condition.
Our tax filings are subject to possible review, audit and/or reassessment and we may be liable for additional taxes,interest or penalties if the final tax outcome is different from those provided for in our filings.
Although our primary operations are in the United States, we also have operations in Canada. Our income tax liability istherefore a consolidation of the tax liabilities we expect to have in various locations. Our tax rate is affected by theprofitability of our operations in all locations, tax rates and systems of the countries in which we operate, our tax policies andthe impact of certain tax planning strategies which we have implemented or may implement. To determine our worldwide taxliability, we make estimates of possible tax liabilities. Our tax filings, positions and strategies are subject to review under localor international tax audit and the outcomes of such reviews are uncertain. In addition, these audits generally take place yearsafter the period in which the tax provision in question was provided and it may take a substantial amount of time before thefinal outcome of any audit is known. Future final tax outcomes could also differ materially from the amounts recorded in ourfinancial statements. These differences could have a material effect on our financial position and our net income in the periodsuch determination is made.
Changes in our accounting estimates and assumptions could negatively affect our financial position and results ofoperations.
We prepare our consolidated financial statements in accordance with accounting principles generally accepted in theUnited States (“U.S. GAAP”). These accounting principles require us to make estimates and assumptions that affect thereported amounts of assets and liabilities, and the disclosure of contingent assets and liabilities at the date of our consolidatedfinancial statements. We are also required to make certain judgments that affect the reported amounts of revenues andexpenses during each reporting period. We periodically evaluate our estimates and assumptions including those relating torevenue recognition, rebates, asset impairments, valuation of allowance for doubtful accounts, contingencies, and incometaxes. We base our estimates on historical experience and various assumptions that we believe to be reasonable based onspecific circumstances. Actual results could differ from these estimates, and changes in accounting standards could have anadverse impact on our future financial position and results of operations.
Catalyst Merger Risk Factors
In addition to the risk factors above, investors should consider the following risk factors arising from the recentlycompleted Merger transaction with Catalyst.
31
The anticipated benefits of the Merger with Catalyst may not be realized fully and may take longer to realize thanexpected.
The success of the Merger will depend, in part, on our ability to successfully combine the businesses of Catamaran andCatalyst and realize the anticipated benefits, including synergies, cost savings, innovation and operational efficiencies, fromthe combination. If we are unable to achieve these objectives within the anticipated time frame, or at all, the anticipatedbenefits may not be realized fully or at all, or may take longer to realize than expected and the value of our common stockmay be adversely affected.
The Merger involves the integration of Catalyst’s businesses with Catamaran’s business, which is a complex, costly andtime-consuming process. We have not previously completed a transaction comparable in size or scope to the Merger withCatalyst. The integration of the companies may result in material challenges, including, without limitation:
• the diversion of management’s attention from ongoing business concerns and performance shortfalls at thecombined company as a result of the devotion of management’s attention to the integration;
• managing a larger company;
• maintaining employee morale and retaining key management and other employees;
• integrating two unique corporate cultures, which may prove to be incompatible;
• the possibility of faulty assumptions underlying expectations regarding the integration process;
• retaining existing clients and attracting new clients on profitable terms;
• consolidating corporate and administrative infrastructures and eliminating duplicative operations;
• coordinating geographically separate organizations;
• unanticipated issues in integrating information technology, communications and other systems;
• unanticipated changes in applicable laws and regulations;
• managing tax costs or inefficiencies associated with integrating the operations of the combined company; and
• unforeseen expenses associated with the Merger.
Some of these factors will be outside of our control and any one of them could result in increased costs, decreases in theamount of expected revenues and diversion of management’s time and energy, which could materially impact our business,financial condition and results of operations.
The integration may result in additional and unforeseen expenses, and the anticipated benefits of the integration plan maynot be realized. Delays or issues encountered in the integration process could have a material adverse effect on the revenues,expenses, operating results and financial condition of the combined company. Although we expect significant benefits, suchas synergies, cost savings, innovation and operational efficiencies, to result from the Merger, there can be no assurance thatwe will actually realize any of these anticipated benefits.
We have incurred, and will continue to incur, significant transaction and Merger related costs.
We have incurred, and will continue to incur, significant costs in connection with the transaction and integration process.The substantial majority of these costs will be non-recurring expenses related to the facilities and systems consolidation costs.We may incur additional costs to maintain employee morale and to retain key employees. We will also incur transaction feesand costs related to formulating and revising integration plans. Additional unanticipated costs may be incurred in theintegration of Catalyst’s businesses. Although we expect that the elimination of duplicative costs, as well as the realization ofother efficiencies related to the integration of the businesses, should allow us to more than offset incremental transaction andMerger-related costs over time, this net benefit may not be achieved in the near term, or at all.
The market price of our common stock may decline as a result of the Merger.
The market price of our common stock may decline as a result of the Merger if, among other things, we are unable toachieve the expected growth in earnings, or if our operational cost savings estimates are not realized, or if the transaction costsrelated to the Merger and integration are greater than expected. The market price also may decline if we do not achieve theperceived benefits of the Merger as rapidly or to the extent anticipated by financial or industry analysts or if the effect of theMerger on our financial results is not consistent with the expectations of financial or industry analysts.
32
The combined company’s financial results will depend in substantial part on its ability to maintain the presentrelationships with customers.
A substantial portion of revenues for the Company is generated from a small number of customers. However,competitors of the Company may attempt to persuade present customers to take their business elsewhere. Contracts with manyof these customers permit the customer to terminate the contract for convenience on relatively short notice or upon completionof a transaction such as the Merger. The combined company’s success will depend in part on its ability to maintain thesecustomer relationships. If the combined company is unable to maintain relationships with its customers, or is required tomodify the financial terms of those relationships to the detriment of the combined company, its business, financial conditionand results of operations could be adversely affected.
To be successful, the combined company must retain and motivate key employees, and failure to do so could seriouslyharm the combined company.
The success of the combined company largely depends on the skills, experience and continued efforts of the managementteam and other key personnel. As a result, to be successful, the combined company must retain and motivate executives andother key employees. Employees may experience uncertainty about their future roles with the combined company until orafter strategies for the combined company are announced or executed. These circumstances may adversely affect thecombined company’s ability to retain key personnel. The combined company also must continue to motivate employees andkeep them focused on the strategies and goals of the combined company, which effort may be adversely affected as a result ofthe uncertainty and difficulties with integrating the merged companies. If the combined company is unable to retainexecutives and other key employees, the roles and responsibilities of such executive officers and employees will need to befilled either by existing or new officers and employees, which may require the combined company to devote time andresources to identifying, hiring and integrating replacements for the departed executives and employees that could otherwisebe used to integrate the businesses or otherwise pursue business opportunities. If any key personnel were to join an existingcompetitor or form a competing company, some clients could choose to use the services of that competitor instead of theservices of the combined company. There can be no assurance that the combined company will be able to retain and motivateits employees in the same manner as the merged companies previously did.
If the combined company is unable to manage its growth, its business and financial results could suffer.
The combined company’s future financial results will depend in part on its ability to profitably manage its corebusinesses, including any growth that the combined company may be able to achieve. Over the past several years, each of themerged companies has engaged in the identification of, and competition for, growth and expansion opportunities. In order toachieve those initiatives, the combined company will need to, among other things, recruit, train, retain and effectively manageemployees and expand its operations and financial control systems. If the combined company is unable to manage itsbusinesses effectively and profitably, its business and financial results could suffer.
The Company incurred substantial indebtedness to finance the Merger, which may decrease business flexibility andadversely affect financial results.
The Company incurred debt of approximately $1.4 billion to finance a portion of the cash component of the Mergerconsideration and to refinance existing indebtedness and to pay related fees and expenses. The financial and other covenantsto which the Company has agreed in connection with the incurrence of such debt, and the company’s increased indebtednessand higher debt-to-equity ratio in comparison to that on a recent historical basis may have the effect, among other things, ofreducing our flexibility to respond to changing business and economic conditions, thereby placing the Company at acompetitive disadvantage compared to competitors that have less indebtedness and making us more vulnerable to generaladverse economic and industry conditions. The increased indebtedness will also increase borrowing costs and the covenantspertaining thereto may also limit the Company’s ability to obtain additional financing to fund working capital, capitalexpenditures, acquisitions or general corporate requirements. The Company will also be required to dedicate a larger portionof its cash flow from operations to payments on its indebtedness, thereby reducing the availability of its cash flow for otherpurposes, including working capital, capital expenditures and general corporate purposes. In addition, the company’sborrowings are at variable rates of interest, therefore exposing the Combined company to interest rate risk.
The Company’s ability to make payments on and to refinance its debt obligations and to fund planned capitalexpenditures will depend on its ability to generate cash from the Company’s operations. This, to a certain extent, is subject togeneral economic, financial, competitive, legislative, regulatory and other factors that are beyond the Company’s control.
The Company may not be able to refinance any of its indebtedness on commercially reasonable terms, or at all. If theCompany cannot service its indebtedness, we may have to take actions such as selling assets, seeking additional equity or
33
reducing or delaying capital expenditures, strategic acquisitions, investments and alliances, any of which could impede theimplementation of the combined company’s business strategy or prevent the Company from entering into transactions thatwould otherwise benefit its business. Additionally, the Company may not be able to effect such actions, if necessary, oncommercially reasonable terms, or at all.
The Merger may not be accretive and may cause dilution to the Company’s earnings per share, which may negativelyaffect the market price of the Company’s common stock.
The Company currently anticipates that the Merger will be accretive to earnings per share in 2013. This expectation isbased on preliminary estimates which may materially change. The Company could also encounter additional transaction andintegration-related costs or other factors such as the failure to realize all of the benefits anticipated in the Merger. All of thesefactors could cause dilution to the Company’s earnings per share or decrease or delay the expected accretive effect of theMerger and cause a decrease in the price of the Company’s common stock.
ITEM 1B. UNRESOLVED STAFF COMMENTS
None
ITEM 2. PROPERTIES
The Company’s principal executive offices, along with PBM and HCIT operations, are located in a 116,712 square footleased office facility located at 2441 Warrenville Road, Suite 610 in Lisle, Illinois (suburban Chicago). This lease expires inJanuary 2018. Additionally, the Company maintains PBM and HCIT operations in several other leased locations in theU.S. and Canada, including Arizona, Arkansas, Colorado,Georgia, Ontario (Canada), Massachusetts, Maryland, Pennsylvaniaand Texas. We operate mail order pharmacy facilities in Colorado, Florida, Ohio and Texas and specialty pharmacies inAlabama, Georgia, Kansas, Louisiana, Maine, Massachusetts, Mississippi, Nevada, Tennessee, Texas, and West Virginia. TheCompany believes these properties are adequate for its current operations. All of the Company’s facilities are leased.
ITEM 3. LEGAL PROCEEDINGS
For information on legal proceedings, see Note 15—Commitments and Contingencies to our consolidated financialstatements included in Item 8 of this Annual Report on Form 10-K, which is hereby incorporated by reference into this Item 3.
ITEM 4. MINE SAFETY DISCLOSURES
Not Applicable.
34

PART II
ITEM 5. MARKET FOR REGISTRANT’S COMMON EQUITY, RELATED STOCKHOLDER MATTERS ANDISSUER PURCHASES OF EQUITY SECURITIES
Market Information
The Company’s common stock is traded on the Toronto Stock Exchange (“TSX”) and NASDAQ Stock Market(“NASDAQ”) under the ticker symbols “CCT” and “CTRX,” respectively. Stock prices quoted on the TSX are denominatedin Canadian dollars. The following table sets forth for each period indicated the high and low sales prices for the Company’scommon stock on the TSX:
High Low
2012
First quarter . . . . . . . . . . . . . . . . . . . . . . . . . . . . . . . . . . . . . . . . . . . . . . . . . . . . . . . . . . Cdn$37.62 Cdn$28.64
Second quarter . . . . . . . . . . . . . . . . . . . . . . . . . . . . . . . . . . . . . . . . . . . . . . . . . . . . . . . . Cdn$52.85 Cdn$36.17
Third quarter . . . . . . . . . . . . . . . . . . . . . . . . . . . . . . . . . . . . . . . . . . . . . . . . . . . . . . . . . Cdn$53.30 Cdn$42.03
Fourth quarter . . . . . . . . . . . . . . . . . . . . . . . . . . . . . . . . . . . . . . . . . . . . . . . . . . . . . . . . Cdn$52.75 Cdn$45.49
2011
First quarter . . . . . . . . . . . . . . . . . . . . . . . . . . . . . . . . . . . . . . . . . . . . . . . . . . . . . . . . . . Cdn$26.76 Cdn$21.21
Second quarter . . . . . . . . . . . . . . . . . . . . . . . . . . . . . . . . . . . . . . . . . . . . . . . . . . . . . . . . Cdn$29.75 Cdn$25.28
Third quarter . . . . . . . . . . . . . . . . . . . . . . . . . . . . . . . . . . . . . . . . . . . . . . . . . . . . . . . . . Cdn$31.32 Cdn$22.47
Fourth quarter . . . . . . . . . . . . . . . . . . . . . . . . . . . . . . . . . . . . . . . . . . . . . . . . . . . . . . . . Cdn$30.49 Cdn$20.73
The Company’s common stock began trading on the NASDAQ on June 13, 2006. The following table sets forth for eachperiod indicated the high and low sales prices for the Company’s common stock on the NASDAQ:
High Low
2012
First quarter . . . . . . . . . . . . . . . . . . . . . . . . . . . . . . . . . . . . . . . . . . . . . . . . . . . . . . . . . . . . . . . . $38.21 $28.41
Second quarter . . . . . . . . . . . . . . . . . . . . . . . . . . . . . . . . . . . . . . . . . . . . . . . . . . . . . . . . . . . . . . $51.99 $36.41
Third quarter . . . . . . . . . . . . . . . . . . . . . . . . . . . . . . . . . . . . . . . . . . . . . . . . . . . . . . . . . . . . . . . . $52.40 $41.67
Fourth quarter . . . . . . . . . . . . . . . . . . . . . . . . . . . . . . . . . . . . . . . . . . . . . . . . . . . . . . . . . . . . . . . $53.13 $45.43
2011
First quarter . . . . . . . . . . . . . . . . . . . . . . . . . . . . . . . . . . . . . . . . . . . . . . . . . . . . . . . . . . . . . . . . $27.50 $21.30
Second quarter . . . . . . . . . . . . . . . . . . . . . . . . . . . . . . . . . . . . . . . . . . . . . . . . . . . . . . . . . . . . . . $31.00 $26.27
Third quarter . . . . . . . . . . . . . . . . . . . . . . . . . . . . . . . . . . . . . . . . . . . . . . . . . . . . . . . . . . . . . . . . $33.20 $22.66
Fourth quarter . . . . . . . . . . . . . . . . . . . . . . . . . . . . . . . . . . . . . . . . . . . . . . . . . . . . . . . . . . . . . . . $30.00 $20.18
On February 1, 2013, the closing sale price of the common stock, as reported by the TSX and NASDAQ was Cdn.$53.48and $53.50 per share, respectively. As of February 1, 2013, there were approximately 61,401 holders of the Company’scommon stock either of record or in street name.
Dividend Policy
We have never paid a cash dividend on our common shares and have no present intention to commence the payment ofcash dividends. It is possible that the Board of Directors could determine in the future, based on the Company’s financial andother relevant circumstances at that time, to pay cash dividends. We currently intend to retain earnings to finance the growthand development of our business and for working capital and general corporate purposes. Any payment of dividends will be atthe discretion of our board of directors and will depend upon earnings, financial condition, capital requirements, level ofindebtedness, contractual restrictions with respect to payment of dividends, restrictions imposed by applicable law and otherfactors. In particular, the terms of the 2012 Credit Agreement limit our ability to pay dividends. See Note 9—Long-TermLiabilities in the notes to our consolidated financial statements for more information on the Company’s 2012 CreditAgreement.
35
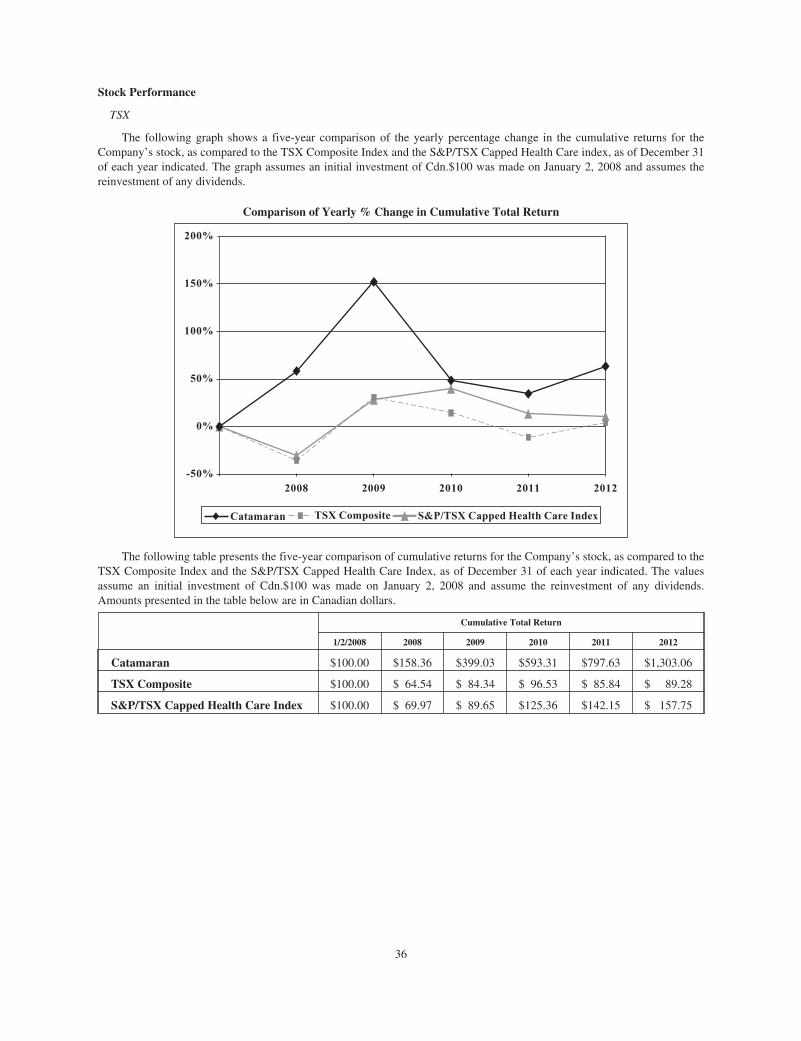
Stock Performance
TSX
The following graph shows a five-year comparison of the yearly percentage change in the cumulative returns for theCompany’s stock, as compared to the TSX Composite Index and the S&P/TSX Capped Health Care index, as of December 31of each year indicated. The graph assumes an initial investment of Cdn.$100 was made on January 2, 2008 and assumes thereinvestment of any dividends.
Comparison of Yearly % Change in Cumulative Total Return
Catamaran TSX Composite S&P/TSX Capped Health Care Index
-50%
200%
150%
100%
50%
0%
2008 2009 201220112010
The following table presents the five-year comparison of cumulative returns for the Company’s stock, as compared to theTSX Composite Index and the S&P/TSX Capped Health Care Index, as of December 31 of each year indicated. The valuesassume an initial investment of Cdn.$100 was made on January 2, 2008 and assume the reinvestment of any dividends.Amounts presented in the table below are in Canadian dollars.
Cumulative Total Return
1/2/2008 2008 2009 2010 2011 2012
Catamaran $100.00 $158.36 $399.03 $593.31 $797.63 $1,303.06
TSX Composite $100.00 $ 64.54 $ 84.34 $ 96.53 $ 85.84 $ 89.28
S&P/TSX Capped Health Care Index $100.00 $ 69.97 $ 89.65 $125.36 $142.15 $ 157.75
36

Nasdaq
The following graph shows a five-year comparison of the yearly percentage change in the Company’s stock, as comparedto the Nasdaq Composite Index and the iShares Dow Jones US Healthcare Index, as of December 31 of each year indicated.The graph assumes an initial investment of $100 was made on January 2, 2008 and assumes the reinvestment of anydividends.
Comparison of Yearly % Change in Cumulative Total Return
Catamaran Nasdaq Composite iShares Dow Jones US Healthcare
-50%
200%
150%
100%
50%
0%
2008 2009 201220112010
The following table presents a five-year comparison of cumulative returns for the Company’s stock, as compared to theNasdaq Composite Index and the iShare Dow Jones US Healthcare index, as of December 31 of each year indicated. Thevalues assume an initial investment of $100 was made on January 2, 2008 and assumes the reinvestment of any dividends.
Cumulative Total Return
1/2/2008 2008 2009 2010 2011 2012
Catamaran $100.00 $129.36 $373.68 $593.63 $782.27 $1,304.71
Nasdaq Composite $100.00 $ 60.43 $ 86.95 $101.66 $ 99.83 $ 115.71
iShares Dow Jones US Healthcare $100.00 $ 77.47 $ 93.72 $ 97.58 $108.57 $ 128.89
The information in this “Stock Performance” section shall not be deemed to be “soliciting material” or to be “filed” withthe SEC or subject to Regulation 14A or 14C, or to the liabilities of Section 18 of the Securities Exchange Act of 1934.
Recent Sales of Unregistered Securities
Not applicable.
37

ITEM 6. SELECTED CONSOLIDATED FINANCIAL DATA
The following selected consolidated financial data have been derived from the consolidated financial statements of theCompany contained elsewhere in this Annual Report on Form 10-K and the Company’s Annual Report on Form 10-K for thefiscal years ended December 31, 2012, 2011 and 2010. The selected consolidated financial data should be read in conjunctionwith “Management’s Discussion and Analysis of Financial Condition and Results of Operations” and the consolidatedfinancial statements, including the notes thereto.
For The Years Ended December 31,
2012(6)(7)(8)(9) 2011(5) 2010(3)(4) 2009(2) 2008(1)
(Dollars in thousands except share and per share data)
Statement of Operations Data:
Revenue . . . . . . . . . . . . . . . . . . . . . . . . . . . . . . . . . . $ 9,940,120 $ 4,975,496 $ 1,948,389 $ 1,438,634 $ 862,939
Net income . . . . . . . . . . . . . . . . . . . . . . . . . . . . . . . $ 116,658 $ 91,786 $ 64,735 $ 46,061 $ 15,113
Earnings per share attributable to the Company . . .
Basic . . . . . . . . . . . . . . . . . . . . . . . . . . . . . . . . . . $ 0.70 $ 0.74 $ 0.53 $ 0.44 $ 0.16
Diluted . . . . . . . . . . . . . . . . . . . . . . . . . . . . . . . . . $ 0.70 $ 0.73 $ 0.51 $ 0.43 $ 0.16
Weighted average common shares outstanding:
Basic . . . . . . . . . . . . . . . . . . . . . . . . . . . . . . . . . . 166,765,682 124,253,312 121,473,662 104,016,816 91,913,864
Diluted . . . . . . . . . . . . . . . . . . . . . . . . . . . . . . . . . 167,830,620 125,903,516 126,273,200 107,189,492 93,652,044
Ratio of earnings to fixed charges(10) . . . . . . . . . . 7.03 35.20 30.94 9.98 4.43
Balance Sheet Data:
Total assets . . . . . . . . . . . . . . . . . . . . . . . . . . . . . . . $ 7,385,127 $ 1,050,307 $ 816,790 $ 662,080 $ 428,343
Debt-current and long-term portion . . . . . . . . . . . . $ 1,173,403 $ — $ — $ — $ 47,640
Total equity . . . . . . . . . . . . . . . . . . . . . . . . . . . . . . . $ 4,609,861 $ 671,038 $ 553,256 $ 458,494 $ 194,163
Notes:
1) Effective April 30, 2008, the Company, through a wholly-owned subsidiary, acquired all of the outstanding shares ofNMHC, based in Port Washington, New York, which provided PBM services. The results of operations of the acquiredbusiness are included from the date of acquisition. The Company issued 11.1 million shares of its common stock inconnection with the acquisition.
2) On September 23, 2009, the Company completed a public offering in Canada and the U.S. of 20.7 million of its commonshares at a price of $10.38 per share. The net proceeds to the Company from the offering were $203.1 million and wereused for general corporate purposes.
3) On September 17, 2010, the Company executed a two-for-one stock split effected by a stock dividend on the issued andoutstanding common shares of the Company. All share and per share data presented in this Annual Report have beenadjusted to reflect this stock split.
4) The Company completed its acquisition of MedfusionRx on December 28, 2010. The purchase price for MedfusionRxwas $101.5 million in cash with an additional $5.5 million potential earn-out payment subject to the achievement ofcertain financial performance targets through 2012.
5) The Company completed its acquisitions of PTRX and SaveDirectRx on October 3, 2011. The aggregate purchase pricefor the acquisitions was $77.2 million in cash, subject to customary working capital adjustments, with an additional$4.5 million potential earn-out payment subject to the achievement of certain financial performance targets through 2012.
6) In January 2012, the Company completed the acquisition of all of the outstanding equity interests of HealthTran, a full-service PBM, in exchange for $250 million in cash, subject to certain customary post-closing adjustments.
7) On May 16, 2012, the Company completed its public offering of 12.0 million of its common shares at a price to the publicof $45.30 per share. The net proceeds to the Company from the offering were approximately $519.1 million, afterdeducting the underwriting discounts and commissions and offering expenses. The Company used the net proceeds fromthe offering to pay a portion of the cash component of the Merger consideration and to pay certain related fees andexpenses and used the balance for general corporate purposes.
8) On July 2, 2012, the Company completed the Merger with Catalyst, a full-service PBM. Each share of Catalyst commonstock outstanding immediately prior to the effective time of the Merger (other than shares owned by the Company or
38

Catalyst or any of their respective wholly-owned subsidiaries) was converted in the Merger into the right to receive 1.3212Company common shares (0.6606 of a Company common share prior to the October 2012 two-for-one stock split) and$28.00 in cash. This resulted in the Company issuing approximately 66.8 million shares of common stock, assuming0.5 million Catalyst warrants, and paying $1.4 billion in cash to Catalyst shareholders to complete the Merger.
9) On September 20, 2012, the Company executed a two-for-one stock split effected by a stock dividend on the issued andoutstanding common shares of the Company. All share and per share data presented in this Annual Report have beenadjusted to reflect this stock split.
10) See Exhibit 12.1 to this Annual Report for the computation of the ratios of earnings to fixed charges.
ITEM 7. MANAGEMENT’S DISCUSSION AND ANALYSIS OF FINANCIAL CONDITION AND RESULTS OFOPERATIONS
This Management’s Discussion and Analysis (“MD&A”) of Catamaran Corporation (the “Company” or “Catamaran”)should be read in conjunction with the consolidated financial statements of the Company and the related notes theretoincluded in Item 8 of this Annual Report on Form 10-K. This MD&A also contains forward-looking statements and should beread in conjunction with the risk factors described in Item 1A “Risk Factors.”
Certain statements included in this MD&A, including those that express management’s objectives and the strategies toachieve those objectives, as well as information with respect to the Company’s beliefs, plans, expectations, anticipations,estimates and intentions, constitute “forward-looking statements” within the meaning of applicable securities laws. Forward-looking statements are necessarily based upon a number of estimates and assumptions that, while considered reasonable bymanagement at this time, are inherently subject to significant business, economic and competitive uncertainties andcontingencies. We caution that such forward-looking statements involve known and unknown risks, uncertainties and otherrisks that may cause our actual financial results, performance, or achievements to be materially different from our estimatedfuture results, performance or achievements expressed or implied by those forward-looking statements. Numerous factorscould cause actual results to differ materially from those in the forward-looking statements, including without limitation, ourdependence on, and ability to retain, key customers; our ability to achieve increased market acceptance for our productofferings and penetrate new markets; consolidation in the healthcare industry; the existence of undetected errors or similarproblems in our software products; our ability to identify and complete acquisitions, manage our growth, integrateacquisitions and achieve expected synergies from acquisitions; our ability to compete successfully; potential liability for theuse of incorrect or incomplete data; the length of the sales cycle for our solutions and services; interruption of our operationsdue to outside sources; maintaining our intellectual property rights and litigation involving intellectual property rights; ourability to obtain, use or successfully integrate third-party licensed technology; compliance with existing laws, regulations andindustry initiatives and future change in laws or regulations in the healthcare industry; breach of our security by thirdparties; our dependence on the expertise of our key personnel; our access to sufficient capital to fund our futurerequirements; potential write-offs of goodwill or other intangible assets; and the outcome of any legal proceeding that hasbeen or may be instituted against us. This list is not exhaustive of the factors that may affect any of our forward-lookingstatements and is subject to change. For additional information with respect to certain of these and other factors, refer to therisk factors described in Item 1A of this Annual Report on Form 10-K.
In addition, numerous factors could cause actual results with respect to the merger with Catalyst Health Solutions, Inc.(“Catalyst” or the “Merger”) to differ materially from those in the forward-looking statements, including, without limitation,the possibility that the expected efficiencies and cost savings from the Merger will not be realized, or will not be realizedwithin the expected time period; the risk that the Company’s and Catalyst businesses will not be integrated successfully;disruption from the Merger making it more difficult to maintain business and operational relationships; the risk of customerattrition; and the impact on the availability of funds for other business purposes due to our debt service obligations and fundsrequired to integrate Catalyst.
When relying on forward-looking information to make decisions, investors and others should carefully consider theforegoing factors and other uncertainties and potential events. In making the forward-looking statements contained in thisMD&A, the Company does not assume any future significant acquisitions, dispositions or one-time items. It does assume,however, the renewal of certain customer contracts. Every year, the Company has major customer contracts that come up forrenewal. In addition, the Company also assumes new customer contracts. In this regard, the Company is pursuing largeopportunities that present a very long and complex sales cycle which substantially affects its forecasting abilities. TheCompany has assumed certain timing for the realization of these opportunities which it believes is reasonable but which maynot be achieved. Furthermore, the pursuit of these larger opportunities does not ensure a linear progression of revenue andearnings since they may involve significant up-front costs followed by renewals and cancellations of existing contracts. TheCompany has assumed certain revenues which may not be realized. The Company has also assumed that the material factors
39
referred to in the previous paragraph will not cause such forward-looking information to differ materially from actual resultsor events. There can be no assurance that such assumptions will reflect the actual outcome of such items or factors.Accordingly, investors are cautioned not to put undue reliance on forward-looking statements.
THE FORWARD-LOOKING INFORMATION CONTAINED IN THIS MD&A REPRESENTS THE COMPANY’SCURRENT EXPECTATIONS AND, ACCORDINGLY, IS SUBJECT TO CHANGE. HOWEVER, THE COMPANYEXPRESSLY DISCLAIMS ANY INTENTION OR OBLIGATION TO UPDATE OR REVISE ANY FORWARD-LOOKINGINFORMATION, WHETHER AS A RESULT OF NEW INFORMATION, FUTURE EVENTS OR OTHERWISE, EXCEPT ASREQUIRED BY APPLICABLE LAW.
All figures are in U.S. dollars unless otherwise stated.
Overview
Catalyst Merger
On April 17, 2012, the Company entered into a definitive merger agreement (the “Merger Agreement”) to combine theCompany and Catalyst in a cash and stock merger transaction (the “Merger”). The Merger was completed on July 2, 2012,following the approval by shareholders of the Company and Catalyst. For financial reporting and accounting purposes, theCompany was the acquirer of Catalyst. The consolidated financial statements included in Item 8 of this Annual Report onForm 10-K reflect the results of operations of Catalyst since the acquisition date.
Additionally, following the completion of the Merger, the Company unveiled a new name and brand for the combinedcompany, Catamaran Corporation. In conjunction with the name change, the Company’s common shares began trading underthe ticker symbols “CTRX” on the NASDAQ Stock Market and “CCT” on the Toronto Stock Exchange.
PBM Business
The Company provides comprehensive PBM services to customers, which include managed care organizations, localgovernments, unions, corporations, HMOs, employers, workers’ compensation plans, third party health care planadministrators, and federal and state government programs through its network of licensed pharmacies throughout the UnitedStates. The PBM services include electronic point-of-sale pharmacy claims management, retail pharmacy networkmanagement, Medicare Part D services, patient services, benefit design consultation, preferred drug management programs,drug review and analysis, consulting services, data access and reporting and information analysis. The Company also ownsand operates a network of mail and specialty pharmacies.
The mail pharmacies provide members flexibility, privacy, and easy access to their maintenance medications whileoffering significant plan savings to the customer. These pharmacies provide high quality service, member support andconvenient, easy-to-use mail service delivery throughout the U.S. Plan savings for mail service are dependent on plan designfeatures, including co-payments and incentives, and utilization patterns.
The Company’s specialty pharmacy offering provides customers the ability to control spending on specialty medicationsand ensure patients receive the necessary, personalized support for complex medications in one of the fastest growing sectorsof pharmaceutical spending through its specialty pharmacy locations. The Company’s specialty therapy medicationmanagement program uses a highly-trained and specialized clinical staff organized in disease pods, a patient-centric approach,and evidence based clinical treatment protocols. The patient care team communicates with the patient, patient’s physician, andother caregivers as needed to obtain a complete medical and pharmacy history and then craft an individualized treatment plan,including patient education, counseling and expected therapy outcomes. Plan savings are achieved as the cost for specialtymedication using this program is generally lower than retail pricing. In addition, the Company is a national provider of drugbenefits to its customers under the federal government’s Medicare Part D program.
Revenue primarily consists of sales of prescription drugs, together with any associated administrative fees, to customersand participants, through the Company’s nationwide network of participating pharmacies or the Company’s own mail andspecialty pharmacies. Revenue related to the sales of prescription drugs is recognized when the claims are adjudicated and theprescription drugs are shipped. Claims are adjudicated at the point-of-sale using a real-time processing system.
Under the Company’s customer contracts, the pharmacy is solely obligated to collect the co-payments from theparticipants. As such, the Company does not include participant co-payments paid to non-Company owned pharmacies inrevenue or cost of revenue. During 2012, 2011 and 2010, pharmacies, excluding the Company’s internally owned mail andspecialty locations, collected approximately $1.8 billion, $0.7 billion, and $0.4 billion, respectively, in co-payments from theparticipants. If we had included these co-payments collected at non-Company owned pharmacies in our reported revenue anddirect expenses, our operating and net income would not have been affected.
40

The Company evaluates customer contracts to determine whether it acts as a principal or as an agent in the fulfillment ofprescriptions through its participating pharmacy network. The Company acts as a principal in most of its transactions withcustomers and revenue is recognized at the prescription price (ingredient cost plus dispensing fee) negotiated with customers,plus an administrative fee, if applicable (“gross reporting”). Gross reporting is appropriate when the Company (i) has separatecontractual relationships with customers and with pharmacies, (ii) is responsible to validate and manage a claim through theclaims adjudication process, (iii) commits to set prescription prices for the pharmacy, including instructing the pharmacy as tohow that price is to be settled (co-payment requirements), (iv) manages the overall prescription drug relationship with thepatients, who are participants of customers’ plans, and (v) has credit risk for the price due from the customer. In instanceswhere the Company merely administers a customer’s network pharmacy contract to which the Company is not a party andunder which the Company does not assume pricing risk and credit risk, among other factors, the Company only records anadministrative fee as revenue. For these customers, the Company earns an administrative fee for collecting payments from thecustomer and remitting the corresponding amount to the pharmacies in the customer’s network. In these transactions, theCompany acts as an agent for the customer. As the Company is not the principal in these transactions, the drug ingredient costis not included in revenue or in cost of revenue (“net reporting”). As such, there is no impact to gross profit based uponwhether gross or net reporting is used.
HCIT Business
The Company is also a leading provider of HCIT solutions and services to payors, and other participants in thepharmaceutical supply chain in North America. The Company’s product offerings include a wide range of software productsfor managing prescription drug programs and for drug prescribing and dispensing. The Company’s solutions are available ona license basis with on-going maintenance and support or on a transaction fee basis using an Application Service Provider(“ASP”) model. The Company’s payor customers include managed care organizations, Blue Cross Blue Shield organizations,government agencies, employers and intermediaries such as pharmacy benefit managers. The solutions offered by theCompany’s services assist payors in managing the complexity and reducing the cost of their prescription drug programs anddispensing activities.
Profitability of the HCIT business depends primarily on revenue derived from transaction processing services, softwarelicense sales, hardware sales, maintenance, and professional services. Recurring revenue remains a cornerstone of theCompany’s business model and consists of transaction processing services and maintenance. Growth in revenue fromrecurring sources has been driven primarily by growth in the Company’s transaction processing business in the form of claimsprocessing for its payor customers. Through the Company’s transaction processing business, where the Company is generallypaid based on the volume of transactions processed, the Company continues to benefit from the growth in pharmaceuticaldrug use in the United States. The Company believes that aging demographics and increased use of prescription drugs willcontinue to benefit the transaction processing business. In addition to benefiting from this industry growth, the Companycontinues to focus on increasing recurring revenue in the transaction processing area by adding new transaction processingcustomers to its existing customer base. The recognition of revenue depends on various factors including the type of serviceprovided, contract parameters, and any undelivered elements.
Operating Expenses
The Company’s operating expenses primarily consist of cost of revenue, selling, general and administrative (“SG&A”)costs, depreciation, and amortization. Cost of revenue includes the costs of drugs dispensed as well as costs related to theproducts and services provided to customers and costs associated with the operation and maintenance of the transactionprocessing centers. These costs include salaries and related expenses for professional services personnel, transactionprocessing centers’ personnel, customer support personnel and depreciation expense related to data center operations. SG&Acosts relate to selling expenses, commissions, marketing, network administration and administrative costs, including legal,accounting, investor relations and corporate development costs. Depreciation expense relates to the depreciation of propertyand equipment used by the Company. Amortization expense relates to definite-lived intangible assets from businessacquisitions.
Industry Overview
The PBM and pharmacy industries are intensely competitive, generally resulting in continuous pressure on gross profit asa percentage of total revenue. In recent years, industry consolidation and dramatic growth in managed healthcare have led toincreasingly aggressive pricing of PBM services. Given the pressure on all parties to reduce healthcare costs, the Companyexpects this competitive environment to continue for the foreseeable future. In order to remain competitive, the Companylooks to continue to drive purchasing efficiencies of pharmaceuticals to improve operating margins, and target the acquisitionof other businesses to achieve its strategy of expanding its product offerings and customer base. The Company also looks to
41
retain and expand its customer base by improving the quality of service provided by enhancing its solutions and lowering thetotal drug spend for customers.
The HCIT industry is increasingly competitive as technologies continue to advance and new products continue toemerge. This rapidly developing industry requires the Company to perpetually improve its offerings to meet customer’s risingproduct standards. Recent governmental stimulus initiatives to improve the country’s electronic health records should assistthe growth of the industry, but it may also increase competition as more players enter the expanding market.
The complicated environment in which the Company operates presents it with opportunities, challenges, and risks. TheCompany’s clients are paramount to its success; the retention of existing and winning of new clients and members poses thegreatest opportunity, and the loss thereof represents an ongoing risk. The preservation of the Company’s relationships withpharmaceutical manufacturers and the Company’s network of participating pharmacies is very important to the execution ofits business strategies. The Company’s future success will hinge on its ability to drive volume at its mail and specialtypharmacies and increase generic dispensing rates in light of the significant brand-name drug patent expirations expected tooccur over the next several years. The Company’s ability to continue to provide innovative and competitive clinical and otherservices to clients and patients, including the Company’s active participation in the Medicare Part D benefit and the rapidlygrowing specialty pharmacy industry, also will play an important part in the Company’s future success.
The frequency with which the Company’s customer contracts come up for renewal, and the potential for one of theCompany’s larger customers to terminate, or elect not to renew, its existing contract with the Company, create the risk that theCompany’s results of operations may be volatile. The Company’s customer contracts generally do not have terms longer thanthree years and, in some cases, are terminable by the customer on relatively short notice. The Company’s larger customersgenerally seek bids from other PBM providers in advance of the expiration of their contracts. If existing customers elect not torenew their contracts with the Company at the expiration of the current terms of those contracts, and in particular if one of theCompany’s largest customers elects not to renew, the Company’s recurring revenue base will be reduced and results ofoperations will be adversely affected.
The Company operates in a competitive environment where clients and other payors seek to control the growth in thecost of providing prescription drug benefits. The Company’s business model is designed to reduce the level of drug cost. TheCompany helps manage drug cost primarily through its programs designed to maximize the substitution of expensive branddrugs with equivalent but much lower cost generic drugs, obtaining competitive discounts from suppliers, securing rebatesfrom pharmaceutical manufacturers and third party rebate administrators, securing discounts from retail pharmacies, applyingthe Company’s sophisticated clinical programs, and efficiently administering prescriptions dispensed through the Company’smail and specialty pharmacies.
Various aspects of the Company’s business are governed by federal and state laws and regulations. Because sanctionsmay be imposed for violations of these laws, compliance is a significant operational requirement. The Company believes it isin substantial compliance with all existing legal requirements material to the operation of its business. There are, however,significant uncertainties involving the application of many of these legal requirements to its business. In addition, there arenumerous proposed health care laws and regulations at the federal and state levels, many of which could adversely affect theCompany’s business, results of operations and financial condition. The Company is unable to predict what additional federalor state legislation or regulatory initiatives may be enacted in the future relating to its business or the health care industry ingeneral, or what effect any such legislation or regulations might have on it. The Company also cannot provide any assurancethat federal or state governments will not impose additional restrictions or adopt interpretations of existing laws or regulationsthat could have a material adverse effect on its business or financial performance.
Competitive Strengths
The Company has demonstrated its ability to serve a broad range of clients from large managed care organizations andstate governments to employer groups with fewer than a thousand members. The Company believes its principal competitivestrengths are:
Flexible, customized and independent services: The Company believes a key differentiator between itself and itscompetitors is not only the Company’s ability to provide innovative PBM services, but also to deliver these services onan à la carte basis. The Catamaran suite offers the flexibility of broad product choice along the entire PBM continuum,enabling enhanced customer control, solutions tailored to the Company’s customers’ specific requirements, and flexiblepricing. The market for the Company’s products is divided between large customers that have the sophisticatedtechnology infrastructure and staff required to operate a 24-hour data center and other customers that are not able orwilling to operate these sophisticated systems.
The Company’s business model allows its large customers to license the Company’s products and operate theCompany’s systems themselves (with or without taking advantage of the Company’s significant customization,
42
consulting and systems implementation services) and allows its other customers to utilize the Company’s systems’capabilities on a fee-per-transaction or subscription basis through ASP processing from the Company’s data center.
Leading technology and platform: The Company’s technology is robust, scalable, and web-enabled. The platform isable to instantly cross-check multiple processes, such as reviewing claim eligibility, adverse drug reaction and properlycalculating member, pharmacy and payor payments. The Company’s technology is built on flexible, database-driven rulesets and broad functionality applicable for most any type of business. The Company believes it has one of the mostcomprehensive claims processing platforms in the market.
The Company’s technology platform allows it to provide more comprehensive PBM services by offering customersa selection of services to choose from to meet their unique needs versus requiring them to accept a one-size-fits-allsolution. The Company believes this à la carte offering is a key differentiator from its competitors.
Measurable cost savings for customers: The Company provides its customers with increased control overprescription drug costs and drug benefit programs. The Company’s pricing model and flexible product offerings aredesigned to deliver measurable cost savings to the Company’s customers. The Company believes its pricing model is akey differentiator from its competitors for the Company’s customers who want to gain control of their prescription drugcosts. For customers who select the Company’s pharmacy network and manufacturer rebate services on a fixed fee pertransaction basis, there is clarity to the rebates and other fees payable to the client. The Company believes that its pricingmodel together with the flexibility to select from a broad range of customizable services helps the customers realizemeasurable results and cost savings.
Selected trends and highlights for the year ended December 31, 2012 compared to the same period in 2011
Business Trends
Our results for the year ended December 31, 2012 reflect the successful execution of our business model, whichemphasizes the alignment of our financial interests with those of our clients through greater use of generics, low-cost brandsand mail and specialty pharmacies. A key focus during the year was the integration of our recent acquisitions of HealthTran,LLC (“HealthTran”) in January and Catalyst in July. The addition of these companies with their additional scale and productofferings helped the Company continue to see the positive trends we experienced in 2011 related to improved pricing fromincreased scale and increased generic usage, and enabled the Company to offset the negative impact of various marketplaceforces affecting pricing and plan structure, among other factors, and thus we were able to continue to generate improvementsin our results of operations. Additionally, the regulatory environment continued to evolve during the year and we havecontinued to make significant investments in our product offerings designed to keep us ahead of the competition.
The integration of our recent acquisitions has helped drive overall growth in our top line revenue as well as in our overalloperating results. We also continue to benefit from better management of ingredient costs through increased competitionamong generic manufacturers. The average generic dispensing rate (“GDR”), or the number of generic prescriptions as apercentage of the total number of prescriptions dispensed, for Catamaran clients reached 82% in 2012, compared to 78% in2011. This aggressive generic trend is a result of a consultative client management approach and the strategic management ofgeneric utilization, channel management, clinical programs, plan design and the use of a preferred network. This increase washelped considerably by a continuing wave of major generic releases.
Financial results
Total revenue in 2012 was $9.9 billion as compared to $5.0 billion in 2011. The increase is largely attributable to anincrease in PBM revenue of $4.9 billion due primarily to the recent Merger with Catalyst, which was completed on July 2,2012 and contributed $3.2 billion in revenue since the closing of the Merger, as well as organic growth driven by volumefrom the Company’s PBM customers. As a result, the Company’s adjusted prescription claim volume increased 116.9% in2012 to 198.9 million from 91.7 million during 2011. Adjusted prescription claim volume equals the Company’s retail andspecialty pharmacy prescriptions, plus mail pharmacy prescriptions multiplied by three. The mail pharmacy prescriptions aremultiplied by three to adjust for the fact that they typically include approximately three times the amount of product dayssupplied compared with retail and specialty prescriptions.
Operating income increased $76.4 million, or 54.4%, in 2012 to $217.0 million as compared to $140.6 million in 2011.The increase is largely attributable to the recent Merger with Catalyst, as well as organic growth as a result of the successfulimplementation of new customer contracts in 2012. Partially offsetting the growth in operating income during 2012 wereMerger related expenses totaling $44.2 million and additional amortization expense of $104.8 million resulting from theidentified intangible assets recorded due to the 2012 acquisitions.
43

The Company reported net income attributable to the Company of $116.7 million, or $0.70 per share (fully-diluted), forthe year ended December 31, 2012 compared to $91.8 million, or $0.73 per share (fully-diluted), in 2011. Net incomeattributable to the Company is higher for the year ended December 31, 2012 as compared to 2011 as a result of the addition ofthe Catalyst book of business and other new customer implementations during the year. These increases were offset by anincrease in interest expense of $23.9 million as a result of the Company’s borrowings utilized to partially finance the Mergerwith Catalyst, plus the additional expenses discussed above. Amortization expense was $130.1 million in 2012 as compared to$16.4 million in 2011.
Earnings per share attributable to the Company decreased for the year ended December 31, 2012 as compared to 2011,primarily attributable to an increase in common shares outstanding as a result of the Company’s issuance of approximately12.0 million common shares in a May 2012 public offering and the issuance of 66.8 million shares to complete the Mergerwith Catalyst, as well as an increase in amortization expense as discussed above.
Strong operational results and strong attention to cash management yielded cash flow from operations of $249.7 millionin 2012, an increase of $155.1 million from 2011.
Business combinations
On July 2, 2012, the Company completed the Merger with Catalyst, a full-service PBM. Each share of Catalyst commonstock outstanding immediately prior to the effective time of the Merger (other than shares owned by the Company or Catalystor any of their respective wholly-owned subsidiaries) was converted into the right to receive 1.3212 Company common shares(0.6606 of a Company common share prior to the October 2012 two-for-one stock split) and $28.00 in cash. This resulted inthe Company issuing approximately 66.8 million shares of common stock, assuming 0.5 million Catalyst warrants, and paying$1.4 billion in cash to Catalyst shareholders to complete the Merger.
In January 2012, the Company completed the acquisition of all of the outstanding equity interests of HealthTran, inexchange for $250 million in cash, subject to certain customary post-closing adjustments. HealthTran was an existing HCITcustomer and utilizes one of the Company’s platforms for its claims adjudication services.
Recent developments
In December 2012, the Company expanded the size of its board of directors from seven to nine and appointed BetsyHolden and Karen Katen to Catamaran’s Board of Directors, effective December 10, 2012.
On September 6, 2012, the Company announced that its board of directors had declared a nominal dividend on the issuedand outstanding common shares of the Company to effect a two-for-one stock split. Shareholders of record at the close ofbusiness on September 20, 2012 were issued one additional common share for each share owned as of that date. Theadditional common shares were distributed on October 1, 2012. All share and per share data presented in this report have beenadjusted to reflect this stock split.
In July 2012, the Company announced that two new directors, Harry M. Kraemer and Steven B. Epstein, would join theCatamaran board following the completion of the Merger. Mr. Kraemer joined the Catamaran Board in July 2012 andMr. Epstein joined the Catamaran Board in August 2012. In addition, Curtis J. Thorne and Philip R. Reddon tendered theirresignations as Catamaran directors in July 2012.
In July 2012, following the completion of the Merger with Catalyst, the Company changed its name from SXC HealthSolutions Corp. to Catamaran Corporation. Along with the name change, the Company’s shares began being traded under theticker symbols “CTRX” on the NASDAQ Stock Market (“ NASDAQ”) and as “CCT” on the Toronto Stock Exchange(“TSX”), replacing the ticker symbols “SXCI” and “SXC” on the NASDAQ and TSX, respectively.
Concurrent with the consummation of the Merger on July 2, 2012, the Company executed a $1.8 billion credit agreementconsisting of (i) a five-year senior secured term loan facility in the amount of $1.1 billion (the “Term A Facility”) and (ii) afive-year senior secured revolving credit facility in the amount of $700 million (the “Revolving Facility,” and, together withthe Term A Facility, the “2012 Credit Agreement”). In July 2012, the Company borrowed $1.4 billion under the 2012 CreditAgreement and utilized the proceeds to partially finance the aggregate cash consideration payable to Catalyst stockholders inthe Merger, repay and discharge existing indebtedness of the Company and Catalyst and pay related transaction fees andexpenses. All obligations of the Company with respect to the 2012 Credit Agreement are guaranteed by certain of its materialdirect and indirect subsidiaries. Refer to Note 9 — Long - Term Liabilities in the notes to the consolidated financial statementsfor more information regarding the 2012 Credit Agreement.
On May 16, 2012, the Company announced that it successfully completed a public offering of 12.0 million of itscommon shares at a price to the public of $45.30 per share. The net proceeds to the Company from the offering were
44
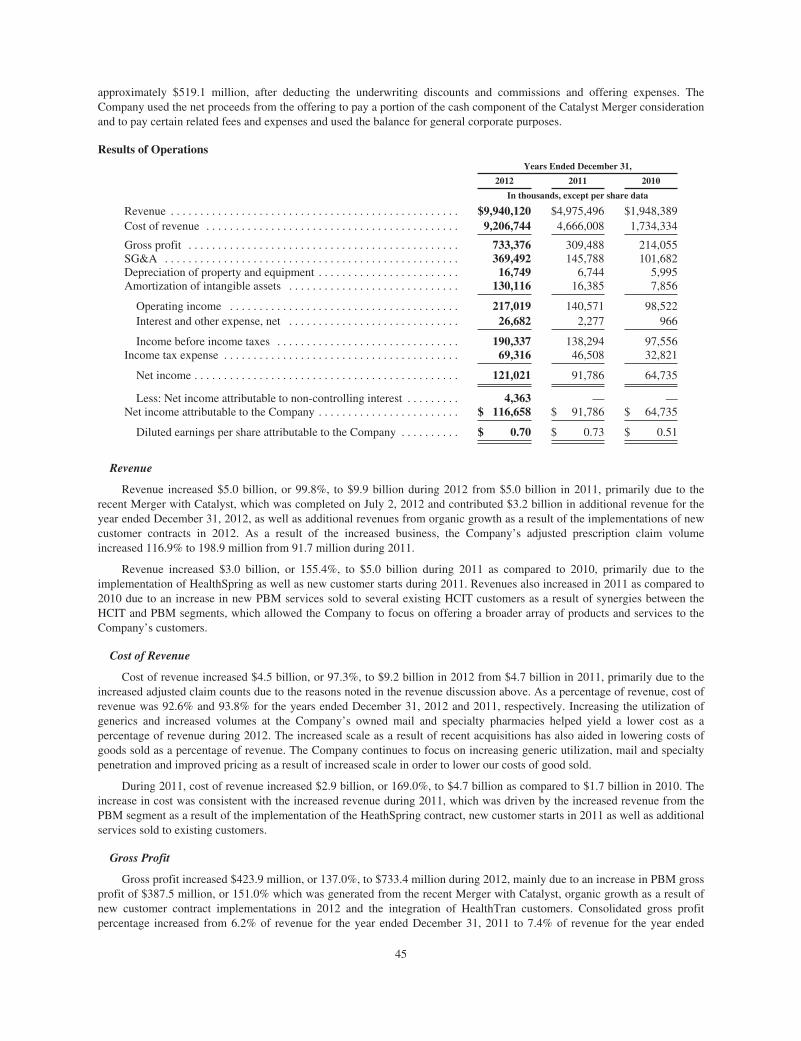
approximately $519.1 million, after deducting the underwriting discounts and commissions and offering expenses. TheCompany used the net proceeds from the offering to pay a portion of the cash component of the Catalyst Merger considerationand to pay certain related fees and expenses and used the balance for general corporate purposes.
Results of OperationsYears Ended December 31,
2012 2011 2010
In thousands, except per share data
Revenue . . . . . . . . . . . . . . . . . . . . . . . . . . . . . . . . . . . . . . . . . . . . . . . . . $9,940,120 $4,975,496 $1,948,389Cost of revenue . . . . . . . . . . . . . . . . . . . . . . . . . . . . . . . . . . . . . . . . . . . 9,206,744 4,666,008 1,734,334
Gross profit . . . . . . . . . . . . . . . . . . . . . . . . . . . . . . . . . . . . . . . . . . . . . . 733,376 309,488 214,055SG&A . . . . . . . . . . . . . . . . . . . . . . . . . . . . . . . . . . . . . . . . . . . . . . . . . . 369,492 145,788 101,682Depreciation of property and equipment . . . . . . . . . . . . . . . . . . . . . . . . 16,749 6,744 5,995Amortization of intangible assets . . . . . . . . . . . . . . . . . . . . . . . . . . . . . 130,116 16,385 7,856
Operating income . . . . . . . . . . . . . . . . . . . . . . . . . . . . . . . . . . . . . . . 217,019 140,571 98,522Interest and other expense, net . . . . . . . . . . . . . . . . . . . . . . . . . . . . . 26,682 2,277 966
Income before income taxes . . . . . . . . . . . . . . . . . . . . . . . . . . . . . . . 190,337 138,294 97,556Income tax expense . . . . . . . . . . . . . . . . . . . . . . . . . . . . . . . . . . . . . . . . 69,316 46,508 32,821
Net income . . . . . . . . . . . . . . . . . . . . . . . . . . . . . . . . . . . . . . . . . . . . . 121,021 91,786 64,735
Less: Net income attributable to non-controlling interest . . . . . . . . . 4,363 — —Net income attributable to the Company . . . . . . . . . . . . . . . . . . . . . . . . $ 116,658 $ 91,786 $ 64,735
Diluted earnings per share attributable to the Company . . . . . . . . . . $ 0.70 $ 0.73 $ 0.51
Revenue
Revenue increased $5.0 billion, or 99.8%, to $9.9 billion during 2012 from $5.0 billion in 2011, primarily due to therecent Merger with Catalyst, which was completed on July 2, 2012 and contributed $3.2 billion in additional revenue for theyear ended December 31, 2012, as well as additional revenues from organic growth as a result of the implementations of newcustomer contracts in 2012. As a result of the increased business, the Company’s adjusted prescription claim volumeincreased 116.9% to 198.9 million from 91.7 million during 2011.
Revenue increased $3.0 billion, or 155.4%, to $5.0 billion during 2011 as compared to 2010, primarily due to theimplementation of HealthSpring as well as new customer starts during 2011. Revenues also increased in 2011 as compared to2010 due to an increase in new PBM services sold to several existing HCIT customers as a result of synergies between theHCIT and PBM segments, which allowed the Company to focus on offering a broader array of products and services to theCompany’s customers.
Cost of Revenue
Cost of revenue increased $4.5 billion, or 97.3%, to $9.2 billion in 2012 from $4.7 billion in 2011, primarily due to theincreased adjusted claim counts due to the reasons noted in the revenue discussion above. As a percentage of revenue, cost ofrevenue was 92.6% and 93.8% for the years ended December 31, 2012 and 2011, respectively. Increasing the utilization ofgenerics and increased volumes at the Company’s owned mail and specialty pharmacies helped yield a lower cost as apercentage of revenue during 2012. The increased scale as a result of recent acquisitions has also aided in lowering costs ofgoods sold as a percentage of revenue. The Company continues to focus on increasing generic utilization, mail and specialtypenetration and improved pricing as a result of increased scale in order to lower our costs of good sold.
During 2011, cost of revenue increased $2.9 billion, or 169.0%, to $4.7 billion as compared to $1.7 billion in 2010. Theincrease in cost was consistent with the increased revenue during 2011, which was driven by the increased revenue from thePBM segment as a result of the implementation of the HeathSpring contract, new customer starts in 2011 as well as additionalservices sold to existing customers.
Gross Profit
Gross profit increased $423.9 million, or 137.0%, to $733.4 million during 2012, mainly due to an increase in PBM grossprofit of $387.5 million, or 151.0% which was generated from the recent Merger with Catalyst, organic growth as a result ofnew customer contract implementations in 2012 and the integration of HealthTran customers. Consolidated gross profitpercentage increased from 6.2% of revenue for the year ended December 31, 2011 to 7.4% of revenue for the year ended
45
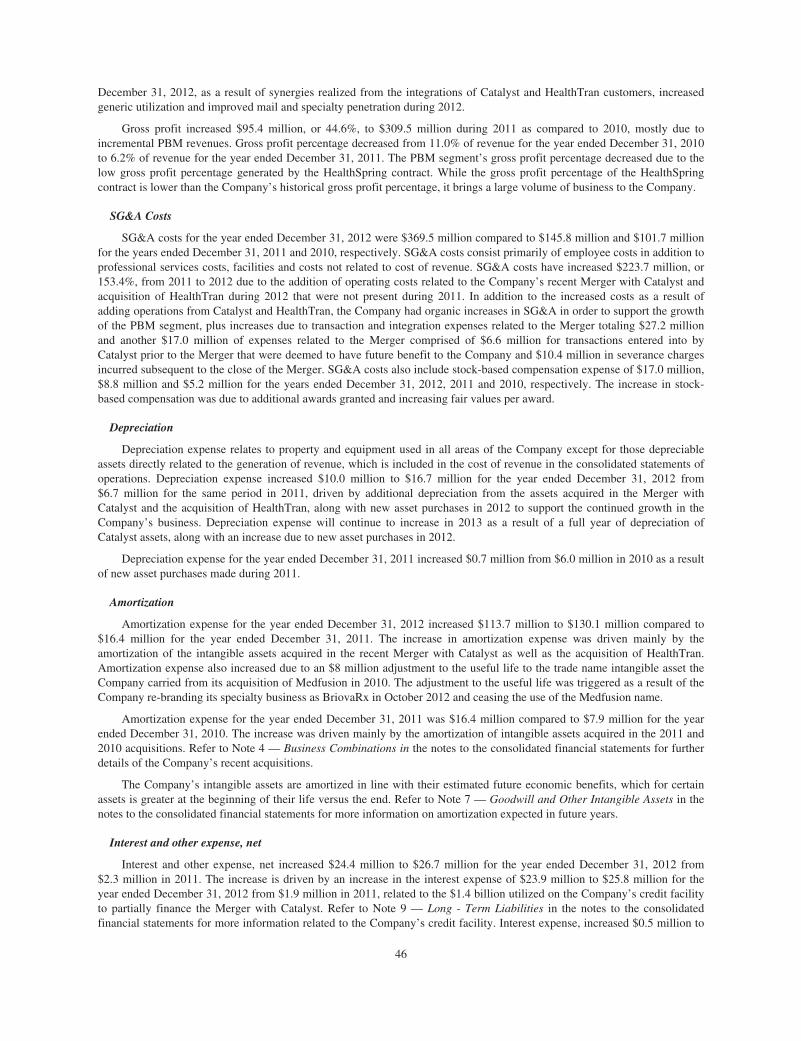
December 31, 2012, as a result of synergies realized from the integrations of Catalyst and HealthTran customers, increasedgeneric utilization and improved mail and specialty penetration during 2012.
Gross profit increased $95.4 million, or 44.6%, to $309.5 million during 2011 as compared to 2010, mostly due toincremental PBM revenues. Gross profit percentage decreased from 11.0% of revenue for the year ended December 31, 2010to 6.2% of revenue for the year ended December 31, 2011. The PBM segment’s gross profit percentage decreased due to thelow gross profit percentage generated by the HealthSpring contract. While the gross profit percentage of the HealthSpringcontract is lower than the Company’s historical gross profit percentage, it brings a large volume of business to the Company.
SG&A Costs
SG&A costs for the year ended December 31, 2012 were $369.5 million compared to $145.8 million and $101.7 millionfor the years ended December 31, 2011 and 2010, respectively. SG&A costs consist primarily of employee costs in addition toprofessional services costs, facilities and costs not related to cost of revenue. SG&A costs have increased $223.7 million, or153.4%, from 2011 to 2012 due to the addition of operating costs related to the Company’s recent Merger with Catalyst andacquisition of HealthTran during 2012 that were not present during 2011. In addition to the increased costs as a result ofadding operations from Catalyst and HealthTran, the Company had organic increases in SG&A in order to support the growthof the PBM segment, plus increases due to transaction and integration expenses related to the Merger totaling $27.2 millionand another $17.0 million of expenses related to the Merger comprised of $6.6 million for transactions entered into byCatalyst prior to the Merger that were deemed to have future benefit to the Company and $10.4 million in severance chargesincurred subsequent to the close of the Merger. SG&A costs also include stock-based compensation expense of $17.0 million,$8.8 million and $5.2 million for the years ended December 31, 2012, 2011 and 2010, respectively. The increase in stock-based compensation was due to additional awards granted and increasing fair values per award.
Depreciation
Depreciation expense relates to property and equipment used in all areas of the Company except for those depreciableassets directly related to the generation of revenue, which is included in the cost of revenue in the consolidated statements ofoperations. Depreciation expense increased $10.0 million to $16.7 million for the year ended December 31, 2012 from$6.7 million for the same period in 2011, driven by additional depreciation from the assets acquired in the Merger withCatalyst and the acquisition of HealthTran, along with new asset purchases in 2012 to support the continued growth in theCompany’s business. Depreciation expense will continue to increase in 2013 as a result of a full year of depreciation ofCatalyst assets, along with an increase due to new asset purchases in 2012.
Depreciation expense for the year ended December 31, 2011 increased $0.7 million from $6.0 million in 2010 as a resultof new asset purchases made during 2011.
Amortization
Amortization expense for the year ended December 31, 2012 increased $113.7 million to $130.1 million compared to$16.4 million for the year ended December 31, 2011. The increase in amortization expense was driven mainly by theamortization of the intangible assets acquired in the recent Merger with Catalyst as well as the acquisition of HealthTran.Amortization expense also increased due to an $8 million adjustment to the useful life to the trade name intangible asset theCompany carried from its acquisition of Medfusion in 2010. The adjustment to the useful life was triggered as a result of theCompany re-branding its specialty business as BriovaRx in October 2012 and ceasing the use of the Medfusion name.
Amortization expense for the year ended December 31, 2011 was $16.4 million compared to $7.9 million for the yearended December 31, 2010. The increase was driven mainly by the amortization of intangible assets acquired in the 2011 and2010 acquisitions. Refer to Note 4 — Business Combinations in the notes to the consolidated financial statements for furtherdetails of the Company’s recent acquisitions.
The Company’s intangible assets are amortized in line with their estimated future economic benefits, which for certainassets is greater at the beginning of their life versus the end. Refer to Note 7 — Goodwill and Other Intangible Assets in thenotes to the consolidated financial statements for more information on amortization expected in future years.
Interest and other expense, net
Interest and other expense, net increased $24.4 million to $26.7 million for the year ended December 31, 2012 from$2.3 million in 2011. The increase is driven by an increase in the interest expense of $23.9 million to $25.8 million for theyear ended December 31, 2012 from $1.9 million in 2011, related to the $1.4 billion utilized on the Company’s credit facilityto partially finance the Merger with Catalyst. Refer to Note 9 — Long - Term Liabilities in the notes to the consolidatedfinancial statements for more information related to the Company’s credit facility. Interest expense, increased $0.5 million to
46

$1.9 million for the year ended December 31, 2011 compared to 2010, primarily due to increased banking fees driven by ahigher number of transactions as a result of business added from recent acquisitions and growth in the PBM segment.
Income Taxes
The Company recognized income tax expense of $69.3 million for the year ended December 31, 2012, representing aneffective tax rate of 36.4%, compared to $46.5 million, representing an effective tax rate of 33.6%, for the same period in2011. The effective tax rate increased during the current year due to certain costs that were not deductible and other taxestriggered as a result of the Catalyst Merger.
Segment Analysis
The Company manages its business in two segments: PBM and HCIT, and evaluates segment performance based onrevenue and gross profit. Information about the Company’s reportable segments for the years ended December 31, 2012, 2011and 2010 is presented below:
PBMYears Ended December 31,
(dollars in thousands) . . . . . . . . . . . . . . . . . . . . . . . . . . . . . . . . . . . . . . . . . . . . . . . . . . . . . 2012 2011 2010
Revenue . . . . . . . . . . . . . . . . . . . . . . . . . . . . . . . . . . . . . . . . . . . . . . . . $9,785,084 $4,859,243 $1,841,600
Cost of revenue . . . . . . . . . . . . . . . . . . . . . . . . . . . . . . . . . . . . . . . . . . 9,141,029 4,602,662 1,681,944
Gross profit . . . . . . . . . . . . . . . . . . . . . . . . . . . . . . . . . . . . . . . . . . . . . $ 644,055 $ 256,581 $ 159,656
Gross profit % . . . . . . . . . . . . . . . . . . . . . . . . . . . . . . . . . . . . . . . . . . 6.6% 5.3% 8.7%
Revenue increased by $4.9 billion, or 101.4% to $9.8 billion for the year ended December 31, 2012 as compared to$4.9 billion in 2011. The increase in revenue is primarily due to the recent Merger with Catalyst, which was completed onJuly 2, 2012, and the acquisition of HealthTran in January 2012, as well as organic growth as a result of the implementation ofnew customer contracts in 2012. As a result of these customer additions, adjusted prescription claim volume for the PBMsegment increased 116.9% to 198.9 million from 91.7 million during 2011.
Revenue increased $3.0 billion, or 163.9%, for the year ended December 31, 2011 as compared to 2010 due to newcustomer starts during 2011, lead by the implementation of the HealthSpring contract on January 1, 2011.
Cost of revenue was $9.1 billion for the year ended December 31, 2012, compared to $4.6 billion for the same period in2011, an increase of $4.5 billion, or 98.6%, in line with the increase in PBM revenue and increased adjusted prescriptionclaim volume. Cost of revenue is predominantly comprised of the cost of prescription drugs. As a percentage of revenue, costof revenue was 93.4% and 94.7% for the years ended December 31, 2012 and 2011, respectively. The decrease in the cost ofrevenue as a percentage of revenue was primarily due to the synergies realized as a result of the Merger as well as theincreased use of lower cost generic drugs and higher utilization of the Company’s owned mail and specialty pharmacies.Generic drug usage continues to be a focus of the industry, and the Company, to help drive down health care costs to ourcustomers. The average GDR for PBM clients reached 82% in 2012, a 4% increase from 2011. This increase was achievedthrough a broad range of plan design solutions, helped considerably by a continuing wave of major generic releases. TheCompany will continue to seek opportunities for increased generic prescription drug usage to help reduce overall prescriptiondrug costs to its customers and the Company.
For the year ended December 31, 2011, compared to 2010, cost of revenue increased $2.9 billion, or 173.7%. Theincrease was in line with the increase in PBM revenues during this period. As a percentage of revenue, cost of revenue was94.7% and 91.3% for the years ended December 31, 2011 and 2010, respectively. The increase in the cost of revenue as apercentage of revenue was due to lower margins earned on new customer starts in 2011.
Gross profit increased $387.5 million, or 151.0% to $644.1 million for the year ended December 31, 2012, compared to$256.6 million in 2011 due to the the integration of Catalyst customers acquired as of July 2, 2012 as well as incrementalrevenue as a result of the HealthTran acquisition and new customer contract implementations. Gross profit percentage was6.6% and 5.3% for the years ended December 31, 2012 and 2011, respectively. Gross profit percentage increased primarily asa result of synergies realized from the integration of Catalyst and HealthTran customers during 2012, along with improvedusage of generics and higher utilization at the Company’s mail and specialty pharmacies.
During the year ended December 31, 2011, gross profit increased $96.9 million, or 60.7%, compared to gross profit in2010. This growth was primarily due to expansion of the customer base, including HealthSpring in 2011 compared to 2010.Gross profit percentage was 5.3% and 8.7% for the years ended December 31, 2011 and 2010. Gross profit percentagedecreased during 2011 as compared to 2010 due to newer business being added at lower margins, driven by the
47
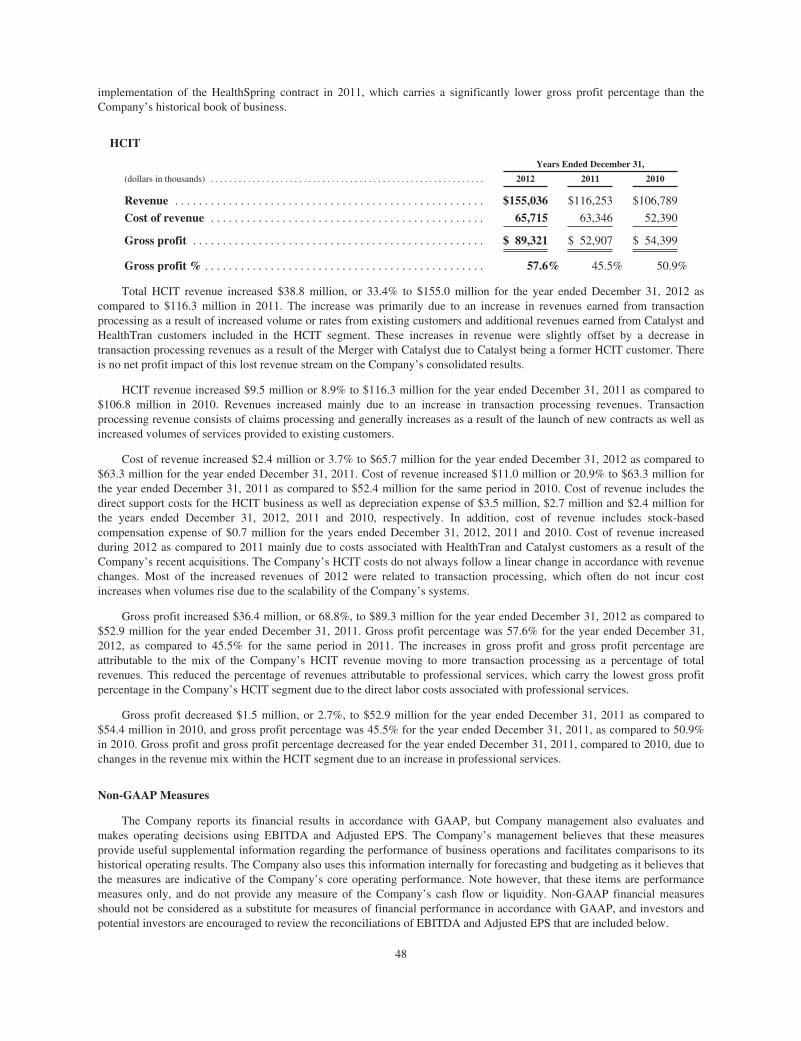
implementation of the HealthSpring contract in 2011, which carries a significantly lower gross profit percentage than theCompany’s historical book of business.
HCIT
Years Ended December 31,
(dollars in thousands) . . . . . . . . . . . . . . . . . . . . . . . . . . . . . . . . . . . . . . . . . . . . . . . . . . . . . . . . . . . 2012 2011 2010
Revenue . . . . . . . . . . . . . . . . . . . . . . . . . . . . . . . . . . . . . . . . . . . . . . . . . . . . $155,036 $116,253 $106,789
Cost of revenue . . . . . . . . . . . . . . . . . . . . . . . . . . . . . . . . . . . . . . . . . . . . . . 65,715 63,346 52,390
Gross profit . . . . . . . . . . . . . . . . . . . . . . . . . . . . . . . . . . . . . . . . . . . . . . . . . $ 89,321 $ 52,907 $ 54,399
Gross profit % . . . . . . . . . . . . . . . . . . . . . . . . . . . . . . . . . . . . . . . . . . . . . . . 57.6% 45.5% 50.9%
Total HCIT revenue increased $38.8 million, or 33.4% to $155.0 million for the year ended December 31, 2012 ascompared to $116.3 million in 2011. The increase was primarily due to an increase in revenues earned from transactionprocessing as a result of increased volume or rates from existing customers and additional revenues earned from Catalyst andHealthTran customers included in the HCIT segment. These increases in revenue were slightly offset by a decrease intransaction processing revenues as a result of the Merger with Catalyst due to Catalyst being a former HCIT customer. Thereis no net profit impact of this lost revenue stream on the Company’s consolidated results.
HCIT revenue increased $9.5 million or 8.9% to $116.3 million for the year ended December 31, 2011 as compared to$106.8 million in 2010. Revenues increased mainly due to an increase in transaction processing revenues. Transactionprocessing revenue consists of claims processing and generally increases as a result of the launch of new contracts as well asincreased volumes of services provided to existing customers.
Cost of revenue increased $2.4 million or 3.7% to $65.7 million for the year ended December 31, 2012 as compared to$63.3 million for the year ended December 31, 2011. Cost of revenue increased $11.0 million or 20.9% to $63.3 million forthe year ended December 31, 2011 as compared to $52.4 million for the same period in 2010. Cost of revenue includes thedirect support costs for the HCIT business as well as depreciation expense of $3.5 million, $2.7 million and $2.4 million forthe years ended December 31, 2012, 2011 and 2010, respectively. In addition, cost of revenue includes stock-basedcompensation expense of $0.7 million for the years ended December 31, 2012, 2011 and 2010. Cost of revenue increasedduring 2012 as compared to 2011 mainly due to costs associated with HealthTran and Catalyst customers as a result of theCompany’s recent acquisitions. The Company’s HCIT costs do not always follow a linear change in accordance with revenuechanges. Most of the increased revenues of 2012 were related to transaction processing, which often do not incur costincreases when volumes rise due to the scalability of the Company’s systems.
Gross profit increased $36.4 million, or 68.8%, to $89.3 million for the year ended December 31, 2012 as compared to$52.9 million for the year ended December 31, 2011. Gross profit percentage was 57.6% for the year ended December 31,2012, as compared to 45.5% for the same period in 2011. The increases in gross profit and gross profit percentage areattributable to the mix of the Company’s HCIT revenue moving to more transaction processing as a percentage of totalrevenues. This reduced the percentage of revenues attributable to professional services, which carry the lowest gross profitpercentage in the Company’s HCIT segment due to the direct labor costs associated with professional services.
Gross profit decreased $1.5 million, or 2.7%, to $52.9 million for the year ended December 31, 2011 as compared to$54.4 million in 2010, and gross profit percentage was 45.5% for the year ended December 31, 2011, as compared to 50.9%in 2010. Gross profit and gross profit percentage decreased for the year ended December 31, 2011, compared to 2010, due tochanges in the revenue mix within the HCIT segment due to an increase in professional services.
Non-GAAP Measures
The Company reports its financial results in accordance with GAAP, but Company management also evaluates andmakes operating decisions using EBITDA and Adjusted EPS. The Company’s management believes that these measuresprovide useful supplemental information regarding the performance of business operations and facilitates comparisons to itshistorical operating results. The Company also uses this information internally for forecasting and budgeting as it believes thatthe measures are indicative of the Company’s core operating performance. Note however, that these items are performancemeasures only, and do not provide any measure of the Company’s cash flow or liquidity. Non-GAAP financial measuresshould not be considered as a substitute for measures of financial performance in accordance with GAAP, and investors andpotential investors are encouraged to review the reconciliations of EBITDA and Adjusted EPS that are included below.
48
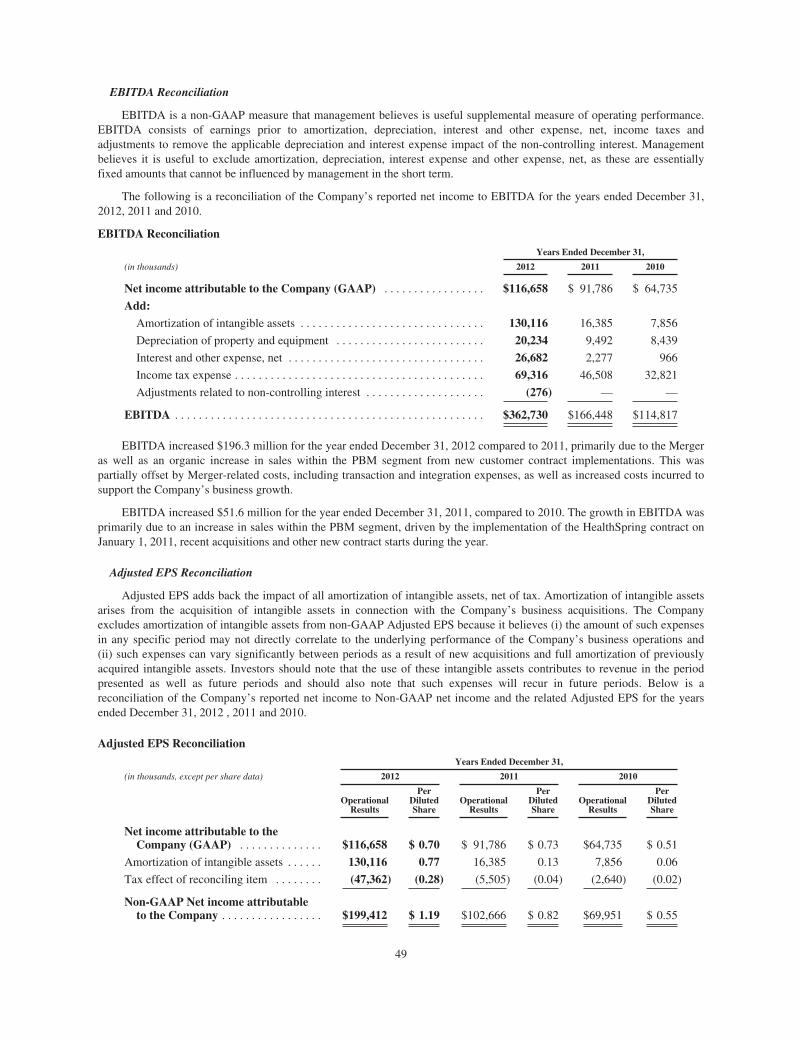
EBITDA Reconciliation
EBITDA is a non-GAAP measure that management believes is useful supplemental measure of operating performance.EBITDA consists of earnings prior to amortization, depreciation, interest and other expense, net, income taxes andadjustments to remove the applicable depreciation and interest expense impact of the non-controlling interest. Managementbelieves it is useful to exclude amortization, depreciation, interest expense and other expense, net, as these are essentiallyfixed amounts that cannot be influenced by management in the short term.
The following is a reconciliation of the Company’s reported net income to EBITDA for the years ended December 31,2012, 2011 and 2010.
EBITDA Reconciliation
Years Ended December 31,
(in thousands) 2012 2011 2010
Net income attributable to the Company (GAAP) . . . . . . . . . . . . . . . . . $116,658 $ 91,786 $ 64,735
Add:
Amortization of intangible assets . . . . . . . . . . . . . . . . . . . . . . . . . . . . . . . 130,116 16,385 7,856
Depreciation of property and equipment . . . . . . . . . . . . . . . . . . . . . . . . . 20,234 9,492 8,439
Interest and other expense, net . . . . . . . . . . . . . . . . . . . . . . . . . . . . . . . . . 26,682 2,277 966
Income tax expense . . . . . . . . . . . . . . . . . . . . . . . . . . . . . . . . . . . . . . . . . . 69,316 46,508 32,821
Adjustments related to non-controlling interest . . . . . . . . . . . . . . . . . . . . (276) — —
EBITDA . . . . . . . . . . . . . . . . . . . . . . . . . . . . . . . . . . . . . . . . . . . . . . . . . . . . $362,730 $166,448 $114,817
EBITDA increased $196.3 million for the year ended December 31, 2012 compared to 2011, primarily due to the Mergeras well as an organic increase in sales within the PBM segment from new customer contract implementations. This waspartially offset by Merger-related costs, including transaction and integration expenses, as well as increased costs incurred tosupport the Company’s business growth.
EBITDA increased $51.6 million for the year ended December 31, 2011, compared to 2010. The growth in EBITDA wasprimarily due to an increase in sales within the PBM segment, driven by the implementation of the HealthSpring contract onJanuary 1, 2011, recent acquisitions and other new contract starts during the year.
Adjusted EPS Reconciliation
Adjusted EPS adds back the impact of all amortization of intangible assets, net of tax. Amortization of intangible assetsarises from the acquisition of intangible assets in connection with the Company’s business acquisitions. The Companyexcludes amortization of intangible assets from non-GAAP Adjusted EPS because it believes (i) the amount of such expensesin any specific period may not directly correlate to the underlying performance of the Company’s business operations and(ii) such expenses can vary significantly between periods as a result of new acquisitions and full amortization of previouslyacquired intangible assets. Investors should note that the use of these intangible assets contributes to revenue in the periodpresented as well as future periods and should also note that such expenses will recur in future periods. Below is areconciliation of the Company’s reported net income to Non-GAAP net income and the related Adjusted EPS for the yearsended December 31, 2012 , 2011 and 2010.
Adjusted EPS Reconciliation
Years Ended December 31,
(in thousands, except per share data) 2012 2011 2010
OperationalResults
PerDilutedShare
OperationalResults
PerDilutedShare
OperationalResults
PerDilutedShare
Net income attributable to theCompany (GAAP) . . . . . . . . . . . . . . $116,658 $ 0.70 $ 91,786 $ 0.73 $64,735 $ 0.51
Amortization of intangible assets . . . . . . 130,116 0.77 16,385 0.13 7,856 0.06
Tax effect of reconciling item . . . . . . . . (47,362) (0.28) (5,505) (0.04) (2,640) (0.02)
Non-GAAP Net income attributableto the Company . . . . . . . . . . . . . . . . . $199,412 $ 1.19 $102,666 $ 0.82 $69,951 $ 0.55
49
Adjusted EPS for the year ended December 31, 2012 was $1.19 as compared to $0.82 in 2011. Increased gross profitearned from the expansion of the Company’s PBM business, as well as recent acquisitions helped improve the Company’sadjusted EPS during 2012. This was partially offset by increased costs incurred to support the Company’s business growthand recent acquisitions along with an increase in the number of diluted shares during 2012 as compared to 2011. Dilutedshares increased in 2012 primarily due to the Company’s issuance of 12.0 million common shares in a May 2012 publicoffering and the issuance of 66.8 million shares to complete the Merger with Catalyst.
Adjusted EPS for the year ended December 31, 2011 was $0.82 as compared to $0.55 in 2010. Increased gross profitfrom an increased customer base within the PBM segment was the main driver of the Adjusted EPS increase in 2011 over2010.
Liquidity and Capital Resources
The Company’s sources of liquidity have primarily consisted of cash provided by operating activities, proceeds from itspublic offerings, proceeds from credit facilities and stock option exercises. On July 2, 2012, the Company completed theMerger with Catalyst. To complete the Merger, the Company issued approximately 66.8 million shares of its common stock,and paid $1.4 billion in cash to Catalyst shareholders. To raise the capital required to complete the Merger, the Companyentered into the 2012 Credit Agreement in, as discussed previously, and in May 2012, issued 12.0 million of its commonshares in a public offering. The Company utilized $1.4 billion of the available $1.8 billion under the 2012 Credit Agreementin July 2012 to partially finance the aggregate cash consideration payable to Catalyst stockholders in the Merger, repay anddischarge existing indebtedness of the Company and Catalyst and pay related transaction fees and expenses. Concurrently, theCompany terminated its credit agreement it entered into in December 2011 with JPMorgan Chase Bank, N.A. (“JPMCB”) andthe other lenders named therein (the “2011 Credit Agreement”) after repaying its outstanding balance in July 2012. As a resultof the borrowings from the 2012 Credit Agreement in July 2012, the Company incurred a significant increase in its interestexpense during the year ended December 31, 2012 and expects this expense and the related payments to continue throughoutthe term of the 2012 Credit Agreement. In conjunction with the Merger, the Company assumed approximately $312 million indebt from Catalyst. The Company repaid this outstanding debt in July 2012. Additionally, during the year endedDecember 31, 2012, the Company repaid $200 million of its revolving debt. As of December 31, 2012, the Company hadapproximately $1.2 billion of outstanding debt under its 2012 Credit Agreement and $600 million of available borrowingcapacity thereunder. Refer to Note 9 — Long-Term Liabilities in the notes to the consolidated financial statements for moreinformation regarding the 2012 Credit Agreement and termination of the 2011 Credit Agreement.
The May 2012 public offering of 12 million common shares raised approximately $519.1 million in net proceeds. Referto Note 10 — Shareholders’ Equity in the notes to the unaudited consolidated financial statements for more informationregarding the May 2012 public offering.
At December 31, 2012 and 2011, the Company had cash and cash equivalents totaling $370.8 million and$341.4 million, respectively. As disclosed previously, the Company completed its acquisition of HealthTran in January 2012and disbursed approximately $246.4 million, net of cash acquired, from cash on hand and borrowings from a draw on theCompany’s 2011 Credit Agreement. In July 2012, the Company disbursed approximately $1.4 billion from cash on hand andproceeds from the Company’s 2012 Credit Agreement to complete the Merger, and additionally disbursed $617.0 millionfrom cash on hand and proceeds from the Company’s 2012 Credit Agreement to repay the outstanding balance on the 2011Credit Agreement and the outstanding Catalyst debt assumed by the Company in the Merger, as well as a portion of theoutstanding balance on the 2012 Credit Agreement. The Company believes that its cash on hand, together with cash generatedfrom operating activities, and the amount available under its 2012 Credit Agreement, will be sufficient to support plannedoperations for the foreseeable future.
At December 31, 2012, cash and cash equivalents consist of cash on hand, deposits in banks and bank term deposits withoriginal maturities of 90 days or less.
As of December 31, 2012, all of the Company’s cash and cash equivalents were exposed to market risks, primarilychanges in U.S. interest rates. Declines in interest rates over time would reduce interest income related to these balances.Additionally, although the Company’s primary operations are in the U.S., the Company is incorporated as a Canadiancompany. Cash that the Company holds in the U.S. would be subject to taxation if it is repatriated to Canada; however, theCompany has determined that its U.S. earnings are permanently reinvested in the U.S. and accordingly deferred income taxeshave not been recorded on the Company’s U.S. earnings. Due to the Merger, the Company was required to pay a tax on itsnon-repatriated U.S. earnings through the end of 2012. As a result, the Company does not have any non-repatriated earningsas of December 31, 2012.
50
Consolidated Balance Sheets
Selected balance sheet highlights at December 31, 2012 are as follows:
• Accounts receivable represent trade accounts receivable from our customers. Accounts receivable increased$485.4 million to $725.8 million at December 31, 2012 from $240.4 million at December 31, 2011, driven byincreases in revenue of $5.0 billion during the year ended December 31, 2012, largely attributable to the Merger withCatalyst, the integration of HealthTran customers on January 1, 2012, as well as the implementation of new customercontracts. The accounts receivable balance is impacted by changes in revenues, as well as the timing of collections,and is continually monitored by the Company to ensure timely collections and to assess the need for any changes tothe allowance for doubtful accounts.
• Rebates receivable of $302.5 million relate to billed and unbilled PBM receivables from pharmaceutical manufacturersand third party administrators in connection with the administration of the rebate program where the Company is theprincipal contracting party. The receivable and related payables are based on estimates, which are subject to finalsettlement. Rebates receivable increased $268.6 million to $302.5 million from $33.8 million at December 31, 2011.The increase in the rebate receivable balance was mostly attributable to the Merger with Catalyst, as well as the timingof receipts from pharmaceutical manufacturers and third party administrators. The Company does not process rebatesfor all PBM customers and accordingly the rebates receivable balance does not always fluctuate proportionately withchanges in revenues and prescription claim volumes.
• As of December 31, 2012, goodwill and other intangible assets were $4.5 billion and $1.2 billion, respectively,increasing $4.2 billion and $1.1 billion, respectively, from December 31, 2011 to December 31, 2012. Goodwill andother intangible assets increased primarily as a result of the Merger with Catalyst. Please refer to Note 7 — Goodwilland Other Intangibles Assets for future amortization expense as of December 31, 2012.
• Accounts payable predominantly relates to amounts owed to retail pharmacies for prescription drug costs anddispensing fees in connection with prescriptions dispensed by the retail pharmacies to the members of the Company’scustomers when the Company is the principal contracting party with the pharmacy. As of December 31, 2012, theaccounts payable balance has increased $425.4 million to $644.8 million from $219.4 million at December 31, 2011,due to increased prescription claim transactions driven by the Merger with Catalyst, the acquisition of HealthTran andnew customer contracts implemented in 2012.
• Pharmacy benefit management rebates payable represents amounts owed to PBM customers for rebates frompharmaceutical manufacturers and third party administrators where the Company administers the rebate program onthe customer’s behalf, and the Company is the principal contracting party. The payables are based on estimates, whichare subject to final settlement. Pharmacy benefit management rebates payable increased $242.8 million to$302.1 million at December 31, 2012, from $59.2 million at December 31, 2011, due to the increased rebate volume asa result of the addition of Catalyst and HealthTran customers. Similar to the change in rebates receivable, theCompany does not process rebates for all customers, and accordingly the rebates payable balance does not alwaysfluctuate proportionately with changes in revenues and prescription claim volumes.
• Accrued liabilities are mainly comprised of customer deposits, salaries and wages payables, contingent considerationand other accrued liabilities related to operating expenses of the Company. Accrued liabilities have increased to$254.8 million at December 31, 2012 from $66.7 million at December 31, 2011. The increase was driven primarily byliabilities assumed from the Merger with Catalyst, the HealthTran acquisition, contingent consideration that became acurrent liability in the first quarter of 2012, as well as increased operating expenses of the Company.
Cash flows from operating activities
For the year ended December 31, 2012, the Company generated $249.7 million of cash through its operations. Cashprovided by operating activities increased by $155.1 million compared to the same period in 2011. Cash from operatingactivities has increased during this period mainly due to the Company’s increased revenue base as a result of the Merger withCatalyst, the acquisition of HealthTran and organic growth as a result of new customer contract implementations in 2012.Although the increased revenue base increased net income by $29.2 million, the increase in net income was offset in part byan increase in amortization expense of $113.7 million, which is a non-cash expense. The Company’s operating cash flow wasalso impacted by changes in accounts receivable and payable, as well as rebates receivable and payable; however, theseimpacts mostly offset each other.
Changes in the Company’s cash from operations result primarily from increased gross profits and the timing of paymentson accounts receivable, rebates receivable, and the payment or processing of its various accounts payable and accruedliabilities. The Company continually monitors its balance of trade accounts receivable and devotes ample resources to
51

collection efforts on those balances. Rebates receivable and the related payable are primarily estimates based on claimssubmitted. Rebates are typically paid to customers on a quarterly basis upon receipt of the billed funds from the third-partyrebate administrators and pharmaceutical manufacturers. The timing of the rebate payments to customers and collections ofrebates from third-party rebate administrators and pharmaceutical manufacturers causes fluctuations on the balance sheet, aswell as in the Company’s cash from operating activities.
Changes in non-cash items such as depreciation and amortization are caused by the purchase and acquisition of capitaland intangible assets. In addition, as assets become fully depreciated or amortized, the related expenses will decrease.
Changes in operating assets and liabilities, as well as non-cash items related to income taxes, will fluctuate based onworking capital requirements and the tax provision, which is determined by examining taxes actually paid or owed, as well asamounts expected to be paid or owed in the future.
For the year ended December 31, 2011, the Company generated $94.7 million of cash through its operations. Cashprovided by operating activities decreased slightly by $1.6 million compared to the same period in 2010. Net incomeincreased $27.1 million from $64.7 million during 2010. This increase was mainly due to increased transaction volume fromnew customer starts. Cash from operations decreased due to an increase in accounts receivable of $110.5 million as a result ofthe increase in the pharmacy transactions in the PBM segment from new customer starts in 2011 and the timing of when theCompany received payments on its accounts receivable balances. This decrease in cash from operations was offset by anincrease in accounts payable of $94.8 million as a result of the increased volume of pharmacy transactions during 2011 andthe timing of when payments are made on these transactions.
Cash flows from investing activities
For the year ended December 31, 2012, the Company used $1.6 billion of cash for investing activities, which consistedprimarily of cash used to acquire HealthTran and Catalyst. Additionally, the Company used $40.2 million for purchases ofproperty and equipment to support increased transaction volume and invest in systems to effectively and efficiently integratethe operations of recent acquisitions.
As the Company grows, it continues to purchase capital assets to support increases in its information technology networkcapacity and personnel. The Company monitors and budgets these costs to ensure the expenditures aid in the strategic growthof the Company.
For the year ended December 31, 2011, the Company used $89.5 million of cash for investing activities, which consistedprimarily of cash used to acquire PTRX and Save DirectRx. Additionally, the Company used $9.7 million for purchases ofproperty and equipment to support increased transaction volume.
For the year ended December 31, 2010, the Company used $103.7 million of cash for investing activities, whichconsisted primarily of cash used to acquire MedfusionRx. Additionally, the Company used $9.1 million for purchases ofproperty and equipment to support increased transaction volume, and $2.2 million to purchase short-term investments.
Cash flows from financing activities
For the year ended December 31, 2012, the Company generated $1.4 billion of cash from financing activities, whichconsisted primarily of the Company’s $1.4 billion draw on the 2012 Credit Agreement to finance the Merger as well as theissuance of 12.0 million common shares in May 2012, which resulted in net proceeds of $519.1 million. Offsetting theseproceeds was $18.8 million in fees the Company paid to lenders related to the 2012 Credit Agreement executed in July 2012,the repayment of $617.0 million of debt related to the Company’s and Catalyst’s previous debt agreements in place prior tothe Merger, and a portion of the Company’s 2012 Credit Agreement.
Cash flows from financing activities generally fluctuate based on the timing of option exercises by the Company’semployees, which are affected by market prices, vesting dates and expiration dates. The associated tax benefit on the exerciseof stock options will also fluctuate based on the timing of option exercises, the market price of the Company’s shares at thetime of exercise, and the exercise price of the option. The Company will continue to incur significant cash outflows related toits amounts due under the 2012 Credit Agreement. Refer to Contractual Obligations later in this MD&A for further analysis offuture payments due under the Company’s 2012 Credit Agreement.
For the year ended December 31, 2011, the Company generated $14.9 million of cash from financing activities, whichmainly consisted of proceeds from the exercise of stock options of $5.7 million and a $10.8 million tax benefit on the exerciseof stock options.
For the year ended December 31, 2010, the Company generated $24.1 million of cash from financing activities, whichmainly consisted of proceeds from the exercise of stock options of $11.0 million and a $13.1 million tax benefit on theexercise of stock options.
52
Future Capital Requirements
The Company’s future capital requirements depend on many factors, including its integration of recent acquisitions andany future transactions. The Company expects to fund its operating and working capital needs, and business growthrequirements through cash flow from operations, its cash and cash equivalents on hand and its funds available under the 2012Credit Agreement. See Note 9 — Long-Term Liabilities in the notes to the consolidated financial statements for moreinformation on the Company’s 2012 Credit Agreement. The Company expects that purchases of property and equipment willincrease in 2013 due to the increase in the size of the business as a result of the Merger with Catalyst in 2012, and the move ofthe Company’s headquarters planned for 2013. The Company cannot provide assurance that its actual cash requirements willnot be greater than expected as of the date of this Annual Report. In order to meet business growth goals, the Company will,from time to time, consider the acquisition of, or investment in, complementary businesses, products, services andtechnologies, which might impact liquidity requirements or cause the issuance of additional equity or debt securities. Anyissuance of additional equity or debt securities may result in dilution to shareholders, and the Company cannot be certain thatadditional public or private financing will be available in amounts or on terms acceptable to the Company, or at all.
If sources of liquidity are not available or if it cannot generate sufficient cash flow from operations during the nexttwelve months, the Company might be required to obtain additional funds through operating improvements, capital marketstransactions, asset sales or financing from third parties or a combination thereof. The Company cannot provide assurance thatthese additional sources of funds will be available or, if available, will have reasonable terms.
If adequate funds are not available to finance the Company’s business growth goals, the Company may have tosubstantially reduce or eliminate expenditures for marketing, research and development, and testing of proposed products, orobtain funds through arrangements with partners that require the Company to relinquish rights to certain of its technologies orproducts. There can be no assurance that the Company will be able to raise additional capital if its capital resources areexhausted. A lack of liquidity and an inability to raise capital when needed may have a material adverse impact on theCompany’s ability to continue its operations or expand its business.
Contractual Obligations
The following table summarizes the Company’s significant contractual obligations as of December 31, 2012 and theeffect such obligations are expected to have on the Company’s liquidity and cash in future periods assuming all obligationsreach maturity (in millions):
TotalLess than1 year Years 1 - 3 Years 4 - 5
More than5 years
Long - term debt(1) . . . . . . . . . . . . . . . . . . . . . . . . . $1,200.0 $41.3 $199.4 $ 959.3 $ —Operating leases . . . . . . . . . . . . . . . . . . . . . . . . . . . 180.4 17.6 36.3 35.3 91.2Interest payments(2) . . . . . . . . . . . . . . . . . . . . . . . . 117.5 26.1 52.2 39.2 —Earn-out payments(3) . . . . . . . . . . . . . . . . . . . . . . . 49.2 9.9 39.3 — —
Total . . . . . . . . . . . . . . . . . . . . . . . . . . . . . . . . . . . . $1,547.1 $94.9 $327.1 $1,033.8 $91.2
(1) The 2012 Credit Agreement is due on the 2012 Credit Agreement’s maturity date, July 2, 2017. The amount notedincludes the amount borrowed by the Company under the Revolving Credit Facility as of December 31, 2012, which willfluctuate based on the principal outstanding under the Revolving Credit Facility.
(2) The interest payments are calculated based on the Company’s senior secured term loan borrowings that carry an annual interestrate of 2.52% on $500 million which has been fixed through the Company’s interest rate swap agreements and the Company’srate of 2.25% on the remaining $600 million of its senior secured term loan borrowings outstanding as of December 31, 2012.The interest rate applicable to the Company’s senior secured term loan borrowings may fluctuate in the future based on changesin the LIBOR rate. These amounts do not include interest payment obligations on the remaining $100 million borrowed underthe Revolving Credit Facility due to the uncertainty of when payments will be made. See Note 9 — Long-Term Liabilities inthe notes to the consolidated financial statements for further information on the terms of the Company’s long-term debtobligations. The current rate on the Company’s Revolving Credit Facility is 2.25%.
(3) The earn-out payments relate to our MedfusionRx, SaveDirectRx and Walgreens Health Initiatives (acquired by Catalystin 2011) acquisitions and are subject to the achievement of certain performance targets during the measurement periodsthat range from 2012 to 2014. In February 2013, the Company settled the Medfusion earn-out paying the former owners$5.5 million.
53
The above table excludes $18.8 million related to the Company’s accrued liability for uncertain tax positions; theCompany is unable to reliably estimate the period of cash settlement, if any, with the respective taxing authorities.
Off-Balance Sheet Arrangements
The Company has no off-balance sheet arrangements.
Outstanding Securities
As of January 31, 2013, the Company had 205,473,502 common shares outstanding, 1,384,820 options outstanding,1,571,504 restricted stock units (“RSUs”) outstanding and 485,160 warrants outstanding. The options and warrants areexercisable on a one-for-one basis into common shares. The outstanding RSUs are subject to time-based and performance-based vesting restrictions. The number of outstanding RSUs as of January 31, 2013 assumes the associated performancetargets will be met at the maximum level for the performance-based RSUs. Once vested, RSUs convert on a one-for-one basisinto common shares.
Summary of Quarterly Results
The following table provides summary quarterly results (unaudited) for the eight quarters prior to and including thequarter ended December 31, 2012 (in thousands except share and per share data):
2012(1)(2)(3)(4) 2011(5)
FourthQuarter
ThirdQuarter
SecondQuarter
FirstQuarter
FourthQuarter
ThirdQuarter
SecondQuarter
FirstQuarter
Revenue . . . . . . . . . $3,329,540 $3,190,780 $1,702,703 $1,717,097 $1,378,515 $1,287,290 $1,212,039 $1,097,652Gross profit % . . . . . 8.0% 7.4% 7.2% 6.4% 6.5% 6.4% 6.1% 5.8%Net income . . . . . . . $ 42,529 $ 20,477 $ 27,310 $ 26,342 $ 26,684 $ 25,266 $ 21,565 $ 18,271Basic EPS . . . . . . . $ 0.21 $ 0.10 $ 0.19 $ 0.21 $ 0.21 $ 0.20 $ 0.18 $ 0.15Diluted EPS . . . . . . $ 0.21 $ 0.10 $ 0.18 $ 0.21 $ 0.21 $ 0.20 $ 0.17 $ 0.15
1) On September 20, 2012, the Company executed a two-for-one stock split effected by a stock dividend on the issued andoutstanding common shares of the Company. All share and per share data presented in this Annual Report have beenadjusted to reflect this stock split.
2) On July 2, 2012, the Company completed the Merger with Catalyst, a full-service PBM. Each share of Catalyst commonstock outstanding immediately prior to the effective time of the Merger (other than shares owned by the Company orCatalyst or any of their respective wholly-owned subsidiaries or shares with respect to which appraisal rights have beenproperly exercised) was converted in the Merger into the right to receive 1.3212 of a Company common share (0.6606 of aCompany common share prior to the October 2012 two-for-one stock split) and $28.00 in cash. This resulted in theCompany issuing approximately 66.8 million shares of common stock, assuming 0.5 million Catalyst warrants, and paying$1.4 billion in cash to Catalyst shareholders to complete the Merger.
3) On May 16, 2012, the Company completed its public offering of 12.0 million of its common shares at a price to the publicof $45.30 per share. The net proceeds to the Company from the offering were approximately $519.1 million, afterdeducting the underwriting discounts and commissions and offering expenses. The Company used the net proceeds fromthe offering to pay a portion of the cash component of the Catalyst Merger consideration and to pay certain related feesand expenses and used the balance for general corporate purposes.
4) In January 2012, the Company completed the acquisition of all of the outstanding equity interests of HealthTran, a full-service PBM, in exchange for $250 million in cash, subject to certain customary post-closing adjustments.
5) The Company completed its acquisition of PTRX and SaveDirectRx on October 3, 2011. The aggregate purchase price forPTRX and SaveDirectRx was $77.2 million in cash, subject to customary working capital adjustments, with an additional$4.5 million potential earn-out payment, subject to the achievement of certain financial performance targets through 2012.
Critical Accounting Policies and Estimates
The preparation of financial statements requires management to make estimates and assumptions that affect the reportedamounts of assets and liabilities and disclosure of contingent assets and liabilities at the dates of the financial statements andthe reported amounts of revenue and expenses during the period. Significant items subject to such estimates and assumptionsinclude revenue recognition, purchase price allocation in connection with acquisitions, the carrying amount of property andequipment, the value of intangible assets acquired and related amortization periods, impairment of goodwill, rebates,contingencies, the valuation allowances for receivables and future income taxes and accruals for income tax uncertainties.
54
Actual results could differ from those estimates. Note 2 — Significant Accounting Policies to the Company’s 2012consolidated financial statements includes a Summary of Significant Accounting Policies. The understanding of theaccounting policies used to prepare the consolidated financial statements is important to understanding the Company’s resultsof operations and financial condition.
Revenue recognition
The Company’s revenue is derived from prescription drug sales along with transaction processing services, maintenance,professional services, and systems sales (including software license and hardware sales).
The Company recognizes revenue when all of the following conditions are satisfied: (i) there is persuasive evidence of anarrangement; (ii) the service or product has been provided to the customer and no uncertainties exist surrounding productacceptance; (iii) the amount of fees to be paid by the customer is fixed or determinable; and (iv) the collection of fees isreasonably assured. Areas of judgment and subjectivity in the Company’s revenue recognition include principal versus agentconsiderations for PBM contracts, arrangements with multiple elements, and professional service revenues under long-termcontracts for HCIT contracts.
Principal versus agent considerations: The Company evaluates customer contracts using the indicators of the principalversus agent revenue accounting guidance to determine whether the Company acts as a principal or as an agent in thefulfillment of prescriptions through the participating pharmacy network. Assessing each contract requires judgment, and theconclusions reached on each contract will greatly impact the amount of revenue recorded. While gross profit is not impactedby the conclusion reached, revenues and cost of revenues will vary significantly. The Company assesses each contract todetermine if the Company is acting as a principal or an agent. Key factors that the Company considers when determiningwhether it acts as a principal or an agent includes: (i) whether the Company has separate contractual relationships withcustomers and with pharmacies, (ii) is the Company responsible to validate and manage a claim through its claimsadjudication process, (iii) does the Company commit to set prescription prices for the pharmacy, including instructing thepharmacy as to how that price is to be settled (co-payment requirements), (iv) does the Company manage the overallprescription drug plan relationship with the patients, who are participants of customers’ plans, (v) who has credit risk for theamount due from the customer, and (vi) does the Company have direct obligations to the participating pharmacies to pay forthe prescription drug spend. The Company weighs the criteria that are present in order to conclude whether the contractshould be recorded gross as a principal, or net as an agent.
Arrangements with multiple elements: When the Company enters into arrangements with multiple deliverables it mustconsider: (i) whether the delivered item has value to the customer on a stand-alone basis, and (ii) if the contract includes ageneral right of return relative to the delivered item, whether delivery or performance of the undelivered item(s) is consideredprobable and substantially in the control of the Company. In most cases, the Company is able to conclude that the separatedeliverables have stand alone value since most of the deliverables are sold as stand alone products or services. A key area ofjudgment is for the Company to determine the relative selling prices of the undelivered items. The relative selling prices ofundelivered elements, such as professional services, or ASP services, are determined based on stated pricing within thecontract with each customer, or pricing for the same product sold to other customers. Professional services relative sellingprices are determined based on billing rates per hour based on the type of professional services provided, whereas ASPservices are generally based on transaction fee rates, or standard monthly access and processing fees. When the Company isunable to determine the relative selling prices based on contractual terms with the customer or from pricing of the sameproduct sold to other customers, the Company uses its best estimate of the selling price for that deliverable. Once the relativeselling prices are determined, revenue is allocated to each unit of accounting or element based on relative fair values.
Professional service revenues under long-term contracts: As part of the Company’s professional services offerings, theCompany enters into contracts to provide professional services over a specified time frame, or for a specific contractdeliverable. In cases where the contracts require professional services to be delivered for an extended time frame, theCompany records revenue based on a percentage of completion model. The percentage of completion model is impacted bymanagement’s estimate of hours required to complete a deliverable and the mix of staffing required for the project. Whenprojects have a fixed fee, the Company must estimate the total cost to complete the deliverable in order to assess a projectedmargin from the project. Revenues are then recorded based on the hours completed for the project and the calculated marginto be earned from the project. Revenues are impacted based on management’s estimate of margin to be earned on the project,and may fluctuate throughout the project as estimates are revised. Whenever management expects a loss on a project, theCompany records the expected loss immediately in its consolidated statement of operations.
Rebates
The Company administers rebate programs through which it receives rebates and administrative fees frompharmaceutical manufacturers and third party administrators that are shared with customers. The Company recognizes rebates
55
when the Company is entitled to them, and when the amounts of the rebates are determinable. The amount recorded forrebates earned by the Company from the pharmaceutical manufacturers, third party administrators, and from administrativefees are recorded as a reduction of cost of sales. Rebates owed to the Company’s customers are recorded as a reduction ofrevenue. The Company determines the amount of rebates to record based on the number and types of claims submitted, therebate program terms with its customers, the Company’s rebate contracts, and any additional information that becomesavailable. The amount of rebates ultimately earned by the Company, or paid to its customers, is contingent upon severalfactors, including validation of claims data submitted by the Company, and may require adjustments in future periods to theamounts originally estimated. Historically, adjustments to the Company’s original rebate estimates have not been significant.
Goodwill and intangible assets
Goodwill is the residual amount that results when the purchase price of an acquired business exceeds the sum of the amountsallocated to the identifiable assets acquired, less liability assumed, based on their fair values. Goodwill is allocated to theCompany’s reporting units that are expected to benefit from the business combination as of the date of the business combination.Intangible assets acquired individually or as part of a group of other assets are initially recognized and measured at cost. The cost ofa group of intangible assets acquired in a transaction, including those acquired in a business combination that meet the specifiedcriteria for recognition apart from goodwill, is allocated to the individual assets acquired based on their fair values.
Goodwill and intangible assets are impacted by the Company’s fair value measurements at initial recording. Beginning in2009, the Company applied the revised business combination guidance as issued by the Financial Accounting Standards Board(“FASB”). Measurements of goodwill and purchased intangible assets are based on models derived from a market participant pointof view. Along with the methodology used to measure assets and liabilities acquired, the new guidance also impacts the types ofassets and liabilities required to be measured and recognized. Management’s conclusions about the composition of relevant marketparticipants, the types of assets and liabilities required to be measured, and the methodology used to measure the assets andliabilities will all have a significant impact on the purchase price allocation for business combinations.
Asset impairments
The Company’s goodwill and long-lived assets (including property and equipment, and purchased intangibles subject toamortization) are subject to periodic impairment testing. Pursuant to the new accounting standards update related to the testingof goodwill impairment in 2011, the Company performed a qualitative assessment to determine if indicators of impairmentwere present. See Note 2 — Significant Accounting Policies in the notes to the consolidated financial statements for additionalinformation on the Company’s 2012 goodwill impairment test. Long-lived assets are only required to be tested for impairmentwhen events or circumstances indicate that the net carrying amount of the asset may not be recoverable. Both assetimpairment tests and considerations are impacted by various estimates and judgments made by management. Events that maycause a potential impairment in the Company’s goodwill or long-lived assets would be the loss of a significant customer orgroup of customers, a fundamental change in the structure of the healthcare industry, including the method and manner inwhich pharmacy benefit managers are compensated or a significant decline in future expected profitability.
The annual qualitative assessment for goodwill is impacted by management’s assessment of reporting units, allocation ofthe consolidated Company’s assets and liabilities to each reporting unit, management’s estimate of future operating results,and a selection of peers to establish a comparable market group. The annual impairment test completed for 2012 did notindicate any impairment of the Company’s two reporting units, and did not reveal that an impairment would be reasonablylikely in the near future.
As noted above, long-lived assets are only required to be tested for impairment when events or circumstances indicatethat the net carrying amount of the asset may not be recoverable. Assessing whether an impairment test is necessary requiresmanagement to monitor results of the business that utilize the long-lived assets, as well as outside market forces that mayimpact the future recoverability of the long-lived assets. No events or other circumstances occurred in 2012 that causedmanagement to conclude any of its long-lived tangible assets may not be recoverable. In October 2012, the Companylaunched its new specialty brand BriovaRx, formerly known as Medfusion and Ascend, delivering personalized, holistic careto patients with complex chronic and conditions to improve health outcomes. As a result of the re-branding of the specialtybusiness, the Company concluded that the useful life of the intangible asset that the Company recorded for the MedfusionRxtrade name should be reduced since the name would no longer be used by the Company, which was the asset’s highest andbest use. Before adjusting the useful life of the asset, the Company considered whether the asset had any value as a defensibleasset which would extend its useful life. The Company determined that the MedfusionRx trade name had an insignificantvalue as a defensible asset, and the asset’s useful life should be shortened due to the name change of the business. As a result,the Company recorded an additional $8.0 million in amortization expense during 2012.
The Company considered the recent turmoil in the credit markets in assessing whether these events may indicate that theCompany’s long-lived assets were impaired. The assets assessed are mostly computer equipment, acquired customer lists and
56

goodwill. The Company’s assessment of the turmoil in the credit markets did not indicate that the values of these assets weresignificantly impacted.
Valuation of allowance for doubtful accounts
In assessing the valuation of the allowance for doubtful accounts, management reviews the collectability of accountsreceivable in aggregate and on an individual account-basis. Delinquency is assessed based primarily on contractual terms, andmanagement’s judgment is used as the basis for allowances required. Management reviews the accounts receivable on anindividual customer-basis to determine if events such as subsequent collections, discussions with management of the debtorcompanies, or other activities lead to the conclusion to either increase or decrease the calculated allowance. Factors consideredwhen reviewing accounts receivable in the aggregate include the overall age of receivables, macro-economic issues impactingclasses of customers and recent collection trends. The conclusions and estimates made are further impacted by changes ineconomic and market conditions as well as changes to the customers’ financial condition. Changes in estimates for theallowance of doubtful accounts have not had a significant impact on the results of the Company during 2012, 2011, or 2010.
Contingencies
From time to time in connection with its operations, the Company is named as a defendant in actions for damages andcosts allegedly sustained by the plaintiffs. Management also considers other areas of the Company’s business that may besubject to litigation and liability for damages arising from errors in processing the pricing of prescription drug claims, failureto meet performance measures within certain contracts relating to its services performed or its ability to obtain certain levelsof discounts or rebates on prescription purchases from participating pharmacies, drug manufacturers and third partyadministrators or other actions or omissions. Reserves for contingencies are based upon the Company’s consideration of theseproceedings and disputes. Management assesses the probability that these contingencies will be realized, and whether theoutcome is reasonably estimable. The Company’s estimates for reserves recorded may be impacted by the history of similarclaims, the limitations of any insurance coverage, advice from outside counsel, and management’s strategy with regard to thesettlement or defense against such claims and obligations.
Income taxes
The Company uses the asset and liability method of accounting for income taxes. Deferred tax assets and liabilities arerecognized for the deferred tax consequences attributable to differences between the financial statement carrying amounts ofexisting assets and liabilities and their respective tax bases and operating loss and tax credit carryforwards. Benefits from taxpositions are recognized in the consolidated financial statements only when it is more likely than not that the tax position willbe sustained upon examination by the appropriate taxing authority having full knowledge of all relevant information.Management’s estimates of future operating results and tax planning strategies, assessment of the probability of future taxbenefits realization, and the determination of the likelihood of tax positions being sustained upon exam, are key judgmentswhich management makes which impact the accounting for income taxes and necessary valuation allowances.
Recent Accounting Standards
See Note 2 — Significant Accounting Policies in the notes to the consolidated financial statements for information onrecent accounting pronouncements that the Company adopted. The Company is currently assessing the impact on its financialcondition and future operating results for recently issued accounting guidance, and does not expect the recently issuedguidance to have a significant impact on the Company’s financial condition or future results of operations.
ITEM 7A. QUANTITATIVE AND QUALITATIVE DISCLOSURES ABOUT MARKET RISK
INTEREST RATE PRICE SENSITIVITY
As of December 31, 2012, the Company had cash and cash equivalents totaling $370.8 million, most of which is held incash on deposit accounts. In July 2012, the Company borrowed $1.4 billion under the 2012 Credit Agreement consisting of$1.1 billion under the Term A Facility and $300 million under the Revolving Facility to fund in part the aggregate cashconsideration payable to Catalyst stockholders in the Merger, repay and discharge existing indebtedness of the Company andCatalyst and pay related transaction fees and expenses.
The Company is exposed to market risk in the normal course of its business operations, primarily the risk of loss arisingfrom adverse changes in interest rates. In addition, the Company is subject to interest rate risk related to $700 million of the$1.2 billion drawn under its 2012 Credit Agreement as of December 31, 2012, as $500 million is not impacted due to theinterest rate swaps the Company maintains. As of December 31, 2012, assuming a hypothetical 1% fluctuation in the interestrate of the loan, the Company’s pre-tax income would vary by $7 million on an annual basis. Actual increases or decreases in
57
earnings in the future could differ materially from this assumption based on the timing and amount of both interest ratechanges and the levels of cash held by the Company. The interest rates applicable to borrowings under the 2012 CreditAgreement are based on a fluctuating rate and are described in more detail in Note 9 — Long-Term Liabilities to theCompany’s consolidated financial statements. There have been no other material changes in the Company’s exposure tomarket risk during the year ended December 31, 2012.
FOREIGN EXCHANGE RISK
The Company is subject to foreign exchange risk related to its operations in Canada. The Company does not enter intoderivative instruments to mitigate this risk. Exposure to fluctuations in Canadian-dollar denominated transactions is partiallyoffset by Canadian-dollar denominated assets and liabilities. The realized foreign exchange gains and losses for each of theperiods presented were insignificant to the Company’s consolidated operations. The Company performed a sensitivityanalysis as of December 31, 2012, assuming a hypothetical 10% fluctuation in the U.S. dollar to Canadian dollar exchangerate. Holding other variables constant, a 10% fluctuation in either direction in the exchange rate would affect the Company’spre-tax income by less than $0.4 million.
There are inherent limitations in the sensitivity analysis presented, primarily due to the assumption that foreign exchangerate movements are linear and instantaneous. As a result, the analysis is unable to reflect the potential effects of more complexmarket changes that could arise, which may positively or negatively affect income.
58
ITEM 8. FINANCIAL STATEMENTS AND SUPPLEMENTARY DATA
REPORT OF INDEPENDENT REGISTERED PUBLIC ACCOUNTING FIRM
The Board of Directors and ShareholdersCatamaran Corporation:
We have audited the accompanying consolidated balance sheets of Catamaran Corporation and subsidiaries (theCompany) as of December 31, 2012 and 2011, and the related consolidated statements of operations, comprehensive income,cash flows and shareholders’ equity for each of the years in the three-year period ended December 31, 2012. Theseconsolidated financial statements are the responsibility of the Company’s management. Our responsibility is to express anopinion on these consolidated financial statements based on our audits.
We conducted our audits in accordance with the standards of the Public Company Accounting Oversight Board (UnitedStates). Those standards require that we plan and perform the audit to obtain reasonable assurance about whether the financialstatements are free of material misstatement. An audit includes examining, on a test basis, evidence supporting the amountsand disclosures in the financial statements. An audit also includes assessing the accounting principles used and significantestimates made by management, as well as evaluating the overall financial statement presentation. We believe that our auditsprovide a reasonable basis for our opinion.
In our opinion, the consolidated financial statements referred to above present fairly, in all material respects, the financialposition of Catamaran Corporation and subsidiaries as of December 31, 2012 and 2011, and the results of their operations andtheir cash flows for each of the years in the three-year period ended December 31, 2012, in conformity with U.S. generallyaccepted accounting principles.
We also have audited, in accordance with the standards of the Public Company Accounting Oversight Board (UnitedStates), the Company’s internal control over financial reporting as of December 31, 2012, based on criteria established inInternal Control — Integrated Framework issued by the Committee of Sponsoring Organizations of the TreadwayCommission (COSO), and our report dated March 1, 2013 expressed an unqualified opinion on the effectiveness of theCompany’s internal control over financial reporting.
/s/ KPMG LLP
Chicago, IllinoisMarch 1, 2013
59

REPORT OF INDEPENDENT REGISTERED PUBLIC ACCOUNTING FIRM
The Board of Directors and ShareholdersCatamaran Corporation:
We have audited Catamaran Corporation’s (the Company) internal control over financial reporting as of December 31,2012, based on criteria established in Internal Control — Integrated Framework issued by the Committee of SponsoringOrganizations of the Treadway Commission (COSO). The Company’s management is responsible for maintaining effectiveinternal control over financial reporting and for its assessment of the effectiveness of internal control over financial reporting,included in the accompanying Management’s Report on Internal Control Over Financial Reporting. Our responsibility is toexpress an opinion on the Company’s internal control over financial reporting based on our audit.
We conducted our audit in accordance with the standards of the Public Company Accounting Oversight Board (UnitedStates). Those standards require that we plan and perform the audit to obtain reasonable assurance about whether effectiveinternal control over financial reporting was maintained in all material respects. Our audit included obtaining anunderstanding of internal control over financial reporting, assessing the risk that a material weakness exists, and testing andevaluating the design and operating effectiveness of internal control based on the assessed risk. Our audit also includedperforming such other procedures as we considered necessary in the circumstances. We believe that our audit provides areasonable basis for our opinion.
A company’s internal control over financial reporting is a process designed to provide reasonable assurance regarding thereliability of financial reporting and the preparation of financial statements for external purposes in accordance with generallyaccepted accounting principles. A company’s internal control over financial reporting includes those policies and proceduresthat (1) pertain to the maintenance of records that, in reasonable detail, accurately and fairly reflect the transactions anddispositions of the assets of the company; (2) provide reasonable assurance that transactions are recorded as necessary topermit preparation of financial statements in accordance with generally accepted accounting principles, and that receipts andexpenditures of the company are being made only in accordance with authorizations of management and directors of thecompany; and (3) provide reasonable assurance regarding prevention or timely detection of unauthorized acquisition, use, ordisposition of the company’s assets that could have a material effect on the financial statements.
Because of its inherent limitations, internal control over financial reporting may not prevent or detect misstatements.Also, projections of any evaluation of effectiveness to future periods are subject to the risk that controls may becomeinadequate because of changes in conditions, or that the degree of compliance with the policies or procedures may deteriorate.
In our opinion, Catamaran Corporation maintained, in all material respects, effective internal control over financialreporting as of December 31, 2012, based on criteria established in Internal Control — Integrated Framework issued by theCommittee of Sponsoring Organizations of the Treadway Commission.
We also have audited, in accordance with the standards of the Public Company Accounting Oversight Board (UnitedStates), the consolidated balance sheets of the Company as of December 31, 2012 and 2011, and the related consolidatedstatements of operations, comprehensive income, cash flows and shareholders’ equity for each of the years in the three-yearperiod ended December 31, 2012, and our report dated March 1, 2013 expressed an unqualified opinion on those consolidatedfinancial statements.
/s/ KPMG LLP
Chicago, IllinoisMarch 1, 2013
60
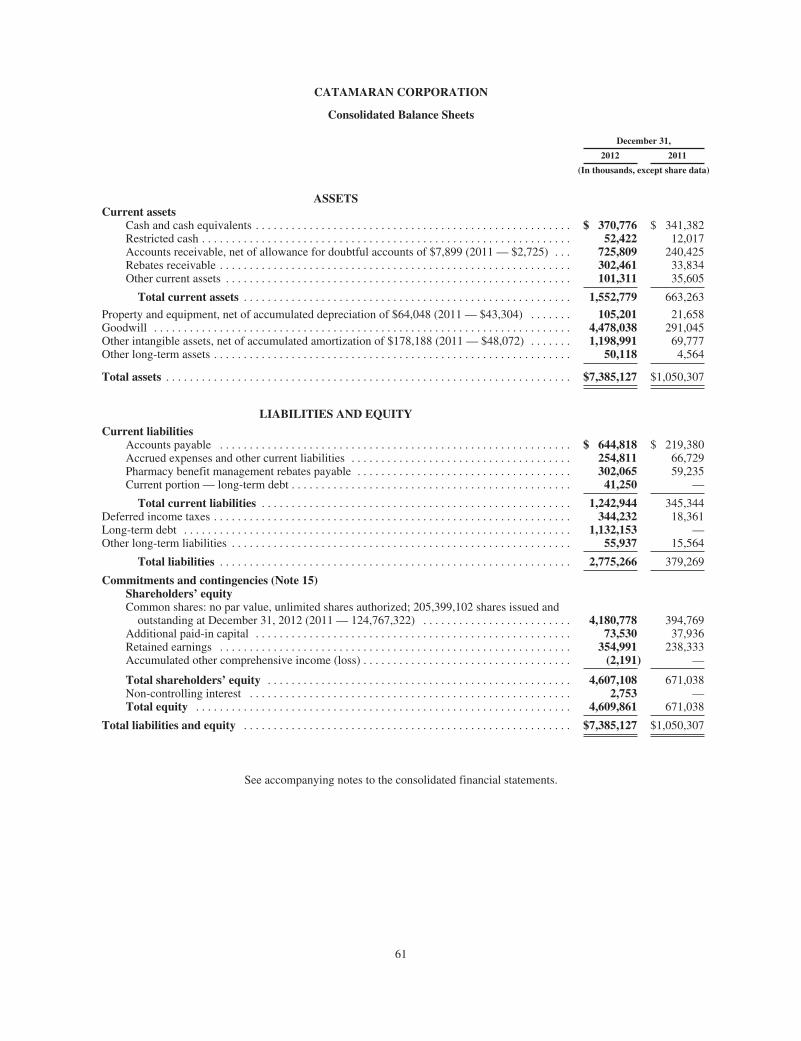
CATAMARAN CORPORATION
Consolidated Balance Sheets
December 31,
2012 2011
(In thousands, except share data)
ASSETSCurrent assets
Cash and cash equivalents . . . . . . . . . . . . . . . . . . . . . . . . . . . . . . . . . . . . . . . . . . . . . . . . . . . . . $ 370,776 $ 341,382Restricted cash . . . . . . . . . . . . . . . . . . . . . . . . . . . . . . . . . . . . . . . . . . . . . . . . . . . . . . . . . . . . . . 52,422 12,017Accounts receivable, net of allowance for doubtful accounts of $7,899 (2011 — $2,725) . . . 725,809 240,425Rebates receivable . . . . . . . . . . . . . . . . . . . . . . . . . . . . . . . . . . . . . . . . . . . . . . . . . . . . . . . . . . . 302,461 33,834Other current assets . . . . . . . . . . . . . . . . . . . . . . . . . . . . . . . . . . . . . . . . . . . . . . . . . . . . . . . . . . 101,311 35,605
Total current assets . . . . . . . . . . . . . . . . . . . . . . . . . . . . . . . . . . . . . . . . . . . . . . . . . . . . . . . 1,552,779 663,263
Property and equipment, net of accumulated depreciation of $64,048 (2011 — $43,304) . . . . . . . 105,201 21,658Goodwill . . . . . . . . . . . . . . . . . . . . . . . . . . . . . . . . . . . . . . . . . . . . . . . . . . . . . . . . . . . . . . . . . . . . . . 4,478,038 291,045Other intangible assets, net of accumulated amortization of $178,188 (2011 — $48,072) . . . . . . . 1,198,991 69,777Other long-term assets . . . . . . . . . . . . . . . . . . . . . . . . . . . . . . . . . . . . . . . . . . . . . . . . . . . . . . . . . . . . 50,118 4,564
Total assets . . . . . . . . . . . . . . . . . . . . . . . . . . . . . . . . . . . . . . . . . . . . . . . . . . . . . . . . . . . . . . . . . . . . $7,385,127 $1,050,307
LIABILITIES AND EQUITY
Current liabilitiesAccounts payable . . . . . . . . . . . . . . . . . . . . . . . . . . . . . . . . . . . . . . . . . . . . . . . . . . . . . . . . . . . $ 644,818 $ 219,380Accrued expenses and other current liabilities . . . . . . . . . . . . . . . . . . . . . . . . . . . . . . . . . . . . . 254,811 66,729Pharmacy benefit management rebates payable . . . . . . . . . . . . . . . . . . . . . . . . . . . . . . . . . . . . 302,065 59,235Current portion — long-term debt . . . . . . . . . . . . . . . . . . . . . . . . . . . . . . . . . . . . . . . . . . . . . . . 41,250 —
Total current liabilities . . . . . . . . . . . . . . . . . . . . . . . . . . . . . . . . . . . . . . . . . . . . . . . . . . . . 1,242,944 345,344Deferred income taxes . . . . . . . . . . . . . . . . . . . . . . . . . . . . . . . . . . . . . . . . . . . . . . . . . . . . . . . . . . . . 344,232 18,361Long-term debt . . . . . . . . . . . . . . . . . . . . . . . . . . . . . . . . . . . . . . . . . . . . . . . . . . . . . . . . . . . . . . . . . 1,132,153 —Other long-term liabilities . . . . . . . . . . . . . . . . . . . . . . . . . . . . . . . . . . . . . . . . . . . . . . . . . . . . . . . . . 55,937 15,564
Total liabilities . . . . . . . . . . . . . . . . . . . . . . . . . . . . . . . . . . . . . . . . . . . . . . . . . . . . . . . . . . . 2,775,266 379,269
Commitments and contingencies (Note 15)Shareholders’ equityCommon shares: no par value, unlimited shares authorized; 205,399,102 shares issued andoutstanding at December 31, 2012 (2011 — 124,767,322) . . . . . . . . . . . . . . . . . . . . . . . . . 4,180,778 394,769
Additional paid-in capital . . . . . . . . . . . . . . . . . . . . . . . . . . . . . . . . . . . . . . . . . . . . . . . . . . . . . 73,530 37,936Retained earnings . . . . . . . . . . . . . . . . . . . . . . . . . . . . . . . . . . . . . . . . . . . . . . . . . . . . . . . . . . . 354,991 238,333Accumulated other comprehensive income (loss) . . . . . . . . . . . . . . . . . . . . . . . . . . . . . . . . . . . (2,191) —
Total shareholders’ equity . . . . . . . . . . . . . . . . . . . . . . . . . . . . . . . . . . . . . . . . . . . . . . . . . . . 4,607,108 671,038Non-controlling interest . . . . . . . . . . . . . . . . . . . . . . . . . . . . . . . . . . . . . . . . . . . . . . . . . . . . . . 2,753 —Total equity . . . . . . . . . . . . . . . . . . . . . . . . . . . . . . . . . . . . . . . . . . . . . . . . . . . . . . . . . . . . . . . 4,609,861 671,038
Total liabilities and equity . . . . . . . . . . . . . . . . . . . . . . . . . . . . . . . . . . . . . . . . . . . . . . . . . . . . . . . $7,385,127 $1,050,307
See accompanying notes to the consolidated financial statements.
61

CATAMARAN CORPORATION
Consolidated Statements of Operations
Years Ended December 31,
2012 2011 2010
(In thousands, except per share data)
Revenue . . . . . . . . . . . . . . . . . . . . . . . . . . . . . . . . . . . . . . . . . . . . . . . . . . . . . . . . . . . . . . $9,940,120 $4,975,496 $1,948,389
Cost of revenue . . . . . . . . . . . . . . . . . . . . . . . . . . . . . . . . . . . . . . . . . . . . . . . . . . . . . . . . 9,206,744 4,666,008 1,734,334
Gross profit . . . . . . . . . . . . . . . . . . . . . . . . . . . . . . . . . . . . . . . . . . . . . . . . . . . . . . . . . . . 733,376 309,488 214,055
Expenses:
Selling, general and administrative . . . . . . . . . . . . . . . . . . . . . . . . . . . . . . . . . . . . . . . 369,492 145,788 101,682
Depreciation of property and equipment . . . . . . . . . . . . . . . . . . . . . . . . . . . . . . . . . . . 16,749 6,744 5,995
Amortization of intangible assets . . . . . . . . . . . . . . . . . . . . . . . . . . . . . . . . . . . . . . . . 130,116 16,385 7,856
516,357 168,917 115,533
Operating income . . . . . . . . . . . . . . . . . . . . . . . . . . . . . . . . . . . . . . . . . . . . . . . . . . . . . . 217,019 140,571 98,522
Interest and other expense, net . . . . . . . . . . . . . . . . . . . . . . . . . . . . . . . . . . . . . . . . . . . . . 26,682 2,277 966
Income before income taxes . . . . . . . . . . . . . . . . . . . . . . . . . . . . . . . . . . . . . . . . . . . . . 190,337 138,294 97,556
Income tax expense (benefit):
Current . . . . . . . . . . . . . . . . . . . . . . . . . . . . . . . . . . . . . . . . . . . . . . . . . . . . . . . . . . . . . 107,241 52,402 29,531
Deferred . . . . . . . . . . . . . . . . . . . . . . . . . . . . . . . . . . . . . . . . . . . . . . . . . . . . . . . . . . . . (37,925) (5,894) 3,290
69,316 46,508 32,821
Net income . . . . . . . . . . . . . . . . . . . . . . . . . . . . . . . . . . . . . . . . . . . . . . . . . . . . . . . . . . . 121,021 91,786 64,735
Less net income attributable to non-controlling interest . . . . . . . . . . . . . . . . . . . . . . . . . 4,363 — —
Net income attributable to the Company . . . . . . . . . . . . . . . . . . . . . . . . . . . . . . . . . . $ 116,658 $ 91,786 $ 64,735
Earnings per share:
Basic . . . . . . . . . . . . . . . . . . . . . . . . . . . . . . . . . . . . . . . . . . . . . . . . . . . . . . . . . . . . . . . $ 0.70 $ 0.74 $ 0.53
Diluted . . . . . . . . . . . . . . . . . . . . . . . . . . . . . . . . . . . . . . . . . . . . . . . . . . . . . . . . . . . . . $ 0.70 $ 0.73 $ 0.51
See accompanying notes to the consolidated financial statements.
62

CATAMARAN CORPORATION
Consolidated Statements of Comprehensive Income
Years Ended December 31,
2012 2011 2010
(In thousands)
Net income . . . . . . . . . . . . . . . . . . . . . . . . . . . . . . . . . . . . . . . . . . . . . . . . . . . . . . . . . . . . . . . . $121,021 $91,786 $64,735
Other comprehensive income, net of tax
Unrealized income (loss) on cash flow hedges and other (net of income tax expense of $1in 2010) . . . . . . . . . . . . . . . . . . . . . . . . . . . . . . . . . . . . . . . . . . . . . . . . . . . . . . . . . . . . . . . . (2,191) — 1
Comprehensive income 118,830 91,786 64,736
Less comprehensive income attributable to non-controlling interest . . . . . . . . . . . . . . . . . . . 4,363 — —
Comprehensive income attributable to the Company . . . . . . . . . . . . . . . . . . . . . . . . . . . . . . . $114,467 $91,786 $64,736
See accompanying notes to the consolidated financial statements.
63

CATAMARAN CORPORATION
Consolidated Statements of Cash Flows
Years Ended December 31,
2012 2011 2010
(In thousands)
Cash flows from operating activities:Net income . . . . . . . . . . . . . . . . . . . . . . . . . . . . . . . . . . . . . . . . . . . . . . . . . . . . . . . . $ 121,021 $ 91,786 $ 64,735Items not involving cash:Stock-based compensation . . . . . . . . . . . . . . . . . . . . . . . . . . . . . . . . . . . . . . . . . . 17,667 9,445 5,895Depreciation of property and equipment . . . . . . . . . . . . . . . . . . . . . . . . . . . . . . . 20,234 9,492 8,439Amortization of intangible assets . . . . . . . . . . . . . . . . . . . . . . . . . . . . . . . . . . . . . 130,116 16,385 7,856Deferred lease inducements and rent . . . . . . . . . . . . . . . . . . . . . . . . . . . . . . . . . . 3,136 759 (462)Deferred income taxes . . . . . . . . . . . . . . . . . . . . . . . . . . . . . . . . . . . . . . . . . . . . . (37,925) (5,894) 3,290Tax benefit on option exercises . . . . . . . . . . . . . . . . . . . . . . . . . . . . . . . . . . . . . . (19,397) (10,804) (13,107)Deferred financing cost amortization . . . . . . . . . . . . . . . . . . . . . . . . . . . . . . . . . . 4,985 — —
Changes in operating assets and liabilities, net of effects from acquisitions:Accounts receivable . . . . . . . . . . . . . . . . . . . . . . . . . . . . . . . . . . . . . . . . . . . . . . . (134,282) (110,528) (9,456)Rebates receivable . . . . . . . . . . . . . . . . . . . . . . . . . . . . . . . . . . . . . . . . . . . . . . . . (40,988) 5,267 (16,619)Restricted cash . . . . . . . . . . . . . . . . . . . . . . . . . . . . . . . . . . . . . . . . . . . . . . . . . . . 9,305 1,773 379Other current assets . . . . . . . . . . . . . . . . . . . . . . . . . . . . . . . . . . . . . . . . . . . . . . . 73,492 10,213 10,200Accounts payable . . . . . . . . . . . . . . . . . . . . . . . . . . . . . . . . . . . . . . . . . . . . . . . . . 70,620 94,799 25,099Accrued expenses and other current liabilities . . . . . . . . . . . . . . . . . . . . . . . . . . (36,005) (10,806) (5,708)Pharmacy benefit management rebates payable . . . . . . . . . . . . . . . . . . . . . . . . . 60,929 (6,019) 14,758Other . . . . . . . . . . . . . . . . . . . . . . . . . . . . . . . . . . . . . . . . . . . . . . . . . . . . . . . . . . 6,825 (1,200) 965
Net cash provided by operating activities . . . . . . . . . . . . . . . . . . . . . . . . . . . . 249,733 94,668 96,264Cash flows from investing activities:
Acquisitions, net of cash acquired . . . . . . . . . . . . . . . . . . . . . . . . . . . . . . . . . . . . (1,565,705) (79,825) (99,200)Purchases of property and equipment . . . . . . . . . . . . . . . . . . . . . . . . . . . . . . . . . (40,236) (9,690) (9,070)Proceeds from sale of short term investments . . . . . . . . . . . . . . . . . . . . . . . . . . . — — 6,828Purchases of short term investments . . . . . . . . . . . . . . . . . . . . . . . . . . . . . . . . . . — — (2,208)
Net cash used in investing activities . . . . . . . . . . . . . . . . . . . . . . . . . . . . . . . . (1,605,941) (89,515) (103,650)Cash flows from financing activities:
Proceeds from issuance of debt . . . . . . . . . . . . . . . . . . . . . . . . . . . . . . . . . . . . . . 1,475,448 — —Proceeds from public offering, net of issuance costs . . . . . . . . . . . . . . . . . . . . . . 519,075 — —Repayment of long-term debt . . . . . . . . . . . . . . . . . . . . . . . . . . . . . . . . . . . . . . . (616,993) — —Proceeds from exercise of options . . . . . . . . . . . . . . . . . . . . . . . . . . . . . . . . . . . . 7,763 5,735 11,024Tax benefit on option exercises . . . . . . . . . . . . . . . . . . . . . . . . . . . . . . . . . . . . . . 19,397 10,804 13,107Payment of financing costs . . . . . . . . . . . . . . . . . . . . . . . . . . . . . . . . . . . . . . . . . (18,806) (1,595) —Other . . . . . . . . . . . . . . . . . . . . . . . . . . . . . . . . . . . . . . . . . . . . . . . . . . . . . . . . . . (268) — —
Net cash provided by financing activities . . . . . . . . . . . . . . . . . . . . . . . . . . . . 1,385,616 14,944 24,131
Effect of foreign exchange on cash balances . . . . . . . . . . . . . . . . . . . . . . . . . . . . . . . . (14) 1 169
Increase in cash and cash equivalents . . . . . . . . . . . . . . . . . . . . . . . . . . . . . . . . . . . 29,394 20,098 16,914
Cash and cash equivalents, beginning of period . . . . . . . . . . . . . . . . . . . . . . . . . . . . . 341,382 321,284 304,370
Cash and cash equivalents, end of period . . . . . . . . . . . . . . . . . . . . . . . . . . . . . . . . $ 370,776 $ 341,382 $ 321,284
See accompanying notes to the consolidated financial statements.
64
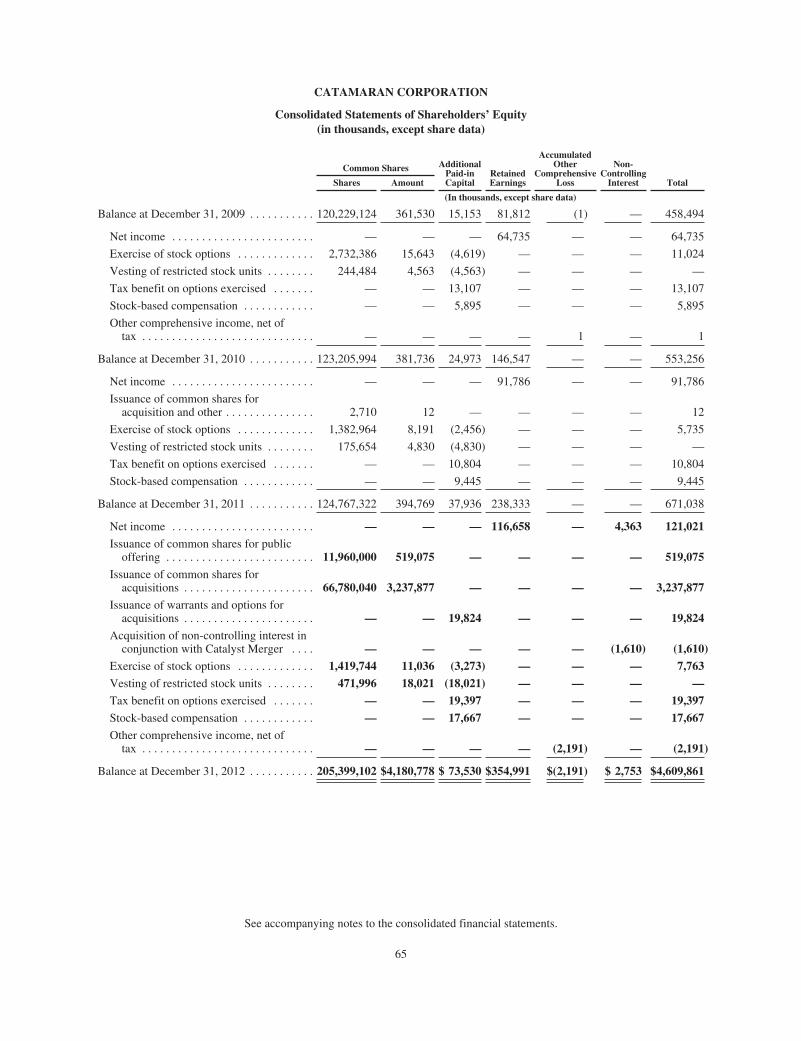
CATAMARAN CORPORATION
Consolidated Statements of Shareholders’ Equity(in thousands, except share data)
Common Shares AdditionalPaid-inCapital
RetainedEarnings
AccumulatedOther
ComprehensiveLoss
Non-ControllingInterest TotalShares Amount
(In thousands, except share data)
Balance at December 31, 2009 . . . . . . . . . . . 120,229,124 361,530 15,153 81,812 (1) — 458,494
Net income . . . . . . . . . . . . . . . . . . . . . . . . — — — 64,735 — — 64,735
Exercise of stock options . . . . . . . . . . . . . 2,732,386 15,643 (4,619) — — — 11,024
Vesting of restricted stock units . . . . . . . . 244,484 4,563 (4,563) — — — —
Tax benefit on options exercised . . . . . . . — — 13,107 — — — 13,107
Stock-based compensation . . . . . . . . . . . . — — 5,895 — — — 5,895
Other comprehensive income, net oftax . . . . . . . . . . . . . . . . . . . . . . . . . . . . . — — — — 1 — 1
Balance at December 31, 2010 . . . . . . . . . . . 123,205,994 381,736 24,973 146,547 — — 553,256
Net income . . . . . . . . . . . . . . . . . . . . . . . . — — — 91,786 — — 91,786
Issuance of common shares foracquisition and other . . . . . . . . . . . . . . . 2,710 12 — — — — 12
Exercise of stock options . . . . . . . . . . . . . 1,382,964 8,191 (2,456) — — — 5,735
Vesting of restricted stock units . . . . . . . . 175,654 4,830 (4,830) — — — —
Tax benefit on options exercised . . . . . . . — — 10,804 — — — 10,804
Stock-based compensation . . . . . . . . . . . . — — 9,445 — — — 9,445
Balance at December 31, 2011 . . . . . . . . . . . 124,767,322 394,769 37,936 238,333 — — 671,038
Net income . . . . . . . . . . . . . . . . . . . . . . . . — — — 116,658 — 4,363 121,021
Issuance of common shares for publicoffering . . . . . . . . . . . . . . . . . . . . . . . . . 11,960,000 519,075 — — — — 519,075
Issuance of common shares foracquisitions . . . . . . . . . . . . . . . . . . . . . . 66,780,040 3,237,877 — — — — 3,237,877
Issuance of warrants and options foracquisitions . . . . . . . . . . . . . . . . . . . . . . — — 19,824 — — — 19,824
Acquisition of non-controlling interest inconjunction with Catalyst Merger . . . . — — — — — (1,610) (1,610)
Exercise of stock options . . . . . . . . . . . . . 1,419,744 11,036 (3,273) — — — 7,763
Vesting of restricted stock units . . . . . . . . 471,996 18,021 (18,021) — — — —
Tax benefit on options exercised . . . . . . . — — 19,397 — — — 19,397
Stock-based compensation . . . . . . . . . . . . — — 17,667 — — — 17,667
Other comprehensive income, net oftax . . . . . . . . . . . . . . . . . . . . . . . . . . . . . — — — — (2,191) — (2,191)
Balance at December 31, 2012 . . . . . . . . . . . 205,399,102 $4,180,778 $ 73,530 $354,991 $(2,191) $ 2,753 $4,609,861
See accompanying notes to the consolidated financial statements.
65
CATAMARAN CORPORATION
NOTES TO CONSOLIDATED FINANCIAL STATEMENTS
1. Description of Business
Catamaran Corporation (“Catamaran” or the “Company”) is a leading provider of pharmacy benefits management(“PBM”) services and healthcare information technology (“HCIT”) solutions to the healthcare benefits management industry.The Company’s product offerings and solutions combine a wide range of PBM services, software applications, applicationservice provider (“ASP”) processing services and professional services designed for many of the largest organizations in thepharmaceutical supply chain, such as federal, provincial, state and local governments, unions, corporations, pharmacy benefitmanagers, managed care organizations, retail pharmacy chains and other healthcare intermediaries. The Company isheadquartered in Lisle, Illinois with several locations in the U.S. and Canada.
In July 2012, following the completion of its merger (the “Merger”) with Catalyst Health Solutions, Inc. (“Catalyst”),SXC Health Solutions Corp. unveiled a new name and brand for the combined company. The new name, CatamaranCorporation, reflects the union of two of the industry’s fastest-growing PBM companies. The Company trades on the NasdaqStock Market under the ticker symbol “CTRX” and on the Toronto Stock Exchange under ticker symbol “CCT.”
2. Significant Accounting Policies
(a) Significant accounting policies are summarized below:
Basis of presentation:
The consolidated financial statements of the Company have been prepared in accordance with accounting principlesgenerally accepted in the United States (“U.S. GAAP”) and include its wholly-owned subsidiaries as well as non-controlledentities. All significant inter-company transactions and balances have been eliminated in consolidation. Amounts in theconsolidated financial statements are expressed in U.S. dollars, except where otherwise indicated. Certain reclassificationshave been made to conform the prior years’ consolidated financial statements to the current year’s presentation.
Use of estimates:
The preparation of the consolidated financial statements in conformity with U.S. GAAP requires management to makeestimates and assumptions that affect the reported amounts of assets and liabilities and disclosure of contingent assets andliabilities at the date of the financial statements, and the reported amounts of revenue and expenses during the reportingperiods. Significant items subject to such estimates and assumptions include revenue recognition, purchase price allocationand contingent consideration in connection with acquisitions, valuation of property and equipment, valuation of intangibleassets acquired and related amortization periods, impairment of goodwill, contingencies, valuation allowances for receivablesand income taxes. Actual results could differ from those estimates.
Revenue recognition:
The Company’s revenue is derived from prescription drug sales along with transaction processing services, maintenance,professional services, and systems sales (including software license and hardware sales).
The Company recognizes revenue when all of the following conditions are satisfied: (i) there is persuasive evidence of anarrangement; (ii) the service or product has been provided to the customer and no uncertainties exist surrounding productacceptance; (iii) the amount of fees to be paid by the customer is fixed or determinable; and (iv) the collection of fees isreasonably assured.
When the Company enters into arrangements with multiple deliverables, exclusive of arrangements with softwaredeliverables, it applies the Financial Accounting Standards Board’s guidance for revenue arrangements with multipledeliverables and evaluates each deliverable to determine whether it represents a separate unit of accounting based on thefollowing criteria: (i) whether the delivered item has value to the customer on a stand-alone basis, and (ii) if the contractincludes a general right of return relative to the delivered item, delivery or performance of the undelivered item(s) isconsidered probable and substantially in the control of the Company. Revenue is allocated to each unit of accounting orelement based on relative selling prices. The Company determines relative selling prices by using either (i) vendor specificobjective evidence (“VSOE”) if it exists; or (ii) third-party evidence of selling price (“TPE”). When neither VSOE nor TPE ofselling price exists for a deliverable, the Company uses its best estimate of the selling price for that deliverable.
66

CATAMARAN CORPORATION
NOTES TO CONSOLIDATED FINANCIAL STATEMENTS — (Continued)
After determining which deliverables represent a separate unit of accounting, each unit is then accounted for under theapplicable revenue recognition guidance. In cases where elements cannot be treated as separate units of accounting, theelements are combined into a single unit of accounting for revenue recognition purposes.
When the Company enters into arrangements with multiple deliverables involving software, the Company applies theAmerican Institute of Certified Public Accountant’s (“AICPA”) accounting guidance for software. The entire arrangement feeis allocated to each element in the arrangement based on the respective VSOE of fair value of each element.
When an arrangement includes software and non-software deliverables, the Company allocates the arrangementconsideration to the non-software deliverables, and to the software deliverables as a group, based on the relative selling pricesof all deliverables in the arrangement. When a tangible product contains software that is not essential to the product’sfunctionality, that nonessential software and any other deliverables within the arrangement that relate to that nonessentialsoftware are accounted for under accounting guidance for software. The non-software deliverables sold by the Companytypically do not include software deliverables that are considered essential to the functionality of a tangible product.
Revenue is recognized for specific types of transactions as follows:
PBM revenue: The Company’s PBM revenue is primarily derived from sales of prescription drugs, together with anyassociated administrative fees, to customers and participants through the Company’s nationwide network of pharmacies.Revenue related to the sales of prescription drugs by the Company’s nationwide network of pharmacies is recognized whenthe claims are adjudicated. Claims are adjudicated at the point-of-sale using the Company’s on-line processing system. TheCompany records an offsetting reduction to revenue for any rebates earned from pharmaceutical manufacturers and third partyadministrators which are payable to the Company’s customers.
For transactions at the Company’s participating pharmacies, under the terms of the customer contracts, the pharmacy issolely obligated to collect the co-payments from the participants. The Company does not assume liability for participant co-payments in non-Company owned pharmacy transactions, and therefore does not include participant co-payments in revenueor cost of revenue. If these amounts were included in the Company’s operating results, its operating income and net incomewould not have been affected.
The Company evaluates customer contracts to determine whether the Company acts as a principal or as an agent in thefulfillment of prescriptions through its participating pharmacy network. The Company acts as a principal in certain of itstransactions with customers and, in these cases, revenues are recognized at the prescription price (ingredient cost plusdispensing fee) negotiated with customers, plus the Company’s administrative fees (“gross reporting”). Gross reporting isappropriate when the Company (i) has separate contractual relationships with customers and with pharmacies, (ii) isresponsible to validate and manage a claim through its claims adjudication process, (iii) commits to set prescription prices forthe pharmacy, including instructing the pharmacy as to how that price is to be settled (co-payment requirements),(iv) manages the overall prescription drug plan relationship with the patients, who are members of customers’ plans, and(v) has credit risk for the amount due from the customer.
Revenue for the sale of prescription drugs dispensed at the Company’s mail and specialty pharmacies, including amountsdue from third-party payors and member co-payments, is recorded when the prescription drugs are shipped.
HCIT revenue: HCIT revenues are generated from transaction processing, system sales, maintenance, and professionalservices. Revenue is recognized for the specific types of HCIT transactions as follows:
Transaction processing revenue: Revenue from transaction processing includes ASP and switching services. ASPservices consist primarily of hosting, claims adjudication, customer support, financial reporting, data storage, and rebateadministration services. The Company earns a transaction fee for each transaction processed. The Company recognizesrevenue at the time the transaction is processed, with the exception of any undelivered elements.
System sales revenue: Revenue from software licenses is recognized in accordance with the AICPA’s accountingguidance for software. Revenue is recognized when all the conditions described above are satisfied. In the event the fee is notfixed or determinable, revenue is recognized as the payments become due from the customer. In cases where collection is notdeemed probable, revenue is recognized upon receipt of cash, assuming all other criteria have been met.
Typically, software license agreements are multiple element arrangements as they may also include professional services,related maintenance, hardware, and implementation services fees. Arrangements that include non-software elements areevaluated to determine whether those services are considered essential to the functionality of the software. In general, thesoftware sold by the Company is not essential to the functionality of the non-software elements, including tangible products,
67

CATAMARAN CORPORATION
NOTES TO CONSOLIDATED FINANCIAL STATEMENTS — (Continued)
sold by the Company; accordingly, all software elements in multiple element arrangements are recognized under accountingguidance for software.
When non-software elements are not considered essential to the functionality of the software and significantcustomization of the software is not required, the entire arrangement fee is allocated to each element in the arrangement basedon the respective VSOE of fair value of each element. VSOE of fair value used in determining the fair value of licenserevenues is based on the price charged by the Company when the same element is sold in similar volumes to a customer ofsimilar size and nature on a stand-alone basis. As the Company has not sold many licenses over the past several years, VSOEof fair value for licenses is not always established. VSOE used in determining revenue for consulting is based on the standarddaily rates for the type of services being provided multiplied by the estimated time to complete the task. VSOE used indetermining the fair value of maintenance and technical support is based on the annual renewal rates. The revenue allocable tothe consulting services is recognized as the services are performed. In instances where VSOE exists for undelivered elementsbut does not exist for delivered elements of a software arrangement, the Company uses the residual method of allocation ofthe arrangement fees for revenue recognition purposes. The Company has used the residual method of revenue recognition todetermine the amount of revenue to be applied to any software licenses that contain multiple elements for the periods coveredin this Annual Report as VSOE of fair value of the software licenses was not available. If VSOE of fair value cannot beestablished for the undelivered elements of a license agreement, the entire amount of revenue under the arrangement isdeferred until these elements have been delivered or VSOE can be established.
Maintenance revenue: Maintenance revenues consist of revenue derived from contracts to provide post-contractcustomer support (“PCS”) to license holders. These revenues are recognized ratably over the term of the contract. Advancebillings of PCS are not recorded to the extent that the term of the PCS has not commenced or payment has not been received.
Professional services revenue: Professional services revenues are recognized as the services are performed, generally ona time and material basis. Professional services revenues attributed to fixed price arrangements are recognized over the serviceperiod based on a proportionate performance method whereby the performance is estimated utilizing direct labor hoursincurred to date as a percentage of total estimated direct labor hours to complete the project.
Cost of revenue:
The Company’s cost of revenue includes the cost of pharmaceuticals dispensed, either directly dispensed at its mail andspecialty pharmacy locations, or indirectly through its nationwide network of participating pharmacies. Cost of revenue isreduced for rebates earned from pharmaceutical manufacturers and third party administrators. Cost of revenue also includesthe cost of personnel to support the Company’s transaction processing services, system sales, maintenance, and professionalservices. In addition, the Company includes in cost of revenue an amount of depreciation expense that is related to propertyand equipment used to provide services to customers.
Cash and cash equivalents:
The Company considers cash on hand, deposits in banks, money market funds, and bank term deposits with originalmaturities of ninety days or less as cash and cash equivalents. The amounts presented in the consolidated balance sheetsapproximate fair value of cash and cash equivalents. These assets are deemed Level 1 securities in the fair value hierarchy.
Restricted cash:
Restricted cash balances at December 31, 2012 are restricted as to use and relate primarily to minimum cash balancesrequired in accordance with various state statutes, contractual terms with customers and other customer restrictions related tothe Company’s PBM business.
Fair value measurements:
The Company applies the fair value accounting guidance for measuring its financial and non-financial assets andliabilities. Currently, none of the Company’s non-financial assets are required to be carried at fair value. The Company wouldapply the fair value accounting guidance to non-financial assets and liabilities in the event that a non-financial asset orliability was impaired, or, if non-financial assets and liabilities were purchased in a business acquisition.
The fair value of contingent consideration is based upon probability weighted discounted cash flow models, utilizing theCompany’s expectation of the amounts to be paid in the future to settle the contingent purchase price. The inputs utilized incalculating the fair value of the contingent purchase price liabilities are not observable in the market place. The fair value ofthe Company’s interest rate contracts is based upon observable market-based inputs that reflect the current value of the
68
CATAMARAN CORPORATION
NOTES TO CONSOLIDATED FINANCIAL STATEMENTS — (Continued)
difference between the fixed rate payments the Company will make to the counter party, and the future variable rate receiptsfrom the counterparty.
Other assets and liabilities held by the Company deemed as financial instruments and required to be carried at fair valueinclude cash and cash equivalents, accounts receivable, rebates receivable, accounts payable, accrued liabilities (currentportion), pharmacy benefit management rebates payable and pharmacy benefit claim payments payable. The estimated fairvalues of these financial instruments approximate their carrying amounts due to the short-term nature of their maturities.
Inventory:
Inventory consists primarily of prescription drugs and medical supplies, computer hardware and sub-licensed softwareheld for resale and is carried at the lower of cost or net realizable value. Inventory costs are calculated using the first-in, first-out method and the weighted-average method.
Property and equipment:
Property and equipment (“P&E”) are stated at cost less accumulated depreciation. Depreciation is generally calculatedover the expected estimated useful lives of the assets. Assets are depreciated in the following manner: 1) Furniture andequipment is depreciated using the straight—line method based on a useful life of five years, 2) Computer equipment andsoftware assets are depreciated using a straight-line method and a useful life of three to five years, and 3) Leaseholdimprovements are depreciated on a straight-line basis over the shorter of the asset’s life or the lease term.
Accounts receivable and allowance for doubtful accounts:
Trade accounts receivable are recorded at the invoiced amount and do not bear interest. Amounts collected on tradeaccounts receivable are included in net cash provided by operating activities in the consolidated statements of cash flows. Inassessing the valuation of the allowance for doubtful accounts, management reviews the collectability of accounts receivablein aggregate and on an individual account-basis. Individual customer events such as subsequent collections, discussions withmanagement of the debtor companies, or other activities are used by management as factors in concluding whether to increaseor decrease the calculated allowance. Any increase or decrease to the allowance is recognized in the statements of operationsas bad debt expense within selling, general and administrative expense.
Impairment of long-lived assets:
Long-lived assets or asset groups held and used, including P&E and purchased intangibles subject to amortization arereviewed for impairment whenever events or changes in circumstances indicate that the carrying amount of an asset may notbe recoverable. Circumstances which could trigger a review include, but are not limited to: significant decreases in the marketprice of the asset; significant adverse changes in the business climate or legal factors; the accumulation of costs significantlyin excess of the amount originally expected for the acquisition or construction of the asset; current period cash flow oroperating losses combined with a history of losses or a forecast of continuing losses associated with the use of the asset; and acurrent expectation that the asset will more likely than not be sold or disposed of significantly before the end of its previouslyestimated useful life. Recoverability is assessed based on the carrying amount of the asset and the sum of the undiscountedcash flows expected to result from the use and the eventual disposal of the asset or asset group. An impairment loss isrecognized when the carrying amount is not recoverable and exceeds the fair value of the asset or asset group. The impairmentloss is measured as the amount by which the carrying amount exceeds fair value. During each of the years endedDecember 31, 2012, 2011 and 2010, no events or circumstances occurred that indicated that the carrying amounts of the long-lived assets may not be recoverable.
While no asset was deemed impaired during 2012, the Company assessed whether one of its assets was recoverable dueto a triggering event. In October 2012, the Company launched its new specialty brand BriovaRx. The Company previouslyacquired MedfusionRx, a specialty pharmacy, and recorded a trade name intangible asset related to the acquisition. As a resultof the re-branding of the specialty business, the Company concluded that a triggering event had occurred that could impair thevalue of the trade name. While the asset was not deemed impaired, the Company concluded that the useful life of the tradename intangible asset should be reduced since the name would no longer be used by the Company, which was the asset’shighest and best use. Before adjusting the useful life of the asset, the Company considered whether the asset had any value asa defensible asset which would extend its useful life. The Company determined that the MedfusionRx trade name had aninsignificant value as a defensible asset, and the asset’s useful life should be shortened due to the name change of thebusiness. As a result, the Company recorded an additional $8.0 million in amortization expense in 2012.
69

CATAMARAN CORPORATION
NOTES TO CONSOLIDATED FINANCIAL STATEMENTS — (Continued)
Goodwill:
Goodwill is the residual amount that results when the purchase price of an acquired business exceeds the sum of theamounts allocated to the identifiable assets acquired, less liabilities assumed, based on their fair values. Goodwill is allocatedto the Company’s reporting unit that is expected to benefit from the business combination as of the date of the businesscombination. As of December 31, 2012, the amount of goodwill carried at the HCIT and PBM segments were $19.7 millionand $4.5 billion, respectively.
Goodwill is not amortized, but rather, is tested for impairment annually or more frequently if events or changes incircumstances indicate that the asset might be impaired. The Company completes its goodwill impairment test annually as ofOctober 31. Circumstances that could trigger an interim impairment test include: a significant adverse change in the businessclimate or legal factors; an adverse action or assessment by a regulator; unanticipated competition; the loss of key personnel; achange in reporting units; the likelihood that a reporting unit or significant portion of a reporting unit will be sold or otherwisedisposed of; the results of testing for recoverability of a significant asset group within a reporting unit; and the recognition ofa goodwill impairment loss in the financial statements of a subsidiary that is a component of a reporting unit.
The Company adopted in the prior year the amendment to the goodwill impairment testing standard that allows theCompany to perform a qualitative analysis to determine whether further impairment testing is necessary. The Companyperformed the qualitative goodwill impairment assessment and there was no indication of an impairment to the Company’sgoodwill balances. In addition, an impairment in the near future is not considered reasonably likely. The Company previouslycompleted impairment tests in 2011 and 2010 and concluded no impairments existed.
The qualitative assessment performed by the Company considered the current operating results of the Company’sreporting units, future expectations of each reporting unit, industry and competitor performance and other recent events thatmay impact each reporting unit. The Company then assessed whether, in light of the evidence gathered, it was more likelythan not that a reporting unit’s fair value was less than its carrying amount. As noted above, the Company concluded that itwas not more likely than not that a reporting unit’s fair value was less than its carrying value. If in the future the Company’squalitative assessment indicates that a reporting unit’s fair value may be below its carrying value, the Company would preparea quantitative test to determine whether an impairment existed, and the amount of such impairment.
The quantitative impairment test is carried out in two steps for each of the Company’s reporting units. In the first step,the carrying amount of the reporting unit is compared with its fair value. When the fair value of a reporting unit exceeds itscarrying amount, goodwill of the reporting unit is considered not to be impaired and the second step of the impairment test isunnecessary. The second step is carried out when the carrying amount of a reporting unit exceeds its fair value, in which casethe implied fair value of the reporting unit’s goodwill is compared with its carrying amount to measure the amount of theimpairment loss, if any. The implied fair value of goodwill is determined in the same manner as the value of goodwill isdetermined in a business combination using the fair value of the reporting unit as if it was the purchase price. When thecarrying amount of reporting unit goodwill exceeds the implied fair value of the goodwill, an impairment loss is recognized inan amount equal to the excess and is presented as a separate line item in the consolidated statements of operations.
Intangible assets:
Intangible assets acquired individually or as part of a group of other assets are initially recognized and measured at cost.The cost of a group of intangible assets acquired in a transaction, including those acquired in a business combination that meetthe specified criteria for recognition apart from goodwill, is allocated to the individual assets acquired based on their fairvalues.
Intangible assets with finite useful lives are amortized over their estimated useful lives on either a straight-line basis or inproportion to the economic benefits expected to be consumed. Customer relationships acquired with the acquisitions areamortized based on projected cash flows associated with existing customers at the acquisition date and typically have a life offour to nine years. The Company’s remaining intangible assets are amortized on a straight-line basis over one to ten years.
Rebates:
The Company administers a rebate program through which it receives rebates and administrative fees frompharmaceutical manufacturers and third party administrators that are shared with a majority of the Company’s customers. Therebates earned for the administration of the program are recorded as a reduction of cost of revenue and the portion of therebate payable to customers, if applicable, is treated as a reduction of revenue. Rebates receivable include billed and unbilledPBM receivables from pharmaceutical manufacturers and third party administrators. The Company records the gross rebatereceivable and the related payable to the customers based on estimates, which are subject to final settlement due to the
70

CATAMARAN CORPORATION
NOTES TO CONSOLIDATED FINANCIAL STATEMENTS — (Continued)
required validation of claims data submitted to the pharmaceutical manufacturers and third party administrators, as well ascontingent items contained in the total calculation for rebates earned. The estimates are based upon claims submitted and theCompany’s rebate contracts, and are adjusted as additional information becomes available. Upon billing the pharmaceuticalmanufacturer or third party administrator, any difference between the Company’s estimate and the actual amount of the rebatereceivable is recorded to cost of revenue, net of the estimated impact to the Company’s customers. The Company generallypays rebates to its customers on a quarterly basis, or as agreed upon with its customers. There are certain instances where theCompany pays rebates to its customers on a more accelerated basis.
As of December 31, 2012 and 2011, total unbilled pharmaceutical manufacturer rebates receivable amounted to$14.6 million and $8.9 million, respectively.
Research and product development:
Research costs are expensed as incurred. Costs related to development of software are expensed as incurred unless suchcosts meet the criteria for capitalization and amortization. The Company has not capitalized any software development costsincurred during 2012, 2011, or 2010.
Stock-based compensation:
For stock-based awards issued to employees and directors, compensation cost related to those awards is measured basedon the fair value of the awards on the date of the grant. For stock options, the fair value is determined by using the Black-Scholes-Merton option-pricing model. The compensation cost of the awards expected to vest is recognized on a straight-linebasis over the service period as compensation expense and additional paid-in capital. In addition, the Company estimatesforfeitures as part of the initial measure of the grant date fair value of the award.
The cumulative compensation cost is treated as a temporary difference for stock-based awards that are deductible for taxpurposes. If a deduction reported on a tax return exceeds the cumulative compensation cost for those awards, any resultingrealized tax benefit that exceeds the previously recognized deferred tax asset for those awards (the excess tax benefit) isrecognized as additional paid-in capital. If the amount deductible is less than the cumulative compensation cost recognized forfinancial reporting purposes, the write-off of a deferred tax asset related to that deficiency, net of the related valuationallowance, if any, is first offset to the extent of any remaining additional paid-in capital from excess tax benefits fromprevious awards with the remainder recognized in the statement of operations.
Derivatives:
The Company accounts for derivative instruments pursuant to the FASB’s derivative and hedge accounting guidance.The guidance requires that all derivative instruments are recorded on the balance sheet at their respective fair values. Changesin the fair value of the Company’s derivative instruments not deemed cash flow hedges are recorded in the statement ofoperations each reporting period. The Company records the change in the fair value of its derivative instruments deemed ascash flow hedges through other comprehensive income in each reporting period.
Foreign currency:
The Company’s functional currency and reporting currency is the U.S. dollar. Monetary items denominated in foreigncurrency are translated to U.S. dollars at exchange rates in effect at the balance sheet date and non-monetary items aretranslated at rates in effect when the assets were acquired or obligations incurred. Revenue and expenses are translated at ratesin effect at the time of the transactions. Foreign exchange gains and losses are included in the consolidated statements ofoperations as “Interest and other expense, net.”
Earnings per share:
Basic earnings per share (“EPS”) is computed by dividing net income by the weighted-average number of commonshares outstanding for the period. Diluted EPS is computed by dividing net income by the weighted-average number ofcommon shares adjusted for the dilutive effect of outstanding stock-based awards. The dilutive effect is calculated byassuming that the proceeds from the exercise of in-the-money stock options were used to acquire shares of common stock atthe average market price for the period.
Income taxes:
The Company uses the asset and liability method of accounting for income taxes. Deferred tax assets and liabilities arerecognized for the deferred tax consequences attributable to differences between the financial statement carrying amounts of
71

CATAMARAN CORPORATION
NOTES TO CONSOLIDATED FINANCIAL STATEMENTS — (Continued)
existing assets and liabilities and their respective tax bases and operating loss and tax credit carryforwards. Deferred tax assetsand liabilities are measured using enacted tax rates expected to apply to taxable income in the periods in which thosetemporary differences are expected to be recovered or settled. The effect on deferred tax assets and liabilities of a change intax rates is recognized in income in the period that includes the date of enactment.
Future tax benefits resulting from historical net operating losses (“NOLs”) and deductible temporary differences arerecognized in accordance with tax accounting guidance. In assessing the realizability of the related deferred income tax assets(“DTAs”), management considers whether it is more likely than not that some portion or all of the DTAs will be realized. Theultimate realization of DTAs is dependent upon the generation of future taxable income during the period in which thosetemporary differences become deductible, in addition to management’s tax planning strategies. Management considersprojected future taxable income, uncertainties related to the industry in which the Company operates, tax planning strategies,historical taxable income, and a comparison of actual levels of taxable income with pre-tax book income in making thisassessment. Valuation allowances are established for DTAs that are not considered more likely than not to be realized. Theamount of this valuation allowance is subject to adjustment by the Company in future periods based upon its assessment ofevidence supporting the degree of probability that DTAs will be realized.
The Company recognizes liabilities for uncertain tax positions, although the Company believes its tax position issupportable, when the Company believes that the tax positions may not be fully sustained upon review by tax authorities.Benefits from uncertain tax positions are recognized in the consolidated financial statements only when it is more likely thannot that the tax position will be sustained upon examination by the appropriate taxing authority having full knowledge of allrelevant information. A tax position that meets the more-likely-than-not recognition threshold is measured at the largestamount of benefit that is greater than fifty percent likely of being realized upon settlement. The Company recognizes interestand penalties related to uncertain tax positions in income tax expense.
Non-refundable investment tax credits for Scientific Research and Experimental Development (“SRED”) activities arerecorded when the Company has reasonable assurance that the credit will be realized. Management has made a number ofestimates and assumptions in determining the expenditures eligible for the investment tax credit claim. It is possible that theallowable amount of the investment tax credit claim could be materially different from the recorded amount upon assessmentby the Canada Revenue Agency. Non-refundable investment tax credits are recorded as a reduction of income tax expense onthe consolidated statements of operations.
(b) Recent accounting standards implemented are summarized below:
Goodwill impairment:
In July 2012, FASB issued an update to the indefinite-lived intangible assets impairment testing standard. The revisedstandard is intended to reduce the cost and complexity of the annual impairment test by providing entities an option toperform a “qualitative” assessment to determine whether further impairment testing is necessary. The revised standard iseffective for annual and interim impairment tests performed for fiscal years beginning after September 15, 2012; however, anentity can choose to early adopt provided that the entity has not yet performed its 2012 annual impairment test or issued itsfinancial statements. The Company does not expect the implementation of the revised standard to have a significant impact onits financial results or in the presentation and disclosure of its financial statements.
3. Stock Split
On September 6, 2012, the Company announced that its board of directors had declared a nominal dividend on the issuedand outstanding common shares of the Company to effect a two-for-one stock split. Shareholders of record at the close ofbusiness on September 20, 2012 were issued one additional common share for each share owned as of that date. Theadditional common shares were distributed on October 1, 2012.
On September 2, 2010, the Company announced that its board of directors had declared a two-for-one stock split effectedby a stock dividend on the issued and outstanding common shares of the Company. On September 17, 2010, shareholders ofrecord at the close of business on September 14, 2010 were issued one additional common share for each share owned as ofthat date.
All share and per share data presented in these consolidated financial statements have been adjusted to reflect the stocksplits noted above.
72
CATAMARAN CORPORATION
NOTES TO CONSOLIDATED FINANCIAL STATEMENTS — (Continued)
4. Business Combinations
Catalyst Merger
On July 2, 2012, the Company completed its previously announced Merger with Catalyst, a full-service PBM. Each shareof Catalyst common stock outstanding immediately prior to the effective time of the Merger (other than shares owned by theCompany or Catalyst or any of their respective wholly-owned subsidiaries) was converted in the Merger into the right toreceive 1.3212 (0.6606 prior to split adjustment) of a Company common share and $28.00 in cash. This resulted in theCompany issuing approximately 66.8 million common shares, issuing 0.5 million warrants, and paying $1.4 billion in cash toCatalyst stockholders to complete the Merger. The results of Catalyst have been included in the Company’s results sinceJuly 2, 2012. The consolidated statement of operations for the year ended December 31, 2012 includes Catalyst’s totalrevenues of $3.2 billion following consummation of the Merger.
The Merger was accounted for under the acquisition method of accounting with the Company treated as the acquiringentity. Accordingly, the consideration paid by the Company to complete the acquisition has been allocated to the assetsacquired and liabilities assumed based upon their estimated fair values as of the date of acquisition. The carrying values forcurrent assets and liabilities were deemed to approximate their fair values due to the short-term nature of their maturities. Thefair value for the acquired customer relationships intangible asset was valued using an excess earnings model based onexpected future revenues derived from the customers acquired. The excess of the purchase price over the estimated fair valuesof the net assets acquired was recorded as goodwill.
All of the assets and liabilities recorded for the Merger are included within the Company’s PBM segment. Goodwill isnon-amortizing for financial statement purposes. Goodwill of $525 million related to the Catalyst Merger is tax deductible.The goodwill recognized by the Company represents many of the synergies and business growth opportunities that theCompany anticipates may be realized from the Merger. The synergies include improved pricing from the Company’ssuppliers due to the increased volume of prescription drug purchases, pull through opportunities of the combined companies’mail and specialty service offerings, and a more efficient leveraging of resources to achieve operating profits.
The purchase price of the acquired Catalyst operations was comprised of the following (in thousands):
Cash paid to Catalyst shareholders $1,415,276
Fair value of common shares issued(a) 3,238,141
Fair value of warrants and stock options issued(b) 19,824
Total purchase price $4,673,241
(a) Valued based on the number of outstanding shares issued in the Merger multiplied by the closing market price ofCatamaran shares on July 2, 2012.
(b) The Black-Scholes option pricing model was used to calculate the fair value of the replacement warrants and stock optionsissued.
73

CATAMARAN CORPORATION
NOTES TO CONSOLIDATED FINANCIAL STATEMENTS — (Continued)
The following summarizes the preliminary fair values assigned to the assets acquired and liabilities assumed at theacquisition date and are subject to change as the valuation processes are not complete. Final determination of the fair valuesmay result in further adjustments to the amounts presented below (in thousands):
Initial AmountsRecognized at
Acquisition Date(a)
MeasurementPeriod
Adjustments(b)
CurrentAmounts
Recognized atAcquisition Date
Cash and cash equivalents . . . . . . . . . . . . . . . . . . . . . . . . . . $ 93,775 $ (315) $ 93,460
Other current assets . . . . . . . . . . . . . . . . . . . . . . . . . . . . . . . . 695,888 5,202 701,090
Total current assets . . . . . . . . . . . . . . . . . . . . . . . . . . . . . 789,663 4,887 794,550
Goodwill . . . . . . . . . . . . . . . . . . . . . . . . . . . . . . . . . . . . . . . . 4,010,235 8,492 4,018,727
Customer relationships intangible . . . . . . . . . . . . . . . . . . . . . 1,184,800 — 1,184,800
Other long-term assets . . . . . . . . . . . . . . . . . . . . . . . . . . . . . 87,174 1,547 88,721
Total assets acquired . . . . . . . . . . . . . . . . . . . . . . . . . . . . 6,071,872 14,926 6,086,798
Accounts payable . . . . . . . . . . . . . . . . . . . . . . . . . . . . . . . . . 338,819 — 338,819
Pharmacy benefit management rebates payable . . . . . . . . . . 176,202 2,935 179,137
Accrued expenses and other current liabilities . . . . . . . . . . . 187,851 1,348 189,199
Long-term debt . . . . . . . . . . . . . . . . . . . . . . . . . . . . . . . . . . . 311,994 — 311,994
Other long-term liabilities . . . . . . . . . . . . . . . . . . . . . . . . . . . 385,375 10,643 396,018
Total liabilities assumed . . . . . . . . . . . . . . . . . . . . . . . . . 1,400,241 14,926 1,415,167
Non-controlling interest . . . . . . . . . . . . . . . . . . . . . . . . (1,610) — (1,610)
Net assets acquired . . . . . . . . . . . . . . . . . . . . . . . . . . . $4,673,241 $ — $4,673,241
(a) As previously reported in the Company’s Form 10-Q for the period ended September 30, 2012.
(b) These measurement period adjustments were recorded to reflect changes in the estimated fair values of the associatedassets acquired and liabilities assumed based on factors existing as of the acquisition date.
During the year ended December 31, 2012, the Company recognized $86.0 million of amortization expense fromintangible assets acquired in the Catalyst Merger. Amortization associated with the Catalyst Merger in 2013 is expected to be$166.1 million. The estimated fair value of the customer relationship intangible asset is $1.2 billion with a useful life of9 years. The intangible asset acquired will not have any residual value at the end of the amortization period. There were no in-process research and development assets acquired.
Separate Transactions and Preexisting Relationships
During the year ended December 31, 2012, the Company incurred transaction and integration expenses related to theMerger, exclusive of debt financing costs, totaling $27.2 million which includes transaction expenses of $22.8 million. Thesecosts are included in selling, general and administrative (“SG&A”) expenses. Additionally, during the year endedDecember 31, 2012, the Company recorded $17.0 million in charges to SG&A expenses due to transactions related to theMerger, recognized separately from the acquisition of assets and assumptions of liabilities from the Merger. The chargesrecorded related to $3.5 million in contract settlements and terminations made by Catalyst prior to the acquisition that hadfuture benefit to the Company, $3.1 million for payments made to Catalyst employees based on contractual arrangementswhich had future benefit to the Company, and $10.4 million in severance charges incurred subsequent to the close of theMerger.
Due to the previous contractual relationship between the Company and Catalyst, there were pre-existing transactionsbetween the entities which resulted in approximately $4.1 million in accounts receivable due to the Company from Catalyst atthe time of the Merger, mainly for HCIT transaction processing services provided. No gain or loss was generated from thesubsequent settlement of these pre-existing balances.
74
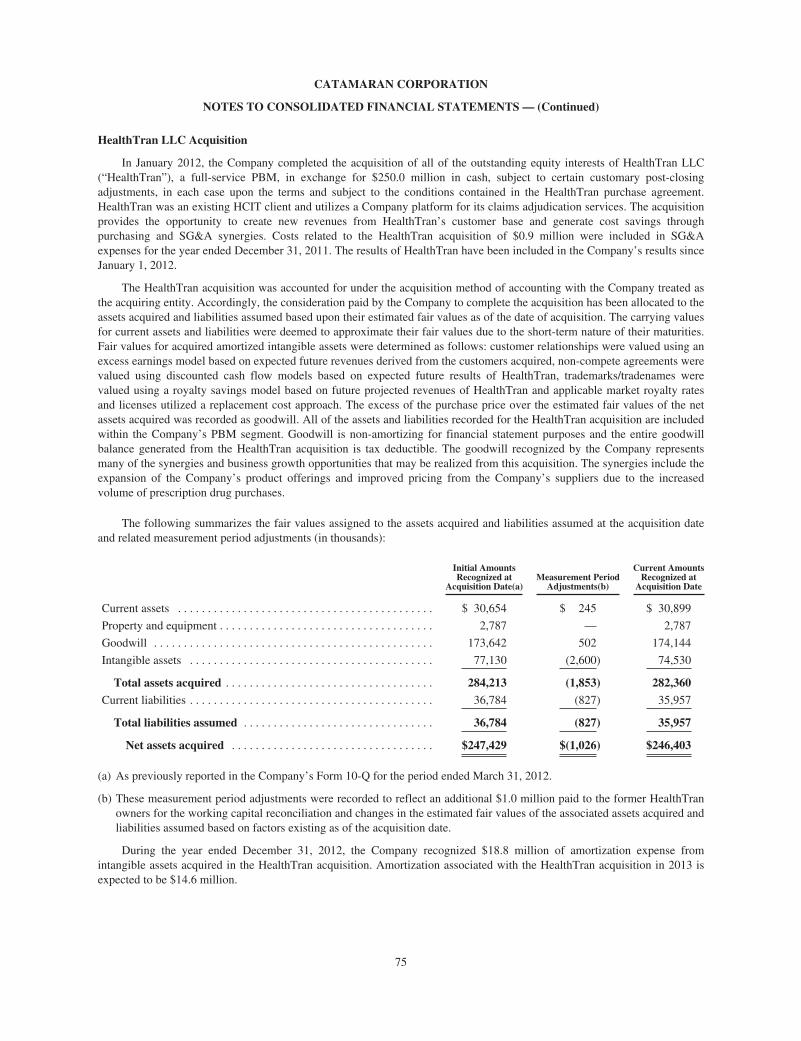
CATAMARAN CORPORATION
NOTES TO CONSOLIDATED FINANCIAL STATEMENTS — (Continued)
HealthTran LLC Acquisition
In January 2012, the Company completed the acquisition of all of the outstanding equity interests of HealthTran LLC(“HealthTran”), a full-service PBM, in exchange for $250.0 million in cash, subject to certain customary post-closingadjustments, in each case upon the terms and subject to the conditions contained in the HealthTran purchase agreement.HealthTran was an existing HCIT client and utilizes a Company platform for its claims adjudication services. The acquisitionprovides the opportunity to create new revenues from HealthTran’s customer base and generate cost savings throughpurchasing and SG&A synergies. Costs related to the HealthTran acquisition of $0.9 million were included in SG&Aexpenses for the year ended December 31, 2011. The results of HealthTran have been included in the Company’s results sinceJanuary 1, 2012.
The HealthTran acquisition was accounted for under the acquisition method of accounting with the Company treated asthe acquiring entity. Accordingly, the consideration paid by the Company to complete the acquisition has been allocated to theassets acquired and liabilities assumed based upon their estimated fair values as of the date of acquisition. The carrying valuesfor current assets and liabilities were deemed to approximate their fair values due to the short-term nature of their maturities.Fair values for acquired amortized intangible assets were determined as follows: customer relationships were valued using anexcess earnings model based on expected future revenues derived from the customers acquired, non-compete agreements werevalued using discounted cash flow models based on expected future results of HealthTran, trademarks/tradenames werevalued using a royalty savings model based on future projected revenues of HealthTran and applicable market royalty ratesand licenses utilized a replacement cost approach. The excess of the purchase price over the estimated fair values of the netassets acquired was recorded as goodwill. All of the assets and liabilities recorded for the HealthTran acquisition are includedwithin the Company’s PBM segment. Goodwill is non-amortizing for financial statement purposes and the entire goodwillbalance generated from the HealthTran acquisition is tax deductible. The goodwill recognized by the Company representsmany of the synergies and business growth opportunities that may be realized from this acquisition. The synergies include theexpansion of the Company’s product offerings and improved pricing from the Company’s suppliers due to the increasedvolume of prescription drug purchases.
The following summarizes the fair values assigned to the assets acquired and liabilities assumed at the acquisition dateand related measurement period adjustments (in thousands):
Initial AmountsRecognized at
Acquisition Date(a)Measurement Period
Adjustments(b)
Current AmountsRecognized at
Acquisition Date
Current assets . . . . . . . . . . . . . . . . . . . . . . . . . . . . . . . . . . . . . . . . . . . $ 30,654 $ 245 $ 30,899
Property and equipment . . . . . . . . . . . . . . . . . . . . . . . . . . . . . . . . . . . . 2,787 — 2,787
Goodwill . . . . . . . . . . . . . . . . . . . . . . . . . . . . . . . . . . . . . . . . . . . . . . . 173,642 502 174,144
Intangible assets . . . . . . . . . . . . . . . . . . . . . . . . . . . . . . . . . . . . . . . . . 77,130 (2,600) 74,530
Total assets acquired . . . . . . . . . . . . . . . . . . . . . . . . . . . . . . . . . . . 284,213 (1,853) 282,360
Current liabilities . . . . . . . . . . . . . . . . . . . . . . . . . . . . . . . . . . . . . . . . . 36,784 (827) 35,957
Total liabilities assumed . . . . . . . . . . . . . . . . . . . . . . . . . . . . . . . . 36,784 (827) 35,957
Net assets acquired . . . . . . . . . . . . . . . . . . . . . . . . . . . . . . . . . . $247,429 $(1,026) $246,403
(a) As previously reported in the Company’s Form 10-Q for the period ended March 31, 2012.
(b) These measurement period adjustments were recorded to reflect an additional $1.0 million paid to the former HealthTranowners for the working capital reconciliation and changes in the estimated fair values of the associated assets acquired andliabilities assumed based on factors existing as of the acquisition date.
During the year ended December 31, 2012, the Company recognized $18.8 million of amortization expense fromintangible assets acquired in the HealthTran acquisition. Amortization associated with the HealthTran acquisition in 2013 isexpected to be $14.6 million.
75
CATAMARAN CORPORATION
NOTES TO CONSOLIDATED FINANCIAL STATEMENTS — (Continued)
The estimated fair values and useful lives of intangible assets acquired are as follows (dollars in thousands):
Fair Value Useful Life
Trademarks/Trade names . . . . . . . . . . . . . . . . . . . . . . . . . . . . . . . . . . . . . . . . . . . . . . . . . . $ 1,750 6 months
Customer relationships . . . . . . . . . . . . . . . . . . . . . . . . . . . . . . . . . . . . . . . . . . . . . . . . . . . . 69,800 4-9 years
Non-compete agreements . . . . . . . . . . . . . . . . . . . . . . . . . . . . . . . . . . . . . . . . . . . . . . . . . . 2,600 5 years
License . . . . . . . . . . . . . . . . . . . . . . . . . . . . . . . . . . . . . . . . . . . . . . . . . . . . . . . . . . . . . . . . . 380 3 years
Total . . . . . . . . . . . . . . . . . . . . . . . . . . . . . . . . . . . . . . . . . . . . . . . . . . . . . . . . . . . . . . . . $74,530
None of the acquired intangible assets will have any residual value at the end of the amortization periods. There were noin-process research and development assets acquired.
PTRX and SaveDirectRx Acquisitions
On October 3, 2011, the Company completed the acquisitions of PTRX, Inc. (“PTRX”), a full-service PBM, and itsexclusive mail-order pharmacy provider, SaveDirectRx, Inc. (“SaveDirectRx”), both based in San Antonio, Texas. Thecombined purchase price was $77.2 million in cash, subject to certain customary post-closing adjustments, with anopportunity for the former owners of SaveDirectRx to earn an additional $4.5 million, subject to the achievement of certainperformance targets through 2012.
The acquisitions of PTRX and SaveDirectRx continue upon the Company’s strategy to acquire assets that currentlyutilize the Company’s technology platform in order to ease the integration into the Company’s business. Further, theseacquisitions will allow the Company to extend its presence in the southwestern part of the U.S. and expand its mail pharmacybusiness. The results of operations of these businesses are included in the Company’s consolidated statements of operationsfrom the date of their acquisition.
The purchase price of the acquired PTRX and SaveDirectRx operations was comprised of the following (in thousands):
Cash payment to PTRX shareholders . . . . . . . . . . . . . . . . . . . . . . . . . . . . . . . . . . . . . . . . . . . . . . . . . . . . $77,181
Fair value of contingent purchase price . . . . . . . . . . . . . . . . . . . . . . . . . . . . . . . . . . . . . . . . . . . . . . . . . . . 4,225
Total purchase price . . . . . . . . . . . . . . . . . . . . . . . . . . . . . . . . . . . . . . . . . . . . . . . . . . . . . . . . . . . . . . $81,406
The SaveDirectRx purchase agreement includes contingent purchase price consideration in the form of an earn-outpayment of up to $4.5 million contingent upon the SaveDirectRx book of business meeting or exceeding certain gross profitand revenue targets for the 2012 fiscal year. The $4.2 million fair-value of the contingent purchase price was accrued at thedate of acquisition as part of the total consideration transferred. The Company utilized a probability weighted discounted cashflow method with expected future performance of SaveDirectRx, and its ability to meet the target performance objectives, asthe main driver of the valuation, to arrive at the fair value of the contingent consideration. As the fair value measurement forthe contingent consideration is based on inputs not observed in the market, the measurement is classified as a Level 3measurement as defined by the fair value hierarchy.
Costs related to the PTRX and SaveDirectRx acquisitions of $0.4 million are included in SG&A expenses for the yearended December 31, 2011. The costs incurred are comprised of legal, accounting, valuation, and professional services feesassociated with the PTRX and SaveDirectRx acquisition. Due to the previous contractual relationship between the Companyand PTRX, there were pre-existing transactions between the two entities which resulted in approximately $2.4 million inaccounts receivable due to the Company from PTRX and SaveDirectRx mainly for PBM services provided, andapproximately $2.6 million due to PTRX and SaveDirectRx primarily for pharmacy benefit management rebates, as of theacquisition date. No gain or loss was generated from the subsequent settlement of these pre-existing balances.
Purchase Price Allocation
The PTRX and SaveDirectRx acquisitions were accounted for under the acquisition method of accounting with theCompany treated as the acquiring entity. Accordingly, the consideration paid by the Company to complete the acquisitionshave been allocated to the assets acquired and liabilities assumed based upon their estimated fair values as of the date ofacquisition. The carrying values for current assets and liabilities were deemed to approximate their fair value due to the short-
76

CATAMARAN CORPORATION
NOTES TO CONSOLIDATED FINANCIAL STATEMENTS — (Continued)
term nature of their maturities. Fair values for acquired amortized intangible assets were determined as follows: customer listsare valued using an excess earnings model based on expected future revenues derived from the customers acquired, non-compete agreements were valued using discounted cash flow models based on expected future results of PTRX andSaveDirectRx, trademarks/tradenames were valued using a royalty savings model based on future projected revenues ofPTRX and SaveDirectRx, and applicable market royalty rates and licenses utilized a replacement cost approach. The excess ofthe purchase price over the estimated fair values of the net assets acquired was recorded as goodwill. The assets and liabilitiesrecorded for PTRX and SaveDirectRx were recorded in the PBM segment. Goodwill is non-amortizing for financial statementpurposes and $25.0 million of the goodwill balance generated from the PTRX and SaveDirectRx acquisitions is taxdeductible.
The goodwill recognized by the Company represents many of the synergies and business growth opportunities that maybe realized from these acquisitions. The opportunity to bring Catamaran’s full suite of PBM services to PTRX andSaveDirectRx clients is a significant driver of the goodwill created. In addition, there are cost saving opportunities throughadding PTRX and SaveDirectRx into the Company’s pharmacy and purchasing networks.
The following summarizes the preliminary fair values assigned to the assets acquired and liabilities assumed at theacquisition date and are subject to change (in thousands):
Current assets . . . . . . . . . . . . . . . . . . . . . . . . . . . . . . . . . . . . . . . . . . . . . . . . . . . . . . . . . . . . . . . . . . . . . . $ 19,063
Property and equipment . . . . . . . . . . . . . . . . . . . . . . . . . . . . . . . . . . . . . . . . . . . . . . . . . . . . . . . . . . . . . . 573
Goodwill . . . . . . . . . . . . . . . . . . . . . . . . . . . . . . . . . . . . . . . . . . . . . . . . . . . . . . . . . . . . . . . . . . . . . . . . . . 61,450
Intangible assets . . . . . . . . . . . . . . . . . . . . . . . . . . . . . . . . . . . . . . . . . . . . . . . . . . . . . . . . . . . . . . . . . . . . 25,380
Total assets acquired . . . . . . . . . . . . . . . . . . . . . . . . . . . . . . . . . . . . . . . . . . . . . . . . . . . . . . . . . . . . . 106,466
Current liabilities . . . . . . . . . . . . . . . . . . . . . . . . . . . . . . . . . . . . . . . . . . . . . . . . . . . . . . . . . . . . . . . . . . . 19,476
Deferred income taxes . . . . . . . . . . . . . . . . . . . . . . . . . . . . . . . . . . . . . . . . . . . . . . . . . . . . . . . . . . . . . . . 5,584
Total liabilities assumed . . . . . . . . . . . . . . . . . . . . . . . . . . . . . . . . . . . . . . . . . . . . . . . . . . . . . . . . . . 25,060
Net assets acquired . . . . . . . . . . . . . . . . . . . . . . . . . . . . . . . . . . . . . . . . . . . . . . . . . . . . . . . . . . . . . $ 81,406
During the year ended December 31, 2012, the Company recognized $4.8 million of amortization expense fromintangible assets acquired. Amortization for 2013 is expected to be $4.3 million.
The estimated fair values and useful lives of intangible assets acquired are as follows (dollars in thousands):
Fair Value Useful Life
Trademarks/Trade names . . . . . . . . . . . . . . . . . . . . . . . . . . . . . . . . . . . . . . . . . . . . . . . . . . $ 400 6 months
Customer relationships . . . . . . . . . . . . . . . . . . . . . . . . . . . . . . . . . . . . . . . . . . . . . . . . . . . . 20,800 8 years
Non-compete agreements . . . . . . . . . . . . . . . . . . . . . . . . . . . . . . . . . . . . . . . . . . . . . . . . . . 3,800 3-4 years
Licenses . . . . . . . . . . . . . . . . . . . . . . . . . . . . . . . . . . . . . . . . . . . . . . . . . . . . . . . . . . . . . . . . 380 3 years
Total . . . . . . . . . . . . . . . . . . . . . . . . . . . . . . . . . . . . . . . . . . . . . . . . . . . . . . . . . . . . . . . . $25,380
None of the acquired intangible assets will have any residual value at the end of the amortization periods. There were noin-process research and development assets acquired.
MedfusionRx Acquisition
On December 28, 2010, the Company, completed the acquisition of MedfusionRx, L.L.C. and certain affiliated entitiesand certain assets of Medtown South, L.L.C (collectively, “MedfusionRx”), a specialty pharmacy provider with significantexpertise in providing clinical services to patients with complex chronic conditions. The purchase price for MedfusionRx was$101.5 million in cash, subject to a customary post-closing working capital adjustment, and an opportunity for the formerowners of MedfusionRx to earn an additional $5.5 million in cash, subject to the satisfaction of certain performance targets inthe 2012 fiscal year, in each case based upon the terms and subject to the conditions contained in the Purchase Agreement.MedfusionRx’s results of operations from the date of acquisition through December 31, 2010 were not material to theCompany’s results of operations for 2011.
77
CATAMARAN CORPORATION
NOTES TO CONSOLIDATED FINANCIAL STATEMENTS — (Continued)
The acquisition of MedfusionRx has helped transform the Company’s specialty pharmacy business by expanding itspresence and enhancing its capabilities in this rapidly growing sector of the PBM industry. The acquisition also provides anopportunity to create new revenues and generate cost savings through purchasing synergies.
The purchase price of the acquired MedfusionRx operations was comprised of the following (in thousands):
Cash payment to MedfusionRx shareholders . . . . . . . . . . . . . . . . . . . . . . . . . . . . . . . . . . . . . . . . . . . . . . $101,514
Fair value of contingent purchase price . . . . . . . . . . . . . . . . . . . . . . . . . . . . . . . . . . . . . . . . . . . . . . . . . . 4,865
Total purchase price . . . . . . . . . . . . . . . . . . . . . . . . . . . . . . . . . . . . . . . . . . . . . . . . . . . . . . . . . . . . . $106,379
The MedfusionRx purchase agreement includes contingent purchase price consideration in the form of an earn-outpayment of up to $5.5 million contingent upon the MedfusionRx book of business meeting or exceeding certain gross profittargets for the year ended December 31, 2012. The $4.9 million fair-value of the contingent purchase price was accrued at thedate of acquisition as part of the total consideration transferred. The Company utilized a probability weighted discounted cashflow method, with expected future performance of MedfusionRx, and its ability to meet the target performance objectives asthe main driver of the valuation, to arrive at the fair value of the contingent consideration.
As the fair value measurement for the contingent consideration is based on inputs not observed in the market, themeasurement is classified as a Level 3 measurement as defined by the fair value measurements guidance.
Costs related to the MedfusionRx acquisition of $2.4 million are included in selling, general and administrative expensesfor the year ended December 31, 2010. The costs incurred are comprised of legal, accounting, valuation, and professionalservices fees associated with the MedfusionRx acquisition.
Purchase Price Allocation
The MedfusionRx acquisition was accounted for under the acquisition method of accounting with the Company treatedas the acquiring entity. Accordingly, the consideration paid by the Company to complete the acquisition has been allocated tothe assets acquired and liabilities assumed based upon their estimated fair values as of the date of acquisition. The carryingvalues for current assets and liabilities were deemed to approximate their fair value due to the short-term nature of theirmaturities. Fair values for acquired amortized intangible assets were determined as follows: customer lists are valued using anexcess earnings model based on expected future revenues derived from the customers acquired, non-compete agreements werevalued using discounted cash flow models based on expected future results of MedfusionRx, trademarks/ tradenames andsoftware were valued using a royalty savings model based on future projected revenues of MedfusionRx and applicablemarket royalty rates, and licenses utilized a replacement cost approach. The excess of the purchase price over the estimatedfair values of the net assets acquired was recorded as goodwill. All of the assets and liabilities recorded for the MedfusionRxacquisition are included within the Company’s PBM segment. Goodwill is non-amortizing for financial statement purposesand the entire goodwill balance generated from the MedfusionRx acquisition is tax deductible.
The goodwill recognized by the Company represents many of the synergies and business growth opportunities that maybe realized from this acquisition. The opportunity to pull through more specialty sales to the Company’s existing customerbase is a significant driver of the goodwill created. The acquisition of MedfusionRx adds to our ability to service customersmore efficiently and effectively due to the addition of specialty pharmacy locations and expands the Company’s productofferings. Further, the Company expects to drive cost savings due to the increased volume of prescription drug purchases ofthe combined entities which should yield improved pricing from the Company’s suppliers.
78

CATAMARAN CORPORATION
NOTES TO CONSOLIDATED FINANCIAL STATEMENTS — (Continued)
The following summarizes the final fair values assigned to the assets acquired and liabilities assumed at the acquisitiondate (in thousands):
Current assets . . . . . . . . . . . . . . . . . . . . . . . . . . . . . . . . . . . . . . . . . . . . . . . . . . . . . . . . . . . . . . . . . . . . . . $ 20,781
Property and equipment . . . . . . . . . . . . . . . . . . . . . . . . . . . . . . . . . . . . . . . . . . . . . . . . . . . . . . . . . . . . . . 360
Goodwill . . . . . . . . . . . . . . . . . . . . . . . . . . . . . . . . . . . . . . . . . . . . . . . . . . . . . . . . . . . . . . . . . . . . . . . . . . 79,034
Intangible assets . . . . . . . . . . . . . . . . . . . . . . . . . . . . . . . . . . . . . . . . . . . . . . . . . . . . . . . . . . . . . . . . . . . . 26,262
Total assets acquired . . . . . . . . . . . . . . . . . . . . . . . . . . . . . . . . . . . . . . . . . . . . . . . . . . . . . . . . . . . . . 126,437
Current liabilities . . . . . . . . . . . . . . . . . . . . . . . . . . . . . . . . . . . . . . . . . . . . . . . . . . . . . . . . . . . . . . . . . . . 20,058
Total liabilities assumed . . . . . . . . . . . . . . . . . . . . . . . . . . . . . . . . . . . . . . . . . . . . . . . . . . . . . . . . . . 20,058
Net assets acquired . . . . . . . . . . . . . . . . . . . . . . . . . . . . . . . . . . . . . . . . . . . . . . . . . . . . . . . . . . . . . $106,379
During the year ended December 31, 2012, the Company recognized $12.9 million of amortization expense fromintangible assets acquired. Amortization for 2013 is expected to be $2.8 million.
The estimated fair values and useful lives of intangible assets acquired are as follows (dollars in thousands):
Fair Value Useful Life
Trademarks/Trade names(a) . . . . . . . . . . . . . . . . . . . . . . . . . . . . . . . . . . . . . . . . . . . . . . . . $10,000 10 years
Customer relationships . . . . . . . . . . . . . . . . . . . . . . . . . . . . . . . . . . . . . . . . . . . . . . . . . . . . 14,562 5 years
Non-compete agreements . . . . . . . . . . . . . . . . . . . . . . . . . . . . . . . . . . . . . . . . . . . . . . . . . . 1,400 5 years
License . . . . . . . . . . . . . . . . . . . . . . . . . . . . . . . . . . . . . . . . . . . . . . . . . . . . . . . . . . . . . . . . . 300 3 years
Total . . . . . . . . . . . . . . . . . . . . . . . . . . . . . . . . . . . . . . . . . . . . . . . . . . . . . . . . . . . . . . . . $26,262
(a) In October 2012, the Company launched its new specialty brand, BriovaRx, formerly known as Medfusion and Ascend.As a result of the re-branding of the specialty business, the Company concluded that the useful life of the intangible assetthat the Company recorded for the MedfusionRx trade name should be reduced since the name would no longer be usedby the Company, which was the asset’s highest and best use. As a result, the Company recorded an additional $8.0 millionin amortization expense during 2012.
None of the acquired intangible assets will have any residual value at the end of the amortization periods. There were noin-process research and development assets acquired.
MedMetrics Health Partners Acquisition
On June 1, 2011, the Company completed the acquisition of substantially all of the assets of MedMetrics Health Partners,Inc. (“MedMetrics”), the full-service PBM subsidiary of Public Sector Partners, Inc., which is affiliated with a major medicalschool. MedMetrics’ results of operations are included in the 2011 consolidated statements of operations commencing June 1,2011. Prior to the acquisition, MedMetrics was a customer of the Company and its associated revenue was accounted for inthe PBM segment. Due to the previous contractual relationship between the Company and MedMetrics, there were pre-existing transactions between the two entities which resulted in approximately $10.6 million in accounts receivable due to theCompany from MedMetrics for PBM services provided as of the acquisition date. No gain or loss was generated from thesubsequent settlement of these pre-existing balances.
The acquisition of MedMetrics is consistent with the Company’s strategy to acquire assets that currently utilize theCompany’s technology platform which facilitates the integration into the Company’s business and will allow the Companythe opportunity to sell additional services, such as mail and specialty services, to MedMetrics’ customers. The acquisition willalso help extend the Company’s footprint in the northeastern part of the U.S.
The MedMetrics acquisition was accounted for under the acquisition method of accounting, with the Company treated asthe acquiring entity. Accordingly, the consideration paid by the Company to complete the acquisition has been allocated to theassets acquired and liabilities assumed based upon their estimated fair values as of the date of acquisition. All of the assets andliabilities recorded for the MedMetrics acquisition are included within the Company’s PBM segment.
79

CATAMARAN CORPORATION
NOTES TO CONSOLIDATED FINANCIAL STATEMENTS — (Continued)
Unaudited Pro Forma Financial Information
The following unaudited pro forma financial information presents the combined historical results of operations of theCompany and its recent acquisitions of Catalyst, HealthTran, PTRX and SaveDirectRx as if the acquisitions had eachoccurred as of January 1, 2011. The unaudited pro forma financial information includes certain adjustments related to theacquisitions, such as increased amortization from the fair value of intangible assets acquired recorded as part of the purchaseaccounting, the elimination of transactions between the Company and the acquired entities, and related income tax effects.
Unaudited pro forma results of operations are as follows (dollars in thousands, except share and per share amounts):
Years Ended December 31,
2012 2011
Revenue . . . . . . . . . . . . . . . . . . . . . . . . . . . . . . . . . . . . . . . . . . . . . . . . . . . . . . . . $ 12,938,675 $ 10,593,613
Gross profit . . . . . . . . . . . . . . . . . . . . . . . . . . . . . . . . . . . . . . . . . . . . . . . . . . . . . . $ 920,444 $ 703,042
Net income . . . . . . . . . . . . . . . . . . . . . . . . . . . . . . . . . . . . . . . . . . . . . . . . . . . . . . $ 167,558 $ 52,812
Earnings per share:
Basic . . . . . . . . . . . . . . . . . . . . . . . . . . . . . . . . . . . . . . . . . . . . . . . . . . . . . . . . . $ 0.82 $ 0.26
Diluted . . . . . . . . . . . . . . . . . . . . . . . . . . . . . . . . . . . . . . . . . . . . . . . . . . . . . . . $ 0.82 $ 0.26
Weighted average shares outstanding:
Basic . . . . . . . . . . . . . . . . . . . . . . . . . . . . . . . . . . . . . . . . . . . . . . . . . . . . . . . . . 204,640,652 202,993,252
Diluted . . . . . . . . . . . . . . . . . . . . . . . . . . . . . . . . . . . . . . . . . . . . . . . . . . . . . . . 205,589,803 204,643,456
This unaudited pro forma financial information is not intended to represent or be indicative of what would have occurredif the transactions had taken place on the dates presented and is not indicative of what the Company’s actual results ofoperations would have been had the acquisitions been completed at the beginning of the periods indicated above. Further, thepro forma combined results do not reflect one-time costs to fully merge and operate the combined organization moreefficiently, or anticipated synergies expected to result from the combination and should not be relied upon as being indicativeof the future results that the Company will experience.
5. Variable Interest Entity
Catalyst entered into a purchase agreement on December 16, 2011, and made an initial capital contribution of$5.0 million to Script Relief LLC (“Script Relief”), a Delaware limited liability company, in exchange for a 19.9% ownershipinterest. On March 1, 2012, Catalyst made an additional $5.0 million capital contribution to Script Relief due to itsachievement of certain milestones, thereby increasing Catalyst’s ownership interest to 47.0%. Script Relief operates a direct toconsumer pharmacy benefit business, including discount card offerings and associated activities. The Company evaluated thistransaction and determined that Script Relief is a variable interest entity with Catamaran being the primary beneficiary, as theCompany’s underlying PBM and pharmacy contracts represent Script Relief’s key business operations and the Company hasthe power to direct these activities. As a result, Script Relief is consolidated in the Company’s consolidated financialstatements with the amounts attributable to the non-controlling interests disclosed. The assets and liabilities of Script Reliefwere recorded at fair value as of the date of the Merger with Catalyst. The carrying amount of the assets and liabilities, andthe impact of the operating results of this consolidated variable interest entity are not material to our consolidated financialstatements.
Beginning in December 2012, and through April 2016, the Company has the right to purchase all of the outstandinginterests owned by the other equity member of Script Relief. The purchase of the outstanding interests is at our sole discretionand is subject to a contractually-defined purchase price. If the Company elects to exercise this call option, it contains aminimum purchase price of $50.0 million, which could be increased based on operating performance. Conversely, beginningin April 2016, the Company has the right to require Script Relief to redeem the Company’s ownership interest in Script Reliefat original cost plus a defined preferred return. There are no terms that would require the Company to provide additionalfinancial support to the variable interest entity.
80

CATAMARAN CORPORATION
NOTES TO CONSOLIDATED FINANCIAL STATEMENTS — (Continued)
6. Property and Equipment
Net property and equipment was made up of the following at December 31, 2012 and 2011:
December 31, 2012 CostAccumulatedDepreciation
Net BookValue
(In thousands)
Furniture and equipment . . . . . . . . . . . . . . . . . . . . . . . . . . . . . . . . . . . . . . . . . . . . . . $ 15,819 $ (5,478) $ 10,341
Computer equipment and software . . . . . . . . . . . . . . . . . . . . . . . . . . . . . . . . . . . . . . 137,541 (52,013) 85,528
Leasehold improvements . . . . . . . . . . . . . . . . . . . . . . . . . . . . . . . . . . . . . . . . . . . . . . 15,889 (6,557) 9,332
$169,249 $(64,048) $105,201
December 31, 2011 CostAccumulatedDepreciation
Net BookValue
(In thousands)
Furniture and equipment . . . . . . . . . . . . . . . . . . . . . . . . . . . . . . . . . . . . . . . . . . . . . . . . $ 6,089 $ (3,574) $ 2,515
Computer equipment and software . . . . . . . . . . . . . . . . . . . . . . . . . . . . . . . . . . . . . . . . 49,539 (35,252) 14,287
Leasehold improvements . . . . . . . . . . . . . . . . . . . . . . . . . . . . . . . . . . . . . . . . . . . . . . . . 9,334 (4,478) 4,856
$64,962 $(43,304) $21,658
Depreciation expense, including property and equipment acquired under capital leases, totaled $20.2 million,$9.5 million, and $8.4 million for the years ended December 31, 2012, 2011, and 2010, respectively. Of the total depreciationexpense, $3.5 million, $2.7 million, and $2.4 million was related to the data center operations and allocated to cost of revenuefor the years ended December 31, 2012, 2011 and 2010, respectively.
7. Goodwill and Other Intangible Assets
The changes in the carrying amounts of goodwill by reportable segment for the years ended December 31, 2012 and2011 are as follows (in thousands):
PBM HCIT Total
Balance at December 31, 2010 . . . . . . . . . . . . . . . . . . . . . . . . . . . . . . . . . . . . . . . . . . . . $ 200,932 $19,665 $ 220,597
Adjustments to purchase price allocation(1) . . . . . . . . . . . . . . . . . . . . . . . . . . . . . . . . . . 523 — 523
Acquisitions(2) . . . . . . . . . . . . . . . . . . . . . . . . . . . . . . . . . . . . . . . . . . . . . . . . . . . . . . . . . 69,925 — 69,925
Balance at December 31, 2011 . . . . . . . . . . . . . . . . . . . . . . . . . . . . . . . . . . . . . . . . . . . . 271,380 19,665 291,045
HealthTran acquisition(3) . . . . . . . . . . . . . . . . . . . . . . . . . . . . . . . . . . . . . . . . . . . . . . . 173,642 — 173,642
Catalyst Merger(4) . . . . . . . . . . . . . . . . . . . . . . . . . . . . . . . . . . . . . . . . . . . . . . . . . . . . . 4,010,235 — 4,010,235
Separate transactions(5) . . . . . . . . . . . . . . . . . . . . . . . . . . . . . . . . . . . . . . . . . . . . . . . . (4,607) — (4,607)
Measurement periods adjustments(6) . . . . . . . . . . . . . . . . . . . . . . . . . . . . . . . . . . . . . 7,723 — 7,723
Balance at December 31, 2012 . . . . . . . . . . . . . . . . . . . . . . . . . . . . . . . . . . . . . . . . . . . $4,458,373 $19,665 $4,478,038
(1) Represents adjustments to purchase price, including settlement of working capital adjustment.
(2) Represents the acquisitions of Medmetrics, PTRX and SaveDirectRx in 2011.
(3) Initial goodwill recorded for the acquisition of HealthTran in January 2012.
(4) Initial goodwill recorded in connection with the Merger with Catalyst in July 2012.
(5) Adjustments to goodwill for transactions entered into and executed by Catalyst prior to the Merger deemed to have futurebenefit to the Company and not recorded as part of purchase accounting.
81
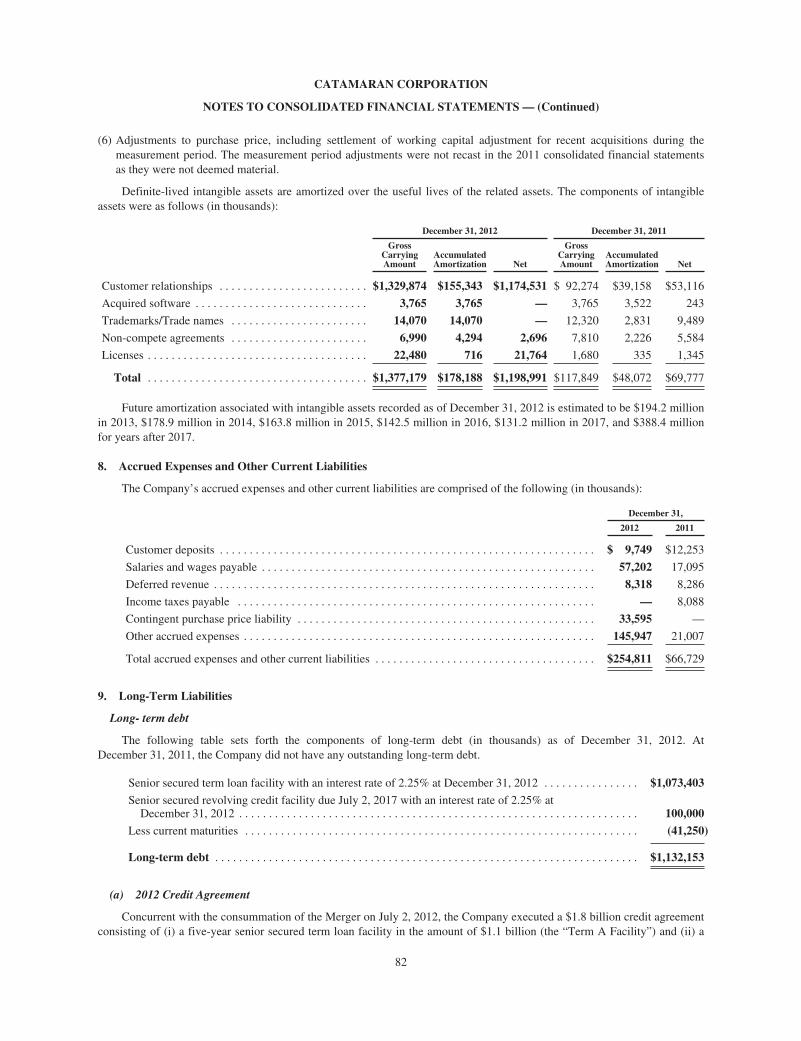
CATAMARAN CORPORATION
NOTES TO CONSOLIDATED FINANCIAL STATEMENTS — (Continued)
(6) Adjustments to purchase price, including settlement of working capital adjustment for recent acquisitions during themeasurement period. The measurement period adjustments were not recast in the 2011 consolidated financial statementsas they were not deemed material.
Definite-lived intangible assets are amortized over the useful lives of the related assets. The components of intangibleassets were as follows (in thousands):
December 31, 2012 December 31, 2011
GrossCarryingAmount
AccumulatedAmortization Net
GrossCarryingAmount
AccumulatedAmortization Net
Customer relationships . . . . . . . . . . . . . . . . . . . . . . . . . $1,329,874 $155,343 $1,174,531 $ 92,274 $39,158 $53,116
Acquired software . . . . . . . . . . . . . . . . . . . . . . . . . . . . . 3,765 3,765 — 3,765 3,522 243
Trademarks/Trade names . . . . . . . . . . . . . . . . . . . . . . . 14,070 14,070 — 12,320 2,831 9,489
Non-compete agreements . . . . . . . . . . . . . . . . . . . . . . . 6,990 4,294 2,696 7,810 2,226 5,584
Licenses . . . . . . . . . . . . . . . . . . . . . . . . . . . . . . . . . . . . . 22,480 716 21,764 1,680 335 1,345
Total . . . . . . . . . . . . . . . . . . . . . . . . . . . . . . . . . . . . . $1,377,179 $178,188 $1,198,991 $117,849 $48,072 $69,777
Future amortization associated with intangible assets recorded as of December 31, 2012 is estimated to be $194.2 millionin 2013, $178.9 million in 2014, $163.8 million in 2015, $142.5 million in 2016, $131.2 million in 2017, and $388.4 millionfor years after 2017.
8. Accrued Expenses and Other Current Liabilities
The Company’s accrued expenses and other current liabilities are comprised of the following (in thousands):
December 31,
2012 2011
Customer deposits . . . . . . . . . . . . . . . . . . . . . . . . . . . . . . . . . . . . . . . . . . . . . . . . . . . . . . . . . . . . . . . $ 9,749 $12,253
Salaries and wages payable . . . . . . . . . . . . . . . . . . . . . . . . . . . . . . . . . . . . . . . . . . . . . . . . . . . . . . . . 57,202 17,095
Deferred revenue . . . . . . . . . . . . . . . . . . . . . . . . . . . . . . . . . . . . . . . . . . . . . . . . . . . . . . . . . . . . . . . . 8,318 8,286
Income taxes payable . . . . . . . . . . . . . . . . . . . . . . . . . . . . . . . . . . . . . . . . . . . . . . . . . . . . . . . . . . . . — 8,088
Contingent purchase price liability . . . . . . . . . . . . . . . . . . . . . . . . . . . . . . . . . . . . . . . . . . . . . . . . . . 33,595 —
Other accrued expenses . . . . . . . . . . . . . . . . . . . . . . . . . . . . . . . . . . . . . . . . . . . . . . . . . . . . . . . . . . . 145,947 21,007
Total accrued expenses and other current liabilities . . . . . . . . . . . . . . . . . . . . . . . . . . . . . . . . . . . . . $254,811 $66,729
9. Long-Term Liabilities
Long- term debt
The following table sets forth the components of long-term debt (in thousands) as of December 31, 2012. AtDecember 31, 2011, the Company did not have any outstanding long-term debt.
Senior secured term loan facility with an interest rate of 2.25% at December 31, 2012 . . . . . . . . . . . . . . . . $1,073,403
Senior secured revolving credit facility due July 2, 2017 with an interest rate of 2.25% atDecember 31, 2012 . . . . . . . . . . . . . . . . . . . . . . . . . . . . . . . . . . . . . . . . . . . . . . . . . . . . . . . . . . . . . . . . . . . 100,000
Less current maturities . . . . . . . . . . . . . . . . . . . . . . . . . . . . . . . . . . . . . . . . . . . . . . . . . . . . . . . . . . . . . . . . . . (41,250)
Long-term debt . . . . . . . . . . . . . . . . . . . . . . . . . . . . . . . . . . . . . . . . . . . . . . . . . . . . . . . . . . . . . . . . . . . . . . . $1,132,153
(a) 2012 Credit Agreement
Concurrent with the consummation of the Merger on July 2, 2012, the Company executed a $1.8 billion credit agreementconsisting of (i) a five-year senior secured term loan facility in the amount of $1.1 billion (the “Term A Facility”) and (ii) a
82
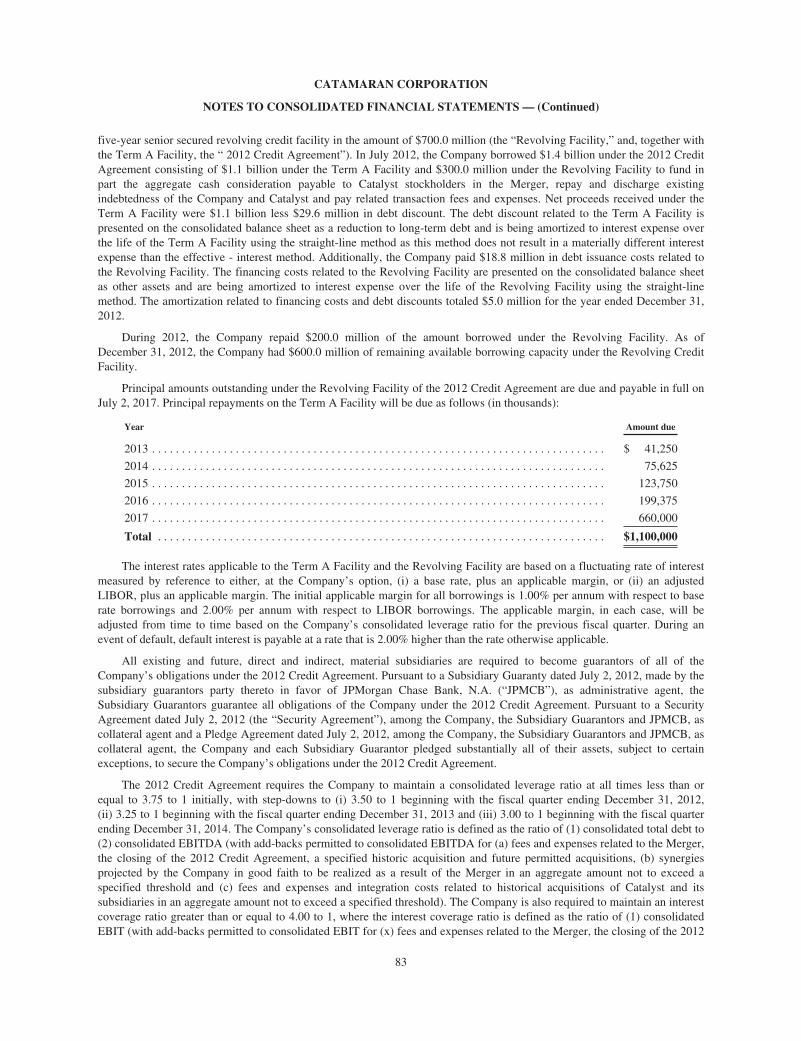
CATAMARAN CORPORATION
NOTES TO CONSOLIDATED FINANCIAL STATEMENTS — (Continued)
five-year senior secured revolving credit facility in the amount of $700.0 million (the “Revolving Facility,” and, together withthe Term A Facility, the “ 2012 Credit Agreement”). In July 2012, the Company borrowed $1.4 billion under the 2012 CreditAgreement consisting of $1.1 billion under the Term A Facility and $300.0 million under the Revolving Facility to fund inpart the aggregate cash consideration payable to Catalyst stockholders in the Merger, repay and discharge existingindebtedness of the Company and Catalyst and pay related transaction fees and expenses. Net proceeds received under theTerm A Facility were $1.1 billion less $29.6 million in debt discount. The debt discount related to the Term A Facility ispresented on the consolidated balance sheet as a reduction to long-term debt and is being amortized to interest expense overthe life of the Term A Facility using the straight-line method as this method does not result in a materially different interestexpense than the effective - interest method. Additionally, the Company paid $18.8 million in debt issuance costs related tothe Revolving Facility. The financing costs related to the Revolving Facility are presented on the consolidated balance sheetas other assets and are being amortized to interest expense over the life of the Revolving Facility using the straight-linemethod. The amortization related to financing costs and debt discounts totaled $5.0 million for the year ended December 31,2012.
During 2012, the Company repaid $200.0 million of the amount borrowed under the Revolving Facility. As ofDecember 31, 2012, the Company had $600.0 million of remaining available borrowing capacity under the Revolving CreditFacility.
Principal amounts outstanding under the Revolving Facility of the 2012 Credit Agreement are due and payable in full onJuly 2, 2017. Principal repayments on the Term A Facility will be due as follows (in thousands):
Year Amount due
2013 . . . . . . . . . . . . . . . . . . . . . . . . . . . . . . . . . . . . . . . . . . . . . . . . . . . . . . . . . . . . . . . . . . . . . . . . . . . . $ 41,250
2014 . . . . . . . . . . . . . . . . . . . . . . . . . . . . . . . . . . . . . . . . . . . . . . . . . . . . . . . . . . . . . . . . . . . . . . . . . . . . 75,625
2015 . . . . . . . . . . . . . . . . . . . . . . . . . . . . . . . . . . . . . . . . . . . . . . . . . . . . . . . . . . . . . . . . . . . . . . . . . . . . 123,750
2016 . . . . . . . . . . . . . . . . . . . . . . . . . . . . . . . . . . . . . . . . . . . . . . . . . . . . . . . . . . . . . . . . . . . . . . . . . . . . 199,375
2017 . . . . . . . . . . . . . . . . . . . . . . . . . . . . . . . . . . . . . . . . . . . . . . . . . . . . . . . . . . . . . . . . . . . . . . . . . . . . 660,000
Total . . . . . . . . . . . . . . . . . . . . . . . . . . . . . . . . . . . . . . . . . . . . . . . . . . . . . . . . . . . . . . . . . . . . . . . . . . . $1,100,000
The interest rates applicable to the Term A Facility and the Revolving Facility are based on a fluctuating rate of interestmeasured by reference to either, at the Company’s option, (i) a base rate, plus an applicable margin, or (ii) an adjustedLIBOR, plus an applicable margin. The initial applicable margin for all borrowings is 1.00% per annum with respect to baserate borrowings and 2.00% per annum with respect to LIBOR borrowings. The applicable margin, in each case, will beadjusted from time to time based on the Company’s consolidated leverage ratio for the previous fiscal quarter. During anevent of default, default interest is payable at a rate that is 2.00% higher than the rate otherwise applicable.
All existing and future, direct and indirect, material subsidiaries are required to become guarantors of all of theCompany’s obligations under the 2012 Credit Agreement. Pursuant to a Subsidiary Guaranty dated July 2, 2012, made by thesubsidiary guarantors party thereto in favor of JPMorgan Chase Bank, N.A. (“JPMCB”), as administrative agent, theSubsidiary Guarantors guarantee all obligations of the Company under the 2012 Credit Agreement. Pursuant to a SecurityAgreement dated July 2, 2012 (the “Security Agreement”), among the Company, the Subsidiary Guarantors and JPMCB, ascollateral agent and a Pledge Agreement dated July 2, 2012, among the Company, the Subsidiary Guarantors and JPMCB, ascollateral agent, the Company and each Subsidiary Guarantor pledged substantially all of their assets, subject to certainexceptions, to secure the Company’s obligations under the 2012 Credit Agreement.
The 2012 Credit Agreement requires the Company to maintain a consolidated leverage ratio at all times less than orequal to 3.75 to 1 initially, with step-downs to (i) 3.50 to 1 beginning with the fiscal quarter ending December 31, 2012,(ii) 3.25 to 1 beginning with the fiscal quarter ending December 31, 2013 and (iii) 3.00 to 1 beginning with the fiscal quarterending December 31, 2014. The Company’s consolidated leverage ratio is defined as the ratio of (1) consolidated total debt to(2) consolidated EBITDA (with add-backs permitted to consolidated EBITDA for (a) fees and expenses related to the Merger,the closing of the 2012 Credit Agreement, a specified historic acquisition and future permitted acquisitions, (b) synergiesprojected by the Company in good faith to be realized as a result of the Merger in an aggregate amount not to exceed aspecified threshold and (c) fees and expenses and integration costs related to historical acquisitions of Catalyst and itssubsidiaries in an aggregate amount not to exceed a specified threshold). The Company is also required to maintain an interestcoverage ratio greater than or equal to 4.00 to 1, where the interest coverage ratio is defined as the ratio of (1) consolidatedEBIT (with add-backs permitted to consolidated EBIT for (x) fees and expenses related to the Merger, the closing of the 2012
83

CATAMARAN CORPORATION
NOTES TO CONSOLIDATED FINANCIAL STATEMENTS — (Continued)
Credit Agreement, a specified historic acquisition and future permitted acquisitions, (y) synergies projected by the Companyin good faith to be realized as a result of the Merger in an aggregate amount not to exceed a specified threshold and (z) feesand expenses and integration costs related to historical acquisitions of Catalyst and its subsidiaries in an aggregate amount notto exceed a specified threshold) to (2) consolidated interest expense, tested at the end of each fiscal quarter for the rolling fourfiscal quarter period then most recently ended. As of December 31, 2012, the Company was in compliance with the covenantsof the 2012 Credit Agreement.
The 2012 Credit Agreement also contains a number of covenants that, among other things, restrict, subject to certainexceptions, the ability of the Company and its subsidiaries to: incur additional indebtedness; create liens; make investments,loans, advances or guarantees; sell or transfer assets; pay dividends and distributions or repurchase its own capital stock;prepay certain indebtedness; engage in mergers, acquisitions or consolidations (subject to exceptions for certain permittedacquisitions); change its lines of business or enter into new lines of business; engage in certain transactions with affiliates;enter into agreements restricting the ability to grant liens in favor of the collateral agent for the benefit of the secured parties;engage in sale and leaseback transactions; or enter into swap, forward, future or derivative transaction or option or similaragreements. In addition, the 2012 Credit Agreement includes various (i) customary affirmative covenants and other reportingrequirements and (ii) customary events of default, including, without limitation, payment defaults, violation of covenants,material inaccuracy of representations or warranties, cross-defaults to other material agreements evidencing indebtedness,bankruptcy events, certain ERISA events, material judgments, invalidity of guarantees or security documents and change ofcontrol. Drawings under the Revolving Facility are subject to certain conditions precedent, including material accuracy ofrepresentations and warranties and absence of default.
The carrying value of the Company’s debt at December 31, 2012 approximates its fair value.
(b) 2011 Credit Agreement
On December 16, 2011, the Company entered into a Credit Agreement (the “2011 Credit Agreement”) with JPMCB, as alender and as administrative agent, and other financial institutions within the syndication, with respect to a five-year seniorunsecured revolving credit facility. The 2011 Credit Agreement provided that, upon the terms and subject to the conditions setforth therein, the lenders will make loans to the Company from time to time, with an initial aggregate revolving commitmentof $350 million, subject to increase from time to time up to a maximum aggregate revolving commitment of $450 million. OnJanuary 3, 2012, the Company borrowed $100 million under the 2011 Credit Agreement to pay a portion of the considerationin connection with the acquisition of HealthTran and certain transaction fees and expenses related to the acquisition. Inconnection with the 2011 Credit Agreement, the Company incurred approximately $1.6 million in financing costs. Thefinancing costs were presented on the consolidated balance sheet as other assets and were amortized to interest expense overthe life of the 2011 Credit Agreement using the straight-line method. In connection with the Merger, the Company terminatedits 2011 Credit Agreement after repaying the outstanding balance in July 2012 and executed a new credit agreement asdiscussed above.
10. Shareholders’ Equity
(a) Common shares:
(i) Authorized: Unlimited no par voting common shares
(ii) Issuance of common shares:
On May 16, 2012, the Company completed a public offering of 12.0 million of its common shares at a price to the publicof $45.30 per share. The net proceeds to the Company from the offering were approximately $519.1 million, after deductingthe underwriting discounts and commissions and offering expenses. The Company used part of the net proceeds from theoffering to pay a portion of the cash component of the Merger consideration and other related fees and expenses in connectionwith the Merger and the balance was used for general corporate purposes.
On July 2, 2012, the Company issued 66.8 million common shares and 0.5 million warrants in connection with theCatalyst Merger. See Note 4 — Business Combinations for further information related to the Merger.
(b) Equity incentive plans:
Effective on March 11, 2009, the Board of Directors of the Company adopted the Catamaran Corporation Long-TermIncentive Plan (“LTIP”), which was approved by the shareholders of the Company at the Annual and Special Meeting ofShareholders on May 13, 2009. The LTIP provides for the grant of stock option awards, stock appreciation rights, restricted
84

CATAMARAN CORPORATION
NOTES TO CONSOLIDATED FINANCIAL STATEMENTS — (Continued)
stock awards, restricted stock unit awards, performance awards and other stock-based awards to eligible persons, includingexecutive officers and directors of the Company. The purpose of the LTIP is to advance the interests of the Company byattracting and retaining high caliber employees and other key individuals who perform services for the Company, a subsidiaryor an affiliate; align the interests of the Company’s shareholders and recipients of awards under the LTIP by increasing theproprietary interest of such recipients in the Company’s growth and success; and motivate award recipients to act in the bestlong-term interest of the Company and its shareholders. The LTIP replaced the previous stock option plan, and no furthergrants or awards will be issued under the previous stock option plan. The maximum common shares of the Company allowedto be issued under the LTIP was increased by 3.6 million on May 11, 2011, after the Company’s shareholders approved anamendment to the LTIP at the Annual and Special Meeting of Shareholders of the Company. In July 2012, the maximumcommon shares of the Company allowed to be issued under the Catamaran Corporation LTIP was increased by 5.0 million.Any full-value awards (i.e., any awards other than stock options or stock appreciation rights) granted under the LTIP arecounted against this share limit as 1.79 shares for every one share granted. There were 6,592,661 stock-based awards availablefor grant under the LTIP as of December 31, 2012.
Prior to May 2007, all stock options awarded by the Company were denominated in Canadian dollars as required by theplan in effect at the grant date. Amendments to the plan in May 2007 permitted the Company to denominate stock optionawards in either Canadian or U.S. dollars. All grants made subsequent to May 2007 are denominated in U.S. dollars.
In connection with the closing of the Merger with Catalyst on July 2, 2012, the Company assumed the 2003HealthExtras, Inc. Equity Incentive Plan (the “2003 Plan”) and the Catalyst Health Solutions, Inc. 2006 Stock Incentive Plan(the “2006 Plan” and, together with the 2003 Plan, the “Catalyst Plans”), each as amended and adjusted for the purpose ofgranting awards to certain employees of Catalyst who continue their employment with the Company subsequent to the closeof the Merger or to newly hired employees of the Company who were not employed with the Company as of the close of theMerger. The Catalyst Plans provide for the grant of stock option awards, restricted stock unit (“RSU”) awards, performanceawards and other stock-based awards to eligible persons. The maximum common shares of the Company allowed to be issuedunder the assumed Catalyst Plans is 1,492,014. Any full-value awards (i.e., any awards other than stock options or SARs)granted under the Catalyst 2006 Plan are counted against this share limit as 1.45 shares for every one share granted. Therewere 1,127,090 stock-based awards available for grant under the Catalyst Plans as of December 31, 2012.
The following table summarizes activity related to stock options denominated in Canadian dollars for the year endedDecember 31, 2012:
Number of Options
WeightedAverageExercisePrice
Outstanding, beginning of period . . . . . . . . . . . . . . . . . . . . . . . . . . . . . . . . . . . . . . . . . . . . . . . . . . . 163,044 $3.20
Granted . . . . . . . . . . . . . . . . . . . . . . . . . . . . . . . . . . . . . . . . . . . . . . . . . . . . . . . . . . . . . . . . . . . . . . . — $ —
Exercised . . . . . . . . . . . . . . . . . . . . . . . . . . . . . . . . . . . . . . . . . . . . . . . . . . . . . . . . . . . . . . . . . . . . . (115,802) $3.08
Expired . . . . . . . . . . . . . . . . . . . . . . . . . . . . . . . . . . . . . . . . . . . . . . . . . . . . . . . . . . . . . . . . . . . . . . . (1,668) $2.91
Forfeited . . . . . . . . . . . . . . . . . . . . . . . . . . . . . . . . . . . . . . . . . . . . . . . . . . . . . . . . . . . . . . . . . . . . . . — $ —
Outstanding, end of period . . . . . . . . . . . . . . . . . . . . . . . . . . . . . . . . . . . . . . . . . . . . . . . . . . . . . . . . 45,574 $3.53
The Company ceased granting Canadian dollar stock options in 2007. All Canadian dollar options outstanding expirefive years from the date of vesting.
The following table summarizes certain information about the Canadian dollar stock options outstanding atDecember 31, 2012 in Canadian dollars:
Range ofExercise Price
OptionsOutstanding
and Exercisable
WeightedAverage
RemainingContractualLife (Years)
WeightedAverageExercisePrice
$ 2.91 - $ 6.09 . . . . . . . . . . . . . . . . . . . . . . . . . . . . . . . . . . . . . . . . . . . . . . . . . . . . . . . . . 45,574 1.0 $3.53
The aggregate intrinsic value and remaining contractual term of exercisable stock options at December 31, 2012 wasapproximately $2.0 million (Cdn.$2.0 million ) and 1 year, respectively.
85
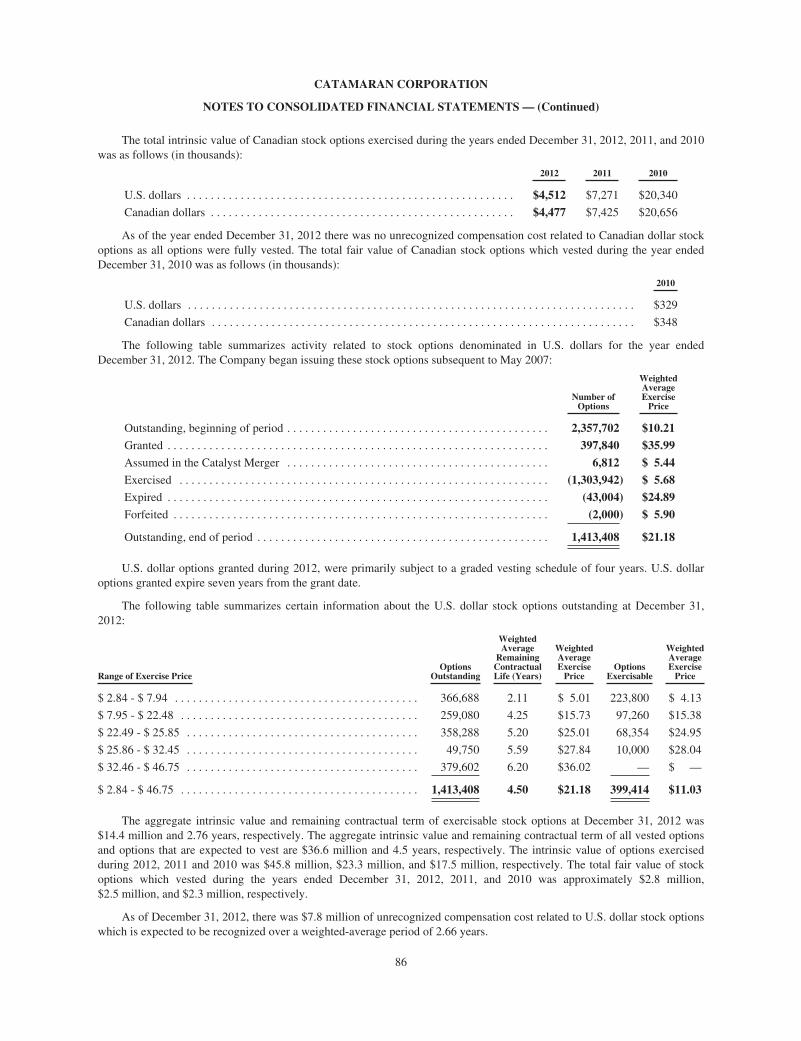
CATAMARAN CORPORATION
NOTES TO CONSOLIDATED FINANCIAL STATEMENTS — (Continued)
The total intrinsic value of Canadian stock options exercised during the years ended December 31, 2012, 2011, and 2010was as follows (in thousands):
2012 2011 2010
U.S. dollars . . . . . . . . . . . . . . . . . . . . . . . . . . . . . . . . . . . . . . . . . . . . . . . . . . . . . . . $4,512 $7,271 $20,340
Canadian dollars . . . . . . . . . . . . . . . . . . . . . . . . . . . . . . . . . . . . . . . . . . . . . . . . . . . $4,477 $7,425 $20,656
As of the year ended December 31, 2012 there was no unrecognized compensation cost related to Canadian dollar stockoptions as all options were fully vested. The total fair value of Canadian stock options which vested during the year endedDecember 31, 2010 was as follows (in thousands):
2010
U.S. dollars . . . . . . . . . . . . . . . . . . . . . . . . . . . . . . . . . . . . . . . . . . . . . . . . . . . . . . . . . . . . . . . . . . . . . . . . . . . $329
Canadian dollars . . . . . . . . . . . . . . . . . . . . . . . . . . . . . . . . . . . . . . . . . . . . . . . . . . . . . . . . . . . . . . . . . . . . . . . $348
The following table summarizes activity related to stock options denominated in U.S. dollars for the year endedDecember 31, 2012. The Company began issuing these stock options subsequent to May 2007:
Number ofOptions
WeightedAverageExercisePrice
Outstanding, beginning of period . . . . . . . . . . . . . . . . . . . . . . . . . . . . . . . . . . . . . . . . . . . . 2,357,702 $10.21
Granted . . . . . . . . . . . . . . . . . . . . . . . . . . . . . . . . . . . . . . . . . . . . . . . . . . . . . . . . . . . . . . . . 397,840 $35.99
Assumed in the Catalyst Merger . . . . . . . . . . . . . . . . . . . . . . . . . . . . . . . . . . . . . . . . . . . . 6,812 $ 5.44
Exercised . . . . . . . . . . . . . . . . . . . . . . . . . . . . . . . . . . . . . . . . . . . . . . . . . . . . . . . . . . . . . . (1,303,942) $ 5.68
Expired . . . . . . . . . . . . . . . . . . . . . . . . . . . . . . . . . . . . . . . . . . . . . . . . . . . . . . . . . . . . . . . . (43,004) $24.89
Forfeited . . . . . . . . . . . . . . . . . . . . . . . . . . . . . . . . . . . . . . . . . . . . . . . . . . . . . . . . . . . . . . . (2,000) $ 5.90
Outstanding, end of period . . . . . . . . . . . . . . . . . . . . . . . . . . . . . . . . . . . . . . . . . . . . . . . . . 1,413,408 $21.18
U.S. dollar options granted during 2012, were primarily subject to a graded vesting schedule of four years. U.S. dollaroptions granted expire seven years from the grant date.
The following table summarizes certain information about the U.S. dollar stock options outstanding at December 31,2012:
Range of Exercise PriceOptions
Outstanding
WeightedAverage
RemainingContractualLife (Years)
WeightedAverageExercisePrice
OptionsExercisable
WeightedAverageExercisePrice
$ 2.84 - $ 7.94 . . . . . . . . . . . . . . . . . . . . . . . . . . . . . . . . . . . . . . . . . 366,688 2.11 $ 5.01 223,800 $ 4.13
$ 7.95 - $ 22.48 . . . . . . . . . . . . . . . . . . . . . . . . . . . . . . . . . . . . . . . . 259,080 4.25 $15.73 97,260 $15.38
$ 22.49 - $ 25.85 . . . . . . . . . . . . . . . . . . . . . . . . . . . . . . . . . . . . . . . 358,288 5.20 $25.01 68,354 $24.95
$ 25.86 - $ 32.45 . . . . . . . . . . . . . . . . . . . . . . . . . . . . . . . . . . . . . . . 49,750 5.59 $27.84 10,000 $28.04
$ 32.46 - $ 46.75 . . . . . . . . . . . . . . . . . . . . . . . . . . . . . . . . . . . . . . . 379,602 6.20 $36.02 — $ —
$ 2.84 - $ 46.75 . . . . . . . . . . . . . . . . . . . . . . . . . . . . . . . . . . . . . . . . 1,413,408 4.50 $21.18 399,414 $11.03
The aggregate intrinsic value and remaining contractual term of exercisable stock options at December 31, 2012 was$14.4 million and 2.76 years, respectively. The aggregate intrinsic value and remaining contractual term of all vested optionsand options that are expected to vest are $36.6 million and 4.5 years, respectively. The intrinsic value of options exercisedduring 2012, 2011 and 2010 was $45.8 million, $23.3 million, and $17.5 million, respectively. The total fair value of stockoptions which vested during the years ended December 31, 2012, 2011, and 2010 was approximately $2.8 million,$2.5 million, and $2.3 million, respectively.
As of December 31, 2012, there was $7.8 million of unrecognized compensation cost related to U.S. dollar stock optionswhich is expected to be recognized over a weighted-average period of 2.66 years.
86
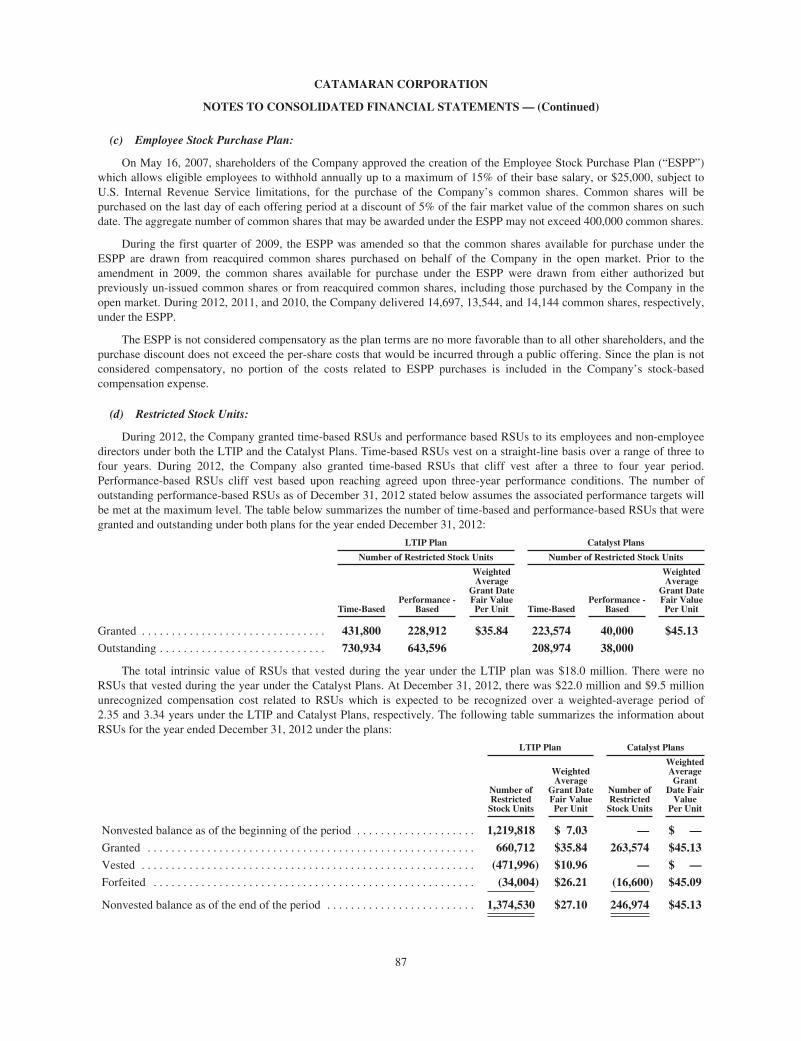
CATAMARAN CORPORATION
NOTES TO CONSOLIDATED FINANCIAL STATEMENTS — (Continued)
(c) Employee Stock Purchase Plan:
On May 16, 2007, shareholders of the Company approved the creation of the Employee Stock Purchase Plan (“ESPP”)which allows eligible employees to withhold annually up to a maximum of 15% of their base salary, or $25,000, subject toU.S. Internal Revenue Service limitations, for the purchase of the Company’s common shares. Common shares will bepurchased on the last day of each offering period at a discount of 5% of the fair market value of the common shares on suchdate. The aggregate number of common shares that may be awarded under the ESPP may not exceed 400,000 common shares.
During the first quarter of 2009, the ESPP was amended so that the common shares available for purchase under theESPP are drawn from reacquired common shares purchased on behalf of the Company in the open market. Prior to theamendment in 2009, the common shares available for purchase under the ESPP were drawn from either authorized butpreviously un-issued common shares or from reacquired common shares, including those purchased by the Company in theopen market. During 2012, 2011, and 2010, the Company delivered 14,697, 13,544, and 14,144 common shares, respectively,under the ESPP.
The ESPP is not considered compensatory as the plan terms are no more favorable than to all other shareholders, and thepurchase discount does not exceed the per-share costs that would be incurred through a public offering. Since the plan is notconsidered compensatory, no portion of the costs related to ESPP purchases is included in the Company’s stock-basedcompensation expense.
(d) Restricted Stock Units:
During 2012, the Company granted time-based RSUs and performance based RSUs to its employees and non-employeedirectors under both the LTIP and the Catalyst Plans. Time-based RSUs vest on a straight-line basis over a range of three tofour years. During 2012, the Company also granted time-based RSUs that cliff vest after a three to four year period.Performance-based RSUs cliff vest based upon reaching agreed upon three-year performance conditions. The number ofoutstanding performance-based RSUs as of December 31, 2012 stated below assumes the associated performance targets willbe met at the maximum level. The table below summarizes the number of time-based and performance-based RSUs that weregranted and outstanding under both plans for the year ended December 31, 2012:
LTIP Plan Catalyst Plans
Number of Restricted Stock Units Number of Restricted Stock Units
Time-BasedPerformance -
Based
WeightedAverage
Grant DateFair ValuePer Unit Time-Based
Performance -Based
WeightedAverage
Grant DateFair ValuePer Unit
Granted . . . . . . . . . . . . . . . . . . . . . . . . . . . . . . . 431,800 228,912 $35.84 223,574 40,000 $45.13
Outstanding . . . . . . . . . . . . . . . . . . . . . . . . . . . . 730,934 643,596 208,974 38,000
The total intrinsic value of RSUs that vested during the year under the LTIP plan was $18.0 million. There were noRSUs that vested during the year under the Catalyst Plans. At December 31, 2012, there was $22.0 million and $9.5 millionunrecognized compensation cost related to RSUs which is expected to be recognized over a weighted-average period of2.35 and 3.34 years under the LTIP and Catalyst Plans, respectively. The following table summarizes the information aboutRSUs for the year ended December 31, 2012 under the plans:
LTIP Plan Catalyst Plans
Number ofRestrictedStock Units
WeightedAverage
Grant DateFair ValuePer Unit
Number ofRestrictedStock Units
WeightedAverageGrant
Date FairValue
Per Unit
Nonvested balance as of the beginning of the period . . . . . . . . . . . . . . . . . . . . 1,219,818 $ 7.03 — $ —
Granted . . . . . . . . . . . . . . . . . . . . . . . . . . . . . . . . . . . . . . . . . . . . . . . . . . . . . . . 660,712 $35.84 263,574 $45.13
Vested . . . . . . . . . . . . . . . . . . . . . . . . . . . . . . . . . . . . . . . . . . . . . . . . . . . . . . . . (471,996) $10.96 — $ —
Forfeited . . . . . . . . . . . . . . . . . . . . . . . . . . . . . . . . . . . . . . . . . . . . . . . . . . . . . . (34,004) $26.21 (16,600) $45.09
Nonvested balance as of the end of the period . . . . . . . . . . . . . . . . . . . . . . . . . 1,374,530 $27.10 246,974 $45.13
87
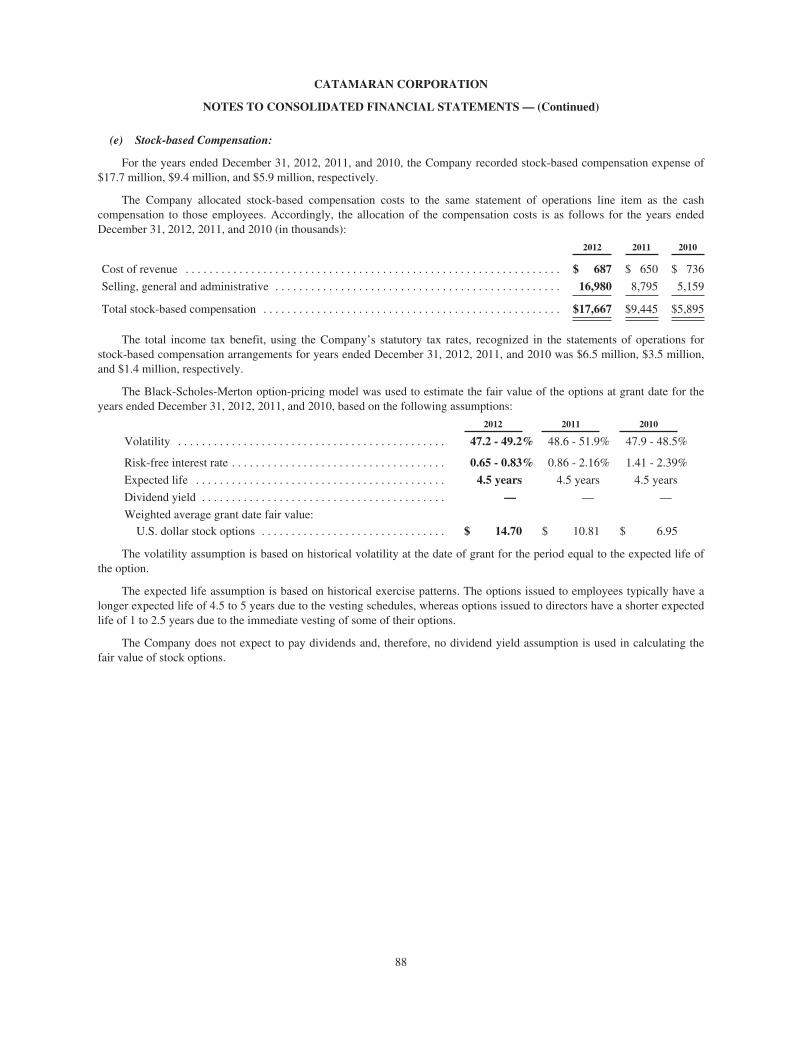
CATAMARAN CORPORATION
NOTES TO CONSOLIDATED FINANCIAL STATEMENTS — (Continued)
(e) Stock-based Compensation:
For the years ended December 31, 2012, 2011, and 2010, the Company recorded stock-based compensation expense of$17.7 million, $9.4 million, and $5.9 million, respectively.
The Company allocated stock-based compensation costs to the same statement of operations line item as the cashcompensation to those employees. Accordingly, the allocation of the compensation costs is as follows for the years endedDecember 31, 2012, 2011, and 2010 (in thousands):
2012 2011 2010
Cost of revenue . . . . . . . . . . . . . . . . . . . . . . . . . . . . . . . . . . . . . . . . . . . . . . . . . . . . . . . . . . . . . . . $ 687 $ 650 $ 736
Selling, general and administrative . . . . . . . . . . . . . . . . . . . . . . . . . . . . . . . . . . . . . . . . . . . . . . . . 16,980 8,795 5,159
Total stock-based compensation . . . . . . . . . . . . . . . . . . . . . . . . . . . . . . . . . . . . . . . . . . . . . . . . . . $17,667 $9,445 $5,895
The total income tax benefit, using the Company’s statutory tax rates, recognized in the statements of operations forstock-based compensation arrangements for years ended December 31, 2012, 2011, and 2010 was $6.5 million, $3.5 million,and $1.4 million, respectively.
The Black-Scholes-Merton option-pricing model was used to estimate the fair value of the options at grant date for theyears ended December 31, 2012, 2011, and 2010, based on the following assumptions:
2012 2011 2010
Volatility . . . . . . . . . . . . . . . . . . . . . . . . . . . . . . . . . . . . . . . . . . . . . 47.2 - 49.2% 48.6 - 51.9% 47.9 - 48.5%
Risk-free interest rate . . . . . . . . . . . . . . . . . . . . . . . . . . . . . . . . . . . . 0.65 - 0.83% 0.86 - 2.16% 1.41 - 2.39%
Expected life . . . . . . . . . . . . . . . . . . . . . . . . . . . . . . . . . . . . . . . . . . 4.5 years 4.5 years 4.5 years
Dividend yield . . . . . . . . . . . . . . . . . . . . . . . . . . . . . . . . . . . . . . . . . — — —
Weighted average grant date fair value:U.S. dollar stock options . . . . . . . . . . . . . . . . . . . . . . . . . . . . . . . $ 14.70 $ 10.81 $ 6.95
The volatility assumption is based on historical volatility at the date of grant for the period equal to the expected life ofthe option.
The expected life assumption is based on historical exercise patterns. The options issued to employees typically have alonger expected life of 4.5 to 5 years due to the vesting schedules, whereas options issued to directors have a shorter expectedlife of 1 to 2.5 years due to the immediate vesting of some of their options.
The Company does not expect to pay dividends and, therefore, no dividend yield assumption is used in calculating thefair value of stock options.
88
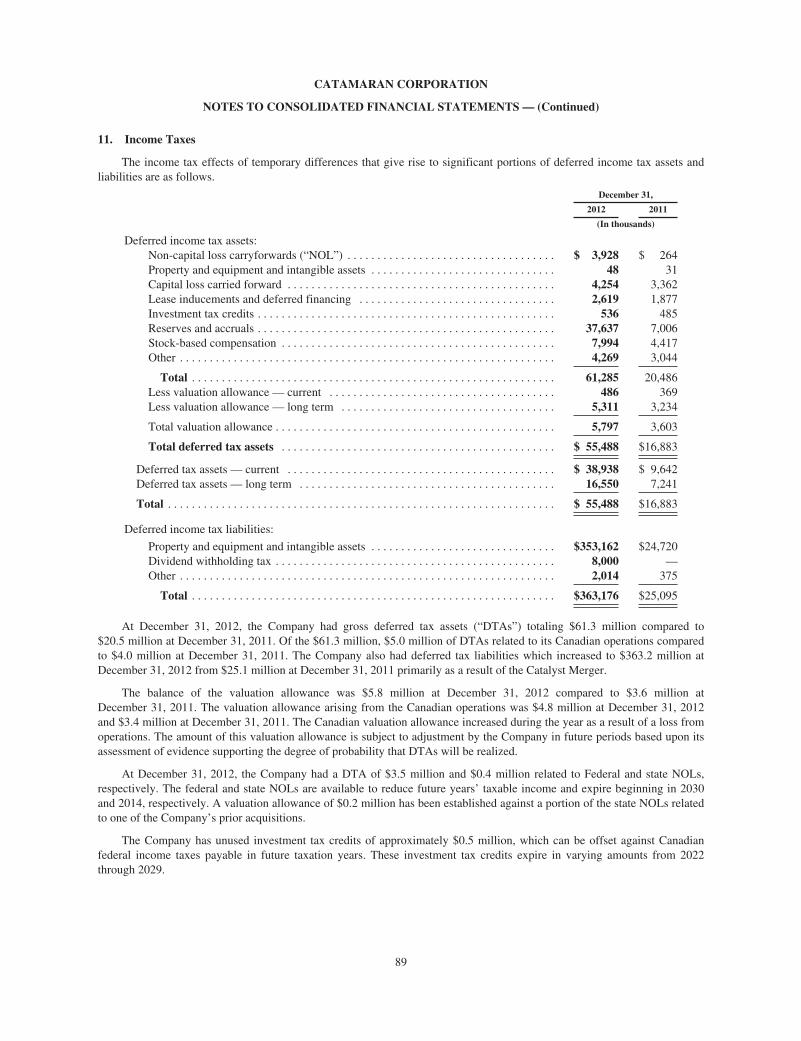
CATAMARAN CORPORATION
NOTES TO CONSOLIDATED FINANCIAL STATEMENTS — (Continued)
11. Income Taxes
The income tax effects of temporary differences that give rise to significant portions of deferred income tax assets andliabilities are as follows.
December 31,
2012 2011
(In thousands)
Deferred income tax assets:Non-capital loss carryforwards (“NOL”) . . . . . . . . . . . . . . . . . . . . . . . . . . . . . . . . . . . $ 3,928 $ 264Property and equipment and intangible assets . . . . . . . . . . . . . . . . . . . . . . . . . . . . . . . 48 31Capital loss carried forward . . . . . . . . . . . . . . . . . . . . . . . . . . . . . . . . . . . . . . . . . . . . . 4,254 3,362Lease inducements and deferred financing . . . . . . . . . . . . . . . . . . . . . . . . . . . . . . . . . 2,619 1,877Investment tax credits . . . . . . . . . . . . . . . . . . . . . . . . . . . . . . . . . . . . . . . . . . . . . . . . . . 536 485Reserves and accruals . . . . . . . . . . . . . . . . . . . . . . . . . . . . . . . . . . . . . . . . . . . . . . . . . . 37,637 7,006Stock-based compensation . . . . . . . . . . . . . . . . . . . . . . . . . . . . . . . . . . . . . . . . . . . . . . 7,994 4,417Other . . . . . . . . . . . . . . . . . . . . . . . . . . . . . . . . . . . . . . . . . . . . . . . . . . . . . . . . . . . . . . . 4,269 3,044
Total . . . . . . . . . . . . . . . . . . . . . . . . . . . . . . . . . . . . . . . . . . . . . . . . . . . . . . . . . . . . . 61,285 20,486Less valuation allowance — current . . . . . . . . . . . . . . . . . . . . . . . . . . . . . . . . . . . . . . 486 369Less valuation allowance — long term . . . . . . . . . . . . . . . . . . . . . . . . . . . . . . . . . . . . 5,311 3,234
Total valuation allowance . . . . . . . . . . . . . . . . . . . . . . . . . . . . . . . . . . . . . . . . . . . . . . . 5,797 3,603
Total deferred tax assets . . . . . . . . . . . . . . . . . . . . . . . . . . . . . . . . . . . . . . . . . . . . . . $ 55,488 $16,883
Deferred tax assets — current . . . . . . . . . . . . . . . . . . . . . . . . . . . . . . . . . . . . . . . . . . . . . $ 38,938 $ 9,642Deferred tax assets — long term . . . . . . . . . . . . . . . . . . . . . . . . . . . . . . . . . . . . . . . . . . . 16,550 7,241
Total . . . . . . . . . . . . . . . . . . . . . . . . . . . . . . . . . . . . . . . . . . . . . . . . . . . . . . . . . . . . . . . . . $ 55,488 $16,883
Deferred income tax liabilities:
Property and equipment and intangible assets . . . . . . . . . . . . . . . . . . . . . . . . . . . . . . . $353,162 $24,720Dividend withholding tax . . . . . . . . . . . . . . . . . . . . . . . . . . . . . . . . . . . . . . . . . . . . . . . 8,000 —Other . . . . . . . . . . . . . . . . . . . . . . . . . . . . . . . . . . . . . . . . . . . . . . . . . . . . . . . . . . . . . . . 2,014 375
Total . . . . . . . . . . . . . . . . . . . . . . . . . . . . . . . . . . . . . . . . . . . . . . . . . . . . . . . . . . . . . $363,176 $25,095
At December 31, 2012, the Company had gross deferred tax assets (“DTAs”) totaling $61.3 million compared to$20.5 million at December 31, 2011. Of the $61.3 million, $5.0 million of DTAs related to its Canadian operations comparedto $4.0 million at December 31, 2011. The Company also had deferred tax liabilities which increased to $363.2 million atDecember 31, 2012 from $25.1 million at December 31, 2011 primarily as a result of the Catalyst Merger.
The balance of the valuation allowance was $5.8 million at December 31, 2012 compared to $3.6 million atDecember 31, 2011. The valuation allowance arising from the Canadian operations was $4.8 million at December 31, 2012and $3.4 million at December 31, 2011. The Canadian valuation allowance increased during the year as a result of a loss fromoperations. The amount of this valuation allowance is subject to adjustment by the Company in future periods based upon itsassessment of evidence supporting the degree of probability that DTAs will be realized.
At December 31, 2012, the Company had a DTA of $3.5 million and $0.4 million related to Federal and state NOLs,respectively. The federal and state NOLs are available to reduce future years’ taxable income and expire beginning in 2030and 2014, respectively. A valuation allowance of $0.2 million has been established against a portion of the state NOLs relatedto one of the Company’s prior acquisitions.
The Company has unused investment tax credits of approximately $0.5 million, which can be offset against Canadianfederal income taxes payable in future taxation years. These investment tax credits expire in varying amounts from 2022through 2029.
89
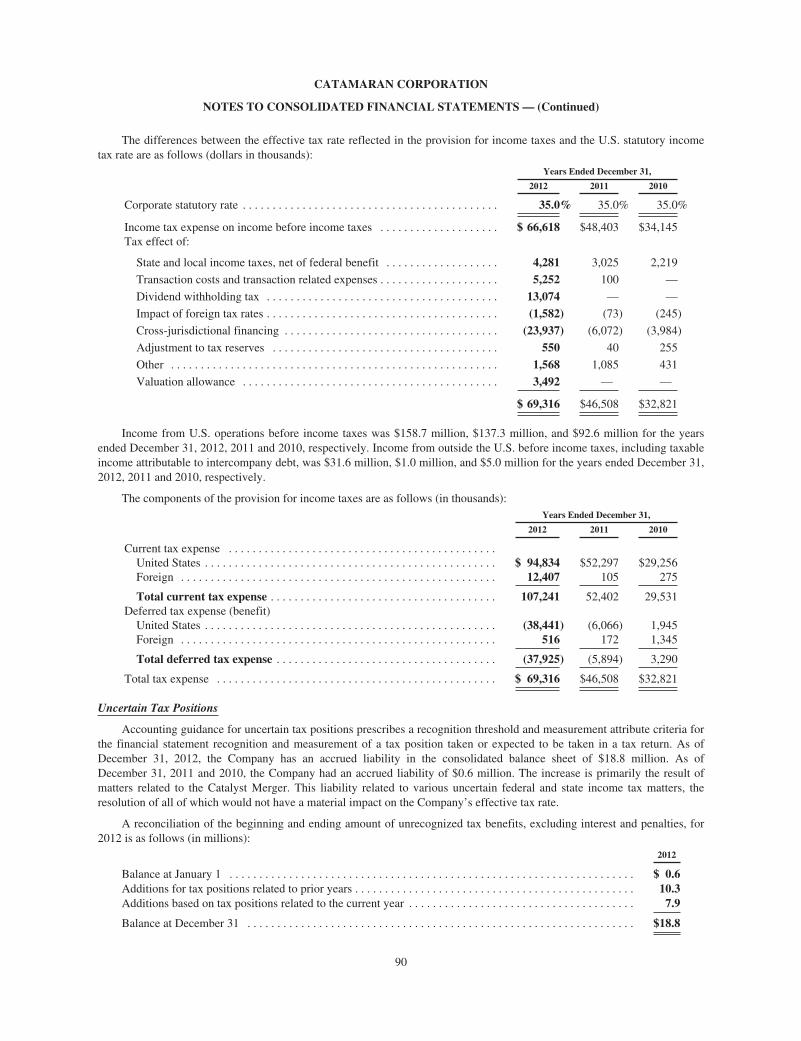
CATAMARAN CORPORATION
NOTES TO CONSOLIDATED FINANCIAL STATEMENTS — (Continued)
The differences between the effective tax rate reflected in the provision for income taxes and the U.S. statutory incometax rate are as follows (dollars in thousands):
Years Ended December 31,
2012 2011 2010
Corporate statutory rate . . . . . . . . . . . . . . . . . . . . . . . . . . . . . . . . . . . . . . . . . . . 35.0% 35.0% 35.0%
Income tax expense on income before income taxes . . . . . . . . . . . . . . . . . . . . $ 66,618 $48,403 $34,145Tax effect of:
State and local income taxes, net of federal benefit . . . . . . . . . . . . . . . . . . . 4,281 3,025 2,219
Transaction costs and transaction related expenses . . . . . . . . . . . . . . . . . . . . 5,252 100 —
Dividend withholding tax . . . . . . . . . . . . . . . . . . . . . . . . . . . . . . . . . . . . . . . 13,074 — —
Impact of foreign tax rates . . . . . . . . . . . . . . . . . . . . . . . . . . . . . . . . . . . . . . . (1,582) (73) (245)
Cross-jurisdictional financing . . . . . . . . . . . . . . . . . . . . . . . . . . . . . . . . . . . . (23,937) (6,072) (3,984)
Adjustment to tax reserves . . . . . . . . . . . . . . . . . . . . . . . . . . . . . . . . . . . . . . 550 40 255
Other . . . . . . . . . . . . . . . . . . . . . . . . . . . . . . . . . . . . . . . . . . . . . . . . . . . . . . . 1,568 1,085 431
Valuation allowance . . . . . . . . . . . . . . . . . . . . . . . . . . . . . . . . . . . . . . . . . . . 3,492 — —
$ 69,316 $46,508 $32,821
Income from U.S. operations before income taxes was $158.7 million, $137.3 million, and $92.6 million for the yearsended December 31, 2012, 2011 and 2010, respectively. Income from outside the U.S. before income taxes, including taxableincome attributable to intercompany debt, was $31.6 million, $1.0 million, and $5.0 million for the years ended December 31,2012, 2011 and 2010, respectively.
The components of the provision for income taxes are as follows (in thousands):Years Ended December 31,
2012 2011 2010
Current tax expense . . . . . . . . . . . . . . . . . . . . . . . . . . . . . . . . . . . . . . . . . . . . .United States . . . . . . . . . . . . . . . . . . . . . . . . . . . . . . . . . . . . . . . . . . . . . . . . . $ 94,834 $52,297 $29,256Foreign . . . . . . . . . . . . . . . . . . . . . . . . . . . . . . . . . . . . . . . . . . . . . . . . . . . . . 12,407 105 275
Total current tax expense . . . . . . . . . . . . . . . . . . . . . . . . . . . . . . . . . . . . . . 107,241 52,402 29,531Deferred tax expense (benefit)United States . . . . . . . . . . . . . . . . . . . . . . . . . . . . . . . . . . . . . . . . . . . . . . . . . (38,441) (6,066) 1,945Foreign . . . . . . . . . . . . . . . . . . . . . . . . . . . . . . . . . . . . . . . . . . . . . . . . . . . . . 516 172 1,345
Total deferred tax expense . . . . . . . . . . . . . . . . . . . . . . . . . . . . . . . . . . . . . (37,925) (5,894) 3,290
Total tax expense . . . . . . . . . . . . . . . . . . . . . . . . . . . . . . . . . . . . . . . . . . . . . . . $ 69,316 $46,508 $32,821
Uncertain Tax Positions
Accounting guidance for uncertain tax positions prescribes a recognition threshold and measurement attribute criteria forthe financial statement recognition and measurement of a tax position taken or expected to be taken in a tax return. As ofDecember 31, 2012, the Company has an accrued liability in the consolidated balance sheet of $18.8 million. As ofDecember 31, 2011 and 2010, the Company had an accrued liability of $0.6 million. The increase is primarily the result ofmatters related to the Catalyst Merger. This liability related to various uncertain federal and state income tax matters, theresolution of all of which would not have a material impact on the Company’s effective tax rate.
A reconciliation of the beginning and ending amount of unrecognized tax benefits, excluding interest and penalties, for2012 is as follows (in millions):
2012
Balance at January 1 . . . . . . . . . . . . . . . . . . . . . . . . . . . . . . . . . . . . . . . . . . . . . . . . . . . . . . . . . . . . . . . . . . . . $ 0.6Additions for tax positions related to prior years . . . . . . . . . . . . . . . . . . . . . . . . . . . . . . . . . . . . . . . . . . . . . . . 10.3Additions based on tax positions related to the current year . . . . . . . . . . . . . . . . . . . . . . . . . . . . . . . . . . . . . . 7.9
Balance at December 31 . . . . . . . . . . . . . . . . . . . . . . . . . . . . . . . . . . . . . . . . . . . . . . . . . . . . . . . . . . . . . . . . . $18.8
90

CATAMARAN CORPORATION
NOTES TO CONSOLIDATED FINANCIAL STATEMENTS — (Continued)
The Company recognizes interest and penalties related to uncertain tax positions in income tax expense. Accrued interestat December 31, 2012 and 2011 was $0.5 million and $0.1 million, respectively. It is reasonably possible that the total amountof unrecognized tax benefits will increase or decrease within twelve months of December 31, 2012. The Company currentlyestimates that such increases or decreases will not be material.
The Company and its subsidiaries file income tax returns in the U.S. federal jurisdiction and various state and foreignjurisdictions, including Canada. With few exceptions, the Company is no longer subject to tax examinations by tax authoritiesfor years prior to 2007.
12. Earnings Per Share
The following table sets forth the computation of basic and diluted EPS for the years ended December 31, 2012, 2011,and 2010 (in thousands, except share and per share data):
2012 2011 2010
Numerator:
Net income available to common shareholders . . . . . . . . . . . . $ 116,658 $ 91,786 $ 64,735
Denominator for basic EPS — weighted average commonshares outstanding . . . . . . . . . . . . . . . . . . . . . . . . . . . . . . . . 166,765,682 124,253,312 121,473,662Effect of dilutive securities:
Restricted stock units . . . . . . . . . . . . . . . . . . . . . . . . . . . . 329,975 462,314 1,105,234Stock options . . . . . . . . . . . . . . . . . . . . . . . . . . . . . . . . . . 734,963 1,187,890 3,694,304
Denominator for diluted EPS . . . . . . . . . . . . . . . . . . . . . . . . 167,830,620 125,903,516 126,273,200
Earnings per share:
Basic . . . . . . . . . . . . . . . . . . . . . . . . . . . . . . . . . . . . . . . . . $ 0.70 $ 0.74 $ 0.53Diluted . . . . . . . . . . . . . . . . . . . . . . . . . . . . . . . . . . . . . . . $ 0.70 $ 0.73 $ 0.51
The Company calculated the number of options and RSUs included in the diluted EPS calculation following the treasurystock method as outlined in earnings per-share accounting guidance. The following represents the stock options and RSUs thatare not included in the calculation of diluted EPS due to their anti-dilutive impact:
December 31,
2012 2011
Anti-dilutive RSUs . . . . . . . . . . . . . . . . . . . . . . . . . . . . . . . . . . . . . . . . . . . . . . . . . . . . . . . 773,509 23,906
Anti-dilutive stock options . . . . . . . . . . . . . . . . . . . . . . . . . . . . . . . . . . . . . . . . . . . . . . . . . 288,532 90,638
1,062,041 114,544
13. Supplemental Cash Flow Information
(a) Other non-cash activities (in thousands):Years Ended December 31,
2012 2011 2010
Contingent purchase price recorded from the SaveDirectRx acquisition . . . . . — $4,225 —Contingent purchase price recorded from the MedfusionRx acquisition . . . . . — — $4,865Equity shares issued as a result of the NMHC acquisition . . . . . . . . . . . . . . . . 4 $ 12 —Equity shares issued as a result of the Catalyst Merger . . . . . . . . . . . . . . . . . . . $3,238,141 $ — —
(b) Cash paid / received for income taxes and interest was as follows for the years ended December 31, 2012, 2011, and2010 (in thousands):
Years Ended December 31,
2012 2011 2010
Income taxes paid . . . . . . . . . . . . . . . . . . . . . . . . . . . . . . . . . . . . . . . . . . . . . . . . $22,052 $30,948 $19,334
Interest paid . . . . . . . . . . . . . . . . . . . . . . . . . . . . . . . . . . . . . . . . . . . . . . . . . . . . . $18,711 $ 1,792 $ 1,351
Interest received . . . . . . . . . . . . . . . . . . . . . . . . . . . . . . . . . . . . . . . . . . . . . . . . . $ 473 $ 502 $ 746
91

CATAMARAN CORPORATION
NOTES TO CONSOLIDATED FINANCIAL STATEMENTS — (Continued)
14. Employee Benefit Plans
The Company has a 401(k) savings plan that allows eligible employees to defer a percentage of their salary, not toexceed $16,500 in 2012 , 2011 and 2010. The Company matches an amount equal to 100% of the first 1% of eligible earningsand 50% of the next 2% through 6% of eligible earnings. All participant contributions are 100% vested. Employercontributions become 20% vested after one year of service and 100% vested after completion of two years of service. For2012, 2011 and 2010, the Company’s contributions to this plan were $4.9 million, $2.3 million, and $1.7 million, respectively.
15. Commitments and Contingencies
(a) Lease Commitments:
The Company maintains operating lease agreements for office space in its main operating locations. The Company alsoleases certain office equipment.
Aggregate future minimum payments in respect of non-cancellable operating lease agreements as of December 31, 2012,which extend until 2025, are as follows (in thousands):
OperatingLeases
2013 . . . . . . . . . . . . . . . . . . . . . . . . . . . . . . . . . . . . . . . . . . . . . . . . . . . . . . . . . . . . . . . . . . . . . . . . . . . . . $ 17,6212014 . . . . . . . . . . . . . . . . . . . . . . . . . . . . . . . . . . . . . . . . . . . . . . . . . . . . . . . . . . . . . . . . . . . . . . . . . . . . . 17,6982015 . . . . . . . . . . . . . . . . . . . . . . . . . . . . . . . . . . . . . . . . . . . . . . . . . . . . . . . . . . . . . . . . . . . . . . . . . . . . . 18,5672016 . . . . . . . . . . . . . . . . . . . . . . . . . . . . . . . . . . . . . . . . . . . . . . . . . . . . . . . . . . . . . . . . . . . . . . . . . . . . . 17,4852017 . . . . . . . . . . . . . . . . . . . . . . . . . . . . . . . . . . . . . . . . . . . . . . . . . . . . . . . . . . . . . . . . . . . . . . . . . . . . . 17,816After 2017 . . . . . . . . . . . . . . . . . . . . . . . . . . . . . . . . . . . . . . . . . . . . . . . . . . . . . . . . . . . . . . . . . . . . . . . . 91,176
$180,363
The total rental expense under operating leases for the years ended December 31, 2012, 2011, and 2010 was$17.1 million, $6.4 million, and $5.7 million, respectively. The lease renewal terms have not been factored into thecommitments noted above as not renewing these leases would not have a detrimental impact on the Company.
(b) Contingencies:
A number of lawsuits were filed by alleged Catalyst stockholders challenging our proposed merger transaction withCatalyst following our announcement on April 18, 2012 that we had entered into a definitive merger agreement with respectto the Merger. The complaints in the actions name as defendants Catalyst, Catalyst’s directors, the Company and certainwholly-owned subsidiaries of the Company (collectively, “the defendants”). Five complaints were filed in two differentvenues: four complaints in the Court of Chancery of the State of Delaware and one in the Circuit Court for MontgomeryCounty of the State of Maryland. The plaintiffs in the purported class action complaints generally alleged, among other things,that (i) the Catalyst directors violated their fiduciary duties in connection with their negotiation of and agreement to themerger agreement and the Merger by, among other things, agreeing to allegedly inadequate consideration and preclusiveterms, (ii) the Company and certain of its wholly-owned subsidiaries allegedly aided and abetted the Catalyst directors’alleged breaches of fiduciary duties and (iii) the joint proxy statement/prospectus of the Company and Catalyst relating to theMerger allegedly included certain materially misleading disclosures and omissions. The plaintiffs sought, among other things,to enjoin the defendants from consummating the Merger and unspecified compensatory damages, together with the costs anddisbursements of the action. On May 25, 2012, the Delaware Court of Chancery issued a decision and order consolidating theDelaware cases. On June 25, 2012, the defendants entered into a memorandum of understanding with respect to a settlementwith the remaining parties to the action in the Court of Chancery in the State of Delaware. Without agreeing that any of theplaintiffs’ claims have merit, the defendants agreed, pursuant to the terms of the memorandum of understanding, to makeadditional disclosures described in the Company’s Current Report on Form 8-K filed June 25, 2012, which supplemented andformed part of the joint proxy statement/prospectus of the Company and Catalyst dated June 1, 2012. In July 2012, theMaryland case was voluntarily dismissed by the plaintiff in that action. On October 24, 2012, the parties to the remainingDelaware cases filed a stipulation of settlement, which is subject to approval by the Delaware Court of Chancery followingnotice to the Catalyst stockholders. At a hearing held on February 5, 2013, the Delaware Court of Chancery, approved theterms of the settlements, dismissed with prejudice all claims against the Company, Catalyst and other defendants and awardedplaintiffs attorney fees in the amount of $450,000, which were subsequently paid in full by the Company. The settlementterms provide that the Delaware cases will be dismissed with prejudice against all defendants. The settlement did not affect
92

CATAMARAN CORPORATION
NOTES TO CONSOLIDATED FINANCIAL STATEMENTS — (Continued)
the amount of the merger consideration paid to the stockholders of Catalyst in the Merger. As of December 31, 2012, theCompany had recorded an immaterial liability in the consolidated financial statements relating to the settlement of this matter.
In addition, from time to time in connection with its operations, the Company is named as a defendant in actions fordamages and costs allegedly sustained by third party plaintiffs. The Company has considered these proceedings and disputes indetermining the necessity of any accruals for losses that are probable and reasonably estimable. In addition, various aspects ofthe Company’s business may subject it to litigation and liability for damages arising from errors in processing the pricing ofprescription drug claims, failure to meet performance measures within certain contracts relating to its services performed, itsability to obtain certain levels of discounts or rebates on prescription purchases from retail pharmacies and drug manufacturersor other actions or omissions. The Company’s recorded accruals are based on estimates developed with consideration given tothe potential merits of claims or quantification of any performance obligations. The Company takes into account its history ofclaims, the limitations of any insurance coverage, advice from outside counsel, and management’s strategy with regard to thesettlement or defense of such claims and obligations. While the ultimate outcome of those claims, lawsuits or performanceobligations cannot be predicted with certainty, the Company believes, based on its understanding of the facts of these claimsand performance obligations, that adequate provisions have been recorded in the accounts where required.
(c) Guarantees:
The Company provides routine indemnification to its customers against liability if the Company’s products infringe on athird party’s intellectual property rights. The maximum amount of these indemnifications cannot be reasonably estimated dueto their uncertain nature. Historically, the Company has not made payments related to these indemnifications.
16. Segment Information
(a) Reportable Segments
The Company manages its business in two segments: PBM and HCIT. The Company and its chief operating decisionmaker evaluates segment performance and allocates resources based upon revenue and gross profit. Selling, general andadministrative expenses, product development, depreciation and amortization, interest and other income and interest expenseare reported as corporate expenses as these are managed on a consolidated basis by the Company. The Merger with Catalystdid not change the Company’s conclusion on its reporting segments.
PBM Segment
The Company provides comprehensive PBM services to customers, which include managed care organizations, localgovernments, unions, corporations, HMOs, employers, workers’ compensation plans, third party health care plan administrators,and federal and state government programs through its network of licensed pharmacies throughout the United States. The PBMservices include electronic point-of-sale pharmacy claims management, retail pharmacy network management, mail and specialtypharmacy claims management, Medicare Part D services, benefit design consultation, preferred drug management programs, drugreview and analysis, consulting services, data access and reporting and information analysis.
Revenue primarily consists of sales of prescription drugs, together with any associated administrative fees, to customersand participants, through the Company’s nationwide network of participating pharmacies and the Company’s own mail andspecialty pharmacies. Revenue and costs related to the sales of prescription drugs is recognized when the claims areadjudicated and the prescription drugs are shipped. Claims are adjudicated at the point-of-sale using an on-line processingsystem. Revenue and costs primarily consists of sales of prescription drugs to customers and participants. These revenues andassociated costs are recognized when the prescription drugs are shipped from the Company’s pharmacy locations.
HCIT Segment
The Company is also a leading provider of HCIT solutions and services to providers, payors and other participants in thepharmaceutical supply chain in North America. The Company’s product offerings include a wide range of software productsfor managing prescription drug programs and for drug prescribing and dispensing. The Company’s solutions are available ona license basis with on-going maintenance and support or on a transaction fee basis using an ASP model. The Company’spayor customers include managed care organizations, Blue Cross Blue Shield organizations, government agencies, employersand intermediaries such as pharmacy benefit managers. The Company’s provider customers include independent, regionalchain, institutional, and mail-order pharmacies. The solutions offered by the Company’s services assist both payors andproviders in managing the complexity and reducing the cost of their prescription drug programs and dispensing activities. TheCompany’s profitability from HCIT depends primarily on revenue derived from transaction processing services, softwarelicense sales, hardware sales, maintenance, and professional services.
93
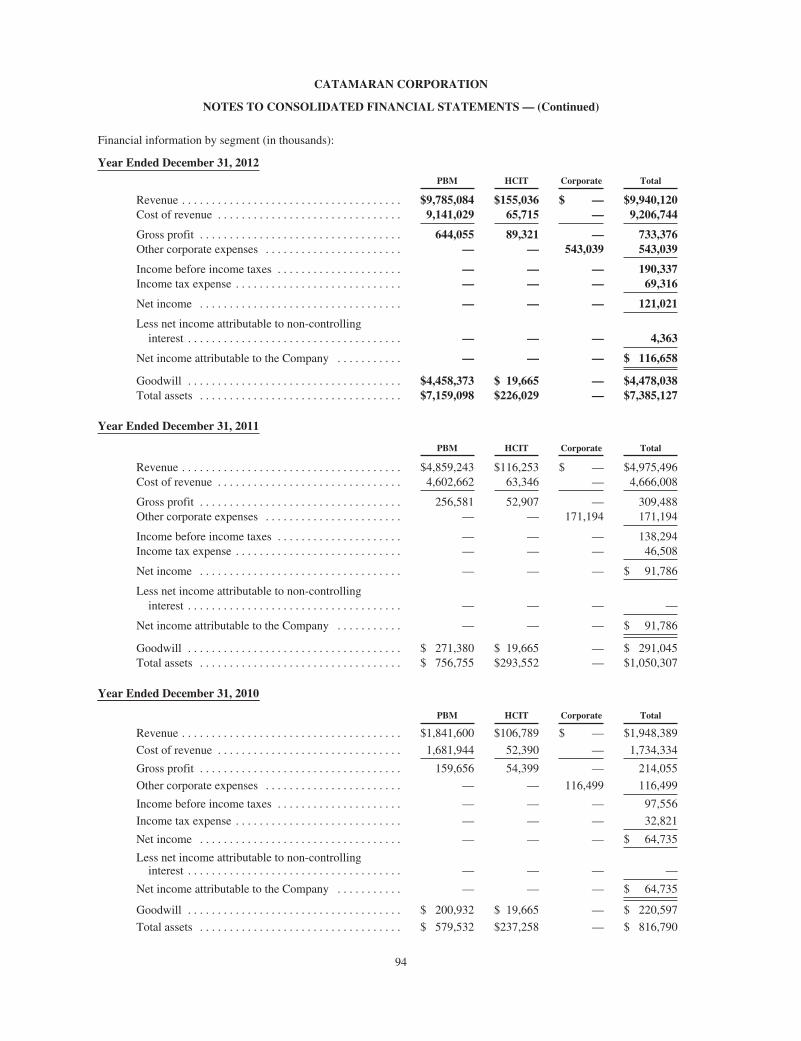
CATAMARAN CORPORATION
NOTES TO CONSOLIDATED FINANCIAL STATEMENTS — (Continued)
Financial information by segment (in thousands):
Year Ended December 31, 2012
PBM HCIT Corporate Total
Revenue . . . . . . . . . . . . . . . . . . . . . . . . . . . . . . . . . . . . . $9,785,084 $155,036 $ — $9,940,120Cost of revenue . . . . . . . . . . . . . . . . . . . . . . . . . . . . . . . 9,141,029 65,715 — 9,206,744
Gross profit . . . . . . . . . . . . . . . . . . . . . . . . . . . . . . . . . . 644,055 89,321 — 733,376Other corporate expenses . . . . . . . . . . . . . . . . . . . . . . . — — 543,039 543,039
Income before income taxes . . . . . . . . . . . . . . . . . . . . . — — — 190,337Income tax expense . . . . . . . . . . . . . . . . . . . . . . . . . . . . — — — 69,316
Net income . . . . . . . . . . . . . . . . . . . . . . . . . . . . . . . . . . — — — 121,021
Less net income attributable to non-controllinginterest . . . . . . . . . . . . . . . . . . . . . . . . . . . . . . . . . . . . — — — 4,363
Net income attributable to the Company . . . . . . . . . . . — — — $ 116,658
Goodwill . . . . . . . . . . . . . . . . . . . . . . . . . . . . . . . . . . . . $4,458,373 $ 19,665 — $4,478,038Total assets . . . . . . . . . . . . . . . . . . . . . . . . . . . . . . . . . . $7,159,098 $226,029 — $7,385,127
Year Ended December 31, 2011
PBM HCIT Corporate Total
Revenue . . . . . . . . . . . . . . . . . . . . . . . . . . . . . . . . . . . . . $4,859,243 $116,253 $ — $4,975,496Cost of revenue . . . . . . . . . . . . . . . . . . . . . . . . . . . . . . . 4,602,662 63,346 — 4,666,008
Gross profit . . . . . . . . . . . . . . . . . . . . . . . . . . . . . . . . . . 256,581 52,907 — 309,488Other corporate expenses . . . . . . . . . . . . . . . . . . . . . . . — — 171,194 171,194
Income before income taxes . . . . . . . . . . . . . . . . . . . . . — — — 138,294Income tax expense . . . . . . . . . . . . . . . . . . . . . . . . . . . . — — — 46,508
Net income . . . . . . . . . . . . . . . . . . . . . . . . . . . . . . . . . . — — — $ 91,786
Less net income attributable to non-controllinginterest . . . . . . . . . . . . . . . . . . . . . . . . . . . . . . . . . . . . — — — —
Net income attributable to the Company . . . . . . . . . . . — — — $ 91,786
Goodwill . . . . . . . . . . . . . . . . . . . . . . . . . . . . . . . . . . . . $ 271,380 $ 19,665 — $ 291,045Total assets . . . . . . . . . . . . . . . . . . . . . . . . . . . . . . . . . . $ 756,755 $293,552 — $1,050,307
Year Ended December 31, 2010
PBM HCIT Corporate Total
Revenue . . . . . . . . . . . . . . . . . . . . . . . . . . . . . . . . . . . . . $1,841,600 $106,789 $ — $1,948,389
Cost of revenue . . . . . . . . . . . . . . . . . . . . . . . . . . . . . . . 1,681,944 52,390 — 1,734,334
Gross profit . . . . . . . . . . . . . . . . . . . . . . . . . . . . . . . . . . 159,656 54,399 — 214,055
Other corporate expenses . . . . . . . . . . . . . . . . . . . . . . . — — 116,499 116,499
Income before income taxes . . . . . . . . . . . . . . . . . . . . . — — — 97,556
Income tax expense . . . . . . . . . . . . . . . . . . . . . . . . . . . . — — — 32,821
Net income . . . . . . . . . . . . . . . . . . . . . . . . . . . . . . . . . . — — — $ 64,735
Less net income attributable to non-controllinginterest . . . . . . . . . . . . . . . . . . . . . . . . . . . . . . . . . . . . — — — —
Net income attributable to the Company . . . . . . . . . . . — — — $ 64,735
Goodwill . . . . . . . . . . . . . . . . . . . . . . . . . . . . . . . . . . . . $ 200,932 $ 19,665 — $ 220,597
Total assets . . . . . . . . . . . . . . . . . . . . . . . . . . . . . . . . . . $ 579,532 $237,258 — $ 816,790
94

CATAMARAN CORPORATION
NOTES TO CONSOLIDATED FINANCIAL STATEMENTS — (Continued)
(b) Geographic Information
Revenues of the Company are primarily earned in the United States. The Company’s Canadian operations representedless than 1.0% of the Company’s consolidated revenue for the years ended December 31, 2012, 2011 and 2010.
(c) Major Customers
During the year ended December 31, 2012, one customer accounted for 31% of total revenue. During the year endedDecember 31, 2011, one customer accounted for 40% of total revenue. During the year ended December 31, 2010, onecustomer accounted for 10% of total revenue. In 2012, 2011 and 2010, these major customers were included in the PBMsegment.
At December 31, 2012, one customer accounted for 13% of the total accounts receivable balance and another customeraccounted for 12% of the total accounts receivable balance. At December 31, 2011, one customer accounted for 16% of thetotal accounts receivable balance.
17. Financial Instruments
(a) Credit risk:
The Company is subject to concentrations of credit risk through cash and cash equivalents and accounts receivable. TheCompany monitors the credit risk and credit standing of counterparties on a regular basis.
(b) Interest rate risk:
To manage credit risks, the Company selects counterparties based on credit assessments, limits overall exposure to anysingle counterparty, and monitors the market position with each counterparty. The Company assesses interest rate cash flowrisk by continually identifying and monitoring changes in interest rate exposures that may adversely impact expected futurecash flows and by evaluating hedging opportunities.
The Company used variable rate debt to assist in financing its Merger with Catalyst. The Company is subject to interestrate risk related to the variable rate debt. When interest rates increase, interest expense could increase. Conversely, wheninterest rates decrease, interest expense could also decrease.
In order to manage fluctuations in cash flows resulting from interest rate risk attributable to changes in the benchmarkinterest rates, the Company entered into 3-year interest rate swap agreements with a total notional amount of $500 million tofix the variable LIBOR rate on the Company’s term loan to 0.52%, resulting in an effective rate of 2.52% after adding the2.00% margin per the 2012 Credit Agreement. Under the interest rate swap, the Company receives LIBOR-based variableinterest rate payments and makes fixed interest rate payments, thereby creating the equivalent to fixed-rate debt with respectto the notional amount of such swap agreements. These interest rate contract derivative instruments were designated as cashflow hedges upon inception in December 2012.
The Company assesses interest rate cash flow risk by continually identifying and monitoring changes in interest rateexposures that may adversely impact expected future cash flows and by evaluating hedging opportunities. The Company doesnot enter into derivative instruments for any purpose other than hedging identified exposures. That is, the Company does notspeculate using derivative instruments and has not designated any instruments as fair value hedges or hedges of the foreigncurrency exposure of a net investment in foreign operations.
(c) Fair values:
The fair value of the interest rate swap liability as of December 31, 2012 was $2.6 million. Interest expense for the yearended December 31, 2012 includes $0.4 million of interest expense reclassified from other comprehensive income into currentearnings. As of December 31, 2012, approximately $1.4 million of deferred expenses related to the derivative instrumentsaccumulated in other comprehensive income is expected to be reclassified as interest expense during the next twelve months.This expectation is based on the expected timing of the occurrence of the hedged forecasted transactions.
The estimated fair value of the Company’s financial instruments has been determined based on the Company’sassessment of available market information and appropriate valuation methodologies. However, these estimates may notnecessarily be indicative of the amounts that the Company could realize in a current market exchange. See Note 18 for theCompany’s disclosure on the fair value of derivative instruments.
95
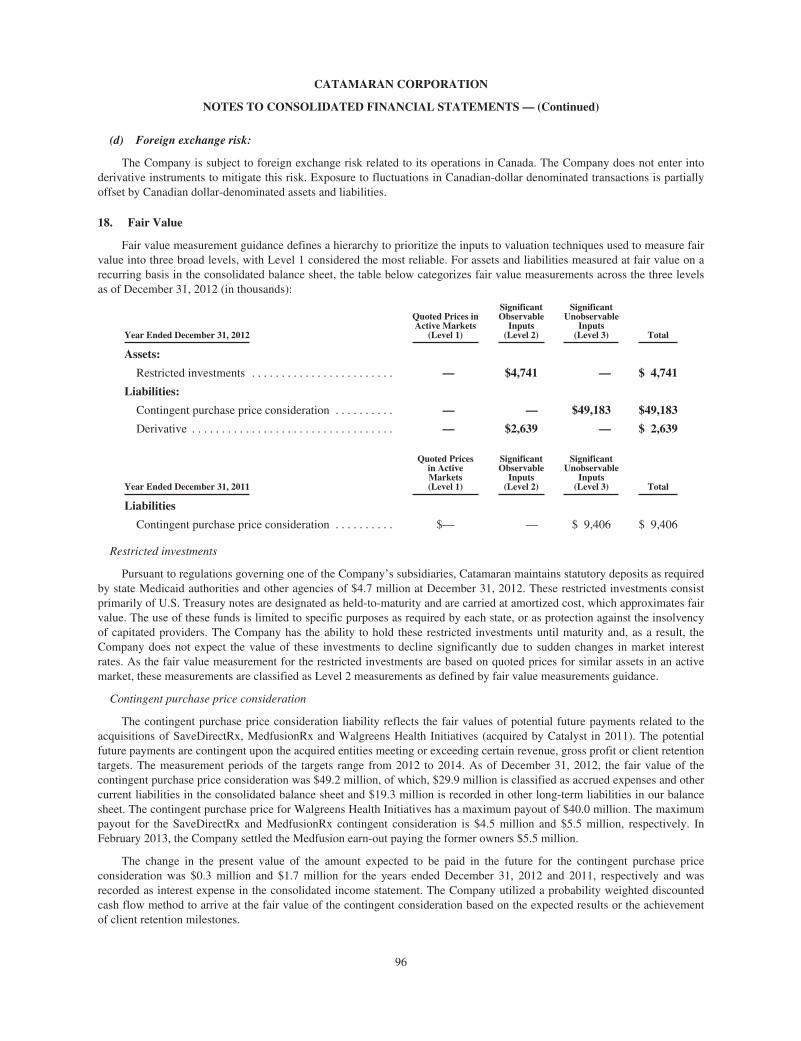
CATAMARAN CORPORATION
NOTES TO CONSOLIDATED FINANCIAL STATEMENTS — (Continued)
(d) Foreign exchange risk:
The Company is subject to foreign exchange risk related to its operations in Canada. The Company does not enter intoderivative instruments to mitigate this risk. Exposure to fluctuations in Canadian-dollar denominated transactions is partiallyoffset by Canadian dollar-denominated assets and liabilities.
18. Fair Value
Fair value measurement guidance defines a hierarchy to prioritize the inputs to valuation techniques used to measure fairvalue into three broad levels, with Level 1 considered the most reliable. For assets and liabilities measured at fair value on arecurring basis in the consolidated balance sheet, the table below categorizes fair value measurements across the three levelsas of December 31, 2012 (in thousands):
Year Ended December 31, 2012
Quoted Prices inActive Markets
(Level 1)
SignificantObservable
Inputs(Level 2)
SignificantUnobservable
Inputs(Level 3) Total
Assets:
Restricted investments . . . . . . . . . . . . . . . . . . . . . . . . — $4,741 — $ 4,741
Liabilities:
Contingent purchase price consideration . . . . . . . . . . — — $49,183 $49,183
Derivative . . . . . . . . . . . . . . . . . . . . . . . . . . . . . . . . . . — $2,639 — $ 2,639
Year Ended December 31, 2011
Quoted Pricesin ActiveMarkets(Level 1)
SignificantObservable
Inputs(Level 2)
SignificantUnobservable
Inputs(Level 3) Total
Liabilities
Contingent purchase price consideration . . . . . . . . . . $— — $ 9,406 $ 9,406
Restricted investments
Pursuant to regulations governing one of the Company’s subsidiaries, Catamaran maintains statutory deposits as requiredby state Medicaid authorities and other agencies of $4.7 million at December 31, 2012. These restricted investments consistprimarily of U.S. Treasury notes are designated as held-to-maturity and are carried at amortized cost, which approximates fairvalue. The use of these funds is limited to specific purposes as required by each state, or as protection against the insolvencyof capitated providers. The Company has the ability to hold these restricted investments until maturity and, as a result, theCompany does not expect the value of these investments to decline significantly due to sudden changes in market interestrates. As the fair value measurement for the restricted investments are based on quoted prices for similar assets in an activemarket, these measurements are classified as Level 2 measurements as defined by fair value measurements guidance.
Contingent purchase price consideration
The contingent purchase price consideration liability reflects the fair values of potential future payments related to theacquisitions of SaveDirectRx, MedfusionRx and Walgreens Health Initiatives (acquired by Catalyst in 2011). The potentialfuture payments are contingent upon the acquired entities meeting or exceeding certain revenue, gross profit or client retentiontargets. The measurement periods of the targets range from 2012 to 2014. As of December 31, 2012, the fair value of thecontingent purchase price consideration was $49.2 million, of which, $29.9 million is classified as accrued expenses and othercurrent liabilities in the consolidated balance sheet and $19.3 million is recorded in other long-term liabilities in our balancesheet. The contingent purchase price for Walgreens Health Initiatives has a maximum payout of $40.0 million. The maximumpayout for the SaveDirectRx and MedfusionRx contingent consideration is $4.5 million and $5.5 million, respectively. InFebruary 2013, the Company settled the Medfusion earn-out paying the former owners $5.5 million.
The change in the present value of the amount expected to be paid in the future for the contingent purchase priceconsideration was $0.3 million and $1.7 million for the years ended December 31, 2012 and 2011, respectively and wasrecorded as interest expense in the consolidated income statement. The Company utilized a probability weighted discountedcash flow method to arrive at the fair value of the contingent consideration based on the expected results or the achievementof client retention milestones.
96

CATAMARAN CORPORATION
NOTES TO CONSOLIDATED FINANCIAL STATEMENTS — (Continued)
As the fair value measurement for the contingent consideration is based on inputs not observed in the market, thesemeasurements are classified as Level 3 measurements as defined by fair value measurements guidance.
Derivatives
Derivative liabilities relate to the interest rate swap (refer to Note 17 — Financial Instruments for further information),which had a fair value of $2.6 million as of December 31, 2012. The fair value adjustment for the year ended December 31,2012 is $0.4 million and was recognized as interest expense in the consolidated statements of operations. As the fair valuemeasurement for the derivative instruments are based on quoted prices from a financial institution, these measurements areclassified as Level 2 measurements as defined by fair value measurements guidance.
During 2012 and 2011, there were no movements of fair value measurements between levels 1, 2 and 3.
19. Supplemental Information
BeginningBalance
Charged toExpense Adjustments
EndingBalance
(In thousands)
Allowance for doubtful accounts
Year Ended December 31, 2012 . . . . . . . . . . . . . . . . . . . . . . . . . . . . . . . . . . . . $2,725 3,328 1,846 $7,899Year Ended December 31, 2011 . . . . . . . . . . . . . . . . . . . . . . . . . . . . . . . . . . . . $3,553 (301) (527) $2,725Year Ended December 31, 2010 . . . . . . . . . . . . . . . . . . . . . . . . . . . . . . . . . . . . $2,871 1,219 (537) $3,553
BeginningBalance
Charged toExpense Adjustments
EndingBalance
(In thousands)
Valuation allowance for deferred tax assets
Year Ended December 31, 2012 . . . . . . . . . . . . . . . . . . . . . . . . . . . . . . . . . . . . $3,603 2,194 — $5,797Year Ended December 31, 2011 . . . . . . . . . . . . . . . . . . . . . . . . . . . . . . . . . . . . $3,714 (111) — $3,603Year Ended December 31, 2010 . . . . . . . . . . . . . . . . . . . . . . . . . . . . . . . . . . . . $3,649 65 — $3,714
97
ITEM 9. CHANGES IN AND DISAGREEMENTS WITH ACCOUNTANTS ON ACCOUNTING AND FINANCIALDISCLOSURE
None.
ITEM 9A. CONTROLS AND PROCEDURES
Evaluation of Disclosure Controls and Procedures
We conducted an evaluation (under the supervision and with the participation of our management, including the ChiefExecutive Officer and Chief Financial Officer), pursuant to Rule 13a-15 promulgated under the Securities Exchange Act of1934 (the “Exchange Act”), of the effectiveness of our disclosure controls and procedures as of December 31, 2012 (the“Evaluation Date”), which is the end of the period covered by this Annual Report on Form 10-K. Based on this evaluation,our Chief Executive Officer and Chief Financial Officer concluded that as of the Evaluation Date such disclosure controls andprocedures were effective to ensure that information required to be disclosed by us in the reports we file or submit under theExchange Act, is recorded, processed, summarized and reported within the time periods specified in the SEC’s rules andforms, and were effective to ensure that the information required to be disclosed in the reports filed or submitted by theCompany under the Exchange Act was accumulated and communicated to management, including the Chief ExecutiveOfficer and Chief Financial Officer, to allow timely decisions regarding required disclosure.
Management’s Report on Internal Control Over Financial Reporting
The Company’s management is responsible for establishing and maintaining adequate internal control over financialreporting, as such term is defined in Exchange Act Rule 13a-15(f). Our internal control system was designed to providereasonable assurance regarding the reliability of financial reporting and the preparation of financial statements for externalpurposes in accordance with generally accepted accounting principles and includes those policies and procedures that:(1) pertain to the maintenance of records that in reasonable detail accurately and fairly reflect the transactions and dispositionsof the assets of the Company; (2) provide reasonable assurance that transactions are recorded as necessary to permitpreparation of financial statements in accordance with generally accepted accounting principles, and that receipts andexpenditures of the Company are being made only in accordance with authorizations of management and directors of theCompany; and (3) provide reasonable assurance regarding prevention or timely detection of unauthorized acquisition, use ordisposition of the Company’s assets that could have a material effect on the financial statements. All internal control systems,no matter how well designed, have inherent limitations. Therefore, even those systems determined to be effective can provideonly reasonable assurance with respect to financial statement preparation and presentation.
Management assessed the effectiveness of our internal control over financial reporting as of December 31, 2012, basedon the criteria set forth in the Internal Control — Integrated Framework issued by the Committee of Sponsoring Organizationsof the Treadway Commission (“COSO”). Based on this assessment, management has concluded that, as of December 31,2012, our internal control over financial reporting is effective. The effectiveness of the Company’s internal control overfinancial reporting as of December 31, 2012, has been audited by KPMG LLP, an independent registered public accountingfirm, as stated in their audit report, included herein.
Except as described below, there were no changes in our internal control over financial reporting (as such term is definedin Exchange Act Rule 13a-15(f)) that occurred during our last fiscal quarter that have materially affected, or are reasonablylikely to materially affect, our internal control over financial reporting.
On July 2, 2012, the Company completed its Merger with Catalyst. We are currently integrating policies, processes,technology and operations and will continue to evaluate our internal control over financial reporting as we develop andexecute our integration plans. Until the companies are fully integrated, we will maintain the operational integrity of eachcompany’s legacy internal controls over financial reporting.
ITEM 9B. OTHER INFORMATION
None
98
PART III
ITEM 10. DIRECTORS, EXECUTIVE OFFICERS AND CORPORATE GOVERNANCE
Information relating to directors is contained in the “Matters to be Acted Upon at the Meeting — Election of Directors”section in the Proxy Statement and is incorporated herein by reference.
Information relating to executive officers is contained in the “Executive Officers” section in the Proxy Statement, and isincorporated herein by reference.
Information relating to compliance with Section 16(a) of the Securities Exchange Act of 1934 is contained in the“Section 16(a) Beneficial Ownership Reporting Compliance” section in the Proxy Statement, and is incorporated herein byreference.
Information relating to the audit committee and the audit committee financial expert is contained in the “Report of theAudit Committee” and “Statement of Corporate Governance Practices” sections in the Proxy Statement and is incorporatedherein by reference.
The Company’s Code of Business Conduct and Ethics applies to all directors, officers and employees. You can find theCode of Business Conduct and Ethics on the “Corporate Governance” section of the Company’s Investor Relations websitelocated at www.catamaranrx.com. The Company will post any amendments to the Code of Business Conduct and Ethics, andany waivers that are required to be disclosed by the rules of either the SEC or NASDAQ, on its Internet site.
ITEM 11. EXECUTIVE COMPENSATION
Information relating to executive and director compensation is contained in the “Executive Compensation” section in theProxy Statement, and is incorporated herein by reference.
The material incorporated herein by reference to the information set forth under the subheading “CompensationCommittee Report” contained in the “Executive Compensation” section in the Proxy Statement shall be deemed furnished,and not filed, in this Form 10-K and shall not be deemed incorporated by reference into any filing under the Securities Act of1933 or the Securities Exchange Act of 1934 as a result of this furnishing, except to the extent that is specifically incorporatedby reference by the Company.
Information relating to compensation committee interlocks and insider participation is incorporated herein by referenceto the information under the heading “Compensation Committee Interlocks and Insider Participation” in the Proxy Statement.
ITEM 12. SECURITY OWNERSHIP OF CERTAIN BENEFICIAL OWNERS AND MANAGEMENT AND RELATEDSTOCKHOLDER MATTERS
Information relating to security ownership of certain beneficial owners and management is contained in the “VotingSecurities and Principal Shareholders Thereof” section in the Proxy Statement, and is incorporated herein by reference.
Information related to compensation plans under which our equity securities are authorized for issuance as ofDecember 31, 2012 is set forth in the table below.
Plan Category
Number of Securitiesto be Issued Upon
Exercise ofOutstanding Equity
Awards
Weighted AverageExercise Price of
Outstanding Options
Number of SecuritiesRemaining Available forFuture Issuance UnderEquity Compensation
Plans
Equity compensation plans approved bysecurity holders(1) . . . . . . . . . . . . . . . . . . . . 2,833,512 (2) 6,592,661
Equity compensation plans not approved bysecurity holders(3) . . . . . . . . . . . . . . . . . . . . 246,974 — 1,127,090
(1) The Long Term Incentive Plan (“LTIP”) provides for the grant of stock option awards, stock appreciation rights, restrictedstock awards, restricted stock unit awards, performance awards and other stock-based awards to eligible persons,including executive officers and directors of the Company.
(2) At December 31, 2012, the Company had outstanding 45,574 options denominated in Canadian dollars with a weightedaverage exercise price of C$3.53. There are 1,413,408 options outstanding that are denominated in U.S. dollars with aweighted average exercise price of $21.18. The remaining 1,374,530 securities outstanding are unvested RSUs with aweighted average grant date fair value of $27.10 per unit.
99

(3) In connection with the completion of the Catalyst Merger on July 2, 2012, the Company assumed the 2003 HealthExtras,Inc. Equity Incentive Plan (the “Catalyst 2003 Plan”) and the Catalyst Health Solutions, Inc. 2006 Stock Incentive Plan(the “Catalyst 2006 Plan” and, together with the 2003 Plan, the “Catalyst Plans”). Although the former public stockholdersof Catalyst approved the Catalyst Plans, the Company’s stockholders have not approved the Catalyst Plans. New awardsunder the Catalyst Plans may not be made to any persons who were employees of Catamaran (formerly SXC HealthSolutions) and its subsidiaries at the time of the completion of the Catalyst Merger. Unless sooner terminated, the Catalyst2003 Plan will terminate on March 4, 2013, and the Catalyst 2006 Plan will terminate on April 7, 2020. Currently, theCompany’s Board of Directors may terminate or amend the Catalyst Plans at any time, subject to applicable NASDAQand TSX stockholder approval requirements. The Catalyst 2003 Plan provides for the grant of stock options and restrictedstock awards, and the Catalyst 2006 Plan provides for the grant of stock options, stock appreciation rights (SARs),restricted stock awards, restricted stock unit (RSU) awards, performance awards and other stock-based awards. Any full-value awards (i.e., any awards other than stock options or SARs) granted under the Catalyst 2006 Plan are counted as 1.45shares for every one share granted for the purpose of determining the number of remaining common shares available forfuture issuance under the Catalyst 2006 Plan. The Company’s Compensation Committee has the exclusive authority toadminister the Catalyst Plans, including the power to determine eligibility, the types and sizes of awards, the price andtiming of awards and the acceleration or waiver of any vesting restriction. At December 31, 2012, the Company hadoutstanding 246,974 unvested RSUs under the Catalyst 2006 Plan with a weighted average grant date fair value of $45.13per unit.
ITEM 13. CERTAIN RELATIONSHIPS AND RELATED TRANSACTIONS, AND DIRECTOR INDEPENDENCE
Information about certain relationships and related transactions and director independence is contained in the “RelatedParty Transactions” and “Statement of Corporate Governance Practices — Board of Directors — Board Composition andDirector Independence” sections in the Proxy Statement, and is incorporated herein by reference.
ITEM 14. PRINCIPAL ACCOUNTANT FEES AND SERVICES
Information on principal accountant fees and services is contained in the “Matters to be Acted Upon at the Meeting —Appointment of Independent Registered Public Accountants” section in the Proxy Statement, and is incorporated herein byreference.
PART IV
ITEM 15. EXHIBITS AND FINANCIAL STATEMENT SCHEDULES
1) Financial Statements:
See Item 8, Financial Statements and Supplementary Data, filed herewith, for a list of financial statements.
2) Financial Statement Schedules:
All financial statement schedules have been omitted because the information either is not required or is otherwiseincluded in the consolidated financial statements and notes thereto.
3) Exhibits Filed:
See the Exhibit Index following the signature page to this Annual Report on Form 10-K, which is incorporated herein byreference. Each management contract and compensatory plan or arrangement required to be filed as an exhibit to this annualreport is identified in the Exhibit Index by a cross following its exhibit number.
100
SIGNATURES
Pursuant to the requirements of Section 13 or 15(d) of the Securities Exchange Act of 1934, the registrant has dulycaused this report to be signed on its behalf by the undersigned, thereunto duly authorized, on March 1, 2013.
CATAMARAN CORPORATION
By: /s/ Mark A. Thierer
Mark A. ThiererChairman and Chief Executive Officer
Pursuant to the requirements of the Securities Exchange Act of 1934, this report has been signed below by the followingpersons on behalf of the registrant in the capacity and on the dates indicated.
By: /s/ Mark A. Thierer
Mark A. Thierer
Chairman and Chief Executive Officer(Principal Executive Officer and Director)
March 1, 2013
By: /s/ Jeffrey G. Park
Jeffrey G. Park
Chief Financial Officer and Executive VicePresident, Finance
(Principal Financial and Accounting Officer)
March 1, 2013
By: /s/ Peter J. Bensen
Peter J. Bensen
Director March 1, 2013
By: /s/ Steven D Cosler
Steven D Cosler
Director March 1, 2013
By: /s/ William J. Davis
William J. Davis
Director March 1, 2013
By: /s/ Steven B. Epstein
Steven B. Epstein
Director March 1, 2013
By: /s/ Betsy D. Holden
Betsy D. Holden
Director March 1, 2013
By: /s/ Karen L. Katen
Karen L. Katen
Director March 1, 2013
By: /s/ Harry M. Kraemer
Harry M. Kraemer
Director March 1, 2013
By: /s/ Anthony R. Masso
Anthony R. Masso
Director March 1, 2013
101
Exhibit Index
ExhibitNumber Description of Document Reference
2.1 Purchase Agreement, dated as of December 1, 2010,among MedfusionRx, L.L.C., Medtown South, L.L.C,the members of Medfusion identified therein, RonCunningham, in his capacity as Selling PartyRepresentative, and SXC Health Solutions, Inc.*
Incorporated herein by reference to Exhibit 2.1 to theCompany’s Current Report on Form 8-K filed onDecember 29, 2010
2.2 Unit Purchase Agreement, dated as of November 16,2011, among SXC Health Solutions, Inc., HealthTranLLC, HealthTrans Data Services, LLC, ABRY SeniorEquity II, L.P., ASE II-A HealthTran, L.P., ABRYSenior Equity Co-Investment, L.P., The Jack and MaryMcClurg Exempt Trust, The Hutchison Family ExemptTrust, Jack W. McClurg, individually and as trustee ofThe Jack and Mary McClurg Exempt Trust, Louis W.Hutchison, Jr., individually and as trustee of TheHutchison Family Exempt Trust, and HealthTrans DataServices, LLC, in its capacity as the Sellers’ Agentthereunder*
Incorporated herein by reference to Exhibit 2.1 to theCompany’s Current Report on Form 8-K filed onJanuary 5, 2012
2.3 Agreement and Plan of Merger, dated as of April 17,2012, among SXC Health Solutions Corp., SXC HealthSolutions, Inc., Catamaran I Corp., Catamaran II LLCand Catalyst Health Solutions, Inc.*
Incorporated herein by reference to Exhibit 2.1 to theCompany’s Current Report on Form 8-K filed on April20, 2012
2.4 Amendment to Agreement and Plan of Merger, datedas of June 29, 2012, among SXC Health SolutionsCorp., SXC Health Solutions, Inc., Catamaran I Corp.,Catamaran II LLC and Catalyst Health Solutions, Inc.*
Incorporated herein by reference to Exhibit 2.1 to theCompany’s Current Report on Form 8-K filed onJune 29, 2012
2.5 Stock Purchase Agreement, dated as of March 8, 2011,between Walgreen Co. and Catalyst Health Solutions,Inc.*
Incorporated herein by reference to Exhibit 2.1 toCatalyst Health Solutions Inc.’s Current Report onForm 8-K filed on March 14, 2011
3.1 Articles of Continuance, as amended through July 3,2012, of Catamaran Corporation (formerly named SXCHealth Solutions Corp. and Systems Xcellence Inc.)
Incorporated herein by reference to Exhibit 3.1 to theCompany’s Quarterly Report on Form 10-Q filed onAugust 3, 2012
3.2 Amended and Restated Bylaws of CatamaranCorporation, as amended through July 3, 2012
Incorporated herein by reference to Exhibit 3.2 to theCompany’s Quarterly Report on Form 10-Q filed onAugust 3, 2012
4.1 Specimen of Common Stock Certificate Filed herewith
10.1† SXC Health Solutions Corp. Second Amended andRestated Long-Term Incentive Plan
Incorporated herein by reference to Annex G to theCompany’s Definitive Joint Proxy Statement/Prospectus filed on June 1, 2012
10.2† Form of SXC Health Solutions Corp. Stock OptionAgreement for certain Employees under the SXCHealth Solutions Corp. Long-Term Incentive Plan
Incorporated herein by reference to Exhibit 10.2 to theCompany’s Quarterly Report on Form 10-Q filed onAugust 7, 2009
10.3† Form of SXC Health Solutions Corp. Time-VestingRestricted Stock Unit Award Agreement for certainEmployees under the SXC Health Solutions Corp.Long-Term Incentive Plan
Incorporated herein by reference to Exhibit 10.3 to theCompany’s Quarterly Report on Form 10-Q filed onAugust 7, 2009
10.4† Form of SXC Health Solutions Corp. Time-VestingRestricted Stock Unit Award Agreement for Non-Employee Directors under the SXC Health SolutionsCorp. Long-Term Incentive Plan
Incorporated herein by reference to Exhibit 10.4 to theCompany’s Quarterly Report on Form 10-Q filed onAugust 7, 2009
102

ExhibitNumber Description of Document Reference
10.5† Form of SXC Health Solutions Corp. Performance-Based Restricted Stock Unit Award Agreement forcertain Employees under the SXC Health SolutionsCorp. Long-Term Incentive Plan
Incorporated herein by reference to Exhibit 10.5 to theCompany’s Quarterly Report on Form 10-Q filed onAugust 7, 2009
10.6† Form of SXC Health Solutions Corp. Time-VestingRestricted Stock Unit Award Agreement for certainEmployees under the SXC Health Solutions Corp.Long-Term Incentive Plan
Incorporated herein by reference to Exhibit 10.6 to theCompany’s Annual Report on Form 10-K filed onMarch 5, 2010
10.7† SXC Health Solutions, Inc. Deferred CompensationPlan, effective as of January 1, 2009
Incorporated herein by reference to Exhibit 10.17 tothe Company’s Annual Report on Form 10-K filed onMarch 13, 2009
10.8† 2007 Employee Stock Purchase Plan Incorporated herein by reference to Exhibit 4.1 to theCompany’s Registration Statement on Form S-8(File No. 333-145449) filed on August 14, 2007
10.9† Amendment No. 1 to the SXC Health Solutions Corp.2007 Employee Stock Purchase Plan, dated March 11,2009
Incorporated herein by reference to Exhibit 10.18 tothe Company’s Annual Report on Form 10-K filed onMarch 13, 2009
10.10† Amendment No. 2 to the SXC Health Solutions Corp.2007 Employee Stock Purchase Plan, dated March 2,2010
Incorporated herein by reference to Exhibit 10.22 tothe Company’s Annual Report on Form 10-K filed onMarch 5, 2010
10.11† Amendment No. 3 to the Catamaran Corporation 2007Employee Stock Purchase Plan, dated September 5,2012
Incorporated herein by reference to Exhibit 10.15 tothe Company’s Quarterly Report on Form 10-Q filedon November 2, 2012
10.12† SXC Health Solutions Corp. Incentive Plan Incorporated herein by reference to Exhibit 10.1 to theCompany’s Current Report on Form 8-K filed onMay 17, 2010
10.13† 2003 HealthExtras, Inc. Equity Incentive Plan Incorporated herein by reference to Exhibit A toCatalyst Health Solutions, Inc.’s Definitive ProxyStatement filed on April 30, 2003
10.14† Amendment to the 2003 HealthExtras, Inc. EquityIncentive Plan
Incorporated herein by reference to Exhibit 10.6 to theCompany’s Current Report on Form 8-K filed onJuly 6, 2012
10.15† Catalyst Health Solutions, Inc. 2006 Stock IncentivePlan, as Amended and Restated on April 8, 2010
Incorporated herein by reference to Appendix A toCatalyst Health Solutions, Inc.’s Definitive ProxyStatement filed on April 23, 2010
10.16† Amendment to the Catalyst Health Solutions, Inc.2006 Stock Incentive Plan, as amended
Incorporated herein by reference to Exhibit 10.8 to theCompany’s Current Report on Form 8-K filed onJuly 6, 2012
10.17† SXC Health Solutions Corp. Restricted Stock UnitAward Agreement relating to the Catalyst HealthSolutions, Inc. 2006 Stock Incentive Plan
Incorporated herein by reference to Exhibit 10.9 to theCompany’s Current Report on Form 8-K filed onJuly 6, 2012
10.18† SXC Health Solutions Corp. Performance-BasedRestricted Stock Unit Award Agreement relating to theCatalyst Health Solutions, Inc. 2006 Stock IncentivePlan
Incorporated herein by reference to Exhibit 10.10 tothe Company’s Current Report on Form 8-K filed onJuly 6, 2012
10.19† SXC Health Solutions Corp. Amended and RestatedStock Option Plan
Incorporated herein by reference to Exhibit 4.1 to theCompany’s Registration Statement on Form S-8(File No. 333-145450) filed on August 14, 2007
10.20† Form of SXC Health Solutions Corp. Stock OptionAgreement for certain Employees, Non-EmployeeDirectors and Service Providers
Incorporated herein by reference to Exhibit 10.19 tothe Company’s Annual Report on Form 10-K filed onMarch 17, 2008
103

ExhibitNumber Description of Document Reference
10.21† Employment Agreement, effective as of June 30, 2008,among SXC Health Solutions Corp., SXC HealthSolutions, Inc. and Mark Thierer
Incorporated herein by reference to Exhibit 10.3 to theCompany’s Quarterly Report on Form 10-Q filed onAugust 11, 2008
10.22† First Amendment to the Employment Agreement,effective as of June 30, 2008, among SXC HealthSolutions Corp., SXC Health Solutions, Inc. and MarkThierer
Incorporated herein by reference to Exhibit 10.15 tothe Company’s Annual Report on Form 10-K filed onMarch 13, 2009
10.23† Second Amendment to the Employment Agreement,effective as of September 1, 2010, among SXC HealthSolutions Corp., SXC Health Solutions, Inc. and MarkThierer
Incorporated herein by reference to Exhibit 10.1 to theCompany’s Quarterly Report on Form 10-Q filed onNovember 4, 2010
10.24† Third Amendment to the Employment Agreement,effective as of December 31, 2012, among CatamaranCorporation, Catamaran LLC and Mark Thierer
Filed herewith
10.25† Employment Agreement, effective as of June 30, 2008,among SXC Health Solutions Corp., SXC HealthSolutions, Inc. and Jeffrey G. Park
Incorporated herein by reference to Exhibit 10.4 to theCompany’s Quarterly Report on Form 10-Q filed onAugust 11, 2008
10.26† First Amendment to the Employment Agreement,effective as of June 30, 2008, among SXC HealthSolutions Corp., SXC Health Solutions, Inc. andJeffrey G. Park
Incorporated herein by reference to Exhibit 10.16 tothe Company’s Annual Report on Form 10-K filed onMarch 13, 2009
10.27† Second Amendment to the Employment Agreement,effective as of September 1, 2010, among SXC HealthSolutions Corp., SXC Health Solutions, Inc. andJeffrey G. Park
Incorporated herein by reference to Exhibit 10.2 to theCompany’s Quarterly Report on Form 10-Q filed onNovember 4, 2010
10.28† Third Amendment to the Employment Agreement,effective as of December 31, 2012, among CatamaranCorporation, Catamaran LLC and Jeffrey G. Park
Filed herewith
10.29† Employment Agreement, effective as of November 6,2008, between SXC Health Solutions, Inc. and JohnRomza
Incorporated herein by reference to Exhibit 10.2 to theCompany’s Quarterly Report on Form 10-Q filed onNovember 6, 2008
10.30† Employment Agreement, effective as of June 22, 2010,among SXC Health Solutions Inc., and Joel Saban
Incorporated herein by reference to Exhibit 10.1 to theCompany’s Quarterly Report on Form 10-Q filed onAugust 5, 2010
10.31† Employment Agreement, effective as of February 16,2008, among SXC Health Solutions Inc., and CliffordE. Berman
Incorporated herein by reference to Exhibit 10.29 tothe Company’s Annual Report on Form 10-K filed onFebruary 25, 2011
10.32† First Amendment to the Employment Agreement,effective as of December, 22, 2008, among SXCHealth Solutions, Inc. and Clifford E. Berman
Incorporated herein by reference to Exhibit 10.30 tothe Company’s Annual Report on Form 10-K filed onFebruary 25, 2011
10.33† Second Amendment to the Employment Agreement,effective as of June 17, 2009, among SXC HealthSolutions, Inc. and Clifford E. Berman
Incorporated herein by reference to Exhibit 10.31 tothe Company’s Annual Report on Form 10-K filed onFebruary 25, 2011
10.34† Employment Agreement, effective as of August 3,2009, between Catalyst Health Solutions, Inc. andRichard A. Bates
Incorporated herein by reference to Exhibit 10.1 toCatalyst Health Solutions, Inc.’s Current Report onForm 8-K filed on August 7, 2009
10.35† Amendment to Employment Agreement, effective asof June 22, 2010, between Catalyst Health Solutions,Inc. and Richard A. Bates
Incorporated herein by reference to Exhibit 10.1 toCatalyst Health Solutions, Inc.’s Quarterly Report onForm 10-Q filed on August 6, 2010
10.36† Agreement, dated as of July 2, 2012, among SXCHealth Solutions, Inc., Catalyst Health Solutions, Inc.and Richard A. Bates
Incorporated herein by reference to Exhibit 10.14 tothe Company’s Current Report on Form 8-K filed onJuly 6, 2012
104
ExhibitNumber Description of Document Reference
10.37† Confidential Separation Agreement and GeneralRelease, dated as of January 11, 2013, betweenCatamaran Inc. and Richard A. Bates
Filed herewith
10.38 Form of indemnification agreement for directors andcertain officers of SXC Health Solutions Corp.
Incorporated herein by reference to Exhibit 10.28 tothe Company’s Annual Report on Form 10-K filed onFebruary 25, 2011
10.39 Lease Agreement, dated as of March 24, 2006,between Hines VAF Westwood of Lisle II, L.P. andSXC Health Solutions, Inc.
Incorporated herein by reference to Exhibit 10.1 tothe Company’s Annual Report on Form 10-K filed onMarch 17, 2008
10.40 Credit Agreement, dated as of July 2, 2012, amongSXC Health Solutions Corp., JPMorgan Chase Bank,N.A., as administrative agent, the lenders partythereto, Bank of America, N.A., Barclays Bank PLCand SunTrust Bank, as co-syndication agents, FifthThird Bank, PNC Bank, National Association andRoyal Bank of Canada, as co-documentation agents,J.P. Morgan Securities LLC and Merrill Lynch,Pierce, Fenner & Smith Incorporated and BarclaysBank PLC, as joint bookrunners and joint leadarrangers
Incorporated herein by reference to Exhibit 10.1 tothe Company’s Current Report on Form 8-K filed onJuly 6, 2012
10.41 Amendment No. 1 to Credit Agreement, dated as ofOctober 24, 2012, among Catamaran Corporation (f/k/a SXC Health Solutions Corp.), JPMorgan ChaseBank, N.A., individually and as administrative agent,and the other financial institutions signatory thereto
Incorporated herein by reference to Exhibit 10.16 tothe Company’s Quarterly Report on Form 10-Q filedon November 2, 2012
10.42 Subsidiary Guaranty, dated as of July 2, 2012, madeby the Subsidiary Guarantors named therein in favorof JPMorgan Chase Bank, N.A., as administrativeagent
Incorporated herein by reference to Exhibit 10.2 tothe Company’s Current Report on Form 8-K filed onJuly 6, 2012
10.43 Security Agreement, dated as of July 2, 2012, amongSXC Health Solutions Corp., the SubsidiaryGuarantors named therein and JPMorgan ChaseBank, N.A., as collateral agent
Incorporated herein by reference to Exhibit 10.3 tothe Company’s Current Report on Form 8-K filed onJuly 6, 2012
10.44 Pledge Agreement, dated as of July 2, 2012, amongSXC Health Solutions Corp., the SubsidiaryGuarantors named therein and JPMorgan ChaseBank, N.A., as collateral agent
Incorporated herein by reference to Exhibit 10.4 tothe Company’s Current Report on Form 8-K filed onJuly 6, 2012
12.1 Statement of computation of ratios of earnings tofixed charges
Filed herewith
21.1 List of Subsidiaries Filed herewith
23.1 Consent of KPMG LLP Filed herewith
31.1 Rule 13a-14(a)/15d-14(a) Certification of CEOpursuant to Section 302 of the Sarbanes-Oxley Act
Filed herewith
31.2 Rule 13a-14(a)/15d-14(a) Certification of CFOpursuant to Section 302 of the Sarbanes-Oxley Act
Filed herewith
32.1 Section 1350 Certification of CEO as adopted bySection 906 of the Sarbanes-Oxley Act
Filed herewith
32.2 Section 1350 Certification of CFO as adopted bySection 906 of the Sarbanes-Oxley Act
Filed herewith
101.INS XBRL Instance Document Filed herewith
101.SCH XBRL Taxonomy Extension Schema Document Filed herewith
105
ExhibitNumber Description of Document Reference
101.CAL XBRL Taxonomy Extension Calculation LinkbaseDocument
Filed herewith
101.DEF XBRL Taxonomy Extension Definition LinkbaseDocument
Filed herewith
101.LAB XBRL Taxonomy Extension Label LinkbaseDocument
Filed herewith
101.PRE XBRL Taxonomy Extension Presentation LinkbaseDocument
Filed herewith
† Indicates management contract or compensatory plan.
* The registrant agrees to furnish supplementary to the SEC a copy of any omitted schedule or exhibit upon the request ofthe SEC in accordance with Item 601(b)(2) of Regulation S-K.
106

Board of DirectorsMark A. Thierer
Chairman of the Board &
Chief Executive Officer
Catamaran Corporation
Peter J. Bensen (c)
Executive Vice President &
Chief Financial Officer
McDonald’s Corporation
Steven D. Cosler (n, i)
Operating Partner
Water Street Healthcare Partners
William J. Davis (a)
Chief Financial Officer
Blackboard Inc.
Steven B. Epstein (n)
Founder
Epstein Becker & Green, P.C.
Betsy D. Holden (n, a)
Senior Advisor
McKinsey & Company
Karen L. Katen (c)
Senior Advisor
Essex Woodlands Healthcare
Venture Capital and Growth Equity
Harry M. Kraemer Jr. (a)
Executive Partner
Madison Dearborn Partners
Anthony R. Masso (c)
Retired Independent Consultant
a= Audit Committee
c= Compensation Committee
n= Nominating and
Corporate Governance Committee
i= Independent Lead Director
Annual & Special Meeting of ShareholdersMay 14, 2013, 4:30 p.m. ET
St. Andrew’s Club &
Conference Centre
150 King Street West
16th Floor
Toronto, ON M5H 1J9
Corporate OfficersMark Thierer
Chairman & Chief Executive Officer
Jeffrey Park
Executive Vice President &
Chief Financial Officer
John Romza
Executive Vice President,
Research & Innovation
Joel Saban
Executive Vice President,
Pharmacy Operations
Cliff Berman
Senior Vice President,
General Counsel &
Corporate Secretary
Legal AdvisorsHeenan Blaikie LLP
Bay Adelaide Centre
P.O. Box 2900
333 Bay Street, Suite 2900
Toronto, ON M5H 2T4
Sidley Austin LLP
One South Dearborn Street
Chicago, IL 60603
Transfer AgentCanadian Stock Transfer
Company Inc.
320 Bay Street
P.O. Box 1
Toronto, ON M5H 4A6
Independent AuditorKPMG LLP
200 East Randolph Drive
Chicago, IL 60601
BankerJPMorgan Chase
10 South Dearborn Street
Chicago, IL 60603
Investor RelationsTony Perkins
Vice President, Investor Relations
312-261-7805
NASDAQ Symbol: CTRX
TSX Symbol: CCT
Design and production by The Mx Group
C H A RT I N G A N EW C OU RS E … TOGETHER
2 0 1 2A N N U A L R E P O R T
2441 Warrenville Road Suite 610 Lisle, IL 60532-3642 630-577-3100 800-282-3232 catamaranRx.com