chavón hydrologic analysis -...
TRANSCRIPT

1
Brigham Young University
Chavón Hydrologic Analysis
Scott Christensen Nathanael Whipple Tracey Brimhall April 2012
2
Table of Contents Executive Summary ....................................................................................................................................... 3
Introduction .................................................................................................................................................. 3
Project Overview ....................................................................................................................................... 3
Summary of Recommended Alternative................................................................................................... 3
Project constraints ........................................................................................................................................ 3
Physical Constraints .................................................................................................................................. 3
Private Stakeholders’ Interests ................................................................................................................. 5
Hydrologic Analysis ....................................................................................................................................... 5
Reservoir Volume ...................................................................................................................................... 5
Ripple Analysis .......................................................................................................................................... 6
HMS Models .............................................................................................................................................. 7
Dam Break ................................................................................................................................................. 7
Flow Duration ............................................................................................................................................ 8
Site Visit ........................................................................................................................................................ 9
Evaluation of Alternatives ............................................................................................................................. 9
No action ................................................................................................................................................... 9
Build Dam to Supply Lower Demand ...................................................................................................... 10
Benefits ............................................................................................................................................... 10
Cost Analysis ....................................................................................................................................... 10
Environmental Cost ............................................................................................................................. 12
Recommendations ...................................................................................................................................... 12
References .................................................................................................................................................. 13

3
Executive Summary INAPA commissioned a consulting engineering company to develop a plan to construct a dam site on the
Chavón River. In order to verify the accuracy and feasibility of the dam construction project, INDRHI
asked BYU’s students to conduct various hydrologic studies to check the feasibility of constructing a
dam. As part of their senior design project, the authors conducted a flood analysis, dam break analysis,
cost analysis, and Ripple analysis as a part of the hydrologic study of the Chavón watershed. The flood
analysis indicated that a reservoir would significantly attenuate the peak flow in a flooding event, and if
reservoir levels were drawn down the flood could be completely stored. The dam break analysis
showed that no high density population centers would be affected in the event of dam failure. The
results of a Ripple curve analysis indicated that, given the available storage, the projected demand of 4.5
cms could not be met over a significant period of time. A preliminary cost analysis for the project was
developed, using a design life of 25 years before reservoir sedimentation. This indicated that the total
profit would be 6.45 million USD. It is recommended that the dam not be built; there is insufficient flow
to provide the projected demand flow of 4.5 cms while leaving a base flow in the river to sustain
irrigation, wildlife, and still be able to fill the reservoir in a cost effective period of time.
Introduction
Project Overview INDRHI was given a report conducted by the engineering consulting firm Hanson Rodriquez, which
contained a dam proposal for the Chavón River at approximately 2067139 N 5087941 E. The watershed
area was previously determined to be 217 km. The height of the proposed dam was 42.5 m, resulting in
a covered surface area of 4 km2 and a storage capacity of 80,000,000 cubic meters when full. The
requested base flow was approximately 4.5 cms. INDRHI requested that the Hanson and Rodriquez
feasibility document be reviewed with respect to the hydrologic factors of the proposed reservoir. In
specific, to verify the feasibility of the project according to the available water in the watershed and the
demand which is required downstream for base flow, irrigation, and municipality purposes. The results
of the hydrologic study indicated that the limiting factor of the project is the hydrology.
Summary of Recommended Alternative Our recommendation is that the dam not be built because the cost is not justified by the benefits.
Based on the cyclical supply of water in the Chavón River there would not be enough water in the
system to meet base flow, provide 4.5 cms for resorts, provide water to agriculture, and fill the dam.
Project Constraints
Physical Constraints The Chavón River presents a number of physical constraints for building a dam. The current location,
2067139N 5087941 E, chosen for building a dam is the best location after considering topology, the
water flow, and the geology below the river. If the dam is built any further downstream, the topology of

4
the surrounding area is too flat to be able to construct a dam wall and block off a basin large enough to
store water. If the dam is built any further upstream, the river would not have enough water to satisfy
the water needs of the dam. The current planned location of the dam is also good because it allows the
greatest head for hydropower production. Figure 1 shows the location of the proposed site, and the
contributing watershed.
Figure 1: Map showing watershed and location of watershed where dam will be located.
The topography limits the size of the dam to a capacity of 80 million cubic meters. Figure 2 on the
following page shows the maximum size of the reservoir. The surface area of the full reservoir is 4 km2,
as compared to the 217 km2 of the watershed.
The design life of the reservoir is another physical constraint. The approximate life of the reservoir will
be 25 years, which is a result of heavy sedimentation that the Chavón River receives as a result of
tropical storms.

5
Figure 2: Map showing the surface of the reservoir when the Chavon dam is full.
Private Stakeholders’ Interests INAPA is the primary stakeholder in the reservoir proposal. They want a reliable supply of water for
tourist development and hydropower production. INAPA would like to provide 4.5 cms from the Chavón
dam for tourist facility use.
INDRHI is interested in providing flood control for the flood plain just below the proposed site during
hurricane season. They are also interested in ensuring that adequate water is provided to the
surrounding area for agriculture, and have requested that the base flow in the channel downstream
from the reservoir remain at the 80 percent reliability flow.
Hydrologic Analysis
Reservoir Volume In the Hanson Rodriguez feasibility study, the maximum volume of the reservoir was calculated to be 80
million cubic meters. This volume was verified using ArcGIS. Using ArcGIS and a Global Elevation Model,
we were able to calculate the volume of water held for different water surface elevations.
6
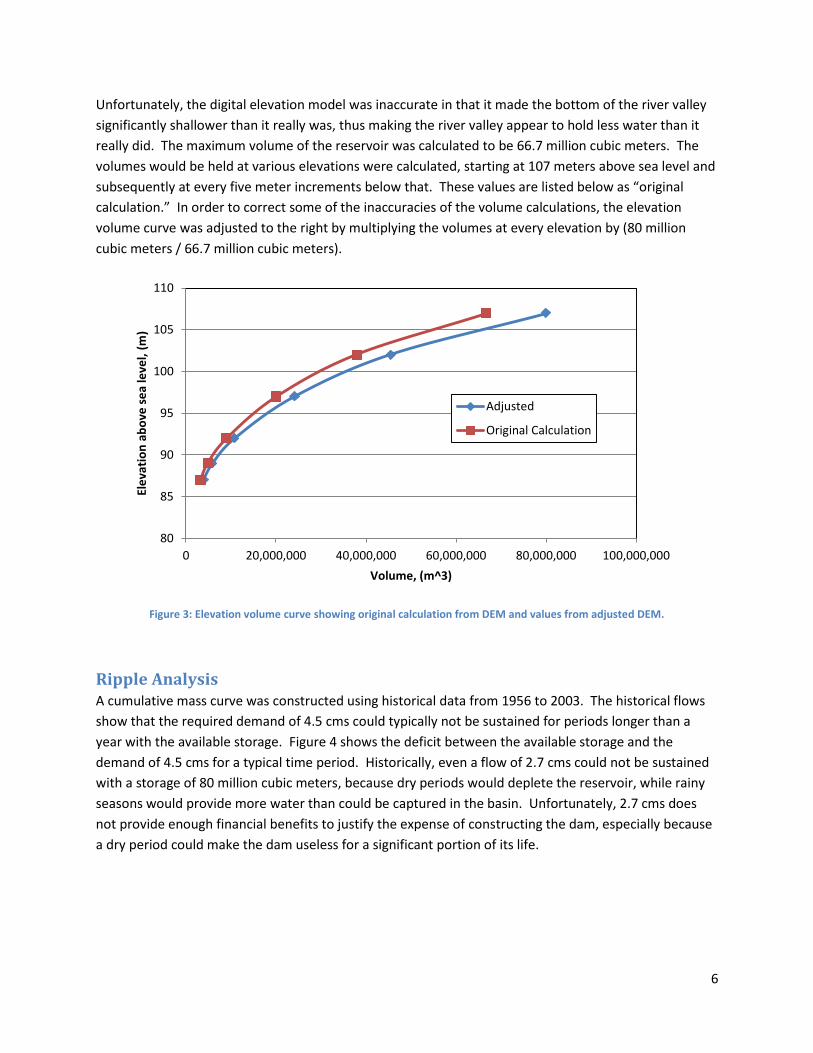
Unfortunately, the digital elevation model was inaccurate in that it made the bottom of the river valley
significantly shallower than it really was, thus making the river valley appear to hold less water than it
really did. The maximum volume of the reservoir was calculated to be 66.7 million cubic meters. The
volumes would be held at various elevations were calculated, starting at 107 meters above sea level and
subsequently at every five meter increments below that. These values are listed below as “original
calculation.” In order to correct some of the inaccuracies of the volume calculations, the elevation
volume curve was adjusted to the right by multiplying the volumes at every elevation by (80 million
cubic meters / 66.7 million cubic meters).
Figure 3: Elevation volume curve showing original calculation from DEM and values from adjusted DEM.
Ripple Analysis A cumulative mass curve was constructed using historical data from 1956 to 2003. The historical flows
show that the required demand of 4.5 cms could typically not be sustained for periods longer than a
year with the available storage. Figure 4 shows the deficit between the available storage and the
demand of 4.5 cms for a typical time period. Historically, even a flow of 2.7 cms could not be sustained
with a storage of 80 million cubic meters, because dry periods would deplete the reservoir, while rainy
seasons would provide more water than could be captured in the basin. Unfortunately, 2.7 cms does
not provide enough financial benefits to justify the expense of constructing the dam, especially because
a dry period could make the dam useless for a significant portion of its life.
80
85
90
95
100
105
110
0 20,000,000 40,000,000 60,000,000 80,000,000 100,000,000
Ele
vati
on
ab
ove
se
a le
vel,
(m)
Volume, (m^3)
Adjusted
Original Calculation

7
Figure 4: Cumulative mass curve (Ripple analysis) of historical Chavón flows showing storage deficiency.
HMS Models HMS models were developed to determine the peak flows for the watershed, and to evaluate the effect
of routing through the proposed reservoir. The SMS curve number method was used to develop the
models, and a composite curve number of 70 was calculated for the watershed based on soil type and
land use. The 100 year storm event was determined to be 230 mm from frequency storm maps. The 10
year storm is 150 mm. An SCS type II 24-hour storm was used for the simulation.
The peak flow for the 100 year event was 620 cms. Routing through the reservoir when it is full
attenuated the peak down to 225 cms. In order to completely contain the flood the reservoir would
need to be drawn down to by 2.5 meters to completely contain the 10 year storm. To contain the 100
year storm the reservoir would need to be drawn down 8 meters to an elevation of 90 meters.

8
Figure 5: Hydrographs showing attenuation of stream flow with reservoir routing if dam were built.
Dam Break An analysis of complete dam failure was conducted to delineate the flood plain. Because of the deep
ravine through which the channel runs, the flood plain does not spread significantly away from the river
(maximum distance of 2 km). While there are some dwellings scattered along the banks of the river that
would be affected by a dam failure, the flood plain does not affect any high density population areas.
Figure 6: Flood plane in the event of complete dam failure.

9
Flow Duration Two flow duration curves (FDC) were calculated for this project. One of the flow duration curves was
made with the actual data, and another flow duration curve was made from a GIS tool developed at
BYU. The FDC made with the GIS tool is much lower than the FDC made with the real data. This is
primarily because the digital elevation model that was used in GIS was very inaccurate and made the
river valley look much shallower than it actually was.
Figure 7: Flow Duration Curve Representing the real data and from the tool that Blake made.
Site Visit A visit to the site of the proposed dam verified several assumptions and results from the analysis.
Several points were recorded with a GPS to verify location and elevation of the channel. The elevations
of the surrounding hills were visually inspected and determined to be sufficient to allow for the
proposed 42.5 meter high dam to be built. The channel had steep side banks verifying that the dam
break results were reasonable. It was estimated that the flowrate was about 2 to 5 cms which is a bit
high for the time of year according to the historical data, but is reasonable assuming recent
precipitation.
Evaluation of Alternatives
No Action Not building the dam provides no water storage, so water demand must remain subject to seasonal
flows. This would not provide consistent flows needed to supply growing municipalities and tourist
0
1
2
3
4
5
6
7
8
9
10
0 20 40 60 80 100
Flo
w [
cms]
Percent of Time
Real Data
BlakeGIS Est.
10
locations. Flooding would continue to be subject to seasonal variation, which could possibly cause
damages to agricultural property and is estimated to cause occasional loss of life. There is no present
financial cost associated with not building the dam.
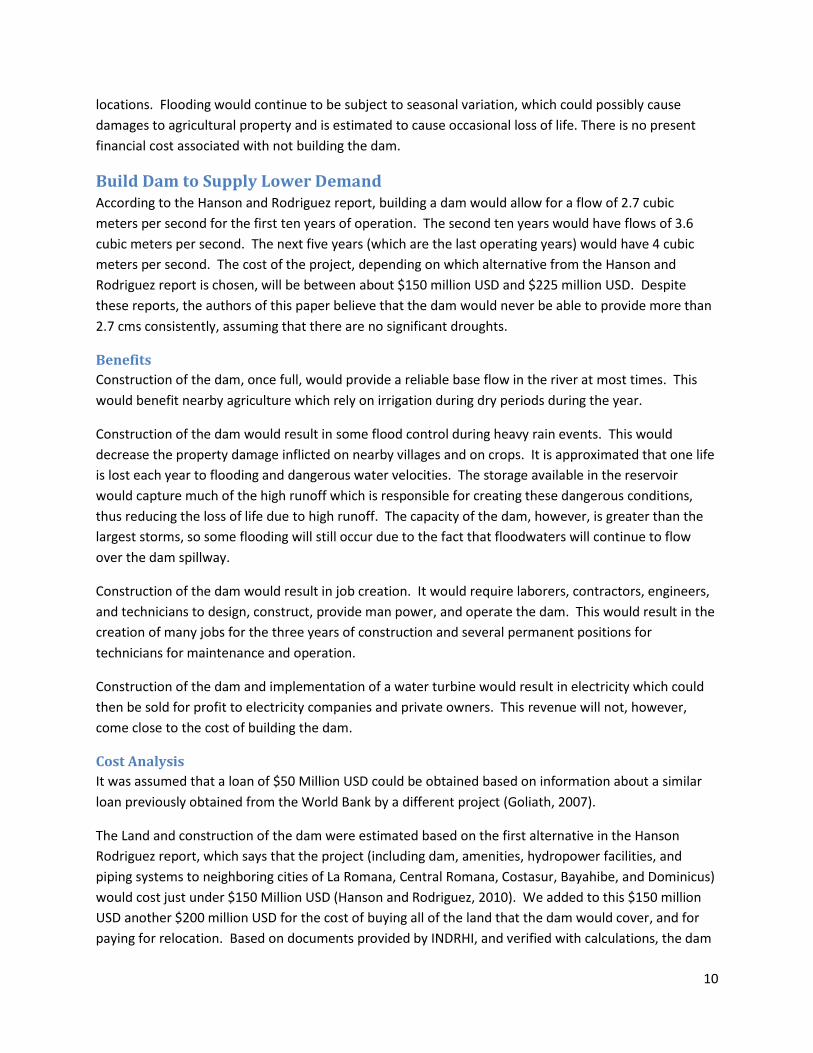
Build Dam to Supply Lower Demand According to the Hanson and Rodriguez report, building a dam would allow for a flow of 2.7 cubic
meters per second for the first ten years of operation. The second ten years would have flows of 3.6
cubic meters per second. The next five years (which are the last operating years) would have 4 cubic
meters per second. The cost of the project, depending on which alternative from the Hanson and
Rodriguez report is chosen, will be between about $150 million USD and $225 million USD. Despite
these reports, the authors of this paper believe that the dam would never be able to provide more than
2.7 cms consistently, assuming that there are no significant droughts.
Benefits
Construction of the dam, once full, would provide a reliable base flow in the river at most times. This
would benefit nearby agriculture which rely on irrigation during dry periods during the year.
Construction of the dam would result in some flood control during heavy rain events. This would
decrease the property damage inflicted on nearby villages and on crops. It is approximated that one life
is lost each year to flooding and dangerous water velocities. The storage available in the reservoir
would capture much of the high runoff which is responsible for creating these dangerous conditions,
thus reducing the loss of life due to high runoff. The capacity of the dam, however, is greater than the
largest storms, so some flooding will still occur due to the fact that floodwaters will continue to flow
over the dam spillway.
Construction of the dam would result in job creation. It would require laborers, contractors, engineers,
and technicians to design, construct, provide man power, and operate the dam. This would result in the
creation of many jobs for the three years of construction and several permanent positions for
technicians for maintenance and operation.
Construction of the dam and implementation of a water turbine would result in electricity which could
then be sold for profit to electricity companies and private owners. This revenue will not, however,
come close to the cost of building the dam.
Cost Analysis
It was assumed that a loan of $50 Million USD could be obtained based on information about a similar
loan previously obtained from the World Bank by a different project (Goliath, 2007).
The Land and construction of the dam were estimated based on the first alternative in the Hanson
Rodriguez report, which says that the project (including dam, amenities, hydropower facilities, and
piping systems to neighboring cities of La Romana, Central Romana, Costasur, Bayahibe, and Dominicus)
would cost just under $150 Million USD (Hanson and Rodriguez, 2010). We added to this $150 million
USD another $200 million USD for the cost of buying all of the land that the dam would cover, and for
paying for relocation. Based on documents provided by INDRHI, and verified with calculations, the dam
11
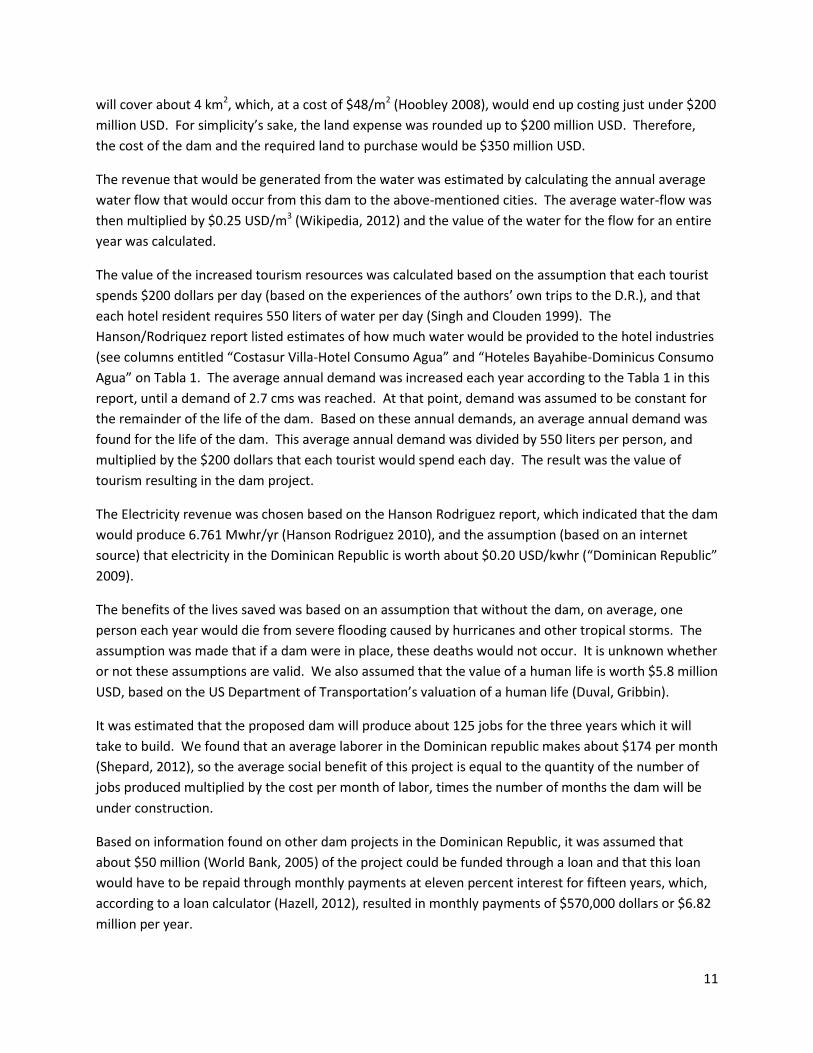
will cover about 4 km2, which, at a cost of $48/m2 (Hoobley 2008), would end up costing just under $200
million USD. For simplicity’s sake, the land expense was rounded up to $200 million USD. Therefore,
the cost of the dam and the required land to purchase would be $350 million USD.
The revenue that would be generated from the water was estimated by calculating the annual average
water flow that would occur from this dam to the above-mentioned cities. The average water-flow was
then multiplied by $0.25 USD/m3 (Wikipedia, 2012) and the value of the water for the flow for an entire
year was calculated.
The value of the increased tourism resources was calculated based on the assumption that each tourist
spends $200 dollars per day (based on the experiences of the authors’ own trips to the D.R.), and that
each hotel resident requires 550 liters of water per day (Singh and Clouden 1999). The
Hanson/Rodriquez report listed estimates of how much water would be provided to the hotel industries
(see columns entitled “Costasur Villa-Hotel Consumo Agua” and “Hoteles Bayahibe-Dominicus Consumo
Agua” on Tabla 1. The average annual demand was increased each year according to the Tabla 1 in this
report, until a demand of 2.7 cms was reached. At that point, demand was assumed to be constant for
the remainder of the life of the dam. Based on these annual demands, an average annual demand was
found for the life of the dam. This average annual demand was divided by 550 liters per person, and
multiplied by the $200 dollars that each tourist would spend each day. The result was the value of
tourism resulting in the dam project.
The Electricity revenue was chosen based on the Hanson Rodriguez report, which indicated that the dam
would produce 6.761 Mwhr/yr (Hanson Rodriguez 2010), and the assumption (based on an internet
source) that electricity in the Dominican Republic is worth about $0.20 USD/kwhr (“Dominican Republic”
2009).
The benefits of the lives saved was based on an assumption that without the dam, on average, one
person each year would die from severe flooding caused by hurricanes and other tropical storms. The
assumption was made that if a dam were in place, these deaths would not occur. It is unknown whether
or not these assumptions are valid. We also assumed that the value of a human life is worth $5.8 million
USD, based on the US Department of Transportation’s valuation of a human life (Duval, Gribbin).
It was estimated that the proposed dam will produce about 125 jobs for the three years which it will
take to build. We found that an average laborer in the Dominican republic makes about $174 per month
(Shepard, 2012), so the average social benefit of this project is equal to the quantity of the number of
jobs produced multiplied by the cost per month of labor, times the number of months the dam will be
under construction.
Based on information found on other dam projects in the Dominican Republic, it was assumed that
about $50 million (World Bank, 2005) of the project could be funded through a loan and that this loan
would have to be repaid through monthly payments at eleven percent interest for fifteen years, which,
according to a loan calculator (Hazell, 2012), resulted in monthly payments of $570,000 dollars or $6.82
million per year.

12
The maintenance of the dam was subjectively determined to cost one million dollars per year and
includes the cost of paying one engineer, two technicians, paying for their office and living quarters, and
maintaining the structure of the dam and piping system
Figure 8: Cash flow diagram (all numbers are in millions of USD).
The overall profit for the project, assuming that the reservoir could supply 2.7 cms of flow consistently,
is $6.45 million USD. Furthermore, due to sedimentation, the reservoir’s capacity will decrease over its
25 year life, meaning that sustainable flow will also decrease. Therefore, the increase in supplied flows
that the Hanson Rodriguez report outlines will not be possible. Consequently the revenue from these
increased flows will not be generated.
Environmental Cost
Flow from outlet and spillways will destroy some aquatic life directly below the reservoir as a result of
temperature and velocity changes. This is not anticipated to be detrimental to the survival of any
species, however.
It is approximated that 3,200,000 cubic meters of sediment would be deposited in the reservoir each
year. This number is large because of the high erosion which occurs during tropical storms, and the mild
slope of the river bed, which results in a slower stream velocity and more time for the sediment to settle
before water in the reservoir reaches the spillway. Sedimentation would limit the reservoir life to 25
years. This would only leave five years after the dam was full for optimal hydropower production.
Recommendations It is recommended that the dam not be built. The drawbacks of building a dam are that the dam is
expensive and will only last for twenty-five years, after which, the dam will be inoperable, leaving the
dam structure and about 4km2 of sediment-filled land. In addition, the river of the dam provides
enough water to allow for the dam to fill up, allow for a continuous environmental flow, and provide the
necessary water to nearby cities and tourist complexes. In other words, if the dam were built, it would
not be capable of providing the anticipated discharge and thus the financial and social returns on its
investment would not be realized. Finally, even if a dam were built, there will certainly not be enough
water to provide for agricultural uses, as the water demands in the cities and tourist complexes can only
be met if all of the water available from the dam is transported there.
Year 1 Year 2 Year 3 Year 4 Year 5 Year 6-15 Year 16-25 Totals
Loan 50.0
Value of water ($0.21/m^3) 12.1 12.1 12.1 12.1
Electricity Revenue 1.4 1.4 1.4 1.4
Lives saved 5.8 5.8 5.8 5.8
Job creation 0.3 0.3 0.3
Loan Payments 6.8 6.8 6.8 6.8 6.8
Land/construction cost 350.0
Maintenance 1.0 1.0 1.0 1.0
Profit 6.45
Rev
enu
esC
ost
s
473.65
467.20

13
References “Dominican Republic’s Electricity Rates up Again in Less than one Month” (2009). Bajan Reporter. <
http://www.bajanreporter.com/2009/07/dominican-republics-electricity-rates-up-again-in-less-than-one-
month/> (Jul 1, 2009).
Duval, T., Gribbin, D.. “Memorandum to: Secretarial Officers, Modal Administrators,” US Department of
Transportation, Office of the Assistant Secretary for Transportation Policy, < http://ostpxweb.dot.gov
/policy/reports/080205.htm > (Apr. 3, 2012).
Goliath Business Knowledge. (2007). US$ 81.3 million loan for dam.(DOMINICAN REPUBLIC). Caribbean
Update, 14. <http://goliath.ecnext.com>
Hazell, Alastair. (2012). Loan Repayment Calculator. The Calculator Site,
http://www.thecalculatorsite.com/finance/calculators/loancalculator.php
Hanson Rodriquez. (2010). Informe Sobre Regulacion Del Rio Chavon: studio de diferentes alternativas para la
conduccion de los caudales regulados del rio chavon. INDRHI
Hoobley. (2008). Lot in Higuey, Dominican Republic 300 square meters. Hoobley,
<http://www.hoobly.com/0/0/542092.html>.
INDRHI. (2008). “Presa de Chavon en la Javilla, Provincia Del Seybo,” PowerPoint presentation.
O Banco Nacional do Desenvolvimento. (2012). Lucro do BNDES foi de R$ 9 bilhoes em 2011.
<http://www.bndes.gov.br/SiteBNDES/bndes/bndes>
Shepard, Wade. (2012). Average Wage in Dominican Republic. Vagabond Journey,
<http://www.vagabondjourney.com/travelogue/average-wage-in-dominican-republic/>
Singh, J., and Clouden, F. (1999). A Review of Water Conservation Practices and Potential for Tourist Facilities
in Barbados and St. Lucia, Activity Report No. 67, Caribbean Environmental Health Institute, Washington D.C.
Soler-Lopez, L.R., 2001, "Sedimentation survey results of the principal water supply reservoirs of Puerto
Rico"; in W.F. Sylva (ed.), Proceedings of the Sixth Caribbean Islands Water Resources Congress, Mayaguez,
Puerto Rico. <http://pr.water.usgs.gov/public/reports/soler.html>
Superintendencia de Electricidad. (2006). Energia Generada Neta (GWh).
<http://www.sie.gov.do/estadisticas.php>
Wikipedia (2012) “Water supply and sanitation in the Dominican Republic.” Wikipedia, <
http://en.wikipedia.org/wiki/Water_supply_and_sanitation_in_the_Dominican_Republic> (Apr. 3, 2012).
World Bank. (2005). Implementation Completion Report (CPL-38750 SCL-3875A SCPD-3875S): on a
loan/credit/grant in the amount of US$ 28 million to the Dominican Republic for a irrigated land and
watershed management project. Report No: 32527, 48.