che 473k example design reportutw10182.utweb.utexas.edu/eldridge/che473k/drop_folder/example … ·...
TRANSCRIPT

ChE 473K
Example Design Report
Feasibility Study of a World-Scale Propylene Plant
Executive Summary
This report evaluates the economic, environment, and operating feasibility of building a
world-scale propane dehydrogenation plant to produce polymer-grade propylene. This plant is intended to be an addition to an existing unit in the Gulf Coast with a projected life of 10-years beginning in January 1st, 2019. In summary, the proposed design has only a 2.2% chance of meeting the 25% target hurdle rate. Therefore, our parent company, Sharif&Co. should not invest in this project unless serious design modifications are made. The internal rate of return (IRR) was 15.8% with a standard deviation of 4.5%. The net present value (NPV) of this project, evaluated at a 15% interest rate, was $107 MM with a standard deviation of $146 MM. The fixed capital investment (FCI) was roughly $461 MM. Since the NPV of the project is positive at a lower discount rate of 15%, the project will return a profit if a lower interest rate is assumed. However, since the standard deviation of the estimated NPV is high, there is an 18.7% chance that the project does not make a profit at all. Since this process will not reliability generate positive cash flows, it reinforces the fact that this project is not economically viable in its current state. The low NPV and unfeasible IRR are primarily driven by extremely variable propane feed pricing, low propylene sales, and high utility costs. If this project is to be optimized further, Sharif&Co should identify a reliable propane supplier that is able to lock in a feedstock prices that averages closer to $0.954/gal. Additionally, propylene production should be increased by increasing the temperature of the reactor to increase its per pass equilibrium conversion, adding inert gases to the feed at constant pressure, or improving the separation in the deethanizer column. Due to the high required reaction temperatures and difficult alkane-alkene separations, this process is very energy intensive. To minimize utility operating costs several process heat integration techniques are employed which produce annual savings of $22 MM. This lower utility requirement also decreases the amount of natural gas required by the process as fuel and reduces the carbon footprint of the plant. Currently, the proposed process produces 176,000 metric tons of CO2 or equivalence per year, which is comparable to units of a similar size currently in the Gulf Coast region. While Texas does not have a unified carbon tax, if a similar price structure to the European Union is assumed the unit will require roughly $4.6 MM/year in emissions credits.

Table of Contents Introduction 1 Summary 1 Conclusion 3 Project Premise 4 Project Description 6 Safety Analysis 12 Environmental Analysis 14 Utilities 16 Economic Analysis 18 Cost Estimate Summary 22 Innovation and Optimization 30 References 33 Appendix A: Equipment List 36 Appendix B: Equipment Specifications 39 Appendix C: Process Flowsheets 56 Appendix D: Material and Energy Balance 64 Appendix E: Supplementary Economic Data 71 Appendix F: Hazard and Operability Study (HAZOP) 80

2
List of Figures Figure 1. Common surface water sources (Texas river basins) along the Gulf
of Mexico
15
Figure 2. Net present value distribution of the propylene process
20
Figure 3. Internal rate of return distribution of the propylene process
20
Figure 4. Sensitivity analysis tornado graph depicting how variable pricing and process conditions affect the project’s mean NPV
21
Figure 5. Flow diagram showing the calculations of yearly project cash flows
23
Figure 6. Contributions of individual equipment to the total, inflate bare equipment cost
24
Figure 7. Chilton Method factors and calculations
25
Figure 8. Fixed capital investment variability for the year 2023, assuming an allowable ±30% variation
26
Figure 9. Fixed capital investment variability for the year 2024, assuming an allowable ±30% variation
27
Figure 10. Percent of total cost-savings for each heat integration technique
32
Figure E1. CE factor correlation for adjusting FCI components based on construction year and calculated factors
77

3
List of Tables
Table 1. Summary of Base Utility Costs (Indexed Costs in Appendix E)
4
Table 2. MACRS 7-Year Depreciation Factors Used to Depreciate FCI
4
Table 3. Discount Factors at an Interest Rate of 15%
5
Table 4. NPFA Ratings of all Process Components
13
Table 5. Carbon Dioxide and Equivalent Emissions by Equipment
15
Table 6. Uninflated and Non-Indexed Utility Prices for the Optimized Design
17
Table 7. Detailed Equipment Utility Costs for the Optimized Design
17
Table 8. Required Product Flowrates and FCI to Meet 25% IRR
22
Table 9. Assumed Chilton Factors to Estimate the Project’s Fixed Capital Investment
26
Table 10. Product and Waste Stream Flowrates
27
Table 11. Waste Stream Lower Heating Values at 15°C
27
Table 12. Sales Generated per Year for Product and Waste Streams
28
Table 13. Operating Cost Process Flowrates and Energy Rates
29
Table 14. Operating Costs per Year for All Process Utilities
29
Table 15. Energy Savings from Each Heat Integration Method
32
Table A1. Equipment Names and Descriptions Represented on the Flow Diagrams
37
Table B1. Coldbox Equipment Details
40
Table B2. Compressor Equipment Details
41
Table B3. Distillation Column Equipment Details
43
Table B4. Furnace Equipment Details
44

4
Table B5. Heat Exchanger Equipment Details
45
Table B6. Pressure Swing Adsorption Unit Equipment Details
49
Table B7. Process Vessel Equipment Details
50
Table B8. Pump Equipment Details
51
Table B9. Reactor Equipment Details
53
Table B10. Condenser Equipment Details
54
Table B11. Reboiler Equipment Details
55
Table E1. Detailed Project Costs from 2023-2025
73
Table E2. Net Present Value and IRR Cash Flow Calculations
73
Table E3. Bare Equipment Costs
74
Table E4. FCI Calculations Using the Chilton Method
76
Table E5. Bare Equipment Calculations for the Propane-Propylene Splitter
76
Table E6. Natural Gas Pricing Adjusted for Inflation
78
Table E7. Propane Feed Pricing Adjusted for Inflation
79
Table E8. Cooling Water, Low-Pressure Steam, Propane Refrigeration, Propylene, and Hydrogen Pricing
80
Table F1. HAZOP of the Reactor, Compressor Train, and Furnace
82

1
Feasibility Study of a World-Scale Propylene Plant
Introduction
The purpose of this project is to assess whether it is desirable to build a world-scale (>1B lb/yr) polymer-grade propylene production plant and to analyze what safety and environmental risks may be associated with the process. As a basis for design, a research article written by Mahmoud El-Halwagi and his team at Texas A&M University was adapted to fit our needs and we further optimized its base design using Aspen Plus. From this process model we performed an economic evaluation using the Chilton Method to estimate the capital investment costs associated with this process. We also used @Risk statistical software to predict future commodity costs and generate estimates of the net present value (NPV) and internal rate of return (IRR) of the project. Our goal was to meet a 25% (IRR) corporate hurdle as dictated by our parent company, Sharif&Co.
Constructing a world-scale propylene plant is of particular interest to Sharif&Co since propylene is the second-largest petrochemical commodity in the world. Over 85 million metric tons of propylene were used globally in 2013 and the commodity has been projected to grow in demand throughout the next decade (Ceresana, 2014). Propylene is such a high-demand chemical because it is the starting material for polypropylene, a thermoplastic that is used both in household and industrial products (Staff, 2016). In fact, roughly two-thirds of propylene that is produced is used to generate polypropylene. Propylene is also used as a feedstock for many other chemicals such as cumene, acrylonitrile, acrylic acid, and propylene oxide (which used in polyurethane, adhesives, and resins) (Ceresana, 2014). Because of its current and ever-growing versatility, the global demand for propylene is estimated to increase 5.3% annually, with the largest increases in demand occurring in North America and China at a rate of 8% per year (Ceresana, 2014). Due to the projected increase in propylene demand and a readily available propane feedstock, due to the overproduction of shale gas in the Gulf Coast region, we believe there is room to enter the propylene market.
Converting propane to propylene is an extremely energy intensive process. The reaction is highly endothermic which requires high energy costs to heat and compress the product to its required temperature and pressure. Additionally, the purification of propylene from propane requires large pieces of equipment with high utility requirements to separate the two components. Therefore, during the design of the plant, it was of the utmost importance to minimize energy costs by using process heat integration to maximize the profitability of the unit. Summary
This paper first introduces the premise of the project, which sets the targets and constraints of the design. Examples of this include a pre-determined feedstock and product compositions of 96.75 mol% propane and 99.5% mol% propylene, respectively. Additionally, the Gulf Coast region of the United States was the target location for the unit and the project timeline considered a two-year construction period from 2023-2025 and a ten-year operational period from 2025-2035.

2
This report then presents a detailed mapping of the current process and provides specifics about process equipment and flows. Our process can be broken into four sections: hydrocarbon purification units, propylene production and compression, compressor effluent cooling, and hydrogen separation and purification. To purify the feed stream, four main units are used. A depropanizer column located at the beginning of the process removes hydrocarbons heavier than propane to sell as fuel gas. Further purification units downstream are used to convert any diolefins in the process to propylene, remove hydrocarbons lighter than propylene to sell as fuel gas, and separate a polymer grade propylene product from unreacted and recycled propane.
After a majority of C4+ components are removed from the feed it is heated and sent to a series of reactors which convert the propane feedstock to propylene and hydrogen. Additionally, several C2, C4, and C6 hydrocarbons are produced as by-products.
The process is sent to a series of coolers and compressors to raise the pressure of the system without reaching unsafe temperatures. The compressor outlet is cooled using one cooler which uses cooling water as its utility and two heat exchangers to increase the extent of process heat integration in the system. The compressor outlet must be sufficiently cooled before entering the process coldbox to allow the system to reach temperatures low enough for hydrogen to be separated from the main hydrocarbon stream.
Hydrogen removed in the coldbox is partially sent to the propane reactor to prevent poisoning of the catalyst and partially sent to the diolefin reactor to convert the components to propylene. The remaining balance of hydrogen is sent to a pressure swing adsorption unit to purify and separate it from any hydrocarbons. Both the separated hydrogen and hydrocarbon streams are collected as product to be sold.
The report then delves into environmental and safety concerns associated with producing polymer-grade propylene from propane. One important consideration is that the process is very energy intensive due to the need for several stages of compression in the process and difficult downstream separations. Using such large utility loads create significant amounts of byproducts that are released into the environment. Specifically, our plant produces 176,000 metric tons of CO2 or equivalence worth of waste per year. In order to legally release this quantity of CO2e we are required to purchase emissions credits at an estimated cost of $4.6 MM/year. Additionally, as with any chemical processes in the petrochemical industry, there are safety risks. This report holistically addresses the potential dangers of the system way to mitigate these risks.
The economic analysis discusses the two main metrics used to determine the project’s economic feasibility, NPV at a discount rate of 15% and IRR to meet a corporate hurdle rate of 25%. The mean NPV was $107 MM with a standard deviation of $146 MM. The mean IRR was 15.8% with a standard deviation of 4.5%. This is well shy of the corporate hurdle rate of 25%, therefore we do not recommend investment in this project without significant design modifications. Calculation details are provided in the report’s “Cost Estimate Summary” section. CE index factors were used to index the equipment’s bare equipment price and the Chilton method was used to estimate the plant’s fixed capital investment (FCI) at $461 MM. A breakeven study and sensitivity analysis determined that the main drivers of the low NPV and IRR were variable propane feed pricing, low propylene sales, and high utility costs.

3
Finally, the paper concludes with process innovations and optimizations. After constructing a base case design, we worked to decrease the energy requirements of the plant using process heat integration. Our process requires heat as high as 600°C in the propane reactor and as low as -33°C in the cold box. Heating and cooling requires energy that raises the operating costs of the propylene plant. Our heat integration techniques allow us to pull heat from warm process streams that need to be cooled and transfer the energy to cool streams that need to be warmed, without using outside utilities. For example, a warm stream at the process’s compressor outlet exchanges heat with a cooler stream going into the diolefin reactor. This allows the diolefin inlet to be heated to the required reaction temperature and the compressor outlet to be cooled without using additional cooling water. In total, employing heat integration techniques in the process led to an overall energy savings of approximately 1047 MMBtu/hr or $22 MM/year.
Conclusion
This project currently does not meet the desired corporate hurdle rate of 25% and should not be considered without major design modifications. The IRR was 15.8% with a standard deviation of 4.5% and a 90% confidence interval of ±0.07%. The NPV of this project, evaluated at a 15% interest rate, was $107 MM with a standard deviation of $146 MM and a 90% confidence interval of ± $2.4 MM. The low NPV and unfeasible IRR are primarily driven by extremely variable propane feed pricing, low propylene sales, and high utility costs. If we are able to identify a reliable source of propane feedstock that averages a cost of $0.954/gal the NPV of the project will increase by roughly $12 MM. Additionally, the production of propylene can be increased by increasing the temperature of the reactor to increase its per pass equilibrium conversion, adding inert gases to the feed at constant pressure, or improving the separation in the deethanizer column. Process utility costs are high mainly due to the difficult separation of propane and propylene. The process currently utilizes several techniques to maximize extent of process heat integration in the unit, which produces a yearly cost-savings of $22 M. However, further heat integration (as outlined in the “Innovation” section of this report) can be used to increase the NPV by roughly $96 MM.
To make the unit feasible from an environmental perspective, $4.6 MM/year will need to be spent on purchasing emissions credits to account for the 176,000 MT/year of CO2e emissions released. These emissions primarily stem from the reactor furnace, compressor train, and distillation columns in the process. Additionally, several safety concerns will need to be addressed before beginning operation of the unit. Due to the prevalence of light hydrocarbons, a majority of chemicals used in this process are highly flammable and combustible. While these concerns are not uncommon at a petrochemical plant, the process, especially near the high temperature furnace and reactor system, should be monitored closely for loss of containment to mitigate the risk of a catastrophic event on-site.

4
Project Premises
The objective is to produce polymer grade propylene (>99.5 mol%) from a feedstock with a flowrate of 1950 kmol/hr and the following molar composition: 96.75% propane, 2.9% ethane, 0.27% methane, and 0.01% ethylene. The plant is to be located in the Gulf Coast of the United States onto an existing plant. Energy and labor costs will also be purchased from the Gulf Coast. The plant will begin operating on January 1st of 2025, operate for 10 years, and will have a two-year construction period starting in January 1st of 2023. It is assumed that the plant operates for 330 days every year and 24 hours each day and that all by-products generated will be sold.
To assess the profitability of the project, the project must meet or exceed a hurdle rate of 25% and the NPV will be evaluated at a 15% interest rate. The 15% discount factors are provided in Table 3. The project’s FCI is calculated using the Chilton method and depreciation on the equipment is evaluated using the MACRS 7-year factors provided in Table 2. We estimate that plant will be subjected to a tax rate of 40%. Additionally, due to insufficient historical data on many utilities used in the process, we assume that all utilities index with natural gas and the cost is inflated at a rate of 2% each year. Spot pricing for each utility at a specified year is provided in Table 1. Table 1: Summary of Base Utility Costs (Indexed Costs in Appendix E)
Utility Costs (2016) Utility Costs (2019)
Propylene = $0.95/kg Propane = $5/MMBtu
Natural gas = $2.52/MMBtu LP Steam = $3/MMBtu
Cooling water = $0.023/m3
Table 2: MACRS 7-Year Depreciation Factors Used to Depreciate FCI
Year Depreciation Percent
1 14.3%
2 24.5%
3 17.5%
4 12.5%
5 8.9%
6 8.9%

5
Table continued from previous page.
Year Depreciation Percent
7 8.9%
8 4.5%
Table 3: Discount Factors at an Interest Rate of 15%
Year Number Discount Factor (15%) Type
-2 1.166 Uniformly
-1 1.079 Uniformly
0 1 Instantaneous
1 0.929 Uniformly
2 0.799 Uniformly
3 0.688 Uniformly
4 0.592 Uniformly
5 0.51 Uniformly
6 0.439 Uniformly
7 0.378 Uniformly
8 0.325 Uniformly
9 0.280 Uniformly
10 0.241 Uniformly
End of 10 0.223 Instantaneous

6
Process Description
This process produces polymer-grade propylene from a high-purity propane feed with an 80% overall conversion of propane to propylene. A detailed process diagram showing all unit operations is provided in Appendix C, details of the heat and material streams are provided in Appendix D, and detailed equipment descriptions are provided in Appendix B. The process feed combines with a high purity recycle stream and enters the depropanizer column. In this column all C4+ components are separated out to be sold as fuel gas. The depropanizer distillate is sent to a subzero temperature coldbox which acts as an autorefrigerator to cool the stream before it is sent to a series of fluidized bed reactors. In the reactor system propylene and hydrogen are created from a catalyzed propane dehydrogenation reaction. Additionally, several side products are formed including, benzene, ethane, ethylene, i-butane, methane, methyl-acetylene, n-butane, propadiene, and toluene. The reactor effluent is sent to a series of four compressors and coolers which increase the pressure and cool the temperature of the gaseous mixture. From the compressor train, the process fluid is sent through a series of heat exchangers to utilize the excess heat from the final compression step to heat other parts of the process. Then, this stream is sent back to the coldbox to remove hydrogen from the hydrocarbon fluid. A portion of the hydrogen is sent for further purification in a pressure swing adsorption unit, while the rest of the hydrogen is combined with the depropanizer distillate or sent to the selective hydrogenation (diolefin) reactor. In the selective hydrogenation reactor, any propadiene or methyl-acetylene formed in the reactor system is converted to propylene. Finally, to further purify the hydrocarbon stream, it is sent to two additional distillation columns: a deethanizer column and a propylene-propane splitter. In the deethanizer column, the majority of the light components are removed to be sold as additional fuel gas. In the splitter, the propylene-rich distillate is separated from propane plus any trace C2 components and is collected as product. Depropanizer Column and Hydrogen Mixer
The process feed (96.8 mol% propane, 1950 kmol/hr) is first combined with a propane-rich recycle stream (99.9 mol% propane) from the downstream propylene-propane splitter. The combined stream is sent to a depropanizer column which removes components with volatilities lower than propane (i-butane, n-butane, benzene, toluene) that may have formed from side reactions in the process. These C4+ components are collected in the bottoms of column at a rate of 10 kmol/hr to sell as fuel gas at a lower heating value @15°C of 0.02 MMBtu/lb. The molar composition of this by-product stream is 48.9% propane/25.1% benzene/15.7% isobutane/10% toluene. Low pressure steam is used in the total condenser on the column, causing the distillate to leave as a liquid with a flowrate of 5316 kmol/hr and a composition of 98.8% propane/1% ethane.
Since the separation between C4 and C3 components is relatively simple the column is small with a diameter of 4.88 m and a tangential height of 14.0 m. The column contains 29 actual trays, each with a tray efficiency of 0.8 and 4 tray passes and runs at a reflux ratio of 1. Since the column operates at intermediate temperatures that fall between 50-100°C the vessel and trays are constructed of carbon steel.

7
Before entering the coldbox, the depropanizer distillate is then combined with excess hydrogen produced downstream. This hydrogen addition is necessary to protect the catalyst downstream from being poisoned. It is hypothesized that the addition of hydrogen changes the oxidating and reducing environment over catalyst to reduce the formation of coke. This addition also reduces the temperature of the process stream from 49.5°C to 11.7°C by lowering the partial pressure of the hydrocarbon since hydrogen is a non-condensable gas. The temperature of the stream is lowered even further from 11.7°C to -39.7°C by dropping the pressure through a Joule-Thompson, or throttling, valve. This valve is insulated to allow the process is allowed to expand adiabatically. Since no heat is exchanged with the environment, the energy required for expansion comes from breaking bonds of material and the temperature drops. Lowering the temperature of the process stream to cryogenic values allow for a larger driving force to cool the hot effluent of the downstream compressor system. Additionally, the Joule-Thompson valve drops the pressure of the process stream from 17.7 bar to 2.0 bar since low pressures are required for propane dehydrogenation. Reactor System and Furnace
From the coldbox, the process stream is passed through a heat exchanger (Log Mean Temperature Difference (LMTD) = 61.1°C) which cross exchanges the downstream high temperature reactor outlet with the reactor inlet. This step preheats the reactor inlet from 1.5°C to 562.9°C which is the energy equivalent of 344 MMBtu/hr. Due to this process integration technique, the reactor A-frame furnace is only needed to heat the process 37.1°C and adjusts the flowrate of natural gas in the burner to reach the required reaction temperature of 600.0°C. Preheating the reactor feed reduces the amount of natural gas required as fuel for the process furnace and the amount of flue gas produced, reducing the required cost of emissions credits.
The process fluid then enters a series of fluidized bed reactors at 600°C and 1.4 bar. The reactor system was modeled as two reactors, although the actual process may contain up to four reactors in series. The main propane dehydrogenation reaction was modeled using a REquilibrium reactor since the reaction occurs in a single-phase and was assumed to reach equilibrium. All side reactions were modeled in a RStoic reactor since the side reactions’ kinetics were unknown and all extents of reactions were approximated. While not truly representative of the “real world” process, since the reaction is highly endothermic, the reactors were modeled isothermally to represent the existence of interstage heaters between each dehydrogenation reactor.
The reactor system has a single pass conversion of 34.6% and produces 1693 kmol/hr of propylene. The process fluid exits at a flowrate of 9263 kmol/hr with a composition of 40.0% hydrogen/38.1% propane/18.2% propylene/3.7% other hydrocarbon material. Each piece of equipment is constructed from Hastelloy steel, a nickel-based alloy, since the material has a high resistance to cracking when subjected to routine high temperature service.
The catalytic dehydrogenation of propane shown in Equation 1 requires high temperatures due to its highly endothermic nature (ΔH298°C = 124 kJ/mol) which is also shown by the 38°C temperature drop from the reactor inlet (600°C) to outlet (562°C) (DeLancey, 2013). This reaction is also run completely in the vapor phase at a low pressure of 1.38 bar, to shift the equilibrium towards the propylene product by Le Chatlier’s principle. This must be balanced by

8
the amount of hydrogen fed back to reactor system, which shifts the equilibrium away from the products by the same principle. Several undesired side products including benzene, ethane, ethylene, i-butane, methane, methyl-acetylene, n-butane, propadiene, and toluene are produced in the reactor system. While the exact reaction pathways of the byproducts are not known, they can be approximated by the reactions shown in Equations 1-7.
A PtSn/ɣ-Al2O3 catalyst (composition = 1.0% Pt/1.6% Sn/ 97.4% ɣ-Al2O3) was chosen for the reactor system since platinum has a high activity for activating carbon-hydrogen bonds, and a relatively low activity for the rupture of carbon-carbon bonds. Additionally, scientific literature has shown that adding a low concentration of tin to a Pt/Al2O3 catalyst can increase its selectivity to propylene to over 99% and can increase its stability by inhibiting cracking and isomerization reactions (Siri, 2005). Although chromia oxide is a common catalyst used in the dehydrogenation of propane, it was not chosen for this system since it has a lower selectivity towards propylene, leading to lower yields of the desired product (Herauville, 2012). One drawback of using PtSn/ɣ-Al2O3 catalysts include short lifetimes of roughly 3-years, so continuous catalyst regeneration is required (Yu, 2012). This process continuously removes spent catalysts, burns off any coke that has formed during the reaction, removes any excess moisture, and redistributes the catalyst metal. A full regeneration cycle is generally completed within 5-10 days (Stijepovic, 2010).
𝐶3𝐻8 ↔ 𝐶3𝐻6 + 𝐻2 (1)
𝐶3𝐻6 ↔ 𝐶3𝐻4 + 𝐻2 (2)
𝐶3𝐻4 (𝑝𝑟𝑜𝑝𝑦𝑛𝑒) ↔ 𝐶3𝐻4 (𝑝𝑟𝑜𝑝𝑎𝑑𝑖𝑒𝑛𝑒) (3)
𝐶3𝐻8 + 𝐻2 ↔ 𝐶2𝐻6 + 𝐶𝐻4 (4)
2(𝐶3𝐻6) ↔ 𝐶6𝐻6 + 𝐻2 (5)
𝐶2𝐻6 ↔ 𝐶2𝐻4 + 𝐻2 (6)
𝐶6𝐻6 + 𝐶𝐻4 ↔ 𝐶7𝐻6 + 𝐻2 (7)
Compressor and Cooling System Four centrifugal compressors are used in series to increase the pressure of the reactor
effluent from 1.4 bar to 103.4 bar. The outlet pressure of each compressor is measured, and gas turbines provide the driving force in the system to reach a compression ratio of approximately 3. Compression is a highly exothermic process and each compressor raises the temperature of the process by roughly 70°C. Therefore, coolers were placed after each compressor to prevent the process from reaching unsafe operating conditions and to decrease the outlet temperature each compressor to roughly 50°C.The LMTD of the cooler of the first compressor is roughly 30°C and the LMTDs of the coolers for the remaining compressors are roughly 40°C. A flash drum is used after each interstage cooler to remove any condensate that

9
may have formed when cooling the system. While during normal operation little condensate forms, due to the low mean-average boiling point of the mixture (-124.4°C), these flash drums are safety measures that protect the compressors from potential impeller damage or driver failure.
Since the compressor train is the second most energy-intensive part of the process, they are powered by gas turbines rather than an electric motor to reduce utility costs. Using gas turbines decreased the compressor utility cost from roughly $30 MM/year to $4 MM/year. Additionally, to decrease utility costs, the outlet streams of the first and second compressor stages are used for direct process heat integration. This reduces the load on the cooling utility system and decreases the amount of low-pressure steam required in the deethanizer reboiler and propane-propylene splitter reboiler by 320 MMBtu/hr and 322 MMBtu/hr, respectively. The high-temperature outlet of the first compressor transfers heat directly to the reboiler of the deethanizer column to increase the boilup temperature to 75.5°C. Additionally, the outlet of the first compressor transfers heat to the reboiler of the propane-propylene splitter to increase the boilup temperature to 58.3°C. Process Heat Exchangers and Coldbox
After the process pressure is increased the stream must be cooled to roughly -33.8°C before entering the coldbox. This is because the coldbox is used to separate hydrogen from the mixture by liquifying the hydrocarbon components. To cool the compressor effluent, it is first heat exchanged with the inlet to a downstream reactor (LMTD = 70.2°C). This exchange increases the diolefin reactor inlet to its required temperature of 60.9°C and cools the compressor outlet from 126.4°C to 79.0°C. Repurposing the energy of the compressor outlet saves roughly 37 MMBtu/hr of low-pressure steam. Then the process fluid is passed through a cooler (LMTD = 46.2°C), which adjusts the flowrate of cooling water to reach an outlet temperature of 54.4°C. This step is performed before running the process through a second heat exchanger since cooling water is a relatively cheap utility. In the second heat exchanger (LMTD = 60.1°C) the process temperature is lowered to 36.9°C so that a sufficient driving force exists across the coldbox to reach the cryogenic temperatures needed to liquify the C2 and C3 components in the process fluid.
In the coldbox, hydrogen is separated by liquifying the hydrocarbon stream and removing the hydrogen gas. The coldbox uses a “series of isentropic expansion, separation and subcooling” to reduce the pressure across its expanders, leading to auto refrigeration properties capable of liquifying the hydrocarbon material (El-Halwagi, 2018). To simplify the coldbox system, it is modeled as a heat exchanger and a flash drum. Due to its resistance to cracking at low and cryogenic temperatures SS 316 is the material of construction for the coldbox, cooler, and both heat exchangers. Pressure Swing Adsorption Unit
In the coldbox, 3842 kmol/hr of hydrogen is separated from the hydrocarbon stream and sent to a splitter. The splitter sends 2190 kmol/hr (57 mol%) of hydrogen to the dehydrogenation reactor system to reduce the amount of coke formed the catalyst, 5 kmol/hr (0.13 mol%) to the selective hydrogenation reactor to convert react with any diolefins in the

10
process, and 1647 kmol/hr (41.7 mol%) to a pressure-swing adsorption (PSA) unit for further purification.
Hydrogen sent to the PSA unit at -33.8°C is cross-exchanged with the deethanizer condenser to reduce the cost of propane refrigeration and heat the hydrogen stream to 41.0°C. This heat integration reduces the refrigeration load by 3.6 MMBtu/hr. While cross exchanging with the deethanizer condenser has a noticeable effect, its impact is minimized due to the decreased flowrate of hydrogen sent to the PSA unit since over 57% of the hydrogen on a molar basis is recycled to the reactor system. Additionally, hydrogen has a much lower gross heating value by volume as compared to heavier hydrocarbon streams (300 Btu/ft3 vs 2572 Btu/ft3 for propane) (Essom, 2019).
The PSA unit operates at a flash temperature of 35.3°C and a flash pressure of roughly 7 bar. It produces 1525 kmol/hr of high-purity hydrogen (99.99 mol%) and 122 kmol/hr of a hydrocarbon waste stream with a composition of 36.5% propane/28.3% methane/22.5% propylene/6.7% ethylene/5.9% ethane. The hydrocarbon stream will be sold as fuel gas and has a lower heating value @15°C = 0.02 MMBtu/lb. Pressure swing adsorption is favorable for this process since it is capable of producing very high purity hydrogen in quick cycles without having to operate at unreasonably high pressures or cryogenic temperatures, which can be costly. Additionally, the hydrogen is recovered and purified at a pressure close to the feed pressure. In this process, the hydrocarbon components bind to adsorbents in the PSA unit due to their higher polarities and affinities for the adsorbent materials. The unbound hydrogen is then removed from the unit and stored in high-pressure composite tanks or bottles. Then the pressure in the unit is lowered to desorb and collect the hydrocarbon stream and regenerate the adsorbent material (The Linde Group, 2019). Selective Dehydrogenation Reactor
After a majority of the hydrogen is removed from the main process stream it is sent to a selective hydrogenation reactor at 60.9C. The flowrate of the incoming process stream is measured, and a ratio controller is used to feed 1.5 times the stoichiometric proportion of hydrogen into the reactor. The reaction hydrogenates any diolefins formed from side reactions in the dehydrogenation reactor system, converting the unwanted propadiene and methyl-acetylene into propylene. The process converts roughly 5 kmol/hr of the diolefins into propylene, producing an outlet stream with a molar composition of 63.2% propane/30.1% propylene/2.6% hydrogen. While during normal operation this conversion is low, the selective dehydrogenation reactor acts as a failsafe. If process upsets occur and the generation of propadiene or methyl-acetylene is increased, the purity of the final product will not be affected. In the current process, 144 kmol/hr of hydrogen enters the reactor due to inadequate separation in the coldbox. While this is not properly represented in the process model, the excess flowrate of hydrogen will reduce the amount of propylene leaving the reactor by overreacting the olefins and causing them to revert back to propane. As later discussed, further optimization is required to increase the propylene yield.
This reaction is endothermic (Q = 0.2 MMBtu/hr) and occurs at a high pressure of 41.0 bar. Since the reaction predominantly occurs in the liquid phase a trickle bed reactor is used with a Pd/Al2O3 catalyst (composition = 0.13% Pd/ 0.87% Al2O3) (AIChE, 2019). This catalyst was chosen for its high thermal stability, high activity, and high tolerance toward moisture

11
(Resasco, 2000). The fixed bed reactor is made of carbon steel due to the intermediate reaction temperatures and the material’s excellent tensile strength and resistance to shock. Deethanizer Column
The deethanizer column removes a majority of the C2- components to further purify the hydrocarbon stream. This is a crucial step in the process because if a good separation is not achieved these light gases will be collected with propylene in the distillate of the downstream propane-propylene splitter, lowering the final product purity. The light gases (hydrogen, methane, ethane, ethylene) are collected as the distillate of the column to be stored in pressurized railroad tankcars and sold as fuel gas at a lower heating value @15°C of 0.02 MMBtu/lb. The flowrate of this by-product stream is 542 kmol/hr and has a molar composition of 25.6% hydrogen/25.3% propylene/18.5% ethane/12.7% ethylene/9.7% propane/8.1% methane. The bottoms stream is further purified downstream and leaves at a flowrate of 4879 kmol/hr and molar composition of 69.2% propane/30.7% propylene. Due to the large amount of propylene lost during the separation (137 kmol/hr) the reflux ratio and number of stages of the column should be increased to maximize the amount of propylene product that is collected.
The column has a diameter of 5.44 m and a tangential height of 29.3 m. The column contains 60 actual trays and runs at a reflux ratio of 10. Each tray has an efficiency of 0.8 and contains four tray passes. Since the column operates at intermediate temperatures that fall between 23-76°C, the vessel and trays are constructed of carbon steel.
Low pressure steam is used to supplement the energy provided by the first compressor outlet in the deethanizer reboiler. The boilup is recycled to the bottom of the column at a rate of 10021 kmol/hr and temperature of 75.5°C. Since cooling water is only able to lower the temperature of a process stream to 54.4°C it is not able to condense the deethanizer reflux which condenses at a temperature of 23.5°C. Therefore, propane refrigeration is required in the condenser to meet an energy load of 66.5 MMBtu/hr. Propane-Propylene Splitter
The separation of propane and propylene is extremely difficult since the vapor pressures of the two components are similar. In fact the relative volatility of propylene to propane at 43.3°C is 1.136 (Laurance, 1972). Due to these challenges, the separation requires a high reflux ratio of 50 and is the highest energy consumer in this process. The steam loads on the reboiler and condenser are 839 MMBtu/hr and 854 MMBtu/hr, respectively.
Additionally, this final purification step requires a very large propane-propylene splitter that is 111.56 m in tangential height, 10.67 m in diameter, and has 229 actual trays. Due to the proposed height of the tower and the notoriously windy conditions in the gulf coast region it is recommended to split the tower into two columns placed in series to prevent potential buckling. Both of the smaller propane-propylene splitters will have a height of roughly 56 m and 115 actual stages and are made of carbon steel. In this process configuration, which is depicted on the flow diagram 5 in Appendix C, the first column contains a kettle reboiler, but no condenser, and the second column contains a total condenser, but no reboiler. The distillate of the first column enters the second column below its bottom stage and the bottoms of the second column is recycled back above the top tray of the first column at a flowrate of roughly 73500 kmol/hr. The propane-rich bottoms of the first column is recycled to the beginning of the

12
process and combined with the initial propane feed at temperature of 58.3°C, pressure of 20.7 bar, flowrate of 3376 kmol/hr, and a molar composition of 99.9% propane.
At these conditions, 1503 kmol/hr of polymer grade propylene can be obtained at a temperature of 49.7°C and a pressure of 20.7 bar. The product stream is 99.6 mol% propylene and this high purity will be maintained by using an analyzer transmitter on the distillate line to control a valve on the second column recycle stream. Safety and Environmental Safety
With any process, it is important to understand the safety risks and costs associated with operating a plant. Some of the largest risks associated with the propane to propylene process involve the furnace, reactor, compressor train, cryogenic temperatures, and distillation columns. The Hazard and Operability Study (HAZOP) in appendix F can be used to give a more in depth understanding of the risks associated with the furnace, reactor, and compressor train, but the key hazards are highlighted here.
The NPFA ratings of the compounds found in the petrochemical process are shown in Table 4. As specified by 3+ flammability rating of all components, the process is largely at risk of combustion due to fire or an explosion. This risk is more intensified in some parts of the process, such as the reactor system. The reactor and its preheating furnace operate at roughly 600°C and 567°C, respectively. Therefore, the process must be well insulated to protect operators from burns while working in the area. Additionally, the autoignition temperatures of propane and propylene, the two predominant components in the process, are 455°C and 458°C, respectively (Engineering ToolBox, 2003). Therefore, the process operates above the autoignition temperature of the process fluid, which increases the operative dangers and the likelihood of a catastrophic event in this system. For example, a fire or explosion may occur if there is a loss of containment before or in the reactor system and the hot process chemicals reach an oxidation (air) source. To mitigate these hazards, we recommend building the furnace and reactor as far from any control rooms as possible to reduce the possibility of any employees being injured. Additionally, the natural gas feed to the furnace should fail-close in the event of a process upset to prevent continually adding fuel to an already out of control system. Furthermore, the furnace and reactor should have multiple layers of protection since they are crucial pieces of equipment and cannot be designed out of the system. For example, high temperature and pressure alarms should be incorporated into the control system to warn the operators of process issues, such as unintended combustion or a blockage downstream of the furnace or reactor. This would give the operator time to react to the situation and keep the process from reaching a hazardous situation. While adding alarms, a low-level protection, will give operators an opportunity to correct a problem before it catastrophically affects the unit, automatic, or mid-level, protections should also be in place. These automatic protections, such as an automatic system shutdown or pressure relief valves that lead to a flare, act as fail-safes in case operators are unable to reach the affected part of the system or cannot react fast enough.
A unique danger to the process is the byproduct of concentrated hydrogen. Hydrogen, especially in high concentrations, is very reactive to oxidizers and can cause violent explosions.

13
Therefore, any piece of equipment that is downstream of the coldbox should have very durable piping and undergo regular maintenance checks to prevent any leakage of this flammable gas. In this preliminary analysis we did not investigate methods of storage for all product streams, however, proper hydrogen storage is especially critical for the safety of the plant. Gaseous hydrogen will need to be contained in large spherical tanks, in a separate storage area, and must be monitored regularly for leaks to prevent any loss of containment.
Cryogenic temperatures, such as the temperature of the coldbox and the temperature of propane refrigeration, is another strong safety consideration. Just like excessively hot temperatures, very cold temperatures can burn operators upon exposure, so extra care should be taken to insulate any piping that may be subjected to temperatures under -20°C.
Another major opportunity for loss of containment and damage to the system is in the compressor system. If moisture enters a compressor it can throw the impeller off-balance and cause vibrations. Vibrations can pose a serious safety threat if they cause cracks or disjointment in or near the compressor, which directly allow for a loss of containment. To mitigate this risk, extra process equipment can be added to the design. For example, knockout drums are placed prior to each compressor to remove any condensate that may enter the system and damage the impeller. While the level of these knockout drums will still have to be monitored to ensure that the equipment is not being overfilled, adding this high-level protection greatly reduces the risk of a process fire due to the existence of multi-level protections.
Table 4: NPFA Ratings of all Process Components
Compound Health Flammability Reactivity
Propane 2 4 0
Hydrogen 0 4 0
Methane 1 4 0
Ethane 1 4 0
Ethylene 2 4 2
Propadiene 0 4 3
Methyl-Acetylene 1 4 3
Isobutane 0 4 0
N-Butane 1 4 0
Benzene 2 3 0
Toluene 2 3 0
Propylene 1 4 1

14
Environmental In addition to analyzing potential safety hazards, it is also important to understand the
environmental impacts a plant can have, specifically towards air and water quality. Our process primarily releases carbon dioxide as a by-product of the required utility loads. For example, when natural gas is burned as fuel in the reactor furnace, carbon dioxide is released to the environment due to combustion of the hydrocarbon. Each year, our plant is projected to produce 176,000 metric tons/year of carbon dioxide equivalent (CO2e). Carbon dioxide equivalent is a method used to compare the emissions from various greenhouse gasses based upon their potential contribution to global warming (OECD, 2013). The emissions for specific pieces of process equipment is given in Table 5. Additionally, while explicit emissions rates for UOP’s catalyst regeneration system were unable to be calculated (due to the proprietary nature of the technology) we acknowledge that the continuous catalyst regeneration system used for the propane reactor will produce some additional carbon dioxide emissions. When the catalyst of the propane reactor system is regenerated, coke, carbon that has built up on the catalyst, is burnt off and carbon dioxide is released. From data sourced from the US Environmental Protection Agency, Texas petrochemical plants of similar size produced between 500,000 to 1,000,000 metric tons/year of CO2e in 2018. Additionally, DOW’s operations in Freeport, Texas, which contains a world-scale propylene plant, produced 4,130,000 metric tonnes/year of CO2e (U.S. EPA, 2019). This indicates that our emission levels are not unreasonable for a plant of our size. Since our unit is being added onto an existing plant in the Gulf Coast, there is a strong probability that the unit will be located in a nonattainment area and Sharif&Co. will be required to purchase emissions credits before emitting any additional chemicals into the air. While Texas has an extensive air quality permitting system, as specified by The Texas Commission on Environment Quality’s (TCEQ) Title V, there is not an emissions cost structure in place for the state of Texas at this time. However, two bills, House Bills 4599 and 223, are currently being debated in the state of Texas. If passed, then a $5/metric ton carbon tax will come into effect (NCEL, 2019) which would require our facility to pay a fee of roughly $882,000/year for our projected emissions. However, if Texas were to adopt the current European Union price for carbon tax at £24.10/metric tonne (~$26/metric ton), then our facility will need to pay a fee of $4,586,000/year for our projected emissions. This would decrease the NPV of the project by $15 MM.
The biggest usage of water in our proposed design is the cooling water utility on the compressor effluent cooler. The process requires 57,700,000 lb/hour of cooling water, or 4.5 E+11 lb/year. Depending on where along the Gulf Coast this unit will be built, Sharif&Co. will be required to purchase the rights to use surface water from the nearest river basin as shown in Figure 1. Most unreacted feedstock and by-products are recycled and combined with the feed of the process or sold as fuel gas streams. Therefore, these streams are not considered waste and will not be sent to a flare or produce additional emissions. Waste may be generated if errant temperatures exist in the compressor train and liquid condensate builds in the flash drums. We do not estimate the flowrate of these streams to be high since it mainly serves as a fail-safe if the process is not operating at the desired temperature. Therefore, these waste streams will be collected and sent for further treatment instead of investing in capital to vaporize the liquid condensate to sell as fuel gas.

15
Table 5: Carbon Dioxide and Equivalent Emissions by Equipment
Equipment Tag Hourly Emissions (kg/hr) Yearly Emissions (kg/yr)
Furnace E-1702 4,420 35,009,219
Compressor 1 C-1201 3,622 28,690,031
Compressor 2 C-1002 3,589 28,426,194
Compressor 3 C-1301 3,494 27,668,673
Compressor 4 C-1302 3,238 25,648,699
Deethanizer Column T-1501 3,921 31,055,591
Total 22,285 176,498,407
Figure 1. Common surface water sources (Texas river basins) along the Gulf of Mexico

16
Utilities
The propylene plant uses various utilities to power equipment and heat and cool process streams, including cooling water, natural gas (fuel gas), low-pressure steam, and propane for cooling. A preliminary utility cost estimate was generated using 2019 prices without using @Risk to model statistical variability. This rough analysis estimated the cost of utilities to be roughly $50 MM/year based on values provided in Table 6. More rigorous cost modeling is provided in Appendix E and the “Cost Estimate Summary” section of the report. Utility costs for specific pieces of equipment is given in Table 7. Note that before the process was optimized, electricity was the predominant utility for the system’s compressor train. However, this utility was changed to natural gas in the optimized case to reduce the total utility cost by roughly $20-25 MM/year.
While this spot price method is a good technique for generating a rough estimate of operating costs, the price of utilities, like other commodities can vary over time. In order to more accurately characterize the price of utilities, historical spot prices for natural gas provided by the U.S. Department of Energy was forecasted to the year 2035 using a mean reversion technique and @Risk. The remaining utilities were indexed to natural gas.
Utilities provide heat and cooling duties to the process where needed. Some of the utilities, such as cooling water and propane refrigeration, are treated as streams being cross-exchanged in a heat exchanger, while others are purchased based on the absolute energy needed. Cooling water is used only to decrease the temperature of the compressor effluent. This is because cooling water is a relatively inexpensive utility that is able to cool a stream to roughly 54°C. Its use is limited in this process, however, since most stream temperatures fall below 54°C, the cooling limit of cooling water. Steam is used as the main utility in the reboilers of each distillation column. This is because steam is a highly efficient heat source since its heat of condensation is high. Additionally, it is nontoxic, nonflammable, and inert to the components used in this process. Natural gas is used as the predominant utility in the compressor system and propane reactor furnace. While less environmentally safe, natural gas is preferred over electricity in the compressor system due to the high utility required. Natural gas is much cheaper per $MM/Btu than electricity and drives a cost savings of roughly $20-25 MM/year. Natural gas is also required in the process furnace to heat the process to 600°C since no other utility can reasonably reach such high temperatures. In the process simulation, natural gas was assumed to have a heating value of 600 kJ/kg with an inlet and outlet temperature of 1000°C and 600°C, respectively. Similarly, propane was used for the condenser of the deethanizer column since the temperatures required were too low for cooling water to be used. In the process simulation, the propane refrigeration was assumed to have a cooling value of -179 Btu/lb, the heat of vaporization of propane, with an inlet and outlet temperature of -34.4°C.

17
Table 6: Uninflated and Non-Indexed Utility Prices for the Optimized Design
Utility Rate of use
Units Base Cost Rate ($/Unit)
Usage Rate ($/hr)
Natural Gas (Compressors)
1.5E+8 Btu/hr $3.5/MMBtu 656
Steam 1.2E+6 lb/hr $3/MMBtu 9558
100 PSI Steam 3.6E+6 Btu/hr $3/MMBtu 11
Cooling Water 5.8E+7 lb/hr $0.03/m3 600
Natural Gas (Furnace) 7.1E+7 Btu/hr $3.5/MMBtu 317
Propane (Refrigerant) 6.6E+7 Btu/hr $5/MMBtu 192
Table 7: Detailed Equipment Utility Costs for the Optimized Design
Utility Equipment Description Duty (Btu/hr)
Usage (kg/hr)
Cost ($/hr)
Cooling Water Compressor outlet cooler 3.44E+07 781901 17.98
Cooling Water HX for Compressor 1 2.04E+07 464100 10.67
Cooling Water HX for Compressor 2 3.56E+07 810995 18.65
Cooling Water HX for Compressor 3 3.68E+07 837317 19.25
Cooling Water HX for Compressor 4 4.13E+07 938994 21.59
Cooling Water Depropanizer Condenser 1.27E+08 2.88E+06 66.30
Cooling Water Propane-Propylene Splitter
Condenser 8.55E+08 1.95E+07 447.41
Natural Gas Propane Reactor Preheating
Furnace 6.37E+07 112044 285.71
Low-Pressure Steam
Hydrogen Heater 3.64E+06 1836 10.928
Propane Refrigeration
Deethanizer Condenser 6.65E+07 168507 192.235

18
Table continued from previous page.
Utility Equipment Description Duty (Btu/hr) Usage (kg/hr) Cost ($/hr)
Natural Gas Compressor 1 3.56E+07 62654 678.75
Natural Gas Compressor 2 3.53E+07 62078 672.51
Natural Gas Compressor 3 3.44E+07 60424 654.58
Natural Gas Compressor 4 3.19E+07 56012 606.80
Economic Analysis
The NPV of this project, evaluated at a 15% interest rate, was $107 MM with a standard deviation of $146 MM and a 90% confidence interval of ± $2.4 (Figure 2). The IRR was 15.8% with a standard deviation of 4.5% and a 90% confidence interval of ± 0.07% (Figure 3). Since the project only has a 2.2% chance of meeting the specified corporate hurdle rate of 25%, this project is not economically practical and should not be evaluated further at this time. Since the NPV is positive, the process does make money if evaluated at a lower discount rate, but since the standard deviation of the estimated NPV is high there is an 18.7% chance that the project does not make a profit at all. Since this process will not reliability generate positive cash flows, it reinforces the fact that this project is not economically viable in its current state
The low NPV and unfeasible IRR are primarily driven by extremely variable propylene sales which shift the NPV between -$150 MM to $250 MM. The price of the propane feed also affects the profitability of the project, as it negatively skews the mean project NPV to -$30 MM. If we are able to find a reliable source of propane feedstock with a cost that averages closer to $0.954/gal vs. $0.96/gal (a 1% decrease from the projected price at the beginning of the project) this will produce cost-savings of roughly $3.7MM/year and increase the NPV by $12 MM. The effect of these variables on the mean NPV is shown in the tornado graph in Figure 4. This tool illustrates the parameters that most affect the reported NPV value, with the higher impact variables appearing at the top of the plot. Parameters that may show variability over time, but do not impact the mean NPV of the project, include any by-product flowrates (hydrocarbons or hydrogen separated by the pressure swig adsorption unit, C4’s collected from the bottoms of he depropanizer column, or light gases collected from the distillate of the deethanizer column) and hydrogen utility pricing. This statement is also supported by a breakeven analysis performed using Excel Solver. In this analysis only one variable was changed at a time to observe its individual impact on the project’s IRR. Please note that this analysis is extremely limited since it did not incorporate any statistical variability in utility pricing and did not consider any process impacts (such as larger equipment requirements or higher utility costs) associated with the increased flowrates. The required product flowrates and fixed capital

19
investment to meet the corporate hurdle rate of 25% are provided in Table 8. As seen in this table, just increasing the flowrate of one by-product stream is unreasonable. For the process to generate an IRR of 25% the by-product flowrates must increase by over 1000%. From this analysis, it can be seen that increasing propylene production by 36% (1.1E+09 lb/year to 1.44E+09 lb/yr), decreasing the fixed capital investment by 41%, or a combination of the two, are the most reasonable drivers to meeting the corporate hurdle rate. The amount of propylene produced can be increased by increasing the temperature of the reactor to 650°C or decreasing the amount of hydrogen recirculated back to the reactor system. This would increase its single-pass conversion from 34.6% to roughly 44%, the equilibrium conversion for the propane dehydrogenation reaction commonly cited in literature (Herauville, 2012). Additionally, inert gases, such as nitrogen or steam, can be added to the feed at constant pressure to shift the equilibrium of the reaction further towards the products. Experiments in literature have shown that this practice is capable of increasing the equilibrium to up to 64% (Resasco, 2000). In a similar vein, the amount of hydrogen entering the selective dehydrogenation reactor should be reduced by improving the LMTD and separation in the coldbox. Roughly, 144 kmol/hr enter the selective hydrogenation reactor when only 5 kmol/hr of diolefins are available to react during normal operation. This excess of hydrogen overreacts the olefins and cause these components to revert back to propane, decreasing the yield of propylene.
Others drivers that would help make this process economically feasible include decreasing the amount of propylene lost as a by-product in the deethanizer distillate by increasing the reflux ratio in the column and reducing and fixing the price of natural gas at $2.53/MMBtu, the projected price of natural gas at the beginning of operation. This is projected to increase the NPV of the project by $21 MM since a change in natural gas price affects all utility prices. While the fluctuating price of propylene significantly impacts the project NPV and IRR, it is not considered a controllable economic lever since the price is driven by multiple factors outside of the jurisdiction of the company, such as natural gas pricing and consumer demand for products manufactured using polypropylene.

20
Figure 2. Net present value distribution of the propylene process
Figure 3. Internal rate of return distribution of the propylene process

21
Figure 4. Sensitivity analysis tornado graph depicting how variable pricing and process
conditions affect the project’s mean NPV

22
Table 8: Required Product Flowrates and FCI to Meet 25% IRR
Cost Estimate Summary Overview
Net present value and internal rate of return were the two main levers used to evaluate the projected profitability of this project. Net present value indexes all cash flows over the lifetime of a project to a specific year to account for the time value of money. This allows for a more level comparison between capital projects that have different timelines. Internal rate of return calculates the discount rate that must exist over the lifetime of the project for all future cash flows to equal the initial project investment. This assesses the profitability of a specific project and is often compared against a set hurdle rate, or the minimum acceptable rate of return designated by a corporation. NPV and IRR values were calculated in Excel and used the @Risk add-in to model the potential variability in the amount of product generated by the process and raw material, equipment, and utility pricing.
The project’s NPV was determined by calculating the required fixed capital investment, sales, operating costs, working capital costs, and start-up expenses. The project’s fixed capital investment was assumed to be uniformly distributed over the course of two-years (2023-2024), the working capital costs and start-up expenses were realized as “negative expenses” at the start of the project (start of 2025), and the working capital was repaid at the end of the project

23
(end of 2035). The cash flows for each year were calculated using Equations 8-11 assuming a 40% tax rate, 7-years MACRS depreciation for the fixed capital investment, and a 15% discount rate. These calculations are also illustrated in Figure 5. All cash flows were summed to calculate the project’s NPV and Excel’s built-in functions were used to calculate the project’s IRR. Detailed values for all of these calculations are provided in Appendix E.
Operating Income = Sales − Operating Costs (8)
Net Profit Before Taxes = Operating Income − Depreciation (9)
Net Profit After Taxes = 0.6 ∗ (Net Profit Before Taxes) (10)
Cash Flow = Net Profit After Taxes + Depreciation (11)
Figure 5. Flow diagram showing the calculations of yearly project cash flows Bare Equipment Costs and Fixed Capital Investment
The project’s bare equipment cost was estimated at $77.96 MM with a standard deviation of $2.98 MM for the year 2023 and $78.03 MM with a standard deviation of $2.98 MM for the year 2024. These costs were predominantly based off estimates generated in ASPEN Plus, accounting for potential variation up to ±30%. Since these estimates were assumed to be accurate for the year 2019, half of the bare equipment cost for each item was inflated to the year 2023 and half was inflated to the year 2024 using the CE cost index and Equations 12-14. Since ASPEN could not generate accurate bare equipment costs for the pressure swing adsorption (PSA) unit, this value was assumed to be $4 MM in 2019. Additionally, the installed

24
cost of the reactor and catalyst regeneration system was assumed to be $46 MM in 2016. The contribution of each piece of equipment’s cost to the total, inflated bare equipment cost is shown in Figure 6.
CE Factor in Year X = 2.0664 ∗ Year X − 3593.1 (12)
CE Factor in Year Y = 2.0664 ∗ Year Y − 3593.1 (13)
Cost in Year X = Cost in Year Y ∗ (CE Factor in Year X / CE Factor in Year Y) (14)
Figure 6. Contributions of individual equipment to the total, inflate bare equipment cost
The project’s fixed capital investment (FCI) was approximately $461 MM. The FCI was estimated at $230 MM in the year 2023 (standard deviation of $14.2 MM) and at $231 MM in the year 2024 (standard deviation of $14.2 MM) as shown in Figures 8 and 9. These values were calculated using the Chilton Method with the inflated bare equipment costs. Figure 7 summarizes how the Chilton Method is executed and Table 9 summarizes the factors assumed for our project.
0.7%33.7%
2.5%
2.4%0.1%1.8%
0.8%0.8%
0.4%
18.6% 4.2%
34.0%
Coldbox
Compressors
Deethanizer Column
Depropanizer Column
Hydrogen Heater
Reactor Furnace
Process Integration HX's
Compressor Interstage Coolers
KO Drums
Propane-Propylene Splitter
Pressure Swing Adsorption Unit
Reactors and CCR

25
Figure 7. Chilton Method factors and calculations

26
Table 9: Assumed Chilton Factors to Estimate the Project’s Fixed Capital Investment
Cost Consideration Assumed Factor Description
Delivered Cost 1 N/A
Installed Cost 1.43 N/A
Process Piping 0.45 Fluid Plant
Instrumentation 0.16 Extensive Instrumentation
Buildings 0.20 Outdoor Plant
Auxiliaries 0.40 Major Addition to Plant
Outside Lines 0.10 Intermediate Line Length
Engineering and Construction 0.35 Intermediate Construction Difficulty
Contingencies 0.25 Project Subject to Change
Size Factor 0.025 Large Unit
Figure 8. Fixed capital investment variability for the year 2023, assuming an allowable ±30%
variation

27
Figure 9. Fixed capital investment variability for the year 2024, assuming an allowable ±30%
variation Sales
In this project, all waste streams will be sold to minimize the additional costs associated with releasing these streams into the environment. The flowrate of each product and waste stream was assumed to vary by ±10% and follow a normal statistical distribution. The depropanizer (C4) bottoms, deethanizer light gas distillates, and PSA unit hydrocarbons will be sold as fuel gas. The sales generated from these streams was calculated by multiplying the lower heating value (at 15°C) by the flowrate of each stream. Additionally, the 99.99% pure hydrogen stream generated from the PSA unit will be sold for its heating value assuming a heating rate of 300 Btu/ft3. The propylene product stream will be sold on a per weight basis and is commonly used to produce polypropylene for consumer goods. Sales per year over the lifetime of the project is provided in Table 12. Table 10: Product and Waste Stream Flowrates
Table 11: Waste Stream Lower Heating Values at 15°C

28
Table 12: Sales Generated per Year for Product and Waste Streams
Operating Costs
Several operating costs were required for the process including the propane feedstock, utilities (low pressure steam, cooling water, natural gas, and propane refrigeration), and labor. To estimate the utility costs for natural gas and wholesale propane, historical spot prices were taken from the U.S Energy Information Administration and corrected for a 2% yearly inflation using Equation 15. Then, these prices were forecasted using the mean reverting equation shown in Equation 16. This technique assumes that while there may be random, short term variations in commodity pricing, the prices will ultimately revert to an overall, long-term equilibrium value. Since multi-year pricing was not available for the remaining utilities and propylene it was not possible to apply the mean reverting process to forecast these costs. Instead, the price of cooling water, low pressure steam, propane refrigeration, and propylene was assumed to track with the inflated price of natural gas since natural gas is closely associated with the production of these commodities. This meant that, for example, if the price of natural gas increased by 50% from the year 2024 to 2025, the price of cooling water was expected to increase by roughly 50% from 2024 to 2025 as well. Pricing for cooling water and propylene in 2016 was taken from Sustainable Process Design Approach for On-Purpose Propylene Production and Intensification (El-Halwagi, 2018). Prices for low pressure steam and propane refrigeration in 2019 were estimated to be $3/MMBtu and $5/MMBtu, respectively. Since hydrogen pricing is complex and the market is extremely closed off the price of hydrogen was estimated to be two times the price of natural gas per MMBtu. Labor costs were calculated based on an estimated 2019 base salary of $80,000 per year for plant operators, benefits totaling 30% of the base salary, and 20 operators on payroll. Requiring 20 operators for this facility assumed that there would be four teams of 5 operators. Of the four groups, three would work 8-hr shifts and one would be off-rotation for the week. These costs were inflated by 2% every year until the end of the project life. Operating costs per year over the lifetime of the project is provided in Table 14.

29
Inflated Price in Year X = Uninflated Price in Year X ∗ (1.02)(Year X − Year 1) (15)
𝑉𝑡+1 = 𝑉𝑡 + η ∗ (𝑉𝑏𝑎𝑟 − 𝑉𝑡) + 𝜖𝑡 (16)
Table 13: Operating Cost Process Flowrates and Energy Rates
Table 14: Operating Costs per Year for All Process Utilities
Working Capital
Working capital for the project was estimated at $76.9 MM. The working capital costs associated with this project include two-months of feedstock and the reactor catalysts. Two months of feedstock is required before beginning the project because after the propylene product is sold, clients are given 60-days to pay for the goods. Therefore, two months represents the maximum time frame the plant may need to operate without receiving revenue. Due to the complex nature of catalyst pricing and the information provided as part of the
Where,
Vt+1 = price at year t + 1
Vt = price at year t
η = mean reversion speed
ϵt = normally distributed error term
Vbar = long term mean

30
project’s premise it was assumed that the cost of the catalyst for all reactors was included as part of the FCI calculations. Start-up expenses were estimated at $2.1 MM and included one year’s worth of labor costs for plant operators as previously discussed in this report.
Innovation and Optimization
Propylene production through propane dehydrogenation is widely regarded as one of the most energy intensive processes in the petrochemical industry, due to the difficult separation of propane and propylene. Therefore, research concerning the optimization of propane dehydrogenation usually centers on how to make the process less energy intensive to decrease operating costs, decrease harmful environmental emissions, and increase the overall profitability of the unit. Therefore, when optimizing base case design, we predominantly focused on ways we were able to use process heat integration to reduce the utility loads in our process.
We identified and incorporated six heat integration techniques and have summarized the energy savings from each in Table 15 and Figure 10. With direct process heat integration, heat is transferred directly from one process stream to the other in a single heat exchanger. This reduces the demand and cost of utilities in heating or cooling the process. An example of this is shown in the propane reactor system. The hot outlet of the propane (567°C) reactor is cross-exchanged with the cool inlet of the reactor system (1.5°C). This preheats the feed to the reactor to 527°C, reducing the amount of natural gas needed to be burned in the furnace directly downstream. Using this heat integration technique resulted in a utility load savings of 344 MMBtu/hr and a cost-savings of roughly $9 MM/year.
Process heat integration was also used to heat the inlet to the diolefin reactor from 3.8°C to 61°C using the high-temperature effluent of the compressor train (126°C). This effectively bypassed the need to use low-pressure steam to heat the inlet to the diolefin reactor and helped reduce the compressor effluent temperature to 79°C. This was a positive effect since it helped the compressor effluent decrease its temperature to a safer operating value. Additionally, before the compressor outlet enters the coldbox it must cool further to 37°C to achieve the necessary driving force for effective hydrogen separation. This heat integration technique saved 37 MMBtu/hr in steam energy requirements and saved $700,000/year in operating costs.
Another cross-exchange was used to decrease the compressor outlet temperature to a suitable value before entering. This heat exchanger cross-exchanged the coldbox outlet (-34°C) with the compressor effluent cooled to 54°C. Using process integration to further drop the temperature of the compressor effluent was extremely useful since it avoided the need to use costly propane refrigeration to reach cryogenic temperatures. This produced an energy savings of roughly 20 MMBtu/hr and saved $700,000/year.
Since the compressor outlet leaves each compression stage at a high temperature of ~120°C, the high energy process stream can be used to transfer heat to cooler streams in the process. The outlets of the first and second stages of compression were used to transfer heat to the process’s propane-propylene splitter reboiler and deethanizer reboiler, respectively. This decreased the amount of steam required in each reboiler to heat the process fluid to its boiling point and removed heat from the compressor train, increasing the compressors’ efficiencies.

31
This process improvement produces energy savings of 322 MMBtu/hour and 320 MMBtu/hour, respectively. The combination of the two heat integration methods increased profitability by $11.4 MM/year.
Finally, cold hydrogen that was sent to the PSA unit at -33.8°C was cross-exchanged with the deethanizer condenser to reduce the cost of propane refrigeration and heat the hydrogen stream to 41.0°C. This heat integration reduced the refrigeration load by 3.6 MMBtu/hr and saved $220,000. While cross exchanging with the deethanizer condenser has a noticeable effect, its impact is minimized due to lower gross heating value of hydrogen by volume as compared to heavier hydrocarbon streams (300 Btu/ft3 vs 2572 Btu/ft3 for propane) (Essom, 2019).
In total, using heat integration techniques saved Sharif&Co. from purchasing 1047 MMBtu/hr worth of extra utilities in the form of natural gas, low-pressure steam, cooling water, and propane refrigeration. Additionally, this increased the project’s profitability by $22 MM/year. Using heat integration techniques was extremely profitable since the added cost of heat exchangers to facilitate these cross-exchanges paled in comparison at $782,000. This indicated a highly successful return on investment of 13 days.
While not investigated in this project due to lack of time, another way to further incorporate direct process heat integration is to use the high temperature outlet of the third compressor in series help heat the boilup in the reboiler of the depropanizer column at the beginning of the process. In addition to heat integration through heat exchangers, a heat pump can be used to improve our process savings. Heat pumps operate by “moving thermal energy in the opposite direction of spontaneous heat transfer, by absorbing heat from a cold space and releasing it to a warmer one” (Finn Geotherm, 2019). Scientific literature estimates that integrating two heat pumps in series on the reboiler of the propane-propylene splitter can reduce its steam load and lead to a reduction in utility cost by 50%. This is an estimated cost savings of $15 MM/year, since steam, specifically on the propane-propylene splitter, is the most costly utility in this design. Additionally, using heat pumps is estimated to reduce capital costs for propane-propylene splitter by 17% (generating a cost savings $3 MM). This is because less steam is required in the condenser and reboiler of the column, allowing the column to operate at lower pressure, and increasing the separation between the propane-propylene components. This then reduces the size of the column by requiring less stages in the column to achieve the same separation. This may enable to consolidation of the proposed two-column splitter into one unit. Implementing these further process changes will increase the NPV significantly by roughly$96 MM.

32
Table 15: Energy Savings from Each Heat Integration Method
Heat Integration Methods Energy Savings
(MMBtu/hr)
H2 Stream to Deethanizer Condenser 3.6
Compressor Outlet Cooler 20
Diolefin Reactor Cross-Exchange 37
Second Compressor to Deethanizer Column 320
First Compressor to Propane-Propylene Splitter 322
Propylene Reactor Inlet/Outlet Cross-Exchange 344
Figure 10. Percent of total cost-savings for each heat integration technique
1% 3%3%
26%
26%
41%
H2 Stream to DeethanizerCondenser
Compressor Outlet Cooler
Diolefin Reactor CrossExchange
Second Compressor toDeethanizer Column
First Compressor to Propane-Propylene Splitter
Propylene Reactor Inlet-Outlet Cross-Exchange

33
References
Agarwal, A., Sengupta, D., & El-Halwagi, M. (2018). Sustainable Process Design Approach for
On-Purpose Propylene Production and Intensification. ACS Sustainable Chemistry &
Engineering, 6(2), 2407–2421. doi: 10.1021/acssuschemeng.7b03854
AIChE. (2019, August 13). Modelling of an Industrial Trickle Bed Reactor for Mapd Selective
Hydrogenation with CFD Assistance. Retrieved December 3, 2019, from
https://www.aiche.org/academy/videos/conference-presentations/modelling-
industrial-trickle-bed-reactor-mapd-selective-hydrogenation-cfd-assistance.
DeLancey, G. (2013). Principles of chemical engineering practice. Hoboken, NJ: Wiley.
Engineering ToolBox, (2003). Fuels and Chemicals - Autoignition Temperatures. [online]
Retrieved December 4th, 2019, from https://www.engineeringtoolbox.com/fuels-
ignition-temperatures-d_171.html.
Essom Co. LTD. (n.d.). Heating Values of Hydrogen and Fuels. Retrieved December 3, 2019, from
https://chemeng.queensu.ca/courses/CHEE332/files/ethanol_heating-values.pdf.
Finn Geotherm. (2019). The History of Heat Pump Technology. Retrieved December 8, 2019,
from https://finn-geotherm.co.uk/the-history-of-heat-pumps/.
Herauville, V. M. (2012, June). Catalytic Dehydrogenation of Propane. Catalytic
Dehydrogenation of Propane.
Laurance, D. R., & Swift, G. W. (1972). Relative volatility of propane-propene system from 100-
160.deg.F. Journal of Chemical & Engineering Data, 17(3), 333–337. doi:
10.1021/je60054a011

34
NCEL - Carbon Pricing. (2019). Retrieved December 4th, 2019 from:
https://www.ncel.net/carbon-pricing/#stateinfo.
OECD. (2013, April 4). Glossary of Statistical Terms. Retrieved December 8, 2019, from
https://stats.oecd.org/glossary/detail.asp?ID=285.
Prices under pressure: Ceresana analyzes the global market for propylene. (2014, Dec 04).
Progressive Digital Media Packaging News Retrieved from
http://ezproxy.lib.utexas.edu/login?url=https://search.proquest.com/docview/1630225
841?accountid=7118
Resasco, D. E. (2000, January). Encyclopedia of Catalysis. In Encyclopedia of Catalysis. Retrieved
from http://www.ou.edu/catalysis/pubs/2003-1.pdf
Siri, G. J., Ramallo-López, J. M., Casella, M. L., Fierro, J. L., Requejo, F. G., & Ferretti, O. A. (2005).
XPS and EXAFS study of supported PtSn catalysts obtained by surface organometallic
chemistry on metals. Applied Catalysis A: General, 278(2), 239–249. doi:
10.1016/j.apcata.2004.10.004
Staff, C. M. 2016. Everything You Need To Know About Polypropylene (PP) Plastic. Retrieved
from https://www.creativemechanisms.com/blog/all-about-polypropylene-pp-plastic.
Stijepovic, M. Z., Linke, P., & Kijevcanin, M. (2010). Optimization Approach for Continuous
Catalytic Regenerative Reformer Processes. Energy & Fuels, 24(3), 1908–1916. doi:
10.1021/ef901193v
The Linde Group. (n.d.). Hydrogen Recovery by Pressure Swing Adsorption. Retrieved December
3, 2019, from https://www.linde-
engineering.com/en/images/HA_H_1_1_e_09_150dpi_NB_tcm19-6130.pdf.

35
U.S. Department of Energy. (2019, November 27). Henry Hub Natural Gas Spot Price. Retrieved
December 2, 2019, from https://www.eia.gov/dnav/ng/hist/rngwhhdA.htm.
U.S. Department of Energy. (2019, November 27). Gulf Coast (PADD 3) Propane
Wholesale/Resale Price. Retrieved December 2, 2019, from
https://www.eia.gov/dnav/pet/hist/LeafHandler.ashx?n=PET&s=M_EPLLPA_PWR_R30_
DPG&f=M .
U.S. Environmental Protection Agency. (2019, August 4). 2018 Greenhouse Gas Emissions from
Large Facilities. Retrieved December 8, 2019, from https://ghgdata.epa.gov/.
Yu, H., Mao, Z., Dai, W., Peng, J., Zhai, M., & Wei, G. (2012). Highly selective Pd/Al2O3 catalyst
for hydrogenation of methylacetylene and propadiene in propylene stream prepared by
γ-radiation. Applied Catalysis A: General, 445-446, 246–251. doi:
10.1016/j.apcata.2012.08.036

36
Appendix A
Equipment List
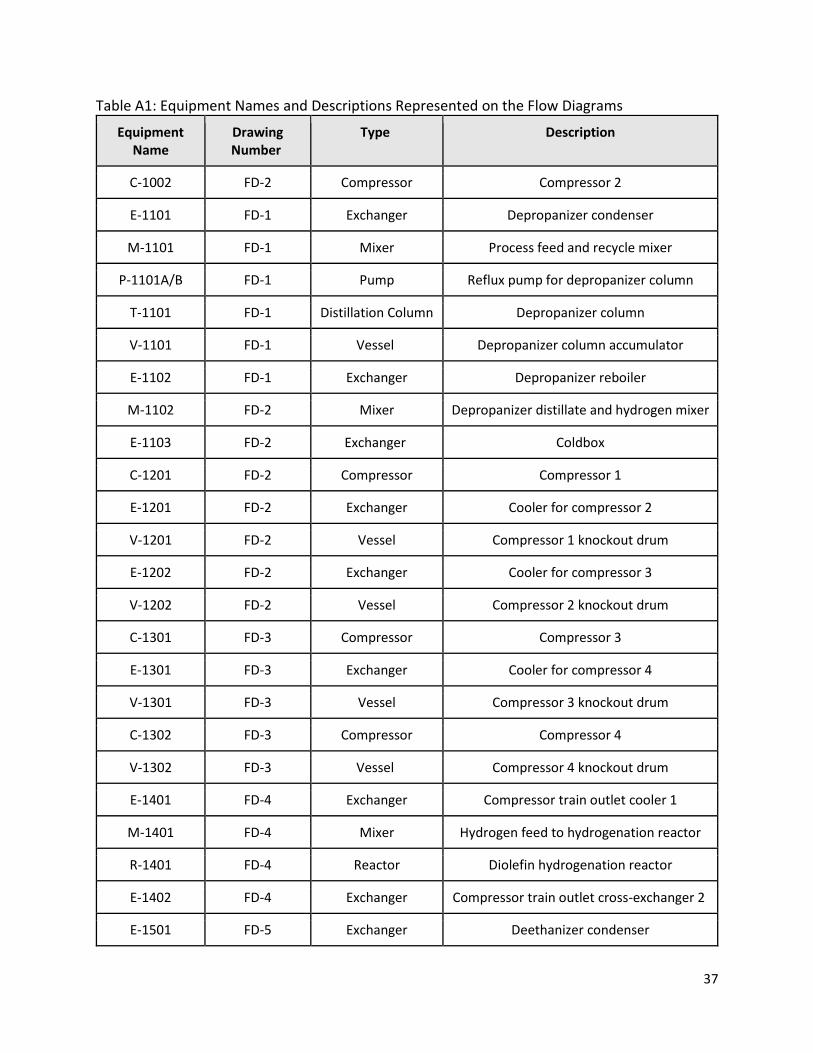
37
Table A1: Equipment Names and Descriptions Represented on the Flow Diagrams
Equipment Name
Drawing Number
Type Description
C-1002 FD-2 Compressor Compressor 2
E-1101 FD-1 Exchanger Depropanizer condenser
M-1101 FD-1 Mixer Process feed and recycle mixer
P-1101A/B FD-1 Pump Reflux pump for depropanizer column
T-1101 FD-1 Distillation Column Depropanizer column
V-1101 FD-1 Vessel Depropanizer column accumulator
E-1102 FD-1 Exchanger Depropanizer reboiler
M-1102 FD-2 Mixer Depropanizer distillate and hydrogen mixer
E-1103 FD-2 Exchanger Coldbox
C-1201 FD-2 Compressor Compressor 1
E-1201 FD-2 Exchanger Cooler for compressor 2
V-1201 FD-2 Vessel Compressor 1 knockout drum
E-1202 FD-2 Exchanger Cooler for compressor 3
V-1202 FD-2 Vessel Compressor 2 knockout drum
C-1301 FD-3 Compressor Compressor 3
E-1301 FD-3 Exchanger Cooler for compressor 4
V-1301 FD-3 Vessel Compressor 3 knockout drum
C-1302 FD-3 Compressor Compressor 4
V-1302 FD-3 Vessel Compressor 4 knockout drum
E-1401 FD-4 Exchanger Compressor train outlet cooler 1
M-1401 FD-4 Mixer Hydrogen feed to hydrogenation reactor
R-1401 FD-4 Reactor Diolefin hydrogenation reactor
E-1402 FD-4 Exchanger Compressor train outlet cross-exchanger 2
E-1501 FD-5 Exchanger Deethanizer condenser

38
Continued from previous page.
Equipment Name
Drawing Number
Type Description
P-1501A/B FD-5 Pump Reflux pump for deethanizer column
T-1501 FD-5 Distillation Column Deethanizer column
V-1501 FD-5 Vessel Deethanizer column accumulator
E-1502 FD-5 Exchanger Deethanizer reboiler
P-1502A/B FD-5 Pump Reflux pump for C3-splitter
T-1502 FD-5 Distillation Column C3-splitter 1
V-1502 FD-5 Vessel C3-splitter accumulator
E-1503 FD-5 Exchanger C3-splitter reboiler
T-1503 FD-5 Distillation Column C3-splitter 2
E-1504 FD-5 Exchanger C3-splitter condenser
E-1601 FD-6 Exchanger Hydrogen heater
S-1601 FD-6 Splitter Hydrogen Splitter
V-1601 FD-6 Vessel Hydrogen flash drum
V-1602 FD-6 Vessel(s) Pressure swing adsorption unit
E-1701 FD-7 Exchanger Dehydrogenation reactor inlet and outlet cross-exchanger
R-1701 FD-7 Reactor Propane dehydrogenation reactor 1
E-1702 FD-7 Exchanger Hydrogenation reactor furnace
R-1702 FD-7 Reactor Propane dehydrogenation reactor 2
E-1703 FD-7 Exchanger Cooler for compressor 1
39
Appendix B
Equipment Specifications

40
Table B1: Coldbox Equipment Details
Coldbox
Name E-1103 Description process coldbox Bare Equipment Cost USD 371,878
Vessel Material SS 316
Heat Transfer Area m2 780.73 Duty Btu/hr 5.77E+07 Hot Side Temperature In C 36.85 Hot Side Temperature Out C -33.79 Cold Side Temperature In C -39.42 Cold Side Temperature Out C 1.50 LMTD C 25.48
Tube Material SS 316 Tube Design Gauge Pressure barg 103.96 Tube Design Temperature C 121.11 Tube Operating Temperature C 36.85 Tube Side Flow kmol/hr 9263.37 Shell Material SS 316 Shell Design Gauge Pressure bar 68.97 Shell Design Temperature C 21.11 Shell Operating Temperature C 1.50 Shell Side Flow kmol/hr 7506.45

41
Table B2: Compressor Equipment Details
Compressors
Name C-1201 C-1202 C-1203
Description reactor effluent compressor 1 reactor effluent compressor 2 reactor effluent compressor 3
Bare Equipment Cost USD 17,983,165 8,851,518 3,311,547
Actual Gas Flowrate - Inlet L/min 2.99E+06 1.08E+06 3.62E+05
Design Pressure - Inlet barg 0.37 2.78 10.02
Design Pressure - Outlet barg 3.12 10.36 32.08
Design Temperature - Inlet C 50.00 50.00 50.00
Design Temperature - Outlet C 117.86 118.69 121.06
Molecular Weight 26.24 26.24 26.24
Specific Heat Ratio 1.18 1.19 1.21
Compressibility Factor - Inlet 1.00 0.99 0.96
Compressibility Factor - Outlet 0.99 0.98 0.95
Casing Material CS CS CS
Compressor Type Centrifugal Centrifugal Centrifugal
Compressor Efficiency 0.8 0.8 0.8
Motor Efficiency 0.98 0.98 0.98
Driver Type Gas Turbine Gas Turbine Gas Turbine
Driver Power kW 10442.34 10346.31 10070.59

42
Table continued from previous page.
Compressors cont.
Name C-1204 Description reactor effluent compressor 4 Bare Equipment Cost USD 2,552,346
Actual Gas Flowrate - Inlet L/min 1.06E+05 Design Pressure - Inlet barg 33.46 Design Pressure - Outlet barg 102.41 Design Temperature - Inlet C 50.00 Design Temperature - Outlet C 126.41 Molecular Weight 26.24 Specific Heat Ratio 1.33 Compressibility Factor - Inlet 0.88 Compressibility Factor - Outlet 0.90
Casing Material CS Compressor Type Centrifugal Compressor Efficiency 0.8 Motor Efficiency 0.98 Driver Type Gas Turbine Driver Power kW 9335.38

43
Table B3: Distillation Column Equipment Details
Distillation Column
Name T-1101 T-1501 T-1502/T-1503
Description de-propanizer column de-ethanizer column C3-splitter
Bare Equipment Cost USD 985,071 1,543,499 15,356,408
Base Material CS CS CS
Column Diameter m 4.88 5.44 10.67
Tangent to Tangent Height m 14.02 29.26 111.56
Design Gauge Pressure bar 18.43 33.46 23.12
Pressure Drop bar 0.14 0.35 1.21
Design Temperature C 121.11 121.11 121.11
Operating Temperature C 81.89 75.50 58.26
Reflux Ratio 1 10 50
Volumetric Feed L/hr 5.26E+05 5.83E+05 5.45E+05
Maximum Weir Loading L/hr-m 9.80E+04 1.24E+05 2.55E+05
Maximum Downcomer Loading L/hr/m2 3.62E+05 3.16E+05 3.52E+05
Maximum Flooding % 80 80 80
Number of Passes 4 4 4
Actual Number of Trays 29 60 229
Tray Efficiency 0.8 0.8 0.8
Tray Type Sieve Sieve Sieve
Tray Material CS CS CS
Tray Spacing m 0.61 0.61 0.61
Tray Hole Diameter cm 1.27 1.27 1.27

44
Table B4: Furnace Equipment Details
Furnaces
Name E-1702
Description reactor inlet heater
Bare Equipment Cost USD 1,788,064
Furnace Type A-Frame
Tube Material Hastelloy
Duty MMBtu/hr 70.75
Standard Gas Flowrate L/min 4.38E+06
Design Gauge Pressure barg 2.43
Internal Tube Pressure barg 0.37
Design Temperature C 627.73
Operating Temperature C 599.95

45
Table B5: Heat Exchanger Equipment Details
Heat Exchangers
Name E-1401 E-1402 E-1701
Description compressor outlet cooler 1 compressor outlet cross-exchanger 2 reactor inlet /outlet cross-exchanger
Bare Equipment Cost USD 173,442 61,777 620,102
Heat Transfer Area m2 320.43 114.05 1943.67
Duty Btu/hr -3.43E+07 1.99E+07 3.44E+08
Flow Configuration Counter-current Counter-current Counter-current
Hot Side Temperature In C 126.41 54.44 566.85
Hot Side Temperature Out C 54.44 36.85 90.00
Cold Side Temperature In C 32.22 -33.82 1.50
Cold Side Temperature Out C 43.33 3.86 526.86
LMTD C 46.15 60.07 61.07
Front End TEMA Symbol B B B
Shell TEMA Symbol E E E
Rear End TEMA Symbol M M M
Tube Material SS316 SS 316 Hastelloy
Tube Design Gauge Pressure barg 71.38 103.96 2.43
Tube Design Temperature C 154.18 121.11 594.63
Tube Operating Temperature C 43.33 54.44 526.86
Tube Inside Diameter m 0.02 0.02 0.02
Tube Outside Diameter m 0.03 0.03 0.03
Tube Length m 6.10 6.10 6.10
Tube Pitch m 0.03 0.03 0.03
Tube Pitch Configuration Triangular Triangular Triangular
Number of Tubes per Shell 658.74 234.46 3995.72
Shell Material SS316 SS 316 Hastelloy
Shell Design Gauge Pressure bar 107.58 68.97 2.43
Shell Design Temperature C 154.18 21.11 594.63
Shell Operating Temperature C 126.41 3.86 566.85
Shell Corrosion Allowance cm 0.16 0.16 0.16

46
Heat Exchangers
Name E-1401 E-1402 E-1701
Description compressor outlet cooler 1 compressor outlet cross-exchanger 2 reactor inlet /outlet cross-exchanger
Bare Equipment Cost USD 173,442 61,777 620,102
Heat Transfer Area m2 320.43 114.05 1943.67
Duty Btu/hr -3.43E+07 1.99E+07 3.44E+08
Flow Configuration Counter-current Counter-current Counter-current
Hot Side Temperature In C 126.41 54.44 566.85
Hot Side Temperature Out C 54.44 36.85 90.00
Cold Side Temperature In C 32.22 -33.82 1.50
Cold Side Temperature Out C 43.33 3.86 526.86
LMTD C 46.15 60.07 61.07
Front End TEMA Symbol B B B
Shell TEMA Symbol E E E
Rear End TEMA Symbol M M M
Tube Material SS316 SS 316 Hastelloy
Tube Design Gauge Pressure barg 71.38 103.96 2.43
Tube Design Temperature C 154.18 121.11 594.63
Tube Operating Temperature C 43.33 54.44 526.86
Tube Inside Diameter m 0.02 0.02 0.02
Tube Outside Diameter m 0.03 0.03 0.03
Tube Length m 6.10 6.10 6.10
Tube Pitch m 0.03 0.03 0.03
Tube Pitch Configuration Triangular Triangular Triangular
Number of Tubes per Shell 658.74 234.46 3995.72
Shell Material SS316 SS 316 Hastelloy
Shell Design Gauge Pressure bar 107.58 68.97 2.43
Shell Design Temperature C 154.18 21.11 594.63
Shell Operating Temperature C 126.41 3.86 566.85
Shell Corrosion Allowance cm 0.16 0.16 0.16

47
Heat Exchangers cont.
Name E-1403 E-1601 E-1702
Description HX to heat SHP inlet H2 heater cooler for compressor 1
Bare Equipment Cost USD 100,285 50,193 147,735
Heat Transfer Area m2 189.74 134.38 899.76
Duty Btu/hr 3.70E+07 3.64E+06 -2.04E+07
Flow Configuration Counter-current Counter-current Counter-current
Hot Side Temperature In C 126.41 175.00 90.00
Hot Side Temperature Out C 78.96 174.00 50.00
Cold Side Temperature In C 3.81 -33.82 32.22
Cold Side Temperature Out C 60.85 41.01 43.33
LMTD C 70.24 168.22 29.93
Front End TEMA Symbol B B B
Shell TEMA Symbol E E E
Rear End TEMA Symbol M M M
Tube Material SS316 SS316 SS316
Tube Design Gauge Pressure barg 107.58 31.29 1.29
Tube Design Temperature C 154.18 202.78 121.11
Tube Operating Temperature C 126.41 175.00 43.33
Tube Inside Diameter m 0.02 0.02 0.02
Tube Outside Diameter m 0.03 0.03 0.03
Tube Length m 6.10 6.10 6.10
Tube Pitch m 0.03 0.03 0.03
Tube Pitch Configuration Triangular Triangular Triangular
Number of Tubes per Shell 390.06 276.25 1849.69
Shell Material SS316 SS316 SS316
Shell Design Gauge Pressure bar 71.38 47.43 2.43
Shell Design Temperature C 121.11 121.11 121.11
Shell Operating Temperature C 60.85 41.01 90.00
Shell Corrosion Allowance Cm 0.16 0.16 0.16
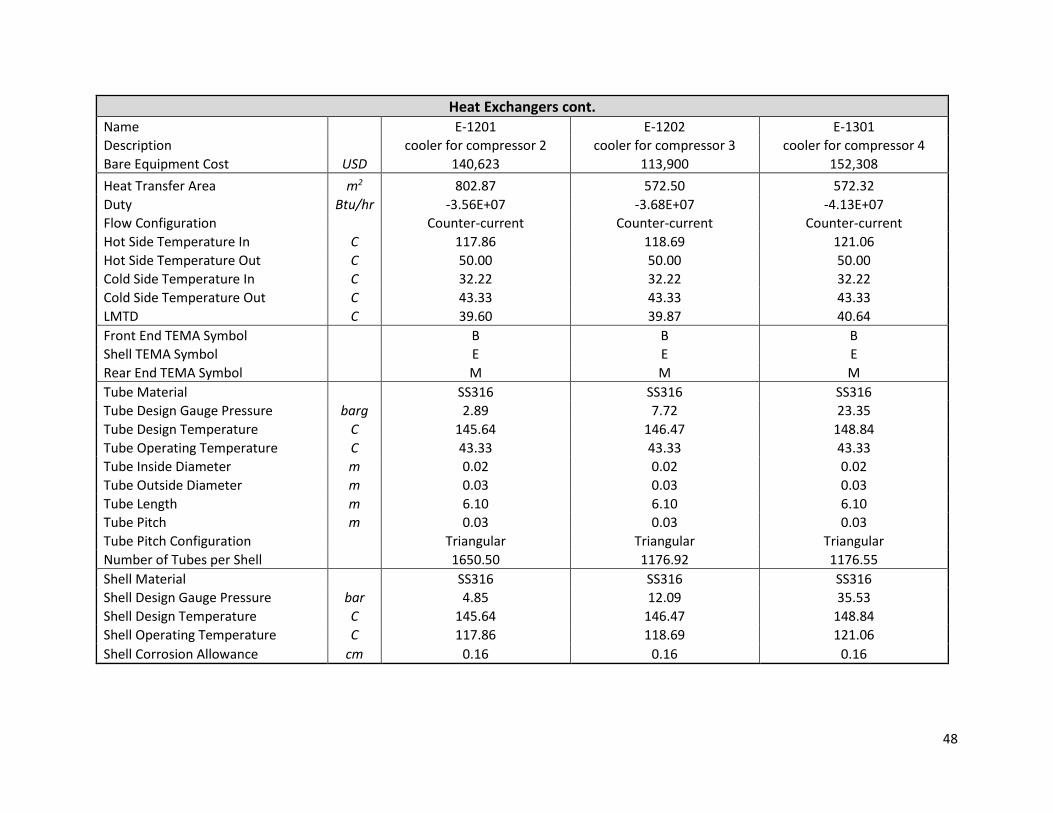
48
Heat Exchangers cont. Name E-1201 E-1202 E-1301
Description cooler for compressor 2 cooler for compressor 3 cooler for compressor 4
Bare Equipment Cost USD 140,623 113,900 152,308
Heat Transfer Area m2 802.87 572.50 572.32
Duty Btu/hr -3.56E+07 -3.68E+07 -4.13E+07
Flow Configuration Counter-current Counter-current Counter-current
Hot Side Temperature In C 117.86 118.69 121.06
Hot Side Temperature Out C 50.00 50.00 50.00
Cold Side Temperature In C 32.22 32.22 32.22
Cold Side Temperature Out C 43.33 43.33 43.33
LMTD C 39.60 39.87 40.64
Front End TEMA Symbol B B B
Shell TEMA Symbol E E E
Rear End TEMA Symbol M M M
Tube Material SS316 SS316 SS316
Tube Design Gauge Pressure barg 2.89 7.72 23.35
Tube Design Temperature C 145.64 146.47 148.84
Tube Operating Temperature C 43.33 43.33 43.33
Tube Inside Diameter m 0.02 0.02 0.02
Tube Outside Diameter m 0.03 0.03 0.03
Tube Length m 6.10 6.10 6.10
Tube Pitch m 0.03 0.03 0.03
Tube Pitch Configuration Triangular Triangular Triangular
Number of Tubes per Shell 1650.50 1176.92 1176.55
Shell Material SS316 SS316 SS316
Shell Design Gauge Pressure bar 4.85 12.09 35.53
Shell Design Temperature C 145.64 146.47 148.84
Shell Operating Temperature C 117.86 118.69 121.06
Shell Corrosion Allowance cm 0.16 0.16 0.16

49
Table B6: Pressure Swing Adsorption Unit Equipment Details
Pressure Swing Adsorption Unit
Name V-1602
Description H2 pressure swing adsorption unit
Bare Equipment Cost USD 4,064,245
Vessel Material SS 316
Liquid Volume L/min 9.27E+04
Heat Duty Btu/hr -2.79E+05
Flash Temperature C 35.25
Inlet Flash Pressure bar 6.90
Outlet Flash Pressure bar 7.77
Hydrogen Inlet Mole Fraction 0.93
Hydrogen Recovery % 99.99
Hydrogen Product Flowrate kmol/hr 1525.21
Hydrocarbon Product Flowrate kmol/hr 121.97

50
Table B7: Process Vessel Equipment Details
Process Vessels
Name V-1501 V-1201 V-1202
Description hydrogen flash drum compressor 1 knockout drum compressor 2 knockout drum
Bare Equipment Cost USD 338,755 160,030 100,793
Type Vertical Vertical Vertical
Shell Material SS 316 CS CS
Head Type Hemispherical Hemispherical Hemispherical
Liquid Volume L 4.95E+04 8.65E+04 5.23E+04
Vessel Diamater m 2.74 5.49 4.27
Vessel Tangent to Tangent Height m 8.38 3.66 3.66
Design Gauge Pressure barg 103.96 2.43 4.50
Design Temperature C 0.00 121.11 121.11
Operating Temperature C -33.79 50.00 50.00
Process Vessels cont.
Name V-1203 V-1204 V-1101
Description compressor 3 knockout drum compressor 4 knockout drum depropanizer column accumulator
Bare Equipment Cost USD 63,707 66,349 143,265
Type Vertical Vertical Horizontal
Shell Material CS CS CS
Head Type Hemispherical Hemispherical Hemispherical
Liquid Volume L 3.23E+04 1.71E+04 1.10E+05
Vessel Diamater m 3.35 2.44 3.51
Vessel Tangent to Tangent Height m 3.66 3.66 11.43
Design Gauge Pressure barg 11.74 36.91 18.43
Design Temperature C 121.11 121.11 121.11
Operating Temperature C 50.00 50.00 49.47

51
Process Vessels cont.
Name V-1401 V-1402
Description de-ethanizer column accumulator C3 splitter accumulator
Bare Equipment Cost USD 108,922 452,932
Type Horizontal Horizontal
Shell Material SS 316 CS
Head Type Hemispherical Hemispherical
Liquid Volume L 5.04E+04 7.64E+05
Vessel Diamater m 2.74 6.71
Vessel Tangent to Tangent Height m 8.53 21.64
Design Gauge Pressure barg 33.46 23.12
Design Temperature C 121.11 121.11
Operating Temperature C 23.49 49.75
Table B8: Pump Equipment Details
Pumps Name P-1101-A P-1101-B P-1401-A Description
de-propanizer column reflux
pump A de-propanizer column reflux
pump B de-ethanizer column reflux
pump A Bare Equipment Cost USD 53,546 53,546 25,605
Pump Type Centrifugal Centrifugal Centrifugal Casing Material CS CS CS Pump Efficiency 0.7 0.7 0.7 Pump Hydraulic Power kW 5.97 5.97 2.68 Pump Shaft Power kW 8.53 8.53 3.83 Net Positive Suction Head Available m 4.27 4.27 4.27
Fluid Specific Gravity 0.45 0.45 0.46 Fluid Viscosity cP 0.50 0.50 0.50 Liquid Flowrate L/min 1.91E+04 1.91E+04 8.27E+03 Design Gauge Pressure bar 18.43 18.43 33.46 Design Temperature C 121.11 121.11 121.11

52
Pumps cont.
Name P-1401-B P-1402-A P-1402-B
Description de-ethanizer column reflux pump B C3 splitter reflux pump A C3 splitter reflux pump B
Bare Equipment Cost USD 25,605 150,618 150,618
Pump Type Centrifugal Centrifugal Centrifugal
Casing Material CS CS CS
Pump Efficiency 0.7 0.7 0.7
Pump Hydraulic Power kW 2.68 41.24 41.24
Pump Shaft Power kW 3.83 58.91 58.91
Net Positive Suction Head Available m 4.27 4.27 4.27
Fluid Specific Gravity 0.46 0.46 0.46
Fluid Viscosity cP 0.50 0.50 0.50
Liquid Flowrate L/min 8.27E+03 1.29E+05 1.29E+05
Design Gauge Pressure bar 33.46 23.12 23.12
Design Temperature C 121.11 121.11 121.11

53
Table B9: Reactor Equipment Details
Reactors
Name R-1701/R-1702 R-1401
Description Propylene and side reactions reactor SHP reactor
Installed Equipment Cost USD 47,244,684
Reactor Type Moving Bed Trickle Bed Reactor
Vessel Material Hastelloy CS
Liquid Volume L N/A 5.76E+04
Design Flowrate L/min 7.82E+06 9.71E+03
Design Pressure barg 2.43 47.43
Operating Pressure barg 0.37 39.99
Design Temperature C 594.63 121.11
Operating Temperature C 566.85 60.85
Heat Duty Btu/hr 1.83E+08 -2.03E+05
Overall Propylene Conversion % 80.0
Once-Through Propane Conversion % 34.6 N/A
Catalyst Type PtSn/ɣ-Al2O3 Pd/Al2O3
Catalyst Composition wt% 1% Pt/1.6% Sn/ 97.4% ɣ-Al2O3 0.134% Pd/ 0.866% Al2O3
Catalyst Surface Area m2/g 200 29.6
Maximum Catalyst Diameter nm 2.2 6.5

54
Table B10: Condenser Equipment Details
Condensers
Name E-1102 E-1502 E-1503
Description de-propanizer column reboiler de-ethanizer reboiler C3-splitter reboiler
Bare Equipment Cost USD 151,088 138,388 409,964
Heat Transfer Area m2 495.49 328.82 2924.00
Duty Btu/hr 1.25E+08 7.90E+07 8.38E+08
Condensor Distillate Rate kmol/hr N/A N/A N/A
Reboiler Boilup Rate kmol/hr 8451.73 10021.06 3376.35
Reboiler/Condensor Temperature C 81.89 75.49 58.25
Reboiler/Condensor Pressure bar 17.72 31.03 20.68
Front End TEMA Symbol B B B
Shell TEMA Symbol K K K
Rear End TEMA Symbol U U U
Tube Material SS 316 SS 316 SS 316
Tube Design Gauge Pressure barg 11.95 21.97 15.07
Tube Design Temperature C 192.11 192.11 192.11
Tube Operating Temperature C 164.33 164.33 164.33
Tube Outside Diameter m 0.03 0.03 0.03
Tube Length m 6.10 6.10 6.10
Tube Pitch m 0.03 0.03 0.03
Tube Pitch Configuration Triangular Triangular Triangular
Number of Tube Passes 2 2 2
Shell Material SS 316 SS 316 SS 316
Shell Design Gauge Pressure bar 18.43 33.46 23.12
Shell Design Temperature C 121.11 121.11 121.11
Shell Operating Temperature C 81.89 75.49 58.25
Shell Corrosion Allowance cm 0.08 0.08 0.08
Number of Shell Passes 1 1 1

55
Table B11: Reboiler Equipment Details
Reboilers
Name E-1102 E-1502 E-1503
Description de-propanizer column reboiler de-ethanizer reboiler C3-splitter reboiler
Bare Equipment Cost USD 151,088 138,388 409,964
Heat Transfer Area m2 495.49 328.82 2924.00
Duty Btu/hr 1.25E+08 7.90E+07 8.38E+08
Condensor Distillate Rate kmol/hr N/A N/A N/A
Reboiler Boilup Rate kmol/hr 8451.73 10021.06 3376.35
Reboiler/Condensor Temperature C 81.89 75.49 58.25
Reboiler/Condensor Pressure bar 17.72 31.03 20.68
Front End TEMA Symbol B B B
Shell TEMA Symbol K K K
Rear End TEMA Symbol U U U
Tube Material SS 316 SS 316 SS 316
Tube Design Gauge Pressure barg 11.95 21.97 15.07
Tube Design Temperature C 192.11 192.11 192.11
Tube Operating Temperature C 164.33 164.33 164.33
Tube Outside Diameter m 0.03 0.03 0.03
Tube Length m 6.10 6.10 6.10
Tube Pitch m 0.03 0.03 0.03
Tube Pitch Configuration Triangular Triangular Triangular
Number of Tube Passes 2 2 2
Shell Material SS 316 SS 316 SS 316
Shell Design Gauge Pressure bar 18.43 33.46 23.12
Shell Design Temperature C 121.11 121.11 121.11
Shell Operating Temperature C 81.89 75.49 58.25
Shell Corrosion Allowance cm 0.08 0.08 0.08
Number of Shell Passes 1 1 1

56
Appendix C
Process Flowsheets

57
Propylene Production Unit
Depropanizer Column and Coldbox
Flow Drawing #1
Sharif&Co.
1
39
3 2
E-1701

58
Flow Drawing #2
Sharif&Co.
Propylene Production Unit
Initial Two Compression Stages
##

59
Flow Drawing #3
Sharif&Co.
Propylene Production Unit
Final Two Compression Stages

60
Flow Drawing #4
Sharif&Co.
Propylene Production Unit
Heat Exchange Before Diolefin Reactor

61
Flow Drawing #5
Sharif&Co.
Propylene Production Unit
Deethanizer Column and Propane-Propylene Splitter

62
Flow Drawing #6
Sharif&Co.
Propylene Production Unit
Hydrogen Separation Unit

63
Flow Drawing #7
Sharif&Co.
Propylene Production Unit
Propane Furnace and Propylene Reactors
To

64
Appendix D
Material and Energy Balance

65
Flow Drawing 1 1 1 1 2 2 2
Equipment From Propane Feed E-1103 E-1103 M-1102 V-1201 C-1201 V-1202
Equipment To T-1101 E-1701 V-1601 E-1103 C-1201 E-1503 C-1202
Stream Number 1 14 15 12 22 23 27
Temperature C 40.0 1.5 -33.8 -39.4 50.0 117.9 50.0
Pressure bar 68.9 1.9 100.0 2.0 1.4 4.1 3.8
Molar Flows
TOTAL kmol/hr 1950.00 7506.45 9263.37 7506.45 9263.37 9263.37 9263.37
PROPANE kmol/hr 1886.81 5312.67 3532.67 5312.67 3532.67 3532.67 3532.67
HYDROGEN kmol/hr 0.00 2027.93 3696.65 2027.93 3696.65 3696.65 3696.65
METHANE kmol/hr 5.27 51.22 124.50 51.22 124.50 124.50 124.50
ETHANE kmol/hr 56.56 66.04 119.04 66.04 119.04 119.04 119.04
ETHYLENE kmol/hr 0.20 11.07 88.07 11.07 88.07 88.07 88.07
PROPA-01 kmol/hr 0.00 0.03 2.48 0.03 2.48 2.48 2.48
METHY-01 kmol/hr 0.00 0.04 2.49 0.04 2.49 2.49 2.49
ISOBU-01 kmol/hr 1.17 0.15 0.55 0.15 0.55 0.55 0.55
N-BUT-01 kmol/hr 0.00 0.00 0.03 0.00 0.03 0.03 0.03
BENZE-01 kmol/hr 0.00 0.00 2.51 0.00 2.51 2.51 2.51
TOLUE-01 kmol/hr 0.00 0.00 1.00 0.00 1.00 1.00 1.00
PROPYLNE kmol/hr 0.00 37.29 1693.37 37.29 1693.37 1693.37 1693.37
Molar Fractions
PROPANE 0.9676 0.7077 0.3814 0.7077 0.3814 0.3814 0.3814
HYDROGEN 0.0000 0.2702 0.3991 0.2702 0.3991 0.3991 0.3991
METHANE 0.0027 6.824E-03 0.0134 0.0068 1.344E-02 0.0134 0.0134
ETHANE 0.0290 8.798E-03 0.0129 0.0088 1.285E-02 0.0129 0.0129
ETHYLENE 1.000E-04 1.475E-03 9.508E-03 0.0015 9.508E-03 9.508E-03 9.508E-03
PROPA-01 0.000E+00 4.331E-06 2.680E-04 0.0000 2.680E-04 2.680E-04 2.680E-04
METHY-01 0.000E+00 5.543E-06 2.690E-04 0.0000 2.690E-04 2.690E-04 2.690E-04
ISOBU-01 6.001E-04 2.004E-05 5.942E-05 0.0000 5.941E-05 5.941E-05 5.941E-05
N-BUT-01 0.000E+00 1.034E-07 3.322E-06 0.0000 3.322E-06 3.322E-06 3.322E-06
BENZE-01 0.000E+00 4.641E-08 2.710E-04 0.0000 2.710E-04 2.710E-04 2.710E-04
TOLUE-01 0.000E+00 2.249E-09 1.080E-04 0.0000 1.080E-04 1.080E-04 1.080E-04
PROPYLNE 0.000E+00 4.968E-03 0.1828 0.0050 0.1828 0.1828 0.1828

66
Flow Drawing 2 3 3 3 3 4 5
Equipment From C-1202 V-1301 C-1301 V-1302 C-1302 E-1401 E-1502
Equipment To E-1502 To Waste E-1301 C-1302 E-1403 E-1402 T-1502
Stream Number 28 37 38 44 45 48 65
Temperature C 118.7 50.0 121.1 50.0 126.4 54.4 75.5
Pressure bar 11.4 11.0 33.1 34.5 103.4 100.0 31.0
Molar Flows
TOTAL kmol/hr 9263.37 9263.37 9263.37 9263.37 9263.37 9263.37 4879.12
PROPANE kmol/hr 3532.67 3532.67 3532.67 3532.67 3532.67 3532.67 3376.16
HYDROGEN kmol/hr 3696.65 3696.65 3696.65 3696.65 3696.65 3696.65 0.00
METHANE kmol/hr 124.50 124.50 124.50 124.50 124.50 124.50 0.00
ETHANE kmol/hr 119.04 119.04 119.04 119.04 119.04 119.04 2.03
ETHYLENE kmol/hr 88.07 88.07 88.07 88.07 88.07 88.07 0.03
PROPA-01 kmol/hr 2.48 2.48 2.48 2.48 2.48 2.48 0.00
METHY-01 kmol/hr 2.49 2.49 2.49 2.49 2.49 2.49 0.00
ISOBU-01 kmol/hr 0.55 0.55 0.55 0.55 0.55 0.55 0.55
N-BUT-01 kmol/hr 0.03 0.03 0.03 0.03 0.03 0.03 0.03
BENZE-01 kmol/hr 2.51 2.51 2.51 2.51 2.51 2.51 2.51
TOLUE-01 kmol/hr 1.00 1.00 1.00 1.00 1.00 1.00 1.00
PROPYLNE kmol/hr 1693.37 1693.37 1693.37 1693.37 1693.37 1693.37 1496.81
Molar Fractions
PROPANE 0.3814 0.3814 0.3814 0.3814 0.3814 0.3814 0.6920
HYDROGEN 0.3991 0.3991 0.3991 0.3991 0.3991 0.3991 5.164E-22
METHANE 0.0134 0.0134 0.0134 0.0134 0.0134 0.0134 1.575E-12
ETHANE 0.0129 0.0129 0.0129 0.0129 0.0129 0.0129 4.170E-04
ETHYLENE 9.508E-03 9.508E-03 9.508E-03 9.508E-03 9.508E-03 9.508E-03 5.307E-06
PROPA-01 2.680E-04 2.680E-04 2.680E-04 2.680E-04 2.680E-04 2.680E-04 0.000E+00
METHY-01 2.690E-04 2.690E-04 2.690E-04 2.690E-04 2.690E-04 2.690E-04 0.000E+00
ISOBU-01 5.941E-05 5.941E-05 5.941E-05 5.941E-05 5.941E-05 5.942E-05 1.120E-04
N-BUT-01 3.322E-06 3.322E-06 3.322E-06 3.322E-06 3.322E-06 3.322E-06 6.273E-06
BENZE-01 2.710E-04 2.710E-04 2.710E-04 2.710E-04 2.710E-04 2.710E-04 5.144E-04
TOLUE-01 1.080E-04 1.080E-04 1.080E-04 1.080E-04 1.080E-04 1.080E-04 2.050E-04
PROPYLNE 0.1828 0.1828 0.1828 0.1828 0.1828 0.1828 0.3068

67
Flow Drawing 5 1 1 1 4 6 6
Equipment From P-1501 E-1102 M-1101 P-1101 V-1601 V-1601 E-1601 Equipment To Fuel Gas Storage Fuel Gas Storage T-1101 T-1101 E-1402 S-1601 V-1602
Stream Number 71 5 3 11 50 78 81
Temperature C 23.5 81.9 51.4 49.5 -33.8 -33.8 41.0 Pressure bar 31.0 17.7 20.7 17.7 45.0 45.0 7.8 Molar Flows TOTAL kmol/hr 542.12 10.00 5326.35 5316.35 5421.09 3842.28 1647.18 PROPANE kmol/hr 52.69 4.89 5258.31 5253.41 3428.71 103.95 44.56 HYDROGEN kmol/hr 138.66 0.00 0.00 0.00 138.88 3557.77 1525.21 METHANE kmol/hr 43.98 0.00 5.27 5.27 43.87 80.63 34.57 ETHANE kmol/hr 100.39 0.00 56.56 56.56 102.40 16.64 7.14 ETHYLENE kmol/hr 68.99 0.00 0.20 0.20 68.99 19.09 8.18
PROPA-01 kmol/hr 0.00 0.00 0.00 0.00 2.43 0.06 0.02 METHY-01 kmol/hr 0.00 0.00 0.00 0.00 2.42 0.07 0.03 ISOBU-01 kmol/hr 0.00 1.57 1.72 0.15 0.55 0.00 0.00 N-BUT-01 kmol/hr 0.00 0.03 0.03 0.00 0.03 0.00 0.00 BENZE-01 kmol/hr 0.00 2.51 2.51 0.00 2.51 0.00 0.00 TOLUE-01 kmol/hr 0.00 1.00 1.00 0.00 1.00 0.00 0.00 PROPYLNE kmol/hr 137.42 0.00 0.77 0.77 1629.31 64.06 27.46 Molar Fractions PROPANE 0.0972 0.4892 0.9872 0.9882 0.6325 0.0271 0.0271 HYDROGEN 0.2558 0.000E+00 0.0000 0.0000 0.0256 0.9260 0.9260 METHANE 0.0811 1.920E-16 9.886E-04 9.904E-04 8.093E-03 0.0210 0.0210 ETHANE 0.1852 2.691E-08 0.0106 0.0106 0.0189 4.332E-03 4.332E-03 ETHYLENE 0.1273 1.933E-12 3.661E-05 3.668E-05 0.0127 4.968E-03 4.968E-03 PROPA-01 0.000E+00 0.000E+00 0.0000 0.0000 4.474E-04 1.484E-05 1.484E-05 METHY-01 0.000E+00 0.000E+00 0.0000 0.0000 4.461E-04 1.900E-05 1.900E-05 ISOBU-01 2.900E-11 0.1568 3.223E-04 2.787E-05 1.008E-04 1.021E-06 1.021E-06 N-BUT-01 1.233E-13 2.993E-03 5.746E-06 1.277E-07 5.646E-06 4.447E-08 4.447E-08 BENZE-01 1.190E-23 0.2510 4.712E-04 3.222E-12 4.630E-04 1.591E-07 1.591E-07 TOLUE-01 9.000E-32 0.1000 1.877E-04 1.269E-17 1.845E-04 7.710E-09 7.710E-09
PROPYLNE 0.2535 0.0000 1.452E-04 1.454E-04 0.3005 0.0167 0.0167

68
Flow Drawing 6 6 6 6 6 7 7
Equipment From V-1602 S-1601 V-1601 S-1601 V-1602 E-1702 E-1703
Equipment To H2 Product
Storage E-1601 S-1601 M-1401 Fuel Gas Storage R-1701 V-1201
Stream Number 85 80 79 77 87 90 98
Temperature C 35.3 -33.8 -33.8 -33.8 41.0 600.0 50.0
Pressure bar 7.8 45.0 45.0 45.0 6.9 1.4 1.4
Molar Flows
TOTAL kmol/hr 1525.21 1647.18 2190.10 5.00 121.97 7506.45 9263.37
PROPANE kmol/hr 0.00 44.56 59.25 0.14 44.56 5312.67 3532.67
HYDROGEN kmol/hr 1525.21 1525.21 2027.93 4.63 0.00 2027.93 3696.65
METHANE kmol/hr 0.00 34.57 45.96 0.10 34.57 51.22 124.50
ETHANE kmol/hr 0.00 7.14 9.49 0.02 7.14 66.04 119.04
ETHYLENE kmol/hr 0.00 8.18 10.88 0.02 8.18 11.07 88.07
PROPA-01 kmol/hr 0.00 0.02 0.03 0.00 0.02 0.03 2.48
METHY-01 kmol/hr 0.00 0.03 0.04 0.00 0.03 0.04 2.49
ISOBU-01 kmol/hr 0.00 0.00 0.00 0.00 0.00 0.15 0.55
N-BUT-01 kmol/hr 0.00 0.00 0.00 0.00 0.00 0.00 0.03
BENZE-01 kmol/hr 0.00 0.00 0.00 0.00 0.00 0.00 2.51
TOLUE-01 kmol/hr 0.00 0.00 0.00 0.00 0.00 0.00 1.00
PROPYLNE kmol/hr 0.00 27.46 36.52 0.08 27.46 37.29 1693.37
Molar Fractions
PROPANE 0.0000 0.0271 0.0271 0.0271 0.3654 0.7077 0.3814
HYDROGEN 1.0000 0.9260 0.9260 0.9260 0.000E+00 0.2702 0.3991
METHANE 0.000E+00 0.0210 0.0210 0.0210 0.2834 0.0068 0.0134
ETHANE 0.000E+00 0.0043 0.0043 0.0043 0.0585 0.0088 0.0129
ETHYLENE 0.000E+00 0.0050 0.0050 0.0050 0.0671 0.0015 0.0095
PROPA-01 0.000E+00 1.484E-05 1.484E-05 1.484E-05 0.0002 4.331E-06 2.680E-04
METHY-01 0.000E+00 1.900E-05 1.900E-05 1.900E-05 0.0003 5.543E-06 2.690E-04
ISOBU-01 0.000E+00 1.021E-06 1.021E-06 1.021E-06 1.378E-05 2.003E-05 5.941E-05
N-BUT-01 0.000E+00 4.447E-08 4.447E-08 4.447E-08 6.006E-07 1.034E-07 3.322E-06
BENZE-01 0.000E+00 1.591E-07 1.591E-07 1.591E-07 2.148E-06 4.641E-08 2.710E-04
TOLUE-01 0.000E+00 7.710E-09 7.710E-09 7.710E-09 1.041E-07 2.249E-09 1.080E-04
PROPYLNE 0.000E+00 0.0167 0.0167 0.0167 0.2252 0.0050 0.1828

69
Flow Drawing 2 3 3 1 4 2 7
Equipment From E-1201 E-1202 E-1301 E-1402 E-1402 E-1703 E-1701 Equipment To V-1202 V-1301 V-1302 E-1103 M-1401 V-1201 E-1702
Stream Number 25 35 41 16 51 19 89
Temperature C 50.0 50.0 50.0 36.9 3.9 90.0 526.9 Pressure bar 3.8 11.0 34.5 100.0 45.0 1.4 1.9 Molar Flows TOTAL kmol/hr 9263.37 9263.37 9263.37 9263.37 5421.09 9263.37 7506.45 PROPANE kmol/hr 3532.67 3532.67 3532.67 3532.67 3428.71 3532.67 5312.67 HYDROGEN kmol/hr 3696.65 3696.65 3696.65 3696.65 138.88 3696.65 2027.93 METHANE kmol/hr 124.50 124.50 124.50 124.50 43.87 124.50 51.22 ETHANE kmol/hr 119.04 119.04 119.04 119.04 102.40 119.04 66.04 ETHYLENE kmol/hr 88.07 88.07 88.07 88.07 68.99 88.07 11.07 PROPA-01 kmol/hr 2.48 2.48 2.48 2.48 2.43 2.48 0.03 METHY-01 kmol/hr 2.49 2.49 2.49 2.49 2.42 2.49 0.04 ISOBU-01 kmol/hr 0.55 0.55 0.55 0.55 0.55 0.55 0.15 N-BUT-01 kmol/hr 0.03 0.03 0.03 0.03 0.03 0.03 0.00 BENZE-01 kmol/hr 2.51 2.51 2.51 2.51 2.51 2.51 0.00 TOLUE-01 kmol/hr 1.00 1.00 1.00 1.00 1.00 1.00 0.00 PROPYLNE kmol/hr 1693.37 1693.37 1693.37 1693.37 1629.31 1693.37 37.29 Molar Fractions PROPANE 0.3814 0.3814 0.3814 0.3814 0.6325 0.3814 0.7077 HYDROGEN 0.3991 0.3991 0.3991 0.3991 0.0256 0.3991 0.2702 METHANE 0.0134 0.0134 0.0134 0.0134 0.0081 0.0134 0.0068 ETHANE 0.0129 0.0129 0.0129 0.0129 0.0189 0.0129 0.0088 ETHYLENE 9.51E-03 9.51E-03 9.51E-03 9.51E-03 1.27E-02 9.51E-03 1.48E-03 PROPA-01 2.68E-04 2.68E-04 2.68E-04 2.68E-04 4.47E-04 2.68E-04 4.33E-06 METHY-01 2.69E-04 2.69E-04 2.69E-04 2.69E-04 4.46E-04 2.69E-04 5.54E-06 ISOBU-01 5.94E-05 5.94E-05 5.94E-05 5.94E-05 1.01E-04 5.94E-05 2.00E-05 N-BUT-01 3.32E-06 3.32E-06 3.32E-06 3.32E-06 5.65E-06 3.32E-06 1.03E-07 BENZE-01 2.71E-04 2.71E-04 2.71E-04 2.71E-04 4.63E-04 2.71E-04 4.64E-08 TOLUE-01 1.08E-04 1.08E-04 1.08E-04 1.08E-04 1.84E-04 1.08E-04 2.25E-09 PROPYLNE 0.1828 0.1828 0.1828 0.1828 0.3005 0.1828 0.0050

70
Flow Drawing 4 2 2 3 4 1 5
Equipment From E-1403 V-1201 V-1202 C-1301 S-1601 M-1102 P-1502
Equipment To E-1401 To Waste To Waste E-1301 M-1401 E-1103 To Product Storage
Stream Number 49 21 30 38 53 12 77
Temperature C 79.0 N/A N/A N/A N/A 11.7 49.7
Pressure bar 103.4 1.4 3.8 11.0 34.5 17.7 20.7
Molar Flows
TOTAL kmol/hr 9263.37 0 0 0 0 7506.45 1502.77
PROPANE kmol/hr 3532.67 0 0 0 0 5312.67 4.67
HYDROGEN kmol/hr 3696.65 0 0 0 0 2027.93 0.00
METHANE kmol/hr 124.50 0 0 0 0 51.22 0.00
ETHANE kmol/hr 119.04 0 0 0 0 66.04 2.03
ETHYLENE kmol/hr 88.07 0 0 0 0 11.07 0.03
PROPA-01 kmol/hr 2.48 0 0 0 0 0.03 0.00
METHY-01 kmol/hr 2.49 0 0 0 0 0.04 0.00
ISOBU-01 kmol/hr 0.55 0 0 0 0 0.15 0.00
N-BUT-01 kmol/hr 0.03 0 0 0 0 0.00 0.00
BENZE-01 kmol/hr 2.51 0 0 0 0 0.00 0.00
TOLUE-01 kmol/hr 1.00 0 0 0 0 0.00 0.00
PROPYLNE kmol/hr 1693.37 0 0 0 0 37.29 1496.04
Molar Fractions
PROPANE 0.3814 0.0000 0.0000 0.0000 0.0000 0.7077 3.11E-03
HYDROGEN 0.3991 0.0000 0.0000 0.0000 0.0000 0.2702 0.00E+00
METHANE 0.0134 0.0000 0.0000 0.0000 0.0000 6.82E-03 5.11E-12
ETHANE 0.0129 0.0000 0.0000 0.0000 0.0000 8.80E-03 1.35E-03
ETHYLENE 9.51E-03 0.0000 0.0000 0.0000 0.0000 1.48E-03 1.72E-05
PROPA-01 2.68E-04 0.0000 0.0000 0.0000 0.0000 4.33E-06 0.00E+00
METHY-01 2.69E-04 0.0000 0.0000 0.0000 0.0000 5.54E-06 0.00E+00
ISOBU-01 5.94E-05 0.0000 0.0000 0.0000 0.0000 2.00E-05 6.20E-39
N-BUT-01 3.32E-06 0.0000 0.0000 0.0000 0.0000 1.03E-07 4.79E-46
BENZE-01 2.71E-04 0.0000 0.0000 0.0000 0.0000 4.64E-08 4.89E-110
TOLUE-01 1.08E-04 0.0000 0.0000 0.0000 0.0000 2.25E-09 8.49E-149
PROPYLNE 0.1828 0.0000 0.0000 0.0000 0.0000 4.97E-03 0.9955
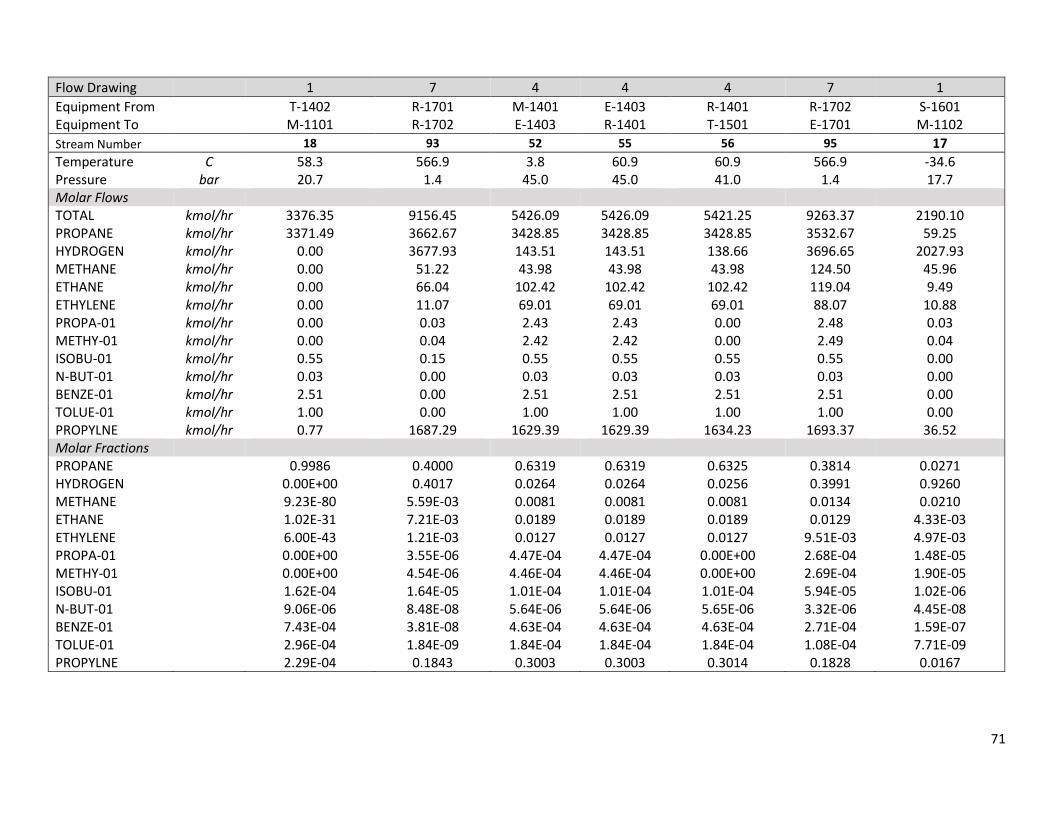
71
Flow Drawing 1 7 4 4 4 7 1
Equipment From T-1402 R-1701 M-1401 E-1403 R-1401 R-1702 S-1601 Equipment To M-1101 R-1702 E-1403 R-1401 T-1501 E-1701 M-1102
Stream Number 18 93 52 55 56 95 17
Temperature C 58.3 566.9 3.8 60.9 60.9 566.9 -34.6 Pressure bar 20.7 1.4 45.0 45.0 41.0 1.4 17.7 Molar Flows TOTAL kmol/hr 3376.35 9156.45 5426.09 5426.09 5421.25 9263.37 2190.10 PROPANE kmol/hr 3371.49 3662.67 3428.85 3428.85 3428.85 3532.67 59.25 HYDROGEN kmol/hr 0.00 3677.93 143.51 143.51 138.66 3696.65 2027.93 METHANE kmol/hr 0.00 51.22 43.98 43.98 43.98 124.50 45.96 ETHANE kmol/hr 0.00 66.04 102.42 102.42 102.42 119.04 9.49 ETHYLENE kmol/hr 0.00 11.07 69.01 69.01 69.01 88.07 10.88 PROPA-01 kmol/hr 0.00 0.03 2.43 2.43 0.00 2.48 0.03 METHY-01 kmol/hr 0.00 0.04 2.42 2.42 0.00 2.49 0.04 ISOBU-01 kmol/hr 0.55 0.15 0.55 0.55 0.55 0.55 0.00 N-BUT-01 kmol/hr 0.03 0.00 0.03 0.03 0.03 0.03 0.00 BENZE-01 kmol/hr 2.51 0.00 2.51 2.51 2.51 2.51 0.00 TOLUE-01 kmol/hr 1.00 0.00 1.00 1.00 1.00 1.00 0.00 PROPYLNE kmol/hr 0.77 1687.29 1629.39 1629.39 1634.23 1693.37 36.52 Molar Fractions PROPANE 0.9986 0.4000 0.6319 0.6319 0.6325 0.3814 0.0271 HYDROGEN 0.00E+00 0.4017 0.0264 0.0264 0.0256 0.3991 0.9260 METHANE 9.23E-80 5.59E-03 0.0081 0.0081 0.0081 0.0134 0.0210 ETHANE 1.02E-31 7.21E-03 0.0189 0.0189 0.0189 0.0129 4.33E-03 ETHYLENE 6.00E-43 1.21E-03 0.0127 0.0127 0.0127 9.51E-03 4.97E-03 PROPA-01 0.00E+00 3.55E-06 4.47E-04 4.47E-04 0.00E+00 2.68E-04 1.48E-05 METHY-01 0.00E+00 4.54E-06 4.46E-04 4.46E-04 0.00E+00 2.69E-04 1.90E-05 ISOBU-01 1.62E-04 1.64E-05 1.01E-04 1.01E-04 1.01E-04 5.94E-05 1.02E-06 N-BUT-01 9.06E-06 8.48E-08 5.64E-06 5.64E-06 5.65E-06 3.32E-06 4.45E-08 BENZE-01 7.43E-04 3.81E-08 4.63E-04 4.63E-04 4.63E-04 2.71E-04 1.59E-07 TOLUE-01 2.96E-04 1.84E-09 1.84E-04 1.84E-04 1.84E-04 1.08E-04 7.71E-09 PROPYLNE 2.29E-04 0.1843 0.3003 0.3003 0.3014 0.1828 0.0167

72
Appendix E
Supplementary Economic Data

73
Table E1: Detailed Project Costs from 2023-2025
Timeline Year Year # DF (@15%) MACRS Factors Working Capital Start-Up Expenses FCI Sales Operating Cost
Construction 2023 -2 1.166 -230,394,662
2024 -1 1.079 -231,205,400
Start-Up 0 1 -69,795,006 -2,080,000
Project Life
2025 1 0.929 0.143 66,008,809 508,725,041 -417,066,115
2026 2 0.799 0.245 113,092,015 771,911,546 -433,112,764
2027 3 0.688 0.175 80,780,011 542,974,060 -420,133,706
2028 4 0.592 0.125 57,700,008 718,723,565 -431,404,225
2029 5 0.51 0.089 41,082,406 737,500,911 -433,637,547
2030 6 0.439 0.089 41,082,406 842,701,772 -441,407,278
2031 7 0.378 0.089 41,082,406 596,008,336 -428,805,076
2032 8 0.325 0.045 20,772,003 668,018,523 -435,985,262
2033 9 0.28 470,192,804 -429,715,407
2034 10 0.241 435,405,170 -431,938,292
2035 End 10 0.223 69,795,006
Table E2: Net Present Value and IRR Cash Flow Calculations
Timeline Year Year # Operating Income Net Profit Before Taxes Net Profit After Taxes Cash Flow Present Value @15%
Construction 2023 -2
-230,394,662 -268,640,176
2024 -1 -
231,205,400 -249,470,627
Start-Up 0 -71,875,006 -71,875,006
Project Life
2025 1 91,658,927 25,650,118 15,390,071 81,398,880 75,619,559
2026 2 338,798,782 225,706,767 135,424,060 248,516,075 198,564,344
2027 3 122,840,354 42,060,343 25,236,206 106,016,217 72,939,157
2028 4 287,319,340 229,619,332 137,771,599 195,471,607 115,719,191
2029 5 303,863,363 262,780,958 157,668,575 198,750,980 101,363,000
2030 6 401,294,494 360,212,088 216,127,253 257,209,659 112,915,040
2031 7 167,203,260 126,120,855 75,672,513 116,754,918 44,133,359
2032 8 232,033,261 211,261,259 126,756,755 147,528,758 47,946,846
2033 9 40,477,397 40,477,397 24,286,438 24,286,438 6,800,203
2034 10 3,466,878 3,466,878 2,080,127 2,080,127 501,311
2035 End 10 69,795,006 15,564,286

74
Table E3: Bare Equipment Costs (Note: the reactor and catalysts regeneration system costs are not included in this calculation)
Name # Pieces of Equipment Equipment Cost [USD] Cost Year Cost in 2023 Cost in 2024 Sum
CBOXFLAS-flash vessel 1 333,400 2019 169,080 169,675 338,755
CBOXVALV 1 0 2019 0 0 0
COLDBOX 1 366,000 2019 185,613 186,266 371,878
COMP1 1 17,698,900 2019 8,975,790 9,007,375 17,983,165
COMP2 1 8,711,600 2019 4,417,986 4,433,532 8,851,518
COMP3 1 3,259,200 2019 1,652,865 1,658,681 3,311,547
COMP4 1 2,512,000 2019 1,273,931 1,278,414 2,552,346
COMPCOOL 1 170,700 2019 86,569 86,873 173,442
DEC-bottoms split 1 0 2019 0 0 0
DEC-cond 1 612,200 2019 310,470 311,563 622,033
DEC-cond acc 1 107,200 2019 54,365 54,557 108,922
DEC-overhead split 1 0 2019 0 0 0
DEC-reb 1 136,200 2019 69,072 69,315 138,388
DEC-reflux pump 2 25,200 2019 25,560 25,650 51,209
DEC-tower 1 1,519,100 2019 770,394 773,105 1,543,499
DPC-bottoms split 1 0 2019 0 0 0
DPC-cond 1 925,400 2019 469,306 470,957 940,263
DPC-cond acc 1 141,000 2019 71,506 71,758 143,265
DPC-overhead split 1 0 2019 0 0 0
DPC-reb 1 148,700 2019 75,411 75,677 151,088
DPC-reflux pump 2 52,700 2019 53,452 53,640 107,093
DPC-tower 1 969,500 2019 491,671 493,401 985,071
DPMIX 1 0 2019 0 0 0
FEEDVALV 1 0 2019 0 0 0
H2FURN 1 49,400 2019 25,053 25,141 50,193
H2SPLIT 1 0 2019 0 0 0
H2VALVE 1 0 2019 0 0 0
HEAT1 1 1,759,800 2019 892,462 895,602 1,788,064
HXA 1 60,800 2019 30,834 30,943 61,777
HXB 1 610,300 2019 309,507 310,596 620,102
HXC 1 98,700 2019 50,055 50,231 100,285
HXCOMP1 1 145,400 2019 73,738 73,997 147,735

75
Table continued from previous page.
Name # Pieces of Equipment Equipment Cost [USD] Cost Year Cost in 2023 Cost in 2024 Sum
HXCOMP2 1 138,400 2019 70,188 70,435 140,623
HXCOMP3 1 112,100 2019 56,850 57,050 113,900
HXCOMP4 1 149,900 2019 76,020 76,288 152,308
KO1-flash vessel 1 157,500 2019 79,874 80,155 160,030
KO2-flash vessel 1 99,200 2019 50,308 50,485 100,793
KO3-flash vessel 1 62,700 2019 31,798 31,909 63,707
KO4-flash vessel 1 65,300 2019 33,116 33,233 66,349
PPSPLIT1 - bottoms split 1 0 2019 0 0 0
PPSPLIT1 - reboiler 1 403,484 2019 204,622 205,342 409,964
PPSPLIT1 - tower 1 7,684,077 2019 3,896,890 3,910,602 7,807,492
PPSPLIT2 - condensor 1 1,476,005 2019 748,539 751,173 1,499,711
PPSLIT2 - condensor accumulator 1 445,772 2019 226,068 226,864 452,932
PPSPLIT2 - overhead splitter 1 0 2019 0 0 0
PPSPLIT2 - reflux pump 2 148,237 2019 150,353 150,882 301,236
PPSPLIT2 - tower 1 7,429,588 2019 3,767,829 3,781,087 7,548,916
PSA 1 4,000,000 2019 2,028,553 2,035,691 4,064,245
SHPMIXER 1 0 2019 0 0 0
VALVMIX 1 0 2019 0 0 0
Total 31,955,697 32,068,146 64,023,843

76
Table E4: FCI Calculations Using the Chilton Method
Cost Consideration 2023 2024 Bare Equipment Cost 31,955,697 32,068,146
Delivered Cost 31,955,697 32,068,146
Installed Cost 45,696,646 45,857,449
Installed Cost + RXR 69,277,499 69,521,280
Process Piping 31,174,874 31,284,576
Instrumentation 11,084,400 11,123,405
Buildings 13,855,500 13,904,256
Auxiliaries 27,710,999 27,808,512
Outside Lines 6,927,750 6,952,128
Total Physical Plant Cost 160,031,022 160,594,157
Engineering and Construction 56,010,858 56,207,955
Contingencies 14,002,714 14,051,989
Size Factor 350,068 351,300
Total Fixed Plant Cost 230,394,662 231,205,400
Table E5: Bare Equipment Calculations for the Propane-Propylene Splitter
Equipment Part Cost at 50% Flow (Jan. 2019) Cost at 100% Flow (Jan. 2019) PPSPLIT1 - bottoms split 0 0 PPSPLIT1 - reboiler 266200 403483.75 PPSPLIT1 - tower 5069600 7684076.706 PPSPLIT2 - condensor 973800 1476004.792 PPSLIT2 - condensor accumulator 294100 445772.2422 PPSPLIT2 - overhead splitter 0 0 PPSPLIT2 - reflux pump 97800 148237.0802 PPSPLIT2 - tower 4901700 7429587.894
Total C3 Splitter Cost 11,603,200 17,587,162

77
CE Cost Index
2016 2019 2023 2024
572.7624 578.9616 587.2272 589.2936
Figure E1. CE factor correlation for adjusting FCI components based on construction year and calculated
factors
y = 2.0664x - 3593.1
400
450
500
550
600
650
2006 2008 2010 2012 2014 2016 2018 2020
CE
Fact
or
Year

78
Table E6: Natural Gas Pricing Adjusted for Inflation
EIA Natural Gas Pricing Adjusted for Inflation Intercept 3.54170419 Slope 0.005208982
$ 0.7401 Long Run Mean $ 3.5602
$ 0.9948 Error $ 0.3522
Year Data Lag Data 2010 4.370000
2011 4.080000 4.370000
2012 2.861100 4.080000
2013 3.958306 2.861100
2014 4.730229 3.958306
2015 2.892692 4.730229
2016 2.837929 2.892692
2017 3.434570 2.837929
2018 3.690727 3.434570
2019 4.003037
2020 2.112911
2021 2.945265
2022 4.441561
2023 3.224190
2024 3.970553
2025 2.902224
2026 4.407186
2027 3.093240
2028 4.102101
2029 4.210579
2030 4.815870
2031 3.399220
2032 3.816412
2033 2.678082
2034 2.480355
2035 2.524500

79
Table E7: Propane Feed Pricing Adjusted for Inflation
EIA Propane Pricing Adjusted for Inflation Intercept 1.199527545 Slope -0.280694248
$ 0.1539 Long Run Mean $ 0.9366
$ 1.2807 Error $ (0.2063)
Year Data Lag Data
2016 0.701923
2017 0.981711 0.701923
2018 1.041710 0.981711
2019 0.810173 1.041710
2020 1.065296
2021 1.000000
2022 1.000000
2023 1.000000
2024 1.000000
2025 1.000000
2026 1.000000
2027 1.000000
2028 1.000000
2029 1.000000
2030 1.000000
2031 1.000000
2032 1.000000
2033 1.003868
2034 1.000000
2035 1.000000

80
Table E8: Cooling Water, Low-Pressure Steam, Propane Refrigeration, Propylene, and Hydrogen Pricing
Cooling Water ($/m3) LP Steam ($/MMBtu)
Propylene ($/kg)
H2 ($/MMBtu) Propane Refrigeration ($/MMBtu)
Source: literature Source: Dr. Eldridge Source: literature Source: Dr. Eldridge Source: Dr. Eldridge
Year Data Year Data Year Data Year Data Year Data
2016 0.023000 2016 N/A 2016 0.950000 2016 N/A 2016 N/A
2017 0.027835 2017 N/A 2017 1.149726 2017 N/A 2017 N/A
2018 0.029912 2018 N/A 2018 1.235475 2018 N/A 2018 N/A
2019 0.032443 2019 3.000000 2019 1.340021 2019 6.583476 2019 5
2020 0.017124 2020 1.583481 2020 0.707299 2020 4.455471 2020 2.639134
2021 0.023870 2021 2.207273 2021 0.985931 2021 5.137967 2021 3.678788 2022 0.035997 2022 3.328643 2022 1.486817 2022 5.394441 2022 5.547738
2023 0.026130 2023 2.416308 2023 1.079301 2023 7.298988 2023 4.027179
2024 0.032179 2024 2.975655 2024 1.329147 2024 6.138749 2024 4.959425
2025 0.023521 2025 2.175016 2025 0.971523 2025 6.536917 2025 3.625027
2026 0.035718 2026 3.302882 2026 1.475311 2026 8.476230 2026 5.504803 2027 0.025069 2027 2.318170 2027 1.035466 2027 8.773194 2027 3.863616
2028 0.033245 2028 3.074241 2028 1.373183 2028 8.472165 2028 5.123735 2029 0.034125 2029 3.155538 2029 1.409496 2029 8.156537 2029 5.259230
2030 0.039030 2030 3.609162 2030 1.612118 2030 7.399816 2030 6.015270
2031 0.027549 2031 2.547480 2031 1.137893 2031 8.047329 2031 4.245801
2032 0.030930 2032 2.860137 2032 1.277548 2032 6.350443 2032 4.766895
2033 0.021705 2033 2.007037 2033 0.896491 2033 7.816752 2033 3.345062 2034 0.020102 2034 1.858855 2034 0.830302 2034 7.068586 2034 3.098091
2035 0.020460 2035 1.891938 2035 0.845079 2035 4.996974 2035 3.153230

81
Appendix F
Process Hazard and Operability Study (HAZOP)

83
Table F1: HAZOP of the Reactor, Compressor Train, and Furnace
Project Name: Conversion of Ethane to Ethylene
Sections Included: Reactor, Compressor Train, and Furnace
Item Study Node Deviation Possible Causes Possible Consequences Action Required
Furnace
Temperature
High Low/no inlet flow,
excessive utility (FIRE)
burned, fuel valve failed
to close
Weakened metallurgy, overpressure
and loss of containment, some
substances are at/near auto-ignition
temperatures so in loss of
containment an explosion could
occur. Also damage to metallurgy
downstream such as compressors
could occur from high temperatures
FIRE feed valve should fail-
close. Emergency cooling
water in case of large
dangerous deviations. Due
to the risk of combustion,
build furnace far from control
rooms.
Low High process inlet flow to
furnace, low FIRE flow to
furnace
Less reaction leading to higher
propane than propene, over long
times this could lead to abnormal
operation of column/flooding
Accepted risk
Pressure High Excessive temperature,
no/low outlet flow
Overpressure causing cracks in
metallurgy and loss of contamination.
Air could also enter the system and
cause a fire/combustion as chemicals
are near their auto-ignition
temperature.
Pressure relief valve, process
outlet valve should fail-open
while FIRE feed valve should
fail-close. Additionally, due
to the risk of combustion,
build reactor far from control
rooms.
Low Compressors pulling in
combination with low/no
inlet flow to furnace
Structural damage caused by vacuum
pressures, loss of containment
Add a vacuum pressure relief
just upstream from a
compressor to avoid
dangerous levels of vacuum

84
Compressors Flow
Low Compressor Failure,
Scaling on tubes,
improper valve
alignment, choked flow
at heat exchanger
Pulling Vacuum and damaging
compressor or upstream piping,
Rising temperature near compressor
Add a vacuum pressure relief
just upstream from a
compressor to avoid
dangerous levels of vacuum,
Low flow alarm
None Compressor Failure,
Scaling on tubes,
improper valve alignment
Pulling Vacuum and damaging
compressor or upstream piping
which could lead to loss of
containment, Rising temperature
near compressor
Add a vacuum pressure relief
just upstream from a
compressor to avoid
dangerous levels of vacuum,
Low flow alarm
High Leak downstream of
compressors (Lower than
planned pressure
downstream), reactor
producing high pressure
Over pressure in Downstream heat
exchanger or columns, Inadequate
reactor resonance time, warmer flow
reducing efficiency and potentially
hurting metallurgy
Flow high alarm, a high
temperature probe may be
used in its place to indicate
the necessary safety issues
Temperature High High inlet temperature
from process variations
in reactors, compressor
vibrations, inadequate
cooling between
compressions due to
scaling in heat
exchangers
Weakened metal, could lead to
future loss of integrity and loss of
containment, loss of efficiency
Include temperature probes
so operators can adjust set
points if coolers are
inadequate
High temperature alarm
Vibrations High Out of balance
compressor caused by
poor maintenance
Compressor vibrations can cause
cracks in piping or other instruments
near the compressor or the
compressor (loss of containment),
and can cause a lack of balance
Regular maintenance checks
(vibration sensors and
temperature monitoring are
common ways to check
compressor vibrations)

85
Reactor Temperature High Outlet of furnace is high Can hurt the metallurgy and cause a
loss of containment. Because some
chemicals are near their auto-ignition
point in the reactor, a loss of
containment can cause a combustion
Reaction is endothermic. The
largest protections are taken
in preventing furnace from
having high temperature.
(Listed above). Additionally,
due to the risk of
combustion, build reactor far
from control rooms.
Pressure High Blocked outlet, scaling in
outlet, trapped vapors
under heating, high
pressure from furnace
Could overpressure and rupture
through reactor. Again, because
some chemicals are near their auto-
ignition point in the reactor, a loss of
containment can cause a
combustion.
Add a pressure relief valve.
Additionally, due to the risk
of combustion, build reactor
far from control rooms.
Low Low process inlet
(scaling, valve alignment,
etc.) with compressors
pulling.
Structural damage caused by vacuum
pressures, loss of containment. Loss
of containment here could cause
combustion as mentioned above.
Add a vacuum pressure relief
just upstream from a
compressor to avoid
dangerous levels of vacuum
upstream in the process.
Also build far from control
room as mentioned above
Flow High Compressors pulling flow
through reactor too
quickly or poor mixing in
reactor such that
entering air quickly leads
to the exit.
Lower resonance time, so less of the
cooling, endothermic reaction. Very
hot air leads to the compressors and
can cause metallurgy issues.
Flow high alarm, a high
temperature probe may be
used in its place at reactor
outlet to indicate the
necessary safety issues.