che discussion paper 174 - university of york
TRANSCRIPT

CENTRE FOR HEALTH ECONOMICS CENTRE FOR HEALTH POLICY UNIVERSITY OF WITWATERSRAND
Hospital Benchmarking Analysis and the Derivation of Cost Indices
Neil Soderlund Rowena van der Merwe DISCUSSION PAPER 174


HOSPITAL BENCHMARKING ANALYSIS AND THE DERIVATION OF COST INDICES
Neil Söderlund1 and
Rowena van der Merwe2 1. Centre for Health Policy, University of Witwatersrand 2. Centre for Health Economics, University of York November 1999
Hospital Benchmarking Analysis and the Derivation of Cost Indices
i
ABSTRACT This paper reports work undertaken for the UK Department of Health to explore approaches to measuring and comparing hospital productivity. The purpose of the cost indices produced in this paper has been to use them to derive productivity scores for English NHS Trusts in order to benchmark them against one another to help identify poorer performers. The work builds on previous deterministic ‘efficiency indices’ by using statistical regression adjustment techniques. This work describes the derivation of three cost indices (CCI, 2CCI and 3CCI), each with increasing adjustment in terms of case mix, factor prices and environmental factors. The analysis uses data for the year 1995/6 and specifically examines acute Trusts. The CCI cost index is a deterministic index that takes into account case mix as measured by Healthcare Resource Groups (HRGs) and inpatient, first outpatient and accident and emergency (A & E) activity. It is a weighted index of actual / expected costs where expected costs are measured as average national costs per respective attendance. 2CCI takes factors into account such as additional adjustments for case mix, age and gender mix, transfers in and out of the hospital, inter-specialty transfers, local labour and capital prices and teaching and research costs for which Trusts might be over or under compensated. The 3CCI makes additional adjustments over and above those in the 2CCI for hospital capacity, including number of beds, and number of sites, scale of inpatient and non-inpatient activity and scope of activity. It therefore tries to capture institutional characteristics amenable to change in the long, but not the short run. 2CCI and 3CCI indices are obtained from a short-run regression model using CCI as the dependent variable, and productivity scores are obtained from the residuals of the regressions. The results suggest that the statistical adjustments reduce estimates of productivity variation between providers considerably, such that there is relatively little difference between providers in terms of fully adjusted (short-run) productivity scores (3CCI). This suggests that savings from bringing poorer performers up to those with higher productivity scores, may in fact be quite small. In the long run there may be more scope for productivity enhancement and savings than in the short run, by optimising capacity and activity levels. Productivity benchmarking results should always be tempered against judgements on the quality and effectiveness of service provision which these indices are currently unable to measure. Implicitly equating high cost to inefficiency, as these indices do, may also be problematic. The paper suggests that the use of panel data and the application of alternative methodologies (such as stochastic frontiers and Data Envelopment Analysis) would be a valuable way to extend this work.

CHE Discussion Paper 174 1
1. INTRODUCTION Measures assessing the performance of NHS Trusts, (the principal providers of health care in the UK) on aspects such as efficiency have been seen to be of increasing importance to ensure that the best use is made of scarce resources. Both the NHS White Paper and the later consultation document “A National Framework for Assessing Performance” stress the need to develop new instruments to tackle inefficiency in the NHS (NHS Executive, 1997). Benchmarking has been proposed as a method whereby Trusts could be compared to their peers and under-performing Trusts identified so that appropriate corrective measures might be taken. Previous measures to assess health service provider efficiency have included NHS Efficiency Indices and NHS Performance Indicators. These have been criticised for inadequately capturing the true nature of hospital output. To date, the Labour Productivity Index (LPI) has been the most sophisticated published basis for regular comparisons of Trust costs (and, therefore, implicitly of Trust productivity). The NHS Executive has extended this work to include non-labour costs, and to adjust for income derived from trading services between Trusts. However, even thus enhanced, two main shortcomings remained which might confound comparisons:
the use of a crude measure of case mix, based on expected length of stay; and an allowance for a limited range of additional exogenous cost drivers.
The aim of the work described in this paper is to use a more sophisticated adjustment for case mix differences and to allow for a wide range of possible cost drivers via multivariate statistical techniques. However, in line with the LPI, the emphasis is still on developing a plausible, intuitive and understandable approach, that is accessible to health service managers, yet consistent and robust in its identification of poorly performing Trusts. This intention underpinned a number of decisions made during the modelling process, including choice of functional form, formulation of the dependent variable, and choice of regressors. In particular, the dependent variable was designed to look similar to the traditional ‘efficiency index’, including a number of deterministic adjustments (in contrast to the conventional econometric approach of including all adjustments on the RHS of the equation). The resulting index, labelled the CCI, can thus be interpreted by someone with no statistical knowledge. The paper describes the derivation of three cost indices (CCI, 2CCI and 3CCI) and uses these to derive productivity scores for English acute NHS hospitals using data for the year 1995/6. The productivity scores are then used to benchmark Trusts with the purpose of identifying poorer performers.

Hospital Benchmarking Analysis and the Derivation of Cost Indices 2
This paper is divided into 3 sections. The methods section describes the data, the construction of the deterministic cost index, the regression and derivation of the statistically adjusted indices, the functional form chosen and some estimation issues. The results section describes the regression results and the productivity indices derived from the regressions. Finally, the paper concludes with discussion of issues around the methodology chosen, the results obtained and future avenues for research. 2. METHODS Applying production theory to the hospital allows econometric estimation of a cost function which describes the relationship between outputs and costs (Folland, Goodman & Stano, 1997). The cost function usually contains explanatory variables on the right hand-side of three types: output quantities, factor prices and (in the short-run) the amounts of fixed factors of production, all of which may be considered exogenous (Zweifel & Breyer, 1997). However, the observed deviation of hospital behaviour from profit maximisation / cost minimisation, has led to the use of a behavioural cost function (Evans, 1971) which in contrast to the above structural cost function, is derived from analysis of the patterns of costs in actual data from hospitals. This behavioural function may include variables that have no influence on minimum cost but that help to explain systematic deviations from minimum cost. This paper uses a variant of this type of cost function and then uses the residuals from the estimated cost function, or the difference between the actual and estimated cost of hospitals, to derive estimates of their relative efficiency. 2.1 The data The analysis is based primarily on data from the database of all hospital inpatient episodes known as the Hospital Episode Statistics (HES), as well as NHS Executive survey data and some Trust Financial Returns by programme and specialty (TFR2). Data from the various sources were combined into a standard format, and Trusts with incomplete data excluded from further analysis. Hospitals where geriatrics and psychiatry constituted more than 50 percent of admissions were also excluded from the hospital level analyses because of an inability to adequately capture the output of such institutions. Previous work suggests that Healthcare Resource Groups (or HRGs, the English casemix classification system) do not perform well for these specialties (Söderlund, Gray, Milne & Raftery, 1996), where diagnosis is typically a poor predictor of resource use1. However, mental health activity in mainly acute hospitals is included for completeness, despite some problems with HRGs in this category.
1 Initial modelling work incorporating hospitals with substantial psychiatric and geriatric workloads yielded confusing results and all formulations mis-specified according to conventional tests, confirming the view that acute specialties should be analysed in isolation.

CHE Discussion Paper 174 3
The derivation of each of the variables used in the modelling is described in Appendix 1. The unit of analysis used in this paper is the Trust and results are presented of data for the financial year 1995/62. Some data limitations should be borne in mind. Inconsistencies in data may arise from different ways in which Trusts classify inpatients, outpatients and day cases and these may in turn influence the resulting productivity scores. However this may be more problematic in assessing performance within specialties than at Trust level and the extension of HRGs to outpatients and A & E in the future, should address such problems. Trusts may also have different ways in which they allocate costs across specialties, for example the cost of consultants who work across specialties. This may again affect the reliability of specialty estimates more than Trust level estimates. Finally data cannot yet make allowance for cost shifting from Trusts to community agencies, patients, families and social services. For example early discharge may help to lower a Trust’s unit costs and improve its productivity score by shifting the care burden into the community. Indicators such as readmission rates would help to monitor this in future. 2.2 Construction of a deterministic cost index The first stage of the regression analysis involved constructing a deterministic cost index based on actual / expected costs for each hospital. Expected costs were based on inpatient, outpatient and A & E (accident and emergency) costs, calculated using an HRG case mix index (described in Appendix 1) and national average costs per respective attendance. The cost index was thus calculated as: CCIi = Ci (1) [(IC*IPi*HIi)/(HI*IP)] + ΣjOPij*OCj/OPj + AEi*AC/AE where: CCIi = Cost index for hospital i Ci = Cost incurred by hospital i for inpatient, outpatient and A & E care3 IC = Total costs incurred for inpatient spells for all acute hospitals IPi = Number of inpatient spells in hospital i HIi = HRG case mix index for hospital i HI = Average HRG case mix index for all spells treated in the study hospitals IP = Total number of inpatient spells in all study hospitals OPij = Total first outpatient attendances in hospital i in specialty j OPj = Total first outpatient attendances for all study hospitals in specialty j
2 Cost indices for Trust specialties have also been developed and the analysis has been extended to other years. These results are not however presented in this paper. 3 These costs included a notional capital cost, estimated as 6 percent of the net asset value of the Trust attributable to inpatient, outpatient and A & E services delivered to NHS patients. Service Increment for Teaching and Research (SIFTR) revenue, and revenue from private patients were excluded from the total cost figure in an attempt to obtain a pure measure of NHS patient care costs. Net costs obtained may thus be biased to the extent that these revenues over or under compensate Trusts for their respective activities.

Hospital Benchmarking Analysis and the Derivation of Cost Indices 4
OCj = Total cost of outpatient attendances for all study hospitals in specialty j AEi = Total first A & E attendances in hospital i AE = Total first A & E attendances in all study hospitals AC = Total cost of A & E in all study hospitals A higher value for the cost index indicates a less productive hospital. The index has been named the Casemix-Adjusted Unit Cost Index (CCI) and has been standardised so that it has a national average of one. 2.3 Statistical adjustment of the cost index Multiple regression techniques were then used to make statistical adjustments to the cost index CCI to account for residual case mix differences, differences in factor prices, differences in the environment, and data artefacts. This additional statistical adjustment was necessary because one might suspect, for example, that emergency cases are more costly than elective ones, or transferred patients more costly than admitted ones, yet one has no a priori idea of the size of this difference. Multiple regression techniques are able to ascertain both the size of these effects, and degree of precision associated with their measurement. The variables used as regressors were divided into two groups. The first group consists of measures, or adjusters of hospital output or factor prices that might be considered purely exogenous factors. These include: The HRG case mix index The age and gender mix of the inpatient population The average number of episodes per spell Transfers in and out of the hospital Inter-specialty transfers Local labour and capital prices Teaching and research activity (these proxy educational outputs)
When the cost index is adjusted for these factors (case mix, severity, factor prices and educational outputs) the new index is called the Casemix Costliness Adjusted Unit Cost Index (2CCI). An additional set of structural and environmental factors were then also included. These would not conventionally be considered candidates for inclusion in a cost function because they are under the control of hospital management, and thus not true exogenous determinants of hospital behaviour. However, in the NHS, historic factors have dictated constraints on the way in which management can optimise institutional performance and these factors are probably de facto exogenous in the short run. For example, a Trust that inherited an ageing

CHE Discussion Paper 174 5
Victorian building unsuited to modern health care should theoretically be able to transform its premises. In practice, however, constraints on raising capital and accumulating surpluses make it difficult for Trusts to do this, and hence they might not function as efficiently as they could. Likewise, while Trusts may over time try to alter the scale or scope of their activity4, any decisions in this regard are subject to NHS Executive approval, and there are many anecdotal cases where providers have been prevented from optimising their performance because of higher political or service access considerations. Variables included in this category are: Hospital capacity, including number of beds, and number of sites Scale of inpatient and non-inpatient activity Scope of activity
The first two factors together constitute an adjustment for hospital utilisation levels. It was assumed that adjustment for all variables (outputs, factor prices and institutional characteristics) would give a reasonable indication of a Trust’s short run productivity. This index is called the Casemix Costliness and Configuration Adjusted Unit Cost Index (3CCI). To obtain an indicator of long run productivity (i.e. assuming institutional characteristics were optimised), the latter set of effects were included in the model residual. So called short run, and long run adjusted indices were thus calculated from the model as follows: 3CCI: Ii
SR = CCIi + 1- βXi´ - γZi´ - α (2) 2CCI: Ii
LR = CCIi + 1- βXi´ - α (3) where: Ii
SR = Short run efficiency indicator for hospital i Ii
LR = Long run efficiency indicator for hospital i CCIi = Cost index for hospital i Xi = Vector of “production theoretic” regressors (outputs and factor prices) Zi = Vector of institutional characteristics amenable to change in the long, but not the short run β, γ, α = Parameters estimated
4 Hospital managers may not easily be able to alter the scale of their operations in the short run. One may therefore have higher cost due to inappropriate use of resources (technical inefficiency) for which the Trust manager should be accountable, and higher cost due to the fact that the scale of operation differs from the optimal one, for which the Trust manager may not be responsible (at least in the short run). To test for economies of scale with a more flexible relationship, the regression model could include the variable (AVBEDS)2 which would allow testing for a “U” shaped relationship between size and unit cost. The results of testing this were inconsistent and did not warrant further in depth investigation of scale effects.

Hospital Benchmarking Analysis and the Derivation of Cost Indices 6
The long run adjusted index 2CCI was calculated using the coefficients from the fully specified (short run) model (2). The variables used in the regression are listed in Table 1 and described more fully in Appendix 1.
Table 1: Variables in benchmarking model, 1995/6
Variable key INTERCEP Intercept
In short and long run estimates (2CCI and 3CCI) TRANSIPP Transfers in to hospital per spell TRANSOPP Transfers out of hospital per spell EMERGPP Emergency admissions per spell FCEINPP Finished consultant episode inter-specialty transfers per spell OPNPP Non-primary outpatient attendances per inpatient spell EMERINDX Standardized index of unexpected emergency admissions/total
emergency admissions EP_SPELL Episodes per spell HRGWTNHS HRG weight, case mix index PROP15U Proportion of patients under 15 years of age PROP60P Proportion of patients 60 years or older PROPFEM Proportion of female patients STUDENPP Student whole time teaching equivalents per inpatient spell RESEARPC Percentage of total revenue spent on research (estimated 1995) MFF_COMB Market forces factor – weighted average of staff, land, buildings and
London weighting factors. In short run model only (3CCI) HESSPNHS Total inpatient spells by NHS patients TOTOP1 Total primary outpatient attendances (NHS patients) A_E1 Total primary A & E attendances (NHS patients) AVBEDS Average available beds HEATBED Heated volume per bed SITES50B Sites with more than 50 beds ITINDX Scope / specialization index, information theory index

CHE Discussion Paper 174 7
2.4 The regression The intention of the benchmarking model is to produce valid estimates of provider efficiency, adjusting for volumes of activity, case mix, input price variation, and other constraints on optimal hospital functioning that may be difficult to change in the short run. It should be mentioned at the outset that the approach to this exercise was at least partly normative. That is, the model did not seek to discover the “true determinants” of hospital productivity, as much as a sub-set of “acceptable” hospital outputs and productivity determinants given the framework under which NHS hospitals were managed. This normative approach determined:
The hospital outputs incorporated in the modelling. The costs which should be attributed to the production of these outputs. The institutional, patient and environmental characteristics which are considered
acceptable drivers of hospital costs. 2.4.1. Functional form A simple additive linear functional form was assumed. The reasons for this were three-fold. Firstly, the coefficients on this form of model are far easier to interpret than those of more flexible functional forms. Furthermore, too flexible a functional form might be counterproductive in this exercise given its normative set of objectives, and the fact that residuals are interpreted as efficiency scores. Often when more flexible functional forms such as translog models are used, they turn out to be near-deterministic and there is no residual left with which to study inefficiency. It seemed reasonable to assume a set of linear relationships within this strongly normative framework. Finally, specification tests on the fully specified version of the model generally indicated that it was not mis-specified in the linear additive form5. 2.4.2.. Measurement of hospital outputs
2.4.2.1. Inpatient activity
Measurement of the volume of inpatient care performed by NHS acute hospitals has been a contentious issue ever since the introduction of the Körner statistical returns in 1987. The finished consultant episode (FCE) forms the basic inpatient activity measurement unit under the Körner system. During a single hospital admission, however, multiple FCEs might occur as a result of transfers within or between specialties. The inpatient spell, or set of episodes constituting a single admission, thus serves as a slightly higher level of aggregation of inpatient activity. Although the FCE has been extensively criticised, preliminary statistical analyses show that spells also fail to fully capture total inpatient activity. Both measures of

Hospital Benchmarking Analysis and the Derivation of Cost Indices 8
inpatient activity are therefore captured in the model, inpatient spells (the basic measurement unit incorporated in the CCI), and the number of episodes per spell (as a RHS regressor). In addition, two other effects are included in the model to adjust volume of inpatient activity. Firstly, it is assumed that transfers from a hospital represent an inability to meet the treatment needs of a given case, and this should thus be treated as less than a full spell. Secondly, large fluctuations in levels of emergency admissions imply that more fixed capacity has to be retained for a given average level of activity, and consequently, costs should increase. Variables are thus included to capture the proportion of spells that are transferred elsewhere, and the level of unexpected emergency admissions.
2.4.2.2. Outpatient and A & E activity
It was felt by the Department of Health that first outpatient and A & E attendances better represented health care output in these areas than did total number of attendances. In the case of A & E, subsequent attendances are likely to be for minor interventions, such as removal of sutures or change of dressings and would therefore not incur significant costs. Furthermore, by far the majority of A&E attendances were primary ones. Non-primary outpatient attendances, on the other hand, might well result in significant costs, especially in cases where patients with serious chronic diseases are being followed up over time. Consequently, numbers of non-primary outpatient (but not A & E) attendances were included as regressors in the model.
2.4.2.3. Case mix
Case mix was measured using a scalar case mix index, derived using Healthcare Resource Groups (HRGs). In order to estimate a case mix index for a hospital, all cases were allocated to an HRG category, and a weight representing the expected cost of that category attached accordingly. The average weight across a hospital is its “case mix index”. Previous studies have shown that case mix is a powerful predictor of hospital costs (Söderlund, Gray, Milne & Raftery, 1996), and the case mix index has thus been included as a fixed adjustment in constructing the cost index, as well as a statistical adjuster of the cost index to capture the residual case mix effects which might still influence costs. The case mix index however, remains an incomplete measure of expected patient costs for a number of reasons. Firstly, it applies only to inpatient costs, and thus excludes case-type variation amongst outpatient and A & E attenders. Secondly, while some age and gender splits occur within HRGs, these are not universal, and one would expect some residual effect of age and gender on hospital costs after HRG-based adjustments. Thirdly, aspects of patient case mix, especially those related to severity of illness, are generally not completely captured 5 It could be argued that the additive linear form also imposes some restrictions on the production structure in that returns to scale are assumed to be the same across all dimensions of production. However, the ease of

CHE Discussion Paper 174 9
by diagnosis-based measures such as HRGs. Therefore proxy variables such as the number of emergencies and whether or not cases have been transferred in from elsewhere have been used to capture some of this severity effect.
2.4.2.4. Teaching and research
Teaching and research constitute important secondary outputs of NHS hospitals, and therefore qualify as valid “production theoretic” regressors in a cost-function. No reasonable measure of research outputs per se could be found, however, and consequently a relatively imperfect measure, the proportion of revenue constituted by external research income, had to be used.
2.4.2.5. Use of deflated independent variables
Many of the independent variables used in the model are divided through by scale or capacity factors. The deflation provided a more precise estimate of the individual effects of the regressors on the dependant variable and also significantly reduced model heteroskedasticity. The main reason for this was that the three capacity terms are collinear, and most of their variance is thus redundant in model estimation. By deflating them, a more precise estimate of their individual effects on the dependant variable can be obtained. 2.4.3. Estimation issues
2.4.3.1. Removal of highly influential observations
While the quality of NHS routine data, both on the clinical and financial side, has improved considerably, incorrect data still exists. In some cases this may be due to incomplete recording of activity or costs, while in others it is possible that providers have recorded all data, but classified costs or activities incorrectly. Checking data with individual Trusts would be extremely labour intensive, and could not be done for this study. Some unusual data in the set might also be correct, and represent true, but highly atypical provision situations. Many of these providers show up as highly influential, or outlier data points in the model. By identifying and removing these points6 the model was re-estimated for a subset of typical providers, and thus general productivity norms could be established more accurately.
interpretation of the linear functional form was considered important from a policy point of view. 6 The DFFITS statistical procedure (Belsey, Kuh & Welsch, 1980) was used in these analyses to identify highly influential providers, and exclude these from the estimation of coefficients. A relatively conservative threshold was used to exclude observations: where DFFITS > 3 × (p/n)0.5 (p = number of parameters estimated; n = sample size).
Hospital Benchmarking Analysis and the Derivation of Cost Indices 10
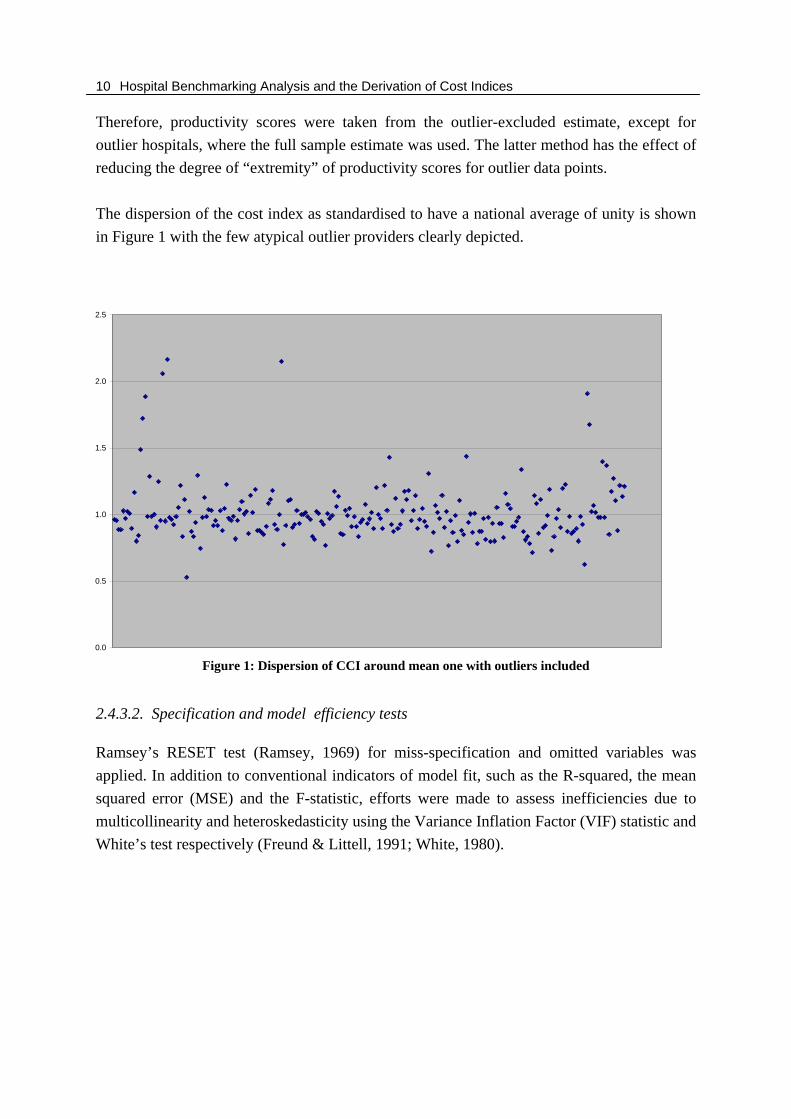
Therefore, productivity scores were taken from the outlier-excluded estimate, except for outlier hospitals, where the full sample estimate was used. The latter method has the effect of reducing the degree of “extremity” of productivity scores for outlier data points. The dispersion of the cost index as standardised to have a national average of unity is shown in Figure 1 with the few atypical outlier providers clearly depicted.
Figure 1: Dispersion of CCI around mean one with outliers included
2.4.3.2. Specification and model efficiency tests
Ramsey’s RESET test (Ramsey, 1969) for miss-specification and omitted variables was applied. In addition to conventional indicators of model fit, such as the R-squared, the mean squared error (MSE) and the F-statistic, efforts were made to assess inefficiencies due to multicollinearity and heteroskedasticity using the Variance Inflation Factor (VIF) statistic and White’s test respectively (Freund & Littell, 1991; White, 1980).
0.0
0.5
1.0
1.5
2.0
2.5

CHE Discussion Paper 174 11
3. RESULTS 3.1 Regression results Results for the full regression model are shown in Table 5 in Appendix 2. 232 hospitals entered the regression. The results for the regression model with outliers removed (the ‘trimmed’ model), are shown in Table 6 in Appendix 2. The trimming process left a sample of 218 hospitals. The adjusted R-squared in each model is around 0.66 suggesting that the regressors are able to explain around two-thirds of the variation in the cost-index. There were no significant multicollinearity or heteroskedasticity problems in the trimmed or full-sample models. Where explanatory variables were strongly correlated, there was sufficient statistical power to produce quite precise coefficient estimates. The model passed the RESET test (p>0.05). The trimmed data coefficients are likely to be more reliable estimates, as they represent the norms of more typical providers, though the signs and coefficient sizes are relatively consistent across the two models. Coefficients indicate the change in the cost index associated with a one unit change in the relevant explanatory variable. In most cases, the explanatory variable also had the expected hypothesised sign (as suggested in Appendix 1). The episodes per spell term, and the non-primary outpatient volume term, had significantly positive coefficients in both models, as expected. This suggests that multi-episode spells are indicative of increased complexity and costliness. Outpatient reattendances were associated with significant extra costs, suggesting that they may be a substitute for admissions. The HRG index term was not significant in either model, suggesting that the deterministic HRG adjustment made to the dependent variable was probably adequate in capturing case mix. The specialisation index was significant in the full model with the expected positive sign in both models, suggesting that economies of scope may apply. Transfers in from other hospitals (of more complex and costly cases), and transfers out (with less cost incurred in-house) had significant positive and negative signs, respectively, as expected, in the trimmed model, although they were both insignificant in the full model. Intra-specialty transfers did not add anything to the adjustment made by the episodes per spell. Emergencies per spell were also non-significant contributors to both models, though the unexpected emergency index had the expected positive sign in both models and was significant in the full model. The market forces factor had the expected positive sign in both models and was highly significant which is consistent with findings from other studies (Berry, 1970). This suggests that higher factor prices in local labour and capital markets feed through into somewhat higher patient treatment costs.

Hospital Benchmarking Analysis and the Derivation of Cost Indices 12
Student teaching activity was consistently cost increasing, as expected, whereas research was significantly cost decreasing. It should be noted that hospital revenue for teaching and research purposes was deducted from the initial cost term, so these coefficients represent the extent to which hospitals are over or under compensated for their academic activity. The positive sign on the student teaching variable therefore suggests that either teaching hospitals are not fully compensated for their costs, or it highlights some potential inefficiency in teaching Trusts. The negative sign on the research term suggests that hospitals doing much research may use some of their research income to cross-subsidise patient care. The variables that did contradict the prior hypothesised signs were the age and gender variables, all proving to be significantly cost decreasing. This suggests that female patients and patients in the under 15 and over 60 age brackets are less resource consuming than other patients, all else being equal. This does seem to correspond with previous research findings that suggest that men may receive more service-intensive care in order to reduce their length of stay and hence opportunity cost of lost income (Ro, 1969). Other studies have shown, however, that aged patients may consume fewer resources per day as a result of lower service intensity (Lave, Lave & Silverman, 1972; Hornbrook & Monheit, 1985). In this case, it should be noted that the age and gender adjustments are superimposed on data that has already been partially adjusted for these factors within HRGs. They thus cannot be interpreted as a pure age or gender effects, but rather residual effects after HRG adjustment. All of the capacity variables (beds, heated volume and number of sites) were significantly cost increasing, thus increasing overhead costs, while scale of activity variables (number of spells, first outpatient and first A & E attendances) were significantly cost decreasing. Together, these confirm that hospitals with higher utilisation rates are more productive. The beta values, sometimes called standardised regression coefficients, are the regression coefficients when all variables are expressed in standardised (or z-score) form. Transforming the independent variables to standardised form makes the coefficients more comparable since they are all in the same units of measure. This allows one to compare the relative importance of the independent variables. It is worth noting that some of the following variables emerge as contributing significantly to the regression; outpatients per inpatient spell, the proportion of patients over the age of sixty, episodes per spell, the specialisation index and research. When these variables are included in the regression they may have a significant impact on the results that emerge as they play an important part in explaining cost variation.

CHE Discussion Paper 174 13
3.2 Productivity scores Three separate productivity indices were produced for each hospital. They were derived from the residuals of the regressions. All scores were standardised to give a national average of approximately 1 for ease of comparison while higher scores indicate less productive providers. They are, in order of increasing adjustment:
The CCI cost index (as calculated in equation 1) The 2CCI long run adjusted cost index (as calculated in equation 3) The 3CCI short run adjusted cost index (as calculated in equation 2)
Trusts were ranked against one another on these three indices. The basic descriptive statistics for these indices are shown in Table 2.
Table 2: Degree of dispersion of productivity indices
Key Mean Std Dev Min Max CCI (Cost index) The unadjusted CCI cost index 1.015 0.218 0.531 2.166 2CCI (LR index) Partially adjusted cost index – adjusted only for
factors that would be exogenous in the long run 1.010 0.151 0.606 1.819
3CCI (SR index) Fully adjusted cost index using all regressors 1.003 0.115 0.581 1.603
As seen in Table 2, the degree of variation between hospitals in terms of short-run efficiency was not very great relative to the unadjusted efficiency index. The statistical adjustments thus reduce productivity variation between providers considerably, such that there is relatively little difference between providers in terms of fully adjusted (short-run) productivity scores. This would suggest that the potential for savings by bringing poorly performing hospitals up to the level of the best ones (should this be possible) is modest, at least in the short-run. Given these relatively similar levels of efficiency, however, one would be able to make other comparisons between hospitals, with regard to outcomes for example, with more confidence. Variation in long run efficiency is greater, however, suggesting that there is still room for efficiency enhancement by optimising capacity and activity levels in particular. Amongst the efficiency scores combined into each index, rank correlations for both the full sample and trimmed sample scores were high as shown in Tables 3 and 4.

Hospital Benchmarking Analysis and the Derivation of Cost Indices 14
Table 3: Correlations between productivity indices for full sample CCI 2CCI (LR index) 3CCI (SR index) CCI 1.000 2CCI (LR index) 0.846 1.000 3CCI (SR index) 0.646 0.794 1.000
Table 4: Correlations between productivity indices for trimmed sample
CCI 2CCI (LR index) 3CCI (SR index) CCI 1.000 2CCI (LR index) 0.721 1.000 3CCI (SR index) 0.557 0.720 1.000
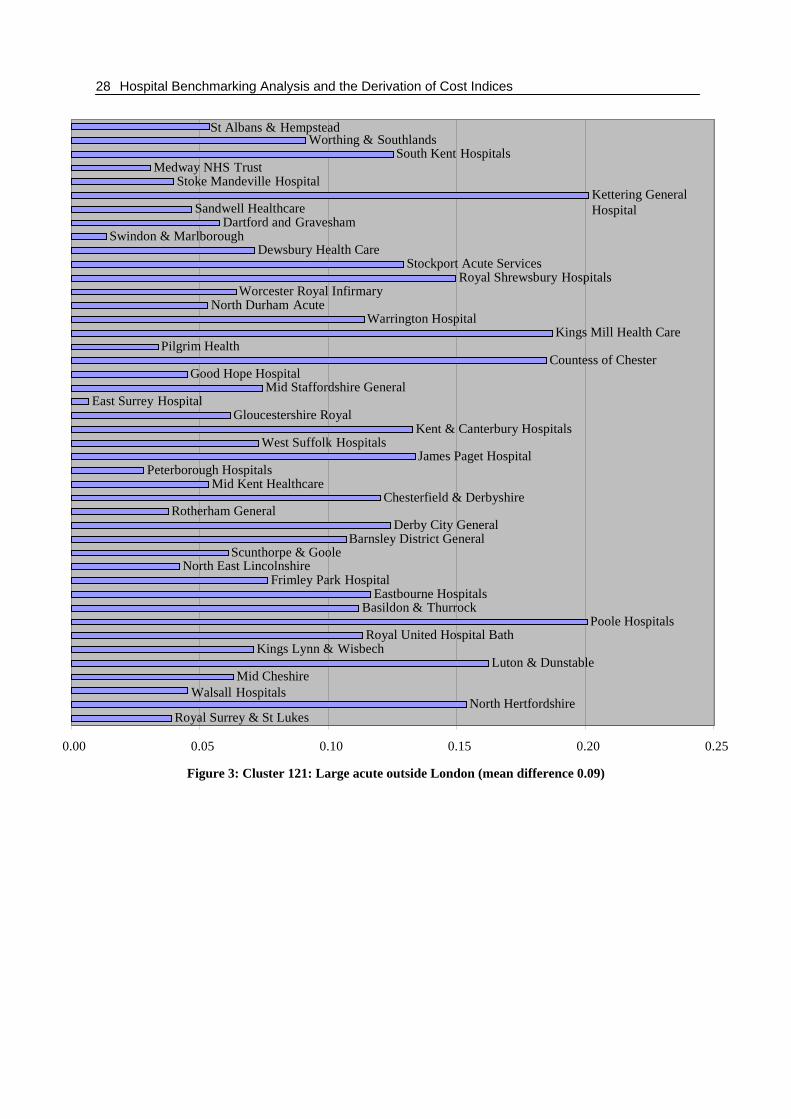
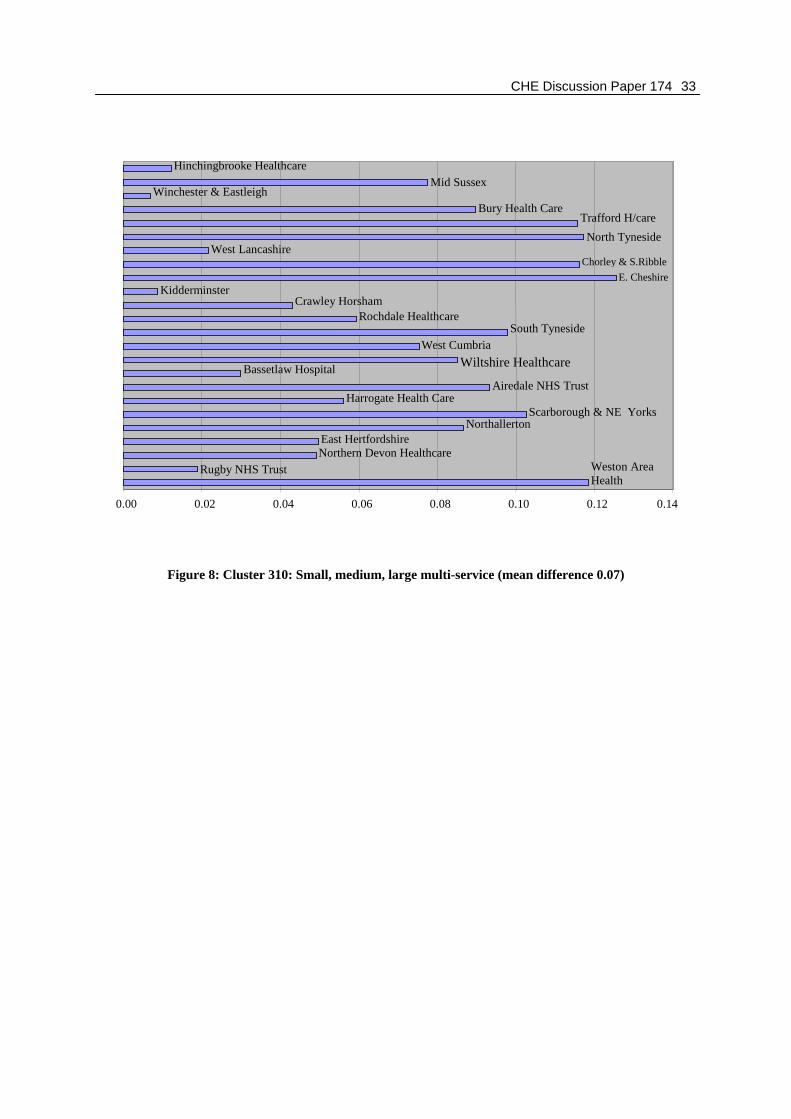
These tables therefore suggest a relatively large degree of correlation between the three indices. However, there can be a relatively large degree of movement across the three indices for each Trust as highlighted in Appendix 3, which shows the absolute difference between the largest and the smallest score for the three indices for each Trust. Therefore for Trusts which move quite considerably across the three indices and are more sensitive to the degree of adjustment in each index, the line (difference) will be longer (greater). 4. CONCLUSIONS AND FUTURE RESEARCH The purpose of this paper has been to produce an adjusted “efficiency index” for English acute NHS Trusts in order to compare them according to their productivity. Adjustments were made using both deterministic and statistical techniques, but in all cases, effects were assumed to be linear, and it was assumed that the system could be adequately represented by a single equation. More complex and less constrained methods have been used elsewhere, but it was felt that the need to make the methods understandable should enjoy priority. Therefore the minimum of higher order terms in the functional form made for greater ease of interpretation of the coefficients. One cannot be completely confident that the data used were error free. Consequently, where a given observation had an unusually large effect on the model coefficients, the model was re-estimated without the observation. This is a crude approach, but was necessitated by the unusually large effect of certain hospitals on the model. Even if these data points were correct, one could argue that the hospitals concerned are sufficiently atypical not to simply be lumped together with the rest of the sample. It should also be borne in mind that accuracy of the analyses and productivity scores are limited by the accuracy of the data. As long as data collection continues to improve and coding techniques and costing allocations across different Trusts converge towards similar practices, the results for future analyses will improve.

CHE Discussion Paper 174 15
Implicit in this paper’s productivity rankings and Department of Health requirements to be able to benchmark Trusts in this way, is the assumption that high costs equate to inefficient providers. Without more information on quality, however, one cannot say that high or low costs are indicators of efficiency, nor that these providers produce effective or high quality services. This will always remain a caveat in productivity rankings based on routinely gathered data. Information on quality and health outcomes should therefore always be used to moderate judgements of Trust efficiency. Perhaps, most importantly, the degree of “fully adjusted” variation between hospitals in terms of productivity after all of the adjustments in this paper, is not great. When the short-run adjustments are removed, however, variation increases significantly, suggesting that there may be scope for productivity enhancement by optimising capacity / activity levels in particular. Where there is greater variability between the scores or rankings of Trusts on the indices, as shown in Appendix 3, some of this variability may be a result of random error, rather than entirely a result of inefficiency. If in fact the Trusts do not vary as greatly on productivity as suggested by their changes in ranking, it would be premature to place too much emphasis on the absolute rankings achieved by Trusts. It may also suggest an unnecessary emphasis on efforts to benchmark Trusts on differences in performance that are relatively small. Additional methods of analysis such as stochastic frontier models and Data Envelopment Analysis (DEA) can examine alternative assumptions about economies of scale, functional form, and suitable comparators for Trusts. The statistical methods used in this paper attribute all unexplained variation in cost to inefficiency. Stochastic frontier methods allocate part of the unexplained variation to random error and part to inefficiency. Stochastic frontier models do however require strong assumptions about the distribution of the errors. DEA has advantages in that, being a non-parametric technique, it makes limited assumptions about functional form, and none about errors. It can also add valuable information regarding ‘best practice’ principles and peer hospitals to which Trusts are compared that produce the same outputs as the Trust under study, but with fewer resources. These may be useful future avenues to investigate and compare the current Trust rankings to, to assess whether rankings remain relatively stable or not. The empirical analysis is based on cross-sectional data. A potential problem with the Trust as the unit of analysis in cross-section studies is its heterogeneity. This could cause a potential problem if there is unobserved heterogeneity and an association between the error term and the regressors. Coefficients in such a regression may be biased (Giuffrida & Gravelle, 1998). Panel data estimates are less likely to suffer from such problems, require fewer distributional assumptions and may give more reliable coefficient estimates. It would be extremely useful

Hospital Benchmarking Analysis and the Derivation of Cost Indices 16
to extend this analysis over a number of years of panel data, possibly through estimation of a fixed effect for each hospital. The standard error of each fixed effect could then be used to make assessments of how far each Trust differs from the ‘best practice’ hospital. This would also help to establish whether short run swings in capacity utilisation or activity levels simply represent lower unit cost measures or actual improvements in service delivery. A longitudinal approach would be a useful future extension to this work.

CHE Discussion Paper 174 17
5. REFERENCES
Audit Commission (1999) NHS Trust Profiles Handbook – 1997/8, London: Audit Commission. Belsey, D.A., Kuh, E. & Welsch, R.E. (1980) Regression Diagnostics, New York: John Wiley and Sons, Inc. Berry, R.E. (1970) Product heterogeneity and hospital cost analysis, Inquiry, 7(1): 67-75. Butler, J.R.G. (1995) Hospital cost analysis, Kluwer Academic Publishers: Dordrecht. Culyer, A.J., Wiseman, J., Drummond, M.F. & West, P.A. (1978) What accounts for the higher costs of teaching hospitals? Social and Economic Administration, 12(1): 20-30. Evans, R.G. (1971) “Behavioural” cost functions for hospitals, Canadian Journal of Economics, 4: 198-215. Farley, D.E. (1989) Measuring casemix specialization and the concentration of diagnoses in hospitals using information theory, Journal of Health Economics, 8: 185-207. Farley, D.E. & Hogan, C. (1990) Case-mix specialization in the market for hospital services, Health Services Research, 25: 757-83. Folland, S., Goodman, A.C. & Stano, M. (1997) The economics of health and health care, Prentice Hall: New Jersey. Freund, R.J. & Littell, R.C. (1991) SAS system for regression, Cary, NC: SAS Institute. Giuffrida, A. & Gravelle, H. (1998) Hospital benchmarking: Comment, National Primary Care Research and Development Centre, Centre for Health Economics, University of York. Hollingsworth, B. & Parkin, D. (1998) Developing efficiency measures for use in the NHS, A report to the NHS Executive Northern & Yorkshire R&D Directorate, February 1998, Health Economics Group, University of Newcastle. Hornbrook, M.C. & Monheit, A.C. (1985) The contribution of case-mix severity to the hospital cost-output relation, Inquiry, 22(3): 259-71. Lave, J.R., Lave, L.B. & Silverman, L.P. (1972) Hospital cost estimation controlling for case-mix, Applied Economics, 4: 165-80. NHS Executive (1997) The New NHS: Modern Dependable, Cm3807: Leeds. Ramsey, J.B. (1969) Tests for specification error in classical linear least squares regression analysis, Journal of the Royal Statistical Society, B31: 250-71. Ro, K.K. (1969) Patient characteristics, hospital characteristics and hospital use, Medical Care, 7(4): 295-312.
Hospital Benchmarking Analysis and the Derivation of Cost Indices 18
Söderlund, N., Csaba, I., Gray, A., Milne, R. & Raftery, J. (1997) The impact of the NHS reforms on English hospital productivity: An analysis of the first 3 years, British Medical Journal, 315: 1126-9. Söderlund, N., Gray, A., Milne, R., & Raftery, J. (1996) Case mix measurement in English hospitals: An evaluation of five methods for predicting resource use, Journal of Health Services Research and Policy, 1: 10-9. Söderlund, N., Milne, R., Gray, A., & Raftery, J. (1995) Differences in hospital casemix, and the relationship between casemix and hospital costs, Journal of Public Health and Medicine, 17: 25-32. Tatchell, P.M. (1980) Measuring hospital output: A review, Australian National University Press: Canberra. White, H. (1980) A heteroskedasticity-consistent covariance matrix estimator and a direct test for heteroskedasticity, Econometrica, 48: 817-38. Zweifel, P. & Breyer, F. (1997) Health economics, Oxford University Press: New York.

CHE Discussion Paper 174 19
6. APPENDIX 1: VARIABLES USED IN BENCHMARKING MODEL TRANSIPP Proportion of spells that involve a transfer in from another hospital Hypothesised sign – positive Transfers in to a hospital are likely to represent difficult or problem cases referred from less capable institutions and are thus likely to be cost increasing. TRANSOPP Proportion of spells that end in a transfer to another hospital Hypothesised sign – negative It is assumed that transfers from a hospital represent an inability to meet the treatment needs of a given case. Transfers out of a hospital are likely to represent incomplete treatment of cases and are thus likely to be cost decreasing. EMERGPP Proportion of spells that involve an emergency admission Hypothesised sign – positive Large fluctuations in levels of emergency admissions imply that more fixed capacity has to be retained for a given average level of activity, and consequently, costs should increase. This variable measures whether, diagnostic case mix and other factors being equal, emergencies will be more costly than elective admissions because of the implied threat of serious adverse outcome. FCEINPP Proportion of spells involving a transfer in from another specialty Hypothesised sign – positive Measurement of the volume of inpatient care performed by NHS acute hospitals has been the finished consultant episode (FCE). During a single hospital admission, however, multiple FCEs might occur as a result of transfers within or between specialties. The inpatient spell, or set of episodes constituting a single admission, thus serves as a slightly higher level of aggregation of inpatient activity. Although the FCE has been extensively criticised, it is argued that spells also fail to fully capture total inpatient activity. Both variables have therefore been captured in the model. Spells requiring inter-specialty transfers are likely to be more complex and costly than those which can be fully treated within a specialty. Given the existing adjustment for episodes per spell, this variable captures the additional effect of inter-specialty transfers over and above the average multiple FCE.

Hospital Benchmarking Analysis and the Derivation of Cost Indices 20
EP_SPELL Average NHS inpatient episodes per NHS inpatient spell Hypothesised sign - positive Although the model used treatment spells (whole admissions) as the measure of volume of inpatient activity for Trusts, the episodes variable incorporates the fact that volume of inpatient activity is represented by two variables (the spell and the episode). It is argued that the true unitary measure of volume of inpatient activity probably lies somewhere between the spell and the episode. OPNPP Non-primary outpatient attendances per inpatient spell Hypothesised sign – positive The basic unit of outpatient activity is assumed to consist of first, rather than follow-up outpatient attendances, based on information which suggests that many outpatient attendances occur because of a failure to complete treatment during the first attendance. Since follow-up attendances may however in some instances constitute genuine additional health care output, this variable has been included as a regressor. EMERINDX Standardised index of unexpected emergency admissions/total emergencies Hypothesised sign – positive This variable reflects additional costs associated with coping with unpredictable demand. The variable is calculated as the 12-month sum of the absolute value of residuals from a simple model of emergency admissions7 standardised to give an index with a national average of one. HRGWTNHS HRG case mix index Hypothesised sign – positive Healthcare Resource Groups (HRGs) were taken to be the best available categorisation system for inpatient case-mix in the hospitals studied. In order to estimate a case mix index for a hospital, all cases were allocated to an HRG category, and a weight representing the expected cost of that category attached accordingly. The average cost weight for all spells treated over a year formed the scalar case mix index for that hospital. The national average case weight was set to equal 100, and case mix indices above 100 thus represent hospitals that have treated a more complex than average mix of cases.
7 A single regression was run for the whole sample using provider specific dummies with each month’s emergency demand set as a function of the previous months’ demand plus a monthly dummy.

CHE Discussion Paper 174 21
While the use of a single index to represent case type variation across a possible 534 categories is somewhat reductionist, previous studies have shown that case mix is a powerful predictor of hospital costs (Tatchell, 1980; Butler, 1995). When more comprehensive methods of incorporating HRG mix were used, such as principle components, a better model fit was achieved, but at considerable expense to ease of interpretation. PROP15U Proportion of patients under 15 years of age Hypothesised sign – positive This variable measures whether social expectations may force Trusts to expend more resources on younger patients, diagnosis and other factors being equal (Söderlund, Milne, Gray & Raftery, 1995). PROP60P Proportion of patients 60 years or older Hypothesised sign – positive Elderly patients are likely to have more complex care needs, and these may not be captured entirely by HRGs, which have only limited age sensitivity. PROPFEM Proportion of female patients Hypothesised sign – uncertain This variable was inserted to capture any gender-specific differences in resource need, other case mix factors being equal. STUDENPP Medical student whole time teaching equivalents per inpatient spell Hypothesised sign - positive Student teaching typically constitutes the major “academic activity” cost driver in academic hospitals. Student whole-time equivalents (WTEs) are used as an indicator of the amount of teaching done by a hospital. The data is unfortunately out of date as it relates to a 1992/3 NHS Executive Survey.

Hospital Benchmarking Analysis and the Derivation of Cost Indices 22
RESEARPC Percentage of total revenue spent on research Hypothesised sign – uncertain Teaching and research activities constitute important secondary outputs of NHS hospitals. They have a well-documented positive impact on hospital costs (Culyer, Wiseman, Drummond & West, 1978). In this case, however, the compensation which hospitals receive for teaching and research (SIFTR) has already been deducted from the cost component of the dependent variable a priori (the cost index). These terms thus capture the extent to which hospitals incur costs over and above the compensation they receive for these activities. Alternatively, assuming that Trusts are fairly compensated for teaching and research outputs produced, these terms capture inefficiencies associated with teaching and research. MFF_COMB Market forces factor Hypothesised sign – positive Market prices for inputs including land, buildings and labour differ between Trusts because of their geographic location. This represents an unavoidable influence on hospital costs. Component price indices are weighted according to their proportional contribution nationally in constructing the index. HESSPNHS Total inpatient spells TOTOP1 Total first outpatient attendances A_E1 Total first accident and emergency (A & E) attendances Hypothesised signs – negative After adjustment for the levels of fixed inputs used by a Trust, increased volume of activity is expected to lower average costs (or increase productivity). AVBEDS Average available beds Hypothesised sign – positive Average bed numbers may be considered fixed in the short-run. While hospital managers do have some control over the size and capacity of their institution, it is expected that there will be some reluctance to radically alter capacity. Decreasing hospital capacity might be particularly difficult because of public opposition and implied job loss. The average number of beds in a hospital is thus included to reflect an inability to alter capacity in the short run. It is however expected that an increase in beds (capital stock) will increase fixed costs.

CHE Discussion Paper 174 23
HEATBED Heated volume per bed Hypothesised sign – positive This variable was included to capture inefficiencies in how hospital buildings were used to create treatment capacity (represented by beds). A large amount of heated volume per bed was assumed to represent less efficient use of capital, and thus increase the cost index. ITINDX Information Theory specialisation index Hypothesised sign – positive Single specialty hospitals are likely to draw patients from further afield, and have greater short-term variation in demand for services because of the lack of cross-specialty compensation effects. Economies of specialisation on the other hand, might occur where relatively under-utilised, specialised fixed resources are centralised in one institution, rather than spread over many. This can be examined through the inclusion of an Information Theory Index which calculates the degree to which the proportions of different case-types (HRGs) in a hospital differ from the national average proportions of case-types. The formula used for derivation of the Information Theory Index as calculated by Farley (Farley, 1989; Farley & Hogan, 1990) is given below: ITIh = ΣiPih log (Pih /π i ) where: ITIh = case mix specialisation index for hospital h Pih = proportion of cases in hospital h that fall into HRG i π i = proportion of all hospitals’ caseload constituted by HRG I An increased IT index indicates a relatively more specialised hospital (i.e. one with a narrower scope of activities) which one would expect to be of higher cost. General hospitals typically have an IT index of between 0.2 and 0.5, whereas this may increase to up to 2.5 in a highly specialised, single discipline, hospital. Despite the fact that they both use HRGs in their construction, the specialisation index and the HRG case-mix index are fundamentally different. The former simply captures the range of different types of cases treated, whereas the latter captures the average resource intensity of cases.

Hospital Benchmarking Analysis and the Derivation of Cost Indices 24
SITES50B Number of sites with more than 50 beds Hypothesised sign – positive Trusts that are located on a number of sites, rather than concentrated in one location, are likely to suffer from duplication of certain capital and staff inputs, as well as incurring communication and management difficulties, thus increasing costs. The number of major sites with more than 50 beds was chosen to exclude sites that were simply isolated accommodation, chronic care or outpatient facilities.

CHE Discussion Paper 174 25
7. APPENDIX 2: REGRESSION RESULTS
Table 5: Results for full regression model, 1995/6
Dependent Variable: CCI Model Coefficient Std.
Error Sig. Beta
value Minimum Maximum Mean Std.
Deviation
INTERCEP 0.525 0.244 0.032 CCI 0.531 2.166 1.015 0.218 TRANSIPP -0.042 0.398 0.917 -0.007 0.000 0.241 0.020 0.037 TRANSOPP -0.918 0.748 0.221 -0.075 0.000 0.125 0.022 0.018 EMERGPP -0.036 0.166 0.827 -0.016 0.009 0.748 0.340 0.098 FCEINPP 0.123 0.671 0.854 0.008 0.000 0.114 0.018 0.014 OPNPP 0.055 0.009 0.000 0.323 0.000 11.988 3.046 1.280 EMERINDX 1.226 0.461 0.008 0.139 0.005 0.266 0.060 0.025 EP_SPELL 0.328 0.045 0.000 0.322 0.785 3.789 1.081 0.215 HRGWTNHS 0.000 0.001 0.918 0.007 72.018 242.028 95.687 22.337 PROP15U -0.259 0.115 0.025 -0.148 0.000 0.919 0.099 0.122 PROP60P -0.674 0.129 0.000 -0.327 0.000 0.958 0.344 0.106 PROPFEM -0.562 0.216 0.009 -0.149 0.308 0.897 0.569 0.058 STUDENPP 12.629 8.319 0.130 0.069 0.000 0.012 0.001 0.001 RESEARPC -0.006 0.001 0.000 -0.241 0.000 99.542 2.486 9.089 MFF_COMB 0.004 0.001 0.002 0.178 75.817 132.955 87.831 10.199 HESSPNHS -0.000 0.000 0.003 -0.401 1145 104544 41316.125 21229.235 TOTOP1 -0.000 0.000 0.005 -0.242 0 130538 45162.845 26130.753 A_E1 -0.000 0.000 0.177 -0.072 0 157042 45649.151 29599.561 AVBEDS 0.000 0.000 0.000 0.547 75 1750 655.196 324.636 HEATBED 0.032 0.008 0.000 0.167 0.029 11.180 3.297 1.126 SITES50B 0.030 0.009 0.001 0.157 1 8 2.034 1.150 ITINDX 0.074 0.024 0.001 0.265 0.119 4.288 0.602 0.784
Model R R2 Adjusted-
R2 Std. Error of the Estimate
Sum of Squares
Degrees of freedom
Mean Square
F Sig.
N=232 0.832 0.692 0.662 0.127 Regression 7.611 21 0.362 22.510 0.000 Residual 3.381 210 0.016 Total 10.992 231

Hospital Benchmarking Analysis and the Derivation of Cost Indices 26
Table 6: Results for trimmed regression model (with outliers removed), 1995/6
Dependent Variable: CCI Model Coefficie
nt Std. Error
Sig. Beta value
Minimum Maximum Mean Std. Deviation
INTERCEP 0.554 0.202 0.006 CCI 0.715 1.724 0.992 0.146 TRANSIPP 0.695 0.339 0.042 0.158 0.000 0.241 0.017 0.033 TRANSOPP -1.281 0.548 0.020 -0.145 0.000 0.125 0.021 0.017 EMERGPP -0.107 0.125 0.393 -0.067 0.020 0.748 0.348 0.091 FCEINPP 0.644 0.475 0.177 0.062 0.000 0.114 0.019 0.014 OPNPP 0.057 0.009 0.000 0.335 0.000 7.847 2.909 0.855 EMERINDX 0.164 0.429 0.702 0.023 0.016 0.258 0.059 0.020 EP_SPELL 0.143 0.060 0.018 0.115 0.785 1.661 1.068 0.117 HRGWTNHS 0.000 0.001 0.544 0.051 72.018 242.028 94.212 20.918 PROP15U -0.054 0.099 0.588 -0.037 0.000 0.838 0.093 0.100 PROP60P -0.355 0.107 0.001 -0.226 0.000 0.951 0.343 0.092 PROPFEM -0.416 0.164 0.013 -0.161 0.308 0.897 0.571 0.056 STUDENPP 12.801 6.250 0.042 0.101 0.000 0.012 0.001 0.001 RESEARPC -0.005 0.001 0.000 -0.219 0.000 73.065 1.754 6.076 MFF_COMB 0.004 0.001 0.000 0.298 75.817 132.789 87.448 9.889 HESSPNHS -0.000 0.000 0.000 -0.532 1398 104544 42919.133 20455.348 TOTOP1 -0.000 0.000 0.000 -0.393 0 130538 47104.624 25455.558 A_E1 -0.000 0.000 0.064 -0.099 0 157042 47811.032 28934.981 AVBEDS 0.000 0.000 0.000 0.838 75 1750 680.908 315.794 HEATBED 0.029 0.006 0.000 0.219 0.029 11.180 3.260 1.094 SITES50B 0.014 0.006 0.037 0.106 1 8 2.069 1.147 ITINDX 0.009 0.020 0.654 0.037 0.119 3.480 0.483 0.595
Model R R2 Adjusted-
R2 Std. Error of the Estimate
Sum of Squares
Degrees of freedom
Mean Square
F Sig.
N=218 0.830 0.689 0.656 0.085 Regression 3.173 21 0.151 20.744 0.000 Residual 1.427 196 0.007 Total 4.600 217
CHE Discussion Paper 174 27
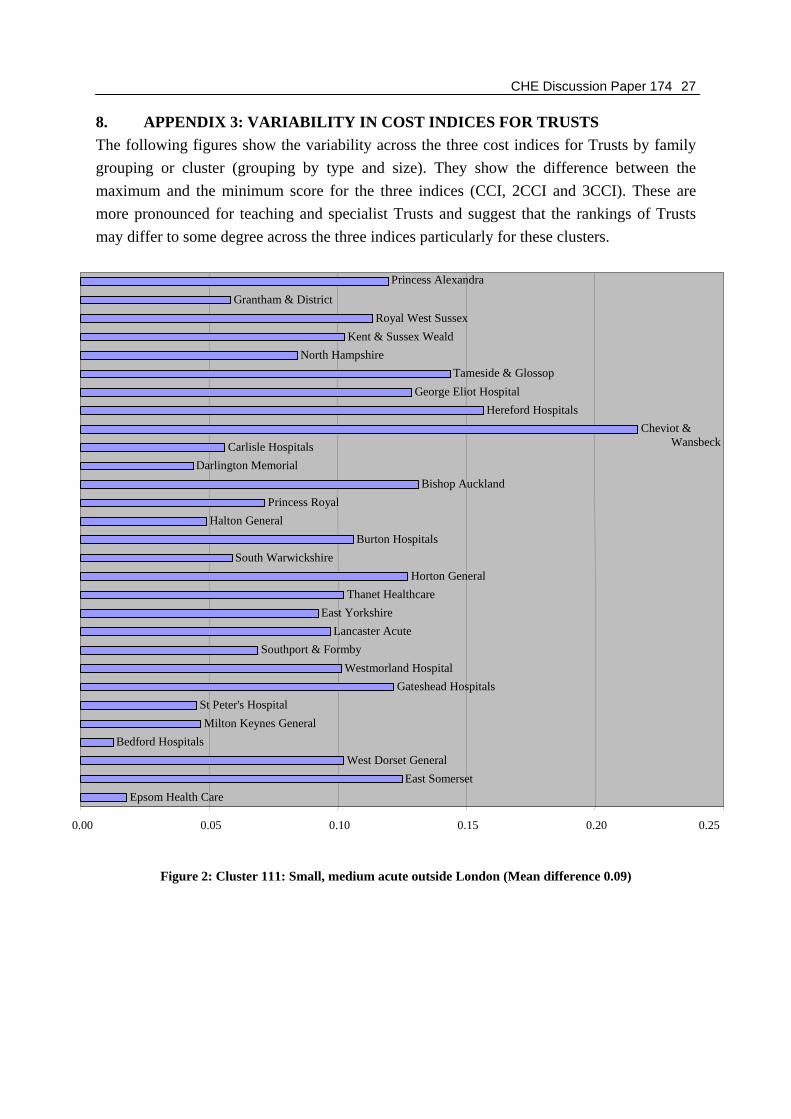
8. APPENDIX 3: VARIABILITY IN COST INDICES FOR TRUSTS The following figures show the variability across the three cost indices for Trusts by family grouping or cluster (grouping by type and size). They show the difference between the maximum and the minimum score for the three indices (CCI, 2CCI and 3CCI). These are more pronounced for teaching and specialist Trusts and suggest that the rankings of Trusts may differ to some degree across the three indices particularly for these clusters.
Figure 2: Cluster 111: Small, medium acute outside London (Mean difference 0.09)
Epsom Health CareEast Somerset
West Dorset GeneralBedford Hospitals
Milton Keynes GeneralSt Peter's Hospital
Gateshead HospitalsWestmorland Hospital
Southport & FormbyLancaster Acute
East YorkshireThanet Healthcare
Horton GeneralSouth Warwickshire
Burton HospitalsHalton General
Princess RoyalBishop Auckland
Darlington MemorialCarlisle Hospitals
Cheviot & Wansbeck
Hereford HospitalsGeorge Eliot Hospital
Tameside & GlossopNorth Hampshire
Kent & Sussex WealdRoyal West Sussex
Grantham & District
Princess Alexandra
0.00 0.05 0.10 0.15 0.20 0.25
Hospital Benchmarking Analysis and the Derivation of Cost Indices 28
Figure 3: Cluster 121: Large acute outside London (mean difference 0.09)
Royal Surrey & St LukesNorth Hertfordshire
Walsall HospitalsMid Cheshire
Luton & DunstableKings Lynn & Wisbech
Royal United Hospital BathPoole Hospitals
Basildon & ThurrockEastbourne Hospitals
Frimley Park HospitalNorth East Lincolnshire
Scunthorpe & GooleBarnsley District General
Derby City GeneralRotherham General
Chesterfield & DerbyshireMid Kent Healthcare
Peterborough HospitalsJames Paget Hospital
West Suffolk HospitalsKent & Canterbury Hospitals
Gloucestershire RoyalEast Surrey Hospital
Mid Staffordshire GeneralGood Hope Hospital
Countess of ChesterPilgrim Health
Kings Mill Health CareWarrington Hospital
North Durham AcuteWorcester Royal Infirmary
Royal Shrewsbury HospitalsStockport Acute Services
Dewsbury Health CareSwindon & Marlborough
Dartford and GraveshamSandwell Healthcare
Kettering GeneralHospital
Stoke Mandeville HospitalMedway NHS Trust
South Kent HospitalsWorthing & Southlands
St Albans & Hempstead
0.00 0.05 0.10 0.15 0.20 0.25

CHE Discussion Paper 174 29
Figure 4: Cluster 131: Very large acute outside London (mean difference 0.10)
Bradford HospitalsDoncaster & Montagu
Southend Health CareTaunton and SomersetWirral Hospital
St Helens & KnowsleySouth Tees Acute Hospitals
Heatherwood & Wexham ParkEssex Rivers Healthcare
Bournemouth & ChristchurchSouthmead Health Services
Royal Cornwall HospitalsAintree Hospitals
Royal Hull HospitalsIpswich Hospital
Brighton Health CareRoyal Devon & Exeter
Portsmouth HospitalsRoyal Berkshire & Battle
North StaffordshireDerbyshire Royal Infirmary
Plymouth HospitalsWalsgrave Hospitals
Royal WolverhamptonCity Hospitals Sunderland
City HospitalNorfolk &Norwich
BlackburnBolton Hospitals
Preston Acute HospitalsNorth Manchester Healthcare
BlackpoolVictoria
Dudley Group of HospitalsNorthampton General
Mid Essex HospitalsMount Vernon & Watford
0.00 0.05 0.10 0.15 0.20 0.25 0.30

Hospital Benchmarking Analysis and the Derivation of Cost Indices 30
Figure 5: Cluster 135: Acuite London (mean difference 0.09)
North Middlesex HospitalThe Hillingdon Hospital
Central Middlesex HospitalKingston HospitalSt Helier
Ealing HospitalAshford Hospital
WellhouseWest Middlesex University
Northwick Park & St MarksBromley Hospitals
Havering HospitalsChase Farm Hospitals
Queen Mary's SidcupLewisham Hospital
Mayday Health CareWhittington Hospital
Newham HealthcareThe HomertonHospital
0.00 0.05 0.10 0.15 0.20 0.25 0.30

CHE Discussion Paper 174 31
Figure 6: Cluster 140: Specialist (mean difference 0.28)
Freeman GroupOrthopaedic Hospital
Rheumatic DiseasesNuffield Orthopaedic
Liverpool CardiothoracicRoyal Liverpool Children'sChristie Hospital
Harefield HospitalSheffield Children's Hospital
Weston Park HospitalClatterbridgeCentre
Liverpool Women's HospitalWalton Centre for Neurology
Wrightington HospitalGlenfield Hospital
Papworth HospitalRadcliffe Infirmary
Robert Jones & Agnes HuntBirmingham Women's Health
Great Ormond Street HospitalMoorfields Eye Hospital
Queen Victoria HospitalRoyal Brompton Hospital
Royal Marsden HospitalBirmingham Children's
Manchester Children'sRoyal Orthopaedic
0.00 0.20 0.40 0.60 0.80 1.00 1.20

Hospital Benchmarking Analysis and the Derivation of Cost Indices 32
Figure 7: Cluster 210: Acute teaching (mean difference 0.16)
United BristolNorthern General Hospital
Royal Free Hampstead
Manchester CentralRoyal Victoria Infirmary
Nottingham City HospitalCentral Sheffield UniversityLeicester General Hospital
Leicester Royal InfirmaryNottingham University
Addenbrooke'sSouthampton University
Guy's and St Thomas'St Mary's Hospital
St George's HealthcareKing's Health Care
South Manchester UniversitySalford Royal Hospitals
Royal HospitalsOxford Radcliffe Hospital
Liverpool & BroadgreenChelsea & Westminster
Hammersmith HospitalsSt James's & Seacroft
United Leeds TeachingBirmingham University
0.00 0.05 0.10 0.15 0.20 0.25 0.30 0.35 0.40 0.45
CHE Discussion Paper 174 33
Figure 8: Cluster 310: Small, medium, large multi-service (mean difference 0.07)
Weston AreaHealth
Rugby NHS TrustNorthern Devon HealthcareEast Hertfordshire
NorthallertonScarborough & NE Yorks
Harrogate Health CareAiredale NHS Trust
Bassetlaw Hospital Wiltshire HealthcareWest Cumbria
South TynesideRochdale Healthcare
Crawley HorshamKidderminster
E. CheshireChorley & S.Ribble
West LancashireNorth Tyneside
Trafford H/careBury Health Care
Winchester & EastleighMid Sussex
Hinchingbrooke Healthcare
0.00 0.02 0.04 0.06 0.08 0.10 0.12 0.14

Hospital Benchmarking Analysis and the Derivation of Cost Indices 34
Figure 9: Cluster 313: Very large multi-service (mean difference 0.12)
East Gloucestershire
South Devon
York Health Services
Forest Healthcare
Hastings & Rother
Frenchay Healthcare
Burnley Healthcare
Oldham
Greenwich Healthcare
Redbridge Health Care
Calderdale Healthcare
Huddersfield
South BuckinghamshireRichmond
Wigan & Leigh
0.00 0.05 0.10 0.15 0.20 0.25 0.30