checking on checkpoints - the national center for border ... · pdf filenational center for...
TRANSCRIPT

National Center for Border Security and Immigration
Checking on CheckpointsAn Assessment of U.S. Border Patrol Checkpoint
Operations, Performance, and Impacts
by Jeffrey Jenkins, Jeffrey G. Proudfoot, Jim Marquardson, Judith Gans,Elyse Golob, and Jay Nunamaker
September 2014
Checking on Checkpoints
An Assessment of U.S. Border Patrol Checkpoint Operations, Performance, and Impacts
by Jeffrey Jenkins, Jeffrey G. Proudfoot, Jim Marquardson, Judith Gans, Elyse Golob, and Jay Nunamaker
September 2014
National Center for Border Security and Immigration
ii
About the Authors
Jeffrey Jenkins is an assistant professor of information systems at Brigham Young University. He was a research associate at BORDERS during the compilation of this report. Jeffrey G. Proudfoot is an assistant professor of information systems at Bentley University. His research interests include information systems security, behavioral sensor research, and novel approaches to concealed information testing. J im Marquardson is a doctoral student in the Center for Management of Information at the University of Arizona. His research interests include simulations, human-computer interaction, and decision support systems. Judith Gans, M.B.A., M.P.A., is manager of the Immigration Policy Program at the Udall Center for Studies in Public Policy at the University of Arizona. Elyse Golob, Ph.D., is the executive director of BORDERS at the University of Arizona. Her expertise includes cross-border trade, economic development, and border management policy. Jay Nunamaker is a Regents’ Professor and Soldwedel Chair of Management Information Systems. He is director of BORDERS and of the Center for the Management of Information at the University of Arizona. Jenkins, Jeffrey, Jeffrey G. Proudfoot, Jim Marquardson, Judith Gans, Elyse Golob, and Jay Nunamaker.
2014a. Checking on Checkpoints: An Assessment of U.S. Border Patrol Operations, Performance, and Impacts. Tucson: National Center for Border Security and Immigration (BORDERS), University of Arizona.
Jenkins, Jeffrey, Jeffrey G. Proudfoot, Jim Marquardson, Judith Gans, Elyse Golob, and Jay Nunamaker.
2014b. Appendices for “Checking on Checkpoints: An Assessment of U.S. Border Patrol Operations, Performance, and Impacts.” Tucson: National Center for Border Security and Immigration (BORDERS), University of Arizona.
Edited by Robert Merideth.
National Center for Border Security and Immigration (BORDERS)
BORDERS is a consortium of 16 premier institutions that is dedicated to the development of innovative technologies, proficient processes, and effective policies that will help protect our nation’s borders, foster international trade, and enhance long-term understanding of immigration determinants and dynamics. BORDERS |The University of Arizona McClelland Hall, Room 427 P.O. Box 210108 Tucson, AZ 85721-0108 520.621.4475 www.borders.arizona.edu Copyright © 2014 by the Arizona Board of Regents. All rights reserved. This research was supported by the United States Department of Homeland Security through the National Center for Border Security and Immigration (BORDERS) under grant number 2008-ST-061-BS0002. However, any opinions, findings, and conclusions or recommendations in this document are those of the authors and do not necessarily reflect views of the United States Department of Homeland Security.
iii
Table of Contents Executive Summary ………………………………………………………………….. iv
Introduction ……………………………………………………………………………. 1
1. Data Integrity and Quality ………………………………………………………… 3
2. Community Impacts ………………………………………………………………. 13
3. Performance Models and Measures ……………………………………………... 35
4. Managerial Tool Development …………………………………………………… 46
Conclusion and Future Research …………………………………………………… 54
References …………………………………………………………………………….. 56
Appendices
A. Site Visit Report
B. Taxonomy of Checkpoint Core Functions
C. Checkpoint Statutory Authority
D. Performance Measures: Definitions and Examples
E. ThinkTank™ Results
F. Interview Summaries
G. Calculating Smuggling Costs
H. Community Impacts Regression Analysis Details
I. Discussion of Selected Methodologies for Estimating Illegal Flow
J. Monte Carlo Simulation for Red Teaming and Equations of Ratios
K. Simulation User Documentation
L. Detailed Description of Simulated Checkpoint
M. Simulation Technical Documentation

iv
Executive Summary OVERVIEW
In 2011, the U.S. Border Patrol asked the National Center for Border Security and Immi-gration (BORDERS)1 to evaluate a 2009 review of the agency’s traffic checkpoints.2 The review recommended that the Border Patrol take actions in four major areas: data integ-rity and quality, community impacts, performance models and measures and managerial tool development (GAO 2009, 78). BORDERS conducted a two-year study to examine and advise the Border Patrol on how to address the following GAO recommendations:
Data integrity and quality
a) Establish internal controls for management oversight of the accuracy, consisten-cy, and completeness of checkpoint performance data.
Community impacts
b) Implement quality of life measures that have already been identified by the Bor-der Patrol to evaluate the impact that checkpoints have on local communities.
c) Use the information generated from the quality of life measures with other rele-vant factors to inform resource allocations and address identified impacts.
Performance models and measures
d) Establish milestones for determining the feasibility of a checkpoint performance model that would allow the Border Patrol to compare apprehensions and sei-zures to the level of illegal activity passing through the checkpoint undetected.
Managerial tool development
e) Require that the Border Patrol conduct traffic volume studies to guide the num-ber and operation of inspection lanes at new permanent checkpoints, and docu-ment these requirements in checkpoint design guidelines and standards.
f) Along with planning new or upgrading existing checkpoints, conduct a workforce needs assessment to determine the levels of staff and resources needed to ad-dress anticipated volumes of illegal activity around the checkpoint.
BORDERS’ assessment of these issues, including major findings and recommended ac-tions are summarized below.
1 BORDERS was established as a Department of Homeland Security Center of Excellence in 2008. Headquartered at the University of Arizona, BORDERS focuses on providing scientific knowledge, developing and transitioning technologies and techniques, and evaluating policies to meet the challenges of border security and immigration. 2 U.S. Government Accountability Office (GAO). 2009. Checkpoints Contribute to Border Patrol's Mission, but More Consistent Data Collection and Performance Measurement Could Improve Effectiveness (GAO-09-824). Washington, DC.

v
1. Data Integrity and Quality | See pages 3–12.
BORDERS Assessment
We evaluated the data collection protocols at checkpoints, focusing on the accuracy, consistency, and completeness of collected data—important components of data integrity and quality. We examined data from the e3 system, the Checkpoint Activity Report (CAR) module, and other reports from the Border Patrol. The e3 system is used by agents to process and record data about apprehended individuals, such as apprehension location, smuggling information, and the date and time of apprehensions. The CAR report contains checkpoint operation data and infrastructure data (e.g. checkpoint profile reports, referrals, apprehensions, seizures, operational hours, and personnel). In addition, we conducted a ThinkTank™ session, interviewed Border Patrol agents, and made site visits to observe and better understand data collection processes.
Findings: While data integrity and quality has substantially increased since the 2009 GAO assessment, there are aspects of data collection and management that still need improvement:
• e3 data: we found errors in the data fields for (a) apprehension latitude and longitude, (b) entry manner, (c) smuggling method and cost, (d) distance from port of entry (POE), and (e) entry date and time.
• CAR data set: we found errors in the checkpoint profile records.
Recommendations
We recommend that the Border Patrol:
1.1. Implement a data oversight procedure to evaluate, correct, and prevent data errors.
1.2. Offer enhanced training refresher courses to agents on how to enter data and why data quality is important.
1.3. Run automated scripts on past data to correct transposed apprehension latitude-longitude data and inconsistent labels for entry manner.
1.4. Continue to modify the e3 system interface with controls to better validate the accuracy, consistency, and completeness of data entry by:
• alerting agents if the apprehension latitude-longitude entry is not within the agent’s assigned sector
• implementing a drop-down selection box for “entry manner”
• requiring agents to enter a smuggling cost and method when smuggling is claimed or verified
• allowing agents to click “unknown” if smuggling cost and method are not available
• alerting agents if smuggling costs are abnormally high and therefore may be an error

vi
• alerting agents if the entry for “miles from POE” is abnormally high and may be an error
• allowing agents to click “estimated” if the date and time of entry is not known
1.5. Set goals for further automating data collection. This may include allowing agents to transfer the apprehension latitude and longitude from their issued GPS devices directly to the e3 system, and automatically calculating the distance from POE based on latitude and longitude data when possible.
1.6. Have the Agent in Charge at checkpoints periodically review the CAR checkpoint profile data for accuracy.
2 . Community Impacts | See pages 13–34.
BORDERS Assessment
Our aim was to identify the nature and magnitude of the impacts of Border Patrol checkpoints on nearby communities and to provide a generalizable approach to measure the impacts. For purposes of this study, the checkpoint along U.S. Interstate 19 (I-19) between Tucson and Nogales, Arizona, was used as a case study (with the aim of identify-ing generalizable lessons for evaluating the community impacts of checkpoints else-where). We used the following methods to make this assessment:
• qualitative interview-based research to provide information as to the nature of community impacts, whether perceived or actual.
• statistical data analysis to describe Border Patrol apprehension data, which provided insight on the effect of the checkpoint on circumvention patterns.
• regression analysis of residential real estate sales data in communities north and south of the checkpoint to see if there were any checkpoint-related effects on residential real estate prices.
The identified measures of checkpoints’ community impacts can be grouped into three broad categories: (a) circumvention impacts with attendant public safety and law-enforcement costs; (b) inconvenience, impacts deriving from unpredictable wait times and risk of secondary screening for those having to travel through the checkpoint; and (c) economic harm, impacts deriving both from changing public perceptions about the dangers of the border region and from the inconvenience to—in the case of the community of Tubac and the I-19 checkpoint—tour groups that have to go through the checkpoint and wait as their busses are boarded and documents inspected.
Findings: Our analysis of Border Patrol apprehension data before and after the interim I-19 checkpoint began operations showed that while circumvention impacts are experienced by communities north and south of a checkpoint, the impacts are disproportionately borne by communities that lie between the checkpoint and the border.
A regression analysis provides statistical evidence for the effect of the checkpoints on real-estate prices. Tentative evidence suggests that the construction of the checkpoint canopy on I-19 may have caused negative effects on Tubac and Rio Rico real estate pric-es over time. However, because of the limited time period analyzed and the fact that the

vii
data did not reach standard levels of statistical significance, these findings should be interpreted cautiously.
Recommendations
We recommend that the Border Patrol:
2.1. Analyze trends in the locations of apprehensions relative to the location of a checkpoint over time.
2.2. Monitor the impacts of a checkpoint on real estate prices through periodic regression analysis using a model similar to that included in this report.
2.3. Work with local law enforcement to regularly and consistently collect data on referrals by local police to the Border Patrol, including information on the type and location of criminal activity.
2.4. Work with local school officials to monitor enforcement activity around schools.
2.5. Hold periodic meetings with community members to answer questions, receive input, and clarify any points of confusion that may exist with regard to checkpoint operations.
2.6. Conduct a public opinion survey on experiences with the checkpoint, both positive and negative.
2.7. Conduct a case study of apprehension and circumvention activity around a checkpoint that controls for staffing levels in the circumvention zone.
3. Performance Models and Measures | See pages 35–45.
BORDERS Assessment
Ideally, the Border Patrol could calculate the absolute flow of illegal activity passing through a checkpoint undetected to understand and assess checkpoint effectiveness. Since this baseline is unknown and cannot be estimated directly from available data, the Border Patrol must rely on proxy measures of absolute flow and intermediate measures of checkpoint effectiveness.
Findings: We found that the best indicator of checkpoint performance is to measure the accuracy rate of the Border Patrol in detecting illegal activity, such as false documents, illicit drugs, and nuclear radiation. The most feasible and reliable method for calculating these accuracy rates is through “red teaming.” Red teaming adheres to all of the requirements for effective checkpoint performance measures.
We also found that checkpoint performance is multi-dimensional and should cover government-wide priorities, such as timeliness, cost efficiency, screening efficiency, resource adequacy, and legal and interpersonal treatment of travelers. We recommend performance measures that cover these dimensions including red teaming for evaluating traveler treatment, input, output, process, efficiency, and outcome performance measures.

viii
Recommendations
We recommend that the Border Patrol:
3.1. Calculate an interdiction rate of illegal activity through red teaming. In this re-port, we provide guidance to ensure valid and reliable red teaming for existing and future attempts, including:
• determining red team composition • maintaining objectivity and confidentiality • generating a statement of evaluation objectives • determining the frequency of red teaming attempts • selecting checkpoints for red teaming • understanding safety issues • preparing a detailed outline for the red teaming process
3.2. Implement input, outcome, process, and efficiency performance measures.
3.3. Evaluate the legal and interpersonal treatment of persons crossing through checkpoints through red teaming.
4. Managerial Tool Development | See pages 46–53.
BORDERS Assessment
We propose a checkpoint simulation and visualization tool to help the Border Patrol make informed resource allocations, conduct workforce planning needs assessments, and as-sess current and future traffic flows when determining the number of inspection lanes on new permanent checkpoints.
Findings: The simulation tool that we built is a realistic computerized representation of an actual checkpoint that models common components, including: pre-primary screening, primary screening, secondary screening, violation processing, traffic flows (actual or an-ticipated), screening times for different types of vehicles, number of inspection lanes, number of agents, secondary screening capacity, number of backscatter machines, and other checkpoint components. Using the simulation model, the Border Patrol can assess the required resources and staffing to meet current and future traffic demands and pre-dict how making resource changes to a checkpoint would influence important outcomes such as wait time, screening time, traffic flushing, queue length, resource utilization, screening capacity, and arrests.
Recommendations
We recommend that the Border Patrol:
4.1. Adopt a checkpoint simulation model, such as that described in this report, to:
• analyze current and expected traffic volumes to determine the number of inspection lanes at new permanent checkpoints;
• conduct workforce planning needs assessment for checkpoint staffing allocations; and perform faster, easier, and more accurate analysis of checkpoint operations.
ix
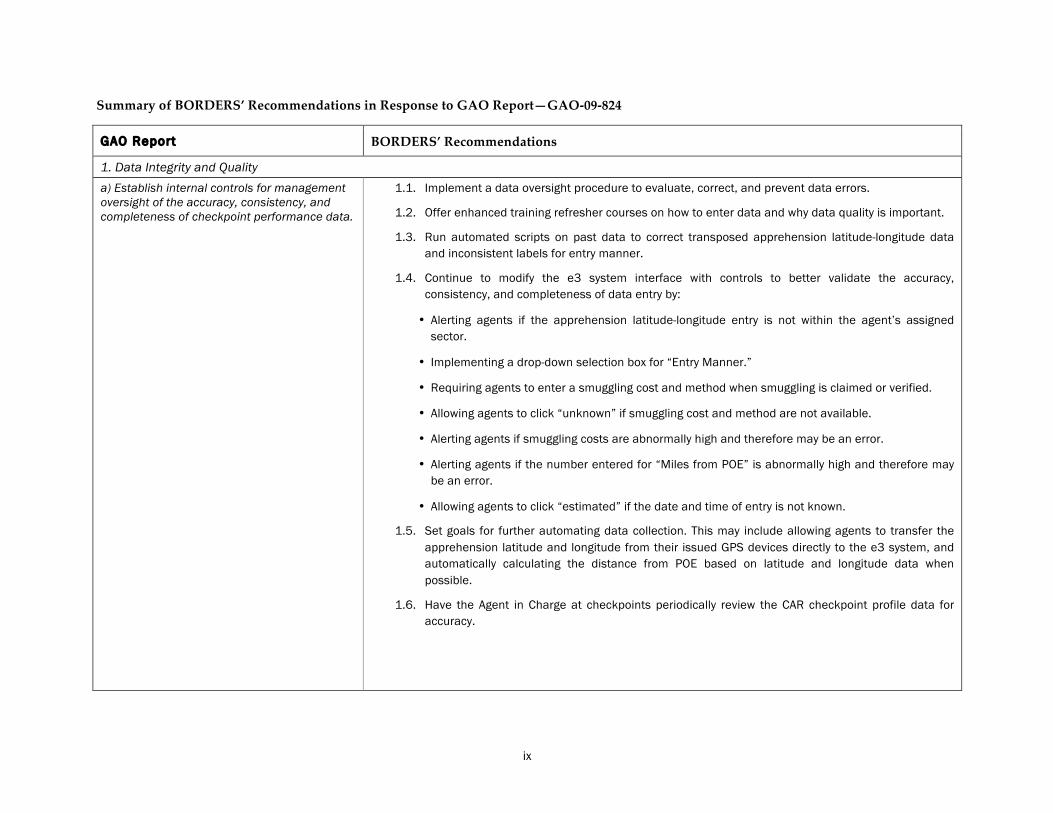
Summary of BORDERS’ Recommendations in Response to GAO Report—GAO-‐‑09-‐‑824
GAO Report BORDERS’ Recommendations
1. Data Integrity and Quality a) Establish internal controls for management oversight of the accuracy, consistency, and completeness of checkpoint performance data.
1.1. Implement a data oversight procedure to evaluate, correct, and prevent data errors.
1.2. Offer enhanced training refresher courses on how to enter data and why data quality is important.
1.3. Run automated scripts on past data to correct transposed apprehension latitude-longitude data and inconsistent labels for entry manner.
1.4. Continue to modify the e3 system interface with controls to better validate the accuracy, consistency, and completeness of data entry by:
• Alerting agents if the apprehension latitude-longitude entry is not within the agent’s assigned sector.
• Implementing a drop-down selection box for “Entry Manner.”
• Requiring agents to enter a smuggling cost and method when smuggling is claimed or verified.
• Allowing agents to click “unknown” if smuggling cost and method are not available.
• Alerting agents if smuggling costs are abnormally high and therefore may be an error.
• Alerting agents if the number entered for “Miles from POE” is abnormally high and therefore may be an error.
• Allowing agents to click “estimated” if the date and time of entry is not known.
1.5. Set goals for further automating data collection. This may include allowing agents to transfer the apprehension latitude and longitude from their issued GPS devices directly to the e3 system, and automatically calculating the distance from POE based on latitude and longitude data when possible.
1.6. Have the Agent in Charge at checkpoints periodically review the CAR checkpoint profile data for accuracy.
x
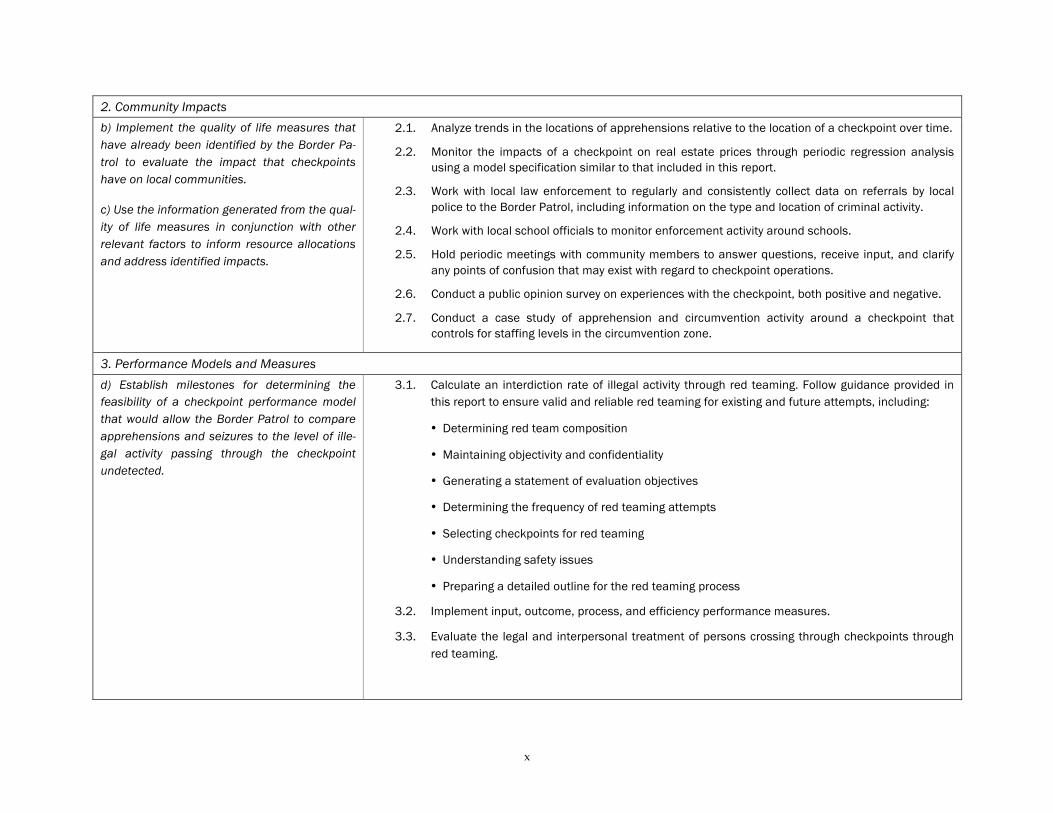
2. Community Impacts b) Implement the quality of life measures that have already been identified by the Border Pa-trol to evaluate the impact that checkpoints have on local communities.
c) Use the information generated from the qual-ity of life measures in conjunction with other relevant factors to inform resource allocations and address identified impacts.
2.1. Analyze trends in the locations of apprehensions relative to the location of a checkpoint over time.
2.2. Monitor the impacts of a checkpoint on real estate prices through periodic regression analysis using a model specification similar to that included in this report.
2.3. Work with local law enforcement to regularly and consistently collect data on referrals by local police to the Border Patrol, including information on the type and location of criminal activity.
2.4. Work with local school officials to monitor enforcement activity around schools.
2.5. Hold periodic meetings with community members to answer questions, receive input, and clarify any points of confusion that may exist with regard to checkpoint operations.
2.6. Conduct a public opinion survey on experiences with the checkpoint, both positive and negative.
2.7. Conduct a case study of apprehension and circumvention activity around a checkpoint that controls for staffing levels in the circumvention zone.
3. Performance Models and Measures d) Establish milestones for determining the feasibility of a checkpoint performance model that would allow the Border Patrol to compare apprehensions and seizures to the level of ille-gal activity passing through the checkpoint undetected.
3.1. Calculate an interdiction rate of illegal activity through red teaming. Follow guidance provided in this report to ensure valid and reliable red teaming for existing and future attempts, including:
• Determining red team composition
• Maintaining objectivity and confidentiality
• Generating a statement of evaluation objectives
• Determining the frequency of red teaming attempts
• Selecting checkpoints for red teaming
• Understanding safety issues
• Preparing a detailed outline for the red teaming process
3.2. Implement input, outcome, process, and efficiency performance measures.
3.3. Evaluate the legal and interpersonal treatment of persons crossing through checkpoints through red teaming.

xi
4. Managerial Tool Development e) Require that current and expected traffic volumes be considered by the Border Patrol when determining the number of inspection lanes at new permanent checkpoints, that traf-fic studies be conducted and documented, and that these requirements be explicitly docu-mented in Border Patrol checkpoint design guidelines and standards.
f) In conjunction with planning for new or up-graded checkpoints, conduct a workforce plan-ning needs assessment for checkpoint staffing allocations to determine the resources needed to address anticipated levels of illegal activity around the checkpoint.
4.1. Adopt a checkpoint simulation model, such as the one described in this report, to:
• Analyze current and expected traffic volumes to determine the number of inspection lanes at new permanent checkpoints;
• Conduct workforce planning needs assessment for checkpoint staffing allocations; and
• Perform faster, easier, and more accurate analysis of checkpoint operations.

1
Introduction The U.S. Border Patrol operates traffic checkpoints on interior U.S. roads as a part of its strategy to interdict and deter illegal immigration, contraband smuggling, and terrorism.
GAO Evaluation of Checkpoint Operations
In 2009, the U.S. Government Accountability Office (GAO) evaluated checkpoint operations3 and, as a result, recommended that the Border Patrol:
• Establish internal controls and management oversight to ensure the accuracy, consistency, and completeness of checkpoint performance data. See section 1: Data Integrity and Quality.
• Implement quality of life measures to evaluate the impact that checkpoints have on local communities. See section 2: Community Impacts.
• Use the quality of life measures in conjunction with other factors to inform agency resource allocations and to address the identified impact. See section 2: Community Impacts.
• Establish milestones to evaluate the usefulness of a checkpoint performance model to compare rates of apprehensions and seizures to undetected illegal activity passing through the checkpoint. See section 3: Performance Models and Measures.
• Factor in current and expected vehicle traffic volumes to determine the number of inspection lanes needed at new permanent checkpoints. See section 4: Managerial Tool Development.
• Assess staffing and resource needs to address anticipated levels of illegal activity that might occur in the vicinity of the checkpoint. See section 4: Managerial Tool Development.
Review of GAO Recommendations
To address the GAO recommendations, the Border Patrol asked the National Center for Border Security and Immigration (BORDERS) to advise the agency on appropriate responses. In collaboration with the Border Patrol, BORDERS conducted a two-year project to examine the GAO recommendations. To conduct the assessment, we gathered and analyzed information from several sources:
3 See Checkpoints Contribute to Border Patrol's Mission, but More Consistent Data Collection and Performance Measurement Could Improve Effectiveness, U.S. Government Accountability Office, GAO-09-824, August 2009, www.gao.gov/products/GAO-09-824.

2
• Site vis its: We visited 17 checkpoints in five Border Patrol sectors on the northern and southern U.S. borders.4
• Working meetings with Border Patrol representatives: We met periodically with representatives from the Border Patrol headquarters to receive feedback on our proposed recommendations and to learn about current developments with the agency and its work.5
• ThinkTank™ session: We conducted a ThinkTank™ session to solicit ideas from Border Patrol staff and agents about how to address the GAO recommendations.6
• e3 system and CAR data: The Border Patrol provided us with apprehension data from its e3 data-collection system (2006–2011) and from the Checkpoint Activity Report (CAR) system (2007–2011).7
• Review of methodologies: We reviewed and validated (a) methodologies used to estimate the amount of undetected illegal activity passing through a checkpoint, (b) models calculating community impact of the checkpoint, and (c) models evaluating data integrity.8
• Interviews with community members: We conducted interviews with community members and stakeholders in surrounding areas to analyze the community impact of checkpoints.9
With the information described above, we completed the four phases of the study (presented in the subsequent sections of this report). We describe the methods, findings, and recommendations of that investigation in this report.
4 Along the U.S.-Mexico border, we visited five checkpoints in the San Diego Sector (located at Temecula I-15, Rainbow, San Clemente I-5, Hwy 94, and I-8), four in the Tucson Sector (Arivaca Rd, I-19, SR 80, and SR 90), four in the El Paso Sector (I-10, White Sands Hwy 70 – MM 198.5, Alamogordo Hwy 54, and US 180), and two in the Rio Grande Sector (Falfurrias and Kingsville). Along the U.S.-Canada border, we visited two checkpoints in the Swanton Sector (I-87 and the Massena Station tactical checkpoint). See documentation of the site visits in Appendix A and a taxonomy of checkpoint core functions in Appendix B. 5 For example, we attended a briefing on the legal restrictions of checkpoints (Appendix C) and on efforts to develop performance measures for the Border Patrol (Appendix D). 6 ThinkTank™ is a brainstorming, consensus-building, and collaboration tool developed by GroupSystems; see www.groupsystems.com. Approximately 30 agents from six sectors (San Diego, Yuma, Tucson, Marfa, El Paso, and Rio Grande Valley) participated in the session. Representatives from the Tucson Sector participated using facilities at the University of Arizona; persons from the other sectors participated via telecommunication links. 7 We received data for 26 variables (a subset of the data in the e3 system) related to apprehended individuals, including (a) location and time of arrest; (b) manner, time, and location of entry into the United States; (c) citizenship of the individual arrested, whether the individual was smuggled in, and, if so, the cost to the individual to be smuggled in; and (d) other information. We received several data sets from the CAR system containing checkpoint profiles, referrals, apprehension counts, seizure counts, and operation hours. 8 This information was a basis for our recommendations. We also reviewed GAO reports that list characteristics of effective performance measures (GAO 2012) and that describe GAO’s Forensic Audits and Investigative Service performance assessments (GAO 2007). 9 For the I-19 case study, we gathered information from the Santa Cruz County Sheriff’s Office, Tubac Golf Resort and Spa, Esplendor Resort, Fresh Produce Association of Americas; various Tubac business and community representatives; residents of Tubac, Green Valley and Sahuarita; and representatives of local schools (Appendix F).
3
1. Data Integrity and Quality We evaluated the data collection protocols at checkpoints, focusing on the accuracy, consistency, and completeness of collected data—important components of data integrity and quality. We examined data from the e3 system, the Checkpoint Activity Report (CAR) module, and other reports from the Border Patrol. In addition, we conducted a ThinkTank™ session, interviewed Border Patrol agents, and made site visits to observe and better understand data collection processes. We found that while data integrity and quality has substantially increased since the 2009 GAO assessment, there are aspects of data collection and management that still need improvement. In this report, we identify ways to mitigate these issues through automation and additional system controls.
BACKGROUND
The GAO stated in its 2009 report that inconsistent data collection and data entry have hindered the Border Patrol’s ability to monitor the need for improvement.10 More specifically, the GAO urged the Border Patrol to “establish internal controls for management oversight of the accuracy, consistency, and completeness of checkpoint performance data” (GAO 2009, 78). The GAO explained that addressing this need and establishing data quality controls “could provide the Border Patrol with additional assurance related to the accuracy, consistency, and completeness of data used to report on the checkpoint performance measures in the annual PAR [Performance Activity Report]” (GAO 2009, 34–35). In a response to these comments in the GAO report, the Border Patrol indicated that it was taking steps to improve data integrity and quality.11
In this section, we identify additional opportunities to improve data accuracy, consistency, and completeness using standard definitions as a guideline (Wang, Storey, and Firth 1995):
• Accuracy means the recorded value is in conformity with the actual value.
• Consistency means the data value represented is the same in all cases.
• Completeness means all values for a certain variable are recorded.
10 “Measures cannot be effectively used until field agents accurately and consistently collect and enter performance data into the checkpoint information system. Field agents are unlikely to do so until guidance is improved, and rigorous oversight is implemented at the station, sector, and headquarters levels” (GAO 2009, 77). 11 “Solutions to control the accuracy, consistency, and completeness of checkpoint performance data are currently being implemented. In April 2009, the Border Patrol convened a workgroup in Washington, DC consisting of headquarters personnel and subject matter experts from the field. This group discussed checkpoint data integrity issues and checkpoint performance measures. To address the data integrity concerns, the workgroup revised and clarified the checkpoint definitions to prevent incorrect data entry. The workgroup reviewed and edited current performance measures to tailor them into more meaningful performance indicators, creating new measures with metrics previously not considered, and remodeled and streamlined data collection procedures to avoid redundancy. With the migration of the Border Patrol system of record from ENFORCE to e3, the Border Patrol can further ensure data integrity by taking advantage of technology enhancements and the lessons learned. Initial technological changes are expected near the end of FY 2009, with final upgrades occurring between the middle and end of FY 2010. In addition to the aforementioned remedies, a program manager at headquarters was selected in February 2009 to oversee all checkpoint data and its collection” (Department of Homeland Security 2009).
4
METHODOLOGY AND FINDINGS
We analyzed e3 data and CAR module data to assess data accuracy, consistency, and completeness. The e3 system is used by agents to process and record data about apprehended individuals, such as apprehension location, smuggling information, and the date and time of apprehensions. The CAR report contains checkpoint operation data and infrastructure data (e.g. checkpoint profile reports, referrals, apprehensions, seizures, operational hours, and personnel).
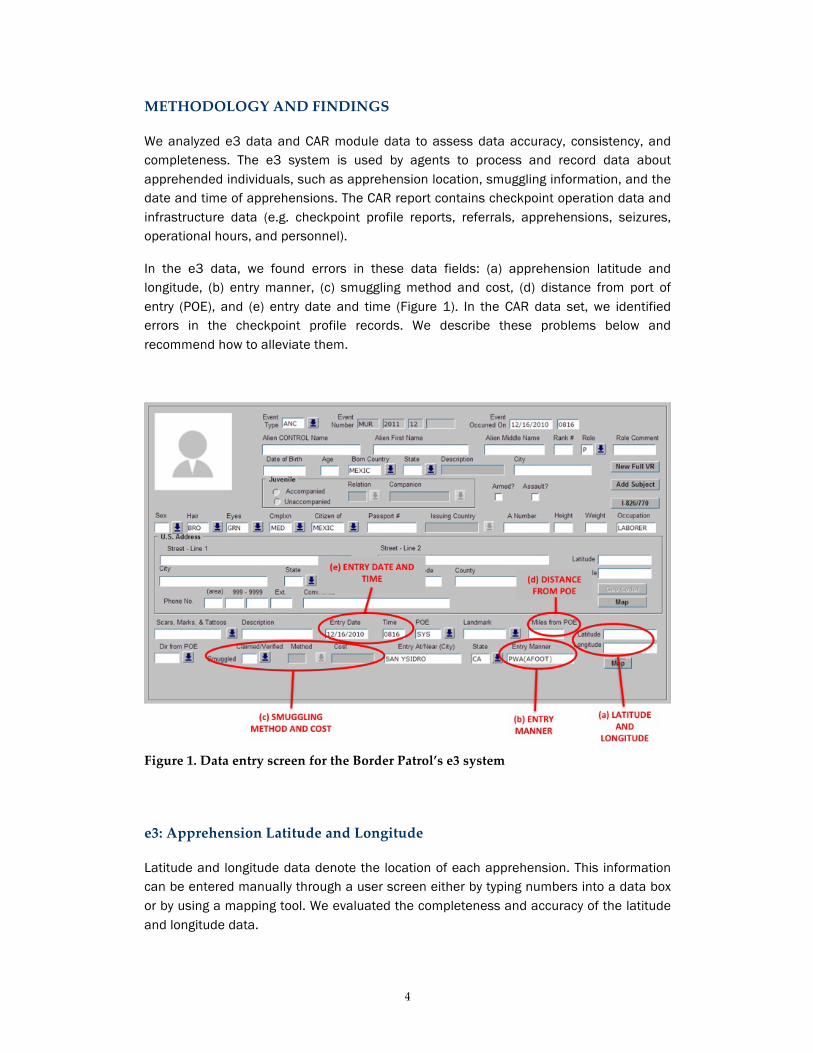
In the e3 data, we found errors in these data fields: (a) apprehension latitude and longitude, (b) entry manner, (c) smuggling method and cost, (d) distance from port of entry (POE), and (e) entry date and time (Figure 1). In the CAR data set, we identified errors in the checkpoint profile records. We describe these problems below and recommend how to alleviate them.
Figure 1. Data entry screen for the Border Patrol’s e3 system
e3: Apprehension Latitude and Longitude
Latitude and longitude data denote the location of each apprehension. This information can be entered manually through a user screen either by typing numbers into a data box or by using a mapping tool. We evaluated the completeness and accuracy of the latitude and longitude data.
5
Completeness
The completeness of apprehension latitude and longitude data in the e3 system has increased substantially during the past five years—attributable to a Border Patrol mandate to collect the data beginning in FY 2009.
Accuracy
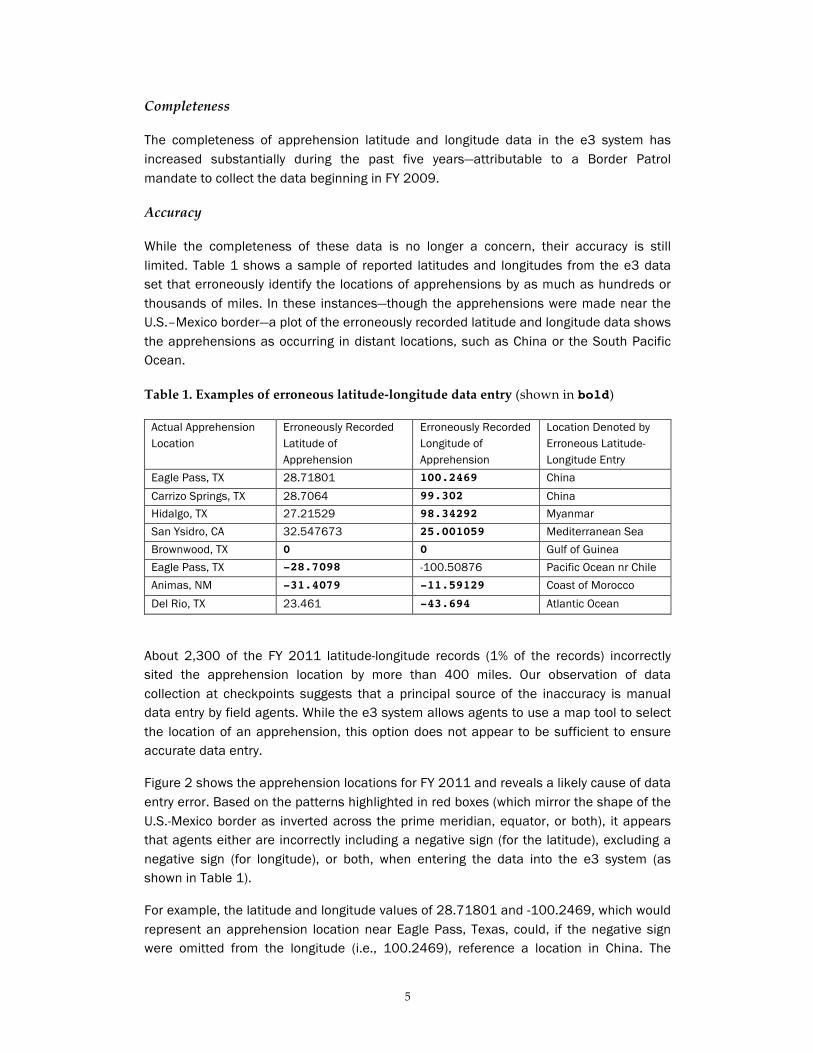
While the completeness of these data is no longer a concern, their accuracy is still limited. Table 1 shows a sample of reported latitudes and longitudes from the e3 data set that erroneously identify the locations of apprehensions by as much as hundreds or thousands of miles. In these instances—though the apprehensions were made near the U.S.–Mexico border—a plot of the erroneously recorded latitude and longitude data shows the apprehensions as occurring in distant locations, such as China or the South Pacific Ocean.
Table 1. Examples of erroneous latitude-‐‑longitude data entry (shown in bold)
Actual Apprehension Location
Erroneously Recorded Latitude of Apprehension
Erroneously Recorded Longitude of Apprehension
Location Denoted by Erroneous Latitude-Longitude Entry
Eagle Pass, TX 28.71801 100.2469 China Carrizo Springs, TX 28.7064 99.302 China Hidalgo, TX 27.21529 98.34292 Myanmar San Ysidro, CA 32.547673 25.001059 Mediterranean Sea Brownwood, TX 0 0 Gulf of Guinea Eagle Pass, TX -28.7098 -100.50876 Pacific Ocean nr Chile Animas, NM -31.4079 -11.59129 Coast of Morocco Del Rio, TX 23.461 -43.694 Atlantic Ocean
About 2,300 of the FY 2011 latitude-longitude records (1% of the records) incorrectly sited the apprehension location by more than 400 miles. Our observation of data collection at checkpoints suggests that a principal source of the inaccuracy is manual data entry by field agents. While the e3 system allows agents to use a map tool to select the location of an apprehension, this option does not appear to be sufficient to ensure accurate data entry.
Figure 2 shows the apprehension locations for FY 2011 and reveals a likely cause of data entry error. Based on the patterns highlighted in red boxes (which mirror the shape of the U.S.-Mexico border as inverted across the prime meridian, equator, or both), it appears that agents either are incorrectly including a negative sign (for the latitude), excluding a negative sign (for longitude), or both, when entering the data into the e3 system (as shown in Table 1).
For example, the latitude and longitude values of 28.71801 and -100.2469, which would represent an apprehension location near Eagle Pass, Texas, could, if the negative sign were omitted from the longitude (i.e., 100.2469), reference a location in China. The

6
patterns suggest, however, that these particular erroneous values could be manipulated systematically (by adding or deleting the negative sign as appropriate) to more accurately represent an apprehension location along the U.S.–Mexico border.
Figure 2. Plotted apprehension latitude and longitude data
In addition to data inaccuracies that are relatively obvious (at least when the locations are mapped), there are data-entry errors that are more difficult to detect, such as when the latitude and longitude data are off by only a few miles or a few dozen miles. In these cases, the inaccuracies often would be undetectable using automated analyses. Furthermore, the overall level of inaccuracy for this data set would seem to render the data of questionable use for intelligence gathering, such as to predict trends in trafficking-smuggling routes.
Based on our analysis, we recommend that the Border Patrol:
• Correct the transposed latitude and longitude data using an automated script.
• Modify the e3 system to validate that the latitude and longitude entries are located within a given sector or area of operation.
• Collect the apprehension latitude and longitude data automatically through electronic field equipment to transfer data directly from an agent's issued GPS device to the e3 system.

7
e3: Entry Manner
The “entry manner” field for the e3 system is used to capture data about the way in which an apprehended person entered the United States. This information is typed manually into a text box, using such terms as “by raft,” “jumped fence,” or “vehicle via desert.”
Consistency
Our analyses indicate that data for “entry manner” are inconsistently entered in the e3 system, either due to typing errors or to varying terms used by agents. As an example, in FY 2011 (during the first five months) there were 1,850 unique data values for this field, many times more than the number of unique terms that would be expected. For one particular term, “AFOOT,” there were 25 variations (such as “AFFOOT,” “AFFOT,” “A FOOOT,” and so on).12
Since the data we analyzed is a subset of the e3 system data, the presence of errors associated with the collection of “entry manner” data could indicate the likelihood of errors for other fields where information is entered using a text box.
Based on our analysis, we recommend that the Border Patrol:
• Correct existing “entry manner” data by identifying acceptable values (for this and other fields where similar errors occur) and developing a script to replace inaccurate values with acceptable ones.
• Identify acceptable values for the “entry manner” field and implement a data entry dropdown menu (or similar control) to prevent inconsistencies. As new methods of entry are identified, the list should be updated.
e3: Smuggling Method and Cost
The e3 system is used to record smuggling-related data (method and cost). If an individual claims to have been smuggled, or is verified to have been smuggled, agents must enter a “c” or “v,” respectively, followed by entering data about the smuggling method and cost.
Consistency
We found no data inconsistency in this field, which can be attributed to a drop down menu that allows agents to select a value, rather than enter it manually. 12 Border Patrol representatives indicated to us that “entry manner” data is not currently used for intelligence gathering operations or for predictive analyses. However, for the purpose of this report, we included this field since the data may prove beneficial in the future for predicting smuggling trends. The method of entry into the United States from Mexico, and the routes used to transit the border areas of the United States to a major city, is a significant piece of the mosaic of drug and human smuggling. The means of entry into the United States, combined with the location, and the type of activity are key indicators of how smuggling-trafficking organizations operate, organizations’ capacities and capabilities, and whether the organizations are responsive to enforcement stimulus.
8
Completeness
Our data completeness analyses for the “smuggling method” and “smuggling cost” fields found that 15% of the records that report that an apprehended individual was “smuggled” do not indicate the smuggling method. While this information might be unknown, this option is not on the menu, and it is not possible to tell whether the empty field is due to agent oversight or the information was not available. Records for the “cost” field are also incomplete, with 45% of the records lacking a corresponding cost. Again, while this can be attributable to a lack of information, the drop-down menu does not offer that response as an option.
Accuracy
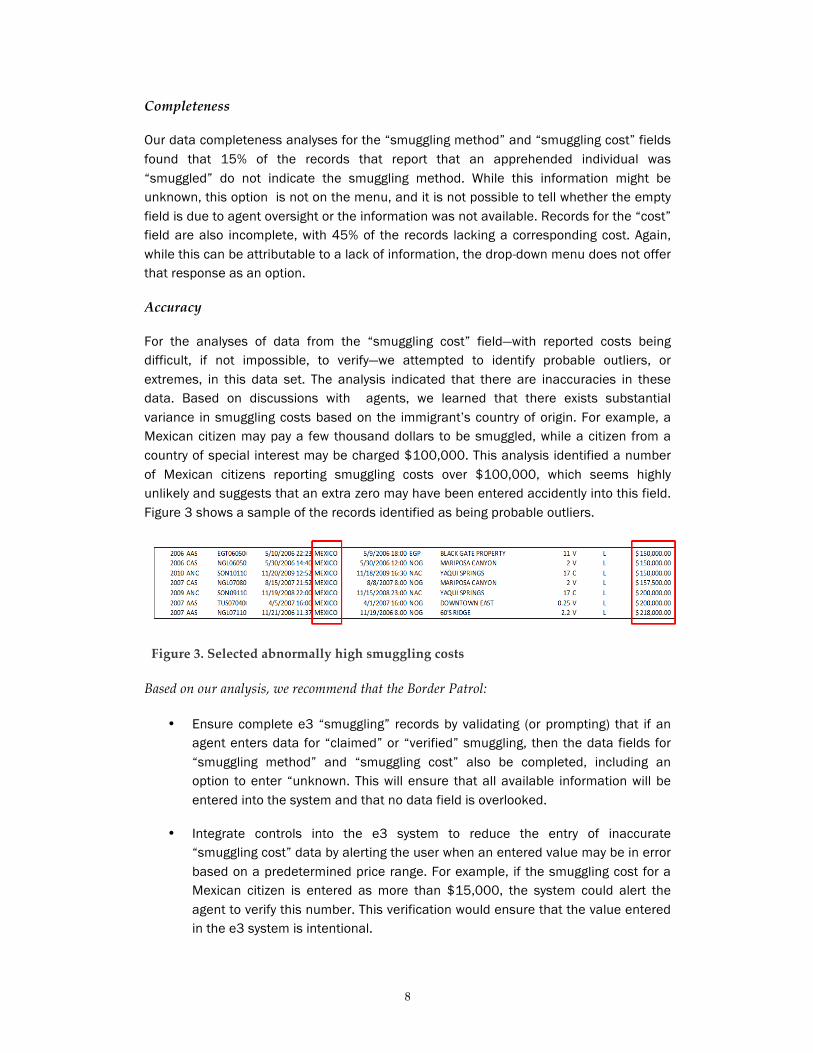
For the analyses of data from the “smuggling cost” field—with reported costs being difficult, if not impossible, to verify—we attempted to identify probable outliers, or extremes, in this data set. The analysis indicated that there are inaccuracies in these data. Based on discussions with agents, we learned that there exists substantial variance in smuggling costs based on the immigrant’s country of origin. For example, a Mexican citizen may pay a few thousand dollars to be smuggled, while a citizen from a country of special interest may be charged $100,000. This analysis identified a number of Mexican citizens reporting smuggling costs over $100,000, which seems highly unlikely and suggests that an extra zero may have been entered accidently into this field. Figure 3 shows a sample of the records identified as being probable outliers.
Figure 3. Selected abnormally high smuggling costs
Based on our analysis, we recommend that the Border Patrol:
• Ensure complete e3 “smuggling” records by validating (or prompting) that if an agent enters data for “claimed” or “verified” smuggling, then the data fields for “smuggling method” and “smuggling cost” also be completed, including an option to enter “unknown. This will ensure that all available information will be entered into the system and that no data field is overlooked.
• Integrate controls into the e3 system to reduce the entry of inaccurate “smuggling cost” data by alerting the user when an entered value may be in error based on a predetermined price range. For example, if the smuggling cost for a Mexican citizen is entered as more than $15,000, the system could alert the agent to verify this number. This verification would ensure that the value entered in the e3 system is intentional.
9
e3: Distance from POE
Another data field captured in e3 is labeled “miles from POE” (port of entry). This field is used to record the distance, in miles, between the location where the individual crossed into the United States and the nearest POE. The agent enters this information manually by typing the calculated distance into a text box. In addition, the agent also enters a landmark to identify the individual’s entry point into the United States. The landmark box has a dropdown menu where the agent can select from a list of options (e.g., “Mariposa Canyon,” “Nogales tunnels,” “San Miguel gate,” etc.).
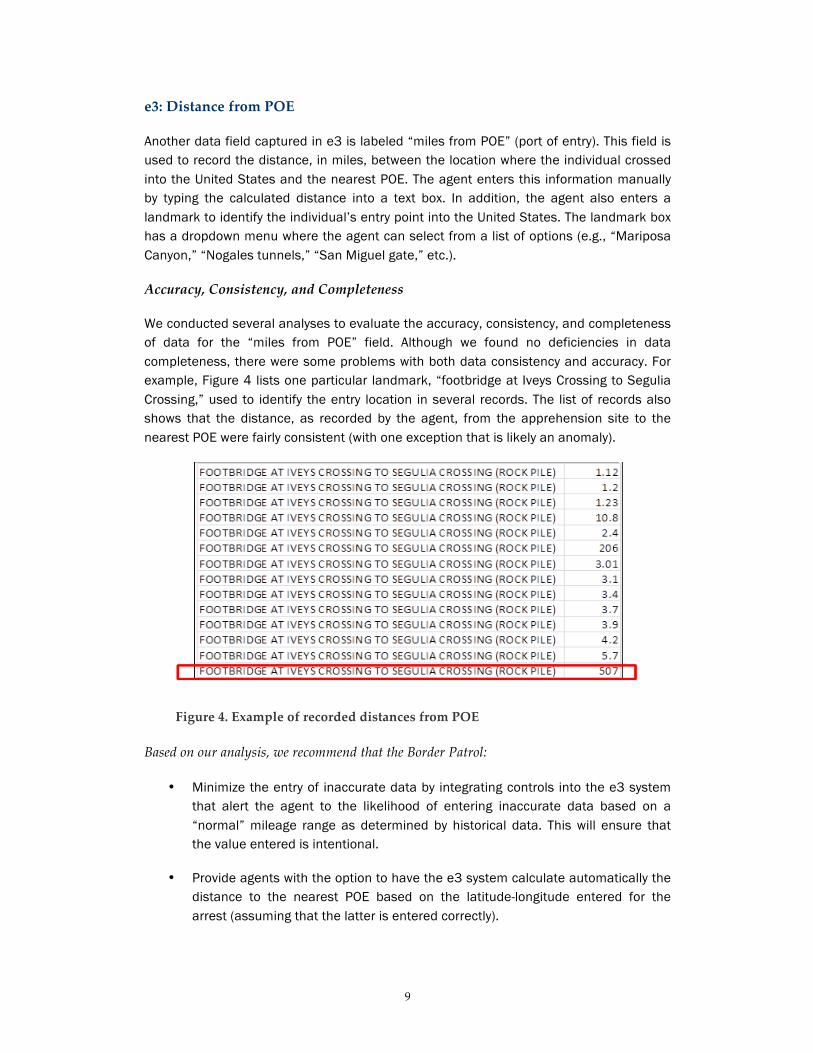
Accuracy, Consistency, and Completeness
We conducted several analyses to evaluate the accuracy, consistency, and completeness of data for the “miles from POE” field. Although we found no deficiencies in data completeness, there were some problems with both data consistency and accuracy. For example, Figure 4 lists one particular landmark, “footbridge at Iveys Crossing to Segulia Crossing,” used to identify the entry location in several records. The list of records also shows that the distance, as recorded by the agent, from the apprehension site to the nearest POE were fairly consistent (with one exception that is likely an anomaly).
Figure 4. Example of recorded distances from POE
Based on our analysis, we recommend that the Border Patrol:
• Minimize the entry of inaccurate data by integrating controls into the e3 system that alert the agent to the likelihood of entering inaccurate data based on a “normal” mileage range as determined by historical data. This will ensure that the value entered is intentional.
• Provide agents with the option to have the e3 system calculate automatically the distance to the nearest POE based on the latitude-longitude entered for the arrest (assuming that the latter is entered correctly).

10
e3: Entry Date and Time
When processing an apprehended individual, agents are required by law to enter the date and time of entry.
Accuracy
We analyzed the “entry date” and “entry time” data and found many inaccuracies in these fields. For example, Figure 5 shows information for two groups of apprehended individuals (the two groups were apprehended on different dates; all individuals within each group were apprehended at the same time). For each individual, a corresponding time and date of entry is present. Some records show that the date or time of entry for an individual is the same as the date or time of apprehension (though the years of entry and apprehension are different), which is highly unlikely.
Figure 5. Sample entry dates and times
Interviews with agents indicated that a common entry time is often recorded for undocumented immigrants apprehended together for the following reasons: (a) the individuals actually crossed the border together, (b) it saves time even if individuals did not cross the border together, or (c) the individuals do not know the exact date or time (or location) of entry. In addition, checkpoints don’t always deal with current or recent entrants, often processing domiciled aliens that may have made their illegal entry years ago and cannot provide an accurate crossing date or time. As a result, this suggests that many entry times recorded in the e3 system may be incorrect and therefore limit the usefulness of the data for predictive analyses.
Based on our analysis, we recommend that the Border Patrol:
• Provide an option for agents to denote an “entry date” or “entry time” as being “estimated.” Marking the data as such would prevent it from being considered for any time-series analyses run using this corpus of data, ensuring that inaccurate data will not skew the results.

11
CAR (Checkpoint Activity Report): Checkpoint Profile Data
We received a checkpoint profile report (current as of June 23, 2011) that contains information about checkpoint resources, operations, and infrastructure. Based on our site visits, we found components of these data to be incorrect. For example, for the Tucson Sector I-19 checkpoint, we identified several discrepancies between what the checkpoint profile report’s description of infrastructure and what actually exists.
• The I-19 checkpoint is listed as not having a canopy in the checkpoint profile report. However, a semi-permanent canopy is currently in place at this location (refer to images in Appendix A).
• The I-19 checkpoint is listed as having hardline power in the checkpoint profile report. However, agents reported that electrical power is provided by generators.
• The I-19 checkpoint is listed as having municipal water. However, agents reported that municipal water is not available.
Based on these findings, we recommend that:
• The Border Patrol Agent in Charge at each checkpoint review the checkpoint profile on a semi-annual basis and verify or sign-off that the information is up to date.
RECOMMENDATIONS
With regard to data integrity and quality, we recommend that the Border Patrol:
1.1. Implement a data oversight procedure to evaluate, correct, and prevent data errors.
1.2. Offer enhanced training refresher courses on how to enter data and why data quality is important.
1.3. Run automated scripts on past data to correct transposed apprehension latitude-longitude data and inconsistent labels for entry manner.
1.4. Continue to modify the e3 system interface with controls to better validate the accuracy, consistency, and completeness of data entry by:
• Alerting agents if the apprehension latitude-longitude entry is not within the agent’s assigned sector.
• Implementing a drop-down selection box for “entry manner.”
• Requiring agents to enter a smuggling cost and method when smuggling is claimed or verified.
• Allowing agents to click “unknown” if smuggling cost and method are not available.
• Alerting agents if smuggling costs are abnormally high and therefore may be an error.

12
• Alerting agents if the number entered for “miles from POE” is abnormally high and therefore may be an error.
• Allowing agents to click “estimated” if the date and time of entry is not known.
1.5. Set goals for further automating data collection. This may include allowing agents to transfer the apprehension latitude and longitude from their issued GPS devices directly to the e3 system, and automatically calculating the distance from POE based on latitude and longitude data when possible.
1.6. Have the Agent in Charge at checkpoints periodically review the CAR checkpoint profile data for accuracy.
13
2. Community Impacts BACKGROUND
The objective of this portion of our research was to identify, measure, and evaluate impacts Border Patrol checkpoints might have on nearby communities. A number of factors contribute to the nature and magnitude of checkpoint impacts on communities, such as:
• the number, size, and population density of communities between the checkpoint and the U.S. border;
• the type of economic activity that sustains these communities; and
• the nature of the terrain around the checkpoint.
I-‐‑19 Checkpoint Case Study
We selected the checkpoint along U.S. Interstate 19 (I-19) between Tucson and Nogales, Arizona, as a case study (see Figure 6).13
The 25-mile corridor along I-19 is home to a number of long-standing communities. According to the U.S. Census Bureau, approximately 41,400 people live in communities along or near I-19 between the checkpoint and the border. The corridor is located in a valley in a mountainous region of southern Arizona. The San Cayetano Mountains and the Santa Rita Mountains border the valley to the east and the Tumacacori Mountains border it to the west. Most of the communities in the corridor are located within a 5-kilometer band along either side of the highway.
The village of Tubac, with a year-round population of approximately 1,200 people, is just four miles south of the checkpoint. Rio Rico, with a population of approximately 19,000, is 10 miles to the south, and Nogales, right at the border, has a population of approximately 20,800 people. To the north of the checkpoint are the communities of Amado, Green Valley, and Sahuarita, with a total population of approximately 55,000 people. The principal economic engines of the region are real estate, tourism, mining, farming, and ranching.
13 While no case study can capture all the conditions and situations of every checkpoint, the standard for selecting a case example should be to identify one that most effectively captures the major phenomena of interest. The I-19 checkpoint meets this standard and is, in our judgment, the best choice available along the U.S.-Mexico border. The checkpoint is on a north-south artery in southern Arizona between Nogales and Tucson, and provides a good example of the effects of a regularly operating checkpoint on traffic and travelers. Further, the checkpoint is located near a number of long-standing communities both to its north and to its south. The size of these communities renders this study feasible, as they are not so large as to prove unmanageable and prohibitively expensive to study, as might have been the case in San Diego, or Texas. Further, the ability to do a paired analysis of real estate prices in the nearby communities of Green Valley and Tubac is a particularly valuable aspect of the I-19 checkpoint as a case study.

14
The findings presented here are particularly relevant to checkpoints located in close proximity to population centers and, in particular, to those with large communities between the checkpoint and the U.S. border. In addition, it should be noted that community impacts related to the I-19 checkpoint are significantly shaped by its fixed location relative to the communities in the region, the scale of the Border Patrol operation at the checkpoint, the physical size of the facility, and the essentially permanent nature of its structures. These impacts, particularly those on residential real estate prices in communities to its south, would likely be different if the I-19 checkpoint were of a size and scale similar to others in the region.
Figure 6. Location of the U.S. Border Patrol I-‐‑19 checkpoint (Source: GAO 2009, 70)
METHODOLOGY AND FINDINGS We used two approaches—qualitative interview-based research and quantitative data analysis—to identify and measure key areas of impact.
• The qualitative research included input from the Border Patrol through the ThinkTank™ session (Appendix E) along with thematic information that emerged from interviews with stakeholders (Appendix F). These sources provided information as to the nature of community impacts, whether perceived or actual.

15
• Two types of quantitative analysis were conducted: (1) basic statistical analysis of Border Patrol apprehension data, which provided insight on the effects of the checkpoint on circumvention patterns, and (2) multiple regression analysis of residential real estate sales data in communities north and south of the checkpoint, which examined whether there is statistical evidence to support community claims with regard to negative effects of the permanent checkpoint on residential real estate prices. The fixed location and essentially permanent nature of the I-19 checkpoint are seen by the community as key determinants of such impacts.
Key Findings and Themes
The location of the checkpoint determines its effectiveness as well as its impacts. While this may seem obvious, it is useful to think in terms of a radius of impacts around a checkpoint that is overlaid on its surrounding communities. Not surprisingly, attitudes toward the checkpoint are significantly shaped by location within the radius and relative to the checkpoint. In the case of the I-19 checkpoint, its scale, fixed location relative to communities in the region, and essentially permanent structures are seen as driving its potentially negative impacts.
Identifying Community Impact Measures
The University of Arizona hosted a ThinkTank™ session involving some 30 agents from several Border Patrol sectors to discuss a variety of topics including metrics for evaluating the impact of checkpoints on communities. The Tucson sector sent agents to the UA facilities while the San Diego, Yuma, El Paso, Marfa, and Rio Grande sectors participated simultaneously from remote locations. Agents were asked to identify and rank possible measures of community impacts (Table 2; also Appendix E).
Table 2. ThinkTank™-‐‑identified impacts of checkpoints (with rankings)
Community Impact Measure Al l Rural Urban Crime rate (of neighboring areas/communities) 1 2 1 Signs of pedestrian and vehicle traffic (evidence of circumvention) 2 1 3 Anecdotal reports of illicit activity/circumvention 3 3 2 Call rates: accidents, amber alerts, other agency assists, etc. 4 6 6 Misdemeanor narcotic violations (operation citation or agency asst.) 5 5 5 Wait times (by day & day part) 6 7 4 Property damage & trespass reports (from ranchers) 7 4 9 Property values (of neighboring areas/communities) 8 10 7 Vehicle accident rate comparisons (at/near checkpoint locations) 9 8 8 Environmental impact 10 9 10
In addition, we met with individuals and representatives of local community groups including the Southern Arizona Resort and Lodging Association, Tubac Golf Resort and Spa, Esplendor Resort in Rio Rico, Fresh Produce Association of America, local small business owners in communities south of the checkpoint, Santa Cruz County sheriff’s

16
office, and local chambers of commerce (Appendix F). A set of concerns and themes emerged from these meetings that, together with the results of the ThinkTank™ session, inform the approach taken in this report.
The identified measures of a checkpoint’s community impacts can be grouped into three broad categories:
• circumvention impacts with attendant public safety and law-enforcement costs;
• inconvenience , impacts deriving from unpredictable wait times and risk of secondary screening for those having to travel through the checkpoint; and
• economic harm , impacts deriving both from changing public perceptions about the dangers of the border region indicated by the presence of a fixed and essentially permanent checkpoint in the community and from the inconvenience to tour groups—in the case of the community of Tubac and the I-19 checkpoint—that have to go through the checkpoint and wait as their busses are boarded and documents inspected.
Again, the concerns that were raised related specifically to the fixed, essentially permanent checkpoint in its current location on I-19 rather than to checkpoint operations in general or to the previously mobile checkpoint activity that used to occur along I-19. And, in the case of the I-19 checkpoint, its impacts are disproportionately born by communities that lie between the permanent checkpoint and the U.S. border because these communities disproportionately experience the inconvenience and economic harm.
Circumvention Impacts
• Neighborhoods and schools. Residents south of the checkpoint expressed concerns that the permanent checkpoint causes those engaged in illegal activity to attempt to circumvent the checkpoint. This circumvention, often referred to as flanking, pushes drug and human smuggling into neighborhoods and creates public safety problems in communities both south and north of the checkpoint. This increased illegal activity also is seen as resulting in increased Border Patrol enforcement activity in neighborhoods and, sometimes, around schools. Community members near the checkpoint complain of high-speed chases through neighborhoods, Blackhawk helicopters deployed near population centers, school lockdowns, and similar disruptions. Representatives of Santa Cruz County Unified School District #35 reported four specific enforcement incidents that affected schools.
• Lessening of activ ity . Representatives from the Fresh Produce Association, located in Nogales near the border, perceive a decline in circumvention through their area and see the checkpoint as having moved illegal trafficking further away to places like Patagonia. A representative of the Tubac Golf Resort and Spa reported seeing fewer visible migrants along the river next to the resort, or, when the resort

17
cleans the highways on both sides, seeing fewer drug mules walking with dogs with drug-laden packs to get around the highway.
Inconvenience
• Missed meetings or air l ine f l ights. Virtually all community members interviewed who live south of the permanent I-19 checkpoint consider it a significant inconvenience. They describe unpredictable wait times for traveling through the checkpoint. For example, when wait-times are long, people have missed flights out of the Tucson International Airport or have been late for appointments in Tucson.
• Interactions with agents. Some community members complained about agents who are not always professional or courteous and spoke of being detained for no apparent reason. Such concerns were often expressed in the context of uncertainty about Border Patrol protocol and ambiguity about individual rights during secondary screening. Others referred to officers at the checkpoint as “generally professional and courteous.”
• Fear of being profi led. Some community members stated that there is concern among Hispanics about racial profiling, and that for some families, the checkpoint creates zones (between the checkpoint and the border) that people won’t leave because they want to avoid the checkpoint. This is perceived as cutting some people off from essential services.
Economic Harm
• “Mil i tary” atmosphere. Because the economies of Tubac and Rio Rico (both located south of the checkpoint) are very dependent on tourism, there is strong, frequently voiced concern among community members that the presence of a large, apparently permanent checkpoint in a fixed location contributes to a perception among visitors to the area that the border region is dangerous. They indicated that the current size of the I-19 checkpoint, with its significant Border Patrol staff, dogs, and physical infrastructure creates a military atmosphere that is intimidating to people going through it.
• Real estate. The perception that the border region is dangerous, in turn, causes some residents to attribute negative impacts on real estate values and businesses south of the checkpoint, many of which rely heavily on tourism.
• Resorts. The Tubac Golf Resort and Spa estimates that the resort has seen a 10% reduction in its conference and meeting business, which translates to a loss of approximately $200,000 per year. While the representative who provided this statistic attributes the reduction to the checkpoint, it is difficult to disentangle the effects of the general economic downturn, negative publicity from SB1070, and the impacts of the checkpoint itself.
18
• Tourism. Representatives of the resort also report a dramatic reduction in the number of tour busses in Tubac from Tucson, representing serious harm to retail businesses that rely on tourism. This reduction results from the fact that tour busses going through the permanent checkpoint must stop so that officers can board the bus and check the documents of all persons on the bus.
• Shift in economic base. Because of the dampening effect on tourism, the checkpoint has the effect of shifting the economic base of the region away from tourism and toward border enforcement itself through the influx of residents (Border Patrol personnel) whose income is spent in local businesses, to purchase or rent housing, and so forth. The presence of Border Patrol agents on the federal payroll does bring money into the region, but a number of people noted that, while the checkpoint is located in Santa Cruz County, many Border Patrol agents live in Green Valley (Pima County) north of the checkpoint. This means that Santa Cruz County bears much of the economic cost of the checkpoint without necessarily reaping an equivalent share of its economic benefit.
Measuring Circumvention Impacts
Circumvention impacts derive from the fact that those involved in illegal activity—primarily smugglers of humans and drugs, as well as individual undocumented immigrants—take steps to circumvent the checkpoint as they move further into the United States. Circumvention decisions have three elements: when to leave the roadway, what route to take around the checkpoint, and where to re-access the roadway beyond the checkpoint. Circumvention activity is pushed into communities around a checkpoint and, in the case of the I-19 checkpoint, circumvention and perception issues are particularly salient to the south, between the checkpoint and the border, because of the funneling effect created by mountains on either side of the highway.
To develop quantitative evidence with regard to the extent and nature of circumvention activity, we conducted a statistical analysis of monthly apprehension data for 2009–2011 provided by the Border Patrol. We also obtained information on specific instances of school lock-downs in Santa Cruz County School District #35 and information from the Santa Cruz County Sheriff’s department with regard to border-enforcement related incidents and costs. The results of our analysis of apprehensions data are presented in this report. Information on school impacts is presented in Appendix F.
Measuring Inconvenience and Economic Harm
Generalizing for other checkpoints, any inconvenience associated with a checkpoint is, by definition, disproportionately born by communities whose location requires people to regularly travel through it. To the extent that the prospect of having to regularly travel through a checkpoint inhibits public willingness to move to a community, there is economic harm resulting from depressed housing prices that is disproportionately born by communities between the checkpoint and the U.S. border.
19
To the extent that a community’s economic base depends on tourism and the presence of a checkpoint inhibits tourism, there is economic harm that is disproportionately born by communities between the checkpoint and the U.S. border. The themes and concerns articulated by a cross section of those with whom we spoke are summarized in Table 3.
It is important to keep in mind that these summarized themes and concerns represent the perceptions and experiences of a broad cross-section of communities around the I-19 checkpoint at its current location and scale and that, while it is difficult to statistically confirm or negate these perceptions, they do represent a cross section of public opinion related to the checkpoint. Further, as mentioned earlier, the findings presented in this section of our report are more relevant to checkpoints located in densely populated areas rather than to checkpoints located in remote areas far from residential areas.
Quantitative measures of the extent and nature of economic harm that is associated with the checkpoint were obtained from two sources. One source was the above statements by representatives of businesses south of the checkpoint, which provided specific estimates of such impacts. A second quantitative measure was obtained from regression analysis of residential real estate prices in the region. These results are presented later in this report.
Circumvention Impacts: Distance-‐‑from-‐‑Interstate Analysis While apprehension data necessarily reflects management decisions with regard to deployment of enforcement resources, such decisions can be assumed to reflect prior knowledge about the location of illegal activity. Therefore, insight can be gained about circumvention by examining the location of apprehensions relative to a checkpoint and to the transportation corridors around it.
Using the I-19 checkpoint as a case study, we examined monthly apprehensions data for 2009–2011 provided by Border Patrol, which included GPS coordinates for each apprehension. As a measure of circumvention activity, these data were analyzed to determine: Is there a discernible difference in locations of apprehensions relative to I-‐‑19 in various north-‐‑south segments before and after April 2010 when the checkpoint began operation in its current location?
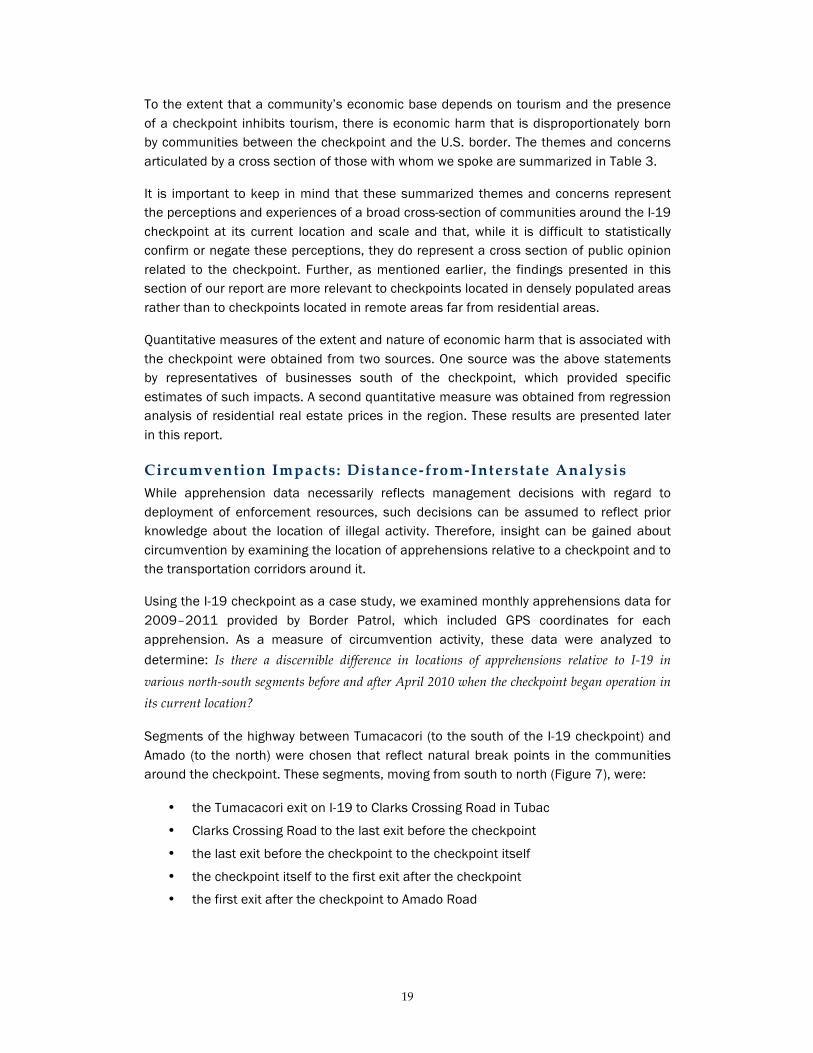
Segments of the highway between Tumacacori (to the south of the I-19 checkpoint) and Amado (to the north) were chosen that reflect natural break points in the communities around the checkpoint. These segments, moving from south to north (Figure 7), were:
• the Tumacacori exit on I-19 to Clarks Crossing Road in Tubac
• Clarks Crossing Road to the last exit before the checkpoint
• the last exit before the checkpoint to the checkpoint itself
• the checkpoint itself to the first exit after the checkpoint
• the first exit after the checkpoint to Amado Road
20
Figure 7. Google Earth map of region with key landmarks
Because the highway is oriented almost completely in a north-south direction, we were able, in a relatively straightforward fashion, to calculate the distance from the highway of each recorded apprehension. For each of the above highway segments, the corresponding data were located between northern and southern points of the segment. This resulted in bands of data stretching east and west along each section of highway. Using the latitude and longitude locations of the apprehensions and of the highway itself, a distance-from-the-highway calculation was made for each apprehension.
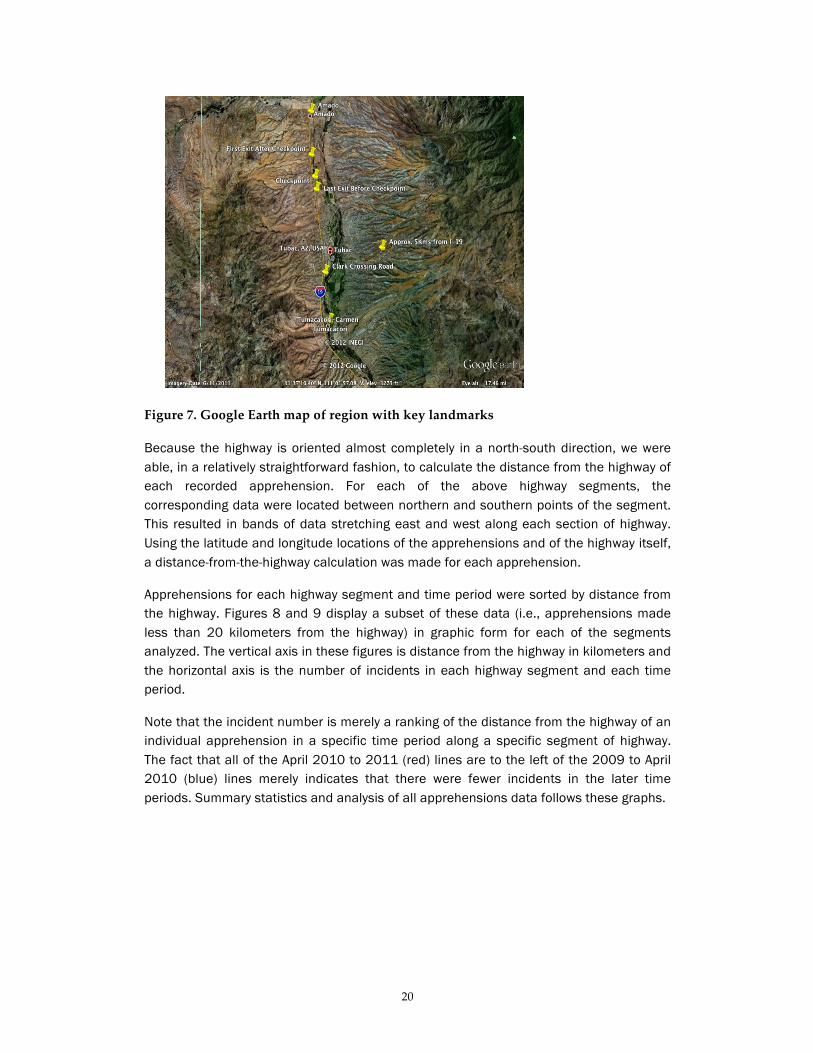
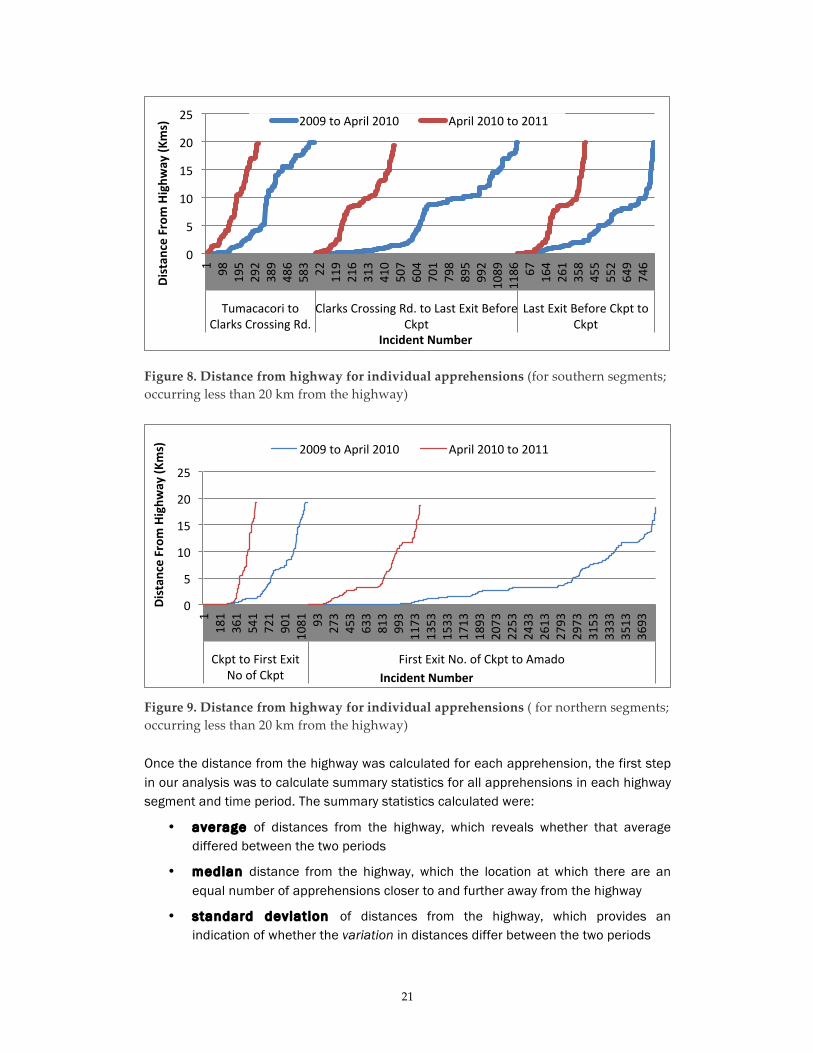
Apprehensions for each highway segment and time period were sorted by distance from the highway. Figures 8 and 9 display a subset of these data (i.e., apprehensions made less than 20 kilometers from the highway) in graphic form for each of the segments analyzed. The vertical axis in these figures is distance from the highway in kilometers and the horizontal axis is the number of incidents in each highway segment and each time period.
Note that the incident number is merely a ranking of the distance from the highway of an individual apprehension in a specific time period along a specific segment of highway. The fact that all of the April 2010 to 2011 (red) lines are to the left of the 2009 to April 2010 (blue) lines merely indicates that there were fewer incidents in the later time periods. Summary statistics and analysis of all apprehensions data follows these graphs.
21
Figure 8. Distance from highway for individual apprehensions (for southern segments; occurring less than 20 km from the highway)
Figure 9. Distance from highway for individual apprehensions ( for northern segments; occurring less than 20 km from the highway)
Once the distance from the highway was calculated for each apprehension, the first step in our analysis was to calculate summary statistics for all apprehensions in each highway segment and time period. The summary statistics calculated were:
• average of distances from the highway, which reveals whether that average differed between the two periods
• median distance from the highway, which the location at which there are an equal number of apprehensions closer to and further away from the highway
• standard deviation of distances from the highway, which provides an indication of whether the variation in distances differ between the two periods
0
5
10
15
20
25
1 98
195
292
389
486
583 22
119
216
313
410
507
604
701
798
895
992
1089
1186
67
164
261
358
455
552
649
746
Tumacacori to Clarks Crossing Rd.
Clarks Crossing Rd. to Last Exit Before Ckpt
Last Exit Before Ckpt to Ckpt
Distan
ce From Highw
ay (K
ms)
Incident Number
2009 to April 2010 April 2010 to 2011
0
5
10
15
20
25
1 181
361
541
721
901
1081
93
273
453
633
813
993
1173
1353
1533
1713
1893
2073
2253
2433
2613
2793
2973
3153
3333
3513
3693
Ckpt to First Exit No of Ckpt
First Exit No. of Ckpt to Amado
Distan
ce From Highw
ay (K
ms)
Incident Number
2009 to April 2010 April 2010 to 2011
22
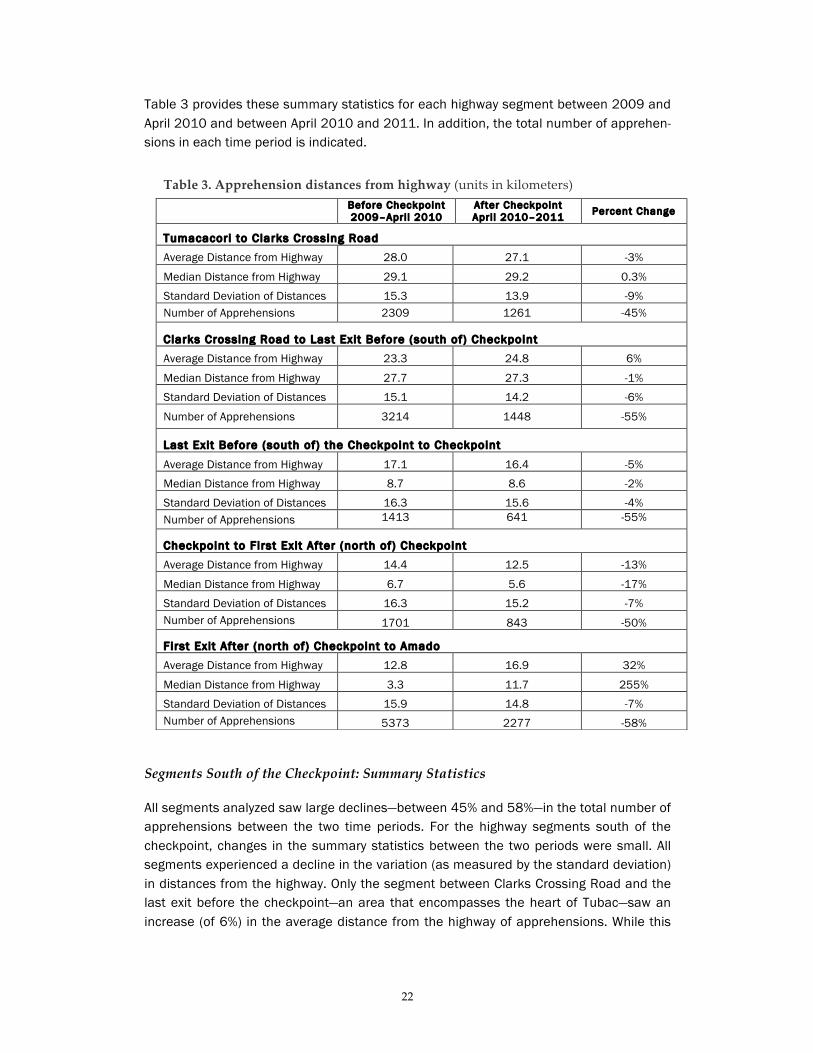
Table 3 provides these summary statistics for each highway segment between 2009 and April 2010 and between April 2010 and 2011. In addition, the total number of apprehen-sions in each time period is indicated.
Segments South of the Checkpoint: Summary Statistics
All segments analyzed saw large declines—between 45% and 58%—in the total number of apprehensions between the two time periods. For the highway segments south of the checkpoint, changes in the summary statistics between the two periods were small. All segments experienced a decline in the variation (as measured by the standard deviation) in distances from the highway. Only the segment between Clarks Crossing Road and the last exit before the checkpoint—an area that encompasses the heart of Tubac—saw an increase (of 6%) in the average distance from the highway of apprehensions. While this
Table 3. Apprehension distances from highway (units in kilometers)
Before Checkpoint 2009–Apri l 2010
After Checkpoint Apri l 2010–2011 Percent Change
Tumacacori to Clarks Crossing Road
Average Distance from Highway 28.0 27.1 -3%
Median Distance from Highway 29.1 29.2 0.3%
Standard Deviation of Distances 15.3 13.9 -9% Number of Apprehensions 2309 1261 -45%
Clarks Crossing Road to Last Exit Before (south of) Checkpoint
Average Distance from Highway 23.3 24.8 6%
Median Distance from Highway 27.7 27.3 -1%
Standard Deviation of Distances 15.1 14.2 -6%
Number of Apprehensions 3214 1448 -55%
Last Exit Before (south of) the Checkpoint to Checkpoint
Average Distance from Highway 17.1 16.4 -5%
Median Distance from Highway 8.7 8.6 -2%
Standard Deviation of Distances 16.3 15.6 -4% Number of Apprehensions 1413 641 -55%
Checkpoint to First Exit After (north of) Checkpoint
Average Distance from Highway 14.4 12.5 -13%
Median Distance from Highway 6.7 5.6 -17%
Standard Deviation of Distances 16.3 15.2 -7% Number of Apprehensions 1701 843 -50%
First Exit After (north of) Checkpoint to Amado
Average Distance from Highway 12.8 16.9 32%
Median Distance from Highway 3.3 11.7 255%
Standard Deviation of Distances 15.9 14.8 -7% Number of Apprehensions 5373 2277 -58%
23
increase in the average distance could indicate an increase in circumvention, additional insight is gained by more detailed analysis of apprehension distances later in this report.
Segments North of the Checkpoint: Summary Statistics
For the segment between the checkpoint and the first exit to its north, the average distance from the highway of all apprehensions fell by 13% from an average of 14.4 kilometers from the highway between all of 2009 and April 2010 to an average of 12.5 kilometers from the highway between April 2010 and all of 2011. The median distance fell by 17% from 6.7 kilometers to 5.6 kilometers during the same period. The segment between the first exit after the checkpoint and Amado, on the other hand, saw the average distance from the highway increase by over 30% between the two periods from 12.8 to 16.9 kilometers and the median distance increased dramatically—255%—from 3.3 to 11.7 kilometers. The highway segments north of the checkpoint are much less densely populated than those to the south of the checkpoint and with fewer affected community members. However, it is important to note that changes in apprehension distance north of the checkpoint quite possibly reflect endpoints of circumvention initiated south of the checkpoint.
Apprehension Corridors According to Distance from the Highway
The above summary statistics provide some insight to shifting patterns of apprehensions within bands along 1-19 relative to the checkpoint. As indicated earlier, the I-19 corridor is located in a valley in a mountainous region of southern Arizona. The San Cayetano Mountains and the Santa Rita Mountains border the valley to the east and the Tumacacori Mountains border it to the west. Most of the communities in the corridor are located within a 5-kilometer band along either side of the highway.
To better understand the proportion of circumvention that occurs near communities, we also examined apprehensions within four east-west corridors: (a) 0 to less than 5 kilometers from each highway segment, (b) 5 to less than 10 kilometers, (c) 10 to less than 20 kilometers, and (d) 20 or more kilometers.
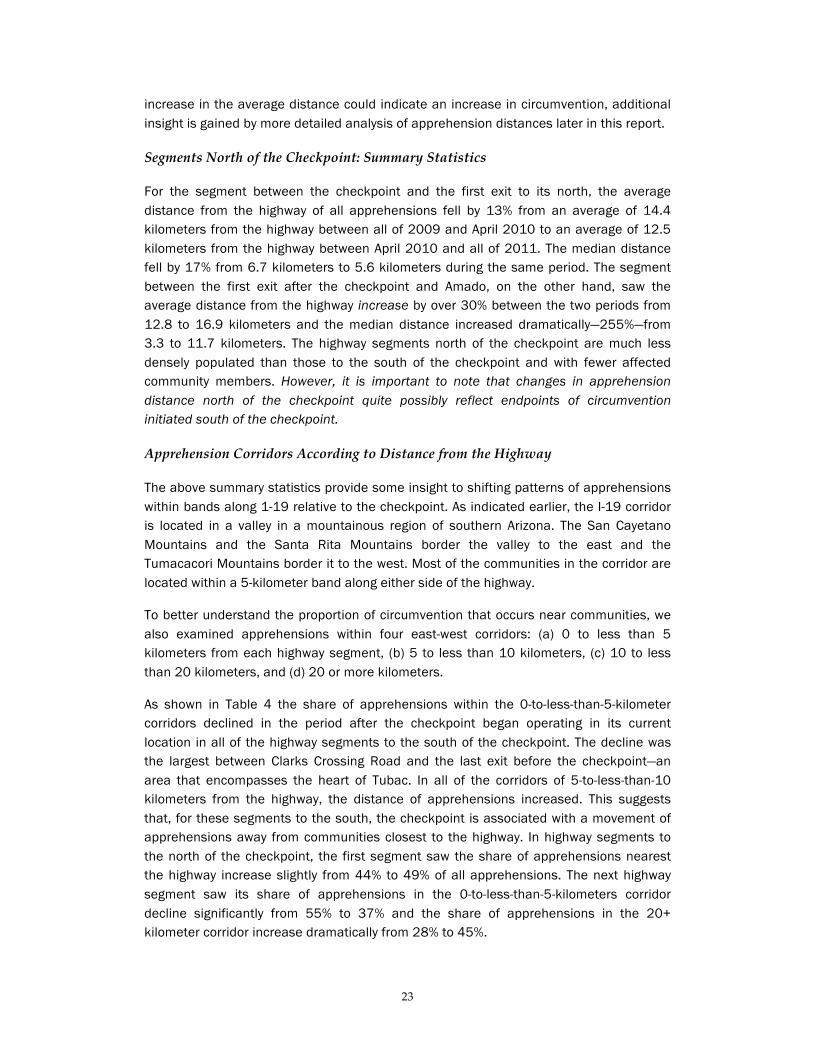
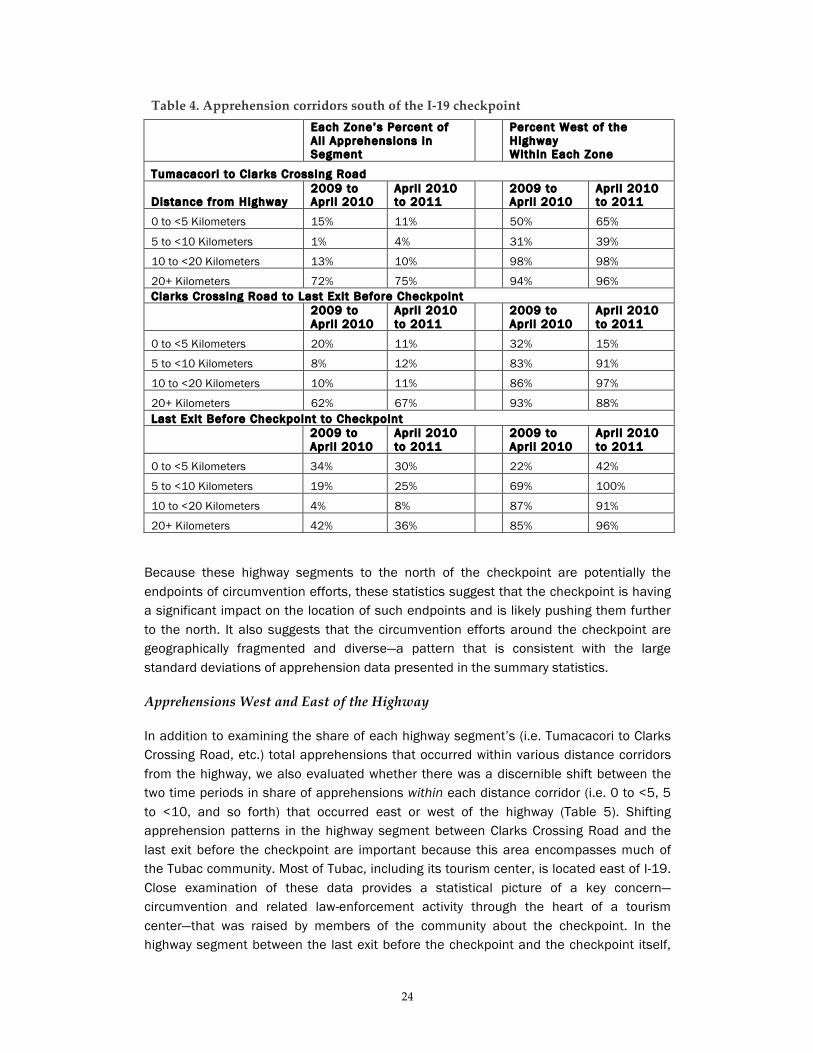
As shown in Table 4 the share of apprehensions within the 0-to-less-than-5-kilometer corridors declined in the period after the checkpoint began operating in its current location in all of the highway segments to the south of the checkpoint. The decline was the largest between Clarks Crossing Road and the last exit before the checkpoint—an area that encompasses the heart of Tubac. In all of the corridors of 5-to-less-than-10 kilometers from the highway, the distance of apprehensions increased. This suggests that, for these segments to the south, the checkpoint is associated with a movement of apprehensions away from communities closest to the highway. In highway segments to the north of the checkpoint, the first segment saw the share of apprehensions nearest the highway increase slightly from 44% to 49% of all apprehensions. The next highway segment saw its share of apprehensions in the 0-to-less-than-5-kilometers corridor decline significantly from 55% to 37% and the share of apprehensions in the 20+ kilometer corridor increase dramatically from 28% to 45%.
24
Because these highway segments to the north of the checkpoint are potentially the endpoints of circumvention efforts, these statistics suggest that the checkpoint is having a significant impact on the location of such endpoints and is likely pushing them further to the north. It also suggests that the circumvention efforts around the checkpoint are geographically fragmented and diverse—a pattern that is consistent with the large standard deviations of apprehension data presented in the summary statistics.
Apprehensions West and East of the Highway
In addition to examining the share of each highway segment’s (i.e. Tumacacori to Clarks Crossing Road, etc.) total apprehensions that occurred within various distance corridors from the highway, we also evaluated whether there was a discernible shift between the two time periods in share of apprehensions within each distance corridor (i.e. 0 to <5, 5 to <10, and so forth) that occurred east or west of the highway (Table 5). Shifting apprehension patterns in the highway segment between Clarks Crossing Road and the last exit before the checkpoint are important because this area encompasses much of the Tubac community. Most of Tubac, including its tourism center, is located east of I-19. Close examination of these data provides a statistical picture of a key concern—circumvention and related law-enforcement activity through the heart of a tourism center—that was raised by members of the community about the checkpoint. In the highway segment between the last exit before the checkpoint and the checkpoint itself,
Table 4. Apprehension corridors south of the I-‐‑19 checkpoint
Each Zone’s Percent of Al l Apprehensions in Segment
Percent West of the Highway Within Each Zone
Tumacacori to Clarks Crossing Road
Distance from Highway 2009 to Apri l 2010
Apri l 2010 to 2011
2009 to Apri l 2010
Apri l 2010 to 2011
0 to <5 Kilometers 15% 11% 50% 65%
5 to <10 Kilometers 1% 4% 31% 39%
10 to <20 Kilometers 13% 10% 98% 98%
20+ Kilometers 72% 75% 94% 96% Clarks Crossing Road to Last Exit Before Checkpoint
2009 to Apri l 2010
Apri l 2010 to 2011
2009 to Apri l 2010
Apri l 2010 to 2011
0 to <5 Kilometers 20% 11% 32% 15%
5 to <10 Kilometers 8% 12% 83% 91%
10 to <20 Kilometers 10% 11% 86% 97%
20+ Kilometers 62% 67% 93% 88% Last Exit Before Checkpoint to Checkpoint
2009 to Apri l 2010
Apri l 2010 to 2011
2009 to Apri l 2010
Apri l 2010 to 2011
0 to <5 Kilometers 34% 30% 22% 42%
5 to <10 Kilometers 19% 25% 69% 100%
10 to <20 Kilometers 4% 8% 87% 91%
20+ Kilometers 42% 36% 85% 96%
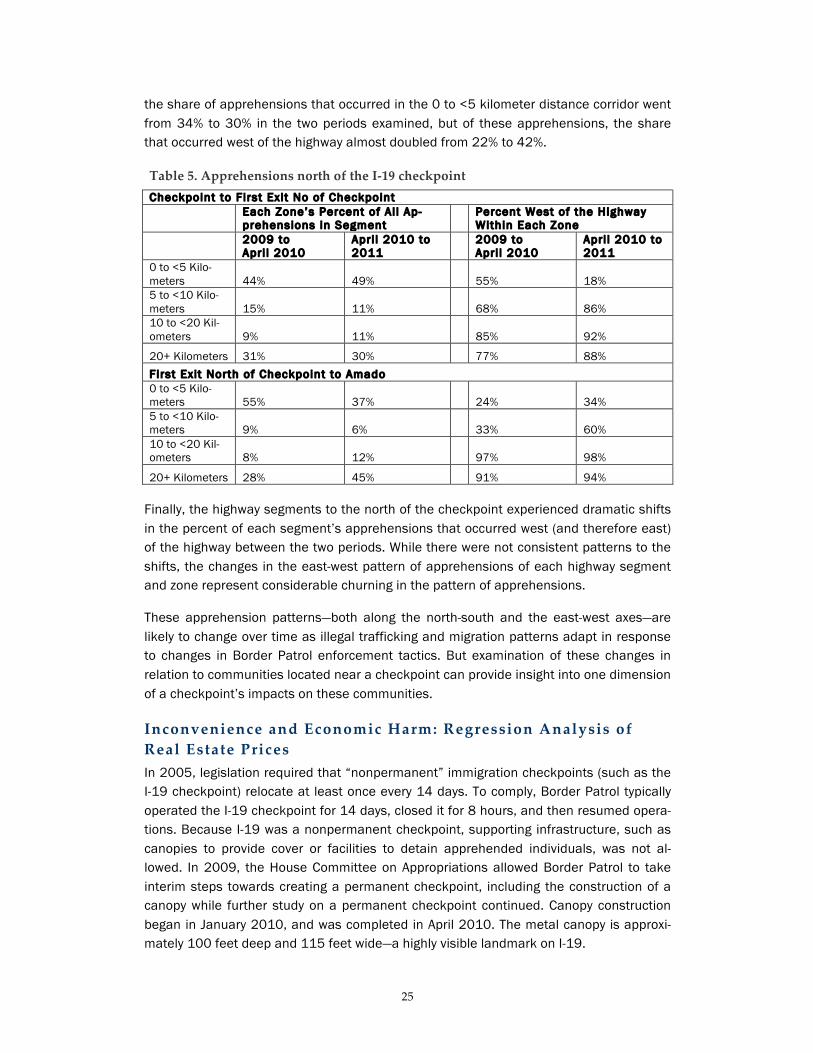
25
the share of apprehensions that occurred in the 0 to <5 kilometer distance corridor went from 34% to 30% in the two periods examined, but of these apprehensions, the share that occurred west of the highway almost doubled from 22% to 42%.
Table 5. Apprehensions north of the I-‐‑19 checkpoint Checkpoint to First Exit No of Checkpoint
Each Zone’s Percent of Al l Ap-prehensions in Segment
Percent West of the Highway Within Each Zone
2009 to Apri l 2010
Apri l 2010 to 2011
2009 to Apri l 2010
Apri l 2010 to 2011
0 to <5 Kilo-meters 44% 49% 55% 18% 5 to <10 Kilo-meters 15% 11% 68% 86% 10 to <20 Kil-ometers 9% 11% 85% 92%
20+ Kilometers 31% 30% 77% 88% First Exit North of Checkpoint to Amado 0 to <5 Kilo-meters 55% 37% 24% 34% 5 to <10 Kilo-meters 9% 6% 33% 60% 10 to <20 Kil-ometers 8% 12% 97% 98%
20+ Kilometers 28% 45% 91% 94% Finally, the highway segments to the north of the checkpoint experienced dramatic shifts in the percent of each segment’s apprehensions that occurred west (and therefore east) of the highway between the two periods. While there were not consistent patterns to the shifts, the changes in the east-west pattern of apprehensions of each highway segment and zone represent considerable churning in the pattern of apprehensions.
These apprehension patterns—both along the north-south and the east-west axes—are likely to change over time as illegal trafficking and migration patterns adapt in response to changes in Border Patrol enforcement tactics. But examination of these changes in relation to communities located near a checkpoint can provide insight into one dimension of a checkpoint’s impacts on these communities.
Inconvenience and Economic Harm: Regression Analysis of Real Estate Prices In 2005, legislation required that “nonpermanent” immigration checkpoints (such as the I-19 checkpoint) relocate at least once every 14 days. To comply, Border Patrol typically operated the I-19 checkpoint for 14 days, closed it for 8 hours, and then resumed opera-tions. Because I-19 was a nonpermanent checkpoint, supporting infrastructure, such as canopies to provide cover or facilities to detain apprehended individuals, was not al-lowed. In 2009, the House Committee on Appropriations allowed Border Patrol to take interim steps towards creating a permanent checkpoint, including the construction of a canopy while further study on a permanent checkpoint continued. Canopy construction began in January 2010, and was completed in April 2010. The metal canopy is approxi-mately 100 feet deep and 115 feet wide—a highly visible landmark on I-19.

26
As stated, numerous community members asserted that the I-19 checkpoint in its current location has had a negative impact on public perceptions, with attendant economic effects, regarding the safety and desirability of living in communities to the south of the checkpoint, and that these impacts include downward pressure on real estate prices above and beyond those associated with general economic conditions. Regression analysis provides insight as to whether there is statistical evidence to support these claims with regard to this particular checkpoint. Note that the results of this multiple regression analysis should not be generalized to other smaller mobile checkpoints operating in less densely populated corridors.
The principal challenge in addressing this question is the fact that a number of complex factors combine to determine real estate prices. For the region of southern Arizona, these factors, among others, include a severe economic downturn that has impacted the real estate market throughout Arizona and the United States; negative fallout from Arizona’s passage of SB1070 (a law intended to curtail illegal immigration); and publicity about violence in Mexico that some fear has made the U.S. border region a more dangerous place to live. As a result of these complexities, rather than trying to explain real estate prices per se, this analysis was formulated to examine differences in prices between Green Valley (north of the checkpoint) and Tubac–Rio Rico (south of the checkpoint). This approach assumes that the broader, “macro-environment” affects these two areas (north and south of the checkpoint) in essentially the same way and allows examination of whether there is statistical evidence to support the proposition that differences in real estate prices in the two areas is due to their respective locations relative to the checkpoint.
The regression analysis was formulated to ask a very specific question: given the complex factors affecting the region’s real estate market, are prices in Green Valley moving differently than those in Tubac–Rio Rico and if so, is there statistical evidence as to why? Price data for individual homes sold in communities north and south of the checkpoint was collected along with information about home attributes. These data were collected between February 2009 and April 2012--before and after the I-19 canopy construction was completed in April 2010. Two residential real estate price indices were constructed: one for Green Valley and a second for Tubac plus Rio Rico. In addition, data on commercial real estate permits was collected from the Santa Cruz County building department.
A regression equation with the following specification was estimated: Tubac–Rio Rico price index =
α (a constant)
+ β1 * (Green Valley Price Index)
+ β2 * (time trend)
+ β3 * (checkpoint dummy variable)
+ β4 * (time trend-checkpoint interaction)
+ β5 * (Tubac commercial real estate permits)

27
The coefficients (βs) in this regression represent the magnitude of the marginal impact on the Tubac–Rio Rico price index14 that results from a unit of change in the associated explanatory variable. By focusing on differences between Green Valley and Tubac–Rio Rico, it was not necessary to model the specific effects on home prices of the economic downturn, of SB1070, or concerns about violence in the border region since these simi-larly affect both subsets of the region’s real estate market. By using the price index for Green Valley as a predictor (explanatory variable) for the price index for Tubac–Rio Rico, the broader drivers of regional prices are, by definition, reflected in the Green Valley price index. This focuses the analysis on factors that are correlated with differences between the two price indexes.
Residential Real Estate Price Indices
The two monthly residential real estate price indices were constructed using the method-ology developed by Professor N. Edward Coulson of the Department of Economics at Penn State University15 and described herein. These indices are the basis of our regres-sion analysis of a possible correlation between the checkpoint and residential real estate prices to its south. The average closing residential real estate prices in Tubac-Rio Rico and in Green Valley, which were used to construct the price indices, are depicted in Fig-ure 10 and the price indices themselves are depicted in Figure 11.
Figure 10. Average Closing Residential Real Estate Prices in Tubac-‐‑Rio Rico and Green Valley, Arizona (February 2009 to April 2012)
14 Price index methodology: For each time period in each region, a linear regression was applied to prices as a func-tion of a property’s real estate characteristics (such as the number of bedrooms, bathrooms, etc.). The coefficients of these regressions provide a measure of how each characteristic was valued in each region at each time period. The characteristics of a benchmark property in each region were then calculated by averaging the characteristics of all houses sold across markets and periods. Once this was completed, the estimated price of this benchmark prop-erty was calculated for each region in each period by multiplying the coefficient values for that period and region by its benchmark characteristics. Once the predicted price for every region and time period of the benchmark property was calculated, it was used to create a price index from a base year—in this case February–April 2009—for each region. When the price index changes by a unit of 1, prices have increased by 1% of the price of the benchmark property in the benchmark period. In this case, the price of the benchmark house in Tubac–Rio Rico in February–April of 2009 was $157400. A 1% change in the index translates to a price change of $1574. 15 Coulson, N. Edward, “Housing Price Index Methodologies,” Department of Economics, Penn State University, Pre-pared for the International Encyclopedia of Housing and Home to be published by Elsevier, Limited. Available at: http://www.econ.psu.edu/~ecoulson/iehh3.pdf.
Average Closing Price ($)
Tubac-Rio Rico
Green Valley
3 Month Period
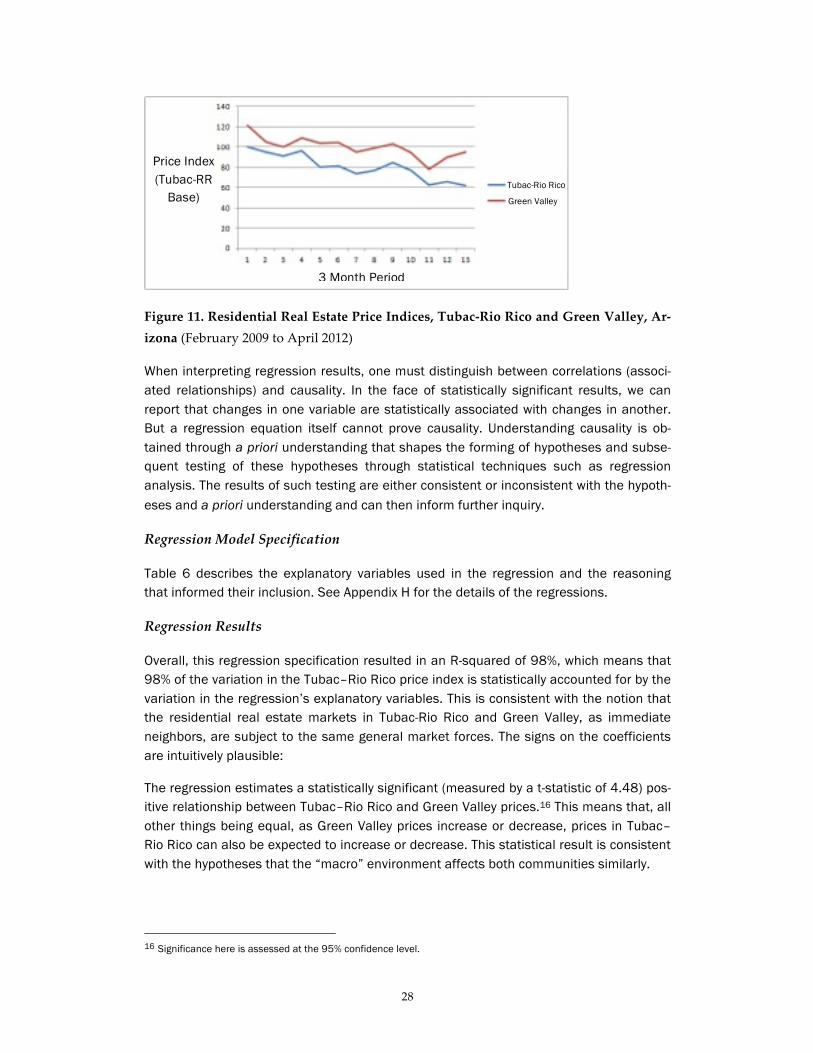
28
Figure 11. Residential Real Estate Price Indices, Tubac-‐‑Rio Rico and Green Valley, Ar-‐‑izona (February 2009 to April 2012)
When interpreting regression results, one must distinguish between correlations (associ-ated relationships) and causality. In the face of statistically significant results, we can report that changes in one variable are statistically associated with changes in another. But a regression equation itself cannot prove causality. Understanding causality is ob-tained through a priori understanding that shapes the forming of hypotheses and subse-quent testing of these hypotheses through statistical techniques such as regression analysis. The results of such testing are either consistent or inconsistent with the hypoth-eses and a priori understanding and can then inform further inquiry.
Regression Model Specification
Table 6 describes the explanatory variables used in the regression and the reasoning that informed their inclusion. See Appendix H for the details of the regressions.
Regression Results
Overall, this regression specification resulted in an R-squared of 98%, which means that 98% of the variation in the Tubac–Rio Rico price index is statistically accounted for by the variation in the regression’s explanatory variables. This is consistent with the notion that the residential real estate markets in Tubac-Rio Rico and Green Valley, as immediate neighbors, are subject to the same general market forces. The signs on the coefficients are intuitively plausible:
The regression estimates a statistically significant (measured by a t-statistic of 4.48) pos-itive relationship between Tubac–Rio Rico and Green Valley prices.16 This means that, all other things being equal, as Green Valley prices increase or decrease, prices in Tubac–Rio Rico can also be expected to increase or decrease. This statistical result is consistent with the hypotheses that the “macro” environment affects both communities similarly.
16 Significance here is assessed at the 95% confidence level.
Tubac-Rio Rico
Green Valley
3 Month Period
Price Index (Tubac-RR
Base)
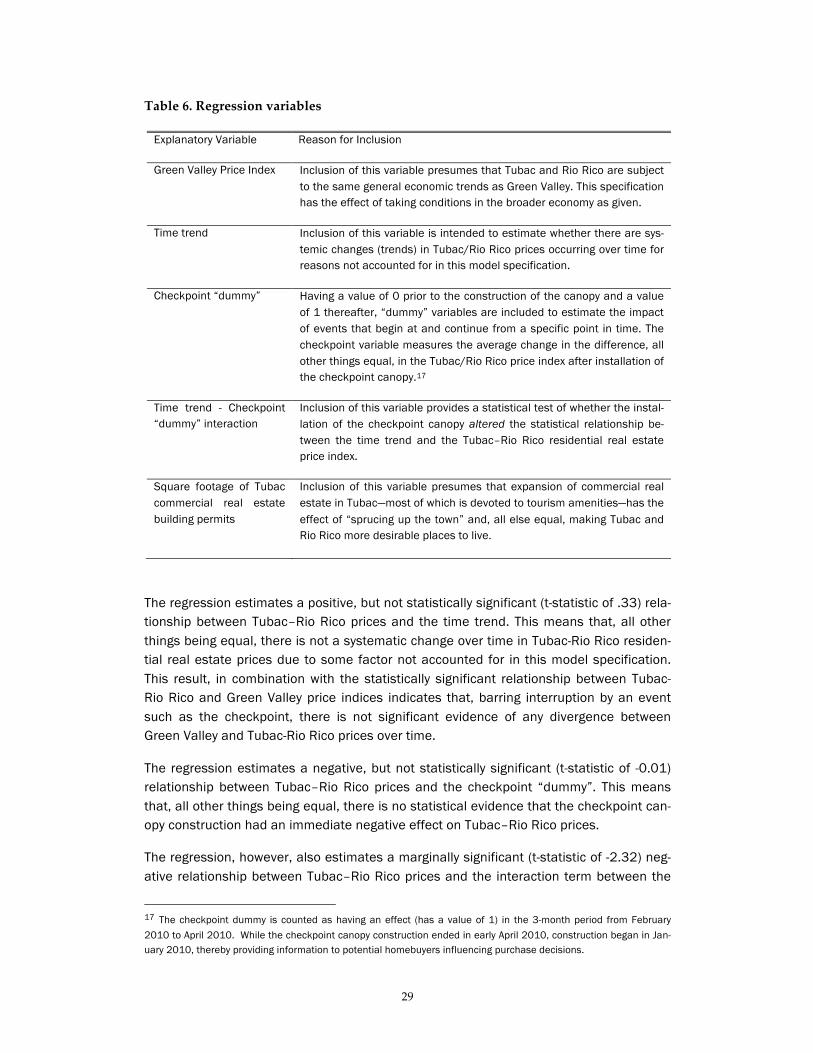
29
Table 6. Regression variables
Explanatory Variable Reason for Inclusion
Green Valley Price Index Inclusion of this variable presumes that Tubac and Rio Rico are subject to the same general economic trends as Green Valley. This specification has the effect of taking conditions in the broader economy as given.
Time trend Inclusion of this variable is intended to estimate whether there are sys-temic changes (trends) in Tubac/Rio Rico prices occurring over time for reasons not accounted for in this model specification.
Checkpoint “dummy” Having a value of 0 prior to the construction of the canopy and a value of 1 thereafter, “dummy” variables are included to estimate the impact of events that begin at and continue from a specific point in time. The checkpoint variable measures the average change in the difference, all other things equal, in the Tubac/Rio Rico price index after installation of the checkpoint canopy.17
Time trend - Checkpoint “dummy” interaction
Inclusion of this variable provides a statistical test of whether the instal-lation of the checkpoint canopy altered the statistical relationship be-tween the time trend and the Tubac–Rio Rico residential real estate price index.
Square footage of Tubac commercial real estate building permits
Inclusion of this variable presumes that expansion of commercial real estate in Tubac—most of which is devoted to tourism amenities—has the effect of “sprucing up the town” and, all else equal, making Tubac and Rio Rico more desirable places to live.
The regression estimates a positive, but not statistically significant (t-statistic of .33) rela-tionship between Tubac–Rio Rico prices and the time trend. This means that, all other things being equal, there is not a systematic change over time in Tubac-Rio Rico residen-tial real estate prices due to some factor not accounted for in this model specification. This result, in combination with the statistically significant relationship between Tubac-Rio Rico and Green Valley price indices indicates that, barring interruption by an event such as the checkpoint, there is not significant evidence of any divergence between Green Valley and Tubac-Rio Rico prices over time.
The regression estimates a negative, but not statistically significant (t-statistic of -0.01) relationship between Tubac–Rio Rico prices and the checkpoint “dummy”. This means that, all other things being equal, there is no statistical evidence that the checkpoint can-opy construction had an immediate negative effect on Tubac–Rio Rico prices.
The regression, however, also estimates a marginally significant (t-statistic of -2.32) neg-ative relationship between Tubac–Rio Rico prices and the interaction term between the
17 The checkpoint dummy is counted as having an effect (has a value of 1) in the 3-month period from February 2010 to April 2010. While the checkpoint canopy construction ended in early April 2010, construction began in Jan-uary 2010, thereby providing information to potential homebuyers influencing purchase decisions.

30
time trend and the checkpoint canopy.18 The coefficient for the time-checkpoint interac-tion term is consistent with the idea that the impact of the checkpoint canopy on Tubac-Rio Rico real estate values became increasingly negative over time. It provides an esti-mate, all other things equal, of how the checkpoint canopy changed time’s effects on Tubac–Rio Rico prices. In this case, the marginally significant negative coefficient is con-sistent with the hypothesis that the checkpoint canopy negatively impacted Tubac–Rio Rico prices relative to Green Valley prices over time. This time-checkpoint interaction var-iable is important. We have noted that there is no statistical evidence of a divergence over time in and of itself between Tubac–Rio Rico and Green Valley prices. This result indicates that the checkpoint canopy is associated with a decline over time in the value of Tubac-Rio Rico prices relative to what they otherwise would have been.
To elaborate, we noted that there is not strong statistical evidence that the checkpoint canopy construction had an immediate impact on Tubac–Rio Rico prices. But the time-checkpoint interaction term provides tentative evidence that a negative divergence over time between Green Valley and Tubac–Rio Rico prices emerged after the canopy’s con-struction. While there could be another causal factor to explain this change, we have not been able to identify what that might be, and the results of this regression are consistent with the hypothesis that the checkpoint canopy is the causal factor.
The regression estimates a positive relationship between Tubac–Rio Rico prices and ex-pansion of commercial square footage in Tubac. This provides statistical evidence that, all else equal, expansion of Tubac’s commercial square footage—this included an expan-sion of the Tubac Center for the Arts, which is an important tourist amenity—has the ef-fect of “sprucing up” the community and making it a more desirable place to live.
Regression Implications for Home Prices
Because this regression uses price indices calculated for benchmark properties, it is necessary to translate what the regression means for actual average residential real es-tate prices in Tubac–Rio Rico. While it is very important not to assign too much precision to the estimates of the individual coefficients, they do provide a gauge of the order of magnitude of the statistical estimate of each variable’s effect relative to the others. With this caveat in mind, the following describes what the various regression variables’ coeffi-cients imply as to their effects on Tubac–Rio Rico prices.
The regression model estimates the effect on Tubac–Rio Rico prices associated with changes in Green Valley prices. The estimated magnitude of that effect is provided by the coefficient, which is estimated by the regression to be 0.475. This is interpreted as meaning that, all other things equal, a change of 1 in the Green Valley price index is as-sociated with a .475 change in the Tubac–Rio Rico price index. The benchmark price, described above, must be used to translate these changes in the price indices to dollar amounts. This is accomplished as follows. The value of the benchmark house (index =
18 The P>|t| of .053 in this regression is above the standard 0.05 cutoff for statistical significance, so the impact should be interpreted cautiously. However, we feel that the finding is strong enough to warrant consideration and further investigation.
31
100) in Tubac–Rio Rico is $157,400 and 1% of this value is $1574. Thus, all other things being equal, change of 1 in the Green Valley price index is associated with an approxi-mate $747 ($1574 x .475) change in the Tubac price index.
The regression estimates the effect on Tubac–Rio Rico prices associated with the pas-sage of time. The magnitude of that effect is provided by the coefficient, estimated by the regression to be 0.299. This means that, all other things equal—including the absence of the checkpoint—during each three-month period, Tubac–Rio Rico prices increased on average by $471 (or $1574 x 0.299). However, the fact that the coefficient is not statis-tically significant indicates that the $471 is not statistically different from $0.
The regression model estimates the effect on Tubac–Rio Rico prices associated with the construction of the checkpoint canopy. The magnitude of that effect is provided by the coefficient, estimated by the regression to be -0.059. This means that an average house declined in value by $92 (= $1574 x -0.059) after the checkpoint canopy construction. However, the fact that this coefficient is not statistically significant indicates that the $92 impact is not statistically different from $0.
The checkpoint-time interaction term causes the regression to estimate whether the checkpoint canopy changes the effect on Tubac–Rio Rico prices associated with the pas-sage of time. In other words, it estimates the difference between the time trend effect after the checkpoint canopy and before the checkpoint canopy. In this case, the magni-tude of the coefficient estimated by the regression is -2.059 and is statistically signifi-cant. This means that, all other things equal, compared to before the checkpoint canopy, the time trend after the checkpoint canopy decreased Tubac–Rio Rico prices by $3240 (= $1572 x -2.059) per three-month period. On net, if one takes into account both the positive impact of time on its own and the negative time-checkpoint interaction, Tubac–Rio Rico prices fell by an average of $2769 (= $3240 - $471) per three-month period after the checkpoint canopy construction. It should be noted that because the 95% con-fidence interval for the regression coefficient crosses zero (-4.145 to 0.035), only tenta-tive statements about the checkpoint’s effect on real-estate prices over time should be made.
The regression model estimates the effect on Tubac–Rio Rico prices associated with the expansion of commercial square footage in Tubac. The magnitude of that effect is pro-vided by the coefficient, estimated by the regression to be 0.002. This means that the average house increased in value by $3 (= $1574 x 0.002) for every square foot of commercial real estate building permit that was granted.
It is important to reiterate that the dollar amounts of the estimates calculated by this re-gression must be interpreted as order-of-magnitude impacts rather than reliable dollar estimates and that they derive from a model using 13 data points. These results must be seen as indicative of impacts and as warranting continued analysis and monitoring. After construction of the checkpoint canopy in April 2010, real estate prices appeared to fall faster in Tubac/Rio Rico than they did in Green Valley. However, these results did not reach the standard statistical levels to make a definitive statement about the check-point’s role in the price decline.
32
Summary and Conclusions
The concerns voiced by members of communities to the south of the permanent I-19 checkpoint with regard to its impacts are, in many instances, difficult to quantify, and perspectives are shaped by a number of factors including distance from the checkpoint. There was, however, quite a bit of consistency in the perspectives of a wide range of individuals—retirees, business and community leaders, law enforcement representatives, individual members of the community, and school officials—with regard to this particular checkpoint as a fixed (as opposed to mobile), permanent structure.
Specifically, there is significant concern about economic harm to communities south of the I-19 checkpoint as a result of it increasing negative perceptions about safety in the region. Circumvention is widely seen as pushing illegal activity and law enforcement activity into communities. The scale and permanence of the current I-19 checkpoint (in contrast to the mobile checkpoints operating in other locations) is widely seen as a nuisance and as creating a militaristic atmosphere that lowers the quality of life for those living to its south.
Analysis of Border Patrol apprehensions data provided a mixed picture of the extent and nature of circumvention patterns associated with the checkpoint. Analysis of real estate price data, however, appears to provide marginally statistically significant evidence of one type of economic harm associated with the checkpoint. While the limited number (13) of observations used to conduct this analysis means that these results must be seen as indicating an impact, the results are strong enough to warrant inclusion in this report.
While the perceived declines in tourism in the region as a result of the current I-19 checkpoint are difficult to quantify, business representatives to the south of the checkpoint who participated in this study were unequivocal in their views that there has been, in fact, a decline in tourism in the region as a result of this checkpoint. Thus, while the full extent of community impacts are difficult to quantify, the nature of these impacts seems fairly clear and the quantitative analysis we were able to perform provides support for some of the concerns expressed by members of communities to the south of the I-19 checkpoint.
Further, because the perceived economic harm relates to factors that exist at other checkpoints—namely inconvenience associated with having to travel through the checkpoint and impacts on a range of types of businesses—these results can be seen as relevant to other checkpoints with large communities between the checkpoint and the U.S. border.
RECOMMENDATIONS
By definition, the nature and magnitude of a checkpoint’s impacts on surrounding communities depends on the location of the checkpoint relative to those communities, the nature of the surrounding terrain, and the nature of the economic activity upon which those communities depend.
33
A checkpoint’s impacts on a community are magnified when the location of the checkpoint places the community between the checkpoint and the U.S. border; when the community’s economic base is dependent on the perceptions of a broader public with regard to safety of the region; and when the surrounding physical terrain shapes circumvention of the checkpoint by those engaged in illegal activity relative to population corridors.
Our analysis identified a variety of promising quantitative measures of a checkpoint’s impacts on surrounding communities, and we recommend that Border Patrol consider regularly examining them. These include:
• Analysis of apprehension data relative to the roads or highways on which a given checkpoint is located, which provides a statistical measure of circumvention activity.
• Analysis of residential real estate prices between a checkpoint and the U.S. border, which provides a statistical indication of the impacts of a checkpoint on residential real estate prices.
• Analysis of local law enforcement referrals to Border Patrol, which provides an additional indication of circumvention activity around a checkpoint. We recommend that Border Patrol consider establishing protocols with local law enforcement for regular, consistent collection of referrals by type and location of incident and that these data be periodically analyzed to identify trends that may be evident in the data.
• Analysis of enforcement activ ity around schools including data on school lock-downs, which provides a measure of circumvention activity specifically affecting children. Such meetings would allow community members to raise concerns, obtain clarifying information, and gain a better understanding of the rationale behind checkpoint operations.
With regard to community impacts we recommend that the Border Patrol;
2.1. Analyze trends in the locations of apprehensions relative to the location of a checkpoint over time.
2.2. Monitor the impacts of a checkpoint on real estate prices through periodic regression analysis using a model specification similar to that included in this report.
2.3. Work with local law enforcement to regularly and consistently collect data on referrals by local police to the Border Patrol, including information on the type and location of criminal activity.
2.4. Work with local school officials to monitor enforcement activity around schools.

34
2.5. Hold periodic meetings with community members to answer questions, receive input, and clarify any points of confusion that may exist with regard to checkpoint operations.
2.6. Conduct a public opinion survey on experiences with the checkpoint, both positive and negative.
2.7. Conduct a case study of apprehension and circumvention activity around a checkpoint that controls for staffing levels in the circumvention zone.

35
3. Performance Models and Measures BACKGROUND
The need for effective checkpoint performance measures has been emphasized by the GAO (2005, 2009, 2012b). In 2006, the Border Patrol established three performance measures to report the results of checkpoint operations: (1) checkpoint drug seizures as a percentage of all Border Patrol seizures, (2) checkpoint apprehensions as a percentage of all Border Patrol apprehensions, and (3) percentage of checkpoint apprehensions that are referred to a U.S. Attorney for criminal prosecution. Information gaps in these performance measures, however, have hindered public accountability (GAO 2009).19
Based on this information gap, the GAO (2009) recommended that the Border Patrol establish milestones for developing a model that compares apprehensions and seizures to the level of illegal activity passing through checkpoints undetected.
As an example of how to address this recommendation, GAO cites Compliance Examination (COMPEX), a U.S. Customs and Border Protection (CPB) program that estimates the total amount of illegal traffic passing through U.S. ports of entry (POE). COMPEX estimates this number by randomly selecting vehicles passing through a POE for more detailed inspection.
Based on the number of violations found using the in-depth inspection, CBP can estimate an interdiction rate.20 In the following section, we propose performance measures that address GAO’s recommendation and are also feasible for the Border Patrol to implement.
METHODOLOGY AND FINDINGS
Based on a review of GAO reports (GAO 2009, 2102a, 2012b) and our discussion with Border Patrol representatives, we compiled a list of requirements for effective checkpoint performance measures. In summary, checkpoint performance measures should:
• Cover the core functions that checkpoints are expected to perform within the defense-in-depth border protection strategy (GAO 2012a; see Appendix B for a description of checkpoint purposes that we observed during our site visits).
• Balance to cover CBP and DHS priorities (GAO 2012a).
19 GAO explains, “The number of seizures or apprehensions bear little relationship to effectiveness because they do not compare these numbers to the amount of illegal activity that passes through undetected. In the absence of this information, the Border Patrol does not know whether seizure and apprehension rates at checkpoints are low or high, and if lower rates are due to ineffective performance, effective deterrence, or a low volume of illegal drugs or aliens passing through a checkpoint” (GAO 2009, 29). 20 In a letter dated August 24, 2009, DHS responded to the feasibility of this suggestion in the following statement: “While a useful model (COMPEX) exists at U.S. ports of entry (POE), this same model cannot be applied at check-points due to the differences in statutory authorities between POEs and checkpoints. POEs have statutory authority to conduct thorough inspection of individuals, personal items, and vehicles. In contrast, at a checkpoint, agents have a lower search authority and probable cause is required to conduct a search on a vehicle, passengers, and all personal items when consent is not given. … Nevertheless, the Border Patrol is committed to exploring the development of a checkpoint model that will allow the Border Patrol to measure the effectiveness of checkpoints” (Department of Homeland Security, 2009, 1).

36
• Be executed within the statutory authority of checkpoints (see Appendix C for a discussion of checkpoint legal restrictions).
• Link and align with measures of other components at successive levels of the organization (GAO 2012a).
• Be consistent with government-wide priorities, such as timeliness, cost efficiency, screening efficiency, and resource adequacy (GAO 2012a; see Appendix D).
• Have an objective and reliable numerical goal (GAO 2012a).
• Allow the Border Patrol to compare apprehensions and drug seizures to the level of illegal activity passing through checkpoints undetected (GAO 2009). If this statistic is unavailable, measures should be indicative of how well checkpoints perform core activities that result in interdicting and deterring illegal activity.
We performed an in-depth review of potential methodologies to estimate illegal flow and evaluate checkpoints (selected methodologies are summarized in Appendix I). We then evaluated how well each methodology fulfilled the requirements for effective checkpoints listed above. The evaluation yielded the following recommendations:
• The most practical, accurate and unbiased approach to get a realistic approximation of the Border Patrol’s ability to detect and deter illegal activity is “red teaming.”
• Input, outcome, process, and efficiency performance measures can be implemented to assess government wide priorities, such as timeliness, cost efficiency, screening efficiency, and resource adequacy.
• The legal and interpersonal treatment of persons crossing through checkpoints can be assessed through red teaming.
We now provide guidance on each of these points in the following sections.
Red Teaming
Ideally, the Border Patrol could calculate the absolute flow of illegal activity passing through a checkpoint undetected to understand and assess checkpoint effectiveness. Since this baseline is unknown and cannot be estimated directly from available data, the Border Patrol must rely on proxy measures of absolute flow and intermediate measures of checkpoint effectiveness.
We found that the best indicator of checkpoint performance is to measure the accuracy rate of the Border Patrol in detecting illegal activity, such as false documents, illicit drugs, and nuclear radiation. The most feasible and reliable method for calculating these accuracy rates is through “red teaming.” Red teaming adheres to all of the requirements for effective checkpoint performance measures.
Definition and Use of Red Teaming
A red team has been defined by DHS as “a group of subject matter experts of various appropriate disciplinary backgrounds who provide an independent peer review of plans and processes; acts as the adversary’s advocate; and knowledgeably role-play the adversary,

37
using a controlled, realistic, interactive process during operations planning, training, and exercising” (Homeland Security Exercise and Evaluation Program, 2007, B-26).
Regarding red teaming, the GAO stated “We are confident that the red team approach provides the Congress with dependable, irrefutable evidence about the actual ability of federal agencies under ‘live’ conditions to deal with security threats and to protect government assets and programs from fraudsters” (GAO 2007, 1).
Red teaming has been successfully deployed in other agencies, including the Federal Aviation Administration (FAA) to test airport security (GAO 2008), the GAO for Forensic Audits and Special Investigations (GAO 2007), the Department of Defense in an Information Assurance Context (NSIAD 1998), and the National Nuclear Security Administration. Border Patrol representatives reported that red teaming is currently used at checkpoints to measure accuracy of issued radiation detectors in detecting radiation.
Red Teaming of Border Patrol Checkpoints
Applying this to a checkpoint context, red teaming would be carried out by actors knowledgeably role-playing the adversary in an attempt to bypass checkpoint security carrying false documents, illegal drugs, radiation (i.e., proxy for nuclear weapons), or other illegal items. The rate at which red team actors are detected at checkpoints will allow the Border Patrol to calculate an interdiction rate for illegal activities.
Red teaming would provide the Border Patrol with valuable information, including: (a) accuracy rates of detecting illegal activities during red teaming, (b) measurable indicators of how resource allocation influences this accuracy rate, (c) objective and quantitative baselines of a checkpoint’s detection accuracy rate to gauge improvement over time, and (d) focused areas of improvement for checkpoint operations (Table 7).
As an intermediate measure to satisfy GAO’s recommendation to “compare apprehensions and seizures to the level of illegal activity passing through the checkpoint undetected” we suggest reporting the red-teaming interdiction rate alongside the number of apprehensions and drug seizures in the DHS annual performance report for program accountability.
We recommend initially deploying red teaming for detecting illegal drugs (e.g., using canines, backscatter machines, and other resources), differentiating between false documents and real ones, and detecting nuclear radiation traces.
In each of these areas, actors would attempt to pass through the checkpoint following known smuggling trends. The Border Patrol can also consider conducting red teaming in the circumvention zones.
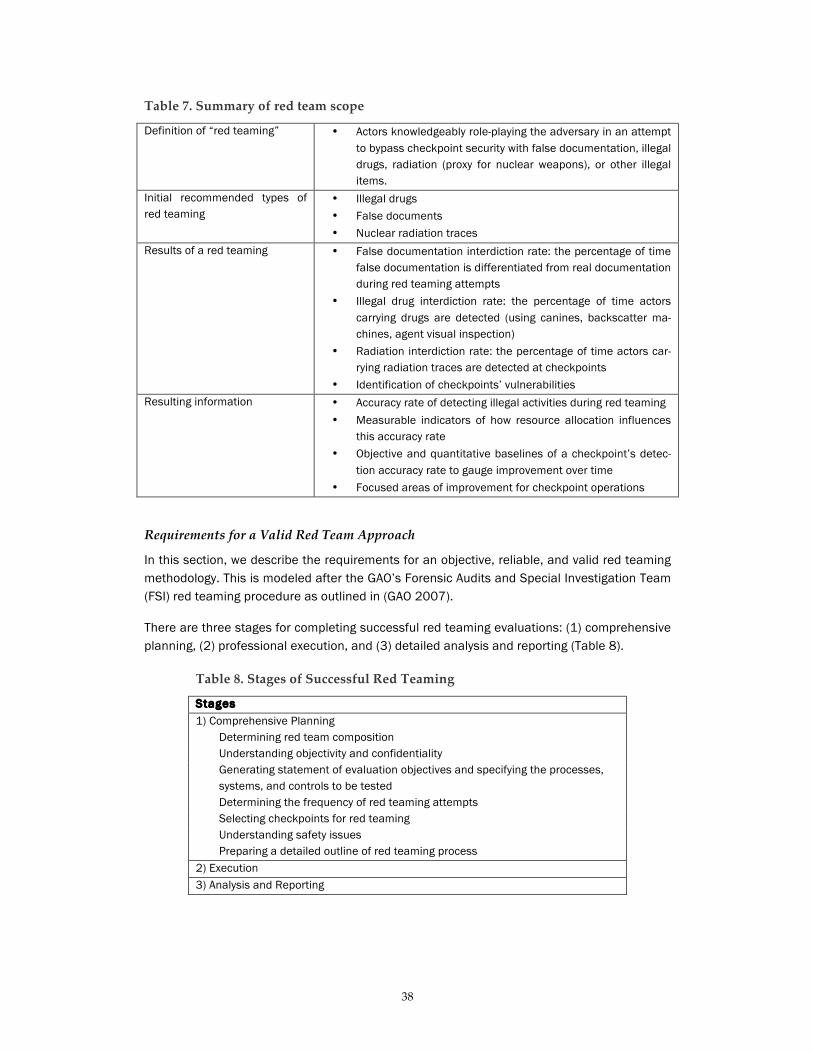
38
Table 7. Summary of red team scope
Definition of “red teaming” • Actors knowledgeably role-playing the adversary in an attempt to bypass checkpoint security with false documentation, illegal drugs, radiation (proxy for nuclear weapons), or other illegal items.
Initial recommended types of red teaming
• Illegal drugs • False documents • Nuclear radiation traces
Results of a red teaming • False documentation interdiction rate: the percentage of time false documentation is differentiated from real documentation during red teaming attempts
• Illegal drug interdiction rate: the percentage of time actors carrying drugs are detected (using canines, backscatter ma-chines, agent visual inspection)
• Radiation interdiction rate: the percentage of time actors car-rying radiation traces are detected at checkpoints
• Identification of checkpoints’ vulnerabilities Resulting information • Accuracy rate of detecting illegal activities during red teaming
• Measurable indicators of how resource allocation influences this accuracy rate
• Objective and quantitative baselines of a checkpoint’s detec-tion accuracy rate to gauge improvement over time
• Focused areas of improvement for checkpoint operations
Requirements for a Valid Red Team Approach
In this section, we describe the requirements for an objective, reliable, and valid red teaming methodology. This is modeled after the GAO’s Forensic Audits and Special Investigation Team (FSI) red teaming procedure as outlined in (GAO 2007).
There are three stages for completing successful red teaming evaluations: (1) comprehensive planning, (2) professional execution, and (3) detailed analysis and reporting (Table 8).
Table 8. Stages of Successful Red Teaming
Stages 1) Comprehensive Planning
Determining red team composition Understanding objectivity and confidentiality Generating statement of evaluation objectives and specifying the processes, systems, and controls to be tested Determining the frequency of red teaming attempts Selecting checkpoints for red teaming Understanding safety issues Preparing a detailed outline of red teaming process
2) Execution 3) Analysis and Reporting
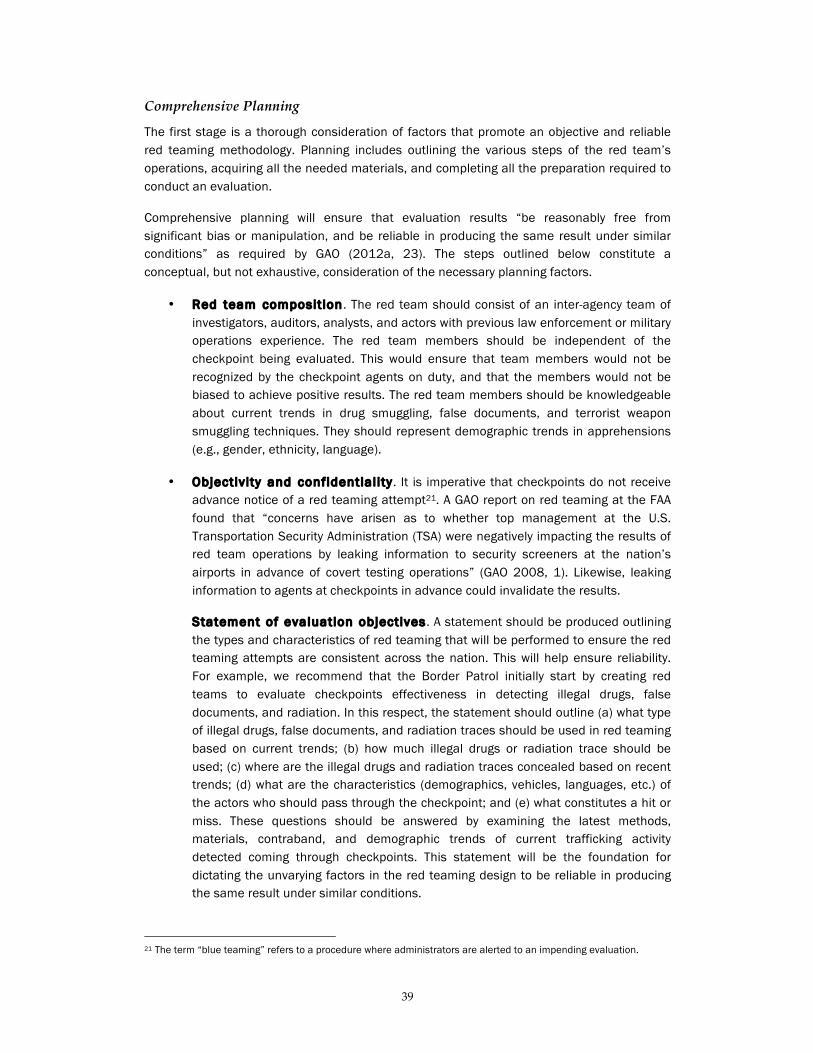
39
Comprehensive Planning
The first stage is a thorough consideration of factors that promote an objective and reliable red teaming methodology. Planning includes outlining the various steps of the red team’s operations, acquiring all the needed materials, and completing all the preparation required to conduct an evaluation.
Comprehensive planning will ensure that evaluation results “be reasonably free from significant bias or manipulation, and be reliable in producing the same result under similar conditions” as required by GAO (2012a, 23). The steps outlined below constitute a conceptual, but not exhaustive, consideration of the necessary planning factors.
• Red team composit ion. The red team should consist of an inter-agency team of investigators, auditors, analysts, and actors with previous law enforcement or military operations experience. The red team members should be independent of the checkpoint being evaluated. This would ensure that team members would not be recognized by the checkpoint agents on duty, and that the members would not be biased to achieve positive results. The red team members should be knowledgeable about current trends in drug smuggling, false documents, and terrorist weapon smuggling techniques. They should represent demographic trends in apprehensions (e.g., gender, ethnicity, language).
• Objectiv ity and confidential i ty . It is imperative that checkpoints do not receive advance notice of a red teaming attempt21. A GAO report on red teaming at the FAA found that “concerns have arisen as to whether top management at the U.S. Transportation Security Administration (TSA) were negatively impacting the results of red team operations by leaking information to security screeners at the nation’s airports in advance of covert testing operations” (GAO 2008, 1). Likewise, leaking information to agents at checkpoints in advance could invalidate the results.
Statement of evaluation objectives. A statement should be produced outlining the types and characteristics of red teaming that will be performed to ensure the red teaming attempts are consistent across the nation. This will help ensure reliability. For example, we recommend that the Border Patrol initially start by creating red teams to evaluate checkpoints effectiveness in detecting illegal drugs, false documents, and radiation. In this respect, the statement should outline (a) what type of illegal drugs, false documents, and radiation traces should be used in red teaming based on current trends; (b) how much illegal drugs or radiation trace should be used; (c) where are the illegal drugs and radiation traces concealed based on recent trends; (d) what are the characteristics (demographics, vehicles, languages, etc.) of the actors who should pass through the checkpoint; and (e) what constitutes a hit or miss. These questions should be answered by examining the latest methods, materials, contraband, and demographic trends of current trafficking activity detected coming through checkpoints. This statement will be the foundation for dictating the unvarying factors in the red teaming design to be reliable in producing the same result under similar conditions.
21 The term “blue teaming” refers to a procedure where administrators are alerted to an impending evaluation.
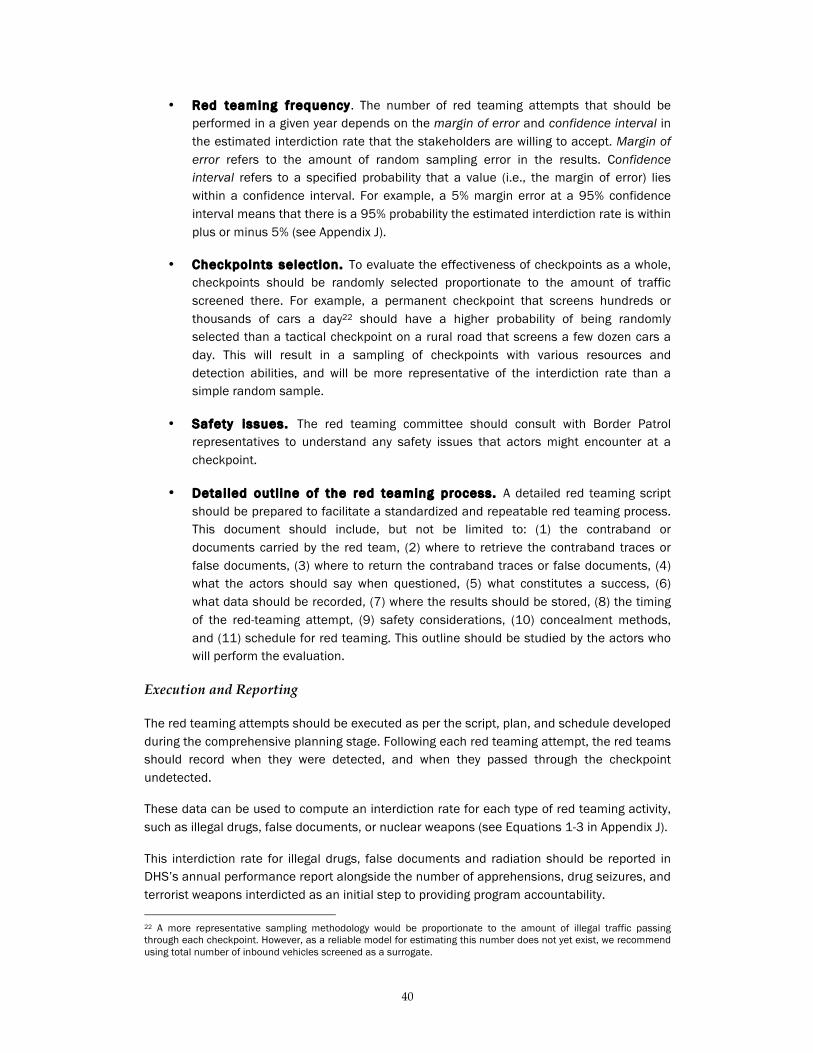
40
• Red teaming frequency. The number of red teaming attempts that should be performed in a given year depends on the margin of error and confidence interval in the estimated interdiction rate that the stakeholders are willing to accept. Margin of error refers to the amount of random sampling error in the results. Confidence interval refers to a specified probability that a value (i.e., the margin of error) lies within a confidence interval. For example, a 5% margin error at a 95% confidence interval means that there is a 95% probability the estimated interdiction rate is within plus or minus 5% (see Appendix J).
• Checkpoints selection. To evaluate the effectiveness of checkpoints as a whole, checkpoints should be randomly selected proportionate to the amount of traffic screened there. For example, a permanent checkpoint that screens hundreds or thousands of cars a day22 should have a higher probability of being randomly selected than a tactical checkpoint on a rural road that screens a few dozen cars a day. This will result in a sampling of checkpoints with various resources and detection abilities, and will be more representative of the interdiction rate than a simple random sample.
• Safety issues. The red teaming committee should consult with Border Patrol representatives to understand any safety issues that actors might encounter at a checkpoint.
• Detai led outl ine of the red teaming process. A detailed red teaming script should be prepared to facilitate a standardized and repeatable red teaming process. This document should include, but not be limited to: (1) the contraband or documents carried by the red team, (2) where to retrieve the contraband traces or false documents, (3) where to return the contraband traces or false documents, (4) what the actors should say when questioned, (5) what constitutes a success, (6) what data should be recorded, (7) where the results should be stored, (8) the timing of the red-teaming attempt, (9) safety considerations, (10) concealment methods, and (11) schedule for red teaming. This outline should be studied by the actors who will perform the evaluation.
Execution and Reporting
The red teaming attempts should be executed as per the script, plan, and schedule developed during the comprehensive planning stage. Following each red teaming attempt, the red teams should record when they were detected, and when they passed through the checkpoint undetected.
These data can be used to compute an interdiction rate for each type of red teaming activity, such as illegal drugs, false documents, or nuclear weapons (see Equations 1-3 in Appendix J).
This interdiction rate for illegal drugs, false documents and radiation should be reported in DHS’s annual performance report alongside the number of apprehensions, drug seizures, and terrorist weapons interdicted as an initial step to providing program accountability. 22 A more representative sampling methodology would be proportionate to the amount of illegal traffic passing through each checkpoint. However, as a reliable model for estimating this number does not yet exist, we recommend using total number of inbound vehicles screened as a surrogate.

41
It can also provide the Border Patrol with several valuable pieces of information, including: measurable indicators of how resource allocation influences this accuracy rate, objective and quantitative baselines of a checkpoint’s detection accuracy rate to gauge improvement over time, and focused areas of improvement for checkpoint operations.
Pass-‐‑Through Rates
In addition to red teaming, we found that pass-through rates and anecdotal intelligence information can also be used to gauge a checkpoint’s effectiveness.
Investigative agencies, such as the Drug Enforcement Administration (DEA), the High Intensity Drug Trafficking Area (HIDTA) Task Force, and others, occasionally track a known drug load, criminal suspect, or other contraband as it passes through a checkpoint. This occurs when the investigative agency has a need, which is articulated to the Border Patrol (usually at the level of assistant chief), for that vehicle to go farther into the United States to further identify other conspirators and/or transshipment locations. In all these circumstances, the investigative agencies will take action on the vehicle to seize the drugs, humans, and/or contraband at a point after the checkpoint.
The investigative agency provides the results of their actions as a courtesy to the Border Patrol. With the concurrence of the investigative agencies, the Border Patrol can analyze intelligence gathered as a result of pass-through operations (e.g., the amount of drugs at distribution centers past the checkpoint) to estimate the amount of illegal traffic passing through a checkpoint undetected.
For example, if an investigative agency finds that a drug distribution center past the checkpoint has 10,000 pounds of drugs, one could use this information to estimate that at least 10,000 pounds of drugs passed through the checkpoint undetected during a given time period.
This statistic can be compared to the amount of drugs seized during that same time period. The important statistic reported can be a number with no details, to respect the investigative process of other agencies.
Input, Outcome, Process, and Efficiency Performance Measures
Checkpoint performance is multi-dimensional and must address government wide priorities, such as timeliness, cost efficiency, screening efficiency, and resource adequacy.
We recommend performance measures that cover these areas, including: input, outcome, process, and efficiency performance measures. These measures were selected based on validated measures implemented elsewhere at DHS, law enforcement agencies, and other government agencies. The measures are outlined below for each category.
Input Performance Measures
Input performance measures can be defined as the following: “A type of performance measure that gauges the level or resources entering a process and the demand or request for services” (Appendix D). In the context of checkpoints, the level of resources needed should be

42
proportionate to the total amount of illegal traffic flow or, if this measure is not available, the total traffic flow can be an appropriate surrogate (GAO 2009).
A non-inclusive list of resources that should be proportionate to the traffic flow include: operating lanes, canines, and secondary inspection areas. Hence, we use these as examples for the Border Patrol to reference in specifying performance measures (for these measures, the lower the ratio, the better):
• traffic flow23 / # of operating lanes
• traffic flow/ # of canines
• traffic flow/ # of secondary inspection areas
Understanding the ratio of traffic flow to the amount of resources helps identify operational strengths and weaknesses in deterring the amount of illegal traffic passing through checkpoints.
For example, a checkpoint that does not have adequate resources in terms of screening lanes, canines, or inspection areas will not be able to screen and detect illegal activity as well as a checkpoint with adequate resources. Hence, the output performance measures can help identify operational deficiencies that will influence subsequent outcome measures.
Outcome Performance Measures
Output performance measures are defined as a type of performance measure that describes the products and services that are produced by a process, and/or gauges the quantity of products or services delivered to customers (Appendix D).
In the context of checkpoints, the most basic form of output is the number of vehicles screened24. To normalize for traffic flow, we recommend that checkpoints report the percentage of vehicles screened for citizenship, drugs (e.g., canine sniffs), and radiation, resulting in the following sample output measures:
• % of passengers screened for citizenship
• % of vehicles screened by canines25 for drugs
• % of vehicles screened for radiation
The percentage of vehicles screened may be indicative of a checkpoint’s operational strengths and weaknesses in deterring the amount of illegal traffic passing through a checkpoint.
23 Ideally, the Border Patrol could estimate the amount of illegal traffic that is attempting to travel on a given path of egress. However, if there is no reliable estimate of this number, we recommend the total traffic flow as a surrogate. 24 We recommend vehicles screened rather than apprehensions or drug seizures because when a checkpoint becomes effective, illegal traffic will attempt to circumvent the checkpoint. Thus, apprehensions and drugs seizures may not be representative of very effective checkpoints’ performance. However, vehicle screening is applicable to all checkpoints. 25 The Border Patrol should define what constitutes a canine sniff. Based on our site visits, the definition of a canine sniff is not consistent.

43
For example, if a checkpoint is constantly “flushing” traffic (i.e., allowing cars to pass through a checkpoint without screening) because the flow exceeds its capacity, this checkpoint likely is less effective in deterring illegal traffic than a checkpoint that does not flush and thus screens nearly 100% of vehicles. According to the Border Patrol, “operating a checkpoint continuously—that is, 24 hours a day, 7 days a week—is key to effective and efficient checkpoint performance” because smugglers and undocumented immigrants monitor flushing or non-operational times (GAO 2005, 5). Hence, the output performance measures can help identify operational deficiencies that will influence subsequent outcome measures.
Process Performance Measures
Process performance measures can be defined as: “A type of performance measure that captures information about the process that transforms inputs into outputs, typically identifying where the causes of problems occur, assist in diagnosing inefficiencies, and help in identifying how to make process improvements” (Appendix D).
These measures indicate how well checkpoints perform according to government-wide priorities of quality and timeliness of service. Two dimensions suggested to us by Border Patrol representatives that are particularly relevant to timeliness include (1) the time taken to process violations and (2) the time vehicles wait to be screened.
Based on feedback in GAO (2009) regarding data quality, we also suggest that the process of data entry be evaluated in terms of quality. Hence, we use these as examples for the Border Patrol to reference in specifying process performance measures:
• The percentage of violations processed within targeted processing times26
• The percentage of vehicles that pass through the checkpoint in less than the targeted maximum wait time
• The percentage of data accurately entered when a violation is recorded
Efficiency Performance Measures
Process performance measures can be defined as the following: “A type of performance measure that tracks the ratio of total outputs or outcomes to total inputs” (Appendix D).
Efficiency measures can tell how well checkpoints perform according to government-wide priorities of cost of service, by comparing the outputs and outcomes to the checkpoint operating and maintenance cost. Based on our previously defined outcome and output measures, we propose the following performance measures to aid the Border Patrol in specifying efficiency performance measures (with lower measures, or ratios, being better):
• Checkpoint operating and maintenance cost / # of vehicles screened
• Checkpoint operating and maintenance cost / (Illegal immigrant interdiction rate27 *100)
• Checkpoint operating and maintenance cost / (Illegal drug interdiction rate28 *100)
26 This measure is comparable to the OFO measure: “Percent of routine referrals with national security implications completed within targeted processing times” 27 Calculated through red teaming

44
These measures allow the Border Patrol to compare the cost-effectiveness of different checkpoints, and checkpoints to different border security efforts. The first measure allows the Border Patrol to evaluate the cost per screening a single vehicle. The second measure allows the Border Patrol to evaluate the cost on average for each percentage point of illegal immigrant interdiction capability. The third measure allows the Border Patrol to evaluate the cost on average for each percentage point of illegal drug interdiction capability.
The end results of these three performance measures is the ability to compare which checkpoints are able to screen vehicles and detect illegal activity most cost effectively.
Interpersonal Treatment of Persons Crossing through Checkpoints
In the “Community Impacts” phase of our study, one of the main issues identified in meetings and key interviews was the treatment by the Border Patrol of people crossing through checkpoints.
The red team approach is well-designed to obtain objective evidence concerning possible racial profiling and disrespectful treatment, without prior assumptions in any direction. This would be useful evidence for operational management and improvement of Border Patrol practices, and would provide a suitable, objective perspective on treatment of individuals at checkpoints.
We recommend that unidentified red teams enter and pass through checkpoints with the following variable characteristics:
• Skin color, hair color, and other bodily appearances that distinguish persons of Mexican origin from persons of European origin (“white”)
• Accent or lack thereof in English
• Apparent social class in terms of vehicle age/appearance and clothing
• Documents designed to examine officer handling, scrutiny, and response
We recommend evaluation of results from such studies and vigorous implementation of any needed improvements. The red teaming methodology should follow the rigorous requirements outlined in Recommendation 3.1 (below).
RECOMMENDATIONS
In summary, our consolidated recommendations include:
3.1. Calculate an interdiction rate of illegal activity through red teaming. Follow guidance provided in this report to ensure valid and reliable red teaming for existing and future attempts, including:
• Determining red team composition
• Maintaining objectivity and confidentiality
• Generating a statement of evaluation objectives
28 Calculated through red teaming

45
• Determining the frequency of red teaming attempts
• Selecting checkpoints for red teaming
• Understanding safety issues
• Preparing a detailed outline for the red teaming process
3.2. Implement input, outcome, process, and efficiency performance measures.
3.3. Evaluate the legal and interpersonal treatment of persons crossing through checkpoints through red teaming.

46
4. Managerial Tool Development BACKGROUND
Proper resource planning and allocation plays an important role in both the construction and operation of checkpoints. The GAO (2009) made two recommendations regarding the need to consider traffic volumes and workforce needs assessments in making resource allocation decisions (see Executive Summary, p. i).
To address these recommendations, we propose that the Border Patrol perform traffic-flow and agent staffing assessments using a simulation such as the one described in this report.
A simulation refers to a computerized imitation of the operation of a real-world process or system over time. For example, the operations of a checkpoint can be simulated by computer, allowing the Border Patrol to assess the resources and staffing needed to meet current and future traffic demands.
A simulation will also allow the Border Patrol to predict how making resource changes to a checkpoint will influence performance measures, as these are gathered during the simulation. Variables such as the number of resources, screening times, rate of referral to secondary, and others can be changed quickly and easily without the time and expense of making changes in the field.
Without simulation tools, Border Patrol management would need to conduct the costly and time consuming process of field experimentation to measure the impact of resource or process changes at checkpoints. Table 9 summarizes the current process without a simulation, and how the simulation can improve the process.
Table 9. Comparison of current and future process of resource planning
Current Process (Without Simulation) Future Process (With Simulation) • Brainstorm potential checkpoint change • Record baseline checkpoint operations
metrics • Plan operational change in the field • Train personnel • Implement change in the field • Record checkpoint operations metrics • Compare metrics • Decide if change should be kept, or if op-
erations should revert to prior practices • If needed, retrain personnel
• Brainstorm potential checkpoint change • Modify simulation to test the change • Compare simulation results to the baseline • Decide if changes warrant implementation in
the field
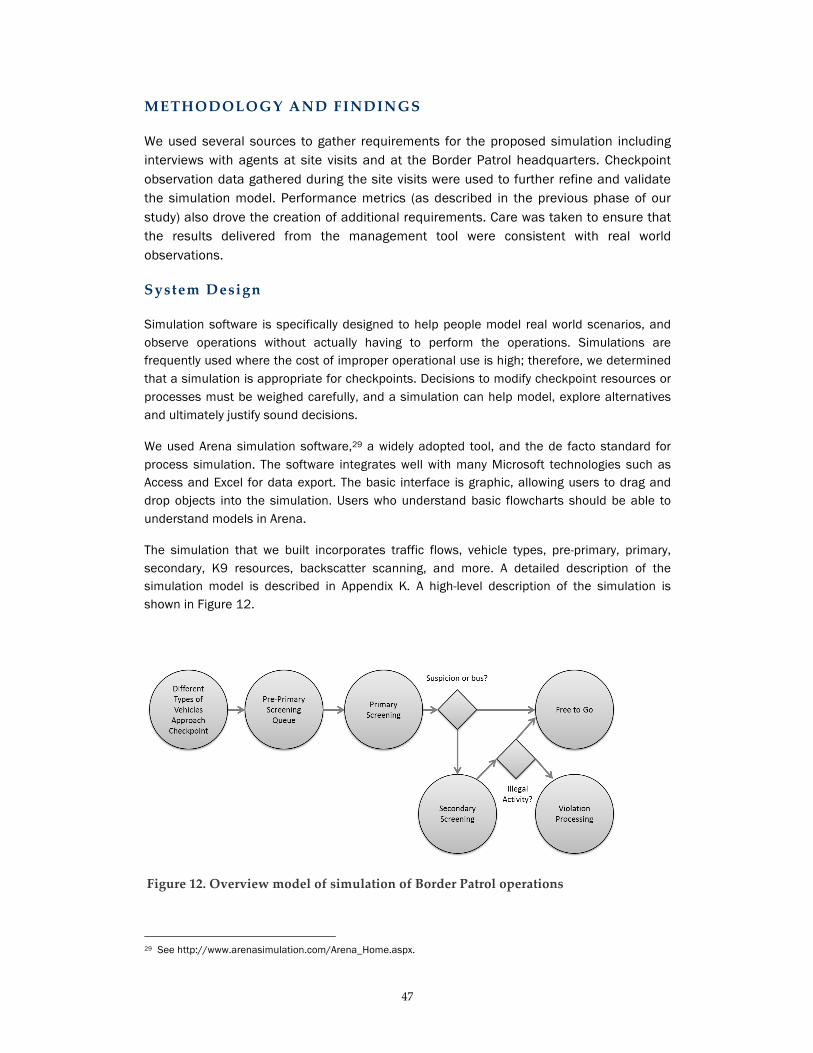
47
METHODOLOGY AND FINDINGS
We used several sources to gather requirements for the proposed simulation including interviews with agents at site visits and at the Border Patrol headquarters. Checkpoint observation data gathered during the site visits were used to further refine and validate the simulation model. Performance metrics (as described in the previous phase of our study) also drove the creation of additional requirements. Care was taken to ensure that the results delivered from the management tool were consistent with real world observations.
System Design
Simulation software is specifically designed to help people model real world scenarios, and observe operations without actually having to perform the operations. Simulations are frequently used where the cost of improper operational use is high; therefore, we determined that a simulation is appropriate for checkpoints. Decisions to modify checkpoint resources or processes must be weighed carefully, and a simulation can help model, explore alternatives and ultimately justify sound decisions.
We used Arena simulation software,29 a widely adopted tool, and the de facto standard for process simulation. The software integrates well with many Microsoft technologies such as Access and Excel for data export. The basic interface is graphic, allowing users to drag and drop objects into the simulation. Users who understand basic flowcharts should be able to understand models in Arena.
The simulation that we built incorporates traffic flows, vehicle types, pre-primary, primary, secondary, K9 resources, backscatter scanning, and more. A detailed description of the simulation model is described in Appendix K. A high-level description of the simulation is shown in Figure 12.
Figure 12. Overview model of simulation of Border Patrol operations
29 See http://www.arenasimulation.com/Arena_Home.aspx.

48
The simulation begins when vehicles are “created” (Figure 13), which corresponds to a vehicle approaching a checkpoint in the real world.
Figure 13. Vehicle creation
For each vehicle, the simulation ends when it is determined either that the vehicle should be detained or that the vehicle is free to go (Figure 14).
Figure 14. Simulation end

49
We modeled several checkpoint processes that reflect the real-world flow of operations: (a) queuing in pre-primary, (b) suspicion by either K9 or document check, (c) secondary screening, (d) backscatter screening, and more (see Appendix L). Actual checkpoint data, such as screening times and vehicle counts can be added to the simulation. In this simulation, the checkpoint being modeled uses data gathered from the I-19 checkpoint and is meant to be used as a guide to model other checkpoints.
To help make the simulation easier to understand, a visualization layer was added to provide a graphical representation of the model. Figure 15 demonstrates a checkpoint with two open primary screening lanes with significant traffic flow. In the simulation, semi-trailer trucks are required to pass through lane 1. Because the trucks are larger and take longer to pass through the checkpoint, more cars are directed to lane 2.
Figure 15. Simulation visualization
In addition to the graphical interface, we created a dashboard of key statistics, including: average wait times, time to clear, and number of arrests. This information is also produced in a final report that is automatically created at the end of a simulation run, but the dashboard provides a quick reference to some of the most important statistics, including:
• Average car wait time
• Average car time to clear
• Average van time to clear
• Total cars processed
• Total arrests
• Total flushing
• Queue length
• Red teaming
50
Example Simulation Results
The simulation is very flexible and can be used to answer many questions. We ran it under several conditions and made significant discoveries (detailed below). It should be noted that these are only examples of what the simulation can do, and are included here to show the type of analysis that can be done.
Red Teaming
In the previous section of our report, we recommend red teaming as a way to help establish a baseline for document violations, drugs, and radiation. However, one potential concern is that additional traffic, and especially additional traffic that should be sent to secondary screening, could have harmful effects on queues and waiting times.
However, when we introduced red teaming attempts of up to 70 cars per week, we found that there was no significant increase in wait times.
Opening a New Primary Screening Lane
Opening a new lane is a costly and time-consuming endeavor. Determining the effects of opening another primary screening lane is important when performing a cost-benefit decision.
The simulation shows that a fourth lane at the I-19 checkpoint would have eliminated most, but not all, flushing during a normal week.
The simulation demonstrates that the major cause of flushing is large numbers of semi-trailer trucks that arrive at the same time. Because trucks are confined to pass through lane 1, opening a fourth screening lane may not alleviate the need for all flushing. Therefore, to eliminate flushing, the simulation shows that process changes (such as allowing trucks to pass through multiple lanes) would need to accompany additional screening lanes.
Increasing the Traffic to Secondary Screening
There are many ways in which checkpoints can increase their effectiveness in detecting illegal activity. By using enhanced sensors or by rotating canines more frequently, it is possible that primary screening agents would be able to increase the detection rate for suspicious activity. However, it is possible that this increased detection ability could impact other areas of the checkpoint negatively by straining other resources.
The simulation shows that increasing the number of cars sent to secondary by .5% will not require additional resources. With this increase, secondary screening agents were not overly taxed, and wait times did not increase significantly.
Sample Summary Statistics
Table 10 summarizes a few statistics across the several scenarios listed above. It should be noted that these are only some of the hundreds of statistics available in the simulation report. These measures were selected since they directly assess potential

51
concerns of implementing these scenarios. The results are for 24 hours of checkpoint operation.
Table 10. Sample Simulation Summary Statistics Baseline Process 10
Red Team Vehicles
Add a 4th Primary
Screening Lane
Increasing traff ic to
secondary by .5%
Max Lane 1 Queue 28 28 19 24
Average Time to Clear: Car (seconds)
15 17 15 14
Average Time to Clear: Van (seconds)
197 197 226 351
Flushes 52 4* 10 18
Total Detained 17 17 22 18*
* Differences due to random variation between runs; not a significant difference
Validation
Based on our observations at checkpoint visits, the results shown in the simulation are consistent with real world checkpoint operations. However, because the simulation is probabilistic, results of the simulation will change slightly between runs. In this way, the simulation accurately reflects real-world patterns because the real-world traffic flows and results also vary slightly. A strategy for dealing with the probabilistic nature of the simulation to ensure that random variation in a single run does not skew the analysis.
As with all abstractions, the simulation does not try to model every checkpoint process in detail. The emphasis is put on the most frequent and time-consuming tasks. A more detailed analysis of what is included in the simulation and the limitations of the model are listed in Appendix M.
Transition Strategy
Documentation
Several types of documentation have been developed to help use and maintain the simulation.
• Appendix K: This explains how a typical user would run the simulation and interpret the output with Arena software.
• Appendix L: Checkpoints are complex, and the simulation does not cover all aspects of a real-world checkpoint. The detailed description in this section describes the checkpoint resources, vehicle types, checkpoint processes, and all other factors that are included in the simulation.
52
• Appendix M: This documentation is provided for Border Patrol personnel who would be in charge of making significant changes to the simulation.
Arena is a popular simulation tool, but there is a learning curve to be able to use it effectively. It is recommended that Border Patrol personnel who will be using or developing the model receive some training in Arena if not already familiar with it.
Future Enhancements
This simulation tool can add immediate value in making managerial decisions. We have identified certain ways in which the tool can be enhanced in order to provide even more value. It is important that Border Patrol management uses the tool in order to identify the most pressing needs and the features that need enhancements. The following is a list of enhancements that may add significant value.
Enhanced Graphical Dashboard
Currently, most of the output of the simulation is in text. While this information is helpful, many users find the animations and graphical representations of the data to be more valuable. Creating user friendly dashboards would also make it possible to get users up to speed on using the tool with less training.
Real-‐‑Time Interventions
Any modifications to checkpoint operations in the simulation must be made in between simulation runs. Having to stop the simulation, make a change, run the simulation, and compare the results can be time consuming. Ideally, we would build the capability to let users modify the simulation in real-time.
For example, if a manager were running the simulation, he or she could close a primary screening lane and observe the impacts of that change. This could be done easily from a graphical user interface, such as by “dragging and dropping” a barricade into a lane of traffic.
Data Integration
The current simulation has traffic flow and agent resource scheduling directly built into the simulation. Any changes to traffic flows or resource scheduling have to be done inside the simulation itself.
In the future, it may be possible to link the simulation to real-time data sources so that the simulation can be kept up to date automatically.
Personal Radiation Detection Device Processes
Agents may carry personal radiation detection devices. Responding to alerts and clearing the devices can be a time consuming processes that agents carry out 5–10 times per day. This process is not currently modeled. In the future, this can be added to the simulation.

53
RECOMMENDATIONS
4.1. Adopt a checkpoint simulation model, such as the one described in this report, to:
• Analyze current and expected traffic volumes to determine the number of inspection lanes at new permanent checkpoints;
• Conduct workforce planning needs assessment for checkpoint staffing allocations; and
• Perform faster, easier, and more accurate analysis of checkpoint operations.
54
Conclusion This report addresses the recommendations made in GAO’s 2009 report (GAO-09-824).
Specifically, it provides recommendations that will aid the Border Patrol in (a) continuing to improve the consistency, accuracy, integrity, and completeness of data in the e3 and CAR module systems, (b) better assessing the impact of checkpoints on surrounding communities, (c) evaluating the performance of checkpoints in detecting and deterring illegal activity, and (d) making more informed resource allocation decisions.
Based on the findings in this report, we offer several areas where additional research would be beneficial. These recommendations are outlined below.
Data Integrity and Quality
• Design new e3 and CAR module user interfaces to address our findings regarding data entry controls, flow and method of data entry, and programming logic to automate data entry where applicable.
• Develop new continuous training modules for Border Patrol agents to reinforce the importance of data quality and of the need to enter data consistently.
Community Impacts
• Analyze trends in the locations of apprehensions relative to the location of a checkpoint over time.
• Monitor the impacts of a checkpoint on real estate prices through periodic regression analysis using a model similar to that included in this report.
• Work with local law enforcement to regularly and consistently collect data on referrals by local police to the Border Patrol, including information on the type and location of criminal activity.
• Conduct a public opinion survey on experiences with the checkpoint, both positive and negative.
• Conduct a case study of apprehension and circumvention activity around a checkpoint that controls for staffing levels in the circumvention zone.
Performance Models and Measures
• Assist the Border Patrol in developing and implementing a red teaming methodology for calculating an interdiction rate for false documents, illegal drugs, and nuclear radiation. The methodology would provide detailed guidance for a valid and reliable red team, as outlined in this report. If red teaming is

55
implemented at checkpoints, further research can analyze the data collected to identify areas of improvement for checkpoint operations.
Managerial Tools
• Adopt a checkpoint simulation model, such as the one described in this report, to: (a) analyze current and expected traffic volumes to determine the number of inspection lanes at new permanent checkpoints; (b) conduct workforce planning needs assessment for checkpoint staffing allocations; and (c) perform faster, easier, and more accurate analysis of checkpoint operations.
56
References Bean, F. D. (1990). Post-IRCA changes in the volume and composition of undocumented
migration to the United States: an assessment based on apprehensions data: Urban Institute.
Bean, F. D., Corona, R., Tuirán, R., & Woodrow-Lafield, K. A. (1998). The quantification of migration between Mexico and the United States. Migration between Mexico and the United States, binational study, 1, 1-90.
Chapman, L. F. (1976). Illegal aliens: Time to call a halt! Reader's Digest, 109, 188-192.
Costanzo, J. M. (2002). Evaluating components of international migration. The residual foreign born. Washington, DC: Population Division, U.S. Census Bureau.
Department of Homeland Security (2009). [Comments from the Department of Homeland Security].
Espenshade, T. J. (1995). Using INS Border Apprehension Data to Measure the Flow of Undocumented Migrants Crossing the U.S.-Mexico Frontier. International Migration Review, 29(2), 545-565.
Frisbie, P. (1975). Illegal Migration from Mexico to the United States: A Longitudinal Analysis. International Migration Review, 9(1), 3-13.
GAO-05-435. (2005). Available Data on Interior Checkpoints Suggest Differences in Sector Performance: U.S. Government Accountability Office.
GAO-08-286T. (2007). Use of Covert Testing to Identify Security Vulnerabilities and Fraud, Waste, and Abuse.
GAO-08-958. (2008). TSA Has Developed a Risk-Based Covert Testing Program, but Could Better Mitigate Aviation Security Vulnerabilities Identified Through Covert Tests: United States Government Accountability Office.
GAO-09-824. (2009). Checkpoints Contribute to Border Patrol's Mission, but More Consistent Data Collection and Performance Measurement Could Improve Effectiveness (pp. 138).
GAO-12-688T. (2012). Progress and Challenges in Implementation and Assessment Efforts: United States Government Accountability Office.
GAO-13-25. (2012). Key Elements of New Strategic Plan Not Yet in Place to Inform Border Security Status and Resource Needs: United States Government Accountability Office.
Garcia y Griego, M. (1980). El volumen de la migracion de Mexicanos no documentados a los Estados Unidos: Nuevas hipotesis. CENIET Studies. Mexico, DF: Centro Nacional de Informaci6n y Estadisticas del Trabajo, Secretaria de Trabajo y Prevision Social.

57
Grimes, M., E. Golob, A. Durcikova, and J. Nunamaker. 2013. Reasons and Resolve to Cross the Line: A Post-Apprehension Study of Undocumented Immigrants Along the U.S.-Mexico Border. Tucson: National Center for Border Security and Immigration.
Heer, D. M. (1979). What is the annual net flow of undocumented Mexican immigrants to the United States? Demography, 16(3), 417-423.
Homeland Security Exercise and Evaluation Program. (2007). HSEEP Overview and Exercise Program Management (Vol. 1): Homeland Security.
Meissner, D., Kerwin, D. M., Chishti, M. & Bergeron, C. (2013). Immigration Enforcement in the United States: A rise of a formidable Machinery. Migration Policy Institute.
Morral, A. R., Willis, H. H., & Brownell, P. (2011). Measuring Illegal Border Crossing Between Ports of Entry: An Assessment of Four Promising Methods: RAND.
North, D. S. (1975). Illegal Aliens: Final Report Outlining a Rationale for and a Preliminary Design of a Study of the Magnitude, Distribution, Flow, Characteristics and Impacts of Illegal Aliens in the United States. Contract J-LEAA-015-75 awarded by LEAA, US Department of Justice, Washington, DC: Linton and Company, 1-3.
NSIAD-98-132R. (1998). DOD's Information Assurance Efforts: U.S. Government Accountability Office.
Passel, J. S. (2005). Estimates of the Size and Characteristics of the Undocumented Population: Pew Hispanic Center Washington D.C.
Siegel, J. S., Passel, J. S., & Robinson, J. G. (1980). Preliminary Review of existing studies of the number of illegal residents in the United States: US Dept. of Commerce, Bureau of the Census.
U.S. Border Patrol. (2012). 2012-2016 Border Patrol Strategic Plan - Interactive Version.
U.S. Customs and Border Protection. (2012). 2012-2016 Border Patrol Strategic Plan.
U.S. Department of Homeland Security, B. o. C. a. B. P. (2005). National Border Patrol Strategy.
Wang, R. Y., Storey, V. C., & Firth, C. P. (1995). A framework for analysis of data quality research. Knowledge and Data Engineering. IEEE Transactions on Knowledge and Data Engineering, 7(4), 623-640.