chelmsford city council gypsy and traveller accommodation
TRANSCRIPT
Chelmsford City Council
Gypsy and Traveller Accommodation
Assessment
Need Summary Report
January 2017
Chelmsford City Council GTAA Need Summary – January 2017
Page 2
Opinion Research Services The Strand, Swansea SA1 1AF
Steve Jarman, Claire Thomas and Ciara Small
Enquiries: 01792 535300 · [email protected] · www.ors.org.uk
© Copyright January 2017
Contains public sector information licensed under the Open Government Licence v3.0
Contains OS data © Crown Copyright (2014)
Chelmsford City Council GTAA Need Summary – January 2017
Page 3
Contents
1. Introduction ................................................................................................................................... 5
The Planning Definition in PPTS (2015) ..................................................................................................... 5
Definition of Travelling .............................................................................................................................. 6
2. Methodology .................................................................................................................................. 8
Background ................................................................................................................................................ 8
Desk-Based Review .................................................................................................................................... 8
Survey of Travelling Communities ............................................................................................................. 8
Timing of the Fieldwork ............................................................................................................................. 9
Engagement with Bricks and Mortar Households ..................................................................................... 9
Supply of Pitches ..................................................................................................................................... 10
Current Need ........................................................................................................................................... 10
Future Need ............................................................................................................................................. 11
Pitch Turnover ......................................................................................................................................... 11
Transit Provision ...................................................................................................................................... 12
3. Planning Definition ....................................................................................................................... 13
Applying the Planning Definition ............................................................................................................. 13
Unknown Households .............................................................................................................................. 14
Households that do not meet the Planning Definition ........................................................................... 15
4. Survey of Travellers ...................................................................................................................... 16
Interviews with Gypsies, Travellers and Travelling Showpeople ............................................................ 16
Current and Future Pitch Provision ......................................................................................................... 17
Planning Definition .................................................................................................................................. 17
New Household Formation Rates ............................................................................................................ 17
Breakdown by 5 Year Bands .................................................................................................................... 19
Applying the Planning Definition ............................................................................................................. 19
Travelling Status of Households .............................................................................................................. 19
Bricks and Mortar Interviews .................................................................................................................. 20
Pitch Needs – Gypsies and Travellers that meet the Planning Definition ............................................... 20
Pitch Needs – Unknown Gypsies and Travellers ..................................................................................... 21
Waiting Lists............................................................................................................................................. 22
Chelmsford City Council GTAA Need Summary – January 2017
Page 4
Plot Needs – Travelling Showpeople that meet the Planning Definition ................................................ 22
Plot Needs – Unknown Travelling Showpeople ....................................................................................... 23
Transit Requirements .............................................................................................................................. 24
DCLG Caravan Count ................................................................................................................................ 24
Stakeholder Interviews and Local Data ................................................................................................... 25
Potential Implications of PPTS (2015) ..................................................................................................... 25
Transit Recommendations ....................................................................................................................... 25
Conclusions .................................................................................................................................................. 26
Gypsies and Travellers ............................................................................................................................. 26
Travelling Showpeople ............................................................................................................................ 26
Transit Provision ...................................................................................................................................... 26
Summary of Need to be Addressed ......................................................................................................... 27
Appendix A – Unknown and Non-Travelling Need ................................................................................. 28
Appendix B – ORS Technical Note on Household Formation and Growth Rates ...................................... 31
Chelmsford City Council GTAA Need Summary – January 2017
Page 5
1. Introduction 1.1 The primary objective of the Chelmsford City Council Gypsy and Traveller Accommodation Assessment
(GTAA) is to provide a robust revised assessment of current and future need for Gypsy, Traveller and
Travelling Showpeople accommodation for the period 2016-2033.
1.2 The primary reason for completing the update was the publication of a revised version of Planning Policy
for Traveller Sites (PPTS) in August 2015. This included a change to the definition of Travellers for planning
purposes. The key change that was made was the removal of the term persons…who have ceased to travel
permanently, meaning that those who have ceased to travel permanently will not now fall under the
planning definition of a Traveller for the purposes of assessing accommodation need in a GTAA (see
Paragraph 1.6 for the full definition).
1.3 The study will provide an evidence base to enable the Council to assess and meet the needs of the
Travelling Community as well as complying with their requirements towards Gypsies, Travellers and
Travelling Showpeople under the Housing Act 1985, the National Planning Policy Framework (NPPF) 2012,
Planning Practice Guidance (PPG) 2014, PPTS (2015), and the Housing and Planning Act 2016. It also
provides an evidence base which can be used to support Local Plan policies.
1.4 The baseline date for the study is September 2016.
1.5 The Chelmsford City Council GTAA is part of a wider study that covers the whole of Essex, together with
Southend-on-Sea and Thurrock. The study across all 14 local authorities has been completed following the
same methodology and has the same baseline date. Due to the complexity of this wider Essex study the
data processing and analysis has not been completed in some areas so the overall report has not been
completed. However the fieldwork and analysis has been completed for Chelmsford City Council and a final
assessment of need has been undertaken. Therefore the purpose of this Need Summary is to provide the
Council with a summary of the levels of need for Chelmsford City Council for the period 2016-2033.
The Planning Definition in PPTS (2015)
1.6 For the purposes of the planning system, the definition was changed in PPTS (2015). The new definition is
set out in Annex 1 and states that:
For the purposes of this planning policy “gypsies and travellers” means:
Persons of nomadic habit of life whatever their race or origin, including such persons who on
grounds only of their own or their family’s or dependants’ educational or health needs or old age
have ceased to travel temporarily, but excluding members of an organised group of travelling
showpeople or circus people travelling together as such.
In determining whether persons are “gypsies and travellers” for the purposes of this planning policy,
consideration should be given to the following issues amongst other relevant matters:
a) Whether they previously led a nomadic habit of life.
b) The reasons for ceasing their nomadic habit of life.
Chelmsford City Council GTAA Need Summary – January 2017
Page 6
c) Whether there is an intention of living a nomadic habit of life in the future, and if so, how soon
and in what circumstances.
For the purposes of this planning policy, “travelling showpeople” means:
Members of a group organised for the purposes of holding fairs, circuses or shows (whether or not
travelling together as such). This includes such persons who on the grounds of their own or their
family’s or dependants’ more localised pattern of trading, educational or health needs or old age
have ceased to travel temporarily, but excludes Gypsies and Travellers as defined above.
(Planning Policy for Traveller Sites, Department for Communities and Local Government (DCLG),
August 2015)
1.7 The key change that was made to both definitions was the removal of the term persons…who have ceased
to travel permanently, meaning that those who have ceased to travel permanently will not now fall under
the planning definition of a Traveller for the purposes of assessing accommodation need in a GTAA.
Definition of Travelling
1.8 One of the most important questions that GTAAs will need to address in terms of applying the planning
definition is what constitutes travelling? This has been determined through case law that has tested the
meaning of the term ‘nomadic’ as well as other travelling characteristics.
1.9 R v South Hams District Council (1994) – defined Gypsies as “persons who wander or travel for the purpose
of making or seeking their livelihood (not persons who travel from place to place without any connection
between their movements and their means of livelihood.)” This includes ‘born’ Gypsies and Travellers as
well as ‘elective’ Travellers such as New Age Travellers.
1.10 In Maidstone BC v Secretary of State for the Environment and Dunn (2006), it was held that a Romany
Gypsy who bred horses and travelled to horse fairs at Appleby, Stow-in-the-Wold and the New Forest,
where he bought and sold horses, and who remained away from his permanent site for up to two months
of the year, at least partly in connection with this traditional Gypsy activity, was entitled to be accorded
Gypsy status.
1.11 In Greenwich LBC v Powell (1989), Lord Bridge of Harwich stated that a person could be a statutory Gypsy
if he led a nomadic way of life only seasonally.
1.12 The definition was widened further by the decision in R v Shropshire CC ex p Bungay (1990). The case
concerned a Gypsy family that had not travelled for some 15 years in order to care for its elderly and infirm
parents. An aggrieved resident living in the area of the family’s recently approved Gypsy site sought judicial
review of the local authority’s decision to accept that the family had retained their Gypsy status even
though they had not travelled for some considerable time. Dismissing the claim, the judge held that a
person could remain a Gypsy even if he or she did not travel, provided that their nomadism was held in
abeyance and not abandoned.
1.13 That point was revisited in the case of Hearne v National Assembly for Wales (1999), where a traditional
Gypsy was held not to be a Gypsy for the purposes of planning law as he had stated that he intended to
abandon his nomadic habit of life, lived in a permanent dwelling and was taking a course that led to
permanent employment.
Chelmsford City Council GTAA Need Summary – January 2017
Page 7
1.14 Wrexham County Borough Council v National Assembly of Wales and Others (2003) determined that
households and individuals could continue to lead a nomadic way of life with a permanent base from which
they set out from and return to.
1.15 The implication of these rulings in terms of applying the planning definition is that it will only include those
who travel (or have ceased to travel temporarily) for work purposes and in doing so stay away from their
usual place of residence. It can include those who have a permanent site or place of residence, but that it
will not include those who travel for purposes other than work – such as visiting horse fairs and visiting
friends or relatives. It will not cover those who commute to work daily from a permanent place of
residence.
1.16 It will also be the case that a household where some family members travel for nomadic purposes on a
regular basis, but where other family members stay at home to look after children in education, or other
dependents with health problems etc. the household unit would be defined as travelling under the
planning definition.
1.17 Households will also fall under the planning definition if they can demonstrate that they have ceased to
travel temporarily as a result of their own or their family’s or dependants’ educational or health needs or
old age. In order to have ceased to travel temporarily these households will need to demonstrate that they
have travelled in the past. In addition households may also have to demonstrate that they plan to travel
again in the future.
1.18 This approach was endorsed by a Planning Inspector in a recent Decision Notice for an appeal in East
Hertfordshire (Appeal Ref: APP/J1915/W/16/3145267). A summary can be seen below.
Case law, including the R v South Hams District Council ex parte Gibb (1994) judgment referred to
me at the hearing, despite its reference to ‘purposive activities including work’ also refers to a
connection between the travelling and the means of livelihood, that is, an economic purpose. In
this regard, there is no economic purpose… This situation is no different from that of many
landlords and property investors or indeed anyone travelling to work in a fixed, pre-arranged
location. In this regard there is not an essential connection between wandering and work… Whilst
there does appear to be some connection between the travel and the work in this regard, it seems
to me that these periods of travel for economic purposes are very short, amounting to an
extremely small proportion of his time and income. Furthermore, the work is not carried out in a
nomadic manner because it seems likely that it is done by appointment… I conclude, therefore,
that XX does not meet the definition of a gypsy and traveller in terms of planning policy because
there is insufficient evidence that he is currently a person of a nomadic habit of life.
Chelmsford City Council GTAA Need Summary – January 2017
Page 8
2. Methodology Background
2.1 Over the past 10 years, ORS has continually refined a methodology for undertaking robust and defensible
GTAAs. This has been updated in light of the introduction of the PPG in 2014, changes to PPTS in August
2015 and the Housing and Planning Act in 2016, as well as responding to changes set out by Planning
Ministers, with particular reference to new household formation rates. This is an evolving methodology
that has been adaptive to changes in planning policy as well as the outcomes of Local Plan Examinations
and Planning Appeals.
2.2 PPTS (2015) contains a number of requirements for local authorities which must be addressed in any
methodology. This includes the need to pay particular attention to early and effective community
engagement with both settled and traveller communities (including discussing travellers’ accommodation
needs with travellers themselves); identification of permanent and transit site accommodation needs
separately; working collaboratively with neighbouring local planning authorities; and establishing whether
households fall within the planning definition for Gypsies, Travellers and Travelling Showpeople.
2.3 The approach currently used by ORS was considered in April 2016 by the Planning Inspector for the
Gloucester, Cheltenham and Tewkesbury Joint Core Strategy who concluded:
‘The methodology behind this assessment included undertaking a full demographic study of all
occupied pitches, interviewing Gypsy and Traveller households, including those living in bricks
and mortar accommodation, and considering the implications of the new Government policy.
On the evidence before me, I am satisfied that the assessment has been appropriately carried
out, and there is no reason for me to dispute the figures.’
2.4 The stages of the methodology that was used to complete this study are set out below. More information
on each stage will be provided in the full report for the Essex Planning Officers Group.
Desk-Based Review
2.5 ORS collated a range of secondary data that was used to support the study. This included:
» Census data.
» Site records.
» Caravan counts.
» Records of unauthorised
sites/encampments.
» Information on planning
applications/appeals.
» Existing Needs Assessments and
other relevant local studies.
» Existing national and local policy.
Survey of Travelling Communities
2.6 Through the desk-based research, ORS sought to identify all authorised and unauthorised sites and
yards in the study area and attempted to complete an interview with the residents on all occupied
Chelmsford City Council GTAA Need Summary – January 2017
Page 9
pitches and plots. In order to gather robust information to use to assess households against the
planning definition of a Traveller multiple visits were made to households where it was not possible
to conduct an interview because they were not in or not available.
2.7 Our experience suggests that an attempt to interview households on all pitches is more robust, as
opposed to a sample based approach which often leads to an under-estimate of need - an approach
which is regularly challenged by the Planning Inspectorate and at planning appeals.
2.8 ORS worked closely with the Council to ensure that the interviews collected all the necessary
information to support the study. The household interview questions that were used have been
updated to take account of PPTS (2015) and to collect the information ORS feel is necessary to apply
the planning definition. All pitches and plots were visited by members of our dedicated team of
experienced interviewers who work solely on our GTAA studies across England and Wales. They
conducted semi-structured interviews with residents to determine their current demographic
characteristics, their current or future accommodation needs, whether there is any over-crowding or
the presence of concealed households and travelling characteristics (to meet the in PPTS (2015)).
Interviewers also sought to identify contacts living in bricks and mortar to interview, as well as an
overall assessment of each site to determine any opportunities for intensification or expansion to
meet future needs. They also sought information from residents on the type of pitches they may
require in the future – for example private or socially rented, together with any features they may
wish to be provided on a new pitch or site.
2.9 Where it was not possible to undertake an interview, staff sought to capture as much information as
possible about the residents on each pitch or plot from sources including neighbouring residents and
site management (if present).
Timing of the Fieldwork
2.10 ORS are fully aware of the transient nature of many travelling communities and subsequent seasonal
variations in site and yard occupancy. As such the majority of the fieldwork was undertaken during
the non-travelling season, and also avoided days of known local or national events. Fieldwork was
completed between January and November 2016. Whilst this did cover the summer period,
interviews were not completed during July and August.
Engagement with Bricks and Mortar Households
2.11 The 2011 Census recorded just 48 households in Chelmsford living in a house or a flat who identified
as Gypsies or Irish Travellers. ORS apply a rigorous approach to making contact with bricks and
mortar households as this is a common issue raised at Local Plan examinations and planning appeals.
Contacts were sought through a range of sources including the interviews with people on existing
sites and yards, intelligence from the Council, information from housing registers and other local
knowledge from stakeholders, and adverts on social media (including the Friends Families and
Travellers Facebook group). Through this approach we endeavoured to do everything within our
means to give households living in bricks and mortar the opportunity to make their views known to
us.
Chelmsford City Council GTAA Need Summary – January 2017
Page 10
2.12 As a rule we do not extrapolate the findings from our fieldwork with bricks and mortar households
up to the total estimated bricks and mortar population as a whole as in our experience this leads to a
significant over-estimate of the number of households wishing to move to a site or a yard. We work
on the assumption that all those wishing to move will make their views known to us based on the
wide range of publicity we will put in place. Thus we are seeking to shift the burden of responsibility
on to those living in bricks and mortar through demonstrating rigorous efforts to make them aware
of the study.
Calculating Current and Future Need
2.13 To identify need, PPTS (2015) requires an assessment for current and future pitch requirements, but
does not provide a methodology for this. However, as with any housing assessment, the underlying
calculation can be broken down into a relatively small number of factors. In this case, the key issue is
to compare the supply of pitches available for occupation with the current and future needs of the
population.
Supply of Pitches
2.14 The first stage of the assessment sought to determine the number of occupied, vacant and
potentially available supply in the study area:
» Current vacant pitches.
» Pitches currently with planning consent due to be developed within 5 years.
» Pitches vacated by people moving to housing.
» Pitches vacated by people moving from the study area (out-migration).
2.15 It is important when seeking to identify supply from vacant pitches that they are in fact available for
general occupation – i.e. on a public or social rented site, or on a private site that is run on a
commercial basis with anyone being able to rent a pitch if they are available. Typically vacant pitches
on small private family sites are not included as components of available supply, but can be used to
meet any current and future need from the family living on the site.
Current Need
2.16 The second stage was to identify components of current need. It is important to address issues of
double counting – for example concealed or doubled-up households may also be on the waiting list,
as may households in bricks and mortar. Current need is made up of the following:
» Households on unauthorised developments for which planning permission is not
expected.
» Households on unauthorised encampments for which planning permission is not
expected.
» Concealed, doubled-up or over-crowded households (including single adults).
» Households in bricks and mortar wishing to move to sites.
» Households in need on waiting lists for public sites.
Chelmsford City Council GTAA Need Summary – January 2017
Page 11
Future Need
2.17 The final stage was to identify components of future need. This includes the following four
components:
» Older teenage children in need of a pitch of their own in the next 5 years.
» Households living on sites with temporary planning permission.
» New household formation.
» In-migration.
2.18 Household formation rates are often the subject of challenge at appeals or examinations. We agree
with the position now being taken by DCLG and firmly believe that any household formation rates
should use a robust local evidence base where household interviews have been completed, rather
than simply relying on precedent.
2.19 All of these components of supply and need are presented in easy to understand tables which
identify the overall net need for current and future accommodation for both Gypsies and Travellers,
and for Travelling Showpeople. This has proven to be a robust model for identifying needs. The
residential and transit pitch needs for Gypsies and Travellers are identified separately and the needs
are identified to 2033.
Pitch Turnover
2.20 Some assessments of need by other companies make use of pitch turnover as an ongoing
component of supply. ORS do not agree with this approach or about making any assumptions about
annual turnover rates. This is an approach that usually ends up with a significant under-estimate of
need as in the majority of cases vacant pitches on sites are not available to meet any additional
need. The use of pitch turnover has been the subject of a number of Inspectors’ Decisions, for
example APP/J3720/A/13/2208767 found a GTAA to be unsound when using pitch turnover and
concluded:
West Oxfordshire Council relies on a GTAA published in 2013. This identifies an immediate
need for 6 additional pitches. However the GTAA methodology treats pitch turnover as a
component of supply. This is only the case if there is net outward migration yet no such
scenario is apparent in West Oxfordshire. Based on the evidence before me I consider the
underlying criticism of the GTAA to be justified and that unmet need is likely to be higher
than that in the findings in the GTAA.
2.21 In addition a GTAA Best Practice Guide was produced in June 2016 by a number of organisations
including Friends, Families and Travellers, the London Gypsy and Traveller Unit, the York Travellers
Trust, the Derbyshire Gypsy Liaison Group, Garden Court Chambers and Leeds GATE concluded that:
Assessments involving any form of pitch turnover in their supply relies upon making
assumptions; a practice best avoided. Turnover is naturally very difficult to assess
accurately and in practice does not contribute meaningfully to additional supply so should
be very carefully assessed in line with local trends. Mainstream housing assessments are
Chelmsford City Council GTAA Need Summary – January 2017
Page 12
not based on the assumption that turnover within the existing stock can provide for
general housing needs.
2.22 As such, other than current vacant pitches on sites that are known to be available, or pitches that
are known to become vacant identified during the household interviews, pitch turnover has not
been considered as a component of supply in this GTAA.
Transit Provision
2.23 PPTS also requires an assessment of the need for any transit sites or stopping places. While the
majority of Gypsies and Travellers have permanent bases either on Gypsy and Traveller sites or in
bricks and mortar and no longer travel, other members of the community either travel permanently
or for part of the year. Due to the mobile nature of the population, a range of sites or management
approaches can be developed to accommodate Gypsies and Travellers as they move through
different areas.
» Transit sites
» Temporary/Emergency stopping places
» Temporary (seasonal) sites
» Negotiated Stopping Agreements
2.24 In order to investigate the potential need for transit provision when undertaking work to support the
study, ORS sought to undertake analysis of any records of unauthorised sites and encampments, as
well as information from the CLG Caravan Count. The outcomes of the interviews with Council
Officers, Officers from neighbouring local authorities and other stakeholders that were undertaken
during the previous GTAA were also taken into consideration when determining this element of
need in the study area.
Chelmsford City Council GTAA Need Summary – January 2017
Page 13
3. Planning Definition 3.1 The primary change introduced by PPTS (2015) in relation to the assessment of need was the change
in the definition of a Gypsy, Traveller or Travelling Showperson for planning purposes. Through the
site interviews ORS has collected information necessary to assess each household against the
planning definition. As PPTS (2015) has only recently been issued only a small number of relevant
appeal decisions have been issued by the Planning Inspectorate on how the new planning definition
should be applied – these support the view that households need to be able to demonstrate that
they travel for work purposes to meet the planning definition, and stay away from their usual place
of residence when doing so. See Paragraph 1.18 for a recent example.
Applying the Planning Definition
3.2 The household survey included a structured section of questions to record information about the
travelling characteristics of household members. This included questions on the following key issues:
» Whether any household members have travelled in the past 12 months.
» Whether household members have ever travelled.
» The main reasons for travelling.
» Where household members travelled to.
» The times of the year that household members travelled.
» Where household members stay when they are away travelling.
» When household members stopped travelling.
» The reasons why household members stopped travelling.
» Whether household members intend to travel again in the future.
» When and the reasons why household members plan to travel again in the future.
3.3 When the household survey was completed the outcomes from these questions on travelling were
used to determine the status of each household against the planning definition in PPTS (2015).
Through a combination of responses households need to provide sufficient information to
demonstrate that household members travel for works purposes and in doing so stay away from
their usual place of residence, or that they have ceased to travel temporarily due to education, ill
health or old age, and plan to travel again for work purposes in the future. The same definition
applies to Travelling Showpeople as to Gypsies and Travellers.
3.4 Households that need to be considered in the GTAA fall under one of 3 classifications that will
determine whether their housing needs will need to be assessed in the GTAA. Only those households
that meet, or may meet, the planning definition will form the components of need to be included in
the GTAA:
Chelmsford City Council GTAA Need Summary – January 2017
Page 14
» Households that travel under the new planning definition.
» Households that have ceased to travel temporarily under the new planning
definition.
» Households where an interview was not possible who may fall under the new
planning definition.
3.5 Only those households that meet, or may meet, the planning definition will form the components of
need to be included in the GTAA. Whilst the needs of those households that do not meet the
planning definition do not need to be included in the GTAA, they have been assessed to provide the
Council with information on components of need to be addressed as part of a SHMA or HEDNA for
example.
Unknown Households
3.6 As well as calculating need for households that meet the planning definition, the needs of the
households where an interview was not completed (either due to refusal to be interviewed or
households that were not present during the fieldwork period – despite repeated visits) need to be
assessed as part of the GTAA where they are believed to be ethnic Gypsies and Travellers who may
meet the planning definition. Whilst there is no law or guidance that sets out how the needs of these
households should be addressed, an approach has been taken that applies an estimate of potential
need from these households. This will be a maximum additional need figure over and above the
need identified for households that do meet the planning definition.
3.7 The estimate seeks to identify potential current and future need from pitches known to be
temporary or unauthorised, and through new household formation. For the latter the national rate
of 1.50%1 has been used as the demographics of residents are unknown. This approach is also
consistent with the outcomes of a recent Planning Appeal where access to a site was not possible
but basic information was known about the number of households residing there. (Planning
Inspectorate Ref: APP/Z6950/A/14/2212012).
3.8 ORS are of the opinion that it would not be appropriate when producing a robust assessment of
need to make any firm assumptions about whether or not households where an interview was not
completed meet the planning definition based on the outcomes of households where an interview
was completed. However, data that has been collected from over 1,500 household interviews that
have been completed by ORS since the changes to PPTS in 2015 suggests that overall approximately
10% of households who have been interviewed meet the planning definition. This would suggest
that it is likely that only a small proportion of the potential need identified from these households
will need new Gypsy and Traveller pitches, and that the needs of the majority from unknown
households will need to be addressed through a SHMA or HEDNA.
3.9 Councils will need to carefully consider how to address the needs associated with unknown
Travellers in Local Plan policies as it is unlikely that all of these will have a need that should be
addressed through the provision of Gypsy or Traveller pitches. In terms of Local Plan policies the
Councils could consider the use of a specific site allocation/protection/intensification/expansion
1 See Paragraph 5.8
Chelmsford City Council GTAA Need Summary – January 2017
Page 15
policy for those households that do meet the planning definition, together with a criteria-based
policy (as suggested in PPTS (2015) Paragraph 11) for any unknown households that do provide
evidence that they meet the planning definition.
Households that do not meet the Planning Definition
3.10 Households who do not travel or have ceased to travel permanently now fall outside the planning
definition of a Traveller. However Romany Gypsies and Irish and Scottish Travellers may be able to
demonstrate a right to culturally appropriate accommodation under the Equality Act 2010. In
addition provisions set out in the Housing and Planning Act (2016) now include a duty (under Section
8 of the 1985 Housing Act that covers the requirement for a periodical review of housing needs) for
local authorities to consider the needs of people residing in or resorting to their district with respect
to the provision of sites on which caravans can be stationed, or places on inland waterways where
houseboats can be moored. Draft Guidance2 related to this section of the Housing and Planning Act
has been published setting out how the government would want local housing authorities to
undertake this assessment and it is the same as the GTAA assessment process. The implication is
therefore that the housing needs of any Gypsy and Traveller households who do not meet the
planning definition of a Traveller will need to be assessed as part of the wider housing needs of the
area, for example through the SHMA or HEDNA process, and will form a subset of the wider need
arising from households residing in caravans.
2 “Draft guidance to local housing authorities on the periodical review of housing needs for caravans and houseboats.” (March 2016)

Chelmsford City Council GTAA Need Summary – January 2017
Page 16
4. Survey of Travellers Interviews with Gypsies, Travellers and Travelling Showpeople
4.1 One of the major components of this study was a detailed survey of the Gypsy, Traveller and
Travelling Showpeople population living in Chelmsford City Council. Through the desk-based
research ORS identified 2 public sites (22 pitches), 14 private sites (53 pitches), 1 site that is
tolerated for planning purposes (1 pitch), 5 unauthorised sites (5 pitches), and 3 Travelling
Showpeople yards (42 plots). There are no transit sites. Interviews were completed between January
and November 2016. Up to 3 attempts were made to interview each household where they were
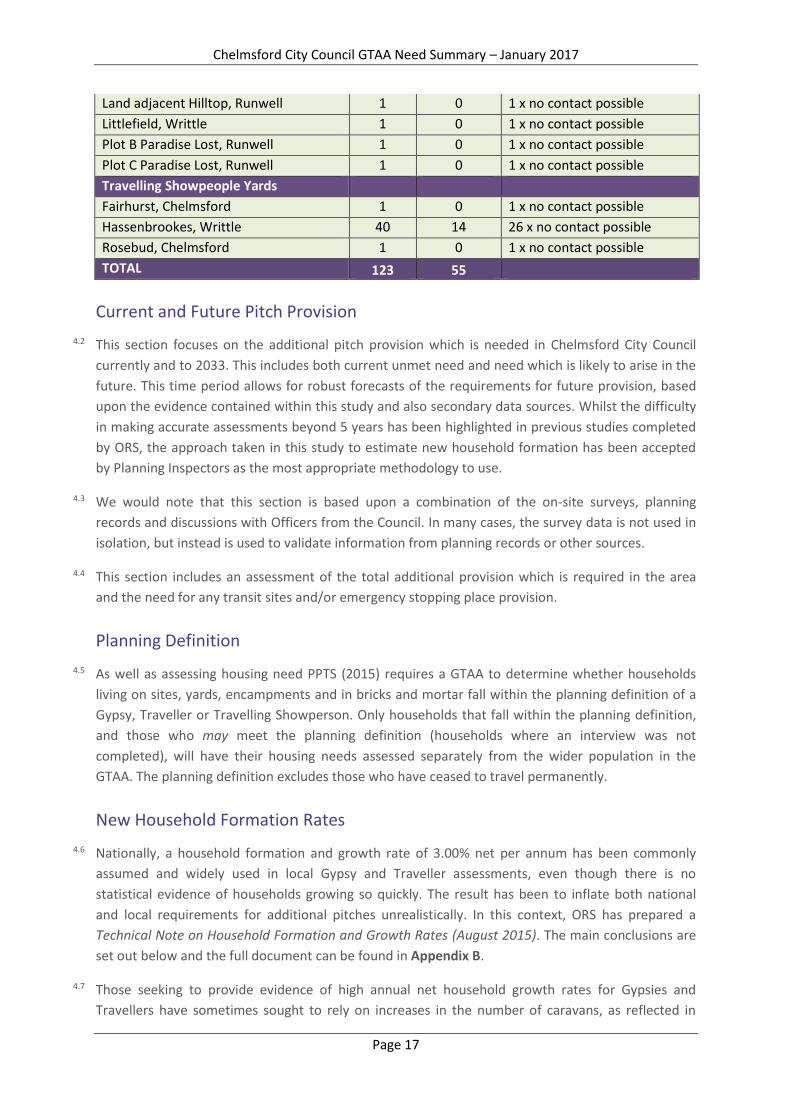
not present when interviewers visited. The table below sets out the number of pitches, the number
of interviews that were completed, and the reasons why interviews were not completed. Figure 1 – Gypsy, Traveller and Travelling Showpeople sites and yards visited in Chelmsford City Council
Site Status Pitches/Plots
Interviews Reasons for not completing interviews
Public Sites
Cranham Hall Caravan Site, Little Waltham
10 5 2 x vacant, 2 x refusals, 1 x no contact possible
Ladygrove Caravan Park, Writtle 12 10 2 x no contact possible
Private Sites
Apple Blossom, Little Waltham 1 0 1 x no contact possible
Barracks Field, Boreham 3 0 3 x no contact possible
Blundells, Pleshey 1 0 1 x no contact possible
Copper Farm, Stock 1 0 1 x no contact possible
Greenfields, Edney Common 1 0 1 x no contact possible
Hillview, Runwell 1 1 -
Leedanton Farm, Downham 1 0 1 x no contact possible
Little Paddocks, Writtle 1 2 -
Meadow Lane, Runwell 37 21 5 x vacant, 2 x refusals, 14 x no contact possible
Oak Vale/Orchard View, Little Waltham 2 0 2 x no contact possible
Old Brook, Sandon 1 0 1 x no contact possible
Railside, Boreham 1 0 1 x no contact possible
Riverhaven, Galleywood 1 0 1 x non-Travellers
The Willows, Downham 1 1 -
Tolerated Sites
Jobbs Yard, Great Waltham 1 1 -
Unauthorised Sites
Dowcett Farm, Ramsden Heath 1 0 1 x no contact possible
Chelmsford City Council GTAA Need Summary – January 2017
Page 17
Land adjacent Hilltop, Runwell 1 0 1 x no contact possible
Littlefield, Writtle 1 0 1 x no contact possible
Plot B Paradise Lost, Runwell 1 0 1 x no contact possible
Plot C Paradise Lost, Runwell 1 0 1 x no contact possible
Travelling Showpeople Yards
Fairhurst, Chelmsford 1 0 1 x no contact possible
Hassenbrookes, Writtle 40 14 26 x no contact possible
Rosebud, Chelmsford 1 0 1 x no contact possible
TOTAL 123 55
Current and Future Pitch Provision
4.2 This section focuses on the additional pitch provision which is needed in Chelmsford City Council
currently and to 2033. This includes both current unmet need and need which is likely to arise in the
future. This time period allows for robust forecasts of the requirements for future provision, based
upon the evidence contained within this study and also secondary data sources. Whilst the difficulty
in making accurate assessments beyond 5 years has been highlighted in previous studies completed
by ORS, the approach taken in this study to estimate new household formation has been accepted
by Planning Inspectors as the most appropriate methodology to use.
4.3 We would note that this section is based upon a combination of the on-site surveys, planning
records and discussions with Officers from the Council. In many cases, the survey data is not used in
isolation, but instead is used to validate information from planning records or other sources.
4.4 This section includes an assessment of the total additional provision which is required in the area
and the need for any transit sites and/or emergency stopping place provision.
Planning Definition
4.5 As well as assessing housing need PPTS (2015) requires a GTAA to determine whether households
living on sites, yards, encampments and in bricks and mortar fall within the planning definition of a
Gypsy, Traveller or Travelling Showperson. Only households that fall within the planning definition,
and those who may meet the planning definition (households where an interview was not
completed), will have their housing needs assessed separately from the wider population in the
GTAA. The planning definition excludes those who have ceased to travel permanently.
New Household Formation Rates
4.6 Nationally, a household formation and growth rate of 3.00% net per annum has been commonly
assumed and widely used in local Gypsy and Traveller assessments, even though there is no
statistical evidence of households growing so quickly. The result has been to inflate both national
and local requirements for additional pitches unrealistically. In this context, ORS has prepared a
Technical Note on Household Formation and Growth Rates (August 2015). The main conclusions are
set out below and the full document can be found in Appendix B.
4.7 Those seeking to provide evidence of high annual net household growth rates for Gypsies and
Travellers have sometimes sought to rely on increases in the number of caravans, as reflected in
Chelmsford City Council GTAA Need Summary – January 2017
Page 18
caravan counts. However, caravan count data is unreliable and erratic – so the only robust way to
project future population and household growth is through demographic analysis.
4.8 The Technical Note concludes that in fact, the growth in the national Gypsy and Traveller population
may be as low as 1.25% per annum – much less than the 3.00% per annum often assumed, but still
greater than in the settled community. Even using extreme and unrealistic assumptions, it is hard to
find evidence that net Gypsy and Traveller population and household growth rates are above 2.00%
per annum nationally.
4.9 The often assumed 3.00% per annum net household growth rate is unrealistic and would require
clear statistical evidence before being used for planning purposes. In practice, the best available
evidence supports a national net household growth rate of 1.50% per annum for Gypsies and
Travellers. This view has been supported by Planning Inspectors in a number of Decision Notices. The
most recent was in relation to an appeal in Doncaster that was issued in November 2016 (Ref:
APP/F4410/W/15/3133490) where the agent acting on behalf of the appellant claimed that a rate
closer to 3.00% should be used. The Inspector concluded:
In assessing need account also needs to be taken of likely household growth over the
coming years. In determining an annual household growth rate the Council relies on the
work of Opinions Research Services (ORS), part of Swansea University. ORS’s research
considers migration, population profiles, births & fertility rates, death rates, household
size data and household dissolution rates to determine average household growth rates
for gypsies and travellers. The findings indicate that the average annual growth rate is in
the order of 1.5% but that a 2.5% figure could be used if local data suggest a relatively
youthful population. As the Council has found a strong correlation between Doncaster’s
gypsy and traveller population age profile and the national picture, a 1.5% annual
household growth rate has been used in its 2016 GTANA. Given the rigour of ORS’s
research and the Council’s application of its findings to the local area I accept that a
1.5% figure is justified in the case of Doncaster.
4.10 ORS assessments take full account of the net local household growth rate per annum for each local
authority, calculated on the basis of demographic evidence from the site surveys. The ‘baseline’
includes all current authorised households, all households identified as in current need (excluding
older teenage children whose needs are assessed separately), as well as households living on
tolerated unauthorised pitches or plots who are not included as current need. The assessments of
future need also take account of modelling projections based on birth and death rates, and in-/out-
migration.
4.11 Overall, the household growth rate used for the assessment of future needs has been informed by
local evidence. This demographic evidence has been used to adjust the national growth rate of
1.50% up or down based on the proportion of those aged under 18 in each local authority (by
travelling status).
4.12 In certain circumstances where the numbers of households and children are low it may not be
appropriate to apply a percentage rate for new household formation. In these cases a judgement
will be made on likely new household formation based on the age and gender of the children.
Chelmsford City Council GTAA Need Summary – January 2017
Page 19
4.13 In Chelmsford City Council for Gypsies and Travellers who meet the new definition formation a rate
of 2.50% has been used based on the demographics of the households; for unknown Travellers the
national rate of 1.50% has been used; and for those who do not meet the new definition a rate of
1.50% has been used based on the demographics of the households. For Travelling Showpeople who
meet the new definition a rate of 2.00% has been used based on the demographics of the
households; for unknown Showpeople the national rate of 1.00% has been used; and for those who
do not meet the new definition a rate of 0.00% has been used as all residents are aged over 50.
Breakdown by 5 Year Bands
4.14 In addition to tables which set out the overall need for Gypsies, Travellers and Travelling
Showpeople, the overall need has also been broken down by 5 year bands as required by PPTS
(2015). The way that this is calculated is by including all current need (from unauthorised pitches,
pitches with temporary planning permission, concealed and doubled-up households, and net
movement from bricks and mortar) in the first 5 years. In addition the total net new household
formation is split across the 5 year bands based on the rate of growth that was applied – as opposed
to being spread evenly.
Applying the Planning Definition
4.15 The outcomes from the questions in the household survey on travelling were used to determine the
status of each household against the planning definition in PPTS. This assessment was based on the
verbal responses to the questions given to interviewers as it is understood that oral evidence is
capable of being sufficient when determining whether households meet the planning definition.
Only those households that meet the planning definition, in that they stated during the interview
that they travel for work purposes, and stay away from their usual place of residence when doing so
– or that they have ceased to travel temporarily due to education, ill health or old age, form the
components of need that will form the baseline of need in the GTAA. Households where an
interview was not completed who may meet the planning definition have also been included as a
potential additional component of need from unknown households.
Travelling Status of Households
4.16 Information that was sought from households where an interview was completed allowed each
household to be assessed against the new ‘planning’ definition of a Traveller. This included
information on whether households have ever travelled; why they have stopped travelling; the
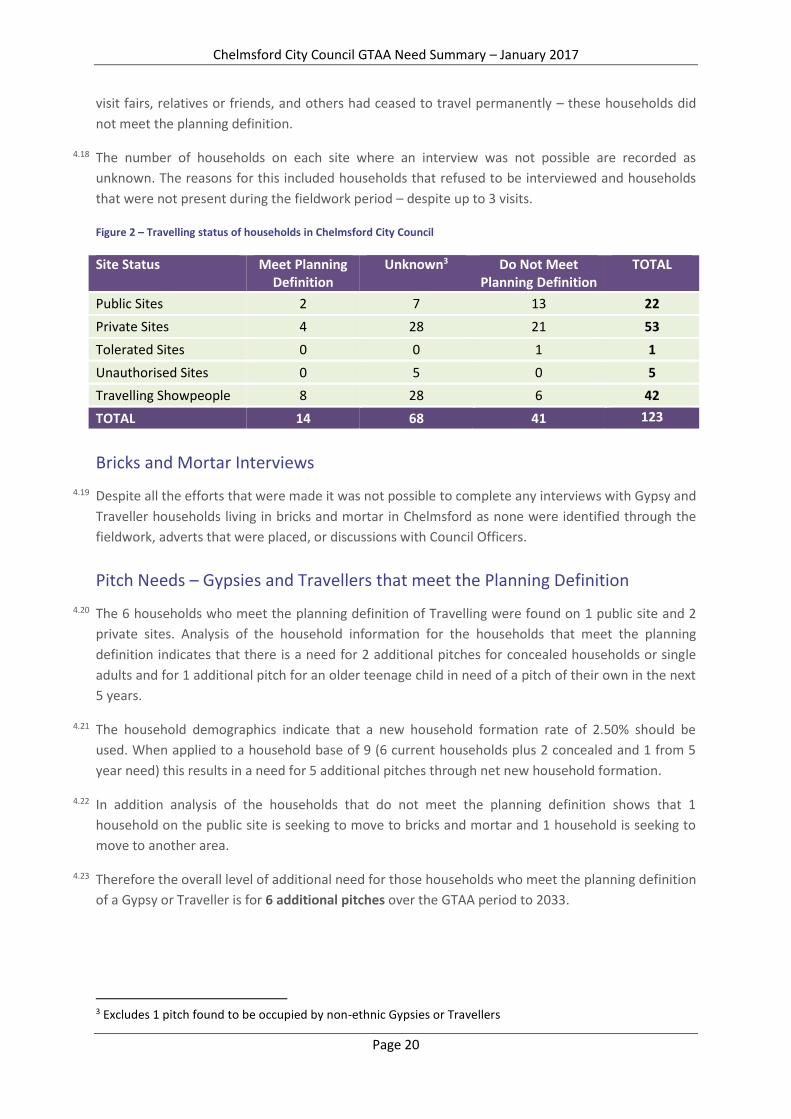
reasons that they travel; and whether they plan to travel again in the future. Figure 2 overleaf sets
out the travelling status of households in Chelmsford City Council.
4.17 Figure 2 shows that for Gypsies and Travellers 6 households and for Travelling Showpeople 8
households meet the planning definition of a Traveller in that it was able to be determined that they
travel for work purposes and stay away from their usual place of residence, or have ceased to travel
temporarily. A total of 35 Gypsy and Traveller households and 6 Travelling Showpeople households
did not meet the planning definition as they were not able to provide information that they travel
away from their usual place of residence for the purpose of work, or that they have ceased to travel
temporarily due to children in education, ill health or old age. Some did travel for cultural reasons to
Chelmsford City Council GTAA Need Summary – January 2017
Page 20
visit fairs, relatives or friends, and others had ceased to travel permanently – these households did
not meet the planning definition.
4.18 The number of households on each site where an interview was not possible are recorded as
unknown. The reasons for this included households that refused to be interviewed and households
that were not present during the fieldwork period – despite up to 3 visits. Figure 2 – Travelling status of households in Chelmsford City Council
Bricks and Mortar Interviews
4.19 Despite all the efforts that were made it was not possible to complete any interviews with Gypsy and
Traveller households living in bricks and mortar in Chelmsford as none were identified through the
fieldwork, adverts that were placed, or discussions with Council Officers.
Pitch Needs – Gypsies and Travellers that meet the Planning Definition
4.20 The 6 households who meet the planning definition of Travelling were found on 1 public site and 2
private sites. Analysis of the household information for the households that meet the planning
definition indicates that there is a need for 2 additional pitches for concealed households or single
adults and for 1 additional pitch for an older teenage child in need of a pitch of their own in the next
5 years.
4.21 The household demographics indicate that a new household formation rate of 2.50% should be
used. When applied to a household base of 9 (6 current households plus 2 concealed and 1 from 5
year need) this results in a need for 5 additional pitches through net new household formation.
4.22 In addition analysis of the households that do not meet the planning definition shows that 1
household on the public site is seeking to move to bricks and mortar and 1 household is seeking to
move to another area.
4.23 Therefore the overall level of additional need for those households who meet the planning definition
of a Gypsy or Traveller is for 6 additional pitches over the GTAA period to 2033.
3 Excludes 1 pitch found to be occupied by non-ethnic Gypsies or Travellers
Site Status Meet Planning Definition
Unknown3 Do Not Meet Planning Definition
TOTAL
Public Sites 2 7 13 22
Private Sites 4 28 21 53
Tolerated Sites 0 0 1 1
Unauthorised Sites 0 5 0 5
Travelling Showpeople 8 28 6 42
TOTAL 14 68 41 123
Chelmsford City Council GTAA Need Summary – January 2017
Page 21
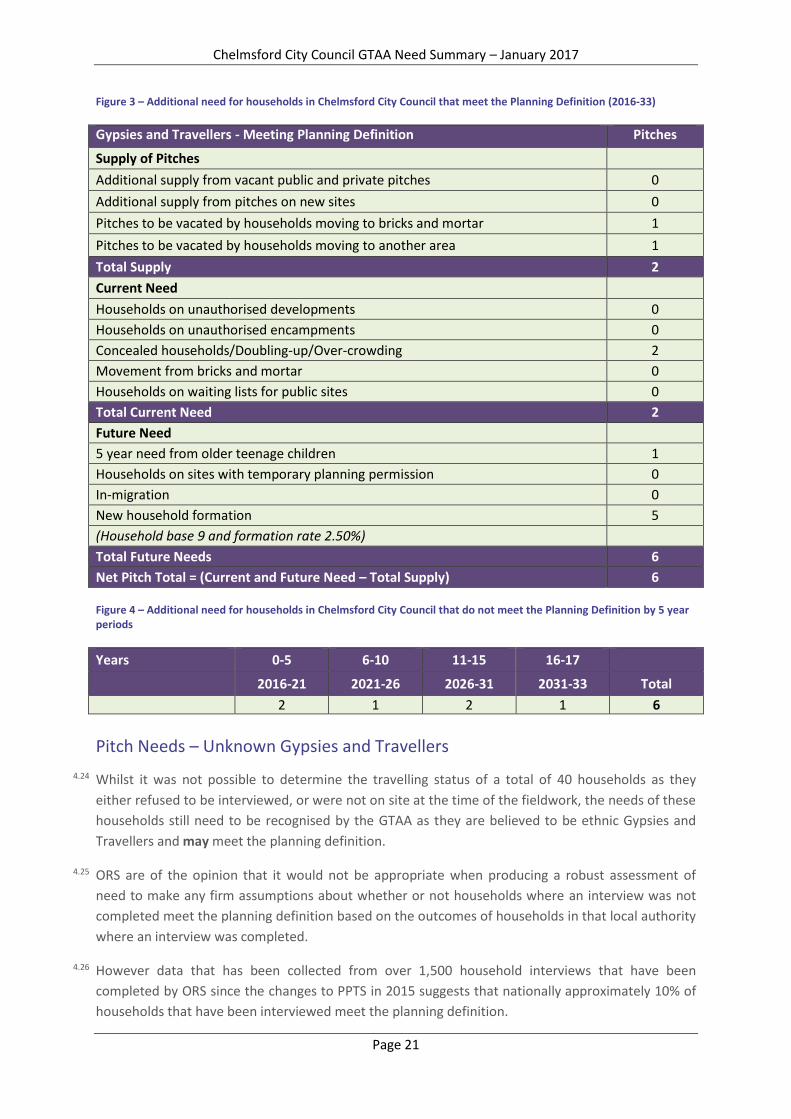
Figure 3 – Additional need for households in Chelmsford City Council that meet the Planning Definition (2016-33)
Gypsies and Travellers - Meeting Planning Definition Pitches
Supply of Pitches
Additional supply from vacant public and private pitches 0
Additional supply from pitches on new sites 0
Pitches to be vacated by households moving to bricks and mortar 1
Pitches to be vacated by households moving to another area 1
Total Supply 2
Current Need
Households on unauthorised developments 0
Households on unauthorised encampments 0
Concealed households/Doubling-up/Over-crowding 2
Movement from bricks and mortar 0
Households on waiting lists for public sites 0
Total Current Need 2
Future Need
5 year need from older teenage children 1
Households on sites with temporary planning permission 0
In-migration 0
New household formation 5
(Household base 9 and formation rate 2.50%)
Total Future Needs 6
Net Pitch Total = (Current and Future Need – Total Supply) 6 Figure 4 – Additional need for households in Chelmsford City Council that do not meet the Planning Definition by 5 year periods
Years 0-5 6-10 11-15 16-17
2016-21 2021-26 2026-31 2031-33 Total
2 1 2 1 6
Pitch Needs – Unknown Gypsies and Travellers
4.24 Whilst it was not possible to determine the travelling status of a total of 40 households as they
either refused to be interviewed, or were not on site at the time of the fieldwork, the needs of these
households still need to be recognised by the GTAA as they are believed to be ethnic Gypsies and
Travellers and may meet the planning definition.
4.25 ORS are of the opinion that it would not be appropriate when producing a robust assessment of
need to make any firm assumptions about whether or not households where an interview was not
completed meet the planning definition based on the outcomes of households in that local authority
where an interview was completed.
4.26 However data that has been collected from over 1,500 household interviews that have been
completed by ORS since the changes to PPTS in 2015 suggests that nationally approximately 10% of
households that have been interviewed meet the planning definition.
Chelmsford City Council GTAA Need Summary – January 2017
Page 22
4.27 This would suggest that it is likely that only a small proportion of the potential need identified from
these households will need new Gypsy and Traveller pitches, and that the needs of the majority will
need to be addressed through other means such as the SHMA or HEDNA.
4.28 Should further information be made available to the Council that will allow for the planning
definition to be applied to the unknown households, the overall level of need could rise by up to 5
pitches that are currently unauthorised and by up to 12 pitches from new household formation (this
uses a base of the 40 households and a net growth rate of 1.50%4). Therefore additional
need could increase by up to a further 17 pitches, plus any concealed adult households or 5 year
need arising from older teenagers living in these households (if all 40 unknown pitches are deemed
to meet the planning definition). However, as an illustration, if the national average of 10% were to
be applied this could be as few as 2 additional pitches. Tables setting out the components of need
for unknown households can be found in Appendix A.
Waiting Lists
4.29 There are 2 public sites in Chelmsford City Council. At the time of reporting information was still
being processed by Essex County Council regarding the households on the waiting lists for these
sites. This will help to identify how many households are currently living on one of the sites; how
many are living in bricks and mortar in Chelmsford City Council; how many are living on other sites in
Chelmsford City Council; how many are living on sites outside of Chelmsford City Council; and how
many are living in bricks and mortar outside of Chelmsford City Council.
4.30 Should these households wish to be considered for a tenancy on one of the public sites they may
have to provide information on their travelling patterns during the site allocation process as and
when a pitch becomes available.
Plot Needs – Travelling Showpeople that meet the Planning Definition
4.31 There was 1 large and 2 small Travelling Showpeople yards identified in Chelmsford City Council. The
8 households who meet the planning definition of Travelling were all found on the large yard.
Analysis of the household information for the households that meet the planning definition indicates
that there is a need for 10 additional plots for older teenage children in need of plots of their own in
the next 5 years.
4.32 The household demographics indicate that a new household formation rate of 2.00% should be
used. When applied to a household base of 18 (8 current households plus 10 from 5 year need) this
results in a need for 7 additional plots through net new household formation.
4.33 In addition 1 household on the large yard is actively seeking to purchase land to develop a new
private yard due to over-crowding and lack of space to store and maintain rides.
4.34 Therefore the overall level of additional need for those households who meet the planning definition
of a Gypsy or Traveller is for 16 additional plots over the GTAA period to 2033.
4 The ORS Technical Note on Population and Household Growth (2015) has identified a national growth rate of 1.50% for Gypsies and Travellers which has been applied in the absence of further demographic information about these households.
Chelmsford City Council GTAA Need Summary – January 2017
Page 23
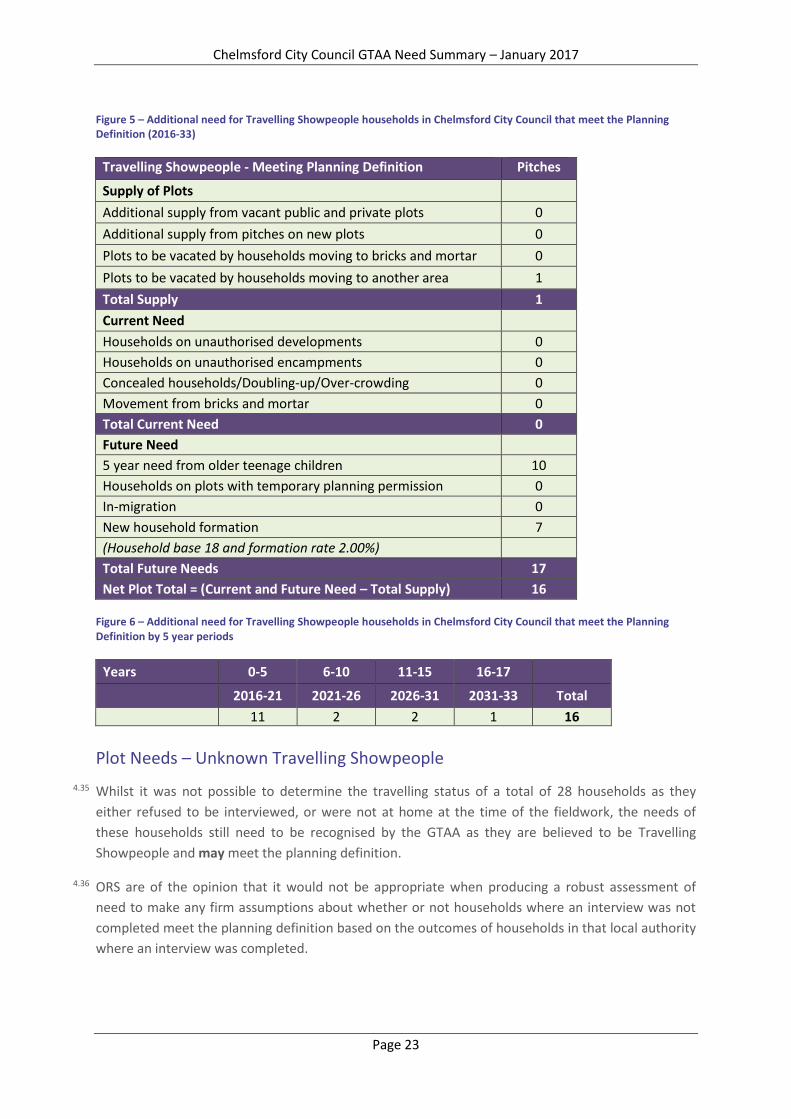
Figure 5 – Additional need for Travelling Showpeople households in Chelmsford City Council that meet the Planning Definition (2016-33)
Travelling Showpeople - Meeting Planning Definition Pitches
Supply of Plots
Additional supply from vacant public and private plots 0
Additional supply from pitches on new plots 0
Plots to be vacated by households moving to bricks and mortar 0
Plots to be vacated by households moving to another area 1
Total Supply 1
Current Need
Households on unauthorised developments 0
Households on unauthorised encampments 0
Concealed households/Doubling-up/Over-crowding 0
Movement from bricks and mortar 0
Total Current Need 0
Future Need
5 year need from older teenage children 10
Households on plots with temporary planning permission 0
In-migration 0
New household formation 7
(Household base 18 and formation rate 2.00%)
Total Future Needs 17
Net Plot Total = (Current and Future Need – Total Supply) 16 Figure 6 – Additional need for Travelling Showpeople households in Chelmsford City Council that meet the Planning Definition by 5 year periods
Years 0-5 6-10 11-15 16-17
2016-21 2021-26 2026-31 2031-33 Total
11 2 2 1 16
Plot Needs – Unknown Travelling Showpeople
4.35 Whilst it was not possible to determine the travelling status of a total of 28 households as they
either refused to be interviewed, or were not at home at the time of the fieldwork, the needs of
these households still need to be recognised by the GTAA as they are believed to be Travelling
Showpeople and may meet the planning definition.
4.36 ORS are of the opinion that it would not be appropriate when producing a robust assessment of
need to make any firm assumptions about whether or not households where an interview was not
completed meet the planning definition based on the outcomes of households in that local authority
where an interview was completed.
Chelmsford City Council GTAA Need Summary – January 2017
Page 24
4.37 Data that has been collected from over 300 household interviews that have been completed by ORS
since the changes to PPTS in 2015 suggests that nationally approximately 70% of Showpeople
households that have been interviewed meet the planning definition.
4.38 This would suggest that it is likely that only a proportion of the potential need identified from these
households will need new Gypsy and Traveller pitches, and that the needs of the remainder will
need to be addressed through other means such as the SHMA or HEDNA.
4.39 Should further information be made available to the Council that will allow for the planning
definition to be applied to the unknown households, the overall level of need could rise by up to 5
plots from new household formation (this uses a base of the 28 households and a net growth rate of
1.00%5). Therefore additional need could increase by up to a further 5 plots, plus any concealed
adult households or 5 year need arising from older teenagers living in these households (if all 28
unknown households are deemed to meet the planning definition). However, as an illustration, if the
national average of 70% were to be applied this could be as few as 4 additional plots. Tables setting
out the components of need for unknown households can be found in Appendix A.
Transit Requirements
4.40 When determining the potential need for transit provision the assessment has looked at data from
the DCLG Caravan Count, the outcomes of the stakeholder interviews and local records on numbers
of unauthorised encampments, and the potential wider issues related to changes made to PPTS in
2015.
DCLG Caravan Count
4.41 Whilst it is considered to be a comprehensive national dataset on numbers of authorised and
unauthorised caravans across England, it is acknowledged that the Caravan Count is a count of
caravans and not households or pitches/plots. It also does not record the reasons for unauthorised
caravans. This makes it very difficult to interpret in relation to assessing future need because it does
not count pitches or resident households. The count is also only a twice yearly (January and July)
‘snapshot in time’ conducted by local authorities on a specific day, and any caravans on
unauthorised sites or encampments which occur on other dates are not recorded. Likewise any
caravans that are away from sites on the day of the count are not included. As such it is not
considered appropriate to use the outcomes from the Traveller Caravan Count in the assessment of
future transit provision. It does however provide valuable historic and trend data on whether there
are instances of unauthorised caravans in local authority areas.
4.42 Data from the Caravan Count shows that there have been very low numbers of non-tolerated
unauthorised caravans on land not owned by Travellers recorded in Chelmsford City Council in
recent years.
5 The ORS Technical Note on Population and Household Growth (2015) has identified a national growth rate of 1.50% for Gypsies and Travellers which has been applied in the absence of further demographic information about these households.
Chelmsford City Council GTAA Need Summary – January 2017
Page 25
Stakeholder Interviews and Local Data
4.43 Information from the stakeholder interviews that were completed for the previous GTAA that was
published in 2014 also confirmed that there are usually6 relatively low levels of unauthorised
encampments in Chelmsford City Council, and that the majority were short-term visiting family or
friends, transient and simply passing through, or from a small number of groups moving around an
area.
Potential Implications of PPTS (2015)
4.44 It has been suggested by a number of organisations and individuals representing the Travelling
Community that there will need to be an increase in transit provision across the country as a result
of changes to PPTS leading to more households travelling seeking to meet the new planning
definition. This may well be the case but it will take some time for any changes to become apparent.
As such the use of historic evidence to make an assessment of future transit need is not
recommended at this time. Any recommendation for future transit provision will need to make use
of a robust post-PPTS (2015) evidence base and there has not been sufficient time yet for this to be
developed.
Transit Recommendations
4.45 It is recommended that the situation relating to levels of unauthorised encampments should be
continually monitored whilst any potential changes associated with the PPTS (2015) develop.
4.46 A review of the evidence base relating to unauthorised encampments should be undertaken in
autumn 2018 once there is a new 3 year evidence base following the changes to PPTS in 2015 –
including if possible an analysis of whether households on encampments meet the new planning
definition. This will establish whether there is a need for investment in more formal transit sites or
emergency stopping places. If such a need is identified work will need to be undertaken on an Essex-
wide basis to identify suitable locations to meet the provision.
4.47 In the short-term the Council should consider the use of short-term toleration or negotiated
stopping agreements to deal with any encampments, as opposed to taking forward an
infrastructure-based approach. At this point whilst consideration should also be given as to how to
deal with households that do and do not meet the new definition, from a practical point of view it is
likely that households on all unauthorised encampments will need to be dealt with in the same way.
4.48 The term ‘negotiated stopping’ is used to describe agreed short term provision for Gypsy and
Traveller caravans. It does not describe permanent ‘built’ transit sites but negotiated agreements
which allow caravans to be sited on suitable specific pieces of ground for an agreed and limited
period of time, with the provision of limited services such as water, waste disposal and toilets.
Agreements are made between the authority and the (temporary) residents regarding expectations
on both sides.
6 There was an isolated instance in July 2011 when a total of 538 unauthorised caravans were recorded attending a one-off event.
Chelmsford City Council GTAA Need Summary – January 2017
Page 26
4.49 Temporary stopping places can be made available at times of increased demand due to fairs or
cultural celebrations that are attended by Gypsies and Travellers. A charge may be levied as
determined by the local authority although they only need to provide basic facilities including: a cold
water supply; portaloos; sewage disposal point and refuse disposal facilities.
Conclusions
4.50 This study provides a robust evidence base to enable the Council to assess and meet the needs of
the Travelling Community as well as complying with their requirements towards Gypsies, Travellers
and Travelling Showpeople under the Housing Act 1985, the National Planning Policy Framework
(NPPF) 2012, Planning Practice Guidance (PPG) 2014, PPTS (2015), and the Housing and Planning Act
2016. It also provides the evidence base which can be used to support Local Plan policies.
Gypsies and Travellers
4.51 In summary there is a need for 6 additional pitches in Chelmsford City Council over the GTAA period
to 2033 for Gypsy and Traveller households that meet the planning definition; a need for up to 17
additional pitches for Gypsy and Traveller households that may meet the planning definition –
although if the national average of 10% were to be applied this could be as few as 2 additional
pitches; and a need for 18 additional pitches for Gypsy and Traveller households who do not meet
the planning definition (see Appendix A) – if the potential need from 90% of unknown households is
added to this the total need for non-Travelling households could rise to 30 additional pitches.
Travelling Showpeople
4.52 In summary there is a need for 16 additional plots in Chelmsford City Council over the GTAA period
to 2033 for Travelling Showpeople households that meet the planning definition; a need for up to 5
additional plots for Travelling Showpeople households that may meet the planning definition –
although if the national average of 70% were to be applied this could reduce to 4 additional plots;
and a need for no additional plots for Travelling Showpeople households who do not meet the
planning definition (see Appendix A) as all residents are aged 50 and over. If the potential need from
30% of unknown households is added to this the total need for non-Travelling households could rise
to 1 additional plot.
Transit Provision
4.53 It is recommended that the situation relating to levels of unauthorised encampments should be
continually monitored whilst any potential changes associated with PPTS (2015) develop. A review
of the evidence base relating to unauthorised encampments should be undertaken in autumn 2018
once there is a new 3 year evidence base following the changes to PPTS in 2015 – including if
possible an analysis of whether households on encampments meet the new definition. This will
establish whether there is a need for investment in more formal transit sites or emergency stopping
places.
Chelmsford City Council GTAA Need Summary – January 2017
Page 27
4.54 In the short-term the Council should consider the use of short-term toleration or negotiated
stopping agreements to deal with any encampments, as opposed to taking forward an
infrastructure-based approach.
Summary of Need to be Addressed
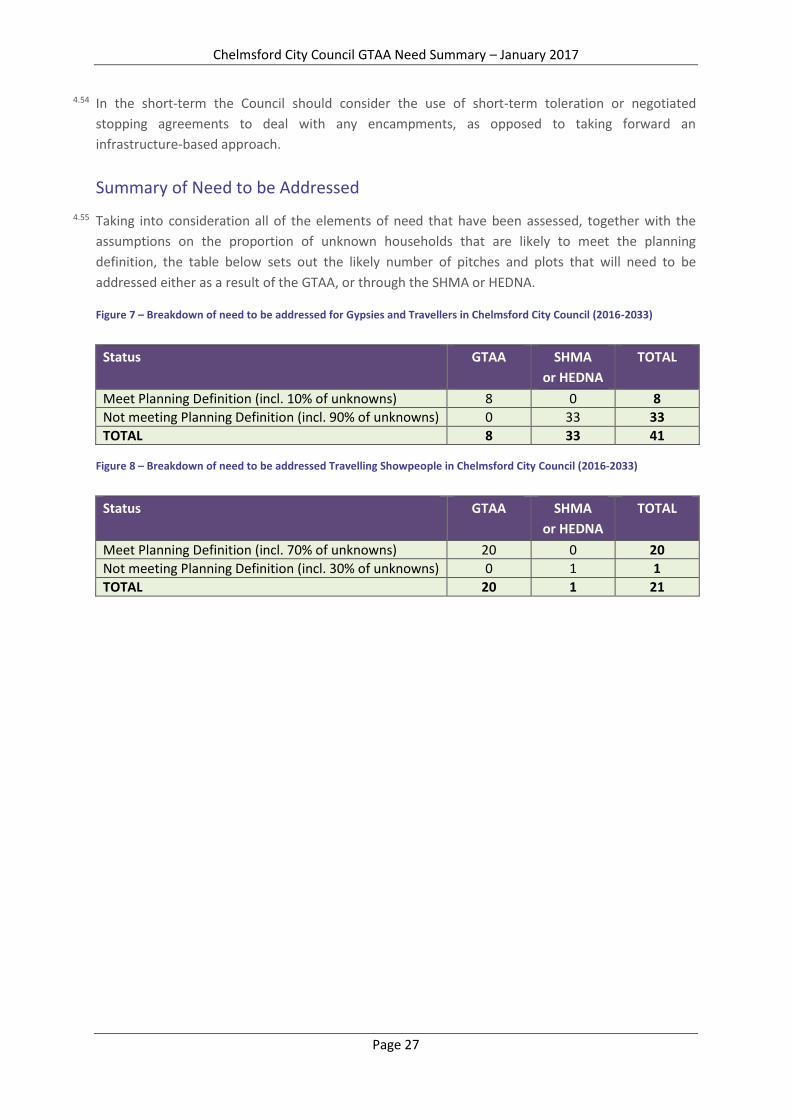
4.55 Taking into consideration all of the elements of need that have been assessed, together with the
assumptions on the proportion of unknown households that are likely to meet the planning
definition, the table below sets out the likely number of pitches and plots that will need to be
addressed either as a result of the GTAA, or through the SHMA or HEDNA.
Figure 7 – Breakdown of need to be addressed for Gypsies and Travellers in Chelmsford City Council (2016-2033)
Status GTAA SHMA
or HEDNA
TOTAL
Meet Planning Definition (incl. 10% of unknowns) 8 0 8
Not meeting Planning Definition (incl. 90% of unknowns) 0 33 33
TOTAL 8 33 41
Figure 8 – Breakdown of need to be addressed Travelling Showpeople in Chelmsford City Council (2016-2033)
Status GTAA SHMA
or HEDNA
TOTAL
Meet Planning Definition (incl. 70% of unknowns) 20 0 20
Not meeting Planning Definition (incl. 30% of unknowns) 0 1 1
TOTAL 20 1 21
Chelmsford City Council GTAA Need Summary – January 2017
Page 28
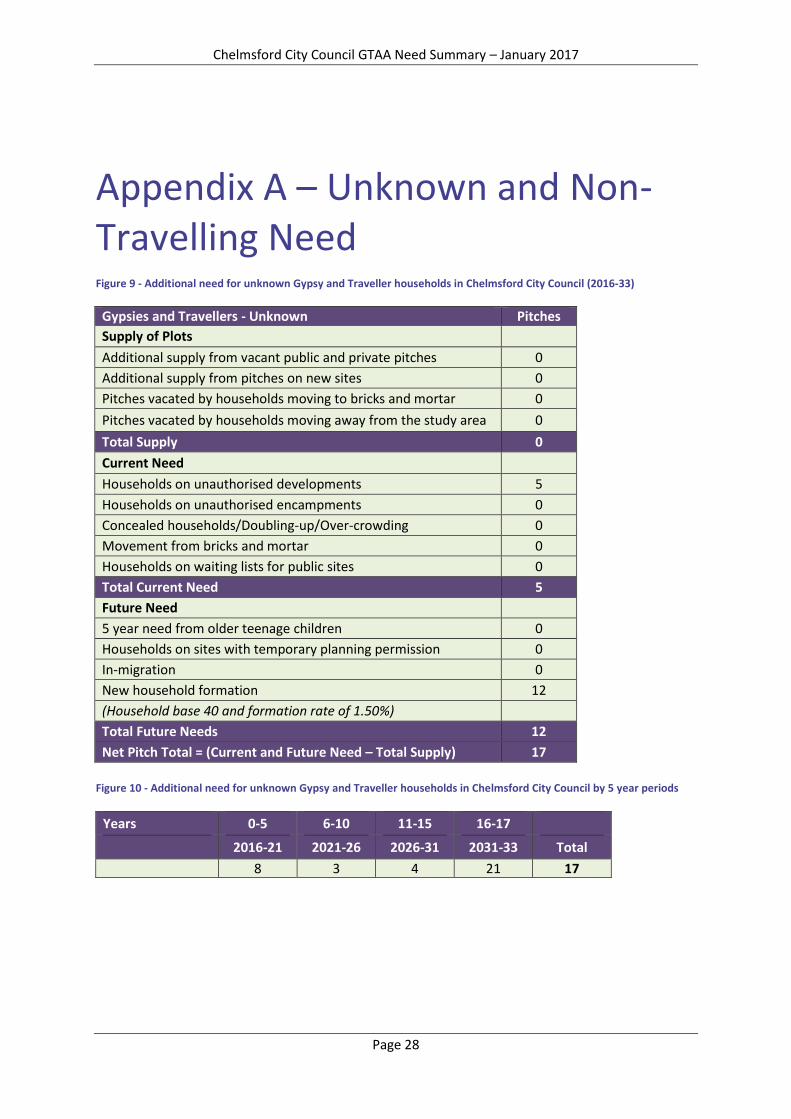
Appendix A – Unknown and Non-Travelling Need Figure 9 - Additional need for unknown Gypsy and Traveller households in Chelmsford City Council (2016-33)
Gypsies and Travellers - Unknown Pitches
Supply of Plots
Additional supply from vacant public and private pitches 0
Additional supply from pitches on new sites 0
Pitches vacated by households moving to bricks and mortar 0
Pitches vacated by households moving away from the study area 0
Total Supply 0
Current Need
Households on unauthorised developments 5
Households on unauthorised encampments 0
Concealed households/Doubling-up/Over-crowding 0
Movement from bricks and mortar 0
Households on waiting lists for public sites 0
Total Current Need 5
Future Need
5 year need from older teenage children 0
Households on sites with temporary planning permission 0
In-migration 0
New household formation 12
(Household base 40 and formation rate of 1.50%)
Total Future Needs 12
Net Pitch Total = (Current and Future Need – Total Supply) 17
Figure 10 - Additional need for unknown Gypsy and Traveller households in Chelmsford City Council by 5 year periods
Years 0-5 6-10 11-15 16-17
2016-21 2021-26 2026-31 2031-33 Total
8 3 4 21 17
Chelmsford City Council GTAA Need Summary – January 2017
Page 29
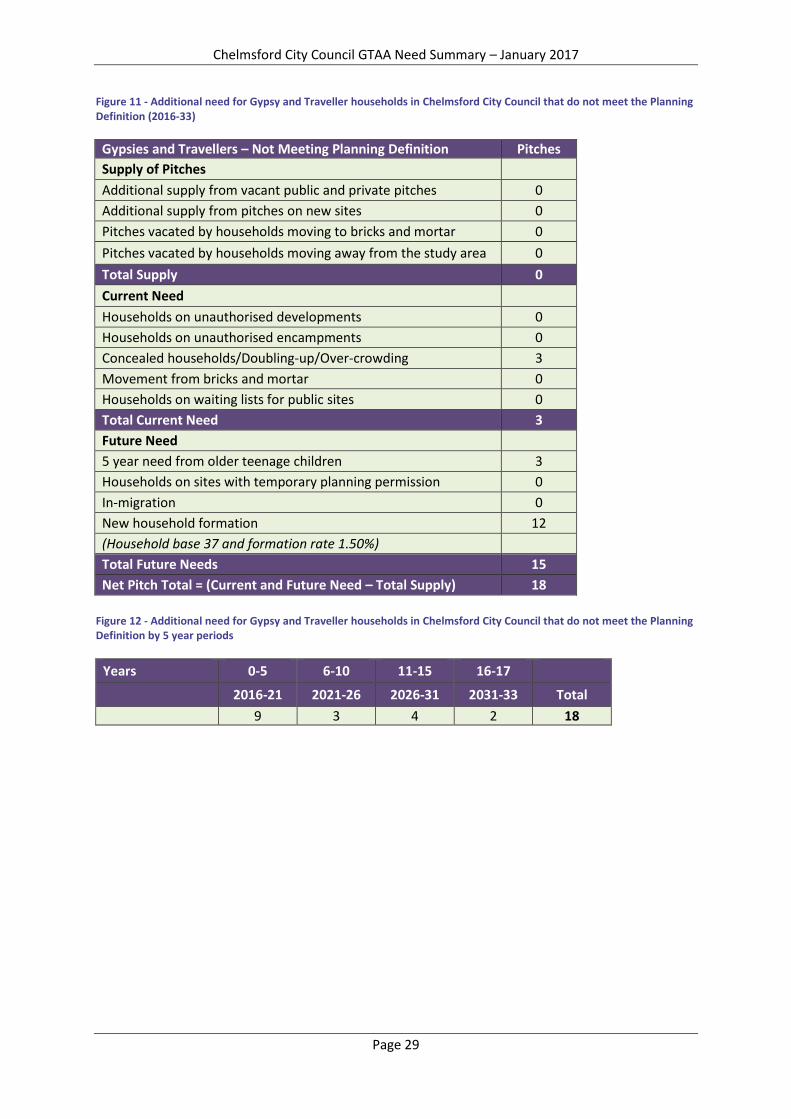
Figure 11 - Additional need for Gypsy and Traveller households in Chelmsford City Council that do not meet the Planning Definition (2016-33)
Gypsies and Travellers – Not Meeting Planning Definition Pitches
Supply of Pitches
Additional supply from vacant public and private pitches 0
Additional supply from pitches on new sites 0
Pitches vacated by households moving to bricks and mortar 0
Pitches vacated by households moving away from the study area 0
Total Supply 0
Current Need
Households on unauthorised developments 0
Households on unauthorised encampments 0
Concealed households/Doubling-up/Over-crowding 3
Movement from bricks and mortar 0
Households on waiting lists for public sites 0
Total Current Need 3
Future Need
5 year need from older teenage children 3
Households on sites with temporary planning permission 0
In-migration 0
New household formation 12
(Household base 37 and formation rate 1.50%)
Total Future Needs 15
Net Pitch Total = (Current and Future Need – Total Supply) 18
Figure 12 - Additional need for Gypsy and Traveller households in Chelmsford City Council that do not meet the Planning Definition by 5 year periods
Years 0-5 6-10 11-15 16-17
2016-21 2021-26 2026-31 2031-33 Total
9 3 4 2 18
Chelmsford City Council GTAA Need Summary – January 2017
Page 30
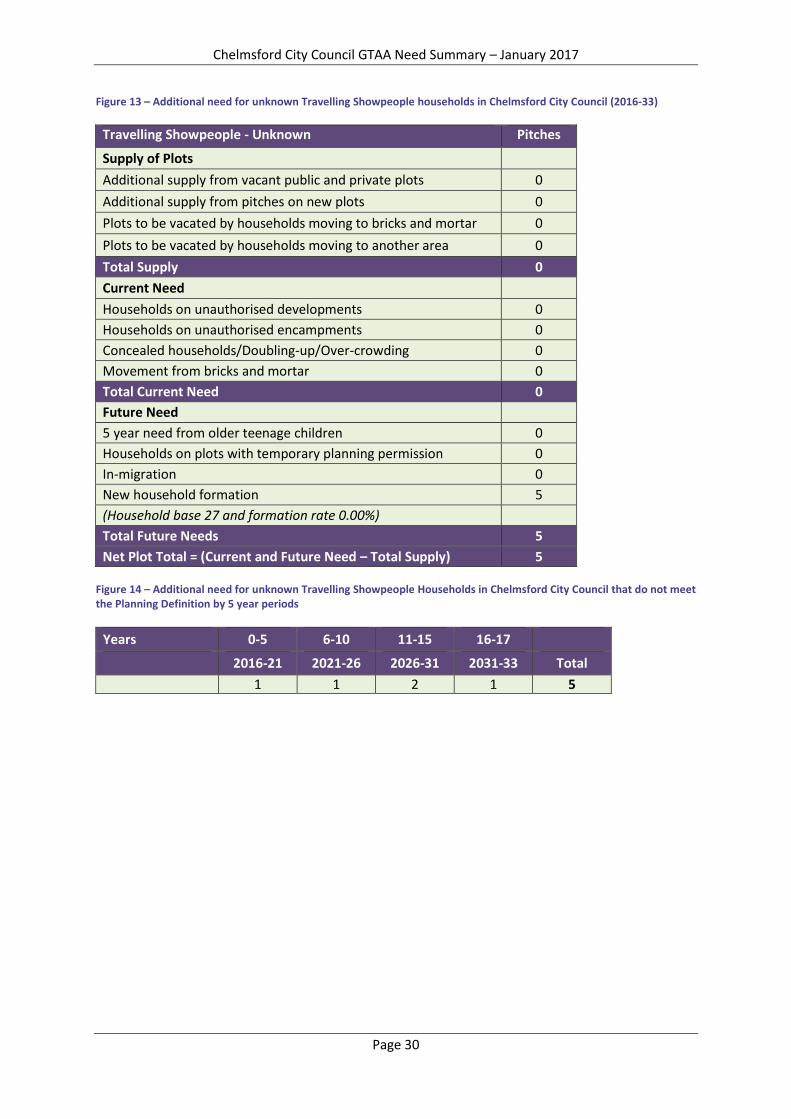
Figure 13 – Additional need for unknown Travelling Showpeople households in Chelmsford City Council (2016-33)
Travelling Showpeople - Unknown Pitches
Supply of Plots
Additional supply from vacant public and private plots 0
Additional supply from pitches on new plots 0
Plots to be vacated by households moving to bricks and mortar 0
Plots to be vacated by households moving to another area 0
Total Supply 0
Current Need
Households on unauthorised developments 0
Households on unauthorised encampments 0
Concealed households/Doubling-up/Over-crowding 0
Movement from bricks and mortar 0
Total Current Need 0
Future Need
5 year need from older teenage children 0
Households on plots with temporary planning permission 0
In-migration 0
New household formation 5
(Household base 27 and formation rate 0.00%)
Total Future Needs 5
Net Plot Total = (Current and Future Need – Total Supply) 5 Figure 14 – Additional need for unknown Travelling Showpeople Households in Chelmsford City Council that do not meet the Planning Definition by 5 year periods
Years 0-5 6-10 11-15 16-17
2016-21 2021-26 2026-31 2031-33 Total
1 1 2 1 5
Chelmsford City Council GTAA Need Summary – January 2017
Page 31
Appendix B – ORS Technical Note on Household Formation and Growth Rates
Opinion Research Services
Gypsy and Traveller Methodology: Household Formation and Growth Rates August 2015
1
Technical Note
Gypsy and Traveller Household Formation and Growth Rates
August 26th
2015
Opinion Research Services Spin-out company of Swansea University
Opinion Research Services
Opinion Research Services
Gypsy and Traveller Methodology: Household Formation and Growth Rates August 2015
2
As with all our studies, this research is subject to Opinion Research Services’ Standard
Terms and Conditions of Contract.
Any press release or publication of this research requires the advance approval of ORS.
Such approval will only be refused on the grounds of inaccuracy or misrepresentation.
© Copyright August 2015
Opinion Research Services
Gypsy and Traveller Methodology: Household Formation and Growth Rates August 2015
3
Contents
Household Growth Rates............................................................................................................................... 4
Abstract and conclusions ............................................................................................................................... 4
Introduction ................................................................................................................................................... 4
Compound growth ......................................................................................................................................... 6
Caravan counts .............................................................................................................................................. 7
Modelling population growth ........................................................................................................................ 8
Household growth ....................................................................................................................................... 12
Household dissolution rates ........................................................................................................................ 14
Summary conclusions .................................................................................................................................. 14
Opinion Research Services
Gypsy and Traveller Methodology: Household Formation and Growth Rates August 2015
4
Household Growth Rates Abstract and conclusions
1. National and local household formation and growth rates are important components of Gypsy and Traveller
accommodation assessments, but little detailed work has been done to assess their likely scale.
Nonetheless, nationally, a net growth rate of 3% per annum has been commonly assumed and widely used
in local assessments – even though there is actually no statistical evidence of households growing so
quickly. The result has been to inflate both national and local requirements for additional pitches
unrealistically.
2. Those seeking to provide evidence of high annual net household growth rates for Gypsies and Travellers
have sometimes sought to rely on increases in the number of caravans, as reflected in caravan counts.
However, caravan count data are unreliable and erratic – so the only proper way to project future
population and household growth is through demographic analysis (which, of course, is used to assess
housing needs in the settled community).
3. The growth in the Gypsy and Traveller population may be as low as 1.25% per annum – a rate which is
much less than the 3% per annum often assumed, but still at least four times greater than in the general
population. Even using extreme and unrealistic assumptions, it is hard to find evidence that net Gypsy and
Traveller population and household growth rates are above 2% per annum nationally.
4. The often assumed 3% per annum net household growth rate is unrealistic and would require clear
statistical evidence before being used for planning purposes. In practice, the best available evidence
supports a national net household growth rate of 1.5% per annum for Gypsies and Travellers.
5. Some local authorities might perhaps allow for a household growth rate of up to 2.5% per annum, to
provide a ‘margin’ if their populations are relatively youthful; but in areas where on-site surveys indicate
that there are fewer children in the Gypsy and Traveller communities, the lower estimate of 1.5% per
annum should be used for planning purposes.
Introduction
6. The rate of household growth is a key element in all housing assessments, including Gypsy and Traveller
accommodation assessments. Compared with the general population, the relative youthfulness of many
Gypsy and Traveller populations means that their birth rates are likely to generate higher-than-average
population growth, and proportionately higher gross household formation rates. However, while their
gross rate of household growth might be high, Gypsy and Traveller communities’ future accommodation
needs are, in practice, affected by any reduction in the number of households due to dissolution and/or by
movements in/out of the area and/or by transfers into other forms of housing. Therefore, the net rate of
household growth is the gross rate of formation minus any reductions in households due to such factors. Of
course, it is the net rate that is important in determining future accommodation needs for Gypsies and
Travellers.
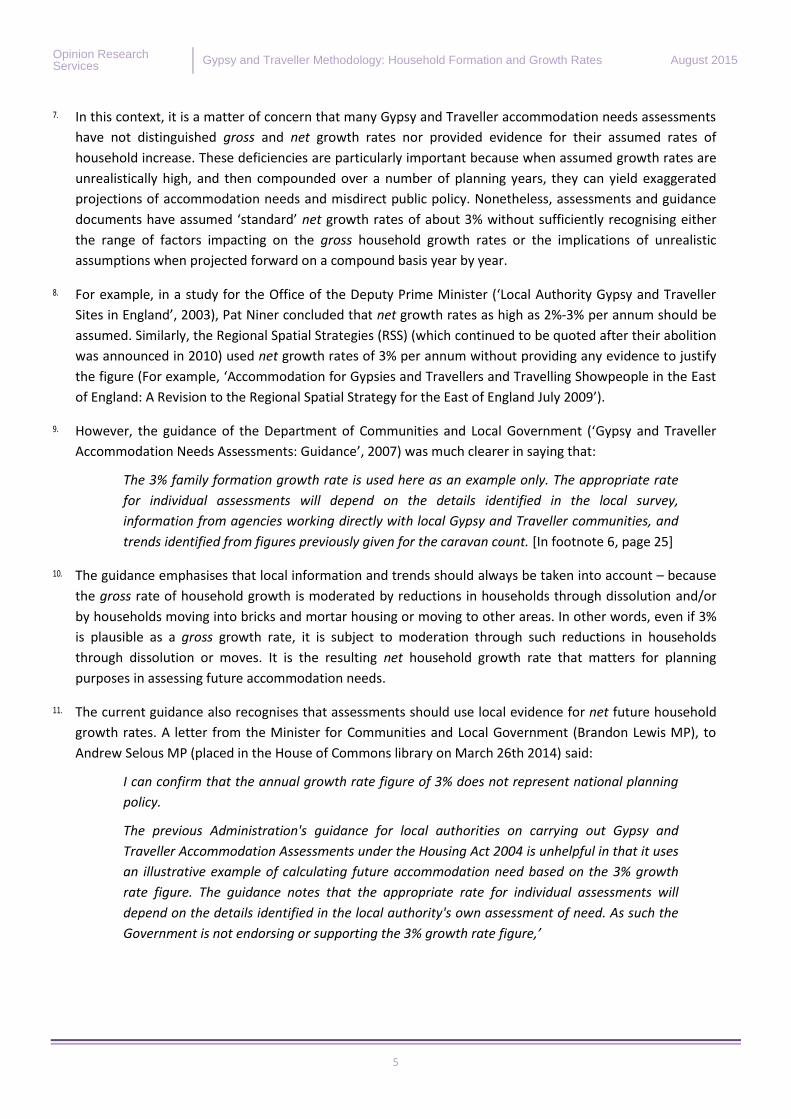
Opinion Research Services
Gypsy and Traveller Methodology: Household Formation and Growth Rates August 2015
5
7. In this context, it is a matter of concern that many Gypsy and Traveller accommodation needs assessments
have not distinguished gross and net growth rates nor provided evidence for their assumed rates of
household increase. These deficiencies are particularly important because when assumed growth rates are
unrealistically high, and then compounded over a number of planning years, they can yield exaggerated
projections of accommodation needs and misdirect public policy. Nonetheless, assessments and guidance
documents have assumed ‘standard’ net growth rates of about 3% without sufficiently recognising either
the range of factors impacting on the gross household growth rates or the implications of unrealistic
assumptions when projected forward on a compound basis year by year.
8. For example, in a study for the Office of the Deputy Prime Minister (‘Local Authority Gypsy and Traveller
Sites in England’, 2003), Pat Niner concluded that net growth rates as high as 2%-3% per annum should be
assumed. Similarly, the Regional Spatial Strategies (RSS) (which continued to be quoted after their abolition
was announced in 2010) used net growth rates of 3% per annum without providing any evidence to justify
the figure (For example, ‘Accommodation for Gypsies and Travellers and Travelling Showpeople in the East
of England: A Revision to the Regional Spatial Strategy for the East of England July 2009’).
9. However, the guidance of the Department of Communities and Local Government (‘Gypsy and Traveller
Accommodation Needs Assessments: Guidance’, 2007) was much clearer in saying that:
The 3% family formation growth rate is used here as an example only. The appropriate rate
for individual assessments will depend on the details identified in the local survey,
information from agencies working directly with local Gypsy and Traveller communities, and
trends identified from figures previously given for the caravan count. [In footnote 6, page 25]
10. The guidance emphasises that local information and trends should always be taken into account – because
the gross rate of household growth is moderated by reductions in households through dissolution and/or
by households moving into bricks and mortar housing or moving to other areas. In other words, even if 3%
is plausible as a gross growth rate, it is subject to moderation through such reductions in households
through dissolution or moves. It is the resulting net household growth rate that matters for planning
purposes in assessing future accommodation needs.
11. The current guidance also recognises that assessments should use local evidence for net future household
growth rates. A letter from the Minister for Communities and Local Government (Brandon Lewis MP), to
Andrew Selous MP (placed in the House of Commons library on March 26th 2014) said:
I can confirm that the annual growth rate figure of 3% does not represent national planning
policy.
The previous Administration's guidance for local authorities on carrying out Gypsy and
Traveller Accommodation Assessments under the Housing Act 2004 is unhelpful in that it uses
an illustrative example of calculating future accommodation need based on the 3% growth
rate figure. The guidance notes that the appropriate rate for individual assessments will
depend on the details identified in the local authority's own assessment of need. As such the
Government is not endorsing or supporting the 3% growth rate figure,’
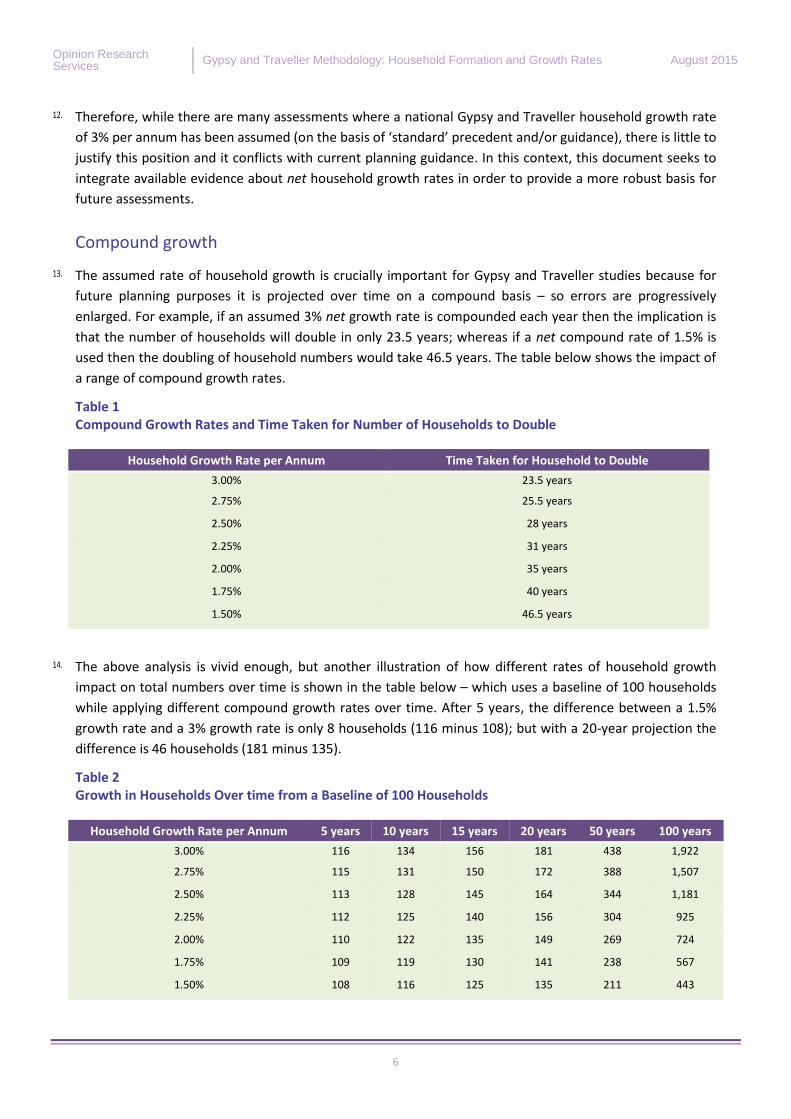
Opinion Research Services
Gypsy and Traveller Methodology: Household Formation and Growth Rates August 2015
6
12. Therefore, while there are many assessments where a national Gypsy and Traveller household growth rate
of 3% per annum has been assumed (on the basis of ‘standard’ precedent and/or guidance), there is little to
justify this position and it conflicts with current planning guidance. In this context, this document seeks to
integrate available evidence about net household growth rates in order to provide a more robust basis for
future assessments.
Compound growth
13. The assumed rate of household growth is crucially important for Gypsy and Traveller studies because for
future planning purposes it is projected over time on a compound basis – so errors are progressively
enlarged. For example, if an assumed 3% net growth rate is compounded each year then the implication is
that the number of households will double in only 23.5 years; whereas if a net compound rate of 1.5% is
used then the doubling of household numbers would take 46.5 years. The table below shows the impact of
a range of compound growth rates.
Table 1 Compound Growth Rates and Time Taken for Number of Households to Double
Household Growth Rate per Annum Time Taken for Household to Double
3.00% 23.5 years
2.75% 25.5 years
2.50% 28 years
2.25% 31 years
2.00% 35 years
1.75% 40 years
1.50% 46.5 years
14. The above analysis is vivid enough, but another illustration of how different rates of household growth
impact on total numbers over time is shown in the table below – which uses a baseline of 100 households
while applying different compound growth rates over time. After 5 years, the difference between a 1.5%
growth rate and a 3% growth rate is only 8 households (116 minus 108); but with a 20-year projection the
difference is 46 households (181 minus 135).
Table 2 Growth in Households Over time from a Baseline of 100 Households
Household Growth Rate per Annum 5 years 10 years 15 years 20 years 50 years 100 years
3.00% 116 134 156 181 438 1,922
2.75% 115 131 150 172 388 1,507
2.50% 113 128 145 164 344 1,181
2.25% 112 125 140 156 304 925
2.00% 110 122 135 149 269 724
1.75% 109 119 130 141 238 567
1.50% 108 116 125 135 211 443
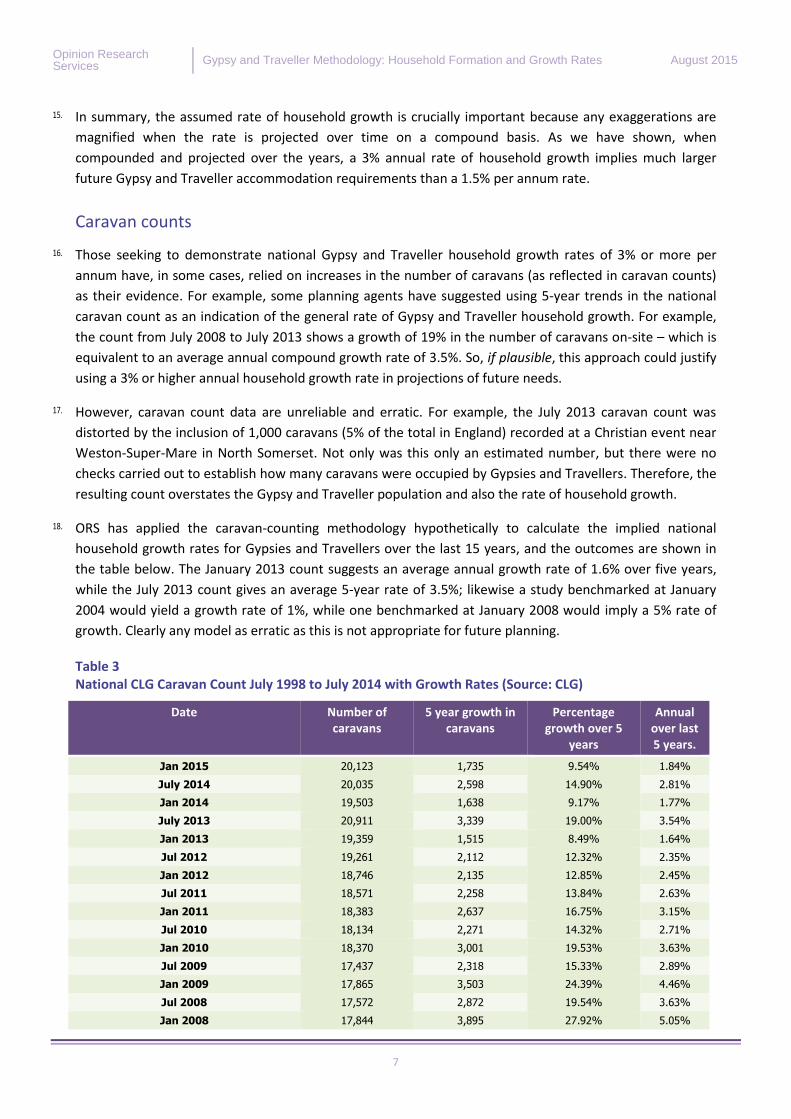
Opinion Research Services
Gypsy and Traveller Methodology: Household Formation and Growth Rates August 2015
7
15. In summary, the assumed rate of household growth is crucially important because any exaggerations are
magnified when the rate is projected over time on a compound basis. As we have shown, when
compounded and projected over the years, a 3% annual rate of household growth implies much larger
future Gypsy and Traveller accommodation requirements than a 1.5% per annum rate.
Caravan counts
16. Those seeking to demonstrate national Gypsy and Traveller household growth rates of 3% or more per
annum have, in some cases, relied on increases in the number of caravans (as reflected in caravan counts)
as their evidence. For example, some planning agents have suggested using 5-year trends in the national
caravan count as an indication of the general rate of Gypsy and Traveller household growth. For example,
the count from July 2008 to July 2013 shows a growth of 19% in the number of caravans on-site – which is
equivalent to an average annual compound growth rate of 3.5%. So, if plausible, this approach could justify
using a 3% or higher annual household growth rate in projections of future needs.
17. However, caravan count data are unreliable and erratic. For example, the July 2013 caravan count was
distorted by the inclusion of 1,000 caravans (5% of the total in England) recorded at a Christian event near
Weston-Super-Mare in North Somerset. Not only was this only an estimated number, but there were no
checks carried out to establish how many caravans were occupied by Gypsies and Travellers. Therefore, the
resulting count overstates the Gypsy and Traveller population and also the rate of household growth.
18. ORS has applied the caravan-counting methodology hypothetically to calculate the implied national
household growth rates for Gypsies and Travellers over the last 15 years, and the outcomes are shown in
the table below. The January 2013 count suggests an average annual growth rate of 1.6% over five years,
while the July 2013 count gives an average 5-year rate of 3.5%; likewise a study benchmarked at January
2004 would yield a growth rate of 1%, while one benchmarked at January 2008 would imply a 5% rate of
growth. Clearly any model as erratic as this is not appropriate for future planning.
Table 3 National CLG Caravan Count July 1998 to July 2014 with Growth Rates (Source: CLG)
Date Number of caravans
5 year growth in caravans
Percentage growth over 5
years
Annual over last 5 years.
Jan 2015 20,123 1,735 9.54% 1.84%
July 2014 20,035 2,598 14.90% 2.81%
Jan 2014 19,503 1,638 9.17% 1.77%
July 2013 20,911 3,339 19.00% 3.54%
Jan 2013 19,359 1,515 8.49% 1.64%
Jul 2012 19,261 2,112 12.32% 2.35%
Jan 2012 18,746 2,135 12.85% 2.45%
Jul 2011 18,571 2,258 13.84% 2.63%
Jan 2011 18,383 2,637 16.75% 3.15%
Jul 2010 18,134 2,271 14.32% 2.71%
Jan 2010 18,370 3,001 19.53% 3.63%
Jul 2009 17,437 2,318 15.33% 2.89%
Jan 2009 17,865 3,503 24.39% 4.46%
Jul 2008 17,572 2,872 19.54% 3.63%
Jan 2008 17,844 3,895 27.92% 5.05%
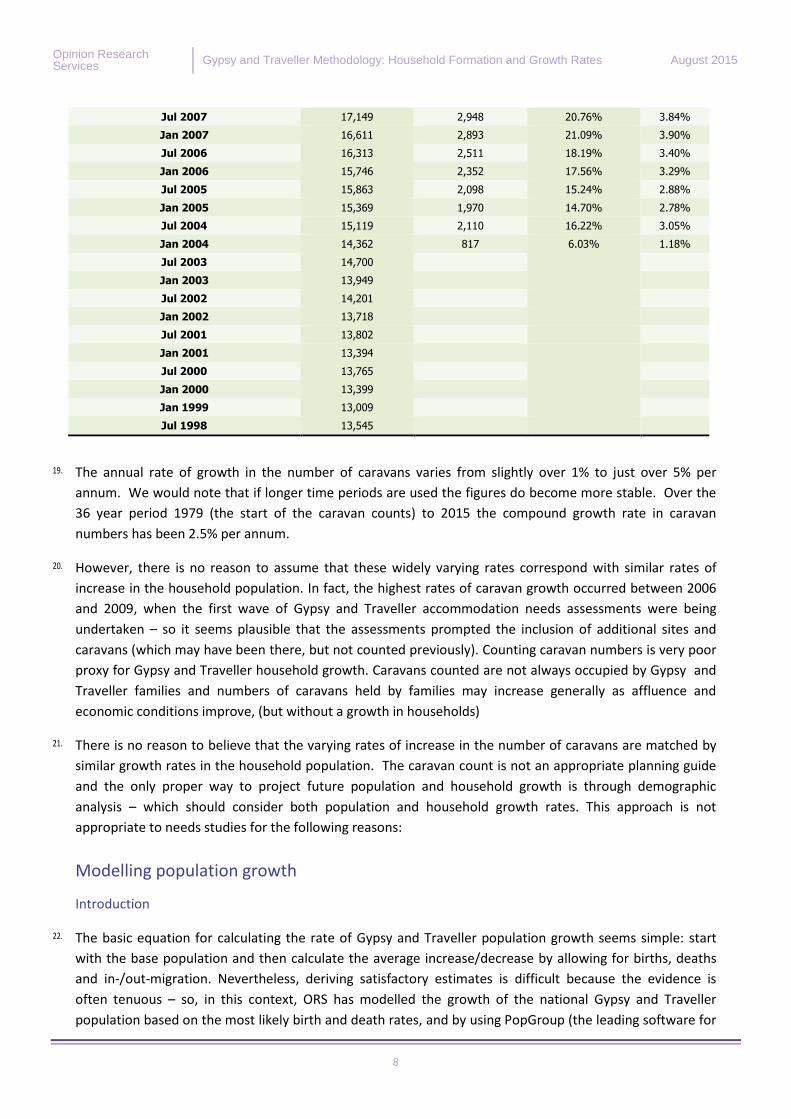
Opinion Research Services
Gypsy and Traveller Methodology: Household Formation and Growth Rates August 2015
8
Jul 2007 17,149 2,948 20.76% 3.84%
Jan 2007 16,611 2,893 21.09% 3.90%
Jul 2006 16,313 2,511 18.19% 3.40%
Jan 2006 15,746 2,352 17.56% 3.29%
Jul 2005 15,863 2,098 15.24% 2.88%
Jan 2005 15,369 1,970 14.70% 2.78%
Jul 2004 15,119 2,110 16.22% 3.05%
Jan 2004 14,362 817 6.03% 1.18%
Jul 2003 14,700
Jan 2003 13,949
Jul 2002 14,201
Jan 2002 13,718
Jul 2001 13,802
Jan 2001 13,394
Jul 2000 13,765
Jan 2000 13,399
Jan 1999 13,009
Jul 1998 13,545
19. The annual rate of growth in the number of caravans varies from slightly over 1% to just over 5% per
annum. We would note that if longer time periods are used the figures do become more stable. Over the
36 year period 1979 (the start of the caravan counts) to 2015 the compound growth rate in caravan
numbers has been 2.5% per annum.
20. However, there is no reason to assume that these widely varying rates correspond with similar rates of
increase in the household population. In fact, the highest rates of caravan growth occurred between 2006
and 2009, when the first wave of Gypsy and Traveller accommodation needs assessments were being
undertaken – so it seems plausible that the assessments prompted the inclusion of additional sites and
caravans (which may have been there, but not counted previously). Counting caravan numbers is very poor
proxy for Gypsy and Traveller household growth. Caravans counted are not always occupied by Gypsy and
Traveller families and numbers of caravans held by families may increase generally as affluence and
economic conditions improve, (but without a growth in households)
21. There is no reason to believe that the varying rates of increase in the number of caravans are matched by
similar growth rates in the household population. The caravan count is not an appropriate planning guide
and the only proper way to project future population and household growth is through demographic
analysis – which should consider both population and household growth rates. This approach is not
appropriate to needs studies for the following reasons:
Modelling population growth
Introduction
22. The basic equation for calculating the rate of Gypsy and Traveller population growth seems simple: start
with the base population and then calculate the average increase/decrease by allowing for births, deaths
and in-/out-migration. Nevertheless, deriving satisfactory estimates is difficult because the evidence is
often tenuous – so, in this context, ORS has modelled the growth of the national Gypsy and Traveller
population based on the most likely birth and death rates, and by using PopGroup (the leading software for
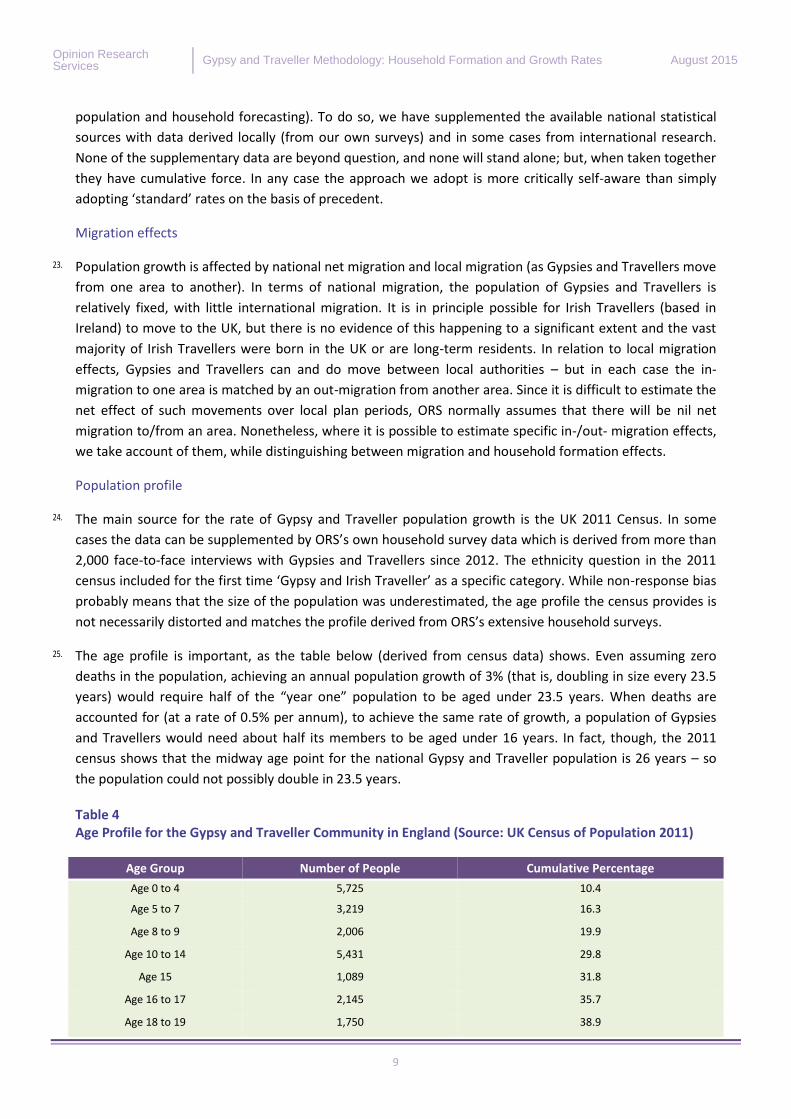
Opinion Research Services
Gypsy and Traveller Methodology: Household Formation and Growth Rates August 2015
9
population and household forecasting). To do so, we have supplemented the available national statistical
sources with data derived locally (from our own surveys) and in some cases from international research.
None of the supplementary data are beyond question, and none will stand alone; but, when taken together
they have cumulative force. In any case the approach we adopt is more critically self-aware than simply
adopting ‘standard’ rates on the basis of precedent.
Migration effects
23. Population growth is affected by national net migration and local migration (as Gypsies and Travellers move
from one area to another). In terms of national migration, the population of Gypsies and Travellers is
relatively fixed, with little international migration. It is in principle possible for Irish Travellers (based in
Ireland) to move to the UK, but there is no evidence of this happening to a significant extent and the vast
majority of Irish Travellers were born in the UK or are long-term residents. In relation to local migration
effects, Gypsies and Travellers can and do move between local authorities – but in each case the in-
migration to one area is matched by an out-migration from another area. Since it is difficult to estimate the
net effect of such movements over local plan periods, ORS normally assumes that there will be nil net
migration to/from an area. Nonetheless, where it is possible to estimate specific in-/out- migration effects,
we take account of them, while distinguishing between migration and household formation effects.
Population profile
24. The main source for the rate of Gypsy and Traveller population growth is the UK 2011 Census. In some
cases the data can be supplemented by ORS’s own household survey data which is derived from more than
2,000 face-to-face interviews with Gypsies and Travellers since 2012. The ethnicity question in the 2011
census included for the first time ‘Gypsy and Irish Traveller’ as a specific category. While non-response bias
probably means that the size of the population was underestimated, the age profile the census provides is
not necessarily distorted and matches the profile derived from ORS’s extensive household surveys.
25. The age profile is important, as the table below (derived from census data) shows. Even assuming zero
deaths in the population, achieving an annual population growth of 3% (that is, doubling in size every 23.5
years) would require half of the “year one” population to be aged under 23.5 years. When deaths are
accounted for (at a rate of 0.5% per annum), to achieve the same rate of growth, a population of Gypsies
and Travellers would need about half its members to be aged under 16 years. In fact, though, the 2011
census shows that the midway age point for the national Gypsy and Traveller population is 26 years – so
the population could not possibly double in 23.5 years.
Table 4 Age Profile for the Gypsy and Traveller Community in England (Source: UK Census of Population 2011)
Age Group Number of People Cumulative Percentage
Age 0 to 4 5,725 10.4
Age 5 to 7 3,219 16.3
Age 8 to 9 2,006 19.9
Age 10 to 14 5,431 29.8
Age 15 1,089 31.8
Age 16 to 17 2,145 35.7
Age 18 to 19 1,750 38.9
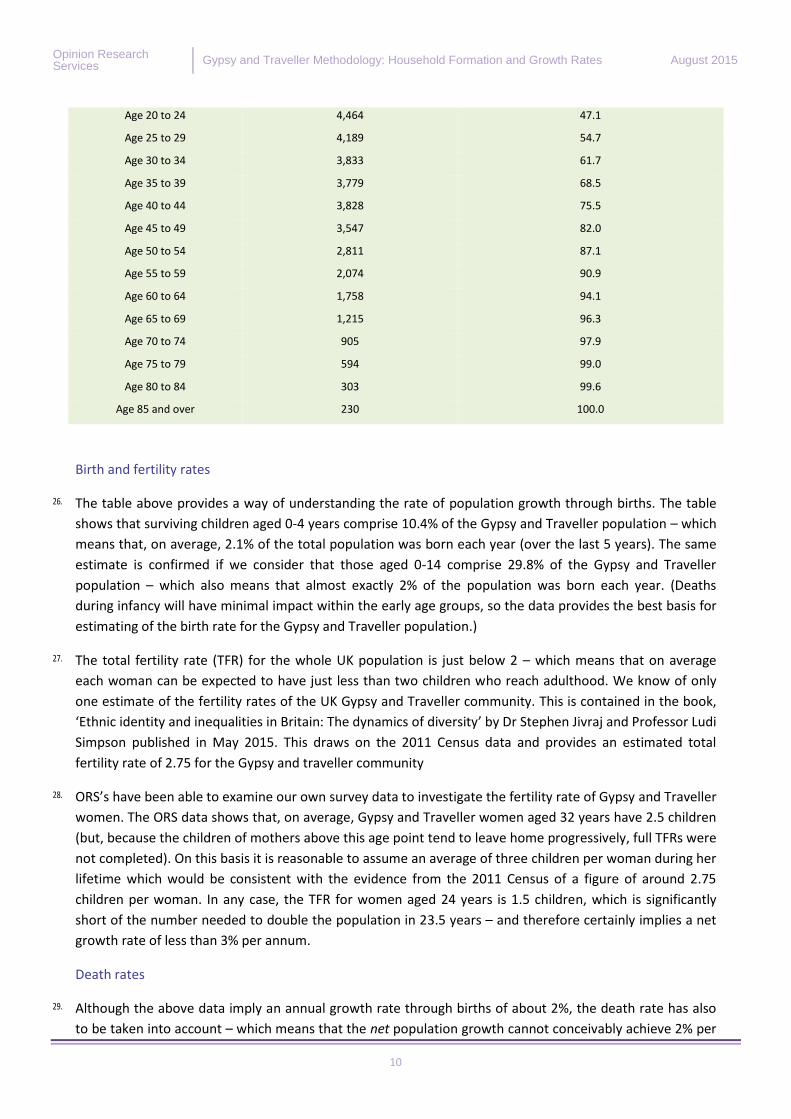
Opinion Research Services
Gypsy and Traveller Methodology: Household Formation and Growth Rates August 2015
10
Age 20 to 24 4,464 47.1
Age 25 to 29 4,189 54.7
Age 30 to 34 3,833 61.7
Age 35 to 39 3,779 68.5
Age 40 to 44 3,828 75.5
Age 45 to 49 3,547 82.0
Age 50 to 54 2,811 87.1
Age 55 to 59 2,074 90.9
Age 60 to 64 1,758 94.1
Age 65 to 69 1,215 96.3
Age 70 to 74 905 97.9
Age 75 to 79 594 99.0
Age 80 to 84 303 99.6
Age 85 and over 230 100.0
Birth and fertility rates
26. The table above provides a way of understanding the rate of population growth through births. The table
shows that surviving children aged 0-4 years comprise 10.4% of the Gypsy and Traveller population – which
means that, on average, 2.1% of the total population was born each year (over the last 5 years). The same
estimate is confirmed if we consider that those aged 0-14 comprise 29.8% of the Gypsy and Traveller
population – which also means that almost exactly 2% of the population was born each year. (Deaths
during infancy will have minimal impact within the early age groups, so the data provides the best basis for
estimating of the birth rate for the Gypsy and Traveller population.)
27. The total fertility rate (TFR) for the whole UK population is just below 2 – which means that on average
each woman can be expected to have just less than two children who reach adulthood. We know of only
one estimate of the fertility rates of the UK Gypsy and Traveller community. This is contained in the book,
‘Ethnic identity and inequalities in Britain: The dynamics of diversity’ by Dr Stephen Jivraj and Professor Ludi
Simpson published in May 2015. This draws on the 2011 Census data and provides an estimated total
fertility rate of 2.75 for the Gypsy and traveller community
28. ORS’s have been able to examine our own survey data to investigate the fertility rate of Gypsy and Traveller
women. The ORS data shows that, on average, Gypsy and Traveller women aged 32 years have 2.5 children
(but, because the children of mothers above this age point tend to leave home progressively, full TFRs were
not completed). On this basis it is reasonable to assume an average of three children per woman during her
lifetime which would be consistent with the evidence from the 2011 Census of a figure of around 2.75
children per woman. In any case, the TFR for women aged 24 years is 1.5 children, which is significantly
short of the number needed to double the population in 23.5 years – and therefore certainly implies a net
growth rate of less than 3% per annum.
Death rates
29. Although the above data imply an annual growth rate through births of about 2%, the death rate has also
to be taken into account – which means that the net population growth cannot conceivably achieve 2% per
Opinion Research Services
Gypsy and Traveller Methodology: Household Formation and Growth Rates August 2015
11
annum. In England and Wales there are nearly half-a-million deaths each year – about 0.85% of the total
population of 56.1 million in 2011. If this death rate is applied to the Gypsy and Traveller community then
the resulting projected growth rate is in the region of 1.15%-1.25% per annum.
30. However, the Gypsy and Traveller population is significantly younger than average and may be expected to
have a lower percentage death rate overall (even though a smaller than average proportion of the
population lives beyond 68 to 70 years). While there can be no certainty, an assumed death rate of around
0.5% to 0.6% per annum would imply a net population growth rate of around 1.5% per annum.
31. Even though the population is younger and has a lower death rate than average, Gypsies and Travellers are
less likely than average to live beyond 68 to 70 years. Whereas the average life expectancy across the
whole population of the UK is currently just over 80 years, a Sheffield University study found that Gypsy
and Traveller life expectancy is about 10-12 years less than average (Parry et al (2004) ‘The Health Status of
Gypsies and Travellers: Report of Department of Health Inequalities in Health Research Initiative’,
University of Sheffield). Therefore, in our population growth modelling we have used a conservative
estimate of average life expectancy as 72 years – which is entirely consistent with the lower-than-average
number of Gypsies and Travellers aged over 70 years in the 2011 census (and also in ORS’s own survey
data). On the basis of the Sheffield study, we could have supposed a life expectancy of only 68, but we have
been cautious in our approach.
Modelling outputs
32. If we assume a TFR of 3 and an average life expectancy of 72 years for Gypsies and Travellers, then the
modelling projects the population to increase by 66% over the next 40 years – implying a population
compound growth rate of 1.25% per annum (well below the 3% per annum often assumed). If we assume
that Gypsy and Traveller life expectancy increases to 77 years by 2050, then the projected population
growth rate rises to nearly 1.5% per annum. To generate an ‘upper range’ rate of population growth, we
have assumed a TFR of 4 and an average life expectancy rising to 77 over the next 40 years – which then
yields an ‘upper range’ growth rate of 1.9% per annum. We should note, though, that national TFR rates of
4 are currently found only in sub-Saharan Africa and Afghanistan, so it is an implausible assumption.
33. There are indications that these modelling outputs are well founded. For example, in the ONS’s 2012-based
Sub-National Population Projections the projected population growth rate for England to 2037 is 0.6% per
annum, of which 60% is due to natural change and 40% due to migration. Therefore, the natural population
growth rate for England is almost exactly 0.35% per annum – meaning that our estimate of the Gypsy and
Traveller population growth rate is four times greater than that of the general population of England.
34. The ORS Gypsy and Traveller findings are also supported by data for comparable populations around the
world. As noted, on the basis of sophisticated analysis, Hungary is planning for its Roma population to grow
at around 2.0% per annum, but the underlying demographic growth is typically closer to 1.5% per annum.
The World Bank estimates that the populations of Bolivia, Cambodia, Egypt, Malaysia, Pakistan, Paraguay,
Philippines and Venezuela (countries with high birth rates and improving life expectancy) all show
population growth rates of around 1.7% per annum. Therefore, in the context of national data, ORS’s
modelling and plausible international comparisons, it is implausible to assume a net 3% annual growth rate
for the Gypsy and Traveller population.
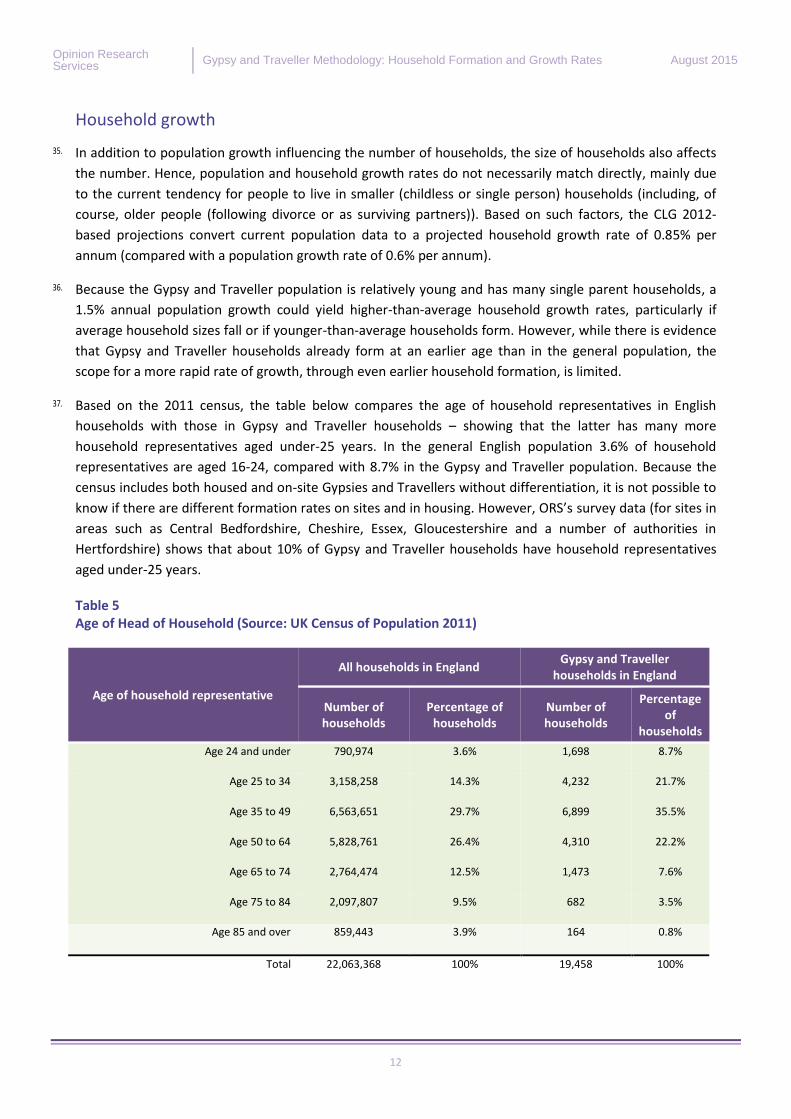
Opinion Research Services
Gypsy and Traveller Methodology: Household Formation and Growth Rates August 2015
12
Household growth
35. In addition to population growth influencing the number of households, the size of households also affects
the number. Hence, population and household growth rates do not necessarily match directly, mainly due
to the current tendency for people to live in smaller (childless or single person) households (including, of
course, older people (following divorce or as surviving partners)). Based on such factors, the CLG 2012-
based projections convert current population data to a projected household growth rate of 0.85% per
annum (compared with a population growth rate of 0.6% per annum).
36. Because the Gypsy and Traveller population is relatively young and has many single parent households, a
1.5% annual population growth could yield higher-than-average household growth rates, particularly if
average household sizes fall or if younger-than-average households form. However, while there is evidence
that Gypsy and Traveller households already form at an earlier age than in the general population, the
scope for a more rapid rate of growth, through even earlier household formation, is limited.
37. Based on the 2011 census, the table below compares the age of household representatives in English
households with those in Gypsy and Traveller households – showing that the latter has many more
household representatives aged under-25 years. In the general English population 3.6% of household
representatives are aged 16-24, compared with 8.7% in the Gypsy and Traveller population. Because the
census includes both housed and on-site Gypsies and Travellers without differentiation, it is not possible to
know if there are different formation rates on sites and in housing. However, ORS’s survey data (for sites in
areas such as Central Bedfordshire, Cheshire, Essex, Gloucestershire and a number of authorities in
Hertfordshire) shows that about 10% of Gypsy and Traveller households have household representatives
aged under-25 years.
Table 5 Age of Head of Household (Source: UK Census of Population 2011)
Age of household representative
All households in England Gypsy and Traveller
households in England
Number of households
Percentage of households
Number of households
Percentage of
households
Age 24 and under 790,974 3.6% 1,698 8.7%
Age 25 to 34 3,158,258 14.3% 4,232 21.7%
Age 35 to 49 6,563,651 29.7% 6,899 35.5%
Age 50 to 64 5,828,761 26.4% 4,310 22.2%
Age 65 to 74 2,764,474 12.5% 1,473 7.6%
Age 75 to 84 2,097,807 9.5% 682 3.5%
Age 85 and over 859,443 3.9% 164 0.8%
Total 22,063,368 100% 19,458 100%
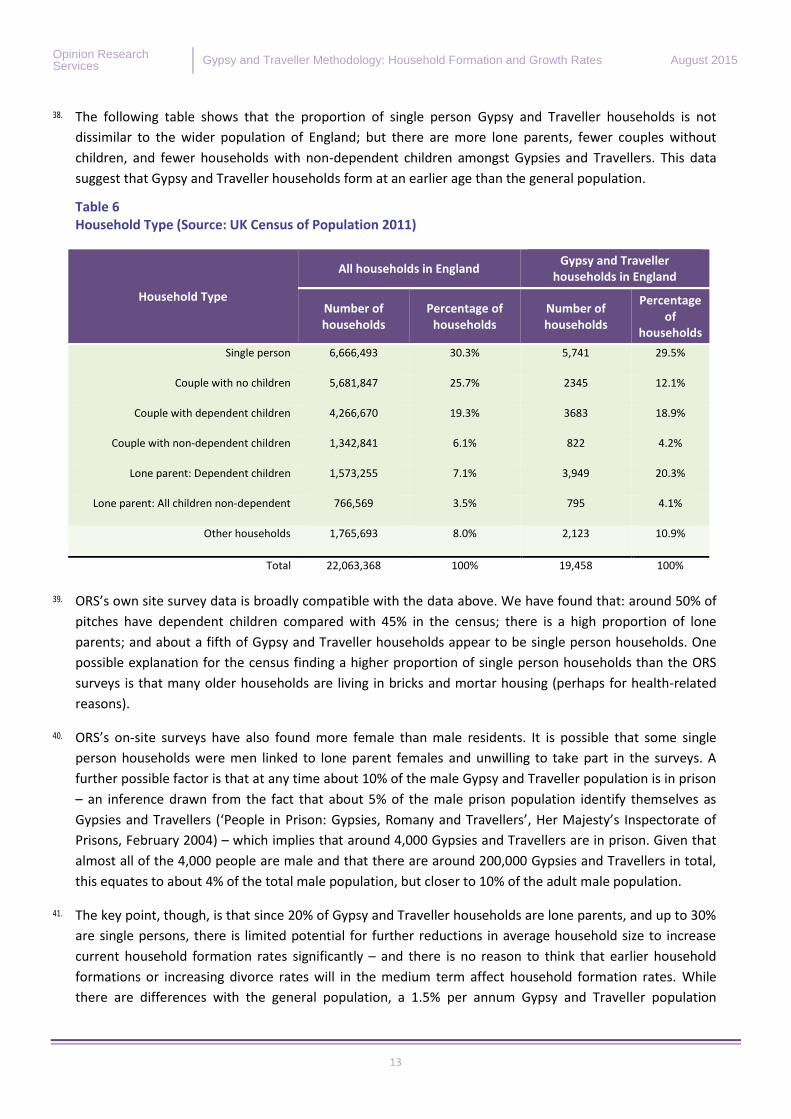
Opinion Research Services
Gypsy and Traveller Methodology: Household Formation and Growth Rates August 2015
13
38. The following table shows that the proportion of single person Gypsy and Traveller households is not
dissimilar to the wider population of England; but there are more lone parents, fewer couples without
children, and fewer households with non-dependent children amongst Gypsies and Travellers. This data
suggest that Gypsy and Traveller households form at an earlier age than the general population.
Table 6 Household Type (Source: UK Census of Population 2011)
Household Type
All households in England Gypsy and Traveller
households in England
Number of households
Percentage of households
Number of households
Percentage of
households
Single person 6,666,493 30.3% 5,741 29.5%
Couple with no children 5,681,847 25.7% 2345 12.1%
Couple with dependent children 4,266,670 19.3% 3683 18.9%
Couple with non-dependent children 1,342,841 6.1% 822 4.2%
Lone parent: Dependent children 1,573,255 7.1% 3,949 20.3%
Lone parent: All children non-dependent 766,569 3.5% 795 4.1%
Other households 1,765,693 8.0% 2,123 10.9%
Total 22,063,368 100% 19,458 100%
39. ORS’s own site survey data is broadly compatible with the data above. We have found that: around 50% of
pitches have dependent children compared with 45% in the census; there is a high proportion of lone
parents; and about a fifth of Gypsy and Traveller households appear to be single person households. One
possible explanation for the census finding a higher proportion of single person households than the ORS
surveys is that many older households are living in bricks and mortar housing (perhaps for health-related
reasons).
40. ORS’s on-site surveys have also found more female than male residents. It is possible that some single
person households were men linked to lone parent females and unwilling to take part in the surveys. A
further possible factor is that at any time about 10% of the male Gypsy and Traveller population is in prison
– an inference drawn from the fact that about 5% of the male prison population identify themselves as
Gypsies and Travellers (‘People in Prison: Gypsies, Romany and Travellers’, Her Majesty’s Inspectorate of
Prisons, February 2004) – which implies that around 4,000 Gypsies and Travellers are in prison. Given that
almost all of the 4,000 people are male and that there are around 200,000 Gypsies and Travellers in total,
this equates to about 4% of the total male population, but closer to 10% of the adult male population.
41. The key point, though, is that since 20% of Gypsy and Traveller households are lone parents, and up to 30%
are single persons, there is limited potential for further reductions in average household size to increase
current household formation rates significantly – and there is no reason to think that earlier household
formations or increasing divorce rates will in the medium term affect household formation rates. While
there are differences with the general population, a 1.5% per annum Gypsy and Traveller population
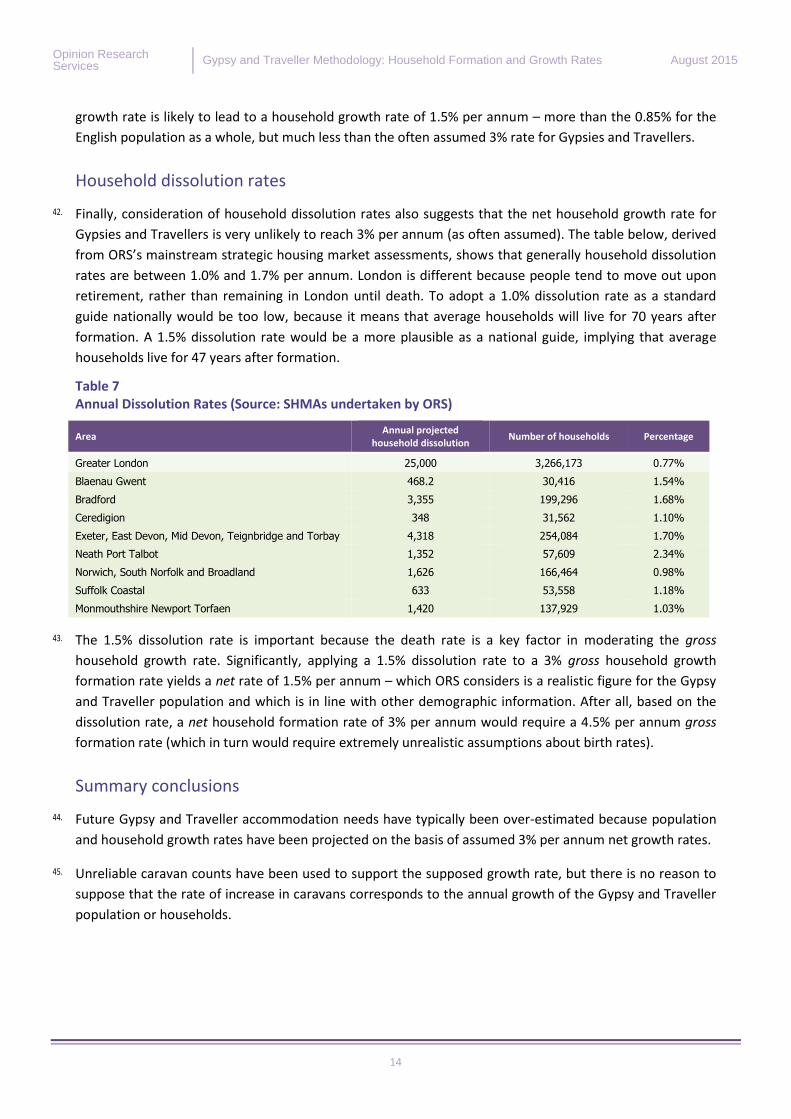
Opinion Research Services
Gypsy and Traveller Methodology: Household Formation and Growth Rates August 2015
14
growth rate is likely to lead to a household growth rate of 1.5% per annum – more than the 0.85% for the
English population as a whole, but much less than the often assumed 3% rate for Gypsies and Travellers.
Household dissolution rates
42. Finally, consideration of household dissolution rates also suggests that the net household growth rate for
Gypsies and Travellers is very unlikely to reach 3% per annum (as often assumed). The table below, derived
from ORS’s mainstream strategic housing market assessments, shows that generally household dissolution
rates are between 1.0% and 1.7% per annum. London is different because people tend to move out upon
retirement, rather than remaining in London until death. To adopt a 1.0% dissolution rate as a standard
guide nationally would be too low, because it means that average households will live for 70 years after
formation. A 1.5% dissolution rate would be a more plausible as a national guide, implying that average
households live for 47 years after formation.
Table 7 Annual Dissolution Rates (Source: SHMAs undertaken by ORS)
Area Annual projected
household dissolution Number of households Percentage
Greater London 25,000 3,266,173 0.77%
Blaenau Gwent 468.2 30,416 1.54%
Bradford 3,355 199,296 1.68%
Ceredigion 348 31,562 1.10%
Exeter, East Devon, Mid Devon, Teignbridge and Torbay 4,318 254,084 1.70%
Neath Port Talbot 1,352 57,609 2.34%
Norwich, South Norfolk and Broadland 1,626 166,464 0.98%
Suffolk Coastal 633 53,558 1.18%
Monmouthshire Newport Torfaen 1,420 137,929 1.03%
43. The 1.5% dissolution rate is important because the death rate is a key factor in moderating the gross
household growth rate. Significantly, applying a 1.5% dissolution rate to a 3% gross household growth
formation rate yields a net rate of 1.5% per annum – which ORS considers is a realistic figure for the Gypsy
and Traveller population and which is in line with other demographic information. After all, based on the
dissolution rate, a net household formation rate of 3% per annum would require a 4.5% per annum gross
formation rate (which in turn would require extremely unrealistic assumptions about birth rates).
Summary conclusions
44. Future Gypsy and Traveller accommodation needs have typically been over-estimated because population
and household growth rates have been projected on the basis of assumed 3% per annum net growth rates.
45. Unreliable caravan counts have been used to support the supposed growth rate, but there is no reason to
suppose that the rate of increase in caravans corresponds to the annual growth of the Gypsy and Traveller
population or households.

Opinion Research Services
Gypsy and Traveller Methodology: Household Formation and Growth Rates August 2015
15
46. The growth of the national Gypsy and Traveller population may be as low as 1.25% per annum – which is
still four times greater than in the settled community. Even using extreme and unrealistic assumptions, it is
hard to find evidence that the net national Gypsy and Traveller population and household growth is above
2% per annum nationally. The often assumed 3% net household growth rate per annum for Gypsies and
Travellers is unrealistic.
47. The best available evidence suggests that the net annual Gypsy and Traveller household growth rate is 1.5%
per annum. The often assumed 3% per annum net rate is unrealistic. Some local authorities might allow for
a household growth rate of up to 2.5% per annum, to provide a ‘margin’ if their populations are relatively
youthful; but in areas where on-site surveys indicate that there are fewer children in the Gypsy and
Traveller population, the lower estimate of 1.5% per annum should be used.