chem 111 a09 general chemistry i laboratory reports fall...
TRANSCRIPT

CHEM 111 A09
GENERAL CHEMISTRY I
LABORATORY REPORTS
FALL 2016
General Chemistry I Lab Reports Class Portfolio
December 2016 • Volume 1, Issue 1

2
Letter from the Editor Welcome to the first issue of General Chemistry Student Lab Report Portfolio at IUP. We have made this journal to better introduce our exceptional student work to visitors. Professionals in science and engineering spend at least fifty percent of their time writing reports and memoranda according to recent nationwide surveys. By taking the CHEM 111 - general chemistry lab classes at IUP, our students are not only trained to learn technical skills in laboratory, but also trained to interpret experimental data and write good lab reports. Although report writing can be time intensive, the time is well spent because it provides our students with the opportunity to develop the skill that will be extremely valuable in their future careers. I give high grades to students who are able to describe their laboratory work in a clear, organized report than those who cannot. I grade lab reports based on the following four criteria: format (30%), results (30%), discussion (30%), and problems (10%). Students need to (1) adopt a given format and prepare research style reports; (2) convert their measurements to final results through calculations; (3) discuss the implication of their results and draw main conclusions; and (4) complete the pre-lab and after-lab assignments given in the lab manual. I’m glad to see the majority of our students did a very good job on their lab reports. Although it is very difficult to select 11 best reports from 264 submissions, I finally made it by giving a maximum number of students the chance of including their work in this class portfolio. I gratefully acknowledge the contributions of my students in CHEM 111 A09 section of Fall 2016. There has never been a more exciting time reading their reports. Please read this class portfolio and I believe you will have the same feeling with me. Sincerely,
Hao Tang, Ph.D., P.E. Assistant Professor of Environmental Engineering Indiana University of Pennsylvania
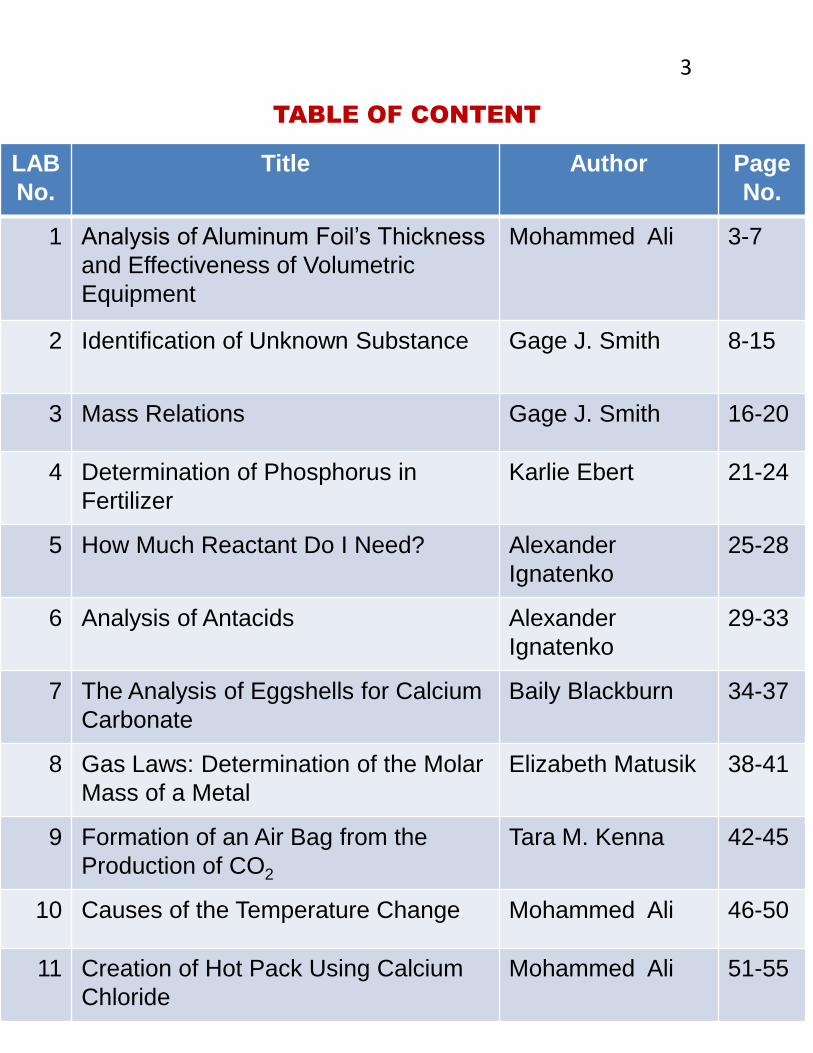
LAB
No.
Title Author Page
No.
1 Analysis of Aluminum Foil’s Thickness
and Effectiveness of Volumetric
Equipment
Mohammed Ali 3-7
2 Identification of Unknown Substance Gage J. Smith 8-15
3 Mass Relations Gage J. Smith 16-20
4 Determination of Phosphorus in
Fertilizer
Karlie Ebert 21-24
5 How Much Reactant Do I Need? Alexander
Ignatenko
25-28
6 Analysis of Antacids Alexander
Ignatenko
29-33
7 The Analysis of Eggshells for Calcium
Carbonate
Baily Blackburn 34-37
8 Gas Laws: Determination of the Molar
Mass of a Metal
Elizabeth Matusik 38-41
9 Formation of an Air Bag from the
Production of CO2
Tara M. Kenna 42-45
10 Causes of the Temperature Change Mohammed Ali 46-50
11 Creation of Hot Pack Using Calcium
Chloride
Mohammed Ali 51-55
3
TABLE OF CONTENT

CHEM 111 A09 FALL 2016, LAB 1, 3-7
CHEM 111 A09 GENERAL CHEMISTRY
LABORATORY FALL 2016
Indiana University of Pennsylvania
Analysis of Aluminum Foil’s Thickness and Effectiveness of Volumetric Equipment
Mohammed Ali
Department of Biology, Indiana University of Pennsylvania, Indiana, PA 15705
Academic Editor: H. Tang
Received: September 13, 2016 / Accepted: November 19, 2016 / Published: December 6, 2016
Abstract: This first procedure dealt with calculating the thickness of Reynold’s Heavy Duty aluminum foil. This was calculated by solving the derived density formula, d= m/lwh, for height. The average thickness of the foil was found to be .00228 cm ± .00007 cm with a percent error of 13.0%. The second part of this lab focused on analyzing the precision and accuracy of different sized beakers in comparison to a volumetric flask. 25 mL of distilled water was estimated in each container and then a graduated cylinder was used to determine actual volume. The glassware’s accuracy was calculated through percent error and precision through standard deviation. The volumetric cylinder was determined to be the most reliable as it had the lowest standard deviation and percent error. The beakers had less reliable accuracy and precision and these worsened as capacity increased. In both experiments, variations between the observed and actual values were likely due to human error, such as the measuring of the foil or the estimating of the water.
1. Introduction and Scope
This lab has two purposes: the first purpose is calculating the thickness of Reynold’s Heavy Duty aluminum foil. The foil’s thickness must be calculated indirectly as it is too small to be measured accurately with a ruler. This is important as many calculations in the laboratory, especially ones that are too small or difficult to quantify, must rely upon derivation to be calculated. In this lab, aluminum’s thickness was quantified from its known density and its measurable dimensions of length, width, and mass.
The second purpose is to analyze the accuracy and precision of different containers of volume found within the lab. This means that the results are close to the actual value for volume and can be
OPEN ACCESS

CHEM 111 A09 FALL 2016, LAB 1, 3-7 4
reproduced with relatively little variation, respectively. This is important as accurate and reproducible results are crucial for valid conclusions in science. Measurements using the wrong glassware can seriously flaw the entire design of an experiment. This also explains the wide array of instruments used to measure volume in labs, including beakers, test tubes, graduated cylinders, or Erlenmeyer and volumetric flasks. This lab in particular deals with comparing two of these pieces: beakers and volumetric flasks. Various forms of beakers and a volumetric flask are used to estimate a target volume and find which one produces the most accurate results.
The scope of this paper is to attempt to calculate the thickness of aluminum foil and determine out of several beakers and a volumetric flask which is most accurate in measuring volume. This paper will show the methodology performed to come to both conclusions by focusing on the materials and procedures, data and analysis, and the error analysis and overall conclusions that can be drawn from the data.
2. Calculation of Aluminum Foil’s Thickness
Materials and Procedure This experiment required four pieces of Reynold’s Heavy Duty Aluminum Foil, one metric ruler,
and one electronic pan balance. It was performed by measuring the dimension of four pieces of aluminum foil that were pre-cut to certain dimensions. A ruler was used to measure both the length and width of the foil and these results were recorded. Following this, the foil was massed on an electronic pan balance and the results were recorded as well. This entire process was repeated four times with different pieces of foil to find the mass and dimension of each of them.
Results and Calculations
Foil Piece Length (cm) Width (cm) Mass (g) Thickness (cm)
Foil #1 14.20 6.20 0.538 0.00226
Foil #2 19.53 14.10 1.750 0.00235
Foil #3 17.17 17.70 1.895 0.00231
Foil #4 24.08 14.20 2.015 0.00218
Average ± Standard Deviation
18.75 ± 4.17 13.05± 4.86 1.550±0.683 0.00228± 0.00007
The thickness was calculated using two formulas, one for volume and the other for density. Density
is equal to mass divided by volume (d=m/v) and volume is the product of length, width, and height (V=lwh). It is important to note that volume appears in both formulas so the second formula for volume can be substituted in the first to get a derived formula. This equates the known value of density (given as of 2.70g/mL) to the quantity of mass divided by the product of length, width, and thickness (d= m/lwh. This formula can be used to input the data for each trial and algebraically solve for the height of the aluminum foil which is also the thickness of the foil. Mathematically, this is done by multiplying density by the length, width, and height and then dividing the mass by the entire quantity of length, width, and density so that the unknown height is isolated on one side and can be solved. This
CHEM 111 A09 FALL 2016, LAB 1, 3-7 5
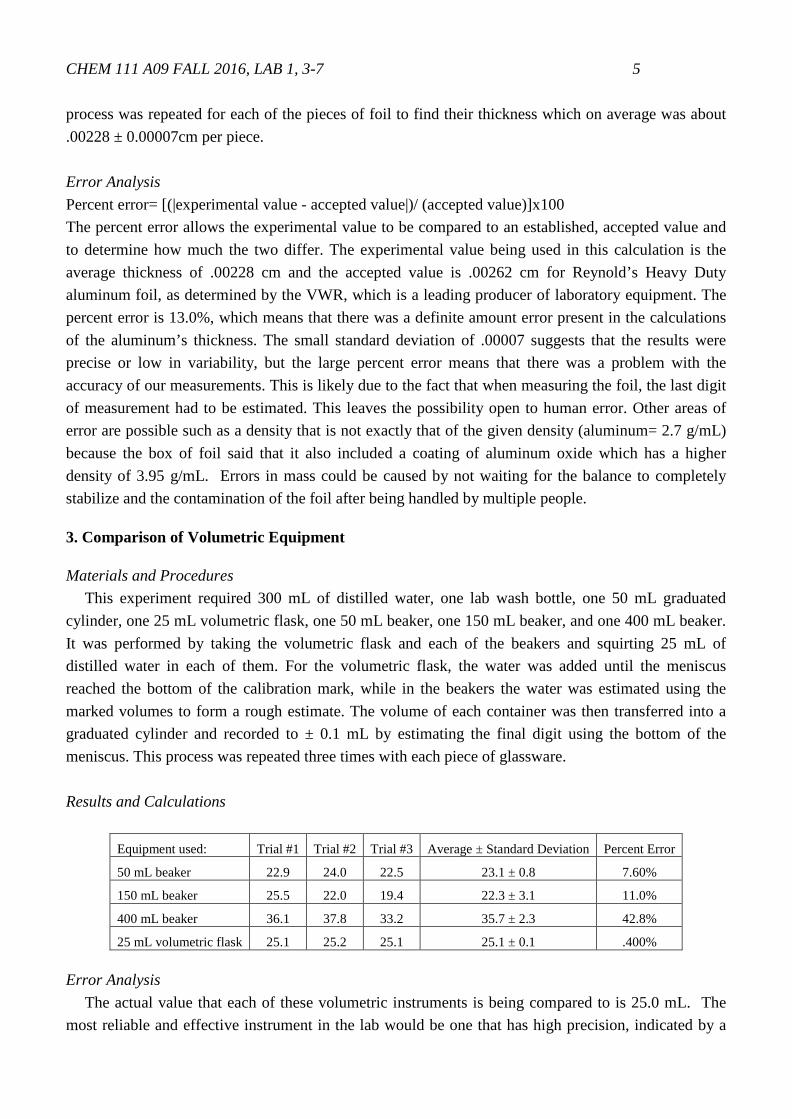
process was repeated for each of the pieces of foil to find their thickness which on average was about .00228 ± 0.00007cm per piece. Error Analysis Percent error= [(|experimental value - accepted value|)/ (accepted value)]x100 The percent error allows the experimental value to be compared to an established, accepted value and to determine how much the two differ. The experimental value being used in this calculation is the average thickness of .00228 cm and the accepted value is .00262 cm for Reynold’s Heavy Duty aluminum foil, as determined by the VWR, which is a leading producer of laboratory equipment. The percent error is 13.0%, which means that there was a definite amount error present in the calculations of the aluminum’s thickness. The small standard deviation of .00007 suggests that the results were precise or low in variability, but the large percent error means that there was a problem with the accuracy of our measurements. This is likely due to the fact that when measuring the foil, the last digit of measurement had to be estimated. This leaves the possibility open to human error. Other areas of error are possible such as a density that is not exactly that of the given density (aluminum= 2.7 g/mL) because the box of foil said that it also included a coating of aluminum oxide which has a higher density of 3.95 g/mL. Errors in mass could be caused by not waiting for the balance to completely stabilize and the contamination of the foil after being handled by multiple people.
3. Comparison of Volumetric Equipment
Materials and Procedures This experiment required 300 mL of distilled water, one lab wash bottle, one 50 mL graduated
cylinder, one 25 mL volumetric flask, one 50 mL beaker, one 150 mL beaker, and one 400 mL beaker. It was performed by taking the volumetric flask and each of the beakers and squirting 25 mL of distilled water in each of them. For the volumetric flask, the water was added until the meniscus reached the bottom of the calibration mark, while in the beakers the water was estimated using the marked volumes to form a rough estimate. The volume of each container was then transferred into a graduated cylinder and recorded to ± 0.1 mL by estimating the final digit using the bottom of the meniscus. This process was repeated three times with each piece of glassware.
Results and Calculations
Equipment used: Trial #1 Trial #2 Trial #3 Average ± Standard Deviation Percent Error
50 mL beaker 22.9 24.0 22.5 23.1 ± 0.8 7.60%
150 mL beaker 25.5 22.0 19.4 22.3 ± 3.1 11.0%
400 mL beaker 36.1 37.8 33.2 35.7 ± 2.3 42.8%
25 mL volumetric flask 25.1 25.2 25.1 25.1 ± 0.1 .400%
Error Analysis The actual value that each of these volumetric instruments is being compared to is 25.0 mL. The
most reliable and effective instrument in the lab would be one that has high precision, indicated by a

CHEM 111 A09 FALL 2016, LAB 1, 3-7 6
low variability, and high accuracy, indicated by a low percent error. This is exhibited by the 25mL volumetric flask which in comparison to the other instruments has a very miniscule variation and percent error. This means that when it is used correctly for appropriate measurements, it will yield highly dependable results with less human error. The presence of human error can account for both precision and accuracy errors. For example, rash and unmethodical measuring, rough estimating of a solution, flawed human perception, or spills during transfer will both make the data varied and inaccurate in measuring a desired amount. Also, instrument standards may play a role in the effectivity of the container. Beakers are a lot cheaper and are mass produced so they are not required to meet the accuracy and quality standard that volumetric flasks are held to by the scientific community. Volumetric flasks are meant to be accurate to about 1%, but beakers are typically made to be accurate to only 5% so they are more likely to cause systematic error. The data also shows that in general human error increases as the capacity of the beaker increases. This means that the beakers became more inaccurate and varied in their measurements as volume increases. For example, the 50 mL beaker has a percent error of 7.60%, which increases to 11.0% in the 150 mL beaker, and dramatically rises to 42.8% in the 400mL beaker. This means that the 400 mL beaker is about five times more inaccurate then the 50 mL beaker when it comes to measuring a quantity. The variation follows a similar trend of increasing. For example, the variability increases about four times when using the 150 mL beaker as opposed to the 50 mL beaker. It is important to note that even though the 400 mL beaker has a lower variability than the 150 mL it is not more dependable. This just means that all of its measurements (36.1, 37.8, and 33.2 mL) are more uniform in overestimating the desired volume.
4. Summary and Discussion
Based on the results the average thickness of aluminum foil was calculated to be .00228 cm with a standard deviation of ± .00007 cm. This low variability means that the values for the thickness were relatively very similar or precise. Although, when compared to the true value of the thickness of Reynold’s Heavy Duty aluminum foil, the percent error was 13.0%. This means that there was error present in the calculations of the foil most likely due to different levels of human error.
The results of the experiment comparing volumetric equipment demonstrates that out of the glassware surveyed the volumetric flask offers the most accurate and precise readings when it comes to measuring an exact amount. This is supported by the low variability and percent error of its measurements. Beakers in comparison to volumetric flask lack precision and accuracy. This is shown by their significantly higher variabilities and percent errors. Moreover, the larger the beakers the more likely it will give a less accurate and precise measurement. This seems to be because beakers that hold a larger capacity also maximize the chances of human error by only offering a rough estimate for specific volumes. For example, a 400 mL beaker might only offer markers every 50 mL while a 50 mL beaker may offer markers every 10 mL. Although it would be a matter of perception in both cases to measure 25 mL, it would be more accurate in the smaller beaker as the volume can be to fine-tuned with confidence, leaving a smaller interval of uncertainty. Also from a technical standpoint, volumetric flasks are held to a higher standard of quality control and effectivity then beakers are normally subjected to which reduces the chance of systematic error. The overall conclusion that can be drawn is that a beaker should not be used for accurate or precise measurements but rather as vessels to carry

CHEM 111 A09 FALL 2016, LAB 1, 3-7 7
solutions. For more reliable measurements, scientists should opt for tools such as the volumetric flask that perform exceptionally well when it comes to precision and accuracy.
Acknowledgments
The author gratefully acknowledges his lab partner Brad O’Hara for his assistance in performing the experiment and all other aspects of the process, including data collection, statistical calculations, and lab clean-up to enumerate a few.
References and Notes
"Flasks, Beakers, & Graduated Cylinders." Dartmouth.edu. Dartmouth University, n.d. Web. 10 Sept. 2016. <https://www.dartmouth.edu/~chemlab/techniques/flasks.html>.
"Reynolds Wrap® Aluminum Foil." Us.vwr.com. VWR International, n.d. Web. 10 Sept. 2016. <https://us.vwr.com/store/product/4526537/reynolds-wrap-aluminum-foil>
© 2016 by the author. This article is an open access article.

CHEM 111 A09 FALL 2016, LAB 2, 8-15
CHEM 111 A09 GENERAL CHEMISTRY
LABORATORY FALL 2016
Indiana University of Pennsylvania
Identification of Unknown Substance
Gage J. Smith
College of Natural Sciences and Mathematics, Indiana University of Pennsylvania, Indiana, PA 15705
Academic Editor: H. Tang
Received: September 20, 2016 / Accepted: November 19, 2016 / Published: December 6, 2016
Abstract: The purpose of this lab was to find the density of an unknown metal by utilizing water displacement and Archimedes Principle. Not only was the objective to identify an unknown metal but also to identify an unknown liquid by comparing collected data to a density of ethanol-water solutions chart to find the percentage of ethanol in the solution. Making sure you’re precise as possible when it comes to significant figures is very important because if you’re off, your results could be mistaken for a whole different substance. During the experiment, Tahmair played a crucial role of collecting the equipment and unknown substances in order to begin using the methods to determine density. As stated, the methods we used to complete this lab were the methods of water displacement and Archimedes Principle. Equipment used throughout this lab consisted of goggles, a scale, graduated cylinder, volumetric flask, 400 mL beaker, weight stand, calculator, the density equation, the percent error equation, densities of commercial metals at 25 degrees Celsius chart, density of ethanol-water solutions versus mass percent ethanol at 25 degrees Celsius chart, and of course the unknown metal and liquid. This report explains the guidelines you must know and understand when it comes to the concept of density. It isn’t just a simple calculation. There are several methods used to find the density of a particular substance. Understanding each method of water displacement is crucial when determining density. Methods of water displacement include the displacement method itself and Archimedes Principle. Just like any other calculations and results, significant figures reflect the precision of the values and are very important. Understanding significant figures and how they vary between equipment is key to a precise and accurate lab results.
1. Introduction and Scope
OPEN ACCESS
CHEM 111 A09 FALL 2016, LAB 2, 8-15 9
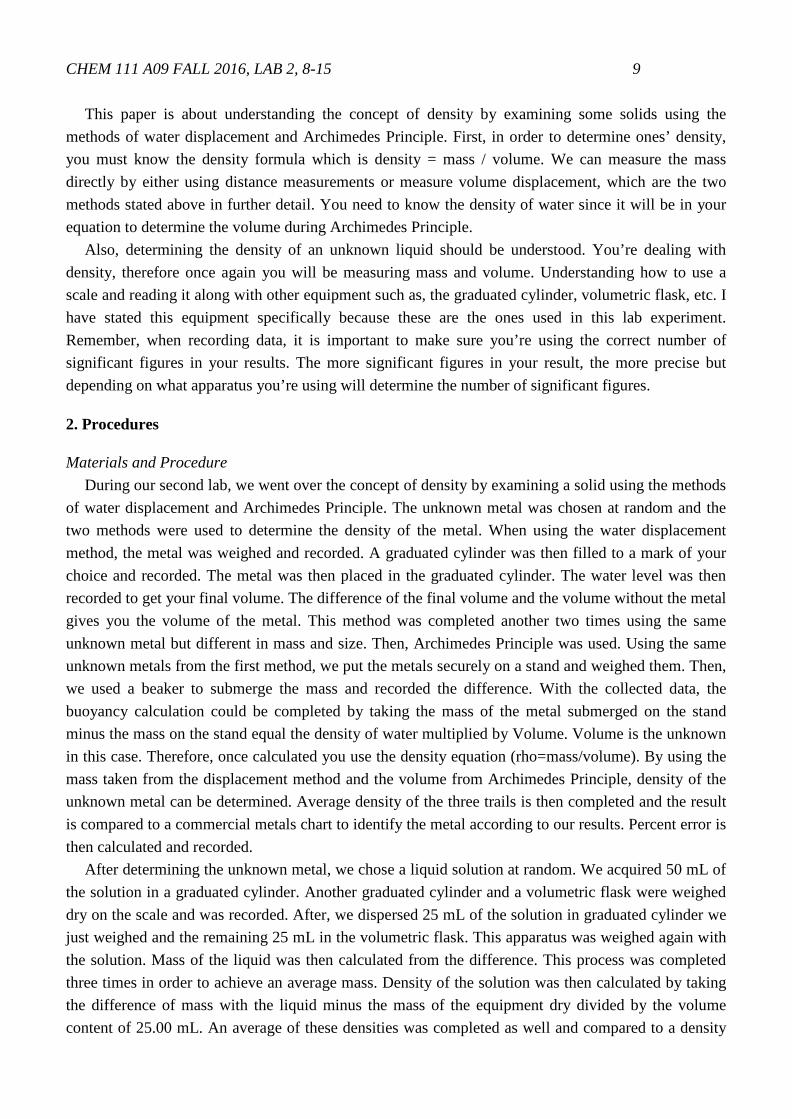
This paper is about understanding the concept of density by examining some solids using the methods of water displacement and Archimedes Principle. First, in order to determine ones’ density, you must know the density formula which is density = mass / volume. We can measure the mass directly by either using distance measurements or measure volume displacement, which are the two methods stated above in further detail. You need to know the density of water since it will be in your equation to determine the volume during Archimedes Principle.
Also, determining the density of an unknown liquid should be understood. You’re dealing with density, therefore once again you will be measuring mass and volume. Understanding how to use a scale and reading it along with other equipment such as, the graduated cylinder, volumetric flask, etc. I have stated this equipment specifically because these are the ones used in this lab experiment. Remember, when recording data, it is important to make sure you’re using the correct number of significant figures in your results. The more significant figures in your result, the more precise but depending on what apparatus you’re using will determine the number of significant figures.
2. Procedures
Materials and Procedure During our second lab, we went over the concept of density by examining a solid using the methods
of water displacement and Archimedes Principle. The unknown metal was chosen at random and the two methods were used to determine the density of the metal. When using the water displacement method, the metal was weighed and recorded. A graduated cylinder was then filled to a mark of your choice and recorded. The metal was then placed in the graduated cylinder. The water level was then recorded to get your final volume. The difference of the final volume and the volume without the metal gives you the volume of the metal. This method was completed another two times using the same unknown metal but different in mass and size. Then, Archimedes Principle was used. Using the same unknown metals from the first method, we put the metals securely on a stand and weighed them. Then, we used a beaker to submerge the mass and recorded the difference. With the collected data, the buoyancy calculation could be completed by taking the mass of the metal submerged on the stand minus the mass on the stand equal the density of water multiplied by Volume. Volume is the unknown in this case. Therefore, once calculated you use the density equation (rho=mass/volume). By using the mass taken from the displacement method and the volume from Archimedes Principle, density of the unknown metal can be determined. Average density of the three trails is then completed and the result is compared to a commercial metals chart to identify the metal according to our results. Percent error is then calculated and recorded.
After determining the unknown metal, we chose a liquid solution at random. We acquired 50 mL of the solution in a graduated cylinder. Another graduated cylinder and a volumetric flask were weighed dry on the scale and was recorded. After, we dispersed 25 mL of the solution in graduated cylinder we just weighed and the remaining 25 mL in the volumetric flask. This apparatus was weighed again with the solution. Mass of the liquid was then calculated from the difference. This process was completed three times in order to achieve an average mass. Density of the solution was then calculated by taking the difference of mass with the liquid minus the mass of the equipment dry divided by the volume content of 25.00 mL. An average of these densities was completed as well and compared to a density
CHEM 111 A09 FALL 2016, LAB 2, 8-15 10
of ethanol-water solutions versus mass percent ethanol at 25 degrees Celsius chart. The percent of ethanol for the solution of the graduated cylinder and volumetric flask were then averaged.
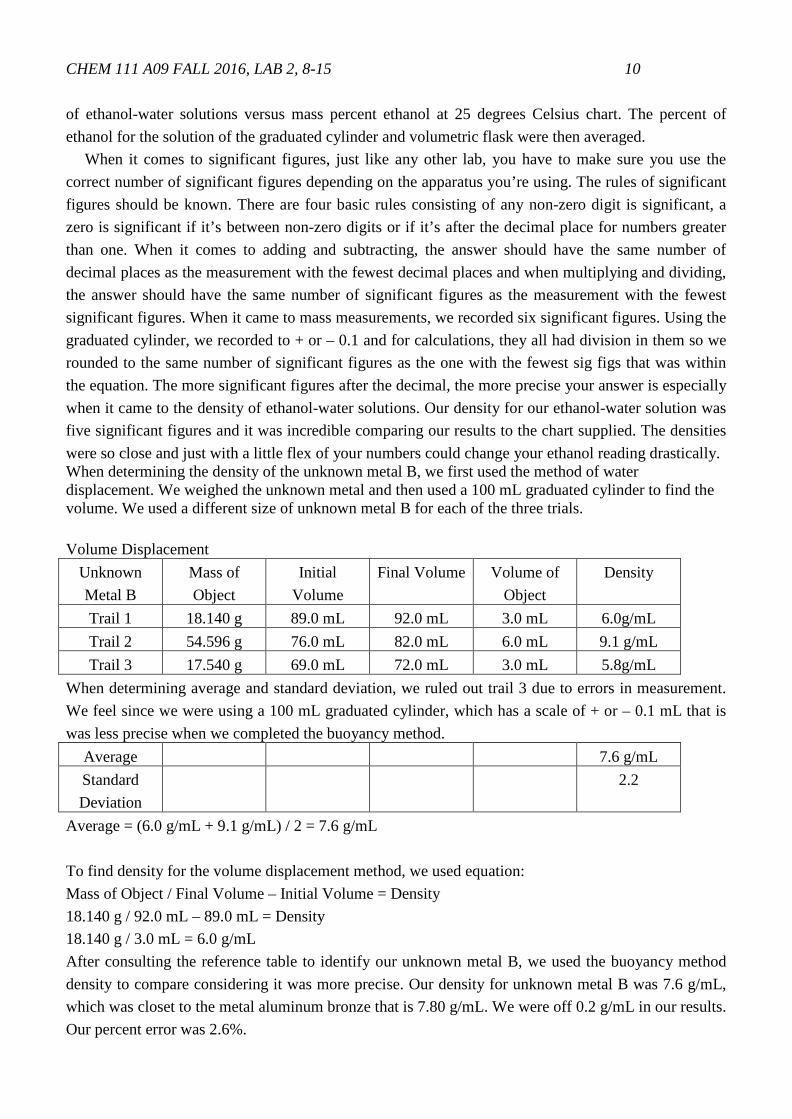
When it comes to significant figures, just like any other lab, you have to make sure you use the correct number of significant figures depending on the apparatus you’re using. The rules of significant figures should be known. There are four basic rules consisting of any non-zero digit is significant, a zero is significant if it’s between non-zero digits or if it’s after the decimal place for numbers greater than one. When it comes to adding and subtracting, the answer should have the same number of decimal places as the measurement with the fewest decimal places and when multiplying and dividing, the answer should have the same number of significant figures as the measurement with the fewest significant figures. When it came to mass measurements, we recorded six significant figures. Using the graduated cylinder, we recorded to + or – 0.1 and for calculations, they all had division in them so we rounded to the same number of significant figures as the one with the fewest sig figs that was within the equation. The more significant figures after the decimal, the more precise your answer is especially when it came to the density of ethanol-water solutions. Our density for our ethanol-water solution was five significant figures and it was incredible comparing our results to the chart supplied. The densities were so close and just with a little flex of your numbers could change your ethanol reading drastically. When determining the density of the unknown metal B, we first used the method of water displacement. We weighed the unknown metal and then used a 100 mL graduated cylinder to find the volume. We used a different size of unknown metal B for each of the three trials. Volume Displacement
Unknown Metal B
Mass of Object
Initial Volume
Final Volume Volume of Object
Density
Trail 1 18.140 g 89.0 mL 92.0 mL 3.0 mL 6.0g/mL Trail 2 54.596 g 76.0 mL 82.0 mL 6.0 mL 9.1 g/mL Trail 3 17.540 g 69.0 mL 72.0 mL 3.0 mL 5.8g/mL
When determining average and standard deviation, we ruled out trail 3 due to errors in measurement. We feel since we were using a 100 mL graduated cylinder, which has a scale of + or – 0.1 mL that is was less precise when we completed the buoyancy method.
Average 7.6 g/mL Standard Deviation
2.2
Average = (6.0 g/mL + 9.1 g/mL) / 2 = 7.6 g/mL To find density for the volume displacement method, we used equation: Mass of Object / Final Volume – Initial Volume = Density 18.140 g / 92.0 mL – 89.0 mL = Density 18.140 g / 3.0 mL = 6.0 g/mL After consulting the reference table to identify our unknown metal B, we used the buoyancy method density to compare considering it was more precise. Our density for unknown metal B was 7.6 g/mL, which was closet to the metal aluminum bronze that is 7.80 g/mL. We were off 0.2 g/mL in our results. Our percent error was 2.6%.
CHEM 111 A09 FALL 2016, LAB 2, 8-15 11
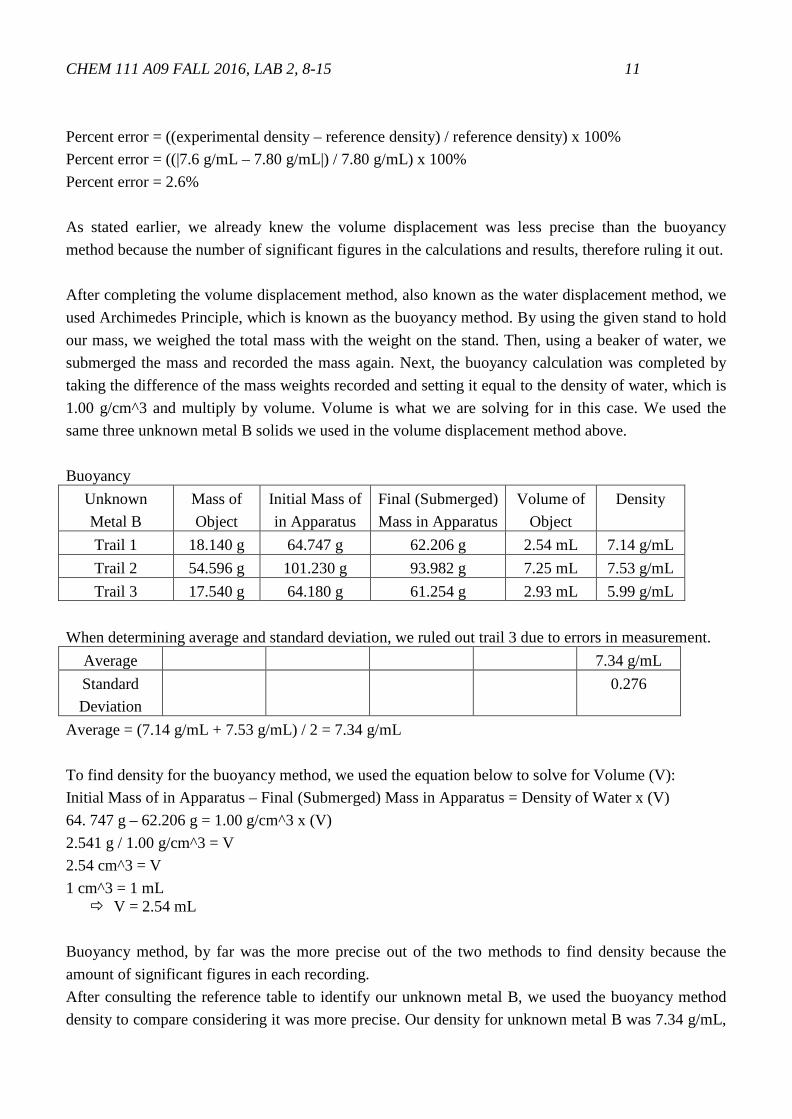
Percent error = ((experimental density – reference density) / reference density) x 100% Percent error = ((|7.6 g/mL – 7.80 g/mL|) / 7.80 g/mL) x 100% Percent error = 2.6% As stated earlier, we already knew the volume displacement was less precise than the buoyancy method because the number of significant figures in the calculations and results, therefore ruling it out. After completing the volume displacement method, also known as the water displacement method, we used Archimedes Principle, which is known as the buoyancy method. By using the given stand to hold our mass, we weighed the total mass with the weight on the stand. Then, using a beaker of water, we submerged the mass and recorded the mass again. Next, the buoyancy calculation was completed by taking the difference of the mass weights recorded and setting it equal to the density of water, which is 1.00 g/cm^3 and multiply by volume. Volume is what we are solving for in this case. We used the same three unknown metal B solids we used in the volume displacement method above. Buoyancy
Unknown Metal B
Mass of Object
Initial Mass of in Apparatus
Final (Submerged) Mass in Apparatus
Volume of Object
Density
Trail 1 18.140 g 64.747 g 62.206 g 2.54 mL 7.14 g/mL Trail 2 54.596 g 101.230 g 93.982 g 7.25 mL 7.53 g/mL Trail 3 17.540 g 64.180 g 61.254 g 2.93 mL 5.99 g/mL
When determining average and standard deviation, we ruled out trail 3 due to errors in measurement.
Average 7.34 g/mL Standard Deviation
0.276
Average = (7.14 g/mL + 7.53 g/mL) / 2 = 7.34 g/mL To find density for the buoyancy method, we used the equation below to solve for Volume (V): Initial Mass of in Apparatus – Final (Submerged) Mass in Apparatus = Density of Water x (V) 64. 747 g – 62.206 g = 1.00 g/cm^3 x (V) 2.541 g / 1.00 g/cm^3 = V 2.54 cm^3 = V 1 cm^3 = 1 mL V = 2.54 mL
Buoyancy method, by far was the more precise out of the two methods to find density because the amount of significant figures in each recording. After consulting the reference table to identify our unknown metal B, we used the buoyancy method density to compare considering it was more precise. Our density for unknown metal B was 7.34 g/mL,

CHEM 111 A09 FALL 2016, LAB 2, 8-15 12
which was closet to the metal zinc that is 7.14 g/mL. We were off 0.20 g/mL in our results. Our percent error was 2.80%. Percent error = ((experimental density – reference density) / reference density) x 100% Percent error = ((7.34 g/mL – 7.14 g/mL) / 7.14 g/mL) x 100% Percent error = 2.80% After identifying our unknown metal B to be zinc, we chose unknown “Quarmby B” to determine the density and to identify the ethanol percentage within the solution. We used two pieces of equipment to determine this liquid. This equipment consisted of a graduated cylinder and volumetric flask. Graduated Cylinder
Unknown “Quarmby B”
Mass of Container
Mass of Container
Plus Liquid
Mass of Liquid
Volume of Liquid
Density
Trail 1 82.117 g 106.474 g 24.357 g 25.00 mL 0.9743 g/mL Trail 2 82.115 g 106.479 g 24.364 g 25.00 mL 0.9746 g/mL Trail 3 82.117 g 106. 472 g 24.355 g 25.00 mL 0.9742 g/mL
Average 0.9745 g/mL Standard Deviation
0.0002
Average = (0.9743 g/mL + 0.9746 g/mL + 0.9742 g/mL) / 3 = 0.9745 g/mL To find density of the alcohol sample for the unknown “Quarmby B”, we used equation: Rho = Mass of Liquid / Volume of Liquid Rho = 24.357 g / 25.00 mL Rho = 0.9743 g/mL Rho = Density Once we compare our result 0.9745 g/mL to the reference table, density of ethanol-water solutions, we found out in this sample using the graduated cylinder is closest to 0.97474 g/mL, which contains 14% ethanol in the water solution. Volume Percentage = Mass Percent x (Total Density / Density of pure ethanol) Volume Percentage = 14% x (0.9745 g/mL / 0.78507 g/mL) Volume Percentage = 17% Alcoholic proof = (2) x (% Volume of ethanol) Alcoholic proof = (2) x (17%)
CHEM 111 A09 FALL 2016, LAB 2, 8-15 13
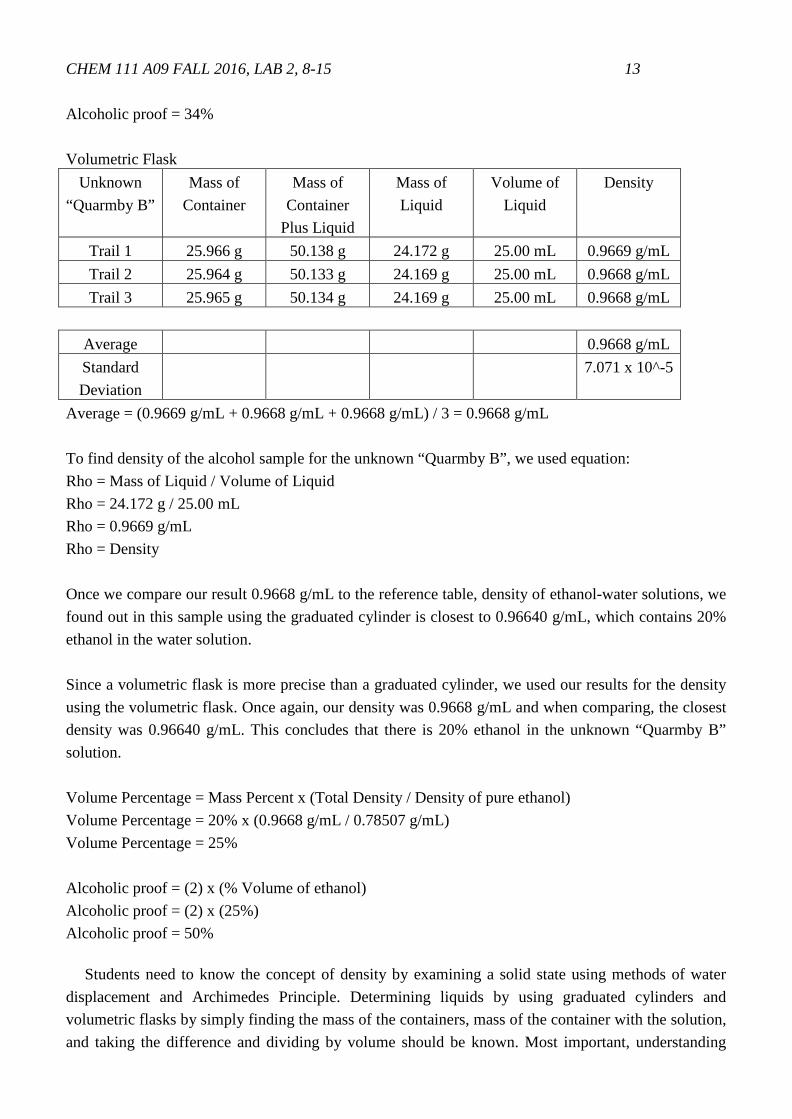
Alcoholic proof = 34% Volumetric Flask
Unknown “Quarmby B”
Mass of Container
Mass of Container
Plus Liquid
Mass of Liquid
Volume of Liquid
Density
Trail 1 25.966 g 50.138 g 24.172 g 25.00 mL 0.9669 g/mL Trail 2 25.964 g 50.133 g 24.169 g 25.00 mL 0.9668 g/mL Trail 3 25.965 g 50.134 g 24.169 g 25.00 mL 0.9668 g/mL
Average 0.9668 g/mL Standard Deviation
7.071 x 10^-5
Average = (0.9669 g/mL + 0.9668 g/mL + 0.9668 g/mL) / 3 = 0.9668 g/mL To find density of the alcohol sample for the unknown “Quarmby B”, we used equation: Rho = Mass of Liquid / Volume of Liquid Rho = 24.172 g / 25.00 mL Rho = 0.9669 g/mL Rho = Density Once we compare our result 0.9668 g/mL to the reference table, density of ethanol-water solutions, we found out in this sample using the graduated cylinder is closest to 0.96640 g/mL, which contains 20% ethanol in the water solution. Since a volumetric flask is more precise than a graduated cylinder, we used our results for the density using the volumetric flask. Once again, our density was 0.9668 g/mL and when comparing, the closest density was 0.96640 g/mL. This concludes that there is 20% ethanol in the unknown “Quarmby B” solution. Volume Percentage = Mass Percent x (Total Density / Density of pure ethanol) Volume Percentage = 20% x (0.9668 g/mL / 0.78507 g/mL) Volume Percentage = 25% Alcoholic proof = (2) x (% Volume of ethanol) Alcoholic proof = (2) x (25%) Alcoholic proof = 50%
Students need to know the concept of density by examining a solid state using methods of water
displacement and Archimedes Principle. Determining liquids by using graduated cylinders and volumetric flasks by simply finding the mass of the containers, mass of the container with the solution, and taking the difference and dividing by volume should be known. Most important, understanding

CHEM 111 A09 FALL 2016, LAB 2, 8-15 14
and recognizing significant figures and determining the correct number depending on the circumstances should be learned and understood.
Conclusion questions:
1. We tried to find the densities of an unknown solid and ethanol-water solution to determine the
solids metal identity and the ethanol-water solutions ethanol percentage. We completed this by using two methods consisting of the volume displacement method and buoyancy method using mass and volume to calculate density and comparing our results to a reference table. When finding the density of the liquid, we used two methods which were the same except we used a graduated cylinder for one and a volumetric flask to measure masses in order to use the density equation to come up with a result. Our final results after long consideration of precise measurements and errors were that the unknown metal B was zinc and the unknown “Quarmby B” had 20 % ethanol in it.
2. In part 1, the buoyancy method was more precise because it gave more significant figures in our final answer and pretty much in every measurement to be exact. The standard deviation for the buoyancy method is also smaller than the standard deviation for the volume displacement method.
3. Using the more precise method, which was the buoyancy method, we compared our density
of 7.34 g/mL to the reference table and found it was closest to the density of zinc, which is 7.14 g/mL. If we used the less precise method, we would have not got the same answer. Instead, the method would have been aluminum.
4. In part 2, the volumetric flask produced the smaller standard deviation. The volumetric flask
has and advantage of being very precise when it comes to measuring exactly 25.00 mL. This produces an extremely low standard deviation, which everyone wants when recording results. When it comes to other measurements is basically a guessing game. The volumetric flask also only has a max capacity of 25.00 mL. The graduated cylinder can measure high water capacities for bulk volumes. The marks on a graduated cylinder a very easy to read as well. It does have its downfall though. Say you need to weigh the cylinder dry and the only one available is wet, you can’t get the whole graduated cylinder dry because the long narrow tube. Also, though the marks are easy to read. It is sometimes difficult to get a read when the solution is between marks. Always remember, you have to look at it level. If you’re too high, your volume will look greater than it is and vise versa.
5. Our lab instructor provided that unknown “Quarmby B” was 50% proof of alcohol solution.
With our volumetric flask method, we too determined the solution contained 20% ethanol. Ms. Quarmby seems to be watering down her beverages based on these results. Ms. Quarmby should recognize what she is doing wrong and fix it in order to increase the proof on her beverages so they are not under proof. The Herald Observer in this case can do as they please considering that the reports in which they were going to get sued over were correct. Knowing a newspaper nowadays, my guess is another headline would be reported now that the results have been processed and released.
4. Summary and Discussion
In conclusion, we learned the concept of density in terms of a solid state and liquid state and the two methods to determine each. We used the volume displacement method and the Buoyancy method to

CHEM 111 A09 FALL 2016, LAB 2, 8-15 15
determine the density of the unknown metal B, which ended up being zinc. We ran three trial during each method. During the volume displacement method, we found the mass of the solid, as well as, establishing an initial volume in the graduated cylinder. Then, we dropped the solid into the graduated cylinder and recorded the final volume. All that was left was to calculate the difference and use the equation Rho = mass / volume to get the density. In the buoyancy method, you just weighed the stand with the solid and later submerged the solid in water and recorded the new mass. Mass difference was then computed and was set equal to the density of water multiplied by the volume we were determining. Then, once again the rho equation was used to find density. In my opinion, the Buoyancy method or Archimedes Principle was more precise because of the amount of significant figures in the final answer. When it came to determining the liquid, we used a graduated cylinder and a volumetric flask. To find the density, all we simply had to do for both methods was to weigh the containers dry, weigh the containers with the solution and take the difference, followed by taking the difference and dividing it by the volume to calculate the density. I felt that the volumetric flask was more precise because of the single mark at a long narrow neck making it easy to know where you need to stop. Finally, recognizing for each apparatus we were using, we had to make sure we were using the correct number of significant figures to support our results to get the most precise answer to compare to the reference tables.
Acknowledgments
The author gratefully acknowledges his lab partner Tahmir Smith for his assistance in performing the experiments.
© 2016 by the author. This article is an open access article.

CHEM 111 A09 FALL 2016, LAB 3, 16-20
CHEM 111 A09 GENERAL CHEMISTRY
LABORATORY FALL 2016
Indiana University of Pennsylvania
Mass Relations
Gage J. Smith
College of Natural Sciences and Mathematics, Indiana University of Pennsylvania, Indiana, PA 15705
Academic Editor: H. Tang
Received: September 27, 2016 / Accepted: November 19, 2016 / Published: December 6, 2016
Abstract: This report explains the guidelines you must know and understand when it comes to qualitative observations of the reaction of calcium carbonate and hydrochloric acid, as well as, quantitative exploration of the reaction for different masses of the reactants. This experiment shows you what different measurements and masses do during a chemical reaction when it comes to determining a limiting reagent.
1. Introduction and Scope
This paper is about observing the chemical reaction between calcium carbonate and hydrochloric acid to determine the reactant that is completely used up in a chemical reaction and the point at which it occurs. This is just not seeing what it does but the different changes according to the mass difference of the calcium carbonate. By using three test tubes to put a different amount of calcium carbonate in each one, we can observe the different appearances of the to reactants, as well as, distinguish between the limiting and excess reagents in each reaction.
The purpose was to figure out relationships between reactant quantities and resulting products by examining the chemical reaction produced between calcium carbonate and hydrochloric acid. Also, understanding the bond between the two agents and knowing by observation, which chemical is the limiting reagents determining by amounts of mass and volume of fluids.
2. Procedures and Results
During the mass relationships part 1, dealing with how much reactant we need, we began a qualitative observation of the reaction between the calcium carbonate and hydrochloric acid by obtaining 50 mL of hydrochloric acid and recording the hydrochloric acid concentration. The
OPEN ACCESS

CHEM 111 A09 FALL 2016, LAB 3, 16-20 17
concentration is not the density of the acid and its measurement is 109 g/L. Step number two consisted of obtaining three test tubes and filling each with a different amount of calcium carbonate, which were 0.25 g, 0.60 g, and 1.0 g. Measuring was done using a scale. We placed the test tube for each in a beaker and recorded the difference when adding the calcium carbonate to determine the correct amount of calcium carbonate. After getting the correct mass of calcium carbonate, we added 5 mL of distilled water into each test tube. Then, we added about three or four drops of indicator in each test tube, which helps us detect when acid is present or not depending on the color after the reaction. In order, to begin with the chemical reaction, a calculation to determine how much hydrochloric acid had to be done. The calculation will be in the calculations section of the paper but the volume came out to 4.6 mL. We dumped 4.6 mL of hydrochloric acid in each test tube one at a time, observing the chemical reactions in each as we stirred it thoroughly. The evidence of a chemical change consisted of the calcium carbonate fizzing and releasing carbon dioxide, as well as, the change of color, which in the end helped us determine the limiting reagent.
Next, we did a quantitative exploration of the reaction for different masses of the reactants. First, we measured 5.0 mL of hydrochloric acid in a 10 mL graduated cylinder and then recorded the mass. Our group was assigned to record about 0.6 g of calcium carbonate. Our mass was recorded at 0.602 g of calcium carbonate. We used a 50 mL beaker to do the measurement. We then added about 10 mL of water and recorded the mass again. After, we added the hydrochloric acid to the beaker and mixed it with a stirring rod. Once the reaction was over, we weighed the content again. Everything was recorded into a data table to express the results.
Test tube with 0.25 g of calcium carbonate
• After dumping 4.6 mL of hydrochloric acid into the test tube with 0.25 g of calcium carbonate, the chemical reaction occurred instantly turning the solution pink
• The calcium carbonate started fizzing immediately releasing the gas carbon dioxide • After letting the reaction settle down and while mixing, the color of the solution remained
pink • The pink color change and pink end result determined the limiting reagent was the calcium
carbonate and all that was left was the hydrochloric acid
Test tube with 0.60 g of calcium carbonate • The test tube with 0.60 g of calcium carbonate had the same beginning chemical reaction as
the test tube with 0.25 g of calcium carbonate once the hydrochloric acid was added • The solution turned pink immediately • The calcium carbonate, once again, fizzed up instantly releasing carbon dioxide • When the chemical reaction started to settle, the color turned to yellow • After stirring and mixing the content of calcium carbonate thoroughly, the color started to
turn into a peach textured color • Once stirring was done and about 30 seconds went by, the solution returned to yellow • The limiting reagent in this test tube was the hydrochloric acid and all that was left was the
calcium carbonate
Test tube with 1.0 g of calcium carbonate • The test tube with 1.0 g of calcium carbonate turned pink like the rest at the beginning once
the hydrochloric acid was added

CHEM 111 A09 FALL 2016, LAB 3, 16-20 18
• Once again, the solution fizzed meaning the calcium carbonate gave of carbon dioxide • Before the solution even settled or mixed, it turned yellow • After mixing, there was no change • The limiting reagent in this test tube was hydrochloric acid and all that remained was
calcium carbonate Mass CaCO3 (g) Moles CaCO3 Mass CO2 formed Moles CO2
formed Moles CO2 per mole CaCO3
0.25 g 0.003 mol 7.5 x 10^-4 g 1.7 x 10^-5 mol 0.01 0.60 g 0.006 mol 3.6 x 10^-3 g 8.2 x 10^-5 mol 0.01 1.0 g 0.01 mol 1.0 x 10^-2 g 2.3 x 10^-4 mol 0.02
*Periodic table is needed to determine molecular mass for each compound Moles (n) CaCO3 = Mass/Molecular Mass = m/M = 0.25 g / ((1 x 40.08 g/mol) + (1 x 12.01 g/mol) + (3 x 16.00 g/mol) = 0.25 g / 100.09 g = 0.0025 mol Mass CO2 formed (M) = (Mass CaCO3 x Moles CaCO3) / 1 mol = (0.25g x 0.003 mol) / 1 mol = 7.5 x 10^-4 g CO2 = (1 x 12.01) + (2 x 16.00) = 44.01 g/mol Moles CO2 formed = Mass CO2 formed x (1 mol / 44.01 g) = 7.5 x 10^-4 g x (1 mol / 44.01 g) = 1.7 x 10^-5 mol Moles CO2 per mole CaCO3 = Moles CO2 formed/Moles CaCO3 = 1.7 x 10^-5 mol / 0.003 mol = 0.01 Calculation of moles HCl in 5.0 mL of solution: n = 5.0 mL x (1 L / 1000 mL) x (1.0 mol / 1 L) n = 5.0 x 10^-3 mols of HCl
0.0E+00
5.0E-05
1.0E-04
1.5E-04
2.0E-04
2.5E-04
0 0.002 0.004 0.006 0.008 0.01 0.012
Mol
e CO
2 (y
-axi
s)
Moles CaCO3 (x-axis)
Moles CaCO3 versus Moles CO2

CHEM 111 A09 FALL 2016, LAB 3, 16-20 19
Quantitative exploration of the reactant for different masses of reactants.
Group # CaCO3 (g) Cylinder (g)
Cylinder + 5 mL of HCl (g)
CaCO3 (g) Beaker + ~10 mL of Water and CaCO3 (g)
Beaker + ~10 mL of
Water, CaCO3,
and 5 mL of HCl (g)
B2 ~0.2 g 38.804 g 44.119 g 0.200 g 35.198 g 42.219 g B4 ~0.3 g 48.900 g 53.883 g 0.300 g 39.829 g 44.670 g B6 ~0.4 g 38.775 g 44.094 g 0.403 g 35.990 g 41.087 g B8 ~0.5 g 20.436 g 25.484 g 0.500 g 37.526 g 42.204 g B10 ~0.6 g 48.324 g 53.338 g 0.602 g 39.696 g 44.411 g B12 ~0.7 g 35.162 g 44.257 g 0.714 g 43.123 g 48.036 g B14 ~0.8 g 39.530 g 44.320 g 0.812 g 49.930 g 42.920 g B16 ~0.9 g 41.127 g 46.258 g 0.900 g 37.897 g 42.765 g B18 ~1.0 g 38.310 g 43.578 g 1.002 g 44.637 g 49.539 g B20 ~1.1 g 32.953 g 38.354 g 1.102 g 46.426 g 51.658 g B22 ~1.2 g 48.520 g 53.736 g 1.200 g 41.523 g 46.205 g B24 ~1.3 g 39.114 g 44.376 g 1.311 g 39.506 g 44.296 g
Other Calculations: HCl concentration = 109 g /L 1 mL = 109 mg 109 mg/mL 5 mL = 545 mg 4.6 mL = 500 mg
Students need to know the concept of determining which reactant limits a chemical reaction,
identification by appearances, and limiting and excess reagents in a chemical reaction.
Conclusion questions: 1. In this lab, we tried to determine which reactant limits a chemical reaction, distinguish between
different substances based on changes in appearance, and distinguish limiting and excess reagents in a reaction. We are trying to determine which reactant is completely used up in the chemical reaction and the point which it occurs. The final results were that CaCO3 that contained 0.25 g was the limiting reactant within seconds, CaCO3 that contained 0.60g was the excess reagent and the limiting reagent was the hydrochloric acid due to the pink color. This observation lasted around 30 seconds and changed colors a couple times but finally stayed at yellow. CaCO3 containing 1.0 g had a limiting agent of hydrochloric acid as well. Within 5 second of the initial color change to pink, it changed to yellow.
2. No, to determine the limiting reactant, you have to convert the reactants to one product using mole to mole ratio. The reactant that yields the smallest amount of product is the limiting reagent.

CHEM 111 A09 FALL 2016, LAB 3, 16-20 20
3. No, to determine the limiting reactant, you have to convert the reactants to one product using mole to mole ratio. The reactant that yields the smallest amount of product is the limiting reagent.
4. My largest value of moles CO2 per mole CaCO3 is 0.02. This value should conform to the ratio of moles for these two compounds, considering NaHCO3 (s) + CH3COOH (aq) H2O (l) + CO2 (g) + CH3COONa (aq).
5. At 0.25 g CaCO3, the limiting reagent was CaCO3 and was pink at the end. At 0.60g CaCO3, the limiting reagent was HCl and was yellow at the end. At 1.0 g CaCO3, the limiting reagent was HCl and was yellow at the end.
6. My plot of moles CaCO3 versus moles CO2 shows a single, reasonable straight line. Moles versus moles are a ratio based statistic and since it holds true, it produces a linear line.
4. Summary and Discussion
In conclusion, when showing mass relationships, such as observing chemical reactions to determine reactant limits, differences between substances based on changes in appearance, distinguishing limiting and excess reagents, and just being able to see what reactant was completely used up. During the lab we used three different test tubes with three different masses in each. The lowest product of mass 0.25 g of CaCO3 was the limiting reagent and the remaining two, which consisted of 0.60 g and 1.0 g of CaCO3 were excess reagents. If the limiting reagent was CaCO3, the final color was pink since we used the indicator. If HCl was the limiting reagent, the final color was yellow. Signs of chemical change in this lab were the fact that when HCl was added, CaCO3 would instantly fizz and release CO2. Also, the color change of the solution indicates a chemical change. Overall, this quantitative relationships lab between reactant quantities and resulting product quantities were very interesting since it was about studying the chemical reaction between calcium carbonate and hydrochloric acid in terms of this mass relations lab experiment.
Acknowledgments
The author gratefully acknowledges his lab partner Tahmir Smith for his assistance in performing the experiments.
© 2016 by the author. This article is an open access article.
CHEM 111 A09 FALL 2016, LAB 4, 21-24
CHEM 111 A09
GENERAL CHEMISTRY
LABORATORY FALL 2016
Indiana University of Pennsylvania
Determination of Phosphorus in Fertilizer
Karlie Ebert
Indiana University of Pennsylvania, Indiana, PA 15705
Academic Editor: H. Tang
Received: October 11, 2016 / Accepted: December 13, 2016 / Published: December 13, 2016
Abstract: The goal of this lab is to analyze the amount of phosphorus in a given amount
and type of fertilizer. The results of the experiment will be compared to the labeling of the
package. Because fertilizers contain water soluble and insoluble products, the phosphorus
can be taken out by knowing that information. Then by using the idea of balanced
reactions, the mass of the element compared to the mass that was present in the original
compound can tell the percent mass of the element in the original compound.
1. Introduction and Scope
A. Purpose
The objective of the experiment was to determine the amount phosphorus content in a given
fertilizer. The goal is to see if the found amount of phosphorus is the same amount found on the label.
B. Procedure
Major Roles:
Partners: Karlie Ebert and Logan Hutchinson
The roles included one student measuring and weighing while the other student was part of the
conducting the stirring and adding portion of the lab.
Separating soluble from insoluble:
The first step of the lab is to measure out 3.000 grams of the assigned fertilizer. In this case, it was
28 - 8 -16. The next step was to separate out the water soluble from the water insoluble. This was
approached by putting the 30.000 grams of fertilizer into a 150 mL beaker and adding 78 mL of water
in the fertilizer to dissolve it. This was then filtered into a 500 mL volumetric flask and the liquid that
was filtered out what added back to the 150 mL beaker. The calculated MgSO4 is then added to the
solution and the observations were then recorded. Then, 2 mL of ammonia was added to the mixture to
OPEN ACCESS

CHEM 111 A09 FALL 2016, LAB 4, 21-24 22
reach a pH of 9. The beaker was then put in an ice bath for 20 minutes. While this was happening,
damp filter paper was added to the funnel and the 500 mL volumetric flask. The cold mixture was then
poured in with the vacuum attached to the volumetric flask. After it was filtered, the filter paper is then
put onto an already weighed watch glass and is set aside to dry. After dried, the mass is calculated to
find the mass of phosphorus present. The percent mass of phosphorus then can be calculated and
compared to the label of the original fertilizer box.
Materials:
Fertilizer Water Watch glass Glass stirring rod 150 mL beaker
500 mL
volumetric flask
Vacuum rubber
tubing
Funnel Filter paper Ammonia
pH paper Magnesium
sulfate
Scale Dropper Ice bath
TYPE OF FERTILIZER: 24 - 8 -16
3.00 g of fertilizer x 0.08 = 0.24 grams P2O5
0.24 x
= 0.105 g P
= 0.0034 moles of P
0.0034 x 121 g/mol of MgSO4 = 0.408 g MgSO4
50% MORE
0.408 g MgSO4 x 1.5 = .612 g MgSO4
2. Main Body of the Paper
A. Data and Results
Mass of Fertilizer: 3.000 grams
Percent Composition of Fertilizer: 24 - 8 - 16
Description of Mixture After Addition of MgSO4: The original color of the blue was a little darker
than before.
Description of Mixture After Addition of NH3: When the ammonia was added, the mixture was
foggy until it was completely mixed and after it was completely mixed, it foggy throughout the entire
mixture.
Description of Product: The product was a light blue and it looked like a layer of slush.
Mass of Dried Product: 1.007 g.
B. Calculations
Moles of Product (Mg(NH4)(PO4)(H2O6)6):
(1.007 g)/(245.42 g/mol)= 0.0041 moles
Percent of P in Product (Mg(NH4)(PO4)(H2O6)6):
(30.97 g/mol P)/(245.42 g/mol(Mg(NH4)(PO4)(H2O6)6)x 100 = 12.62%

CHEM 111 A09 FALL 2016, LAB 4, 21-24 23
Mass of P in Product:
1.007 g x .1262 = 0.1271 g P
Mass of P2O5:
(0.1271 g P)/(30.97 g/mol P)x 142 g/mol P2O5 = 0.5828 g P2O5
Moles of P2O5:
(0.5828 g P2O5)/(142 g/mol P2O5)= 0.0041 moles P2O5
Experiment % P2O5 in Original Fertilizer Sample:
(0.5828 g P2O5)/(3.00 g)x 100 = 19.43%
Percent Error:
(19.43% - 8.00%)/(8.00%)= 142.9%.
Miscellaneous
Pre-Lab Assignment:
1.
a. 30.97 g/mol of P
b. (2 x 30.974 g/mol of P) + (5 x 16.00 g/mol of O) = 141.9 g/mol of P2O5
c. (1 x 24.31 of Mg) + (1 x 32.07 g/mol of S) + (4 x 16.00 g/mol of O)
= 120.4 g/mol of MgSO4
d. (1 x 24.31 g/mol of Mg) + (1 x 14.01 g/mol of N) + (16 x 1.008 g/mol of H)
+ (1 x 30.97 g/mol of P) + (10 x 16.00 g/mol of O)
= 245.4 g/mol of Mg(NH4)(PO4)(H2O)6
2.
a. 5% N, 30% P2O5, 15% K2O
b.
x 100 = 43.64 grams of P
c. 10.00 grams x 30% = 3 g P2O5
3 g x
= 1.31 g P
= .042 moles of P
d. 5.04 g of MgSO4
3.
a.
x 100 = 12.6% P
b. 11.503 g x .126 = 1.45 g of P
c.
x 142 g/mol = 3.32 g
d.
x 100 = 29%
CHEM 111 A09 FALL 2016, LAB 4, 21-24 24
3. Conclusion
The final percent mass found of P2O5 in the sample of fertilizer is 19.43% This did not match the
packaging because the packaging percent of P2O5 was written to be 8.00%. The sources of
experimental error could conclude to be inaccurate measurements, along with problems dealing with
the methods of making the precipitate. Another possible problem could have been the pH when
ammonia was added to the solution. If some of the solid MgKPO4(H2O)6 was in the solution, then the
calculated percentage would be higher because it would have added weight to the final precipitate.
There would be a difference in the results if the fertilizer was reformulated because if there is more of
the phosphorus, the weight of the final product would be higher than it would be with the actual
amount. Based on the results, the phosphorus could have been reformulated. The found amount of
P2O5 was over double the amount found in the final product.
4. Summary and Discussion
The overall idea of the experiment was to determine the amount of P2O5 in a sample of fertilizer, in
order to compare it to the original fertilizer label. To do this, a method had to followed in order to
accomplish separating the products found in the fertilizer to be able to make a precipitate. Once this is
made and data is collecting, the percentage of the P2O5 can be found and compared to the original
label. Knowing that fertilizer companies can sometimes reformulate the amount of phosphorus is a
product, the exact percentage of P2O5 is likely not to be exactly the same as it is seen on the label. In
conclusion, the goal of this experiment was to understand the concept of mass relationships.
Acknowledgments
The author gratefully acknowledges her lab partner Logan Hutchinson for her assistance in
performing the experiments.
© 2016 by the author. This article is an open access article.

CHEM 111 A09 FALL 2016, LAB 5, 25-28
CHEM 111 A09
GENERAL CHEMISTRY
LABORATORY FALL 2016
Indiana University of Pennsylvania
How Much Reactant Do I Need?
Alex Ignatenko
College of Natural Sciences and Mathematics, Indiana University of Pennsylvania, Indiana, PA 15705
Academic Editor: H. Tang
Received: September 27, 2016 / Accepted: December 13, 2016 / Published: December 13, 2016
Abstract: The purpose of this lab is to identify the limiting reactant through
experimentation of adding HCl to CaCO3 mixed with water. This lab is meant to educate
students about moles, and how much substance is required in order to achieve the ultimate
reaction. Frankie and I played key roles in gathering the material necessary for the lab, and
making sure the equipment was set up properly. Frankie did a fantastic job in gathering
HCl and CaCO3 for the lab, while I was in charge of recording the data, and observing the
reactions that took place. This report is going to explore the amount of reactant needed in
order to produce a reaction, how to find out the limiting reagent, or the amount of moles
that can be produced in the reaction. This lab involved multiple procedures in which
Calcium and Hydrochloric Acid were used. During this experiment, we had to make
calculations of moles, and determine which compounds were released due to the reactions
that took place.
1. Introduction and Scope
The title of this lab speaks for itself, because it is a lab focused on how much reactant is needed in
order to produce the ultimate reaction, without having any leftover material. In this lab, multiple
reactions will be shown, and what their results produced. HCl is the main reactant used in this lab.
Different test tubes with various amounts of Calcium were used in order to find out which test tube
provides the best reaction. The second part of this lab will show how much CO2 was released in the air
by weighing the reactant before and after.
2. Main Body of the Paper
OPEN ACCESS

CHEM 111 A09 FALL 2016, LAB 5, 25-28 26
Part 1
The experimental procedure in this lab involved the use of Calcium and Hydrochloric Acid. My
partner, Frankie, acquired 50 mL of HCl from the fume hood, and he began gathering the 0.25 g, 0.60
g, and 1.0 g of CaCO3 into 3 different test tubes, as I began to set up the area for experimentation.
After the test tubes were set up, I added 5 mL of distilled water to all 3 beakers. Then, an indicator was
used in order to tell if the substance was basic or acidic. The indicator showed that the substance in the
beakers was in fact basic, because it appeared yellow when the indicator was added to the test tubes.
Me and my partner than added the calculated volume of HCl solution to the beakers. The first test
tube (0.25 g), turned pink as HCl was added to it. It slowly started to release bubbles, and it took less
than a minute for all of the CaCO3 to be reacted. The second test tube (0.6g) reacted much more
violently. Once the HCl was added, the solution reacted very quickly, and some of it managed to spill
out of the test tube. Once the HCl was added, the solution turned pink as well, and once the reaction
was completed, the solution became yellow again. Once the HCl was added to the third test tube (1.0
g), it turned pink as well, however it was bubbling very slowly, and after the reaction was completed,
CaCO3 was leftover at the bottom of the test tube.
The limiting reactant in this case is the HCl, because the CaCO3 was still left over in the third test
tube. If more HCl was added to the third test tube, all of CaCO3 would have reacted completely.
Part 2
The second part of this lab involved the use of HCl and CaCO3 again. I acquired a 10 mL graduated
cylinder, and weighed it. Our measurement of the cylinder was 41.127 g. After 5 mL of HCl was
added, the cylinder weighed 46.258 g. Therefore, the HCl itself weighed 5.131 g. Me and Frankie were
asked to approximately used 0.9 g of CaCO3 for the experiment. Frankie was able to gather 0.900 g of
CaCO3 exactly, and we put it in a 50 mL beaker with 10 mL of water mixed in. After the mixture was
created, we weighed the mass of the beaker and the solution, which came out to be 37.897 g. After the
HCl was added to the beaker, and the reaction was completed, the beaker weighed 42.765 g. The
difference between those 2 values is 4.868 g. So, if we compare the values 5.131 to 4.868, this
indicated that CO2 was released in the beaker with CaCO3 when the HCl was added. If we subtract
4.868 from 5.131, it equals 0.263, which is the amount of CO2 that was released during the reaction in
the beaker with CaCO3.
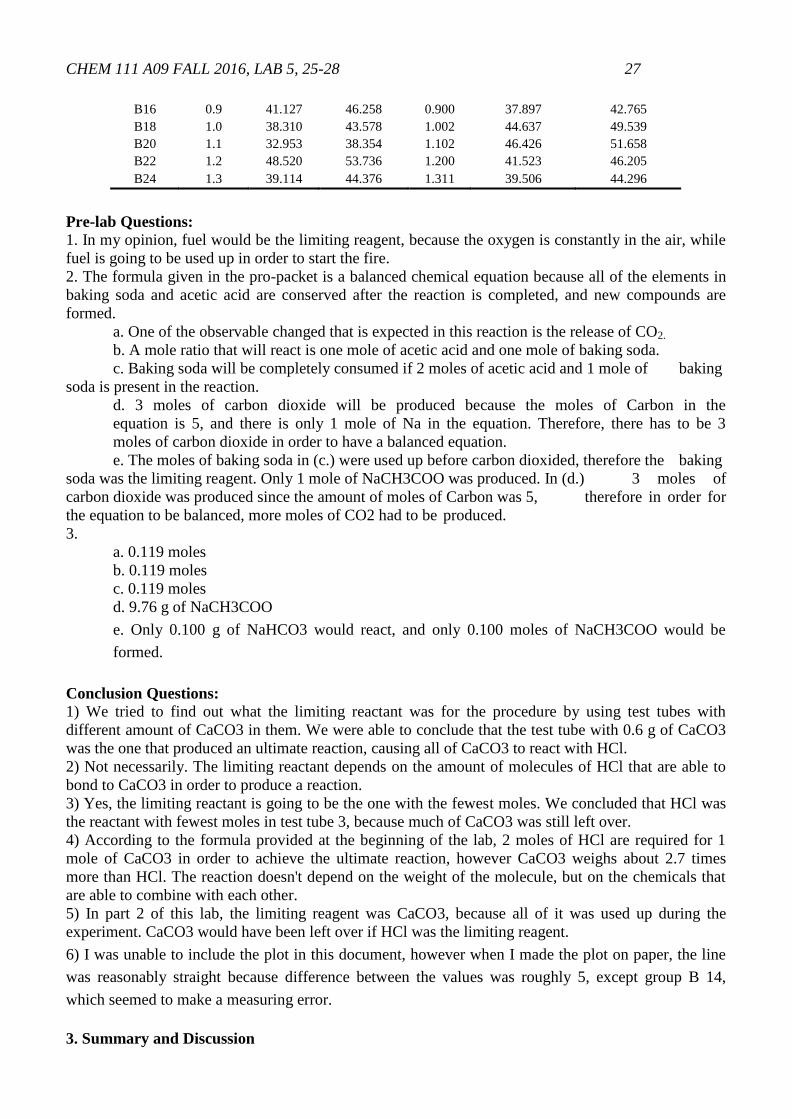
Part 3
Our instructor made sure that all the values were recorded in class so they could be compared. This
is the table of all the values that were recorded in the lab.
Group # approx.
CaCO3[g]
empty
cylinder
[g]
cylinder +
5ml HCl [g]
exact
CaCO3
[g]
Beaker+10ml
water+CaCO3
[g]
Beaker+10ml
water+CaCO3+
HCl [g]
B2 0.2 38.804 44.119 0.200 35.198 42.219
B4 0.3 48.900 53.883 0.300 39.829 44.670
B6 0.4 38.775 44.094 0.403 35.990 41.087
B8 0.5 20.436 25.484 0.500 37.526 42.204
B10 0.6 48.324 53.338 0.602 39.696 44.411
B12 0.7 35.162 44.251 0.714 43.123 48.036
B14 0.8 39.530 44.320 0.812 49.930 42.920
CHEM 111 A09 FALL 2016, LAB 5, 25-28 27
B16 0.9 41.127 46.258 0.900 37.897 42.765
B18 1.0 38.310 43.578 1.002 44.637 49.539
B20 1.1 32.953 38.354 1.102 46.426 51.658
B22 1.2 48.520 53.736 1.200 41.523 46.205
B24 1.3 39.114 44.376 1.311 39.506 44.296
Pre-lab Questions:
1. In my opinion, fuel would be the limiting reagent, because the oxygen is constantly in the air, while
fuel is going to be used up in order to start the fire.
2. The formula given in the pro-packet is a balanced chemical equation because all of the elements in
baking soda and acetic acid are conserved after the reaction is completed, and new compounds are
formed.
a. One of the observable changed that is expected in this reaction is the release of CO2.
b. A mole ratio that will react is one mole of acetic acid and one mole of baking soda.
c. Baking soda will be completely consumed if 2 moles of acetic acid and 1 mole of baking
soda is present in the reaction.
d. 3 moles of carbon dioxide will be produced because the moles of Carbon in the
equation is 5, and there is only 1 mole of Na in the equation. Therefore, there has to be 3
moles of carbon dioxide in order to have a balanced equation.
e. The moles of baking soda in (c.) were used up before carbon dioxided, therefore the baking
soda was the limiting reagent. Only 1 mole of NaCH3COO was produced. In (d.) 3 moles of
carbon dioxide was produced since the amount of moles of Carbon was 5, therefore in order for
the equation to be balanced, more moles of CO2 had to be produced.
3.
a. 0.119 moles
b. 0.119 moles
c. 0.119 moles
d. 9.76 g of NaCH3COO
e. Only 0.100 g of NaHCO3 would react, and only 0.100 moles of NaCH3COO would be
formed.
Conclusion Questions:
1) We tried to find out what the limiting reactant was for the procedure by using test tubes with
different amount of CaCO3 in them. We were able to conclude that the test tube with 0.6 g of CaCO3
was the one that produced an ultimate reaction, causing all of CaCO3 to react with HCl.
2) Not necessarily. The limiting reactant depends on the amount of molecules of HCl that are able to
bond to CaCO3 in order to produce a reaction.
3) Yes, the limiting reactant is going to be the one with the fewest moles. We concluded that HCl was
the reactant with fewest moles in test tube 3, because much of CaCO3 was still left over.
4) According to the formula provided at the beginning of the lab, 2 moles of HCl are required for 1
mole of CaCO3 in order to achieve the ultimate reaction, however CaCO3 weighs about 2.7 times
more than HCl. The reaction doesn't depend on the weight of the molecule, but on the chemicals that
are able to combine with each other.
5) In part 2 of this lab, the limiting reagent was CaCO3, because all of it was used up during the
experiment. CaCO3 would have been left over if HCl was the limiting reagent.
6) I was unable to include the plot in this document, however when I made the plot on paper, the line
was reasonably straight because difference between the values was roughly 5, except group B 14,
which seemed to make a measuring error.
3. Summary and Discussion

CHEM 111 A09 FALL 2016, LAB 5, 25-28 28
To summarize this lab report, I would like to say that this was a very informative lab, and it taught
me and my lab partner Frankie about the difference between the mass and moles. By concluding the
experiment, I realized that the mass of the mole has nothing to do with it being the limiting reagent; it
all depends on the molecules that are able to bond to the other molecules. For example, at the
beginning of this lab, we were given an example that it takes 1 handlebar, 1 seat, 2 wheels, and 1 frame
in order to make one bike. So, if we are given 20 wheels, 18 frames, 18 seats, and 18 handlebars, we
are only able to make 10 bicycles, because 2 wheels are required for each bike. That leaves us with 8
frames, 8 seats, and 8 handlebars left over. This analogy can be used in the experiment that we
conducted. We used HCl and CaCO3, and the formula states that 2 HCl moles are required per 1 mole
of CaCO3 in order to have a perfect reaction.
In the first test tube, the limiting reagent was CaCO3, because the test tube was still pink at the end
of the reaction, which meant that it was still acidic. The second test tube was the ultimate reaction
produced, because both the HCl and CaCO3 reacted perfectly, since the test tube was yellow at the end
of the reaction. And in the third test tube, the limiting reagent was the HCl, because there was still
much of CaCO3 left over. I was able to conclude, according to the chart, that the line was fairly
straight, and that one group had made a calculation mistake, which was a simple error. I learned a lot
about moles and the calculation of limiting reagents because of this lab, and me and my partner will be
able to use this information in the future.
Acknowledgments
The author gratefully acknowledges his lab partner Francis Zwiercan for his assistance in
performing the experiments.
© 2016 by the author. This article is an open access article.

CHEM 111 A09 FALL 2016, LAB 6, 29-33
CHEM 111 A09
GENERAL CHEMISTRY
LABORATORY FALL 2016
Indiana University of Pennsylvania
Analysis of Antacids
Alex Ignatenko
College of Natural Sciences and Mathematics, Indiana University of Pennsylvania, Indiana, PA 15705
Academic Editor: H. Tang
Received: October 18, 2016 / Accepted: December 13, 2016 / Published: December 13, 2016
Abstract: The purpose of this lab was to analyze a brand of over-the-counter antacid by
the process of back titration. The process of back titration in this lab was dissolving the
antacid with excess HCl that was measured in order to ensure that all of the antacid is
dissolved completely. Then, by adding a chemical indicator, we were able to analyze the
amount of NaOH needed in order to achieve the equivalence point. As the equivalence
point was achieved, we were able to calculate the amount of moles of HCl and NaOH used,
and the amount of CaCO3 present in order to tell how cost effective our sample was
compared to other samples. During the experiment, Frankie did a great job of gathering the
antacid tablets, HCl liquid, and NaOH liquid. I was in charge of collecting the data, while
Frankie performed the experiment. We weighed 3 different samples of TUMS, and we
recorded that the active ingredient was calcium carbonate. We dissolved each of the
samples in exactly 25.00 ml of HCl, and we then added the chemical indicator and the
NaOH needed in order to achieve the equivalence point. After that, the procedure was
completed, and we had the proper data in order to do the calculations to figure out the
amount of active ingredient present. This report will carefully show and explain the
procedure and calculations that were performed during this experiment. The procedure
involved the use of 3 antacid samples (TUMS), HCl liquid, NaOH liquid, a scale, and
erlenmeyer flask, a volumetric pipette, and a mortar and pestle. It was crucial that the
measurements were as precise as possible in order to gather the most accurate data. We had
to use the process of back titration in order to figure out the amount of HCl that was used
up by the equivalence point of the reaction. After that was figured out, we were able to
calculate the amount of excess HCl that was left over after the reaction was completed.
1. Introduction and Scope
OPEN ACCESS

CHEM 111 A09 FALL 2016, LAB 6, 29-33 30
This paper is about understanding the concept of back titration, and the use of HCl and NaOH in
order to find out the amount of excess HCl used in the reaction. The back titration is the concept where
excess amount of acid is added in order for all of the antacid to react. Then, the NaOH was added in
order to find out how much excess HCl was left over in order to calculate the amount of HCl that was
needed for the antacid to completely react. That allowed us to calculate the moles and grams of the
active ingredient. This paper will show the results of the procedure, and it will thoroughly explain the
calculations that we acquired.
2. Main Body
At first, we were told by our instructor to acquire 3 different samples of the same antacid. We
decided to pick 3 different samples of TUMS, and Frankie weighed each tablet as I recorded the
results. The first tablet was 1.215 g, the second tablet was 1.205 g, and the third tablet was 1.201 g.
The tablets were round and white, and their main ingredient was calcium carbonate. After we weighed
the tablets, I acquired 25.00 mL of 0.799 M HCl provided for us by the Dr. Tang. While I was doing
that, Frankie crushed the first tablet by using a mortar and pestle. The crushed tablet was relocated to
an Erlenmeyer flask. As the 25.00 mL of HCl was added to the flask, the solution began to bubble until
the reaction was completed.
Our next step was to heat the solution in order to reassure that all of the antacid was reacted. After
that, we let it cool for about 5 minutes, while Frankie gathered the NaOH and placed it in the buret. We
added 2 drops of phenophalyne indicator to the solution, and we began to add the NaOH solution to the
Erlenmeyer flask. We started with 7.60 mL of NaOH liquid, and the equivalence point was reached
when the NaOH liquid reached 22.00 mL in the buret. Therefore, by subtracting 7.60 from 22.00, we
were able to conclude that 14.40 mL of NaOH was used for tablet 1.
We have done the same procedure for tablet 2 and 3, and our results were slightly different. For the
second tablet we used 17.70 ml of NaOH, and for the third, we used 16.70 mL of NaOH.
Data and Results
1. Brand of antacid we analyzed: TUMS.
2. Active ingredients: calcium carbonate.
3. Neutralization reaction of active ingredients with HCl for antacid: CaCO3 + 2 HCl = CaCl2 + H2O +
CO2.
4. Cost and number of tablets per bottle: $3.34 for 150 tablets.
5. Cost of each antacid, in cents per gram: on average, each pill weighs (1.215 + 1.205 + 1.201) / 3 =
1.207 g/pill, so then 3.34 / 150 = 0.0223 = 2.23 cents/pill, therefore 2.23 x (1.000 / 1.207) = 1.85
cents/g
6. Concentration of HCl = 0.799 M
7. Concentration of NaOH = 0.601 M
8. Indicator used, and the color change: Phenophalyne, the color changed to purple.
9. Volume of HCl added, and moles of HCl added: 25.00 mL, (25.00 mL / 1000 ml/L) = 0.025 L x
0.799 mol/L = 0.0200 mol
10.
Antacid Amount (g) HCl (0.799 M) NaOH (0.601 M)

CHEM 111 A09 FALL 2016, LAB 6, 29-33 31
Tablet 1 1.215 25.00 mL 14.40 mL
Tablet 2 1.205 25.00 mL 17.70 mL
Tablet 3 1.201 25.00 mL 16.70 mL
11.
Antacid Cost
(cents)
Cost
(cents/g)
Moles
HCl
added
Moles
NaOH
added
Moles HCl
neutralized
Moles HCl
neutralized
per gram
Moles HCl
neutralized
per cent
Tablet 1 2.23 1.85 0.0200 0.00877 0.0112 0.00922 0.00498
Tablet 2 2.23 1.85 0.0200 0.0106 0.00940 0.00780 0.00422
Tablet 3 2.23 1.85 0.0200 0.0100 0.0100 0.00833 0.00450
12.
The calculation for "Moles NaOH added" (for tablet 1): 14.40 mL of NaOH x 0.000601 mol/mL =
0.00877 mol NaOh
The calculation for "Moles HCl neutralized" (for tablet 1): 0.0200 mol of HCl - 0.00877 mol of NaOH
= 0.0112 mol of HCl
The calculation for "Moles HCl neutralized per gram" (for tablet 1): 0.0112 x (1 / 1.215) = 0.00922
mol
The calculation for "Moles HCl neutralized per cent" (for tablet 1): 0.00922 x (1 / 1.85) = 0.00498
mol/cent
13.
Average value of moles HCl neutralized per gram tablet: (0.00922 + 0.00780 + 0.00833) / 3 = 0.00845
Average value of moles HCl neutralized per cent: (0.00498 + 0.00422 + 0.00450 ) / 3 = 0.00457
14.
Tablet 1: 0.0112 mol HCl x (1/2) = 0.00560 mol CaCO3
Tablet 2: 0.00940 mol HCl x (1/2) = 0.00470 mol CaCO3
Tablet 3: 0.0100 mol HCl x (1/2) = 0.00500 mol CaCO3
15.
Average of active ingredient (CaCO3): (0.00560 + 0.00470 + 0.00500) / 3 = 0.00510 mol
The calculation for grams of active ingredient: 0.00510 mol x 100 g/mol = 0.51 g = 510 mg.
The amount stated by the manufacturer was 500 mg. Therefore, percent error is calculated by: (510-
500)/ 500 x 100 = 2 % error
Pre-lab Questions:
1. Write the balanced reaction equations for the reaction of HCl with each of the active
ingredients for in Milk of Magnesia and TUMS.
CaCO3 + 2 HCl = CaCl2 + H2O + CO2
2. Why do you think this lab's procedure calls for you to titrate the excess HCl with NaOH
after reaction of the HCl and the antacid, as opposed to direct titration of the antacid with HCl?
Using excess HCl will make sure that the antacid is completely reacted.
3. In the titration used in this experiment, which substance goes in the buret and which one
goes in the Erlenmeyer flask? Would the experiment work if the substances placed the other way
around?
If they were switched, the CaCO3 wouldn't react completely. NaOH goes in the buret, and
the HCl goes in the Erlenmeyer flask for CaCO3 to react.
4. What is the precision of a buret and a volumetric pipette?

CHEM 111 A09 FALL 2016, LAB 6, 29-33 32
The precision is 2 digits past the decimal point.
5. Calculate the initial number of moles of HCl in 15.00 ml of the 1.00 M HCl solution.
15.00 L / 1000 ml = 0.015 L x 1.00 mol/L = 0.015 mol
6. Calculate the moles of NaOH added to the solution.
0.950 mol/L = 0.000950 mol/mL 5.8 mL x 0.000950 mol/mL = 0.00551 mol of NaOH
7. Calculate the moles of HCl neutralized by the antacid.
0.015 - 0.00551 = 0.00949 mol of HCl
8. Calculate the number of moles of HCl neutralized per gram of antacid.
0.00949 x 1/1.42 = 0.00668 mol/g
9. A box of the antacid used in the example above costs $2.38, contains 75 tablets and the
tablets have an average mass of 1.42 g/tablet. What is the cost of the antacid in cents per
tablet and in cents per gram?
2.38 / 75 = 0.00317 = 3.17 cents per tablet.
3.17 x (1.00 / 1.42) = 2.23 cents per gram.
Conclusion Questions:
1. Summarize what you tried to find out in the experiment.
Our ultimate goal was to find out the amount of CaCO3 per tablet by using the process of back
titration. We were able to conclude that the amount of CaCO3 that we calculated was 510 mg, and
therefore the percent error was 2%, which means we conducted the experiment quite well.
2. Compare the cost per gram of tablet with the cost of mole of H+
neutralized. Which of these values
is the better way to access the cost effectiveness of the tablet?
The cost per gram is 1.85cents, while the average cost of mole of H neutralized per cent is 0.00457.
Therefore, about 0.00845 moles of H+ will be neutralized per gram. The cost per gram doesn't provide
the buyer with the information on how effective the active ingredient is at neutralizing acid, however
the cost of mole of H +provides the buyer with the amount of moles of acid that will be neutralized by
the active ingredient. Therefore, the cost of mole of H+
neutralized is the better way to access the cost
effectiveness of the tablet.
4. Are there other considerations besides cost and neutralizing ability to consider? If so, what are they
and what impact would they have on your decision?
I don't think there are any other considerations that would impact my decision. I believe that the
experiments and calculations done in this lab have provided me with all the answers needed.
3. Discussion and Conclusion
In conclusion, this lab report provided me and my lab partner, Frankie, with important information
on how to calculate the amount of CaCO3, which was the active ingredient in the antacid sample that
we used. We were introduced to the process of back titration, which is the process where excess acid is
added to the solution with active ingredient to ensure complete reaction. Then, the solution is titrated
with NaOH and the help of chemical indicator in order to find out the equivalence point. Once the
equivalence point was calculated, we had the information needed in order to calculate the active
ingredient present.
To conclude our findings, we were able to calculate the amount of active ingredient present, which
in our case was CaCO3, and it came out to be 510 mg per tablet. On the TUMS box, it stated that the
active ingredient per tablet was 500 mg, so the percent error came out to be 2%, which means that our
lab experiment was conducted quite well. Also, by using the calculation methods we learned in
previous labs, we were able to figure out the amount of moles of acid that will be neutralized by the
active ingredient. Most importantly, this lab showed Frankie and I how to use the process of back
CHEM 111 A09 FALL 2016, LAB 6, 29-33 33
titration in order to find out the amount HCl that was neutralized, and Dr. Tang did a great job of
showing us the calculations that needed to be used in order to figure out the effectiveness of the
antacid sample that we were provided.
Acknowledgments
The author gratefully acknowledges his lab partner Francis Zwiercan for his assistance in
performing the experiments.
© 2016 by the author. This article is an open access article.

CHEM 111 A09 FALL 2016, LAB 7, 34-37
CHEM 111 A09
GENERAL CHEMISTRY
LABORATORY FALL 2016
Indiana University of Pennsylvania
The Analysis of Eggshells for Calcium Carbonate
Baily Blackburn
Indiana University of Pennsylvania, Indiana, PA 15705
Academic Editor: H. Tang
Received: October 25, 2016 / Accepted: December 13, 2016 / Published: December 13, 2016
Abstract: This paper will provide the findings of my laboratory experiments that were
based on the method of direct titration to find the amount of calcium carbonate in an
eggshell. This lab could be performed three ways: Molar mass and mathematical
calculation, direct titration, or back titration. I chose the direct titration to get a better
understanding of its use but I quickly found that since the solute is water, it has a huge
disadvantage when dissolving the eggshell to titrate. This paper will guide you through the
process of finding the necessary data to come to the proper conclusions, even though
they’re not the conclusions you’re looking for.
1. Introduction and Scope
For this lab experiment, it’s almost and exact replica of the last two labs we have done. The only
difference here is that we are dealing with a new solute (CaCO3) and we get to choose what method
we want to use to find the amount of CaCO3 in the eggshell. I chose to use the direct titration method
simply because I felt more comfortable with it and I wanted to touch base with it again.
As we have done before, we need to dissolve the eggshell in water and titrate it with HCl acid that
has a known concentration. Keep in mind that you cannot overshoot the equivalence point when doing
this on your own; it will give you false results. To ensure our results are accurate, we will perform
three trials.
With this in mind, we can properly perform this experiment. It is important to know that when you
add a certain amount of base, you need to slowly drip the acid in to the solution. Once we find the
moles of CaCO3 we can then calculate the percentage of this substance in the eggshell.
OPEN ACCESS

CHEM 111 A09 FALL 2016, LAB 7, 34-37 35
2. Titration of an Eggshell with Known HCl using a Chemical Indicator
Problem
Use direct titration to acquire data about the CaCO3 content in an eggshell.
Data
Concentration of HCL: 0.799M Starting vol of HCl in buret: 47.5ml
Procedure
To start this lab, we had to crush half an eggshell (without the membrane) into a fine powder to
ensure it would dissolve in water. Once we did this, we had to find a suitable amount that would react
with 47.5ml or less of HCl. In our pre-lab, we found that 0.600g will give us proper results.
1.422g/ 100.09g/mol= 0.014mol
0.014mol x 2 = 0.028mol HCl
(0.799mol/1L)=(0.028mol/x) x= 0.035L or 35.00ml
This is the amount of HCl we expect the CaCO3 to react with to reach the equivalence point. After we
set up the solution to be titrated we found that the equivalence point was reached with only 1.00ml of
HCl added. We conducted two more trials to ensure our results.
Trial 2
Mass of eggshell: 1.598g
Starting amt. of HCl: 47.5ml
Expected equivalence point: 40.05ml
Amt added: 1ml
Trial 3
Mass of eggshell: 1.587g
Starting amt of HCl: 47.5ml
Expected equivalence point: 40.05ml
Amt added: 1ml
Discussion
We came nowhere close to our expected equivalence point in any of the trials. Going into this
experiment, we expected that not all the eggshell would dissolve into the water and that showed in our
observations. But we hypothesized that there wasn’t enough CaCO3 dissolved in the water to give a
proper equivalence point and we found that this was true.
PRE-LAB QUESTIONS
1. Balance equation for CaCO3 and HCl
CaCO3 + 2HCl = CaCl2 + H2CO3
2. If the eggshell is 100% calcium carbonate, how many moles of CaCO3 would be present?
0.053mol
b. Based on your balanced equation, how many moles of HCl would be needed to react with the moles
of calcium carbonate in 2a?

CHEM 111 A09 FALL 2016, LAB 7, 34-37 36
0.106mol
c. If HCl is 1.000M, what minimum vol. of HCl is needed to react with the CaCO3 in 2a? Is this a
volume of HCl that can be dispensed without refilling a 50.0ml buret?
0.106L or 106ml / no
d. What mass of eggshell should you aim to analyze assuming its 100% CaCO3?
1.25g
e. How will you ensure you won’t overshoot the endpoint in the titration?
Use an indicator
f. What are the advantages and disadvantages of direct titration?
ADV: Its simpler to use and requires less steps
DISADV: Not all the eggshell with dissolve in the water since it’s not a strong solvent
3. If you use a 25.00ml pipette to dispense 1.000M HCl, how many moles of HCl are present?
0.025mol
b. Find the maximum mass of CaCO3 that could be reacted with this amount of HCl.
1.25g
c. What would be a reasonable mass of eggshell to use?
0.600g
d. How many moles of HCl would be consumed by the eggshell? How many moles of HCl would be
leftover?
0.0120mol / 0.013mol
e. Write the balanced reaction between HCl and NaOH. What vol. of 1.000M NaOH would be needed
to neutralize the leftover HCl as determined in 3d?
HCl + NaOH = NaCl + H20 / 13.00ml
f. Does your answer in 3e require more than one filing of a 50ml buret? Does it take advantage of the
four sig figs of a buret?
No / Yes its 13.00 which is four sig figs
g. How will you find the endpoint without overshooting it?
Use an indicator
h. What are the advantages and disadvantages of back titration in this case?
ADV: It’s very precise
DISADV: There are a lot more calculations that could lead to error
POST-LAB QUESTIONS
1. Summarize what you tried to find and how you did it. What were the final results?
We tried to find the percentage of CaCO3 in an eggshell by using the direct titration method.
We found that it cannot be done with this method due to the water solvent.
2. Write a balanced equation for the reaction.
CaCO3 + 2HCl = CaCl2 + H2CO3
3. Include any other equations used.
None
4. Calculate the average % calcium carbonate in the eggshell.

CHEM 111 A09 FALL 2016, LAB 7, 34-37 37
We could not continue with the experiment due to our method. The water solvent greatly
affected the results.
5. List other businesses that might be interested in the calcium carbonate content of eggs.
Farmers and produce sellers could benefit from this information because the CaCO3 content in
the shell could affect the quality of the yolk.
6. How many grams of CaCO3 could be recouped if 37million pounds of eggshells were thrown away
and 70% of that can be recouped? How much is it worth (112.50/500g)?
37mill x .7= 2.59x10^7lbs x (453.592g/1lb)= 1.17x10^10g
1.17x10^10/500= 23496065.6 x $112.50= $2,643,307,380.00
3. Summary and Discussion
The downside to direct titration is that you use water as a solvent. Although water can dissolve
many elements, it was unable to completely dissolve the eggshell and all the CaCO3. This posed a
problem because there was not enough CaCO3 to react with the HCl where we could calculate the
percentage in the eggshell. A better approach to this experiment would be to use the back-titration
method because it uses a strong acid as a solvent. Since we could not completely dissolve the
eggshell, we cannot complete the experiment with this method.
Acknowledgments
I gratefully acknowledge the constructive comments and suggestions of Mr. Ali, Dr. Tang, and Mr.
Brad, they significantly improved the quality of this paper and deserve recognition. Technical support
was provided by the Stapleton Library at Indiana University of Pennsylvania.
© 2016 by the author. This article is an open access article.
CHEM 111 A09 FALL 2016, LAB 8, 38-41
CHEM 111 A09
GENERAL CHEMISTRY
LABORATORY FALL 2016
Indiana University of Pennsylvania
Gas Laws: Determination of the Molar Mass of a Metal
Elizabeth Matusik
Indiana University of Pennsylvania, Indiana, PA 15705
Academic Editor: H. Tang
Received: November 1, 2016 / Accepted: December 13, 2016 / Published: December 13, 2016
Abstract: This lab focuses on the concept of using the ideal gas law in order to determine
the unknown molar mass of a metal. This is done by solving for the other variables in the
ideal gas law equation, such as pressure, volume, and temperature. This data was collected
by reacted hydrochloric acid and the unknown metal to create a gas, and the electronic
equipment hooked up to the computer gave the data throughout the reaction. This data was
then used in combination with the chemical equation to calculate the moles of the metal,
and then converted into grams per mole.
1. Introduction
In order to be able to calculate the molar mass of the unknown metal that was used, we first must
know the balanced chemical reaction between hydrochloric acid and the metal, which have a one to
one mole ratio. Because of this ratio, the moles of hydrogen used are identical to the moles of the metal
used. The metal simply just needs to be weighed first, and then the reaction can be carried out. The
equipment that is hooked up to the computer then registers the pressure and temperature changes. With
all of this, we can then calculate the molar mass of the metal and compare it to the periodic table in
order to identify it.
2. Pre-lab Questions
1. What is the pressure change in this experiment, expressed in atm?
703 torr x (1 atm / 760 torr) = 0.925 atm
2. What is the temperature of the gas in degrees Kelvin?
C + 273.15 = 295.15 K
3. What is the volume of the gas in liters?
OPEN ACCESS
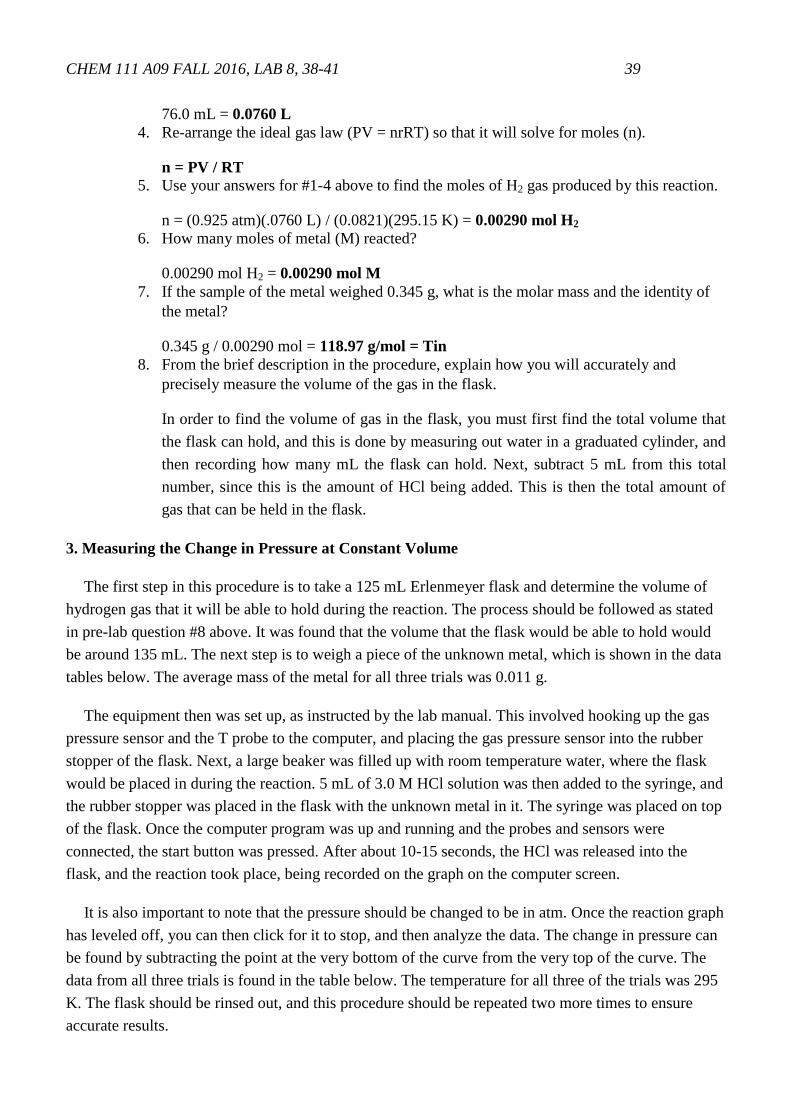
CHEM 111 A09 FALL 2016, LAB 8, 38-41 39
76.0 mL = 0.0760 L
4. Re-arrange the ideal gas law (PV = nrRT) so that it will solve for moles (n).
n = PV / RT 5. Use your answers for #1-4 above to find the moles of H2 gas produced by this reaction.
n = (0.925 atm)(.0760 L) / (0.0821)(295.15 K) = 0.00290 mol H2
6. How many moles of metal (M) reacted?
0.00290 mol H2 = 0.00290 mol M
7. If the sample of the metal weighed 0.345 g, what is the molar mass and the identity of
the metal?
0.345 g / 0.00290 mol = 118.97 g/mol = Tin
8. From the brief description in the procedure, explain how you will accurately and
precisely measure the volume of the gas in the flask.
In order to find the volume of gas in the flask, you must first find the total volume that
the flask can hold, and this is done by measuring out water in a graduated cylinder, and
then recording how many mL the flask can hold. Next, subtract 5 mL from this total
number, since this is the amount of HCl being added. This is then the total amount of
gas that can be held in the flask.
3. Measuring the Change in Pressure at Constant Volume
The first step in this procedure is to take a 125 mL Erlenmeyer flask and determine the volume of
hydrogen gas that it will be able to hold during the reaction. The process should be followed as stated
in pre-lab question #8 above. It was found that the volume that the flask would be able to hold would
be around 135 mL. The next step is to weigh a piece of the unknown metal, which is shown in the data
tables below. The average mass of the metal for all three trials was 0.011 g.
The equipment then was set up, as instructed by the lab manual. This involved hooking up the gas
pressure sensor and the T probe to the computer, and placing the gas pressure sensor into the rubber
stopper of the flask. Next, a large beaker was filled up with room temperature water, where the flask
would be placed in during the reaction. 5 mL of 3.0 M HCl solution was then added to the syringe, and
the rubber stopper was placed in the flask with the unknown metal in it. The syringe was placed on top
of the flask. Once the computer program was up and running and the probes and sensors were
connected, the start button was pressed. After about 10-15 seconds, the HCl was released into the
flask, and the reaction took place, being recorded on the graph on the computer screen.
It is also important to note that the pressure should be changed to be in atm. Once the reaction graph
has leveled off, you can then click for it to stop, and then analyze the data. The change in pressure can
be found by subtracting the point at the very bottom of the curve from the very top of the curve. The
data from all three trials is found in the table below. The temperature for all three of the trials was 295
K. The flask should be rinsed out, and this procedure should be repeated two more times to ensure
accurate results.

CHEM 111 A09 FALL 2016, LAB 8, 38-41 40
An example of how to solve for the molar mass of the metal is shown below.
n = PV / RT
n = (0.1153 atm)(0.135 L) / (0.0821)(295.25 K)
n = 6.42 x 10⁻⁴
0.013 g / 6.42 x 10-4 = 20.24 g/mol
Tables and Figures
Mass of Metal for Trial 1 of Experiment
Trial 1 Trial 2 Trial 3
Mass 0.013 g 0.012 g 0.013 g
Average 0.013 g
Standard Deviation 0.000577
Mass of Metal for Trial 2 of Experiment
Trial 1 Trial 2 Trial 3
Mass 0.010 g 0.011 g 0.010 g
Average 0.010 g
Standard Deviation 0.000577
Mass of Metal for Trial 3 of Experiment
Trial 1 Trial 2 Trial 3
Mass 0.010 g 0.011 g 0.0012 g
Average 0.013 g
Standard Deviation 0.00100
Change in Pressure
Trial 1 Trial 2 Trial 3
Pressure change 0.1153 atm 0.1284 atm 0.04300 atm
Average 0.09557 atm
Standard Deviation 0.04599
3. Summary and Discussion
Overall, we were able to accomplish the main goals of the lab. We weighed a piece of the unknown
metal, and using equipment and sensors hooked up to the computer and the beaker, were able to find
the variables in the ideal gas law equation. By recording this data and these variables, we were able to
solve for the number of moles, or n, in the equation. Once this variable was found, the original mass of
the metal was divided by the number of moles. This gives us the molar mass of the metal. We came to
the conclusion that the unknown metal was Magnesium. The actual molar mass on the periodic table

CHEM 111 A09 FALL 2016, LAB 8, 38-41 41
for this metal is 24.305 g/mol. Our average molar mass was 17.24 g/mol, however, our closest value
was trial one, which was 20.24 g/mol.
The numerical difference between the actual and experimental value is 4.065. The standard
deviation between these three trials was 3.90. This is less than two standard deviations between these
two values, which means that our data could be accepted and that the lab was successful.
Acknowledgments
Lydia Connelly was my lab partner and worked on this lab with me. Amanda and Symira also
worked on this lab procedure with us.
© 2016 by the author. This article is an open access article.

CHEM 111 A09 FALL 2016, LAB 9, 42-45
CHEM 111 A09
GENERAL CHEMISTRY
LABORATORY FALL 2016
Indiana University of Pennsylvania
Formation of an Air Bag from the Production of CO2
Tara M. Kenna
Indiana University of Pennsylvania, Indiana, PA 15705
Academic Editor: H. Tang
Received: November 8, 2016 / Accepted: December 13, 2016 / Published: December 13, 2016
Abstract: This paper presents the results of a model airbag designed to hold the maximum
amount of CO2 after reacting baking soda and hydrochloric acid in the following reaction:
NaHCO3(s) + HCl (aq)CO2 (g) + H2O (l) + NaCl (aq). The researchers used a medicine
cup, taped inside the Ziploc bag, to hold 4.40 g NaHCO3 and poured 17.30 mL of HCl into
the bottom of the bag. In order to react the two, they flipped the bag over and the reaction
began and the 0.052 moles of CO2 filled the bag 9.2 cm in width in 23.29 seconds.
1. Introduction
Chemists, in order to save millions of dollars in chemicals and disposal costs, carefully calculate
and balance the amount of reactants to make good economic and environmental sense. The invention
of the automobile airbag required not only chemistry it also consideration of economic and
environmental factors. When a crash occurs, an air bag must inflate rapidly, usually around 40
milliseconds, in an attempt to keep the occupants involved in the crash safe. The gas that is produced
from the inflation of the air bag is nontoxic, odorless, and cool enough to avoid burning the car
passengers. Chemists also look for compounds that don’t expand unexpectedly, and are easy and safe
to dispose of (General Chem. Lab Notebook, pg 62).
In this lab, in order to keep the reaction to be nontoxic, researchers will use the reation of sodium
bicarbonate, also known as baking soda, and react it with an aqueous solution of hydrochloric acid,
also known as stomach acid, to produce carbon dioxide gas to test the engineering design (General
Chem. Lab Notebook, pg 71). This reaction of hydrochloric acid and sodium bicarbonate is as follows:
NaHCO3 (s) + HCl (aq) CO2 (g) + H2O (l) + NaCl (aq)
OPEN ACCESS

CHEM 111 A09 FALL 2016, LAB 9, 42-45 43
In this reation, the CO2 produced obeys the Ideal Gas Law. All gases, at everyday temperatures and
pressures obey this law. This gas law combines together all major measurements when it comes to
gases: pressure, volume, temperature, and amount (moles) of gas (General Chem. Lab Notebook, pg
71). The equation is as follows:
PV = nRT
Where P is the pressure of the gas in atmospheres (atm), V is the volume in liters (L), n is the
amount in moles of the gas, R is the Ideal Gas Constant that has a value of 0.0821 atm-L/mole-K, and
T is the temperature of the gas in degrees kelvin (K). Using this equation, researchers can find any of
the variables using three of the other variables.
Within this paper, researchers will conduct experiments to design a model automobile airbag that
will expand to the largest possible volume without breaking the seal on the Ziploc bag. They will use
the ideal gas law to determine the proper amount of reactants so that there is no burst of the bag or
wastefulness of the chemicals.
2. Materials
Ziploc bag
Ruler
Calculator
Thermometer
10-15 g of NaHCO3
50 ml of 6 M HCl
Stopwatch
1 L graduated cylinder
Medicine cup
3. Design of the Air Bag
In order to make sure that the bag would not explode from the reaction, researchers had to determine
how much available volume there was within the Ziploc bag. In order to do this, they filled the bag
with water and then dumped the water into the 1 L graduated cylinder to determine the max volume of
the bag. The volume that the researchers found was 1260 mL.
With the researchers knowing the maximum volume, they next found the temperature change that
would occur within the reaction. They determined that the temperature change was not significant
enough so they kept the temperature at 303 K, the measured temperature after the reaction. Next,
researchers calculated the amount in moles of CO2 that would fill the bag after the reaction. They
determined this by using the Ideal Gas Law equation, solved for n (amount in moles).
n = PV/RT
= 0.052 moles CO2

CHEM 111 A09 FALL 2016, LAB 9, 42-45 44
Knowing the moles of carbon dioxide produced gives them a starting point on determining how much
sodium bicarbonate and hydrochloric acid they will need to produce this maximum amount of gas.
They do so in the following calculations:
0.052 mol CO2
= 4.40 g NaHCO3
0.052 mol CO2
= 17.30 mL HCl
Now that they have the proper amounts of reactants to form the air bag, they need the actual design. In
order to have minimal external parts or assistance and a lesser chance of having some carbon dioxide
escape the bag, the researchers decided that they would have to have both reactants inside the bag prior
to the reaction. Their final design was to tape a medicine cup to the inside of the sandwich bag so that
it sits upright towards the seal. They would put the 4.40 g of sodium bicarbonate inside this medicine
cup. Next, they would dump the 17.30 ml of hydrochloric acid into the bottom, away from the
medicine cup. When the timer said go, the researchers would flip the bag upside down and the two
reactants would mix and react. The reaction took 23.29 seconds to fill the bag with carbon dioxide to a
thickness of 9.2 cm. The researchers repeated this process three times.
4. Optimization of the Air Bag Design
Now that the researchers had their design in place, they needed to determine if changing the amount
of one or both of the reactants changed the speed of inflation of the bag or if it would create a better or
poorer cushion. To do this, they first, cut the measurements in half and using the same design, only
reacted 2.20 g of sodium bicarbonate and 8.65 ml of hydrochloric acid. This made less carbon dioxide
and created a poorer cushion but the reaction time did speed up. When the researchers doubled the
reactants to 8.80 g sodium bicarbonate and 34.60 ml of hydrochloric acid, they found that the rate at
which the bag filled up was the same if not slightly less than the ideal measurements they measured at
first. This amount of reactants, did in fact, create a thicker bag and a harder cushion.
5. Discussion
In conclusion, the researchers found that their design of air bag, complete with the medicine cup,
may have been a better way than other designs to separate the reactants until it was time for the
reactant but it was also worse than others. When the researchers flipped the bag over, the sodium
bicarbonate all fell in the same spot because it came from the small cup. The hydrochloric acid on the
other had, when flipped over, it went all along the seal of the bag because it was a liquid. If there was a
design that had all of the hydrochloric acid and the sodium bicarbonate to mix in the same spot, maybe
the reaction time would’ve been cut down even more.
By trying the different quantities of the reactants, the researchers found that if they added more
reactants, the bag would fill up with more air than maybe the bag could hold but the downside was,
that since there was more reactants, the time it took for the reactants to reacts and form the carbon
dioxide greatly increased. This was a plus for when less amounts of the reactants were tested because

CHEM 111 A09 FALL 2016, LAB 9, 42-45 45
there were less reactants to be reacted, the time it took to fill the bag was less but then again, the
cushion of the carbon dioxide formed from the less amount of reactants was weaker than the other
trials. The researchers settled on their original calculations of 17.30 ml of HCl and 4.40 g of NaHCO3.
Though it did not go off in 40 milliseconds like a normal car airbag does, it does create the optimal
cushion for the amount of reactants used.
This kind of lab is useful in everyday life and is very important when it comes to the safety of car
passengers. We all know too many people who have died or have been seriously injured in car crashes.
This Ideal Gas Law, and this experiment in particular, allows chemists to see the optimal amount of
reactants to produce the safest air bag for the safety of car passengers.
Acknowledgments
The author would like to acknowledge Jeffery Schmidt for assistance in performing the experiment.
References
Hoshin V. Gupta, Yuqiong Liu, Guidelines for the Preperation of Journal Style Written Reports,
January 19, 2005
Unknown Author, General Chemistry Laboratory Manual, Fall 2016
© 2016 by the author. This article is an open access article.

CHEM 111 A09 FALL 2016, LAB 10, 46-50
CHEM 111 A09
GENERAL CHEMISTRY
LABORATORY FALL 2016
Indiana University of Pennsylvania
Causes of the Temperature Change
Mohammed Ali
Department of Biology, Indiana University of Pennsylvania, Indiana, PA 15705
Academic Editor: H. Tang
Received: November 15, 2016 / Accepted: December 13, 2016 / Published: December 13, 2016
Abstract: The purpose of this lab was to use a temperature probe to measure temperature
differences in reactions and what ultimately causes these changes in difference. This was
done specifically by determining the heat capacity of a calorimeter by mixing hot and cold
water, finding the specific heat capacity of sand by combining hot sand with cold water
inside a calorimeter ammonium nitrates dissociation is an endothermic or an exothermic
reaction by measuring it temperature change in a calorimeter. The class average for the
calorimeter’s heat capacity was found to be -13.123 J/ ºC with a deviation of 18.713 J/ ºC.
Moreover, it was found that the specific heat capacity of sand is 5.31 J/ ºC mean that it
takes about 5.31 joules of energy to raise one gram of the sand by one degree Celsius. The
results also suggest that NH4NO3 would be endothermic as when it is dissolved this
compound absorbs energy from its surrounding making them cooler at the rate of 34
degrees Celsius per mole. The first two results are unusual and do not make sense as they
suggest that the calorimeter in the presence of heat would cool and that sand which is
known to vary tremendously with temperature has a higher specific heat capacity or is
more stable than water. Different forms of human and experimental error have been
attributed to these results.
1. Introduction and Scope
This lab’s purpose has three goals. The first goal was to determine the heat capacity of a calorimeter
by mixing hot and cold water together and deducing from the heat (q) consumed by both of these how
much heat was absorbed the calorimeter and therefore what its heat capacity was. The second goal was
to find the specific heat capacity of sand by combining hot sand with cold water inside a calorimeter
OPEN ACCESS

CHEM 111 A09 FALL 2016, LAB 10, 46-50 47
and measuring the relative change of temperature of both of them. The final goal was to determine
whether ammonium nitrates dissociation is an endothermic or an exothermic reaction.
2. Procedure
The experiment involved using a homemade calorimeter to determine changes in temperature of
reactions. The calorimeter was made by combining two coffee cups and covering it with a cardboard
cover that allowed a thermometer and temperature probe (Logger Pro) to analyze the reaction being
undergone inside. In each case the final temperature was found by measuring the highest temperature
the reaction attained as it was assumed after this point the energy would be unreflective of total energy
as some would have been lost. The first experiment involved the mixing of hot water with cold water
in a calorimeter. This was performed by boiling hot water and adding it to the calorimeter with the
intention of finding the heat loss or inefficiency attributed to the calorimeter and thus being able to
solve for the heat capacity. The second part of the experiment mirrored the first half but this time the
variable being found was the specific heat capacity of sand. This was done by uniformly heating sand
in a test tube that was surrounded by a water bath. Following this, the sand was added to the cold water
in a calorimeter and the peak temperature was noted. The final experiment dealt with determining if
Ammonium nitrate was a heat producing or heat absorbing when it dissociated. To determine this
massed amount of this compound was added to a calorimeter with cold water and the final temperature
was recorded as a means to determine the change in temperature per mole of Ammonium nitrate.
3. Results and Calculations
Determination of the Heat Capacity of a Calorimeter
0
5
10
15
20
25
30
35
40
0 20 40 60 80 100 120
Tem
per
atu
re (℃
)
Time (seconds)
Time vs. Temperature of Calorimeter
Mass of Water (g)
Initial
Temperature (ºC)
Final Temperature
(ºC)
Change in
Temperature (ºC)
Cold Water
(Calorimeter)
48.875 25.7 36.2 10.5
Warm Water
(Beaker)
49.283 27.1 47.1 20.0

CHEM 111 A09 FALL 2016, LAB 10, 46-50 48
The capacity of the calorimeter was calculated using the final and initial temperatures of a sample of
warm and cold water before and after mixing. The graph above shows the water’s temperature 100
seconds after being mixed. It demonstrates that the temperature sharply increased and reached its peak
of 36.2 degrees Celsius after 25 seconds. From this point onward, it steadily declined to a steady
temperature of 36 degrees. The heat capacity of the calorimeter could then be calculated using equation
“8” shown above. In this particular sample tested, Ccal was found to be 9.56 J/ ºC mean that it takes
about 9.56 joules of energy to raise the calorimeter’s temperature by one degree. The class average
was found to be significantly different at -13.123 J/ ºC with a deviation of 18.713 J/ ºC. This means
that when heat is added to the system, it actually lowers or cools the calorimeter’s temperature by this
rate.
Determination of the Specific Heat of Sand
Mass of Water (g)
Initial
Temperature (ºC)
Final Temperature
(ºC)
Change in
Temperature (ºC)
Cold Water
(Calorimeter)
98.555 24.8 27.4 2.6
Hot Sand
(Beaker)
6.000 60.0 27.4 -32.6
(-13.123) (27.4-24.8) + (6.000)(Cs)(27.4-60.0)+98.555(4.184)(27.4-24.8)=0
24.5
25
25.5
26
26.5
27
27.5
28
0 20 40 60 80 100 120
Tem
per
atu
re (
ºC)
Time (seconds)
Time vs. Temperature of Calorimeter

CHEM 111 A09 FALL 2016, LAB 10, 46-50 49
Cs= 5.31 J/ gºC
The specific heat of sand was calculated using the final and initial temperatures of a sample of hot
sand and cold water before and after mixing. The graph above shows the water’s temperature 100
seconds after being mixed. It demonstrates that the temperature sharply increased and reached its peak
of 27.4 degrees Celsius after 35 seconds. From this point onward, it steadily declined to a steady
temperature of 27.3 degrees. The specific heat could then be calculated using equation “6” shown
above and solving for Cs of sand. In this particular sample tested, was found to be 5.31 J/ ºC mean that
it takes about 5.31 joules of energy to raise one gram of the sand by one degree Celsius.
Dissolution of Salt
NH4NO3(aq) → H+ (aq) + NO3
- (aq) + NH3(g)
Salt Mass of Salt (g) Moles of Salt Initial Temperature
(ºC)
Final Temperature
(ºC)
Change in
temperature/moles
(ºC/mol)
NH4NO3 4.007 .05006 26.6 24.9 -34.0
NH4NO3 would be endothermic as when it is dissolved this compound absorbs energy from its
surrounding making them cooler at the rate of 34 degrees Celsius per mole. This can be determined by
the negative change in temperature per mole calculated.
Error Analysis
Error was noted in both the calculation of the heat capacity of the calorimeter and the determination
of the specific heat of the sand. The problem with the heat capacity of the calorimeter was that it is a
large negative number. This poses two problems first of all the number should not realistically be
negative. This result suggests the improbability than when heat is added to the system, it actually
lowers or cools the calorimeter’s temperature by this rate. Moreover, the calorimeters heat capacity
would likely have been slightly inefficient or above zero but not by such a degree. This means that the
calorimeter as opposed to being an insulator which is not supposed to absorb heat is actually capable of
absorbing it. Even the large standard deviation of +/- 18.713 J/ ºC for a mean of -13.123 J/ ºC suggests
something is very wrong. This means that the variation could more than double the conclusion in the
negative direction or make the heat capacity a small positive number. The most likely conclusion for
this is problem in calculating it or problems in actually using the calorimeter to attain the numbers.
The specific heat seems to have been calculated in error as its value of 5.31 joules per gram per
degree Celsius is higher than that of water. This does not make sense in either the case of the
experiment or in real life. The sand in the experiment changed temperature by a significant margin of
30+ degrees when it was mixed in the water but the cold water in the calorimeter itself changed less
than 5 degrees. This would suggest that the specific heat capacity would have to be lower. This also
goes against natural phenomenon as water is known to retain heat longer as is the case with the ocean
in the late summer months’ versus the relatively cool sand. The flaws in the experiment could have
been due to human errors such as a mistake in the calculations, problem with the heat capacity
calculated earlier on, problems mixing the sand within the calorimeter, or problems in the structure of
the calorimeter which was found to have a small hole.

CHEM 111 A09 FALL 2016, LAB 10, 46-50 50
4. Summary and Discussion
There were three main goals in this experiment. The first goal was to determine the heat capacity of
a calorimeter by mixing hot and cold water together and deducing from the heat (q) consumed by both
of these how much heat was absorbed the calorimeter and therefore what its heat capacity was. The
second goal was to find the specific heat capacity of sand by combining hot sand with cold water
inside a calorimeter and measuring the relative change of temperature of both of them. The final goal
was to determine whether ammonium nitrates dissociation is an endothermic or an exothermic
reaction. The class average was found to be -13.123 J/ ºC with a deviation of 18.713 J/ ºC. Moreover, it
was found that the specific heat capacity of sand is 5.31 J/ ºC mean that it takes about 5.31 joules of
energy to raise one gram of the sand by one degree Celsius. The results also suggest that NH4NO3
would be endothermic as when it is dissolved this compound absorbs energy from its surrounding
making them cooler at the rate of 34 degrees Celsius per mole.
The calorimeter was not very good as there were gaps between the lid and there was a hole at its
bottom. Also, in terms of insulation it would allow for a ready transfer of heat. To this end, the class
average does not tell much about the quality of calorimeter as it suggests that the calorimeter did not
get hot but rather got cold at the rate of -13.123 J/ ºC when heat was added to the system. This
therefore, cannot be used to accurately reflect how good or bad the calorimeter is. Design changes
would include making the calorimeter air tight, a better insulator, or submerging it in water as is the
case with bomb calorimeters.
The sand had a higher specific heat than that of water according to our experiment. This does not
make sense and in actuality water is believed to have a higher capacity to hold heat. For example, in
natural phenomena such as the beach or deserts, the land of these locations are known to gain or lose
heat really quickly. This explains why deserts like El’ Azizia vary from such high to low temperatures
as it does not take much heat from the sun for the sand to either rapidly gain or lose heat. In contrast,
the water of areas of bodies of water have warm temperatures long into the summer as the water
retains heat and even radiates. Tripoli likewise had moderate temperatures as the water is an
intermediary force that in cold months retains the heat and in warm months would not be extremely
affected or absorb the heat in large quanities. This retainment of heat is attributed to a higher specific
heat capacity so it doesn’t make sense for sand to have had a higher specific heat capacity when it does
the opposite. The results were therefore most likely due to human error and inaccuracy. This is also
chemically supported as water molecules are bonded by strong hydrogen bonds that take a lot more
energy to break and would therefore take a lot of energy to fluctuate in terms of heat. In contrast
covalent bonds such as those in sand are relatively easily broken.
Acknowledgments
The author gratefully acknowledges his lab partner Brad O’Hara for his assistance in performing the
experiment and all other aspects of the process, including data collection, statistical calculations, and
lab clean-up to enumerate a few.
© 2016 by the author. This article is an open access article.
CHEM 111 A09 FALL 2016, LAB 11, 51-55
CHEM 111 A09
GENERAL CHEMISTRY
LABORATORY FALL 2016
Indiana University of Pennsylvania
Creation of Hot Pack Using Calcium Chloride
Mohammed Ali
Department of Biology, Indiana University of Pennsylvania, Indiana, PA 15705
Academic Editor: H. Tang
Received: November 27, 2016 / Accepted: December 13, 2016 / Published: December 13, 2016
Abstract: A hot pack was created that through salt dissolution that would increase the
temperature of a calorimeter by three degrees Celsius. The salt used was calcium chloride
due to it being more environmentally friendly and conducive to larger sized hot packs. The
formula Ccal∆T+qdissolution+(mCs∆T)water was used to determine the exact number of grams
of calcium chloride required. This was found to theoretically be 0.375 grams of calcium
chloride. Unfortunately, when this was experimentally tested the temperature rose to only
about 1.5 degrees. This resulted in a 50% error. This error was most likely due to a
calorimeter’s design flaws but could also be caused by error in the amount of reactant
added or procedural inconsistencies. If these were to be marketed based on the current
results about double the predicted amount of calcium chloride would likely need to be
added to achieve a desired change in temperature.
1. Introduction and Scope
This lab’s purpose is to create a hot pack through salt dissolution that would increase the
temperature of a calorimeter by three degrees Celsius. This is caused by an exothermic reaction in
which chemical energy is released into its surroundings. The focus of this experiment is to also to
ensure that the salt used in its design makes the hot pack safe, cost effective, and efficient. This
experiment will be performed by using the molar enthalpy of the reaction with regards to the formula
Ccal∆T+qdissolution+ (mCs∆T)water to predict how much reactant will be needed to generate the required
temperature change. Hot packs play an important role in the treatment of both acute and chronic
injuries. They increase blood flow and help restore movement to injured tissue. Warmth can also
effectively reduce joint stiffness, pain, and muscle spasms.
OPEN ACCESS

CHEM 111 A09 FALL 2016, LAB 11, 51-55 52
The scope of this paper is to create an operative hot pack capable of increasing the overall
temperature by three degrees Celsius. This paper will show the methodology performed to come to
both conclusions by focusing on the materials and procedures, data and analysis, and the error analysis
and overall conclusions that can be drawn from the data.
2. Experimental Procedure for Creation of Hot Pack
This experiment required 1.000g Calcium Chloride, 50 mL distilled water,1-100mL graduated
cylinder, 2-styrofoam cups with cardboard cover, weighing boat, scoopula, temperature probe,
thermometer, electronic pan balance, LoggerPro, and computer. This lab was performed by using
enthalpies of formation to calculate the total molar enthalpy of reaction of calcium chloride. This
amount was then inputted into the formula Ccal∆T+qdissolution+(mCs∆T)water where the heat of
dissolution is equal to molar enthalpy times number of moles, ∆H(n). With all other variables known,
“n” or the number of moles of the reactant is solved for and this can be converted to find the exact
number of grams of calcium chloride needed to raise the temperature by three degrees Celsius (see
“Results and Calculations” section below). This amount was then massed and added to 25 mL of
distilled water within a homemade calorimeter. The initial and final temperature were recorded to
determine how much the temperature had increased due to the salt’s dissolution. This was performed a
total of two times.
This lab used a homemade calorimeter to determine changes in temperature of the reaction. The
calorimeter was made by combining two coffee cups and covering it with a cardboard cover. A
thermometer and a temperature probe (Logger Pro) were placed inside the calorimeter to analyze the
reaction being undergone and heat change within. In each case, the initial temperature was recorded
before the calcium chloride was added to the calorimeter and only the water was present. The final
temperature was found by measuring the highest temperature the reaction attained. It was assumed
after this point the energy would be unreflective of total energy released as some would have been lost.
3. Results and Calculations
Dissolution Reaction:
Calculation of Molar Enthalpy:
=
Calculation of Amount of Reactant:
0= Ccal∆T+∆H(n)+ (mCs∆T)water
0=
0=
0=

CHEM 111 A09 FALL 2016, LAB 11, 51-55 53
The amount of calcium chloride that needed to be dissociated to change the temperature by 3
degrees Celsius was found by using the above equation in which all the variables are known. The value
of Ccal or the calorimeter’s heat capacity in a prior experiment was found to be -13.124 joules per
degree Celsius. This was determined by mixing hot and cold water within a calorimeter and finding the
total heat loss or inefficiency attributed to the calorimeter. ∆T or the change in temperature is a
positive 3.0 degrees Celsius as the intended result is for the temperature to increase by three degrees.
∆H is the molar enthalpy of calcium chloride that was calculated from the individual enthalpies of
formation to be -81.2 kJ per mole or -81,200 joules per mole. The mass of the water added was 25.0
grams and the specific heat capacity of water is 4.184 joules per gram per degree Celsius. These
numbers were algebraically rearranged to solve for “n” or the number of moles of calcium chloride
needed. Finally, “n” was multiplied by calcium chloride’s molar mass to determine how many grams
of calcium chloride are needed to raise the temperature by three degrees Celsius.
24.5
25
25.5
26
26.5
0 20 40 60 80 100 120
Tem
per
atu
re (
)
Time (seconds)
Trial #1
24
24.5
25
25.5
26
26.5
0 20 40 60 80 100 120
Tem
per
atu
re (
)
Time (seconds)
Trial #2
Trial #1
Time
(seconds)
Temperature
0 25.1
20 25.0
40 25.8
60 26.0
68 26.3
80 26.2
100 26.2
Trial #2
Time
(seconds)
Temperature
0 24.2
20 24.2
40 24.5
60 25.6
78 26.0
80 26.0
100 26.0
Trial # Mass of Calcium Chloride
(g)
Temperature Change
Trial#1 0.376 1.2
Trial#2 0.376 1.8
Avg. +/- Std. 1.5 (+/-) 0.4

CHEM 111 A09 FALL 2016, LAB 11, 51-55 54
Two trials were performed in which 0.376 grams of calcium chloride was dissociated to
theoretically increase the calorimeter’s temperature by 3.0 degrees Celsius. In the first trial the initial
temperature was measured at 25.1 with the final temperature reaching 26.3 . The total change in
temperature was 1.2 overall. In the second trial the initial temperature was measured at 24.2 with
the final temperature reaching 26.0 . The total change in temperature was 1.8 overall. The average
temperature change based on these two trials was found to be 1.5 with a standard deviation of plus
or minus 0.4 . The temperature change graphs for both trials show a relatively smooth increase in
temperature with an eventual leveling out after 100 seconds. The maximum temperature was reached
around 60-80 seconds after the calcium chloride was added.
Error Analysis
There is a 50% error from the predicted and actual value of temperature change. The predicted
change in temperature was 3.0 but the actual value for ∆T was found to be 1.5 . Due to the fact
that the calculated value for temperature change differs by such a significantly large margin from the
actual value this means that a substantial amount of error has occurred. Also, the positive sign for
percent error means that the predicted amount was actually smaller than what it should be. This error is
most likely due to problems in the calorimeters design. It is possible that heat escaped from the loose
cardboard lid especially through the large holes designated for the probe and thermometer. Moreover,
an error in the heat capacity of the calorimeter that was previously calculated would influence the
results. This is presumed because the heat capacity is negative which suggests the unlikely scenario
that a heat producing reaction would actually lower the calorimeter’s temperature. The implications of
this erroneous value for Ccal is that the calculations would suggest a lower amount of calcium chloride
required to change the temperature by three degrees than what is actually necessary. Inconsistencies in
procedures could also have influenced the results. For example, in the second trial the calcium chloride
was shaken vigorously inside the calorimeter while in the first trial the calorimeter was not shaken at
all. This could potentially explain why the temperature increase of the second trial was 60% larger than
that of the first trial. It is also a possibility that no one major error caused the calculated temperature to
be lower than the actual value but it could have been a culmination of these factors, namely; design
issues with the calorimeter, error in the calculation of how much calcium chloride to use, and
procedural inconsistencies.
4. Summary and Discussion
This lab’s purpose was to create a hot pack through salt dissolution that would increase the
temperature of a calorimeter by three degrees Celsius. The salt used was calcium chloride. To
determine the amount of reactant needed, the formula Ccal∆T+qdissolution+(mCs∆T)water was used in
which the heat of dissolution is equal to molar enthalpy times number of moles, ∆H(n). Notably, ∆H of
calcium chloride was calculated by subtracting the sum of the degrees of freedom of products minus
that of the reactants. It is -81.2kJ/mol which is important because this means that the dissolution of
CaCl2 releases heat and would therefore be appropriate for use within a hot pack. With all other
variables known, “n” was solved for and this was used to determine the exact number of grams of
calcium chloride needed to raise the temperature by three degrees. This was found to theoretically be
CHEM 111 A09 FALL 2016, LAB 11, 51-55 55
0.375 grams of calcium chloride. When this was experimentally tested though, the temperature was
raised only to about 1.5 degrees. This means that between the predicted and actual values of
temperature change, a significant error of 50% was present. This error was most likely due to a
calorimeter’s design flaws but could also be caused by error in the amount of reactant added or
procedural inconsistencies. If these were to be marketed based on the current results about double the
predicted amount of calcium chloride would likely need to be added to achieve a desired change in
temperature.
When considering the construction of the hot pack both magnesium chloride and calcium chloride
were considered as viable options. In regards to price and overall heat released the difference between
the two were very similar. For example, magnesium chloride costs about $0.018 to raise the
temperature of calorimeter three degrees while calcium chloride costs a very comparable $0.022 to do
the same thing. Assuming that a hot pack was desired to raise the temperature from room temperature
(about 20 ) to 50 ,the total cost of the chemicals in a magnesium chloride hot pack would be 18
cents while those made of calcium chloride would be 22 cents. Due to such a small difference in cost
the choice to use calcium chloride came down to a matter of size and convenience. The calcium
chloride hot pack would weigh 37.5 grams while the magnesium chloride hot pack would weigh 16.34
grams. It seems that the extra weight of the calcium chloride would make it more desirable than the
relatively lighter and less substantial feeling of the magnesium hot pack. Moreover, because most hot
packs are disposable and one-time-use products it is important to note that calcium chloride has been
found to be more environmental friendly. In term of safety both chemicals are considered relatively
safe if used with common sense. They are rated as having low toxicity and the safety warnings for both
include standard precautions. Namely that these chemicals can be stored in a typical lab setting and
that they should not be ingested, inhaled, or applied to the bare skin for extended periods of time.
The majority of sports hot packs actually contain calcium chloride as their active ingredient. If a hot
pack was to be designed it would be designed in a similar manner to current hot packs. It would
contain a heavy-duty plastic bag filled with water or gel with a tiny bag containing calcium chloride.
The outer bag would have pressure or a twisting force applied to it to combine the dry chemical with
the water-based solution. After this is done the contents of the pack should be shaken to combine the
two and further the dissolution of the salt. As far as safety precautions go to biggest risk is that the bag
will be punctured and remain on the skin for an extended period of time of that the contents would be
some ingested within the body. To prevent this big warning labels should be present on the hot pack
and a thick, tear resistant outer bag should be used in the hot pack’s construction.
Acknowledgments
The author gratefully acknowledges his lab partner Brad O’Hara for his assistance in performing the
experiment and all other aspects of the process, including data collection, statistical calculations, and
lab clean-up to enumerate a few.
© 2016 by the author. This article is an open access article.

Chemistry Department
975 Oakland Avenue
143 Weyandt Hall
Indiana University of Pennsylvania
Indiana, PA 15705
www.iup.edu/chemistry