chem. 133 – 3/12 lecture. announcements i hw 2.1 problem due today quiz 3 also today lab – term...
TRANSCRIPT

Chem. 133 – 3/12 Lecture

Announcements I
• HW 2.1 problem due today• Quiz 3 also today• Lab – Term Project Proposal due next
Thursday• Sign Up (see details in main office) to
Meet With Review Committee (Mon. 3-3:15)
• Change in Office Location (starting after Spring Break): New Office = Sequoia 528 (probably for rest of semester)
Announcements II
• Today’s Lecture– Chapter 17: (Basic Spectroscopic Theory)
• Fluorescence/Phosphorescence• Spectral Interpretation• Beer’s Law
– Chapter 18: Spectrometer Instrumentation• Light Sources
SpectroscopyQuestions
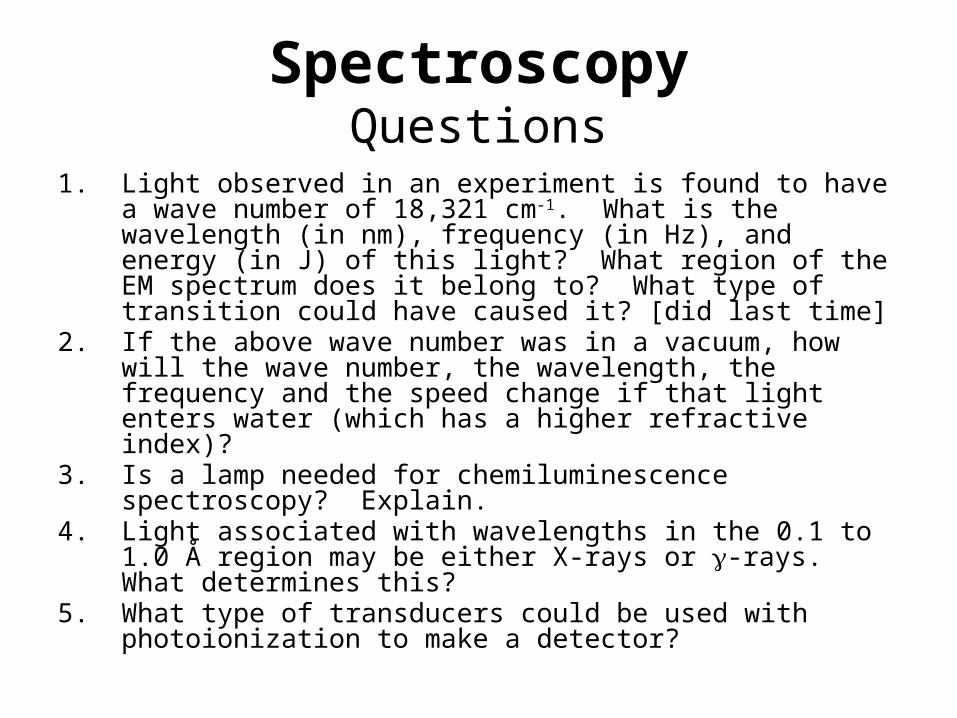
1. Light observed in an experiment is found to have a wave number of 18,321 cm-1. What is the wavelength (in nm), frequency (in Hz), and energy (in J) of this light? What region of the EM spectrum does it belong to? What type of transition could have caused it? [did last time]
2. If the above wave number was in a vacuum, how will the wave number, the wavelength, the frequency and the speed change if that light enters water (which has a higher refractive index)?
3. Is a lamp needed for chemiluminescence spectroscopy? Explain.
4. Light associated with wavelengths in the 0.1 to 1.0 Å region may be either X-rays or g-rays. What determines this?
5. What type of transducers could be used with photoionization to make a detector?

Spectroscopy Transitions in Fluorescence and
Phosphorescence• Absorption of light leads to
transition to excited electronic state
• Decay to lowest vibrational state (collisional deactivation)
• Transition to ground electronic state (fluorescence) or
• Intersystem crossing (phosphorescence) and then transition to ground state
• Phosphorescence is usually at lower energy (due to lower paired spin energy levels) and less probable
Ground Electronic State
Excited Electronic State
higher vibrational states
Triplet State (paired spin)

SpectroscopyInterpreting Spectra
• Major Components– wavelength (of
maximum absorption) – related to energy of transition
– width of peak – related to energy range of states
– complexity of spectrum – related to number of possible transition states
– absorptivity – related to probability of transition (beyond scope of class)
A
l (nm)
Ao
A*
DE
dl
dE

Absorption Based MeasurementsBeer’s Law
Light intensity in = Po
Light intensity out = P
Transmittance = T = P/Po
Absorbance = A = -logTLight source
Absorbance used because it is proportional to concentration
A = εbC
Where ε = molar absorptivity and b = path length (usually in cm) and C = concentration (M)
b
ε = constant for given compound at specific λ value
sample in cuvette
Note: Po and P usually measured differently
Po (for blank)
P (for sample)

Beer’s Law – Specific Example
A compound has a molar absorptivity of 320 M-1 cm-1 and a cell with path length of 0.5 cm is used. If the maximum observable transmittance is 0.995, what is the minimum detectable concentration for the compound?

Beer’s Law– Best Region for Absorption Measurements
• Determine the Best Region for Most Precise Quantitative Absorption Measurements if Uncertainty in Transmittance is constant
A
% uncertainty
0 2
High A values - Poor precision due to little light reaching detector
Low A values – poor precision due to small change in light

Beer’s Law– Deviations to Beer’s Law
A. Real Deviations- Occur at higher C - Solute – solute interactions become important- Also absorption = f(refractive index)

Beer’s Law– Deviations to Beer’s Law
B. Apparent Deviations1. More than one chemical species
Example: indicator (HIn)HIn ↔ H+ + In-
Beer’s law applies for HIn and In- species individually: AHIn = ε(HIn)b[HIn] & AIn- = ε(In-)b[In-]
But if ε(HIn) ≠ ε(In-), no “Net” Beer’s law applies Ameas ≠ ε(HIn)totalb[HIn]total
Standard prepared from dilution of HIn will have [In-]/[HIn] depend on [HIn]total
0
0.05
0.10.15
0.2
0.25
0.3
0.350.4
0.45
0.5
0 0.005 0.01 0.015
Total HIn Conc.A
bso
rban
ce
In example, ε(In-) = 300 M-1 cm-1
ε(HIn) = 20 M-1 cm-1; pKa = 4.0
Beer’s Law– Deviations to Beer’s Law
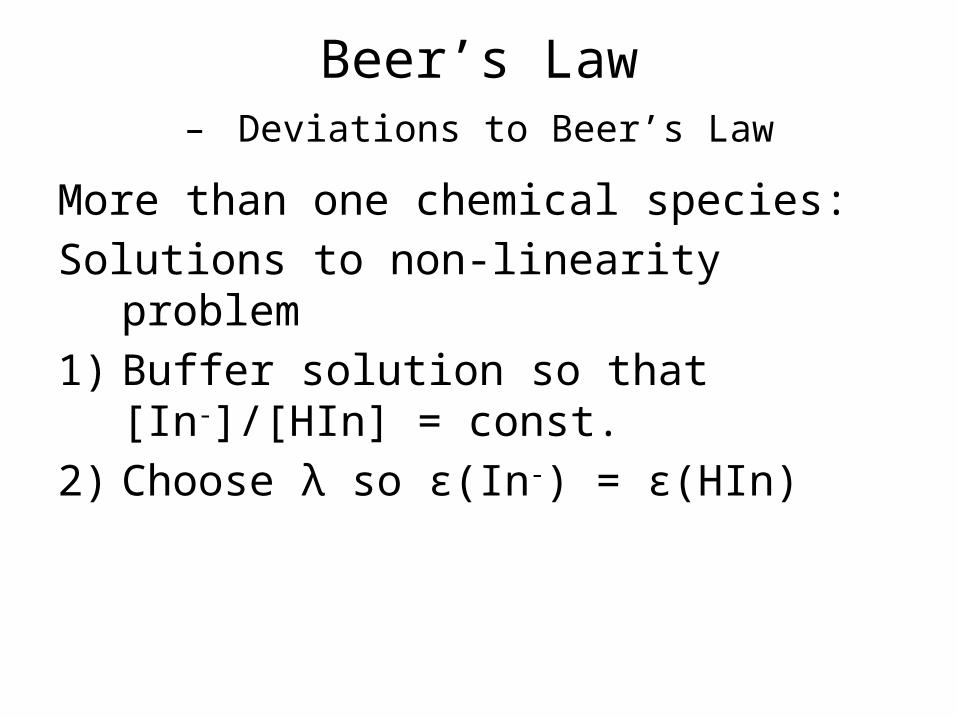
More than one chemical species:Solutions to non-linearity problem1) Buffer solution so that [In-]/[HIn] =
const.2) Choose λ so ε(In-) = ε(HIn)
Beer’s Law– Deviations to Beer’s Law
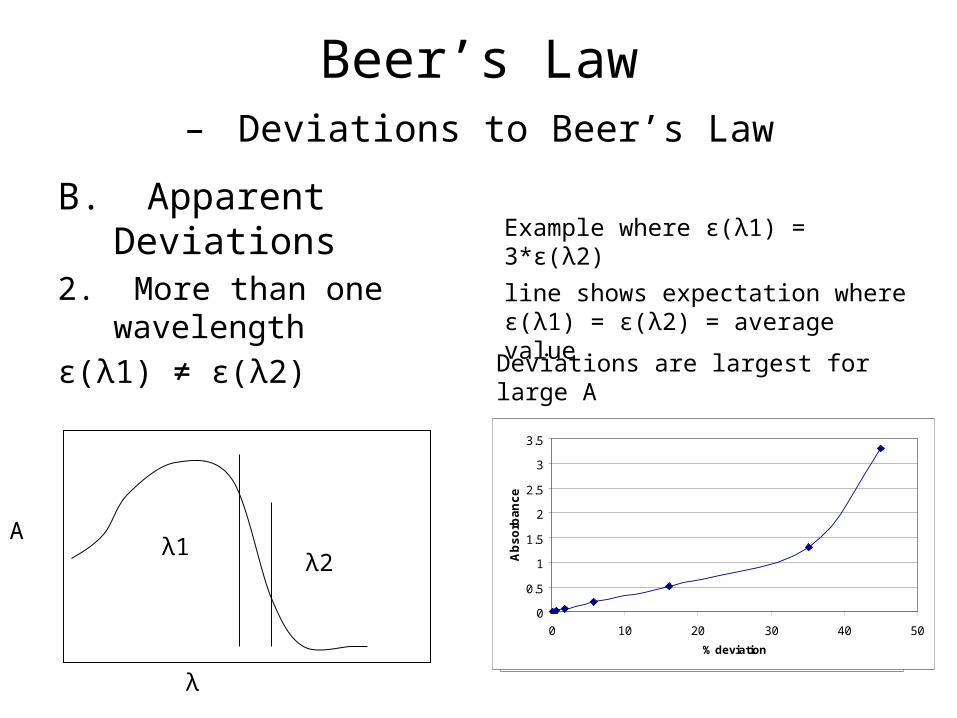
B. Apparent Deviations
2. More than one wavelength
ε(λ1) ≠ ε(λ2)
0
0.5
1
1.5
2
2.5
3
3.5
4
0 0.005 0.01 0.015 0.02 0.025 0.03 0.035
Conc.
Ab
sorb
ance
λ1λ2
Example where ε(λ1) = 3*ε(λ2)
line shows expectation where ε(λ1) = ε(λ2) = average value
Deviations are largest for large A
0
0.5
1
1.5
2
2.5
3
3.5
0 10 20 30 40 50
% deviation
Ab
so
rba
nc
e
A
λ

Beer’s Law– Deviations to Beer’s Law
More than one wavelength - continuedWhen is it a problem?
a) When polychromatic (white) light is usedb) When dε/dλ is large (best to use absoprtion maxima) and Δλ is not small (Δλ is the range of wavelengths passed to sample)c) When monochromator emits stray lightd) More serious at high A values

Luminescence SpectroscopyAdvantages to Luminescence
Spectroscopy1. Greater Selectivity (most compounds do not efficiently fluoresce)2. Greater Sensitivity – does not depend on difference in signal; with sensitive light detectors, low level light detection possibleAbsorption of light
95% transparent
(equiv. to A = 0.022)Weak light in black background
Emission of light

Chapter 19 - SpectrometersMain Components:1) Light Source (produces light in right wavelength range)2) Wavelength Descriminator (allows determination of signal
at each wavelength)3) Sample (in sample container)4) Light Transducer (converts light intensity to electrical
signal)5 )Electronics (Data processing, storage and display)Example: Simple Absorption Spectrophotometer
Light Source
(e.g tungsten lamp)
Monochromator
Sample
detector (e.g. photodiode)
Electronics
single l out

SpectrometersSome times you have to think creatively to get all the
components.Example NMR spectrometer:Light source = antenna (for exciting sample, and sample re-
emission)Light transducer = antenna Electronics = A/D board (plus many other components)Wavelength descriminator =Fourier Transformation
Radio Frequency Signal Generator
Antenna
A/D Board
Fourier Transformed Data

Spectrometers – Fluorescence/Phosphorescence
• Fluorescence Spectrometers– Need two wavelength
descriminators– Emission light usually at
90 deg. from excitation light
– Can pulse light to discriminate against various emissions (based on different decay times for different processes)
– Normally more intense light and more sensitive detector than absorption measurements since these improve sensitivity
lampExcitationmonochromator
sample
Emission monochromator
Light detector

Absorption Spectrometers
A. Sensitivity based on differentiation of light levels (P vs P0) so stable (or compensated) sources and detectors are more important
B. Dual beam instruments account for drifts in light intensity or detector response
Light Source
(tungsten lamp)
Monochromator
Sample
Electronics
chopper or beam splitter
Reference
detector

Spectrometers – Specific ComponentsLight Sources
A. Continuous Sources - General1) Provide light over a distribution of
wavelengths2) Needed for multi-purpose instruments that
read over range of wavelengths3) Sources are usually limited to wavelength
ranges (e.g. D2 source for UV)

Spectrometers – Light Sources
A. Continuous Sources – Specific1) For visible through infrared,
sources are “blackbody” emitters
2) For UV light, discharge lamps (e.g. deuterium) are more common (production of light through charged particle collision excitation)
3) Similar light sources (based on charged particle collisions) are used for X-rays and for higher intensity lamps used for fluorescence
4) For radio waves, light generated by putting AC signal on bare wire (antenna). Wide range of AC frequencies will produce a broad band of wavelengths.
UV Vis IR
high T
low T (max shifted to larger l)in
tens
ity