chemical applications of fourier-transform raman spectroscopy
TRANSCRIPT

University of Southampton
Chemical Applications of Fourier-transform Raman spectroscopy
A thesis submitted by
Christopher David Dyer, B.Sc. CChem. MRSC
for the degree
Doctor of Philosophy
Department of Chemistry
February 1995
UNIVERSITY OF SOUTHAMPTON
ABSTRACT
F/K%JLTY(M;SCn3NCE
CHEMISTRY
Doctor of Philosophy
Chemical Applications of Fourier transform Raman Spectroscopy
by Christopher David Dyer
Details are presented of five studies in the application of Fourier transform (FT) Raman spectroscopy. The studies encompass a diverse range of chemical species, and indicate the wide applicability of FT-Raman methods.
A series of coloured sulphur-containing organic compounds based on the thione ring structure were analysed. Characteristic group frequencies were determined, enabling the thione ring structure to be easily identified. Spectral changes on reaction of thiones or related oxones to yield tetrathiafulvalenes (TTFs) were discovered, whilst the differentiation of thione and oxone species was shown to be straightforward.
The novel allenylketenimine-tetracyanoethylene (TCNE) system was investigated, in order to provide the first vibrational assignment of these compounds. Characteristic frequencies of the underlying cyclic structure were determined. The extremely weak IR absorption of the nitrile (-CN) group was noted, contrasted against the reliable Raman signature, and discussed.
The first study of the hydrated y-alumina surface was undertaken in a combined FT-IR/FT-Raman study, that unambiguously determined the surface to comprise the bayeritic polymorph of aluminium hydroxide. The temperature and pH-dependency of the formation of the hydroxide were studied. The role of phenylphosphate in the suppression of hydration was discussed. Near-IR excitation was shown to produce anomalous luminescence from a series of
calcium silicate cement minerals. Investigations using near-IR diffuse reflectance suggested a connection with the presence of metal ions impurities (especially manganese) and calcium hydroxide. Calcium oxide and hydroxide were shown to display similar anomalous behaviour. The application of conventional Raman spectrr^scopy in this area was appraised as an alternative, and shown to be successful.
A method for obtaining rotational and vibrational spectra of gases on a commercial FT-Raman spectrometer using multiple-reflection cells was designed, developed, and appraised. The technique was then applied to a previously-intractable system (NO2/N2O4) to record the first vapour-phase spectrum of the dimer. In addition, the data suggests that the NO minority species scattering may be strongly-enhanced, and that NO? may be unenhanced at this wavelength.
Contents
Abstract i
Contents ii
Acknowledgements vi
Chapter 1; i
The application of Raman scattering techniques in chemistry 1
1.1 Overview I
1.2 Theoretical background of the Raman efkct 1
1.2.1 Molecular structure 2
1.2.2 Raman scattering 5
1.2.3 Anisotropic polarisability 7
1.2.4 Mechanism of interaction 9
1.2.5 Extension to multi-atom problems - normal modes 12
1.2.6 Breakdown of the simple theory 13
1.2.7 Selection rules 15
1.2.8 Details in the quantum mechanical picture 16
1.2.9 Polarisation measurements 17
1.2.10 Applications of group theory to Raman spectroscopy 19
1.2.11 Intensity of the Raman effect 23
1.3 Implementation of the Raman experiment 24
1.3.1 Classical techniques 25
1.3.2 Advantages of Raman scattering over mid-IR absorption 26
1.3.3 The rise of IR interferometry 27
1.3.4 Problems with visible excitation in analytical Raman studies 27
1.3.5 The inception of the FT-Raman technique 28
1.4 Instrumentation 28
1.4.1 Basic layout of a near-IR Michelson-type interferometer 29
1.4.2 Analysing the data - the Fourier transform 32
1 4.3 Resolution in FT spectroscopy 33
1.4.4 Sampled data 34
1.4.5 J-stop effects 35
1.4.6 Advantages of FT spectrometry 37
1.4.7 FT-Raman instrumentation at Southampton 40
1.4.8 Sampling problems in FT-Raman spectroscopy 42
1.4.9 Optical constants and correction functions 43
1.4.10 Polarisation measurements 44
1.5 References: 46
Chapter 2: 48
l,3-dithiole-2-thione and related compounds 48
2.1 Introduction 48
2.2 Experimental 49
2.3 Results & Discussion 49
2.3.1.1 The Raman spectrum of l,3-dithiole-2-thione 51
2.3.1.2 Vibrational assignment of l,3-dithiole-2-thione 53
2.3.2 Thiones B-H 59
2.3.3 Comparison of thione B, oxone I, and TTF J 67
2.3.4 Further comparisons - thiones 69
2.3.5 Further comparisons - oxones 76
2.3.6 Alternative comparisons of thiones and oxones 78
2.4 Postscript 80
2.5 References 80
Chapter 3: 82
Allenylketenimine-Tetracyanoethylene Diels-Alder reaction products 82
3.1 Introduction 82
3.2 Experimental 85
3.3 Results ; 85
3.4 Discussion 92
3.4.1 The C=C stretching region 95
3.4.2 The nitrile (CN-) stretch 95
3.5 References 99
Chapter 4: 101
Hydration of the y-Alumina surface 101
4.1 Introduction 101
4.2 Experimental 102
4.3 Results and discussion 103
4.3.1 Hydrating y-alumina 103
4.3.2 Initial hydration studies 105
4.3.3 Changes on hydration 107
4.3.4 Elevated temperature hydration 111
4.3.5 Boehmite 113
4.3.6 Dehydroxylation 113
4.3.7 Phenylphosphate adsorption 116
4.4 References 120
Chapter 5: 122
ni
Raman spectroscopy of cement minerals and related species 122
5.1 Introduction 122
5.2 Previous work 122
5.3 Comments on nomenclature, synthesis and sample identification 123
5.4.1 Analytical methods 124
5.4.2 Synthetic details 125
5.5 Results 127
5.5.1 Euroc samples 127
5.5.2 Synthetic calcium silicates 133
5.5.3 Blue Circle samples 134
5.5.4 Comparisons against simple systems 141
5.5.4.1 Si02, AI2O3, and Fe203 141
5.5.4.2 CaSi03 142
5.5.4.3 CaOandCa(OH)2 143
5.5.5 Near-IR absorption studies 147
5.5.6 Low-temperature studies on line widths 150
5.6 Discussion 152
5.6.1 Alternative Raman techniques 154
5.7 Postscript 157
5.8 References 157
Chapter 6 : 160
Near-IR excited Raman scattering in the gas phase 160
6.1 Overview and historical introduction 160
6.2 Aims and goals 161
6.3 Initial considerations 162
6.4 Previous work 163
6.5 Results 164
6.5.1 Studies using the prototype cells and spectrometer 171
6.5.1.1 Background reduction by spatial filtering 171
6.5.1.2 Methyl bromide spectra 173
6.5.1.3 Chlorine isotopic splitting 175
6.5.1.4 Carbon disulphide - higher order transitions 179
6.5.2 Comparison of cell designs for the prototype Raman
spectrometer 180
6.5.2.1 Rotational Raman spectra 184
6.5.2.2 "Filterless" FT-Raman spectrometry ? 190
6.5.3 The commercial spectrometer 190
6.5.4 Results using the commercial spectrometer 199
IV

6.5.4.1 Westinghouse experiments 199
6.5.4.2 Dinitrogen tetroxide in the gas phase 202
6.6 References 207
Chapter 7: 210
Conclusions 210
7.1 Introduction 210
7.2 l,3-dithiole-2-thione and related compounds 210
7.3 Allenylketenimine-TCNE derivatives 211
7.4 Hydration of the y-alumina surface 212
7.5 Cement minerals and some simple calcium-bearing inorganic
compounds 212
7.6 Near-IR-excited Raman scattering in the gas phase 213
7.7 Further work 214
7.8 Other studies and published work 216
7.9 References 216
Appendix 1: 217
Published work 217

Acknowledgements
I thoroughly enjoyed taking the opportunity given to me by Patrick Hendra to
work in his group for three years. During that period, many people made greatly-
valued contributions to that enjoyment. My heartfelt thanks to them all.
Firstly, Professor Patrick Hendra - for his supervision, support, many good
evenings in Crawley, and wine seminars.
Professor Willis Forsling, for being a superb host during my exchange to
Sweden, and providing cross-country skiing opportunities on frozen lakes.
Dr Bill Maddams, for his sound input and ever-willing advisory role.
Dr Jeremy Kilburn and Dr Richard Whitby, for allowing collaborations within
their research groups.
Mrs Jill Allen, for secretarial services above and beyond the call of duty.
My current employers, Renishaw PLC, for the time to conclude the thesis
preparation.
The US Office of Naval Research, for funding.
My parents - for even more funding - and quiet, patient support.
Of course, the horde of past and present members of the Hendra group, a
supporting cast of undergraduates, postgraduates, Graham from t' PCL, assorted
house-mates (special thanks to Andy Wright & Dave Pegs), Southampton publicans
(especially John and Mo at the New Inn), my bank manager Sarah, Dr Ross & diverse
night-clubs, assorted cricket teams, and the (semi-)human members of the Phys Chem
group. Oh - and Zog. Because he's never been mentioned in a thesis before. Nor will
be ever again. What larks, eh ?
Lastly, Sarah. Thanks for the support; still want to marry me ?
VI
Chapter 1:
The application of Raman scattering techniques in chemistry.
1.1 Overview
For nearly seventy years chemists have used Raman spectroscopy in both
fundamental research and analytical roles. The huge literature on the technique bears
testament to its applicability, and the number of researchers who find it an invaluable
tool.
The work presented in this thesis represents a critical appraisal of one such
new technique - Fourier transform (FT-) Raman spectroscopy - for applications of
chemical interest.
In order to introduce the concepts of Raman scattering and vibrational
spectroscopy, a brief and by no means exhaustive review of relevant theory is
presented - followed by a description of the experimental procedures and
instrumentation employed in the FT-Raman technique.
1.2 Theoretical background of the Raman effect.
When intense monochromatic light is shone into a vessel containing a liquid or
gas, secondary radiation may be detected emanating from the vessel to shorter and
longer wavelength of the exciting light, in addition to a strong component at the same
wavelength. Predicted in the early 1920s, although first observed and reported
experimentally by Sir C.V. Raman 1, this secondary radiation comes about by the
inelastic scattering of the incident light by the irradiated molecules. The simple
demonstration that scattered light is detected at right-angles to the direction of
propagation of the exciting beam shows that the scattered beam is not simply due to
reflection within the vessel.
Molecules can be considered to consist of relatively heavy positively-charged
nuclei interacting with a number of negatively-charged lighter electrons. The
distribution of the electrons depends on the configuration of the nuclei - as the
configuration determines the inter-electron, inter-nuclear, and electron-nuclear
interactions.
The mechanism by which the light is scattered involves the polarisation of the
electron distribution by the incident light. A molecule in field-free space irradiated by
a beam of visible light experiences an electric field which is time-varying but not
significantly varying over the length of the molecule. The electric field of the light
displaces the electrons more readily than the more massive nuclei, resulting in a
periodic distortion of the electron cloud*. This periodic movement of electrical charge
constitutes an induced dipole at the frequency of the incident light. The magnitude of
the induced dipole** moment (Cm) can be related to the polarisability (J'^C^m^) and
the electric field strength (V/m):
H = a . E
According to classical mechanics, dipoles are the source of electromagnetic
radiation. The dipole induced by the incident light radiates at the same frequency of
the incident light, and is radiated into a full 4K steradian solid angle. The endothermic
transferral of energy to the molecule on interaction by polarisation of the electron
cloud results in the tendency of the system to re-equilibrate by re-radiation as quickly
as possible. This scattering at the same frequency of the incident light is called
Rayleigh scattering, after its discoverer. It is of course elastic scattering.
Scattering at shifted wavelengths - both shorter and longer - occurs because
the polarisability function may be modulated by the motion of the nuclei, as the exact
and instantaneous molecular configuration determines the polarisability.
1.2.1 Molecular structure
If the predominantly-electrostatic forces in operation between the nuclei and
the electrons result in a nuclear configuration where the species is stable - such that
small deviations away from this configuration result in a force being generated to
restore it - then the system can be thought of as having formed a stable chemical
bond.
It can be seen immediately that changing the chemistry - simply "changing the
atoms" - alters the balance of the net forces acting on the nuclei, and therefore also
the polarisability, a concept related to the "deformability" of the electron distribution.
* The magnetic field of the light has a much weaker interaction with the charge distribution, and
may be ignored.
** This treatment deliberately ignores higher-order terms in the expansion, as these are only
important where extremely high electric fields are generated - as in pulsed laser applications.
2

The potential energy function which governs the bond may be derived from
basic principles:
. Firstly, the function must reflect the fact that molecules dissociate if enough
energy is supplied
• Secondly, that realistic atomic displacements will not result in the nuclei
coalescing
• Thirdly, that if the nuclei are separated by large distances then the conditions for
stability will not be met
• Fourthly, a restoring force must operate for deviations about the stable,
equilibrium, nuclear configuration.
A suitable function to describe the potential energy for the stable bonding case
as described above is given below. This is the well-known Morse curve:
40000
35000 -
30000
25000
20000
^ 15000 -
10000
5000
Intel -Nuc lear I3islaiicc (Angstroms)
Figure 1.1 The Morse potential (dotted curve is a quadratic potential)
The Morse curve can be described as:
V(x) = De(l-Sax)2
where a is a constant (m-^) for a given potential well. The diSerence in
potential energy between the equilibrium configuration and infinite atomic separation
is called the depth of the potential well (Dg) and is identified with the energy required
to break the bond. It is a measure of the strength - not the stiffness - of the bond.
The existence of a restoring force leads (f/recf/v to the existence of molecular
vibrations. The Morse function can be described close to the equilibrium position as a
quadratic function of the bond extension (defined as x = bond length-equilibrium bond
length). In this approximation - the simple harmonic oscillator (SHO) approximation -
the bond force constant kyiy is associated with the Young's modulus of a spring (the
bond), whilst the nuclei are associated with point masses. The restoring force is given
by:
F = -kviy.x
A solution to the problem is found by rewriting this as:
d^x/dt^ = -(kvib/j.iab).x
Using X = A.cos(®t) as a trial solution, we see:
d^x/dt^ = -A.(i)^.cos(G)t) = -m^.x
So that by inspection
X = A.cos((ot)
with
m = = V(kvib/^ab)
This shows that for a classical model the nuclei in a stable bond undergo
periodic motion about their equilibrium position in response to the net force acting on
them.
Note that the reduced mass, = (m^. my)/(m^+my) where m^ is the mass of
atom a is used in the derivation above. In general a molecule undergoes a complex
combination of vibration, rotation, and translation which to reasonable approximation
can be considered independent. Vibrational motion concerns the relative motion of
the nuclei about the molecular centre of mass, not changes of orientation, or in
translation through space; given these conditions, mechanics suggests the reduced
mass as the correct mass parameter.
Note also that the bond stretching force constant (ky^y) is a function only of
the curvature of the potential well - and not of the depth of the potential well, or of
the nuclear mass. Although the above derivation only applies strictly to the (non-
realistic) SHO potential, its approximates the Morse curve and similar potential
functions quite well at small bond extension; the deviation of the Morse curve at
higher values identifies it as an anharmonic oscillator (AO) potential function.
1.2.2 Raman scattering
The appearance of Stokes-shifted scattering to longer wavelength and anti-
Stokes scattering to shorter wavelength constitutes Raman-scattered light (also
known as inelastic scattering). As indicated above, it arises due to the periodic
modulation of the polarisability consequent upon molecular motion, and can be
derived straightforwardly.
Firstly the polarisability as a function of the bond extension is expressed as a
Taylor series about the equilibrium configuration. Secondly, all term higher than the
second are disregarded, which interprets polarisability as a linear function of bond
extension for small extensions about the equilibrium position. Thirdly, the
vibrationally-unmodulated polarisability* ag is associated with the first term of the
expansion, whilst the second term 5a/5x is associated with the change in polarisability
due to vibration.
Let Vy be the vibrational frequency of the bond, whilst v[ is the frequency of
the incident light.
Then:
(- induced = [ciQ + 6a/6x.cos(27rVvt)][Ecos(27ivit)]
l- induced ^ ctQ Ecos(27rvit) + 8a/6x.cos(27tVvt)Ecos(27[Vit)
Using the relationship cos(A+B) + cos(A-B) = 2cosAcosB,
* Notice that this is not static polarisability - that term refers to polarisability under static electric
fields. Note that polarisability is properly a function of incident frequency, as well as field strength;
to good approximation, this fimctional dependence is weak when ^ i n c i d e n t f r o m strong
resonance in the system.
5

induced = ao.Ecos(27:vit) + 6a/6x.E/2.[cos27t(vi+Vv)t] + 6a/6x.E/2[cos27r(vi-Vv)t]
Therefore, Minduced scatters light Vg at v; with sidebands at (vi-vy) and (vi+v^y
This expression also shows that Vy may be obtained by measuring Vg and
subtracting vj. Note the symmetric disposition of the sidebands with respect to vj.
The above derivation shows the same features even when a small change is
made to the notation. Rather than writing the polarisability as a function of bond
displacement, it is possible to describe the polarisability as a function of progress
through the vibration, q. This has advantages when considering complex vibrational
motions, where a simple extension of a single bond is not the only contortion that
needs to be described; q varies between ±71.
Modulation of the polarisability by molecular vibration is one method by
which Raman scattering may occur. As discussed briefly in chapter 6, rotation about
the centre of gravity may also modulate the polarisability and give rise to Raman
scattering.
Using the classical theory of light scattering, it is possible to relate the
intensity of light radiated by a dipole to the frequency of the dipole oscillation. This is
usually given as the intensity ratio of scattered light per unit solid angle to incident
light, and is proportional to the fourth power of the scattered frequency. This implies
anti-Stokes scattering should be stronger than Stokes scattering, by the ratio:
^anti-Stokes ^ Stokes ~ [(®i ®v) ^ (®i " ®v)]^
However, the shifted-wavelength scattering may be many orders of magnitude
weaker in intensity than the Rayleigh scattering; the ratio depends on the magnitude
of the modulation term 5a/5x relative to the static term olq in this model. Obviously,
^o(/6x < ag; however, 6o(/6x « ag in many cases.
Even though the shifted wavelengths borrow their titles from fluorescence
spectroscopy, the spectra are not due a luminescence process. The absorption of light,
followed by the possible re-arrangement of the electronic and nuclear configurations,
with subsequent re-emission of radiation, does not describe the Raman e ffect.
Several factors allow scattering to be separated from spontaneous emission -
several are given below:
• Firstly, measurements of the timescale of fluorescence show that it is slow in
comparison with Raman scattering, which has a timescale typically around
seconds.
• Secondly, if the wavelength of the exciting radiation is varied, the Raman
scattering also varies in wavelength - such that the scattered livht mawtains its
frequency (or inverse wavelenph) shift from the incident lifht: fluorescence is
fixed in absohite \mvelen2th.
• Thirdly, the intensity of fluorescence emission is usually several orders of
magnitude stronger than Raman scattering.
• Fourthly, Stokes and anti-Stokes Raman spectra in principle contain the same
data; anti-Stokes fluorescence spectra arise from transitions from an electronic
excited state with a different set of vibrational parameters, such that Stokes and
anti-Stokes shifts are often different.
1.2.3 Anisotropic polarisabilitv
The net binding force acting on the electron cloud differs at different points in
the molecule, reflecting the observed directional nature of chemical bonding. This
results in anisotropic polarisability, as the electron distribution is easier to polarise in
certain sections of a molecule where the net electron binding force is weaker than
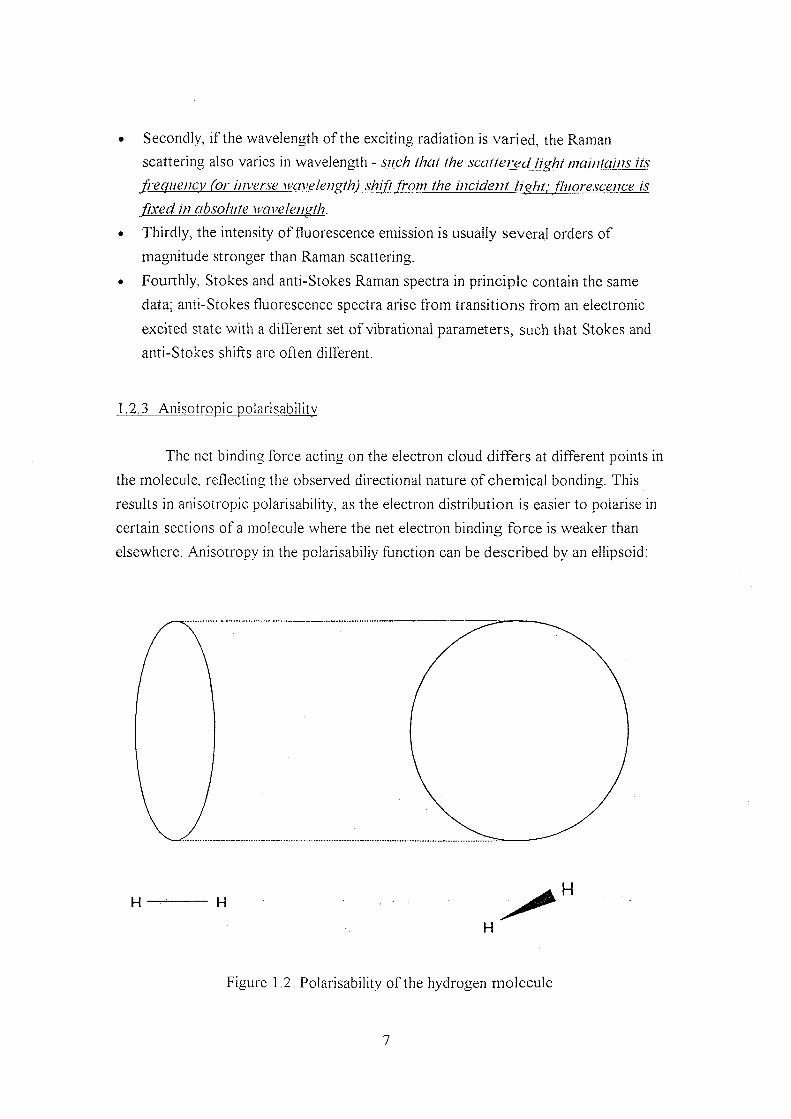
elsewhere. Anisotropy in the polarisabiliy function can be described by an ellipsoid:
H H
H
H
Figure 1.2 Polarisability of the hydrogen molecule
The ellipsoid is plotted as surface from the electrical centre of the molecule,
with length in a eiven direction proportional to the inverse square root of the
polarisability in that direction. In the above example, the distance from the centre of
the ellipsoid is shortest along the internuclear axis. Therefore, the polarisability along
the axis between the nuclei in the bonding region is highest - interpreted as meaning
the electron density is highest along the bond, and therefore easiest to deform. This
simple interpretation must be used with caution, however.
This anisotropy is present in nearly all molecules, except those with very high
intrinsic symmetry, brought about by symmetric disposition of identical bonds. In
these molecules - C^^CU, for instance - the ellipsoid takes on higher symmetry, that
of a sphere.
It is also apparent that polarisability is a tensor property - since it is possible
systems to induce a dipole (a vector quantity, having direction and magnitude
defined) that is not collinear with the exciting dipole (again, a vector). The description
of a tensor quantity is quite straightforward in matrix notation:
/ / v COcx (X\y CCxz hx
= (X\y (Xyy O&z X Ey
(Xcx CCzy CCzz E-.
If a single molecule is fixed in space and excited with a polarised
monochromatic beam of light, the exact directional properties of the scattered dipole
radiation depend on elements of the scattering tensor.
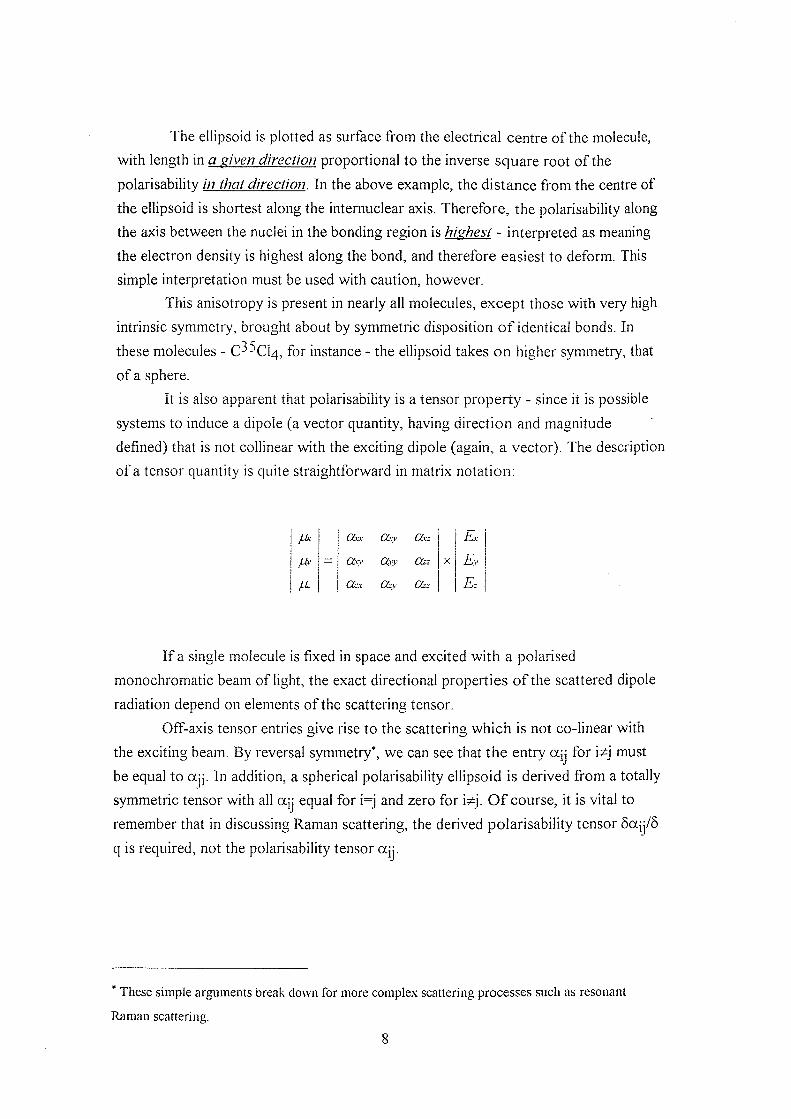
Off-axis tensor entries give rise to the scattering which is not co-linear with
the exciting beam. By reversal symmetry*, we can see that the entry ajj for i j must
be equal to ajj. In addition, a spherical polarisability ellipsoid is derived from a totally
symmetric tensor with all ay equal for i=j and zero for Of course, it is vital to
remember that in discussing Raman scattering, the derived polarisability tensor 5ajj/6
q is required, not the polarisability tensor ajj.
* These simple arguments break down for more complex scattering processes such as resonant
Raman scattering.
( C , ) : c
C for the t e n s o r O O ^
O O y y O
O Ctzz
C fo r the t e n s o r ^ Oxy Oxz"
Ctyx O CLyz
\j^zx CLzy O J
Figure 1.3 Examples of 2 different scattering tensors
1.2.4 Mechanism of interaction
The frequency of vibration for a simple diatomic molecule can be estimated to
lie around 600 Terahertz (10^2 Hz). Using the relationship A,v = c, it can be seen that
this frequency corresponds to light of wavelength in the mid-infrared (mid-IR) region.
Therefore one method of exciting molecular vibrations is to bathe the molecule in IR
radiation; at frequencies that correspond to molecular vibrations, strong absorption of
radiation will be noted.
The absorption can be considered to be due to the resonant transfer of energy
from the beam to the molecule. For IR absorption, variation of bond dipole moment
during the vibration is required - (5|.i/5q)gqj^ must be non-zero, where the dipole
moment is evaluated as a Taylor series expansion about the equilibrium position.
A separation of charges constitutes a dipole - characterised by its dipole
moment, the product of charge difference and distance between the centres of
positive and negative charge. Typically, bond dipole moments have magnitude 3x10"^®
Cm -around 1 Debye unit. Heteronuclear diatomic molecules all have a permanent
dipole, as the electronegativity of each atom is different, resulting in non-coincidence
of the centres of positive and negative charge for the molecule. In the simplest
models, the partial charges are assumed to be resident on and to move with the
9
nuclei*. Dipole moments are vectors, so the position and magnitude of the dipole
moment can be expressed as the sum of three orthogonal components; in general, the
dipole moment of a complex molecule can be then treated as the vector sum of all the
individual bond dipole moments.
IR radiation does work on the dipole - the force exerted being proportional to
the charge imbalance and directed in the same direction as the electric field. Hence as
the electric field direction alternates, contraction and expansion of the bond is
induced. Solving the more-complex vibrational equation" with a field-induced driving
term, the transfer of energy to the bond is strongest when the frequency of the bond
and the frequency of the light are closest - in resonance.
Homonuclear diatomics do not exhibit a change in dipole during vibration, so
homonuclear diatomic molecules do not absorb infrared radiation. However, their
vibrational spectrum may still be deduced via the Raman effect.
All molecules have a finite polarisability; this is most easily expressed in units
of when defined as a polarisability volume (a-47ta/so) with magnitude around 1
A3.
Variation of polarisability with bond length is required for Raman scattering;
unless (5a/5q)gqjyi is finite the shifted-frequency scattering is not allowed. Another
way of viewing the interaction is that light deforms the electron cloud on interaction,
which perturbs the electron/nuclei interaction; this results in a mechanism for the
energy of the irradiating light which acts on the electrons to be transferred into
nuclear motion. This sees (6a/5q)gq^ as a coupling function between nuclear and
electronic motions; if (6a/oq)gq^ is zero, there is little coupling, and therefore little
Raman scattering.
The diagram below gives examples of vibrations with zero and finite (6u/6cpg^^
and (6a/6q)eqrn for a simple molecule.
* Certain higher-order terms sometimes need to be inckided to reflect charge redistribution on bond-
stretching.
Damping terms leading to finite lifetimes and line widths can also be included if needed.
10

D P
/ q
/ Ant i symmet r i c
Stretch
D p
r J
q q
S y m m e l r i c
Stretch
_ c
-C
-C—o
- c -
- c -
- c -
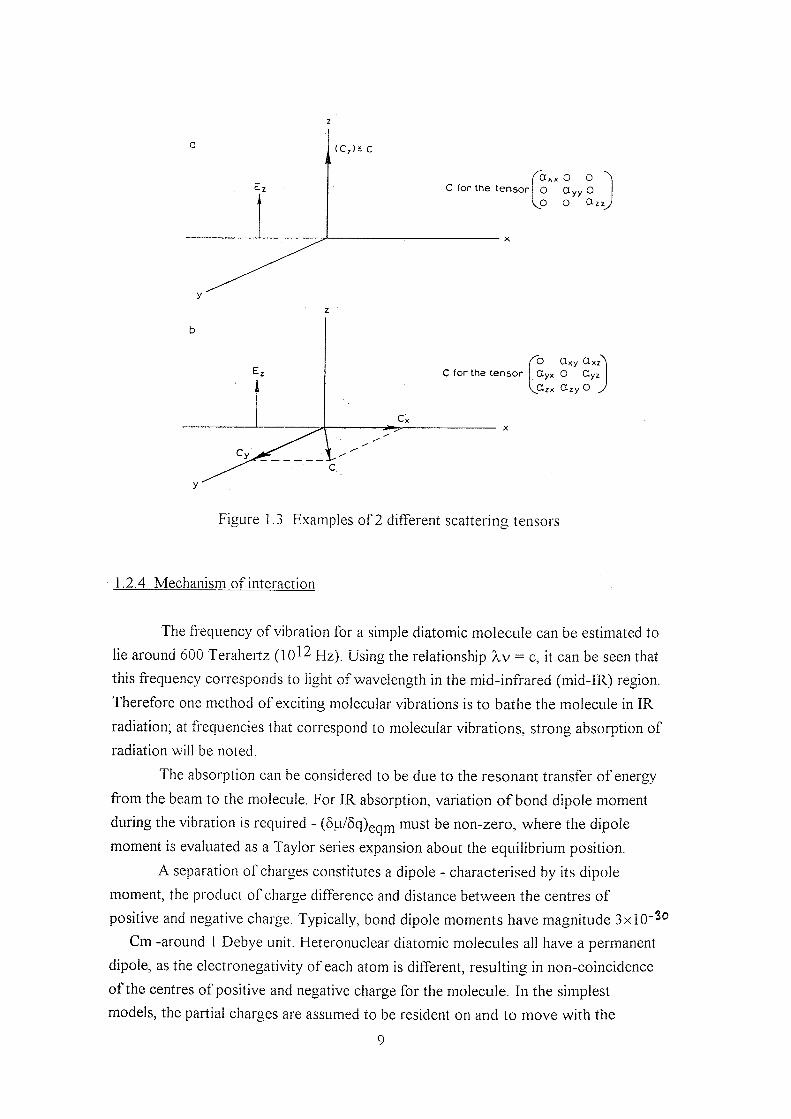
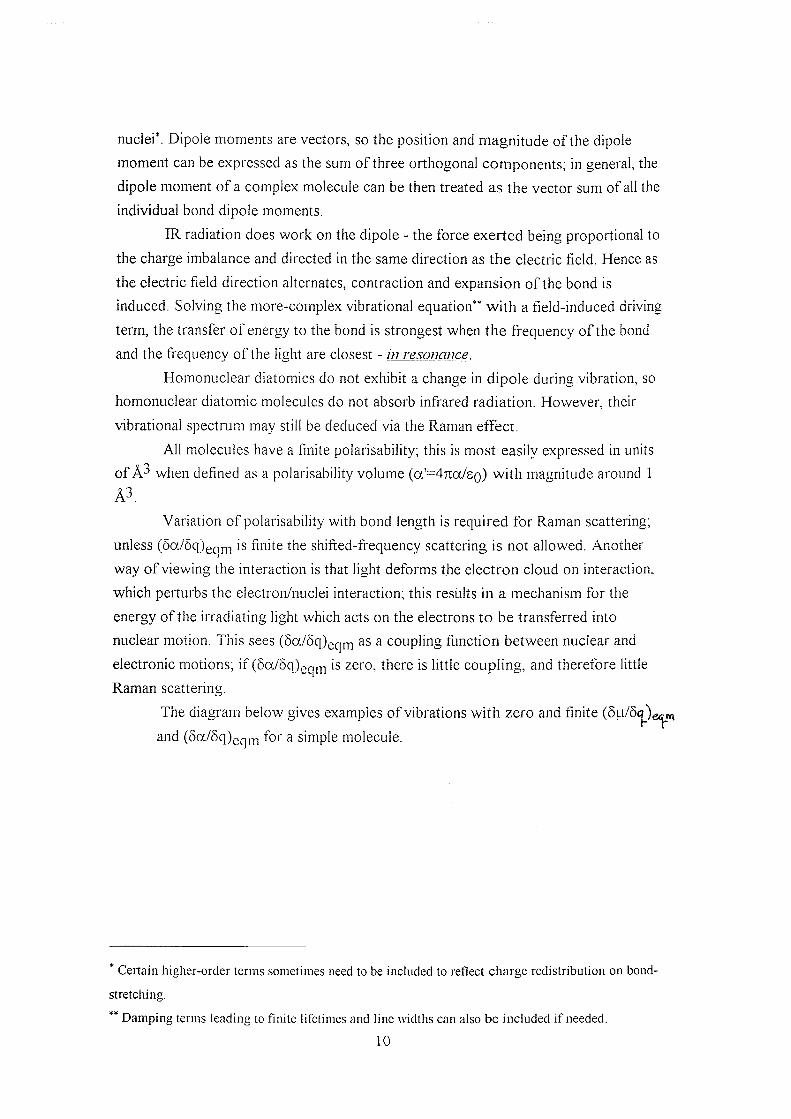
Figure 1.4 Change in dipole moment (D) and polarisability (P) as a function of
progress through vibration (q) for the symmetric and antisymmetric stretching modes
o f C 0 2 .
0 - O-C-0 ac-0
Figure 1.5 Change in polarisability ellipsoid during symmetric stretch of CO?
11
The change in polarisability is reflected by the deformation of the polarisability
ellipsoid during vibration. Of special interest is the case where the ellipsoid is in fact
spherical, since the ellipsoid remains spherical during totally symmetric vibrations.
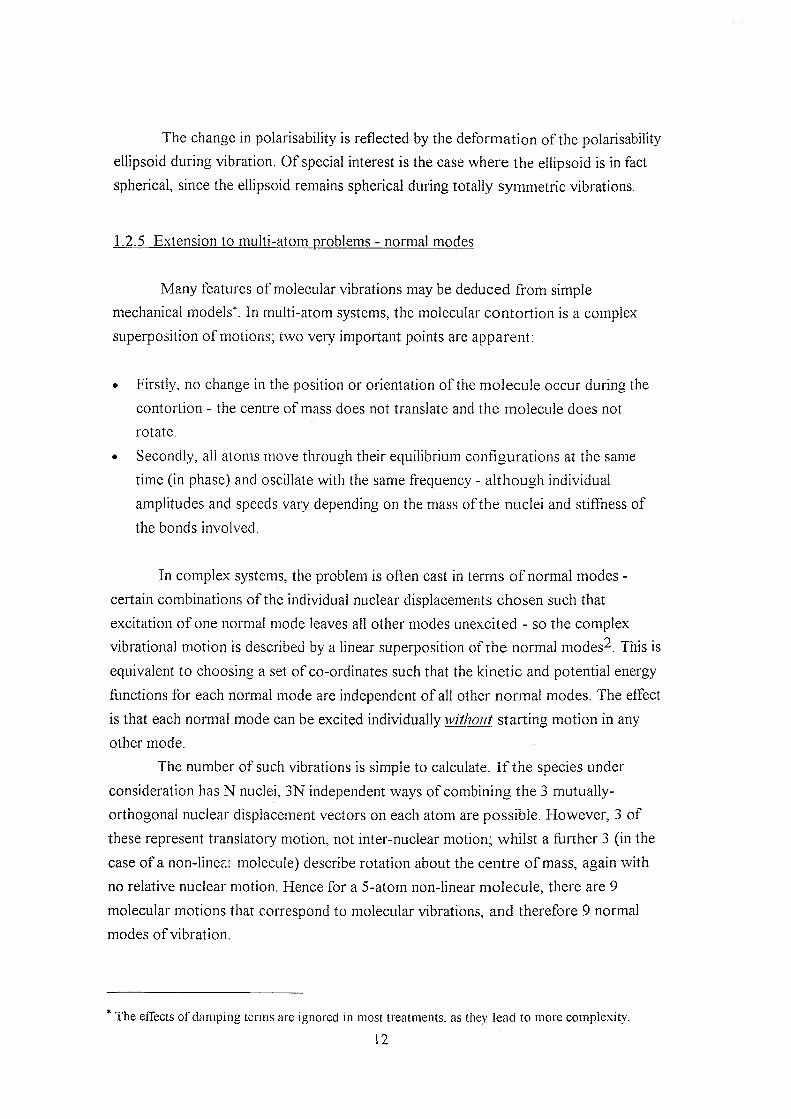
1.2.5 Extension to multi-atom problems - normal modes
Many features of molecular vibrations may be deduced from simple
mechanical models*. In multi-atom systems, the molecular contortion is a complex
superposition of motions; two very important points are apparent:
• Firstly, no change in the position or orientation of the molecule occur during the
contortion - the centre of mass does not translate and the molecule does not
rotate.
• Secondly, all atoms move through their equilibrium configurations at the same
time (in phase) and oscillate with the same frequency - although individual
amplitudes and speeds vary depending on the mass of the nuclei and stiffness of
the bonds involved.
In complex systems, the problem is often cast in terms of normal modes -
certain combinations of the individual nuclear displacements chosen such that
excitation of one normal mode leaves all other modes unexcited - so the complex
vibrational motion is described by a linear superposition of the normal modes^. This is
equivalent to choosing a set of co-ordinates such that the kinetic and potential energy
functions for each normal mode are independent of all other normal modes. The effect
is that each normal mode can be excited individually without starting motion in any
other mode.
The number of such vibrations is simple to calculate. If the species under
consideration has N nuclei, 3N independent ways of combining the 3 mutually-
orthogonal nuclear displacement vectors on each atom are possible. However, 3 of
these represent translatory motion, not inter-nuclear motion; whilst a further 3 (in the
case of a non-linear molecule) describe rotation about the centre of mass, again with
no relative nuclear motion. Hence for a 5-atom non-linear molecule, there are 9
molecular motions that correspond to molecular vibrations, and therefore 9 normal
modes of vibration.
* The effects of damping terms are ignored in most treatments, as they lead to more complexity.
12

The effect of realistic potential energy functions like the Morse potential
described above is that a "decoupled" approach can not be taken, since there are no
descriptions which separate the normal modes. This is due to cubic and quartic terms
in the potential energy function. Simple "ball and stick" models eventually fail because
they cease to accurately describe complex molecules.
1.2.6 Breakdown of the simple theory
Several unpredicted features occur when observing Raman spectra. The most
obvious peculiarity is the intensity of the anti-Stokes scattering relative to the Stokes
scattering. For any exciting wavelength, the simple theory predicts a stronger anti-
Stokes band. For any real system, exactly the opposite is observed - for instance, the
intensity ratio of Stokes-to-anti-Stokes scattering from silicon is about 10:1 with
632.8 nm excitation, whereas simple theory predicted the anti-Stokes band to be
about 30% more intense than the Stokes.
Classical theories of electroniagnetism and mechanics which serve to describe
(phenomenologically) the basic interactions break down at the molecular level. The
modern mechanics of quantum theory is required to describe these events*.
For systems such as the SHO potential, exact analytical solutions to the
equations of motion exist^. The imposition of quantum mechanical rules result in the
total energy being quantised - that is, the sum of kinetic and potential energies can
only have specified discrete values. These values are given by:
ESHO = hvyib(v+!6)
The allowed states are equally spaced, whilst the quantum number (v)
describes which allowed energy state is being discussed. The appearance of zero-
point energy ('/ShVyiy) reflects the impossibility of localising the vibrational motion
exactly". Note that due to the existence of zero-point energy, the bond dissociation
energy Dg is related to the depth of the potential well Dg by Dg = DQ+(!6hVyiy).
For the Mcrse potential analytical solutions also e x i s t w i t h the expression
for the energy of the oscillator:
* The justification simply being that it produces more accurate answers more often than classical
mechanics.
** This may be interpreted by application of the Heisenberg Uncertainty Principle, a postulate of
quantum mechanics.
13
^AO = hUvib(v+!6) - huvib%vib(v+!6)2
Xvib is the so-called anharmonicity constant for the vibration, and may be
related to the depth of the potential well (Dg) by Xvib hVy;y/4Dg. The effect is a
lowering of all energy levels with respect to the SHO, and also a reduction in
separation between adjacent levels as v increases. In addition, Dg =
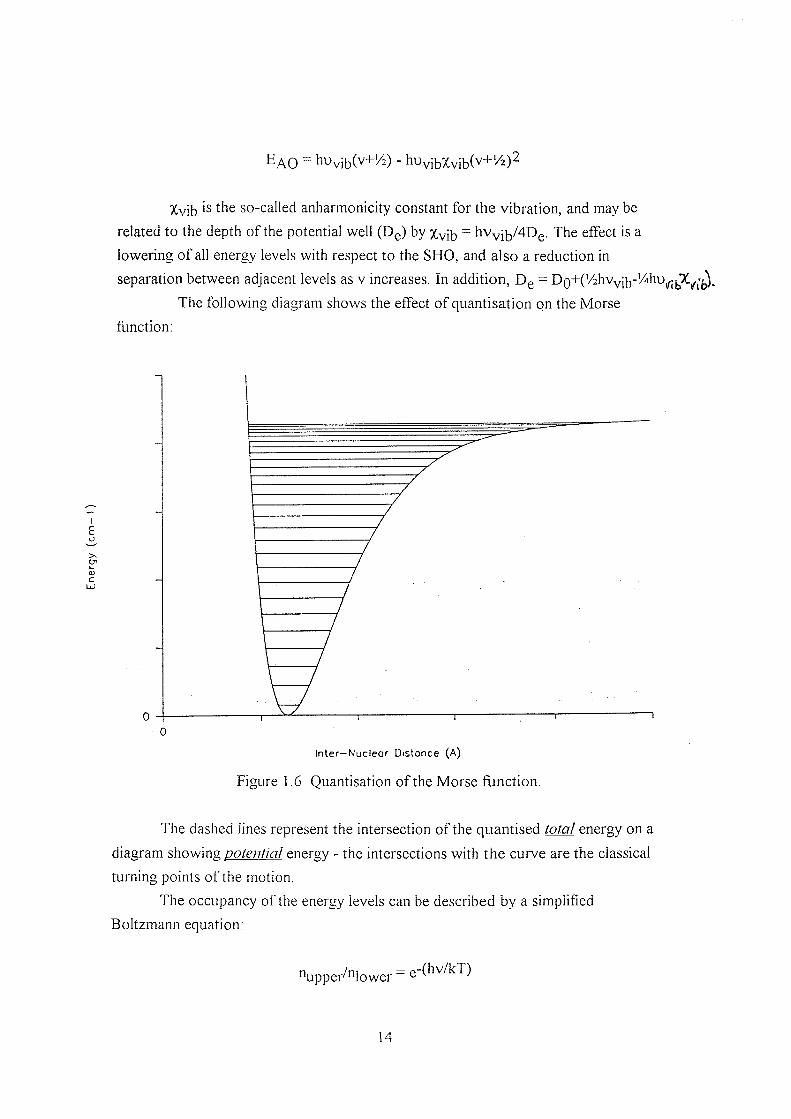
The following diagram shows the effect of quantisation on the Morse
function;
cn
Inter—Nucleor Distance (A)
Figure 1.6 Quantisation of the Morse function.
The dashed lines represent the intersection of the quantised total energy on a
diagram shoWms, potential energy - the intersections with the curve are the classical
turning points of the motion.
The occupancy of the energy levels can be described by a simplified
Boltzmann equation:
"upper/"lower ® (hv/kT)
14
where the fundamental constants h and k take their usual meaning, T is the
absolute temperature measured in Kelvin and v the vibrational frequency in Hertz.
The error in the classical approach was the assumption that an equal population of
Stokes and anti-Stokes vibrations existed. Upon applying this equation for silicon at
room temperature, the ratio nupper/"lower is only around 8 %. Taking account of the
increase in scattering efficiency at shorter wavelength of about 30 %, this implies the
overall intensity ratio of Stokes to anti-Stokes scattering should be about 10:1 - as
observed experimentally*.
1.2.7 Selection rules
The si'oss selection rule for Raman scattering has already been discussed in
some detail - during the molecular motion, the polarisability must be modulated. For
vibrations, (6a/5q)gq^ must be non-zero. In addition, the gross selection rule for IR
absorption has been discussed - (6^/6q)gq^ must be non-zero.
However, the syecific selection rules governing transitions between the
different quantised energy states are regulated by quantum mechanics. The SHO may
change quantum number (v) by Av = ±1. This implies that the change in vibrational
energy is:
- - = huvib
The (v=0) to (v=l) transition abbreviated v%^_o and is called the fundamental
- whereas other allowed transitions with Av = +1 starting from v>0 are called "hot
bands". In this approximation, they appear at the same transition energy, but have
lower intensity as the population of higher states depends on the temperature.
Although somewhat tenuous, the classically-derived reasoning for Av = +1 is
that the dipole moment (IR) and polarisability (Raman scattering) functions go
through one complete cycle per vibration; however, the Morse AO potential can
change by Av = ±n where n is an integer, and this can only be fully explained by
quantum mechanic:. Manipulating the expression for yields:
- %vib(2v+2)] for Av - +1
* This derivation is not intended to demonstrate the subtleties of temperature measurement with
Raman techniques, as it is too simplistic.
15

Notice that the fundamental does not occur at the same transition energy as in
the SHO; similarly, hot-bands no longer lie exactly under the fundamental.
Overtone transitions - Av > 1 - occur in the AO case through cubic and higher
terms in the potential function and non-linearity in the dipole moment and
polarisability functions:
^^AO = 2hUvib[l - %vib(4v+6)] for Av = +2
As can be seen, Av = +2 transitions (first overtones) do not have exactly twice
the fundamental transition energy.
1.2.8 Details in the quantum mechanical picture
In the quantum mechanical derivation, the transitions between the energy
states are facilitated by absorption or emission of quantised units of energy. When this
energy is supplied by electromagnetic radiation, the unit is termed the photon. The
energy of the photon is easily related to the frequency of light:
E = hu [Joules]
The wavenumber unit is vroportional to the energy of the photon in the
following way:
E = hc'u [Joules]
where c' is the speed of light in cm/'s and u has wavenumber units (cm"^).
It is therefore acceptable to speak of wavenumbers as i f they described an
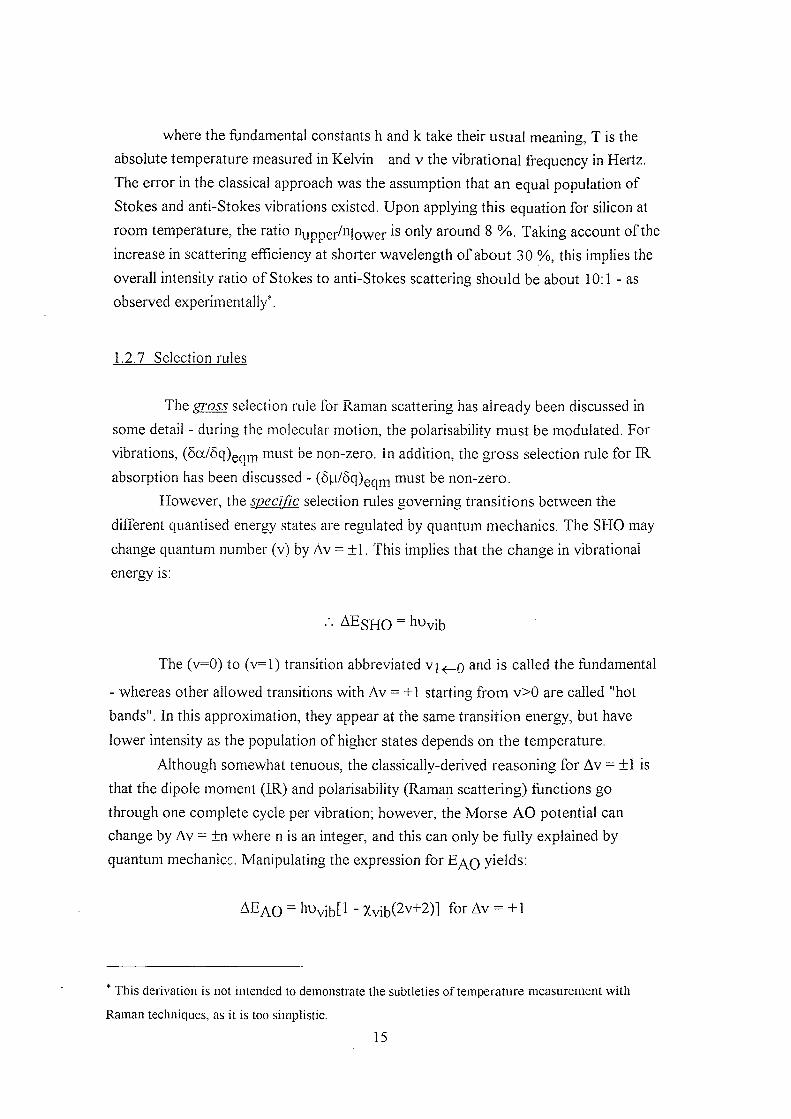
energy scale*. The various interaction processes can be summarised in figure 1.7. This
diagram helps reinforce the hypothesis that the IR experiment is direct absorption of
infrared radiation (2500-25000 nm), whereas Raman scattering is indirect, in that it
involves the scattering cl light. An intermediate state - usually not a true solution to
the steady-state equations for the electronic structure - is produced instantaneously
on interaction with the excitation beam, and a photon destroyed in the process; the
"virtual" state radiates its energy into creation of a Rayleigh-scattered photon or a
Raman-scattered photon plus vibrational (de-)excitation in the latter case. Both the
The wavenumber is belter represented as a unit of momentum.
16
exciting and scattered light usually fall in the ultraviolet (UV) to near-IR regions
(250-2500 run).
•. -
ii
1 Figure 1.7 Mid-lK absorption, anti-^tokes Raman, Rayleigh, and Stokes Raman
scattering (left to right)
1.2.9 Polarisation measurements
If polarised light is shone into a sample of gas and care taken to record the
depolarisalioti ratio, o/ ( defined as the ratio of light intensity transmitted with a
polarisation analyser perpendicular to the excitation electric field vector to the
intensity transmitted with the analyser parallel) a simple fact is evident: p/ is zero - the
Rayleigh scattering is completely polarised. In fact, very careful investigation^ shows
that the depolarisation is actually finite - the smallest values being observed for
molecules such as isotopically-pure CC^ and SF^.
However - when the depolarisation ratios of the vibrational Raman bands are
measured, it is immediately apparent that some of the bands are polarised - giving p]
= 0 - whilst several others are depolarised - that is, they have finite transmission, p]
being about 0.75.
Both these observations can be rationalised in terms of anisotropic
polarisability. During a gas or liquid phase experiment, where molecules are rapidly
17
tumbling and free to change their orientation', the instantaneous polarisability and
derived polarisability of the molecule vary - since the scattering occurs almost
instantaneously, any real experiment detects a superposition of scattering from the
various orientations.
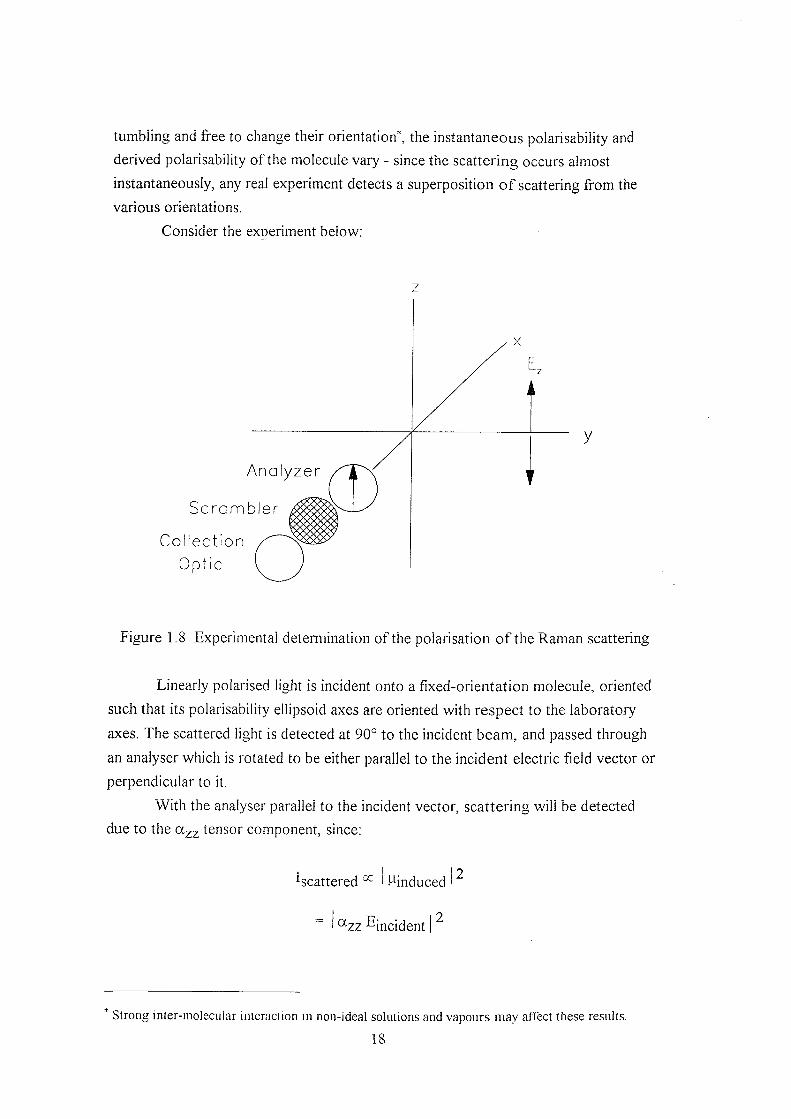
Consider the exoeriment below:
Ana lyzer
S c r a m b l e r
Co l lec t ion
Opt ic
y
Figure 1.8 Experimental determination of the polarisation of the Raman scattering
Linearly polarised light is incident onto a fixed-orientation molecule, oriented
such that its polarisability ellipsoid axes are oriented with respect to the laboratory
axes. The scattered light is detected at 90° to the incident beam, and passed through
an analyser which is rotated to be either parallel to the incident electric field vector or
perpendicular to it.
With the analyser parallel to the incident vector, scattering will be detected
due to the tensor component, since:
^scattered I Wnduced i ^
~ I O-zz incident I ^
Strong inter-moIecular interaction in non-ideal solutions and vapours may affect these results.
18
oc I ^zz ^ ^incident
When the polariser is rotated to be perpendicular, scattering due to will
be detected. The depolarisation ratio pi gives the ratio Iperpendicular^Iparallel
If the molecule rotates freely, the molecule-fixed properties and a^x must
be averaged. The result for a tensor (unlike a vector) is that there are two invariants
under free rotation, related to the trace and anisotropic components of the molecular
tensor:
— l/9(axx GCyy ^zz)^
(3^ — 1 / 2 - cXyy)2 + (of-xx - ctzz)^ (^zz " ^xx)^ (• XY "'~^YZ " ®^ZX )]
The depolarisation ratio may be written to take advantage of these invariants^,
the result being:
PI = 332 / (45a2 + 4p2)
PI clearly depends on which components of the polarisability (for Rayleigh
scattering) and derived polarisability (for Raman scattering) tensors are involved.
Since Rayleigh scattering is very highly polarised, the term must approach
zero. Since the polarisability can not vanish the trace of the tensor can not disappear,
and so this implies that the anisotropic components are zero and that the trace
components are almost equal in magnitude (ay = 0 for i#j, a j j - a j j ~ 0 for all i,j). The
smallest values are noted for molecules with spherical tensors - like C^^CI^. - where
the trace components are indeed equal.
The fact that some Raman bands in this highly-symmetrical molecule are
depolarised indicates that the Raman effect allows anisotropic terms in the derived
polarisability tensor; in CCI4 certain bands have a pj value of 0.75. The value p) = 3/4
can only be derived if all trace terms are exactly equal - they cancel out of the
expression for (3^
1.2.10 Applications of group theory to Raman spectroscopy
The prediction of which vibrations will be Raman active through which
derived tensor components can be greatly expedited by the application of group
theory. Since a small part of this thesis involves determining the number, classification
19
and activity of normal vibrations in a simple species, the basics will be briefly
reviewed here.
Group theory allows use of the concept of symmetry in molecular
spectroscopy. Symmetry operations are those combinations of symmetry elements
(rotations about axes, inversions, and the like) which move an object such that its
orientation in space is absolutely indistinguishable from the original position*. The
collection of possible symmetry operations for a molecule define the molecular point
group.
Certain combinations of symmetry operations exist that can not be broken
down into simpler combinations; and when taken together, any complex combination
of symmetry operations can be described by a linear combination of these basis
functions. Each of these basis functions are labelled with a certain symmetry species;
any more complex combination can be labelled with a linear combination of the
symmetry species.
Each of the completely-independent symmetry species may be described by a
representation. A representation in group theory has the meaning that any set of
functions - matrices, for instance - may represent the actions of the symmetry
operations, if the group of functions has the same combination properties (group
table) as the group of symmetry operations. Since the representations describe the
basis symmetry species, they can be called irreducible representations.
If matrices are used, a very convenient way of expressing the irreducible
representation becomes apparent, as the sum of the diagonal elements of the matrix
(the trace) may be either zero or an integer. The sign of the integer is helpful in
labelling the symmetry species; if the irreducible representation is itself a linear
combination of N functions (because no transformation could be applied to all the
matrix representations and still generate an equivalent representation of the group),
then the representation is said to be N-fold degenerate and the irreducible
representation will have character N.
The characters of the irreducible representations are inserted into the
character table of the point group under the generating symmetry operation. The
symmetry species of the irreducible representations is decided by using a set of rules
which briefly mentioned in order of application are;
• Degeneracy - N=1 gives A or B, N=2 gives E, N=3 gives T
Assuming field-free space.
20
• Rotational symmetry - If N=l, rotation about the axis of highest symmetry is
labelled A if the character is +1, and B if the character is -1.
• Inversion - if the group includes the inversion operation, character +1 implies
symmetric with respect to inversion and is labelled g, and -1 if antisymmetric,
labelled u.
The normal vibrational modes of a molecule can be shown to constitute a
represent:^cion of the group. In addition, the nuclear displacement co-ordinates can be
generated from a linear combination of the normal co-ordinates, which can be shown
to have no effect on the outcome of the reduction procedure, since the normal modes
are an orthogonal set.
This is extremely useful; a reducible representation of the molecule can be
formed by considering the nuclear displacement co-ordinates as the basis, and using
standard reduction equations to arrive at the combination of irreducible
representations that describe the normal modes of the molecules.
The example below indicates the principle of the method - in essence, one
probes the reducible representation with the basis functions to determine the number
contained in the reducible representation derived from the nuclear displacement co-
ordinates.
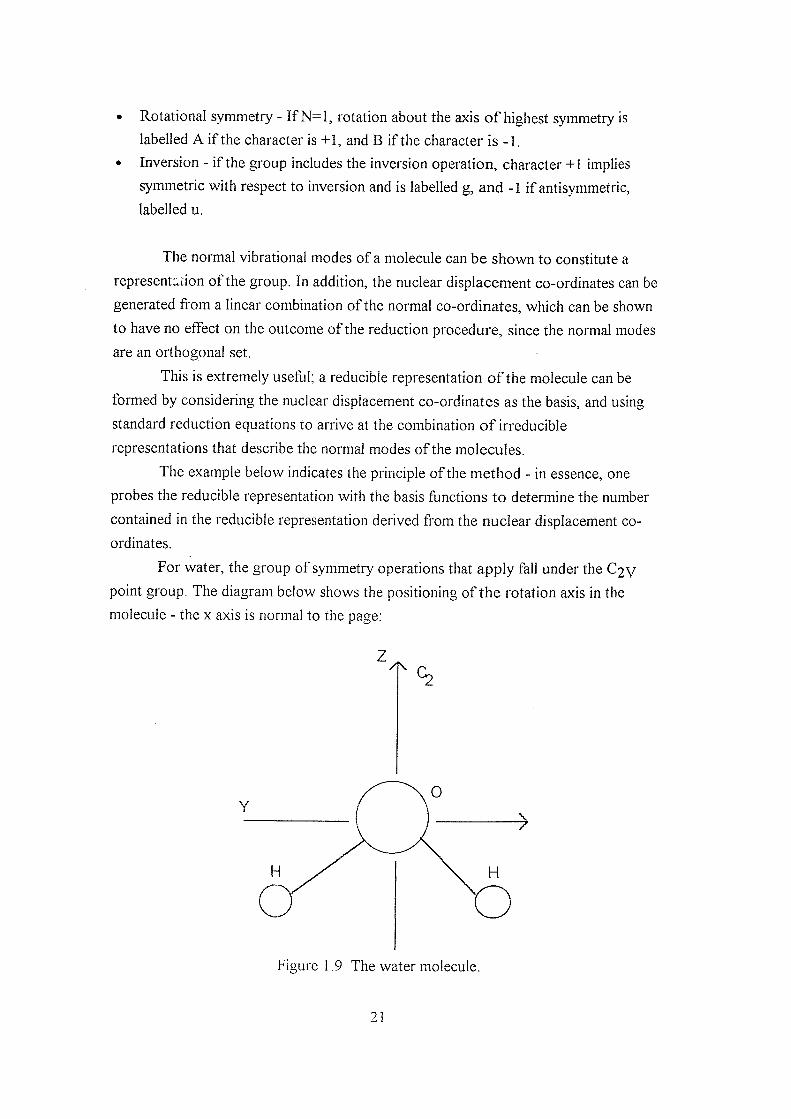
For water, the group of symmetry operations that apply fall under the C i y
point group. The diagram below shows the positioning of the rotation axis in the
molecule - the x axis is normal to the page:
/1\
Figure 1.9 The water molecule.
21
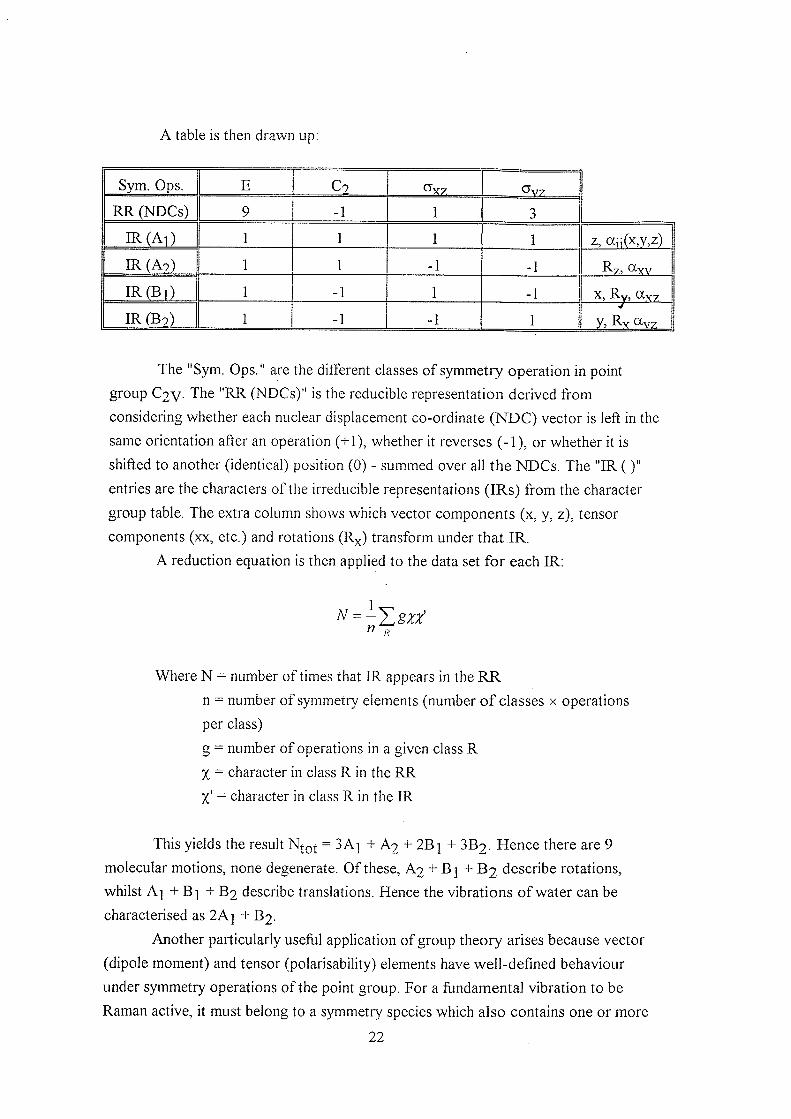
A table is then drawn up:
Sym. Ops. E C9 ^X7. < V7
RR(NDCs) 9 -1 1 3
IR(Ai) 1 1 1 1 z, an(x,y,z)
IR (A?) 1 1 -1 R / , Glw
IR(Bi ) 1 -1 1 -1 X, R v , (Xyy
IR(B?) 1 -1 1 y
y , R y OCyy
The "Sym. Ops." are the different classes of symmetry operation in point
group C i y . The "RR (NDCs)" is the reducible representation derived from
considering whether each nuclear displacement co-ordinate (NDC) vector is left in the
same orientation after an operation (+1), whether it reverses (-1), or whether it is
shifted to another (identical) position (0) - summed over all the NDCs. The "IR ()"
entries are the characters of the irreducible representations (IRs) from the character
group table. The extra column shows which vector components (x, y, z), tensor
components (xx, etc.) and rotations (R^) transform under that IR.
A reduction equation is then applied to the data set for each IR:
// P
Where N = number of times that IR appears in the RR
n = number of symmetry elements (number of classes x operations
per class)
g = number of operations in a given class R
X - character in class R in the RR
%' = character in class R in the IR
This yields the result = 3A] + A? + 2B] + SB?. Hence there are 9
molecular motions, none degenerate. Of these. A? + + Bo describe rotations,
whilst A] + B j + B2 describe translations. Hence the vibrations of water can be
characterised as 2A] + B2.
Another particularly usefijl application of group theory arises because vector
(dipole moment) and tensor (polarisability) elements have well-defined behaviour
under symmetry operations of the point group. For a fundamental vibration to be
Raman active, it must belong to a symmetry species which also contains one or more
22
of the tensor components' irreducible representation. Similarly, the vibration will be
IR-active if it is of the same symmetry species as a component of the vector
representation. For the example above, all modes are IR and Raman active.
This selection rule is complementary to the gross selection rule discussed
earlier. Certain vibrations may be neither IR- nor Raman-active, whilst others may
have dual activity. In molecules with a centre of inversion symmetry, vibrations may
be either IR or Raman active - or neither - but not both.
The final point that needs to be made concerns the use group theory. The
intensity of the Raman effect - discussed below - can only be predicted, insofar as
group theory predicts which modes will NOT be Raman active; it says nothing about
the observed intensity of allowed bands. This is because the magnitude of the change
in polarisability - which governs the overall intensity - is not predicted by group
theory.
1.2.11 Intensitv of the Raman effect
The intensity of Raman scattered light is usually very low. Typically, around
10"9-10"^2 Watts are scattered into a full 4% solid angle with approximately 1 Watt
excitation power. Of this, only a fraction (about 5 % for f/1 collection optics) is
collected - and of this, perhaps 5-10% reaches the detector.
The intensity of the Raman effect may be derived in a number of ways, from
classical through to relativistic quantum mechanical methods. A useful derivation is
the semi-classical derivation of Placzek^, where the problem is treated as quantised
matter in contact with a classical radiation field.
The result of this approach is that the total (or integrated) scattered intensity
into a full 4ti solid angle due to a vibrational transition from state 1 to state u may be
expressed for linearly-polarised excitation with collection at 90° as:
lul = N.fl.lQ.Gul
N represents the number of scattering species illuminated, and fj the fraction
of this number in the lower state, 1, whilst Iq is the incident intensity (W/cm^). The
scattering cross section Oyi (cm^) for a given vibrational normal mode m of
degeneracy n under the above conditions is:
= [2'^.^^/32.(vo-Vm)^.n.(bm)^.(3am^ + 2/3(3^^)] / [I-e{-^E/kT}]
23
where vq = the excitation wavenumber, is the vibrational wavenumber
(positive for Stokes scattering), AE = hv^c, the fundamental constants take their
usual meaning, (b^ ) - = h/fSTt^cvj^), and and (3^2 take on their meaning as the
rotational invariants of the derived polarisability tensor for normal mode m. Notice
the dependence of the intensity on the square of the derived polarisability components
through the rotational invariants.
Also, simply focusing the light to produce a higher intensity spot will not
produce more Raman scattering; the area of the focused beam decreases, so fewer
molecules are irradiated within the field of view of the spectrometer. The sampling
volume of the spectrometer remains the same; more photons are simply incident on a
smaller area of the sample.
Since in general collection is made over a finite solid angle, at a fixed angle
with respect to the excitation direction, with a given polarisation state, on a material
with refractive index different from the surrounding air, corrections must be applied
to even this most basic of formulae. In addition, the effect of absorption of both laser
beam and Raman scattering on scattered intensity is ignored, along with heating
effects on the partition functions.
In general, calculations of this quantity have been very complex, and are
barely reliable; in addition, the predicted dependency on excitation frequency is often
not observed, deviations being due to the occurrence of resonance effects between
the excitation wavelength and electronic transitions of the molecule. The effects of
these resonance processes is to significantly increase the intensity of the scattering,
whilst depolarisation ratios and selection rules are also changed. Nevertheless, the
idea of the cross-section is still discussed with respect to scattering efficiency
calculations and relative intensity measurements.
1.3 Implementation of the Raman experiment
Chemical structure may be inferred by measuring the spectrum of Raman
shifts, and correlating band positions to bond characteristics. Put simply, a given
Raman shift often signifies a certam bond. Better than this, each molecule has a
imiqne spectrum which greatly aids identification.
The Raman shift is usually presented as Av (cm' l) = vjagej- - = Vyjj,
where is experimentally determined. Raman spectra usually
range from between 0-4000 cm"^ shift, zero shift representing the Rayleigh line
position, a negative value indicating anti-Stokes scattering.
24

In essence, the Raman experiment requires that the sample - solid, liquid, or
gas - be irradiated with intense monochromatic light, and that the Raman scattered
wavelengths generated are efficiently collected and separated from the intense
component at the laser wavelength, followed by determination of the wavelengths of
the scattering.
1.3.1 Classical techniques
Many excellent reviews of the classical Raman scattering experiment exist in
the literature^ - only the general points will be raised here*. Rayleigh line rejection
and wavelength-analysis are usually accomplished using devices based on diffraction
gratings to spatially disperse the collected light. Such devices are generally termed
spectrographs (if many wavelengths are simultaneously measured using a multi-
element detector) or spectrometers (if the scattered wavelengths are sequentially
scanned across a single-element detector).
The requirement for strong attenuation of the laser beam leads to the use of
double or triple grating devices - usually double grating spectrometers operated in
additive dispersion, or triple-stage spectrographs comprising a single dispersive
grating after a double-subtractive filter. Single spectrographs may also be used,
providing the attenuation of the laser line with additional filtering is strong enough.
The intrinsic weakness of the Raman effect leads to the requirement for very
sensitive detectors - until recently, either the cooled photomultiplier tube operated in
photon counting mode, or multichannel devices such as the linear photodiode array
with electron multiplier plate - along with powerful excitation sources, typically the
argon ion (Ar"^) gas laser at around 488.0 nm (blue) or 514.5 nm (green) providing
around 1-2 Watts at the sample maximum. Much of the above equipment is complex,
expensive, difficult for the non-expert to align or maintain, and requires several
specialist facilities - cooling water and 3-phase supplies for lasers; for certain
detectors, liquid nitrogen for cooling.
Given the complexity of the experimental apparatus, optical efficiencies are
small - and therefore exposure times long if high resolution or low las^r power
density (to avoid sample damage) are required. This places constraints on stability and
means calibration becomes a significant issue; this presents difficulties for repeatable
analyses. In general, a controlled environment is required. At the very minimum, the
* Prism-based systems with arc-lamp excitation and photographic analysis are excluded from this
summary.
25

experiment requires black-out facilities and a reasonably clean environment; air-
conditioned rooms with anti-vibration tables are not uncommon for complex
experiments.
The chances of such equipment finding major applicability may seem slim, yet
prior to 1940-1950 the Raman effect was very widely used because of the major
advantages over the competing technology for vibrational spectroscopy, dispersive
mid-IR absorption spectroscopy.
1.3.2 Advantages of Raman scattering over mid-IR absorption
Apart from fundamental considerations involving the inherent weakness or
non-activity of certain species' vibrations in the IR, practical considerations include:
• Water is an excellent solvent for Raman analyses, since its Raman spectrum is
very weak. Hence aqueous solution studies are facile, providing the species'
concentrations and scattering cross-sections are suitably large.
• Glass is an excellent vessel for sample cells, as it too exhibits weak scattering; in
contrast, glass is opaque in the IR, with other materials being unsuitable on
grounds of solubility, mechanical strength, toxicity, or cost.
• High temperature studies are facile, since the blackbody radiation emitted by the
sample is far too long in wavelength to appreciably affect the visible Raman
spectrum.
• The sample need not be specially prepared to collect a spectrum - resulting in a
fast analysis, without spectral interference from mulling or solvent features.
• No contact is necessary - this means many diverse shapes and sizes may be
studies, including sampling in low-temperature or high-pressure cells, increasing
the versatility of the experiment.
• Since no contact or preparation are required, many samples can be studied non-
destructively - important for scarce or precious samples.
• In addition, small samples may be studied far more easily with optical
microscopes, which also yield a higher spatial resolution, that with indirect-view
IR microscopes.
• Also, fibre-optics operate far better in the visible - low-loss material is far
cheaper/km in the visible than in the IR, plus materials are non-toxic.
26
1.3.3 The rise of IR interferometrv
In the mid-1960s the development of the interferometric far-IR experiment
meant that the much-improved throughput of the interferometer plus attendant
multiplex detection advantages made it the technique of choice for the far-IR.
Simplicity, reliability, sensitivity, and accuracy attracted other potential users in stellar
and very-high-resolution IR spectroscopy. This meant that large instrument
companies became interested, at first in research markets, then in analysis - eventually
the cost reduced significantly. Especially beneficial to the technique were
developments in electronics (FFT firmware) and the development of low-cost
amplitude-dividing Michelson interferometers and derivatives.
1.3.4 Problems with visible excitation in analytical Raman studies
However, these factors alone would still not have resulted in Raman
spectroscopy falling behind in analytical usage. The Raman experiment using visible
excitation suffers extremely badly from one very major drawback - fluorescence.
It has been estimated" that fluorescence results in 90-95% of all visibly-
excited applications of industrial interest being significantly hampered, whether the
fluorescence is intrinsic to the analyte or due to impurity. The effect of fluorescence is
usually to superimpose a strong and featureless broad continuum over the Raman
scattering, effectively obliterating it.
It is unsurprising that many different methods have been examined, attempting
the reduction or elimination of fluorescence. It has long been assumed - with good
reason - that the number of systems that exhibit fluorescence increase as the
excitation wavelength shortens. This can be viewed as reflecting that more molecular
species have electronic absorption bands in the blue/near-UV than in red/near-IR,
therefore the likelihood of exciting fluorescence should be reduced with red
excitation.
This is undoubtedly true - indeed, early applications of the Raman effect soon
identified red lines from arc lamps as useful in reducing the effect of fluorescence
interference from darkly-coloured materials later applications of red/near-IR laser
lines confirmed this. However, attempts to improve overall performance of long-
wavelength spectrometers were hampered by poor red performance of detectors, low
laser output - but most importantly: the fact that the reduction in fluorescence was
simply not high enough.
27
1.3.5 The inception of the FT-Raman technique
Only with the introduction of the FT-Raman experiment^ ^ and its recent
d e v e l o p m e n t s 12 has the aim of fluorescence reduction been truly successful. FT-
Raman spectroscopy utilises a long-wavelength near-IR laser source AevoMof 7 Li/»
and a near-IR optimised interferometer/detector combination. This approach
combines many of the advantages of interferometry (high throughput, good resolving
power, excellent precision, simplicity, and cost), Raman spectroscopy (ease and
versatility of sampling), and near-IR excitation for fluorescence avoidance.
Although a very recent application, the interferometric Raman experiment had
been considered _ and even tried 4 _ the 1960s. Several problems figured
strongly in the results - these were due to problems rejecting the wavelength
component at the laser frequency, and the issue of how noise affects multiplex
techniques using detectors where the noise is correlated to the signal, an issue which
limits the usefulness of multiplex techniques with shot-noise-limited detectors in many
applications. However, visible hT spectroscopy is used in some very high resolution
atomic emission experiments, and in some stellar observation telescope devices. It
generally requires expensive interferometers with high-performance optics to provide
the necessary tolerances for operation right through to the near-UV (below 400 nm).
In addition, the Nyquist limit must be suitable to cover the wavelength range of
interest. The use of visible FTS in the Raman experiment is not restricted by cost or
by theoretical and experimental difficulties - but by fluorescence^ the same problem as
dispersive spectroscopy. However, several quite successflil visible FT-Raman studies
of gases have been undertaken, and will be commented on in chapter 6.
1.4 Instrumentation
The major advance of FT-Raman spectroscopy is the use of near-IR
excitation on a near-IR interferometer to avoid fluorescence. So successful has this
been, that only 15-20% of all industrial analyses are now estimated to be
unsuccessful^. This situation would not have arisen without reliable interferometers,
lasers, and detectors in the near-IR. To appreciate why near-IR Raman is dependant
on FT-spectrometry, the interferometer needs to be considered in some detail.
28
1.4.1 Basic layout of a near-IR Michelson-tvpe interferometer
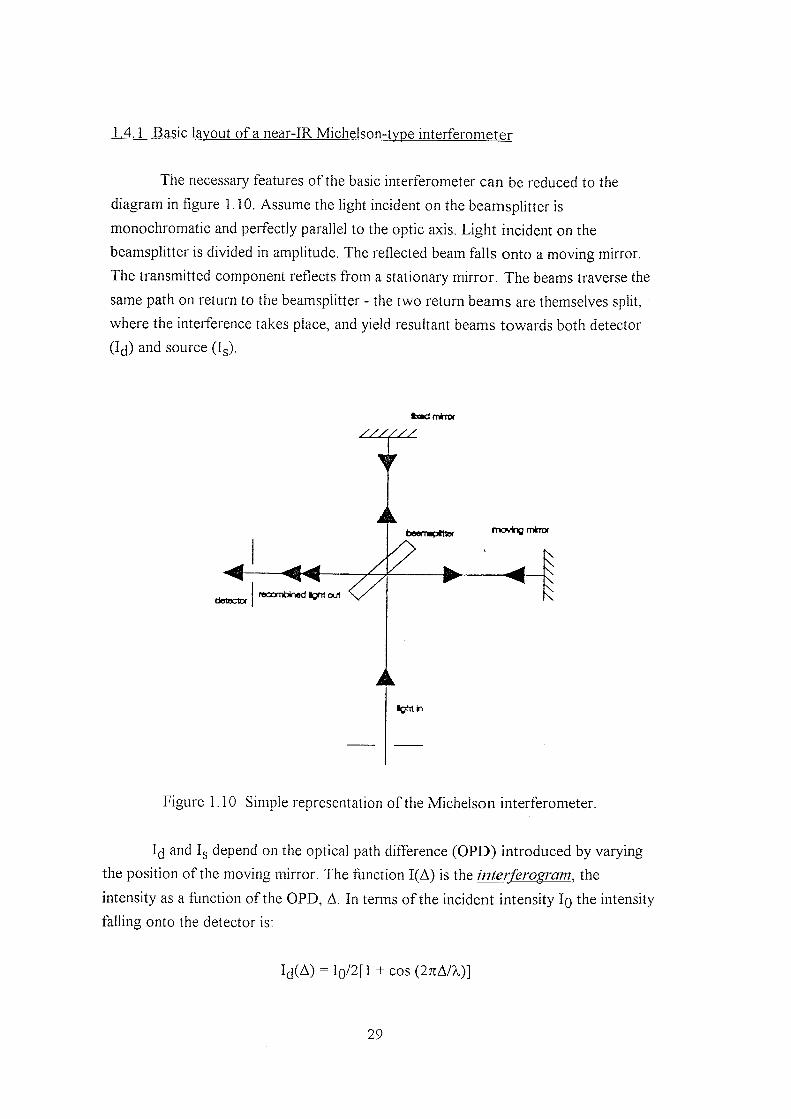
The necessary features of the basic interferometer can be reduced to the
diagram in figure 1.10. Assume the light incident on the beamsplitter is
monochromatic and perfectly parallel to the optic axis. Light incident on the
beamsplitter is divided in amplitude. The reflected beam falls onto a moving mirror.
The transmitted component reflects from a stationary mirror. The beams traverse the
same path on return to the beamsplitter - the two return beams are themselves split,
where the interference takes place, and yield resultant beams towards both detector
( I j ) and source (Ig).
fce»dmltror
T
detector reoombined Igfit out
beemapttter movlno mlrrof
iQtrtin
l igure 1.10 Simple representation of the Michelson interferometer.
and Ig depend on the optical path difference (OPD) introduced by varying
the position of the moving mirror. The function 1(A) is the interferogram, the
intensity as a function of the OPD, A. In terms of the incident intensity Iq the intensity
falling onto the detector is:
I(j(A) = Io/2[] + cos (27tA/X)]
29

Ij varies as a function of the OPD of the incident wavelength. At zero
OPD, the signal is a maximum - going through a further maximum every time the
OPD equals an integer multiple of A,. Note that the OPD is twice the mirror
displacement, and that the actual frequency of modulation depends on the velocity of
the moving mirror*. For radiation around 1 |_im, this equals 1 KHz at scan speed 1
mm/s. Note also that the interferogram is the sum of OPD-invariant ("d.c.") and
cosinusoidally-varying ("a.c.") terms.
The beam returning to the source is also cosinusoidally-modulated at the same
frequency. Conservation of energy demands that the sum of optical power in the
output beams equal the input power in this simple case. Since both the beams
returning to the source experience one more reflection than the beams travelling
towards the detector, this results in the interference term being 180° out-of-phase:
Is(A) = Io/2[] - cos (27rA/X)]
The exact balance of optical power in each "arm" of the interferometer
depends on the beamsplitter characteristics. If the beamsplitter has reflectivity R and
transmissivity T:
Ij = (2RT)lQ[l + cos (27rA/X)]
Is = (R2+T2)lQ[l _ cos (27:A/1)]
Hence the ideal beamsplitter has R=T=0.5, and the maximum signal attainable
towards the detector is In/2. This is difficult to achieve in practice; R and T vary with
wavelength, so that when collimated polychromatic light - continuum or line spectrum
- is incident on the beamsplitter, the efficiency varies with wavelength.
In fact, the interferogram with many wavelengths is a sum of the cosinusoids
of the individual wavelengths. This function is strongest at zero optical path
difference (centreburst), and decays towards the wings - the rate of decay depending
on the number of wavelengths in the sum. Raman interferograms tend to appear more
"periodic" at first glance, since there are few terms in the sum if the background is
negligible. Since the IR experiment relies on absorption, the IR interferogram decays
very quickly because many wavelengths contribute to the signal.
* Different scan speed required for different detector response times.
30
It should be noted that the individual intensities of each component
wavelength add; since the OPD is longer than the coherence length of the radiation
(related to source optical bandwidth) the signal at the detector is not due to
superposition of individual fields integrated to obtain intensity, but the superposition
of intensities:
; /I
At the centreburst, all the intensities add together - as infinite OPD is
approached, the intensity tends to a limiting value. For polychromatic interferograms,
the value at infinite OPD is flat and in a perfect interferometer, would be equal to
IqH. This is important, because it suggests (correctly) that the efficiency of the ideal
interferometer is 50%, as the average energy in each arm of the interferometer is half
the input power. Providing the intensity does not vary during the collection of an
interferogram, stray light will only contribute a zero offset, and will a ^ c t the
untransformed "d.c." term only; noise from the stray light will, however, be present
on the observed signal so the exclusion of stray light is still desirable.
The model above is unrealistic for several reasons - for instance, it ignores the
effect of absorption and dispersion of polychromatic light in the beamsplitter.
Dispersion results in each wavelength experiencing a slightly different delay in phase;
since the initially-reflected beam in the detector arm only traverses the beamsplitter
once whilst the initially-transmitted beam traverses it three times, resulting in an
imbalance. To compensate for the imbalance in absorption and dispersion, a
compensator plate (made of the same material as the beamsplitter) is incorporated in
the simple design above between the beamsplitter and the moving mirror.
The effect of a wavelength-dependant phase delay on the interferogram is to
introduce components that are not maximal at zero OPD*. The signal can not then be
wholly described as a sum of cosines, but must be related to a sum of sines and
cosines. This can present great problems in the analysis stage as band shape and
intensity may become distorted, and data may be completely lost; therefore, several
methods have been devised to correct the phase of the interferogram to be described
accurately by a sum of cosines. These corrections are applied automatically to the
data, and are not consider further here.
If data is collected on both sides of the centreburst, the interferogram is said
to be double-sided; if the data is collected on mirror travel to and from the position of
Many phase errors accrue from processing electronics and not optics.
31

zero OPD the data is said to be collected bi-directional. It is equally possible to have
one-sided, uni-directional sampling. The exact method depends on the chosen method
of phase correction and scan speed, amongst other considerations.
The efficiency of the interferometer is obviously affected by the optical
constants R and T and by the component quality - especially of mirror surfaces and
beamsplitter plates and coatings. In the near-IR (800 nm - 2500 nm) several solutions
exist - popular mirror coatings being protected silver, enhanced aluminium, and over-
coated gold. Quartz is the beamsplitter of choice, although carefully-prepared KBr is
adequate. Overall, the efficiency of a good near-IR interferometer will be around 25-
35% - about the same as for a single diffraction grating spectrograph operating in first
order dispersion close to the grating blaze angle.
1.4.2 Analysing the data - the Fourier transform
The signal from the detector is a function with periodic components. To work
backwards towards its spectrum by "harmonic analysis" as did Michelson would be
wholly inappropriate for modern analytical techniques - especially since the
mathematics of Joseph F o u r i e r g i v e a a powerful method to analyse the data.
Essentially, the Fourier transform (FT) maps data from one functional domain
into the inverse domain - for instance, timeofrequency (sos~ ^), and optical path
length ditTerenceo wavenumbers (cm<=>cm" ). In doing so it produces the spectrum
of the starting function.
For our purposes, the periodic interferogram is decomposed, and represented
as a histogram of its constituent frequencies at the correct intensity ratio. The OPD-
invariant term of the interferogram can be ignored, as this "d.c." terms simply
represents a biasing about the x-axis. Hence the "a.c." term is often represented as
symmetrically disposed about the x-axis*.
The analysis relies on a very useful property of cosine functions. If a cosine is
multiplied by another cosine and the result integrated, the integral must be zero for all
cases where the phase and frequency of the cosinusoids differ. If phase and frequency
match, the resulting integral is proportional to the product of the amplitude of the two
cosines.
This is exploited in FT spectrometry in the following way. The interferogram
is sequentially "probed" by multiplication with a cosine function of unit amplitude.
* It should be noted that for a perfect cosinusoid. this results in two crossings of the x-axis ("zero-
crossings") per period.
32

The orthogonality of cosines "filters out" the component at that frequency in the
interferogram, and the magnitude is given by the amplitude of the integral.
Problems arise from the sheer volume of calculation required. The only
sensible manner to carry out the computation is using a digital computer or dedicated
firmware. The calculation was greatly facilitated by the introduction of the fast
Fourier Transform (FFT) algorithm, by Cooley and Tukey^^. This reduces the
number of computations requited to carry out the FT hugely, and so considerably
speeds the calculation*.
1.4.3 Resolution in FT spectroscopy
It is patently obvious that the interferogram can not be recorded to infinite
path difference - the maximum OPD usually attained even in very-high-resolution
(VHR) spectrometers is around 2 m. This affects the FT process, as basic Fourier
mathematics operates by integrating over infinite limits. The effect of the truncation
of the data set is to introduce strong oscillatory sidebands onto the spectral lines. This
"ringing" can be smoothed in a process known as apodisation. The apodisation
process amounts to truncating the interferogram with gently-varying functions,
instead of imposing a rectangular "box-car" function on the interferogram.
Unfortunately, no single best function to cover every experiment exists. Since the
degree of apodisation affects the resolution a suite of apodisation functions are
usually made available, chosen before data acquisition, and applied without further
user-input.
The resolution attainable depends on the optical path difference. In order to
resolve two closely-overlapped features, a suitable length of interferogram must be
recorded. To show this, consider the interferogram of two monochromatic lines of
equal intensity, and wavelength and Xy:
= I/2[]+cos(2%A/lx)] + I/2[l+cos(27cA/?ty)]
This may be rewritten, using a simple trigonometric identity, as:
Id = I + I[cos(27tA(Xx+Xy}/2XxXy)cos(27tA{Xx-A,y}/2XxA,y)]
* The number of calculations reduces from n^ lo (n)log(n) for an n-point data set. Typically, ii is ca.
4000
This shov^that there is a carrier wave term, and a modulation term,
{Xx-A,y}. In order to determine the periodicity of the modulation simply by
observation of the interferogram, one complete period of the modulation must be
observed. The period of the modulation is wversely proportional to the difference in
line position, so closely-spaced Urns require more interferosram to be recorded to
resolve them. Hence the resolution attained is inversely proportional to the optical
path difference, 5u = 1/A.
1.4.4 Sampled data
In actuality, the data collected is not continuous, as continuous data simply is
not required. Discrete data may be used, providing the effects of a discrete data set
are taken into account. A well-known theory in communication engineering called the
Nyquist t h e o r e m shows that the frequency of a continuous periodic function may
be truthfully determined from discrete data if the fiinction is sampled o/ ny/cg
per period - that is, two samples are needed to solve the coupled equations for
amplitude and frequency of an arbitrary cosine fijnction. The Nyquist limit is the
frequency above which data is no longer sampled twice per period. Above this limit,
data becomes more difficult to interpret; a phenomenon known as aliasing occurs,
where the spectrum derived by the FT process is "folded" about the Nyquist
frequency, and may overlay the spectrum below the Nyquist limit.
Sampling intervals are derived from a reference Helium-Neon (HeNe) laser
source within the interferometer, which follows a near-identical beampath to the
source radiation through the interferometer, also experiences interference as a
function of OPD, but is detected at separate photodiodes. Every time the HeNe signal
zero-crosses, corresponding to one signal per 316.4 nm OPD, a timing signal is
generated. Since there are two zero-crossings per cycle of the HeNe fringes, we have
a Nyquist limit of 15803 cm"^. Electronic filters are often used to remove
components around the Nyquist limit to avoid aliasing. The HeNe signal may be
processed to yield extra zero-crossings, and these used to push the Nyquist limit into
the near-UV.
The discrete data set requires the use of a discrete (DFT) and not continuous
(CFT) Fourier transform. This is a well-understood method; however, the spectral
data available from the DFT is limited in the sense that data is "missing" from the
digitised interferogram. In passing, an example of a problem is the consideration of
what happens to data at spectral positions that do not correspond exactly to sampled

frequencies. Although beyond this simple introduction, the data from such frequencies
is weighted into the nearest two data points.
For the most faithful representation of band shape, many data points must be
used to define the band - a large number of frequency-domain data points must be
determined. In the FT technique, this means a long interferogram must be recorded.
The resolution attainable for a given OPD can be rewritten as Su.N.I = 1. Here, the
OPD is given by the number of data points (N) multiplied by the interval between
them (I). Hence, twice the number of data points must be collected and processed for
a given interferogram sampling rate in order to achieve twice the resolution.
Note that increasing the interferogram sampling rate whilst leaving the
mmiher of samples taken the same can NOT increase spectral resolution. In the above
equation, as the sampling rate increases, the interferogram samplins interval soes
down. The fallacy of the opposite claim can also be seen by considering behaviour at
abstract limits - what occurs on continuously sampling a data set of zero length. Put
another way, increasing the sampling rate on the interferogram is only required if
higher maximum spectral frequencies need to be studied.
1.4.5 J-stop effects
Resolution is not governed only by the length of interferogram collected - but
also by the finite source required for finite optical throughput. Finite source size
means that there are off-axis rays propagating through the interferometer. A beam
stop is placed at the image of the detector, to limit the cone angle of the source
radiation to try to minimise the effect of the off-axis rays; this beam stop is known as
the Jacquinot stop, or J-stop.
Consider an interferometer, uniformly illuminated with monochromatic light,
so that the rays falling onto the beamsplitter define a cone of half-angle a to the
optical axis. The central ray, lying on and therefore parallel to the optical axis,
experiences an optical path difference A equal to twice 1, the moving mirror
retardation.
lon(^) = 2RTIo(l+cos{2TcA /X) )
However, the extreme ray that lies at an angle a to the optical axis
experiences a shorter difference in optical path, for the same mirror displacement.
The optical path difference is given by:
35

Hence
^ext ^ 21.(1- a^/2)
lofKA) = 2RT(l+cos{27:A[l- a^/2] /
The interferogram recorded from this ray will have a characteristic periodicity
lomer than that of the on-axis ray. The FT process can not discriminate between on-
and off-axis beams; it simply operates on signal produced by the detector. In order for
a given maximum OPD to yield the desired resolution, the half cone angle of the
source must be kept below a limiting value. This can be estimates as follows. The
half-angle a is related to the radius of the entrance aperture and the focal length of
the collimating optic (both in mm);
tan a = r / f
The paraxial approximation is assumed to hold, so that tan a « a « r / f
] - ( a 2 ) / 2 = l - ( r / f ) ^ / 2
However, this is also the ratio of the wavenumber difference Voff / ^on '
which is a .measure of the degradation in resolution for a given J-stop size. For r = 4
mm and f = 125 mm as for a Perkin Elmer 1700 series interferometer, Voff / Vq^ =
0.9995. That is, at 10,000 cm"\ there is no point in attempting to achieve 4 cm'^
resolution with a 4 mm radius J-stop as the divergence of light limits the resolution to
about 5 cm"^ Hence for high-resolution spectra, the number of data points collected
must be high enough to define the bands' profile adequately and the J-stop must be
small enough to limit the off-axis cone angle in order to give a broadening less than
the desired resolution.
Another effect of finite source size is that the measured wavelength is greater
than the true wavelength. As the interferogram is recorded each component ray in the
cone of light illuminating the beamsplitter produces a cosinusoid of characteristic
period. The on-axis ray has periodicity X, and the FT correctly interprets this as
indicating the input wavelength was A. Therefore, on-axis ray gives rise to no error in
the measured wavelength. On the other hand, for a given value of mirror displacement
1 (=A/2) an off-axis ray observes - as shown above - a shorter optical path difference,
so that the characteristic periodicity in the interferogram is 1 / [1-a /2]. In other
words, lonser than the on-axis. The FT process incorrectly interprets the wavelength
as indicating a longer wavelength input signal.
The effect is to shift every band in a recorded spectrum to lower wavemmiber'.
36

^recorded ! ^true " 1- ct^/2
When the weighting of off-axis rays in the ray-bundle entering the
interferometer is taken into account, a smaller shift is actually seen. The effect can be
dealt with simply by averaging the shift experienced for an on-axis ray - zero, of
course, so a = 0 - and extreme off-axis ray, at a = r / f:
^recorded ! ^true ~ [(^) (I- (r ! / 2)] / 2
^recorded ! ^true = 1- (r / f)^ / 4
Using a small J-stop reduces the apparent error in band positions wyaff/er
what the OPD-determined speclra! resolution. The OPD-determined resolution
defines the number of points collected; the J-stop width may be usually selected
independently. Of course, smaller J-stop size means smaller energy throughput, and
lower signal-to-noise ratios for given exposure time and source brightness.
Conversely, if band shape needs to be well-defined for frequency measurement
but the linewidth is such that high resolution in not required the OPD-defmed
resolution may be increased, to over-sample the data, whilst leaving the J-stop open,
to give good throughput.
1.4.6 Advantages of FT spectrometry
The optical advantages of the interferometer are very well-known. Briefly
summarised, they are presented below:
The Jacqumot (or Ihroiishpnl) advantage- for spectrometers operating at
equal spectral resolution and covering the same spectral range, interferometers have
higher optical light-gathering power (expressed as etendue or luminosity) than
grating- or prism-based spectrometers^'. Throughput may be defined at any point in
an optical system as the product of solid angle with cross-sectional area:
Q = n A
This wavelength-independent property is a constant of the system, being
conserved throughout a well-designed optical system. In a Raman experiment, the
37
throughput should be source-limited - that is, limited by the collection optics' solid
angle times the area of the spectrometer entrance aperture. For near-IR
interferometers, the improvement in comparison with a grating system has been
estimated to be around a factor of 100-200; this comes the derivation:
©Interferometer / ®Grating ~ 27i.F / 1'
where F = focal length of collimating optic and 1' = height of slit. This ratio
may be around 20-30, for well-designed systems, therefore the advantage simply on
light-gathering grounds of an interferometer is about 2 orders of magnitude. Hence
their use in low-light-level applications.
The Felleelt (or multiplex) advantage - every point in the interferogram is a
superposition of the individual interferences from each wavelength, hence each point
contains information on each wavelength. FT spectroscopy is a multiplex technique -
many signal channels are mixed together and detected at a single detector. Each
wavelength is "coded" by the interferometer; each has a unique modulation frequency
below the Nyquist limit. The FT reproduces the spectrum of the signal as a unique
solution, because the "code" used was orthogonal - remembering that each
component can be represented as a cosine function, and the orthogonality of cosines.
The advantage of multiplex detection can be stated in several ways, although
the outcome depends on the dominant noise process of the experiment. In the case of
FT-Raman spectroscopy, this means the detector. Detector-noise-limited experiments
show no correlation between signal flux and noise level - that is, if the signal is
increased, the noise remains the same.
The most common rendering of the Fellgett advantage is as follows. If the
total number of wavenumber increments to be detected in a given time is N, a true
multiplex method views the signal from each wavenumber increment N times longer
than the equivalent sequential scanning experiment. During this effective integration,
noise also builds up - except there is no correlation with total signal level, so that this
tends to average to Vn. Hence the advantage in SNR of multiplex versus sequential
detection in a detector-noise-limited experiment is N / Vn = "V'N. It must be
emphasised that the equivalent experimental conditions for both spectrometer and
interferometer encompass spectral range, resolution, optical efficiency, and signal
flux.
For N=]00, we would predict a gain in SNR of 10 from this simple approach.
However, many subtleties are ignored in the above derivation; in reality, the SNR gain
is a complex function to derive, and may yield a (significantly) lower result than the
simple model.
The Comies advantave - Wavelength precision is absolutely critical for co-
adding many spectra to derive gains in SNR. The gain in SNR on co-adding N data
sets is Vn , to good approximation - although chapter 6 contains additional comments
on the validity of this approach for very large co-added data sets. The Connes
advantage describes using a monochromatic reference s o u r c e achieve good
relative frequency precision, which expedites this. Co-addition is a very common way
to achieve good SNR in many experimental techniques; it is tiot a property only of
interferometric spectrometers'.
However, since the HeNe laser used for generating timing pulses is extremely
stable in frequency, it is an excellent internal calibration for wavelength precision,
which may in turn be related to absolute accuracy, with care - since angular
misalignment of the HeNe causes wavelength-dependant frequency shift.
Spectral subtraction studies are straightforward using FT spectrometry as a
result of the Connes advantage. Spectra must overlay exactly for meaningful results in
low-concentration systems. However, this must be treated with some care. If the J-
stop is unevenly illuminated, then spectral shifts arise. These effect may be present
using powders; for liquids, the J-stop is more evenly illuminated - and sample cells
may be filed w situ to so that alignment errors due to sample placement remain
approximately constant.
It should be noted that the concepts of throughput and efficiency refer to
different aspects of an optical system - the light-gathering power and the wavelength-
response, respectively. They are not interchangeable - the former is wavelength-
independent, the latter obviously not. Intuitively, it is possible to design a low-
efficiency, high-throughput device and get the same performance as a low-
throughput, high-efficiency optic. Signal flux must also be taken into account when
determining the amount of light incident on the detector - whilst the signal-to-noise
ratio (SNR) in turn depends on the noise characteristics of the detector, and the
length of time available for the experiment. Describing a spectroscopic experiment
analytically using these four parameters is, in general, very difficult, and rarely
undertaken in practice.
It must also not be confused with the Fellgett advantage.
39

1.4.7 FT-Raman instrumentation at Southampton
The advantages of FTS discussed above hold the key to understanding why
FT-Raman is the method of choice for near-IR excited Raman spectrometry beyond 1
|im:
• The theory section showed that the intensity of linear Raman scattering drops
dramatically for equal excitation powers on moving from 488 nm to 1064 nm
excitation; a decrease of about 23-fold, for a band close to the Rayleigh line.
• More seriously, the detectors available are 100 - 1000 times less sensitive than
those available in the visible region.
The layout of the Perkin Elmer 1700 series instrument is given below. Most of
the work in this thesis was carried out on the second development prototype or the
first commercial 1700 series interferometer:
Retay Mags
Sampfe s tand
Infrared source and collimaling
^ % \ mirror ( redundanO
N d - Y A G Laser
Jaqwnol ~ ^ *
He-Ne Laser
20* ' /kpivot Infrared
I sample a r e a
Beam splitter
table
Detector
H e - Ne Laser monitors
Figure 1.11 The PE 1700 series FT-Raman spectrometer optical layout
40
A near-IR laser is focused onto the sample. The scattering, along with
luminescence and reflected light, is collected and focused into the interferometer. The
component at the Rayleigh wavelength is rejected, the light modulated by the
interferometer, and focused to the near-IR detector.
Notice that the interferometer must come after the sample, as this is the
source for our experiment. In IR experiments, the sample may come before or after
the interferometer. It does not matter whether the sample is placed in modulated light
- the most important aspect is that the interferometer acts to code each wavelength,
so that the FFT determines the absorption spectrum; in the Raman experiment, the
scattering must be modulated and therefore must come before the interferometer.
The laser is usually a lamp-pumped (on 1700 series) or diode-laser-pumped
(on 2000 series) Neodymium-doped Yttrium Aluminium garnet (Nd-^'^:YAG) device,
operating in continuous-wave emission at 1064.1 nm (9398 cm'^) in air. The laser
should not limit the experiment - thus a maximum power around 2-3 Watts, linewidth
less than 0.1 cm"^, and high output stability are demanded. Stability is critical to the
optimisation of the experiment - and resulted in active-feedback stabilisation being
fitted to all the lamp-pumped systems. This is discussed later as part of chapter 6,
during the gas-phase experiments. The diode-based systems are very new and
extremely convenient, requiring no cooling and having low power consumption. The
lamp-pumped systems require both cooling water and 415 volt 3-phase a/c supplies.
In addition to the laser, a plasma-line rejection filter is required. This has a
very high transmission at the laser wavelength, and very high blocking elsewhere - it
should also have a passband width that complements the Stokes/anti-Stokes
performance of the Rayleigh line filters. Non-ideality can be tolerated, providing the
low-shift plasma lines* do not mask out any low-frequency Raman shifts of the
sample.
The removal of the laser line from the collected scattering is absolutely
critical. Its sheer intensity (Rayleigh scattering plus reflection) causes the
interferogram to be dominated by a huge component at the laser wavelength, with the
Raman sidebands appearing almost as "noise". Since the laser line at 0 cm"^ shift is
far more intense than the Raman signal, "ringing" extends hundreds of wavenumbers
into the spectrum, dwarfing the Raman spectrum. Worse still, the FT process
redistributes noise; although not important to report in depth, the effect is that noise
* Plasma lines can be recognised as they appear more strongly when the sample is replaced by a
mirror.
41
at each wavelength is weighted into all other wavelengths during FFT. The "ringing"
and Rayleigh line noise simply obliterates the Raman spectrum.
The intensity also often saturates the near-IR detector, and can even "blind"
the HeNe fringe detectors, crashing the interferometer - although this can be avoided
by placing HeNe bandpass filters in front of the fringe diodes. The least that happens
is that the detector may exhibit non-linear response, which gives erroneous spectral
positions and intensities.
Rayleigh rejection on the 1700 series instruments was achieved by use of
multilayer dielectric filters, which are so designed to be extremely reflective at the
laser wavelength. Their performance parameters (optical density at the laser
wavelength, spectral bandwidth of blocking region, transmission in pass bands,
variation in profile) developed astonishingly quickly. In order to achieve suitable
blocking, four filters were usually employed, installed at the J-stop and in the
redundant IR sampling compartment. Since the performance of these filters depends
on angle of incidence, the positioning was not ideal, since the light passing through
them was diverging - however, the first development filters were small and required
installation at a beam waist, easily accessible for replacement.
System 2000 spectrometers operate with larger filters in collimated light,
away from focus points. However, the major change is that laser rejection is achieved
by holographic notch filters - an alternative method to selectively reflect light. This is
one of many alternative technologies available; others are based on transmission,
scattering, or absorption.
The detectors used for the near-IR experiment need to be sensitive over the
wavelength range 1-1.8 |nm, as the Raman scattering excited at about 1 |_im falls out
to around 1.7 j.im. The only two commercially-available detectors with good enough
performance are the Germanium photoconductive and the InGaAs photovoltaic
devices. In routine applications, InGaAs is more suitable, because Ge requires cooling
to liquid nitrogen temperature to operate. The performance of near-IR detectors
needs to improve markedly before scanning spectrometric or spectrographic
applications beyond 1000 nm become routinely advisable; a few researchers have
tried other techniques beyond 1 |.im, with little prospect to challenge the
interferometric experiment for most tasks.
1.4.8 Sampling problems in FT-Raman spectroscopy
FT-Raman has greatly alleviated the number of analyses fatally compromised
by fluorescence. Although FT-Raman offers many advantages to sampling over mid-
42

IR methods, over the last years at Southampton certain features have come to light
that need to be kept in mind:
• Black or very darkly-coloured materials - these give very poor spectra. The
reason is usually strong laser absorption, followed by fluorescence, thermal
emission, or pyrolysis. In general, FT-Raman uses high laser powers - 200-800
mW - so that heating material always causes problem.
• Elevated temperatures - thermal emission is problematic as the region of interest
(1-2 |_im) is significantly affected by emission from samples above 150-200°C.
Thermal emission may be approximated in certain cases with the blackbody model
- which shows objects at 150°C have a maximum emission at around 6 pm. The
edge of the emission profile is strong enough to cause saturation
of the detector. Methods to avoid thermal background interference include pulsed
laser/gated detection and long-wave-blocking filters, as well as sample cooling.
• Aqueous solutions - these can present difficulties, as the first overtone of water is
broad and strong enough to significantly attenuate the Raman scattering from the
2000-2500 cm'l shift area. Deuterated solutions are a somewhat expensive and
non-trivial solution; if -CN, CO, triple CC, certain SH or SiH vibrations need to
be probed in aqueous media, care must be exercised.
• Self-absorption in organic species - many organic species re-absorb Raman
scattering generated in the sample in the overtone and combination region. This
can significantly attenuate relative intensity, and is a complex function of
pathlength, optical coefficients, and sampling geometry. It may make the use of
standard intensity scales and internal standards untenable. Although the overtone
of CH is relatively quite weak in absorption, the effect on the Raman spectrum
may be profound.
• Glass - some glasses are not suitable for sample vessels, as they contain high
levels of either transition metals or rare earths, which fluoresce weakly. Quartz is
ideal, if free from ferric iron.
1.4.9 Optical constants and correction flmctions
The most obvious conclusion to draw is that time spent determining either the
reflectance or transmission near-IR spectrum from 800-2500 nm is always
worthwhile; the knowledge of the optical constants (refractive index, n, and
absorption coefficient, k) as a function of wavelength is very useful when planning an
experimental approach. Although well-used in visible Raman spectroscopy, this idea
43

is only slowly being accepted by near-IR Raman spectroscopists. In chapter 5, near-
IR diffuse reflectance is used as a method to probe the absorptions of cement
minerals; it is hoped that more owners of near-IR-optimised FT spectrometers will
start to use this profitable method to aid their FT-Raman studies.
Unfortunately, few also appreciate the need to routinely correct single-beam
spectra for instrument response as a function of wavelength^^
^recorded ~ ^response ^ ^ t r u e
so that
^ t rue ~ ^recorded ^ ^correction
where
^correction " "theoretical ' '' "° ' '%xperimental
This is well-reviewed elsewhere - all spectra in this thesis are corrected by the
method of Petty et al developed at Southampton^or by a modified method based on
the output of a quartz halogen tungsten (QTH) strip lamp. Although promising, care
must be taken to carefLilly correct the blackbody equation to reflect the emissivity of
tungsten as a function of wavelength (linear from 0.9-1.9 ^im) and temperature
(measured with difficulty and uncertainty with an optical pyrometer). Alignment was
found to be critical - if the lamp were placed off-axis, quite large spectral changes
could be brought about. Since the QTH lamp filament is not a suitable shape to image
in the J-stop evenly, a piece of spectrally-grey scattering glass was used to produce a
diffuse image. It must be remembered that while not sensitive to individual photons,
photodiodes are photon-detectors, not energy-integrating detectors; therefore, the
Planck curve has to be cast in terms of photons, and not intensity, to calculate the
correction function from the blackbody equation.
1.4.10 Polarisation measurements
The simple introduction given earlier in this chapter is adequate to describe
the polarisation of Raman scattering. However, the angular dependency of the
scattered light was not considered - hence an important result was overlooked:
depolarisation ratios can vary, depending on the sampling geometry used. Most
common are the 90° and 180° geometries - the latter prevalent on FT-Raman
spectrometers, as it is far easier for non-experts to align and obtain reproducible
44

results. Fortuitously, the expression for p/ in both geometries is the same*. Care must
therefore be taken to ascertain the polarisation state of the excitation laser, and also
whether the pre-sample optics rotate this polarisation or introduce significant
depolarisation.
During the work in chapter 2, depolarisation ratios were measured for a
simple melt-phase species. As described therein, the experiment involved setting a
linear polariser in the J-stop, and using vertically-polarised excitation. Before the
results could be interpreted, a calibration was required. Since CCI4 has perfect
tetrahedral symmetry (molecular point group T j ) the totally symmetric vibration near
460 cm'^ should have been almost completely polarised - nearly complete extinction
should have been seen under crossed poWaeA whilst the other bands should have been
depolarised, with ratio equal to 0.75. The values obtained (<0.1 for near 460 cm"\
0.74-0.76 for the others) showed the experiment to be imperfect, but not fatally
flawed; the reasons are discussed below.
Problems with near-IR depolarisation ratio measurements are due to well-
known optical considerations. It has been shown recently that interferometry offers an
advantage over grating or prism spectrometry for the routine recording of
depolarisation ratios^ Orthogonal linear polarisations are transmitted through near-
IR Michelson interferometers with almost equal efficiency - expressed as a ratio, 80-
90% compared to 10-20% for conventional spectrometers and spectrographs. The
reason for this improvement is the absence of strongly polarising optical components.
Diffraction gratings are particularly poor in this respect, necessitating the use of
polarisation scrambling optics before the entrance slit, "fixing" the polarisation
admitted to the spectrometer (several different configurations possible), or the
application of a correction to the derived ratio of intensities. The near-equity of
polarisation response for interferometers circumvents the requirement to correct for
the spectrometer, or the use of expensive polarisation scramblers, for qualitative
analytical work.
The errors in the method as a whole are assumed to be:
• Finite transmission of the desired polarisation through the polariser
• Finite extinction of the undesired polarisation through the polariser
• Wavenumber-dependency of these two flinctions
• Angular misalignment of the analyser
* The same is not tnie for p^, the depolarisation ratio obtained using unpolarised excitation, where
no depolarisation may be recorded in the backscattering geometry.
45
• Divergence of the incident beam at the analyser
• Large solid acceptance angle
• Polarisation response of the spectrometer.
Of course, for the highest accuracy, correction of interferometrically-derived
data should be carried out, especially since the accuracy of the depolarisation ratio
has a dependency on spectrometer fore optic /-number. This tends to be low (less
than unity in some cases) to allow high optical throughput. This high angular
acceptance aperture introduces a source of error^^. A particular problem of the near-
IR is that the Raman scattering falls over a long wavelength range (1-1.7 j.im) and it is
difficult to fabricate optical components to have equal polarisation
transmittance/extinction over such a range. The problems of dichroic measurements
on polymers highlight these problems^J.
1.5 References:
1.) C.V. Raman and K.S. Krishnan, Nature, 121. 619 (1928)
2.) G. Herzberg, "Molecular spectra and molecular structure. II. Infrared and
Raman spectra of polyatomic molecules". Van No strand (1945)
3.) See, for instance, P.W. Atkins, "Molecular Quantum Mechanics", 2""^ Ed.,
Oxford University Press (1983)
4.) N.J. Bridge and A.J. Buckingham, Proc. Roy. Soc. Lon., 295A, 334 (1966)
5.) E.B. Wilson, J.C. Decius, and P.C. Cross, "Molecular Vibrations", McGraw-
Hill (1977)
6.) G. Placzek, Handbuch der Radiologic VI, Part 2 (Akademische
Verlagsgesellschaft, 1934); URCL Translation 526 (L)
7.) H.W. Schrotter and H.W. Klockner, Chapter 4 in "Raman spectroscopy of
gases and liquids" Ed. A. Weber (Springer, 1979)
8.) See, for instance, C.E. Hathaway, Chapter 4 in "The Raman Effect" Vol.1,
Ed. A. Anderson (Marcel Dekker, 1970)
9.) B. Schrader, A. Hoffmann, and S. Keller, Spectrochim, Acta 47A(9/10)
1135(1991)
10.) H. Stammreich, Spectrochim. Acta 8, 41 (1956)
11.) T. Hirschfeld and B. Chase, Appl. Spectrosc. 40(2), 133 (1986)
12.) See, for instance, the special editions of Spectrochim. Acta 46A, 47A, 49A,
and 50A devoted to FT-Raman techniques and applications, edited by P.J.
Hendra.
46
13.) E.R. Schildkraut and T.B. Hirschfeld, in "Laser Raman Gas Diagnostics" Eds.
Lapp and Penney, page 379 (Plenum, 1974)
14.) G.W. Chantry, H.A. Gebbie, and C. Hi I sum. Nature 203. 1052 (1964)
15.) J.B.J. Fourier, "Theorie Analytique de la Chaleur", Firmin Didcot, Paris
(1822)
16.) J.W. Cooley and J.W. Tukey, Mathematics of Computation 19, 297 (1965)
17.) P. Jacquinot, Rep. Prog. Phys. 23, 267 (1960)
18.) P. Fellgett, J. De Phys. et de la Rad. 19 187 (1958)
19.) J. Connes, Rev. Theor. Opt. Instrum. 40, 45 (1961)
20.) C.J. Petty, G.M. Warnes, P.J. Hendra, and M. Judkins, Spectrochim. Acta
^ A ( 9 / 1 0 ) , 1 1 7 9 ( 1 9 9 1 )
21.) A. Hoffman, S. Keller, B. Schrader, R. Ferwerda, and J. Van Der Maas, J.
Raman Spectrosc., 22, 497 (1991)
22.) N.J. Bridge and A.D. Buckingham, Proc. Roy. Soc. (London), 295A, 334
(1966)
23.) D.L Green and D.I. Bower, Spectrochim. Acta, 49, 1 191 (1993)
47
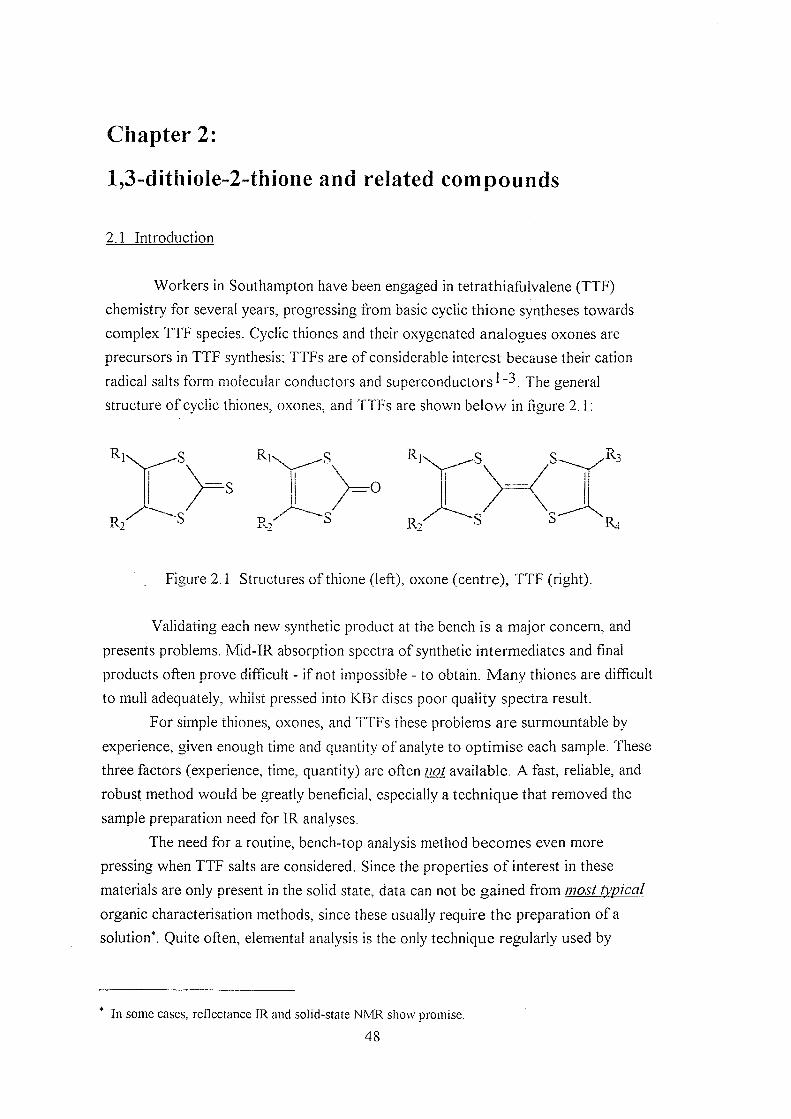
Chapter 2:
l,3-dithiole-2-thione and related compounds
2.1 Introduction
Workers in Southampton have been engaged in tetrathiafuivalene (TTF)
chemistry for several years, progressing from basic cyclic thione syntheses towards
complex TTF species. Cyclic thiones and their oxygenated analogues oxones are
precursors in TTF synthesis; TTFs are of considerable interest because their cation
radical salts form molecular conductors and superconductors "3. The general
structure of cyclic thiones, oxones, and TTFs are shown below in figure 2.1;
S-
R4
Figure 2.1 Structures of thione (left), oxone (centre), TTF (right).
Validating each new synthetic product at the bench is a major concern, and
presents problems. Mid-IR absorption spectra of synthetic intermediates and final
products often prove difficult - if not impossible - to obtain. Many thiones are difficult
to mull adequately, whilst pressed into KBr discs poor quality spectra result.
For simple thiones, oxones, and TTFs these problems are surmountable by
experience, given enough time and quantity of analyte to optimise each sample. These
three factors (experience, time, quantity) are often not available. A fast, reliable, and
robust method would be greatly beneficial, especially a technique that removed the
sample preparation need for IR analyses.
The need for a routine, bench-top analysis method becomes even more
pressing when TTF salts are considered. Since the properties of interest in these
materials are only present in the solid state, data can not be gained from most typical
organic characterisation methods, since these usually require the preparation of a
solution*. Quite often, elemental analysis is the only technique regularly used by
In some cases, reflectance IR and solid-state NMR show promise.
4 8

synthetic chemists for characterising TTF salts after synthesis - which is a wholly
destructive technique,
FT-Raman techniques could greatly beneficial in this area. The basis for this
hope is that Raman spectroscopy has proved rather successful
area of fimdamental research. A very large research effort has been made - not only
have the vibrational spectra of simple TTFs been accurately assigned'^, but theories
developed to explain the bandshiAs seen on the formation of the TTF salt
complexes^-^ in terms of the degree of partial charge-transfer that takes place
between donor and acceptor. Many TTF salts are highly-coloured, and fluorescence
and pyrolysis figure strongly as disadvantages in the routine use of conventional
Raman spectroscopy.
For these reasons, an evaluation of FT-Raman spectroscopy was undertaken.
The work presented in this chapter began with the objective to evaluate the technique
in an analytical context. The intended development of the project was to use the
knowledge gained during the initial thione study, together with the considerable
conventional Raman literature, to survey the analytical applications for TTF salt
synthesis.
2.2 Experimental
All the synthetic work was carried out by Dr, Jeremy Kilburn and co-workers
in the Departments of Chemistry in the Universities of Southampton and Bangor.
Compounds were purified by recrystallisation or by column chromatography, whilst
novel compounds were additionally characterised by proton nuclear magnetic
resonance (^H-NMR), mass spectroscopy (MS), and elemental analysis (EA).
For FT-Raman studies, simple powder cells for solids and bulb cells for oils
proved sufficient. The colour and physical state of the samples varied considerably, as
did the amount of sample available, the minimum being ca. 25 milligrams, although
this presented no problem.
2.3 Results & Discussion
In general, the spectra obtained by the FT-Raman technique are of good
quality. Excitation power levels varied between 10 mW and 1 W. The spectra are the
result of 50-250 co-added scans, recorded at either 3 or 4 cm"^ resolution, from 350-
3500 cm" \ and then corrected for instrumental sensitivity versus wavelength^.
49
The only serious difficulties encountered, albeit in a small number of cases
(<10% of all samples studied), were the decomposition of some samples in the laser
beam, and the fluorescence from others.
• Fluorescence - Although only severe in a few cases, fluorescence was
problematical, since it proved unpredictable. It was detected from some very dark
samples, and from those that recrystallised poorly. However, some of the lightly-
coloured high-purity samples also fluoresced badly. Deep coloration usually
indicates long-wavelength absorption bands, the tail of which might well reach
into the near-IR, and poorly recrystallised samples are likely still to contain by-
products from synthetic "work-up". Such impurities are notorious in conventional
Raman spectroscopy for causing fluorescence. Although a great advance over the
extreme precautions needed in conventional Raman spectroscopy, it is quite plain
that good sample purity is still a requisite for near-IR Raman spectroscopy.
As an example, the zinc-containing bis-dithiolene H (shown later in figure
2.10) fluoresced strongly and decomposed at very low laser powers. The reason for
this is probably the occurrence of an electronic absorption bands near 1 f.im; transition
metal dithiolenes are k n o w n have low-lying electronic transitions around 0.8-1 n
m, depending on the metal centre and the nature of the TTF. These are most likely to
be metal-based d-d transitions.
• Pvrolvsis - Decreasing the power and defocusing the beam had limited success in
reducing the cases of pyrolysis. One of the effects of sample pyrolysis was to
produce a thermal emission background which obscured nearly all other spectral
features. Pyrolysis was especially severe for dark red or dark brown samples.
It should be noted that the high noise level at low Raman shift in figure 2.10
was caused by multiplication with an unmodified instrument response correction
function. The correction function could not be smoothed, as the shape is critical to a
good correction^, whilst smoothing the spectrum sufficiently rendered the band near
1450 cm"^ impossible to resolve.
The first ten thiones and derivatives considered in this study are labelled A-J
in order to simplify identification. Spectra are presented, followed by the chemical
structure. A-H are thiones, I an oxone, and J a TTF. Subsequent batches of thiones
and derivatives were compared and contrasted with these original compounds,
providing a check on the original conclusions, and refining the data.
50

2.3.1.1 The Raman spectrum of L3-dithiole-2-thione
In the case of the simplest structure (U3-dithiole-2-thione, A) several authors
had previously attempted vibrational analyses. Gayathri Devi, Sathyanarayana and
Engler^ ^ reported IR spectra and the results of a normal co-ordinate analysis, whilst
Iqbal and O w e n ^ 2 provided IR spectra and Raman band position data together with a
normal co-ordinate analysis.
Unfortunately, there are significant differences between the two sets of results,
whilst the Raman data collected during this study contradicted both previous analyses
- consequently the assignments in these analyses must be open to doubt.
Consequently, a further aim of this work became the re-assignment of the vibrational
description of A by group frequency methods.
The Raman spectrum of A is shown in figure 2.2. This material was
recrystallised fi-om 20% EtOH:80% MeOMe to leave light yellow needle-like crystals.
.b
I
0.6
0.5
0.4
0.3
0.2
0.1
0
3000 2700 2400 2100 1800 1500 1200 900
Waveniunber shift (cm-1)
600 300
Figure 2.2a The FT-Raman spectrum of A.
Figure 2.2b Structure of A.
51
An experimental crystal structure of A is not available. However, since
analogues and derivatives of A have been shown to contain planar or near-planar
thione rings by X-ray c r y s t a l l o g r a p h y ^ 3 the convention established in previous work
assuming A is planar is followed.
According to basic group theory, the molecule has C2v symmetry, and has 18
fundamental modes of vibration {lk\, 2A2, 6B1, and 3B2). All but the two A2
modes are expected to be jointly Raman and IR active, the A 2 modes only possessing
Raman activity.
Before rushing to assign all bands in figure 2.2 as fundamentals, it must be
remembered that although group theory predicts those bands which will have non-
zero intensity, it says nothing about the actual intensity. Although all the fundamental
vibrations of A are Raman-active, it is very dangerous to proceed only on the basis of
the Raman spectrum, because some Raman bands may be very weak.
Even if IR and Raman data are combined, care must still be exercised when
using mode-counting as a method of assigning vibrational spectra. Most FT-IR
spectrometers are fitted with KBr optics - hence the lowest frequency attainable is ca.
400 cm"\ Most FT-Raman spectrometers struggle to approach shifts under ca. 150
cm"^. Any IR-active fundamentals lying below 400 cm"^ and Raman bands below ca.
150 cm'^ shift could be overlooked - the effect on a detailed assignment would be
disastrous. In addition, some of the weaker bands may be due to overtone and
combination modes. Care is always needed when mode counting'.
Table 2,1 below lists the Raman shift, approximate description, and tentative
assignment of the bands. From group frequency arguments the following Raman
bands would be expected:
• (C-H) around 3100-3000 cm~^
• (C=C) between 1680-1600 crn"*
. (C=S) about 1200-1050 cm"^
. (C-S) at 650-500 cm"^
Bending motions of the C=S and C-H groups, as well as modes associated
with ring deformations, would also be expected, in the region below ca. 1500 cm'^.
^ Sometimes vibrational models can help, but since these are often in largest error in
the low-frequency domain, their use must be well-considered.
52
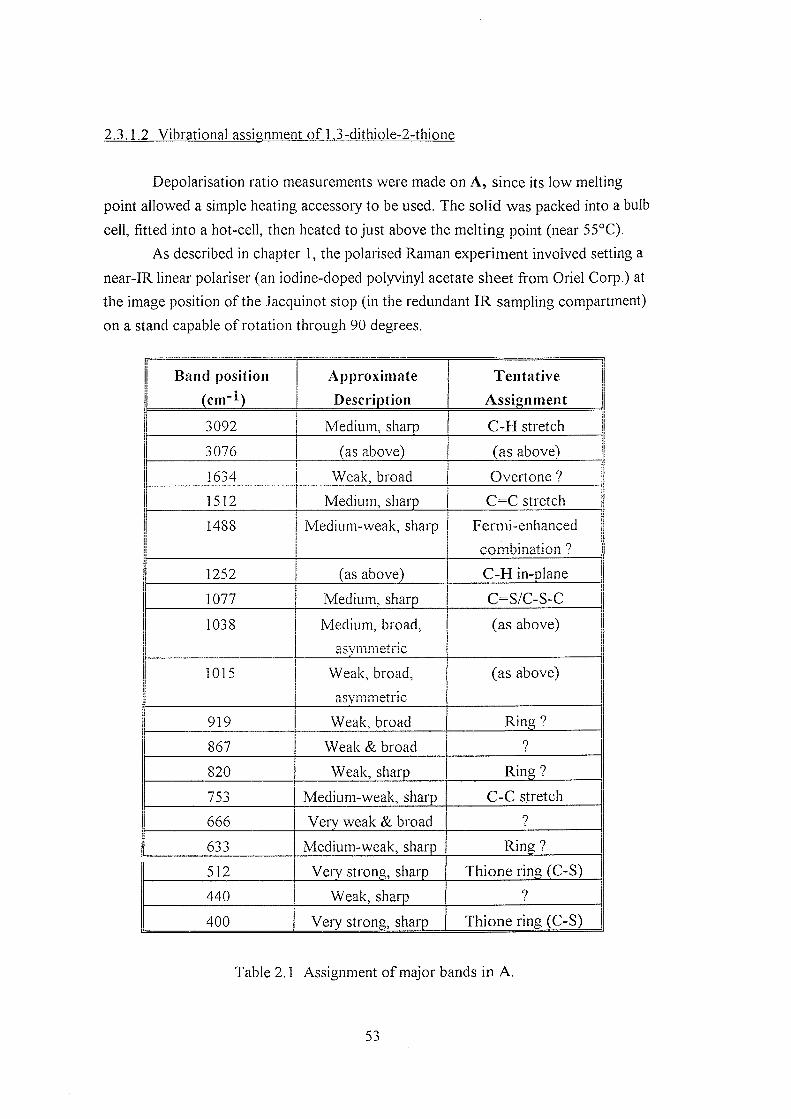
2.3.1.2 Vibrational assignment of 1.3-dithiole-2-thione
Depolarisation ratio measurements were made on A, since its low melting
point allowed a simple heating accessory to be used. The solid was packed into a bulb
cell, fitted into a hot-cell, then heated to just above the melting point (near 55°C).
As described in chapter 1, the polarised Raman experiment involved setting a
near-IR linear polariser (an iodine-doped polyvinyl acetate sheet from Oriel Corp.) at
the image position of the Jacquinot stop (in the redundant IR sampling compartment)
on a stand capable of rotation through 90 degrees.
Band position
(cm"l)
Approximate
Description
Tentative
Assignment
3092 Medium, sharp C-H stretch
3076 (as above) (as above)
1634 Weak, broad Overtone ?
1512 Medium, sharp C=C stretch
1488 Medium-weak, sharp Fermi-enhanced
combination ?
1252 (as above) C-H in-plane
1077 Medium, sharp C=S/C-S-C
1038 Medium, broad,
asymmemc
(as above)
1015 Weak, broad,
asymmetric
(as above)
919 Weak, broad Ring ?
867 Weak & broad 7
820 Weak, sharp Ring ?
753 Medium-weak, sharp C-C stretch
666 Very weak & broad ?
633 Medium-weak, sharp Ring ?
512 Very strong, sharp Thione ring (C-S)
440 Weak, sharp ?
400 Very strong, sharp Thione ring (C-S)
Table 2.1 Assignment of major bands in A.

The Raman scattering with excited as usual with a (fixed) vertical linear
polarisation. Calibration of the experiment was by reference to carbon tetrachloride
( C C I 4 ) , and comparison against accepted v a l u e s ^ ^ .
For totally symmetric vibrations, the depolarisation ratio p] should lie between
0-0.75, whereas all other vibrations should be depolarised, such that pi should be
exactly 3/4. Most totally symmetric vibrational modes of compound A have p] values
between 0.15 and 0.23 (one at 0.4) - the values 0.70-0.74 are taken to indicate
depolarised bands. These values were obtained by integrating the areas under the
bands, and then taking the ratio of the value obtained with the analyser perpendicular
to the incident polarisation vector to that obtained with the analyser parallel to the
polarisation vector.
The values of the depolarisation ratios, without correction for polarisation
response, are given table 2.2. Some bands shifted position slightly on melting, but this
did not prove problematical, as their origin was quite clear.
Band position
(cm-1)
Depolarisation ratio
(PO
3081 a 2 3
3066 ?
1634 0 22
1510 0 23
1485 0 .22
1262 0 J 4
1090 0 22
1046 0 21
1018 0 .20
920 0 J 5
819 0 71
751 0 1 9
625 0 71
510 0 1 7
440 7
4 0 0 0 .42
Table 2.2 Depolarisation ratios of the melt-phase of A
54
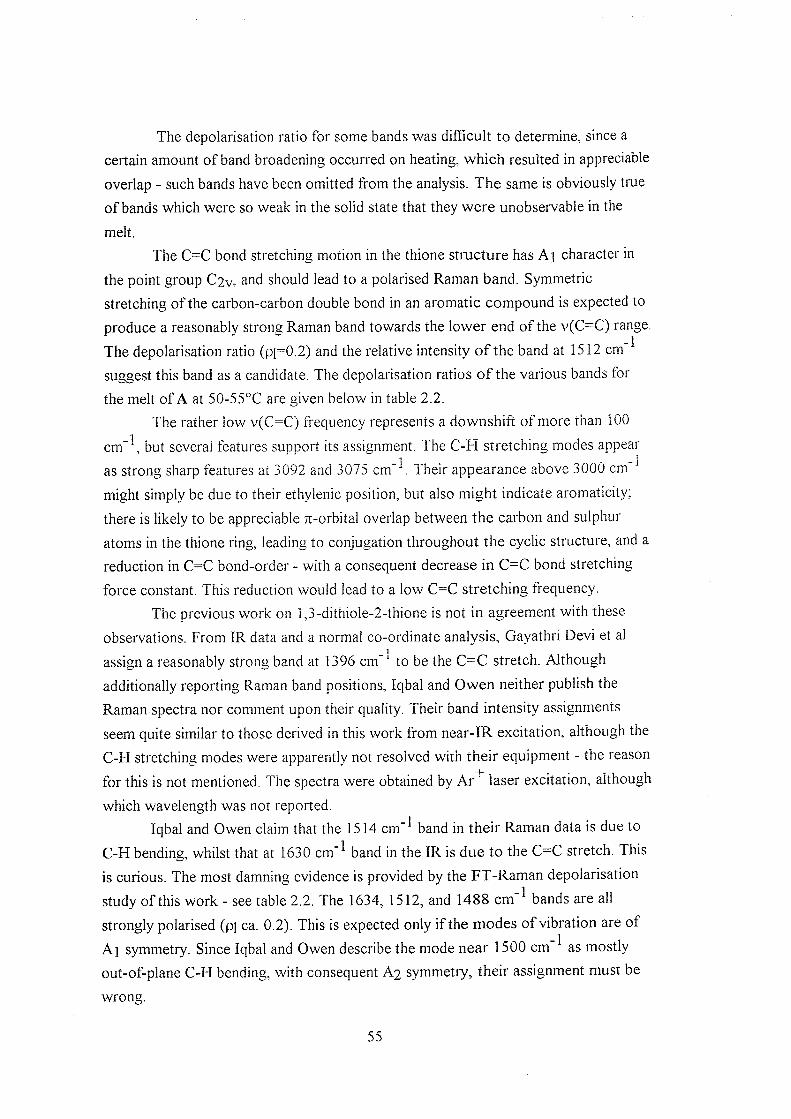
The depolarisation ratio for some bands was difficult to determine, since a
certain amount of band broadening occurred on heating, which resulted in appreciable
overlap - such bands have been omitted from the analysis. The same is obviously true
of bands which were so weak in the solid state that they were unobservable in the
melt.
The C=C bond stretching motion in the thione structure has A% character in
the point group C2v, and should lead to a polarised Raman band. Symmetric
stretching of the carbon-carbon double bond in an aromatic compound is expected to
produce a reasonably strong Raman band towards the lower end of the v(C=C) range.
The depolarisation ratio (pi=0.2) and the relative intensity of the band at 1512 cm ^
suggest this band as a candidate. The depolarisation ratios of the various bands for
the melt of A at 50-55°C are given below in table 2.2.
The rather low v(C=C) frequency represents a downshift of more than 100
cm" \ but several features support its assignment. The C-H stretching modes appear
as strong sharp features at 3092 and 3075 cm"\ Their appearance above 3000 cm ^
might simply be due to their ethylenic position, but also might indicate aromaticity;
there is likely to be appreciable TC-orbital overlap between the carbon and sulphur
atoms in the thione ring, leading to conjugation throughout the cyclic structure, and a
reduction in C=C bond-order - with a consequent decrease in C=C bond stretching
force constant. This reduction would lead to a low C=C stretching frequency.
The previous work on l,3-dithiole-2-thione is not in agreement with these
observations. From IR data and a normal co-ordinate analysis, Gayathri Devi et al
assign a reasonably strong band at 1396 cm"' to be the C=C stretch. Although
additionally reporting Raman band positions, Iqbal and Owen neither publish the
Raman spectra nor comment upon their quality. Their band intensity assignments
seem quite similar to those derived in this work from near-lK excitation, although the
C-H stretching modes were apparently not resolved with their equipment - the reason
for this is not mentioned. The spectra were obtained by Ar ' laser excitation, although
which wavelength was not reported.
Iqbal and Owen claim that the 1514 cm"* band in their Raman data is due to
C-H bending, whilst that at 1630 cm"* band in the IR is due to the C=C stretch. This
is curious. The most damning evidence is provided by the FT-Raman depolarisation
study of this work - see table 2.2. The 1634, 1512, and 1488 cm * bands are all
strongly polarised (p| ca. 0.2). This is expected only if the modes of vibration are of
A] symmetry. Since Iqbal and Owen describe the mode near 1500 cm * as mostly
out-of-plane C-H bending, with consequent A2 symmetry, their assignment must be
55

In addition, if the band at 1634 cm"* were the C=C stretch it would be
reasonable to anticipate such a band throughout the thione series, probably shifted
down in frequency by the combined mass and bonding effects of four sulphur atoms
instead of two sulphur and two hydrogen around the double bond - if previous
assignments were correct, this would suggest a band at around 1600 cm~^ shift in
other members of the thione series. Such a band was not observed. Taken with the
depolarisation ratio data of this work, and the aromaticity in the structure, the
assignment of the C=C stretching mode of A to the band at 1512 cm"^ seems firm.
Comparison against known data for the central and ring C=C bonds ofTTF^
consolidates this.
Since the 1634 cm'^ band can not also be the symmetric C=C stretch, an
assignment must be found. To aid in the interpretation, the KBr disc IR transmission
spectra of A was obtained. This involved much more effort than obtaining an FT-
Raman spectrum. To compare;
• Firstly, drying and grinding KBr to minimise water absorption and scattering of
the incident IR beam.
• Secondly, determining the correct ratio of A to KBr in the sample disc - 1:200
proved adequate (0.5 mgs A in 100 mgs KBr) avoided derivative band shapes and
low transmission.
• Thirdly, further grinding to achieve intimate mixing.
• Then the spectrometer carefully purged with dry N? gas, a background blank KBr
pressed, a spectrum obtained of both background and sample by co-adding 200
scans at 2 cm"* resolution, each requiring ca. 30 minutes.
The spectrum shown below in figure 2.3 is very good quality by KBr disc
standards. There is little evidence of water absorption, minimal scattering, and few
anomalous band shapes. The assignment of the weak 1634 cm * Raman band is
immediately suggested as the overtone of the strong IR band at 817 cm \
56
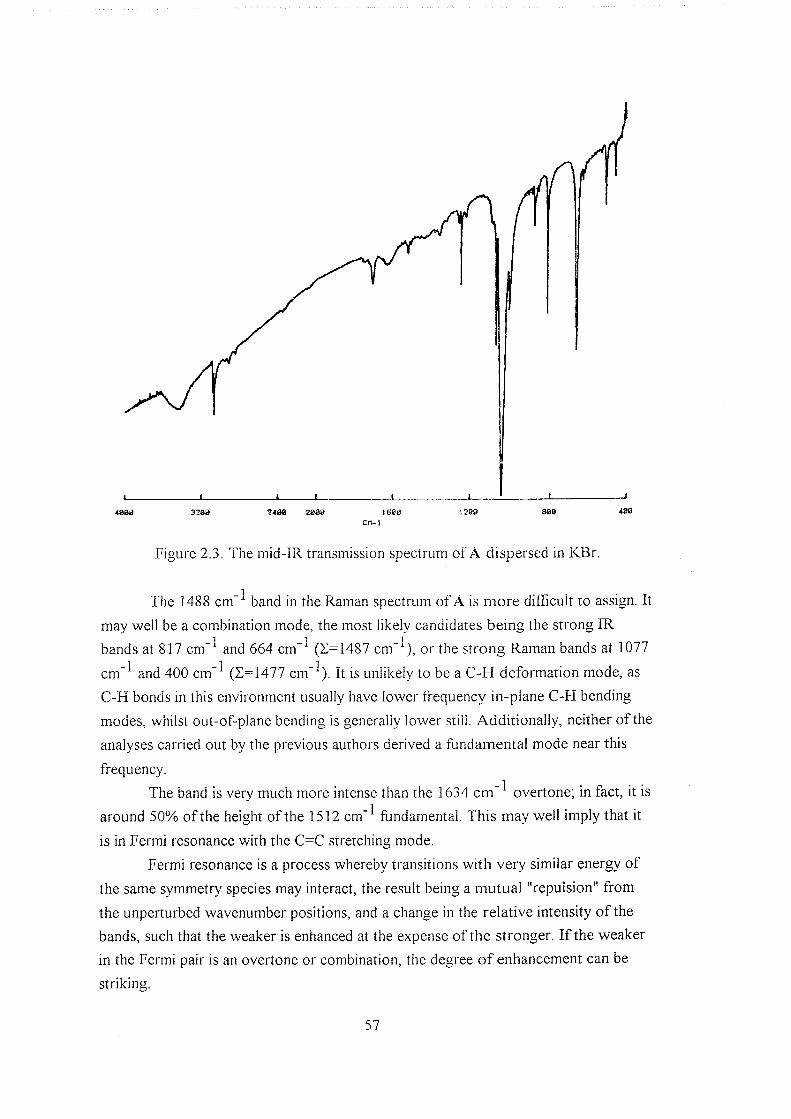
Figure 2.3. The mid-lK transmission spectrum of A dispersed in KBr,
The 1488 cm"^ band in the Raman spectrum of A is more difficult to assign. It
may well be a combination mode, the most likely candidates being the strong IR
bands at 817 cm"* and 664 cm"* (E=1487 cm"^), or the strong Raman bands at 1077
cm"* and 400 cm"* (E=1477 cm"*). It is unlikely to be a C-H deformation mode, as
C-H bonds in this environment usually have lower frequency in-plane C-H bending
modes, whilst out-of-plane bending is generally lower still. Additionally, neither of the
analyses carried out by the previous authors derived a fijndamental mode near this
frequency.
The band is very much more intense than the 1634 cm"* overtone; in fact, it is
around 50% of the height of the 1512 cm"* fundamental. This may well imply that it
is in Fermi resonance with the C=C stretching mode.
Fermi resonance is a process whereby transitions with very similar energy of
the same symmetry species may interact, the result being a mutual "repulsion" from
the unperturbed wavenumber positions, and a change in the relative intensity of the
bands, such that the weaker is enhanced at the expense of the stronger. If the weaker
in the Fermi pair is an overtone or combination, the degree of enhancement can be
striking.
57
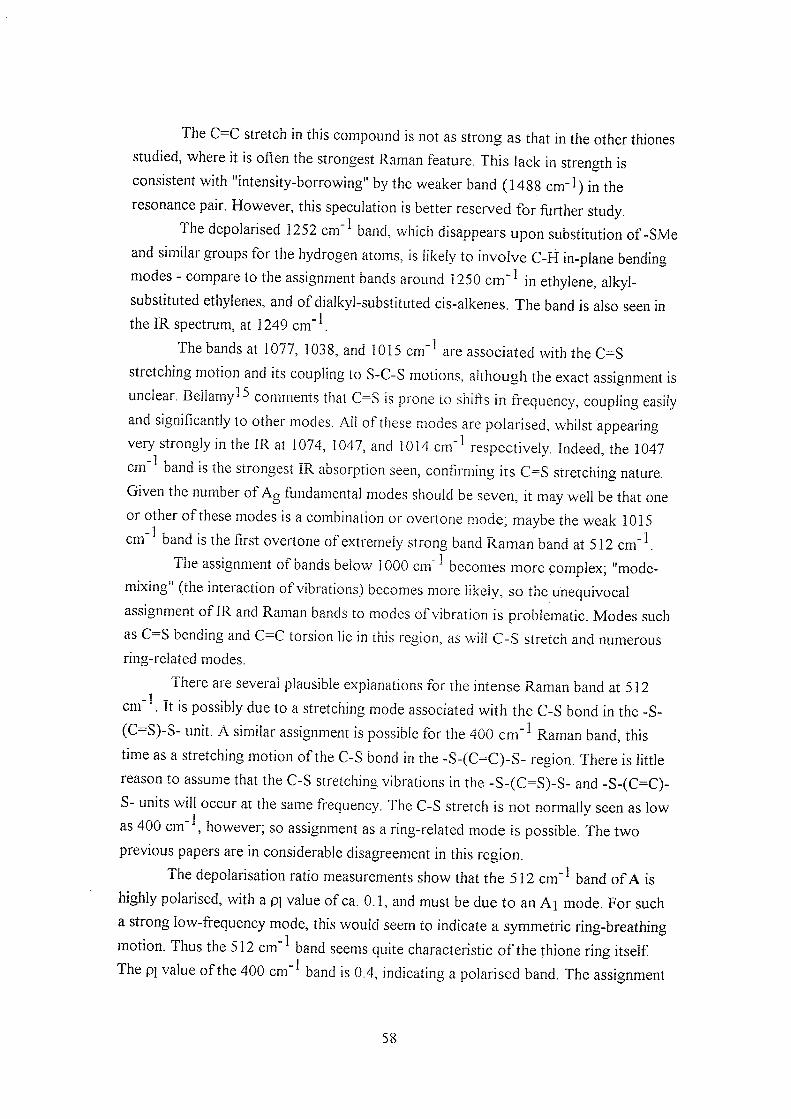
The C C stretch in this compound is not as strong as that in the other thiones
studied, where it is often the strongest Raman feature. This lack in strength is
consistent with "intensity-borrowing" by the weaker band (1488 cm-1) in the
resonance pair. However, this speculation is better reserved for further study.
The depolarised 1252 cm band, which disappears upon substitution of-SMe
and similar groups for the hydrogen atoms, is likely to involve C-H in-plane bending
modes - compare to the assignment bands around 1250 cm"^ in ethylene, alkyl-
substituted ethylenes, and of dialkyl-substituted cis-alkenes. The band is also seen in
the IR spectrum, at 1249 cm"\
The bands at 1077, 1038, and 1015 cm"^ are associated with the C=S
stretching motion and its coupling to S-C-S motions, although the exact assignment is
unclear, ijeliamy^^ comments that C=S is prone to shifts in frequency, coupling easily
and significantly to other modes. All of these modes are polarised, whilst appearing
very strongly in the IR at 1074, 1047, and 1014 cm'^ respectively. Indeed, the 1047
cm Dana is tne strongest IK aosorption seen, confirming its C=S stretching nature.
Given the number of Ag ftindamental modes should be seven, it mav well be that one
or other of these modes is a combination or overtone mode; maybe the weak 1015
cm ^ band is the first overtone of extremely strong band Raman band at 512 c m ' \
The assignment of bands below 1000 cm ^ becomes more complex; "mode-
mixing (the interaction of vibrations) oecomes more likely, so the unequivocal
assignment of IR and Raman bands to modes of vibration is problematic. Modes such
as C—S bending ana C—l, torsion lie in this region, as will C-S stretch and numerous
ring-related modes.
There are several plausible explanations for the intense Raman band at 512
cm ^ It is possibly due to a stretching mode associated with the C-S bond in the -S-
(C=S)-S- unit. A similar assignment is possible for the 400 cm"^ Raman band, this
time as a stretching motion of the C-S bond in the -S-(C=C)-S- region. There is little
reason to assume that the C-S stretching vibrations in the -S-(C=S)-S- and -S-(C=C)-
S- units will occur at the same frequency. The C-S stretch is not normally seen as low
as 400 cm , however; so assignment as a ring-related mode is possible. The two
previous papers are in considerable disagreement in this region.
The depolarisation ratio measurements show that the 512 cm"^ band of A is
highly polarised, with a pi value of ca. 0.1, and must be due to an A% mode. For such
a strong low-frequency mode, this would seem to indicate a symmetric ring-breathing
motion. Thus the 512 cm ^ band seems quite characteristic of the thione ring itself
The p] value of the 400 cm ^ band is 0.4, indicating a polarised band. The assignment
58
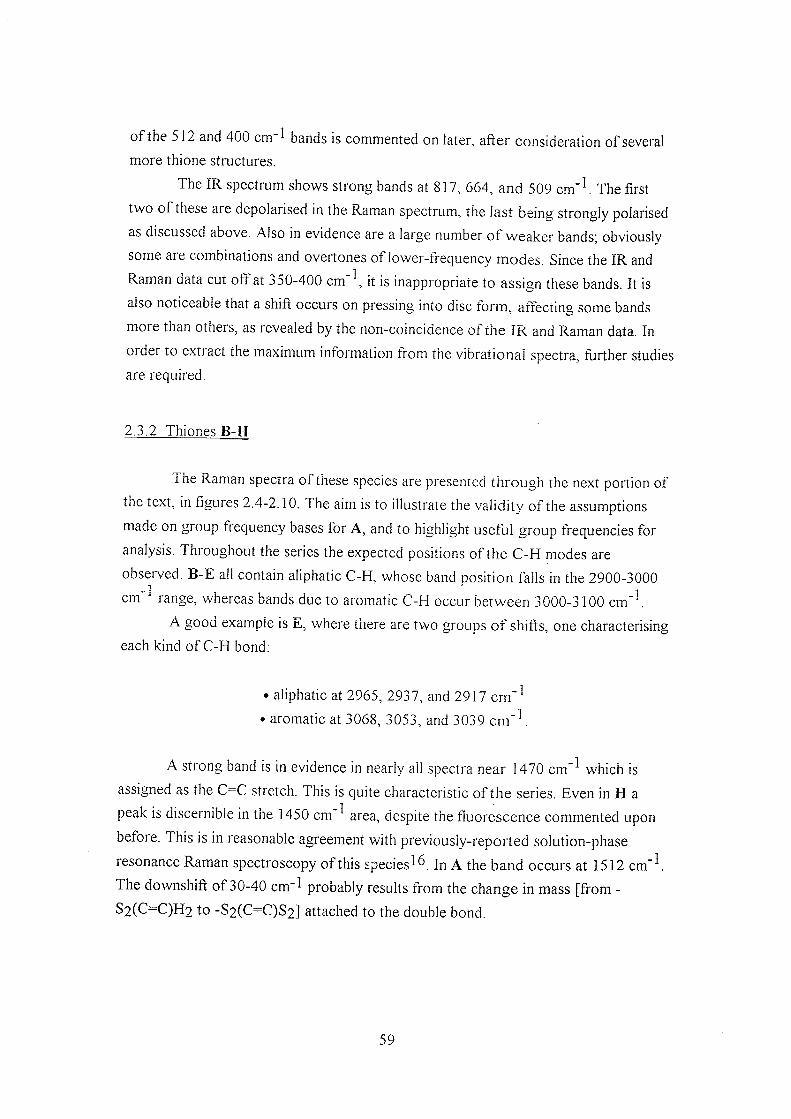
of the 512 and 400 cm ^ bands is commented on later, after consideration of several
more thione structures.
The IR spectrum shows strong bands at 817, 664, and 509 cm" . The first
two of these are depolarised in the Raman spectrum, the last being strongly polarised
as discussed above. Also in evidence are a large number of weaker bands; obviously
some are combinations and overtones ot lower-frequency modes. Since the IR and
Raman data cut oflFat j50-400 cm \ it is inappropriate to assign these bands. It is
also noticeable that a shift occurs on pressing into disc form, affecting some bands
more than others, as revealed by the non-coincidence of the IR and Raman data. In
order to extract the maximum information from the vibrational spectra, further studies
are required.
2.3.2 Thiones B-H
ihe Raman spectra of these species are presented through the next portion of
the text, in figures 2.4-2.10. The aim is to illustrate the validity of the assumptions
made on group frequency bases for A, and to highlight useful group frequencies for
analysis. Throughout the series the expected positions of the C-H modes are
observed. B-E all contain aliphatic C-H, whose band position falls in the 2900-3000
cm" range, whereas bands due to aromatic C-H occur between 3000-3100 cm"\
A good example is E, where there are two groups of shifts, one characterising
each kind of C-H bond:
. aliphatic at 2965, 2937, and 2917 cm"^
* aromatic at 3068, 3053, and 3039
A strong band is in evidence in nearly all spectra near 1470 cm"^ which is
assigned as the C=C stretch. This is quite characteristic of the series. Even in H a
peak is discernible in the 1450 cm ^ area, despite the tluorescence commented upon
before. This is in reasonable agreement with previously-reported solution-phase
resonance Raman spectroscopy of this species In A the band occurs at 1512 cm"^.
The downshift of 30-40 cm"^ probably results from the change in mass [from -
S2(C=C)H2 to -S2(C=C)S2] attached to the double bond.
59
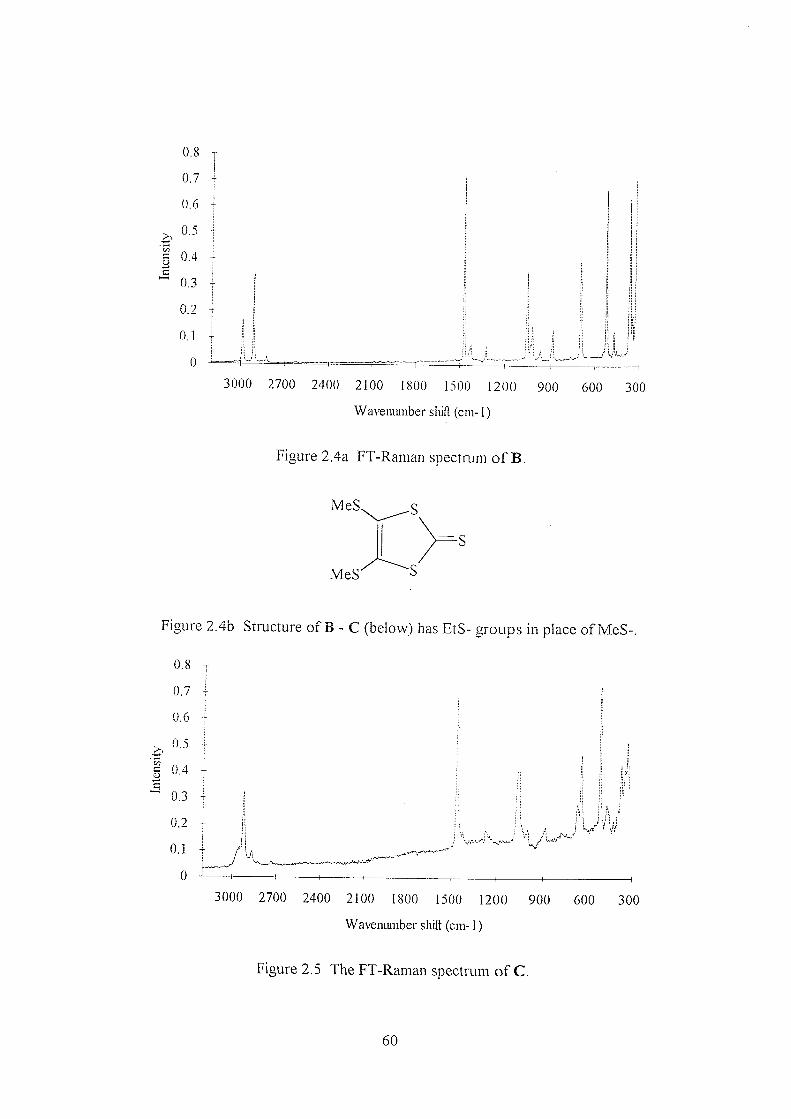
0.8
0,7
0.6
0.5
0.4
0.3
0^ -
0.1
0
3000 2700 2400 2100 1800 1500 1200 900 600 300
Waveiuuiiber shift (cm-1)
Figure 2.4a FT-Rainan soectrum of B.
RdeS'
Figure 2.4b Structure of B - C (below) has EtS- groups in place of MeS-.
0.8
0.7
0.6
§ &4
^ OJ
0.2
0.1
0
I
—H-
3000 2700 2400 2100 1800 1500 1200 900 600 300
Waveniuiiber sliift (cm-1)
Figure 2.5 The FT-Raman spectrum of C.
60

4 5 T
4
3.5
3
2.5
2
1.5
1
0.5
0
3000 2700 2400 2100 1800 1500 1200 900 600 300
Wavemmiber sliifl (cm-1)
Figure 2.6a The FT-Raman spectrum of D.
0.3
0 25
8 0.15
0.1
0 05
0 L
Figure 2.6b Structure of D.
1
3000 2700 2400 2100 1800 1500 1200 900
Waveniuiiber shift (cm-1)
Figure 2.7a The FT-Raman spectrum of E.
600 300
61

Figure 2.7b Structure of E.
0 5 T
0.45 '
0.4
0J5
^ 0 3
= 0^) 0.2
0 15
0 , 1
0 05
0
3000 2700 2400 2100 1800 1500 1200 900 600 300
Wavemunber shift (cm-1)
Figure 2.8a The FT-Raman spectrum of F.
Figure 2.8b Structure of F.
62

0.3
0.2
&15
0.1 -
&05
0 I , A!
3000 2700 2400 2100 1800 1500 1200 900 600 300
Waveiumiber shift (cm-1)
Figure 2.9a The FT-Raman spectrum of G.
C6H3(N02)2
CeHsCNO])]—S'
025
0.2
5
3 01
0.05
0
Figure 2.9b Structure of G.
/ /
\
•'yrtiiA,
3000 2700 2400 2100 1800 1500 1200 900 600 300
Waveniuiiber shift (cm-1)
Figure 2.10a The FT-Raman spectrum of H.

Figure 2.10b Structure of H.
In G the relative intensity of the C=C stretching band is low. G also has weak
C-H bands, relative to the other compounds containing "aromatic" hydrogen. 2.4-
dmitrobenzene shows similar behaviour, implying that the presence of nitro-groups on
the benzene ring reduce the intensity of the aromatic C-H bands. The presence of
dinitrophenyl groups seems to dominate other strongly-scattering groups such as C=C.
The first point to be made about the other bands around 1400 cm"^ shiA is the
disappearance of those near 1488 and 1252 cm'^ in A which are C-H related. C-H
deformation modes (in-plane and out-of-plane methylene and methyl bends) in those
species with methyl groups would lie in this region - for instance, the spectra of B and
C exhibit these bands, albeit weakly.
The second point concerns those compounds which have functional groups
with group-frequencies between 1800-1000 cm'^ including (-C=0), (CgHg-), and (-
NO2). These features appear at shifts predicted by group frequency arguments, and
seem little affected by the cyclic thione structure. In cases where the assignment is
ditricult due to lack of specific information on a given side group, comparison with
spectra of closely related species is of help - comparing G with 2,4-dinitrobenzene,
for instance, helps identify the bands due to the -S(C6H3(N0)2) side group.
Comparison against similar species aids in the interpretation of the region
around 1070 cm'^. Ethylene trithiocarbonate has u(C=S) at 1074 cm'^ in the IR.15
Considenng the similanty of the thione ring structure and the fact that C=S stretch
generally falls into the 1200-1050 cm ^ region, the assignment of a band around
1070-1060 cm to the stretching mode of the exocyclic C=S bond seems convincing
- and supported by the FT-Raman spectrum of ethylene trithiocarbonpte.
64

3
2.5
2
1.5
J , 0.5
0
-0.5
"Y" —r:
3000 2700 2400 2100 1800 1500 1200 900 600 300
Wavenmiiber shift (cm-1)
Figure 11a FT-Raman spectrum of ethylene trithiocarbonate.
Figure l i b Structure of ethylene trithiocarbonate.
Two strong bands in the C-S stretching region at 1046 cm"^ and 1068 cm"^
are prominent in this spectrum. Two more strong bands appear at 506 cm"! and 386
cm . These are clearly ring-related, involving primarily C=S motion, since they are
reasonably insensitive to the substitution of a single for a double carbon-carbon bond.
The strongest band in the spectrum is at 2919 cm \ a C-H stretching mode. A
slightly weaker C-H stretch appears near 2971 cm" \ both bands having prominent
shoulders to higher shift. The downshift of the C-H frequencies is clearly related to
the change from double to single C-C bonding with subsequent decrease in
aromaticity. The C-H deformation modes near 1425 cm~^ are plainly visible, although
not so in the spectra of the thione A.
An intriguing feature of the comparison between the "saturated" ethylene
trithiocarbonate (figure 2.1 lb) and the "unsaturated" vinylene trithiocarbonate (figure
2.2a) is the higher intensity scattering from the saturated species. Indeed, the
scattering from the former is ca. 5-fold greater than that of the latter, the comparison
being made by summing the area under the bands near 500 and 400 cm"\ which are
65

indicative of the trithiocarbonate ring. This differs from the empirical rule that
aromatic systems are more strongly Raman active than saturated systems, resonance Raman effects notwithstanding.
The thiones studied all show several peaks in the C=S stretch region. This
may imply that coupling of the C=S stretch occurs to other modes, as Bellamy
suggests, or that combination modes are involved.
Iqbal and Owen report three Raman bands for A:
• 1076(w) - C=S stretch
. 1038(m) - combination of-S-(CS)- stretch and -S-(CS)- in-plane bend • 1008(w) - -S-(CS)- stretch
Devi and Sathyanarayana report three IR bands;
. 1079 - out-of-plane C-H bend with C=S stretch
• 1050 - C—S stretch with -S-(CS)- stretch and ring deformation
• 1015 - unassigned
these disagreements underline the difficulty in making unambiguous
assignments, and the ambiguity that can arise using models with many possible
solutions. Nevertheless, the 1070-1000 cm ^ region is indicative of the C=S stretch
and modes unassigned concerning the ring, and is therefore useful in fingerprinting
each of the series.
It would perhaps be better to call the C-S stretching region the true fingerprint
region of the spectrum, because apart from a strongly Raman active band at 510-530
cm in all compounds there is strikingly little in common between the spectra. On
examination ot the series, the assignment of the band at around 500 cm'^ to a mode
involving -S-(C—S)-S- and not to -S-(c=C)-S- is proposed purely on simple
mechanical arguments - and is suggested by the stability of this band's position with
respect to substitution on the C=C bond; it is quite characteristic of the thione ring
structure. In a similar way, the band that appears in A near 400 cm"^ may be
identified with a mode involving -S-(C=C)-S- because this band appears greatly
dependant on the exact substitution at the C=C bond.
The methodology to assign the low-shift region is to look for correlation in
intensity, position, and band shape between compounds of similar structure, such as B
and C, and D and E. Certain features are shared:
i. 890 cm (w) - apparent as a weak single peak, split into a weak doublet in E.
ii. 700-670 cm (mw) - in B: sharp close doublet, in C: two peaks of different
intensity separated by 28 cm"^; in D: two peaks of equal intensity separated by 32
cm \ in E; only one peak.
iii. 510-5j0 cm ^ (mw-ms) - always a sharp single peak.
66
iv. 3 80-J20 cm (mw) - closely replicated between the two pairs.
A further characteristic of this region is a weak feature at around 470 cni"\
possibly combined with a very weak feature at lower shifts, around 430 c m ' ^ In
some spectra this feature is not well-resolved and very weak
It may prove possible after further study to predict the whereabouts of the C-
S stretchmg modes for the side groups by analogy to the thiol series, R-SH. As a
simple example, consideration of the mercaptans MeSH and EtSH suggests S-Me
should be near 700 cm ^ and S-Et near 650 cm" \ Bands are indeed observed in these
positions, the former in B, the latter in C.
2.3.3 Comparison of thione B. oxone I. and TTF T
In general', oxones are prepared from thiones by treating the thione with
mercuric acetate, Hg(0Ac)2, whereas TTFs are prepared from either thione or oxone
by coupling with triethylphosphite, P(0Et)3. The most obvious question to ask is
wnether Raman specti oscopy can easily differentiate between the three forms -
oxone, thione, and TTr. i o provide a starting point, the first set of comparisons to be
made involved B. the symmetric SMe- analogue of thione A (figure 2.4); I, the
symmetric SMe analogue of the oxone ],3-dithiole-2-one (figure 2.12); and J, the
symmetric SMe- analogue of TTF (figure 2.13).
Several features are immediately obvious on comparison:
• Substituting (C=0) for (C=S) decreases the C-H stretching frequencies by
only 2 - 5 cm . Since the C-H bonds are well-removed mechanically from the C=X
bond (X—0,S), the implication that the shift is due to higher aromaticity in -SMe-
thione than in -SMe-oxone.
• The C - C stretching frequency in B (C=S) is 14 cm"^ lower than in I (C=0);
however, this could also imply that I has is less aromatic than J, although the
C=C mode will also be influenced by the change in mass.
• The TTF J has two more peaks than B in the C=C stretching region, at 1554 and
1542 cm . Following the assignments previously made'^, the bridging C=C bond
is probably the lowest of the three. The doubling of the higher-shift band is
possibly caused by Fermi resonance with a combination band.
• Synthetic details kindly supplied by Dr. J.D. Kilburn
67
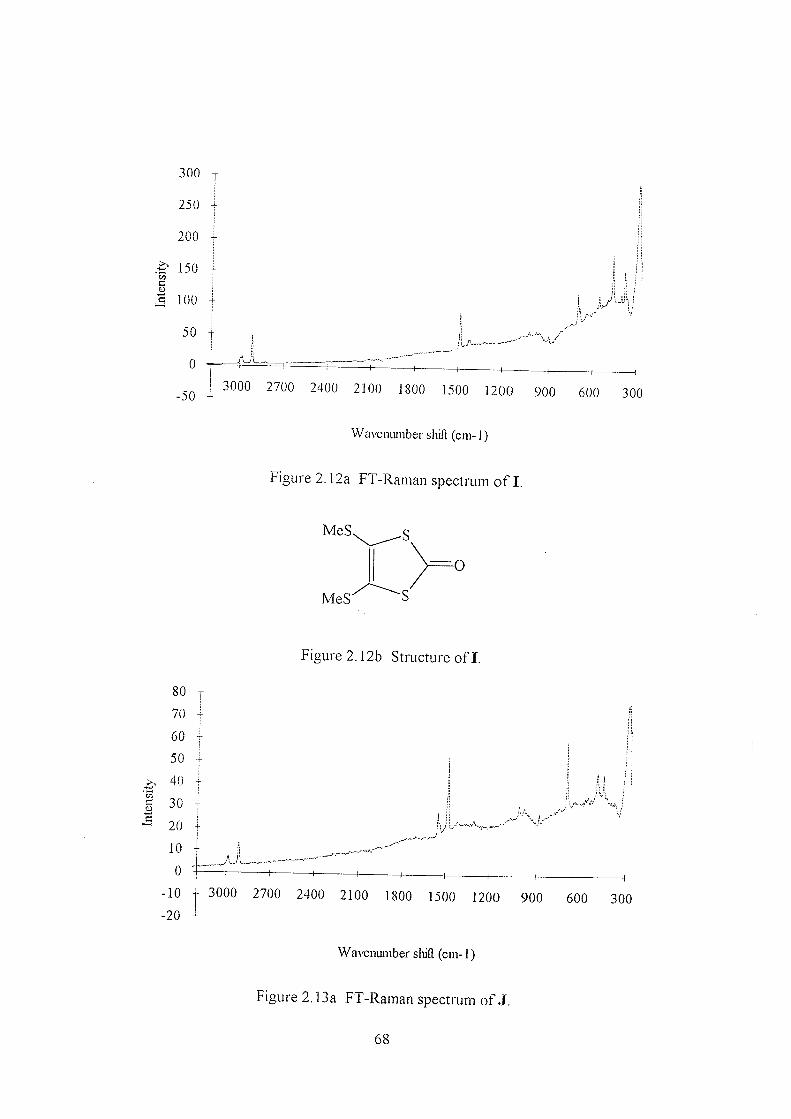
300
250
200
150
I C 100
50
0
-50 3000 2700 2400 2100 1800 1500 1200 900 600 300
Waveiuuiiber shift (cm-1)
Figure 2.12a M -Raman spectrum of I,
MeS
O
rdesr
Figure 2.12b Structure of I.
80
70
60
50
a, 40
1 30
- 20
10
0
- 1 0
- 20
3000 2700 2400 2100 1800 1500 1200 900 —I 1 600 300
Waveniuiiber sliift (cm-1)
Figure 2.13a FT-Raman spectrum of J .
68

NkS S S
Figure 2.13b Structure of J.
• A band is visible in the -SMe-oxone at 1658 cm . This is probably the weak C=0
stretching mode, as an upshift of ca. 600 cm ^ is in order for the change from
C=S to C=0.
. Features present in B around 1420 cm"' and 1320 cm" ^ are still visible in both J
and I. This suggests they are concerned with the -SMe groups, probably due to -
CH3 deformation motions.
ubviousiy, the C=S stretching region is significantly different in J and I - in
the latter the sulphur is exchanged for oxygen, whereas the former is a TTF. The
bands near 700 cm ^ in all three spectra are probably due to C-S stretching in the
SMe side groups, as indicated above by comparison to the C-S stretch of methyl
mercaptan (MeSH).
The most striking difference between the spectra is the disappearance of the
characteristic thione ring-related 510 cm ^ band in B. In J bands appear at 495 and
450 cm ^ - in I, at 465 and 381 cm ^ - but none in either case around 510 cm"^. The
disappearance of this thione ring mode could therefore be the basis of a technique for
determining the success of TTF syntheses from thione precursors.
To summarise the conclusions from the first ten compounds to be studied -
the number of differences between the spectra allows for facile discrimination
between thione, oxone, and TTF - exactly as required for a routine analytical test.
2.3.4 Further comparisons - thiones
Over the course of the year (1992) following the initial study, many further
compounds were synthesised. Some of these proved intractable due to fluorescence
or pyrolysis. However, the vast majority (>90%) of the new compounds were
amenable to study. A selection of these results are presented and discussed below, to
illustrate the points made above and test them further.
69
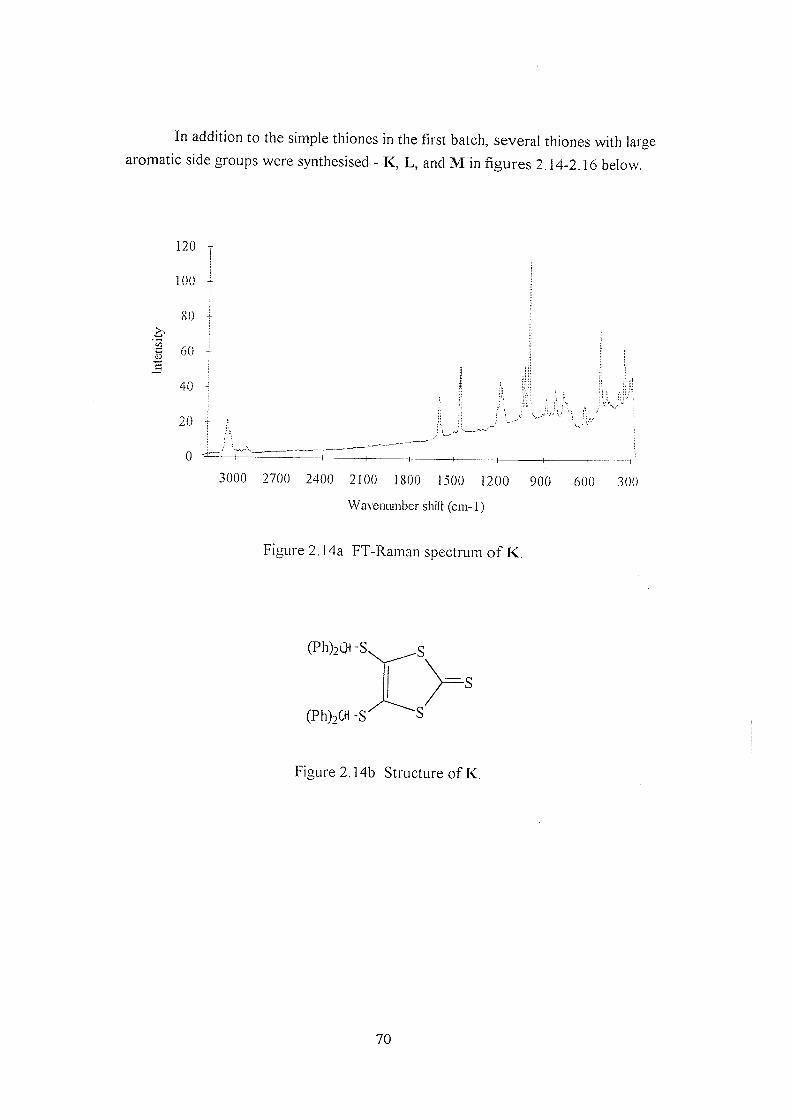
In addition to the simple thiones in the first batch, several thiones with large
aromatic side groups were synthesised - K, L, and M in A^res 2.14-2.16 below.
120
100
80
§ 60
40
20
0
3000 2700 2400 2100 1800 1500 1200 900 600 300
Wn^eniunber siiifl (cm-1)
higure 2.14a FT-Rarnan soectrum of K.
(PhhOI-S.
(Ph)2CH -S'
Figure 2.14b Structure of K.
70
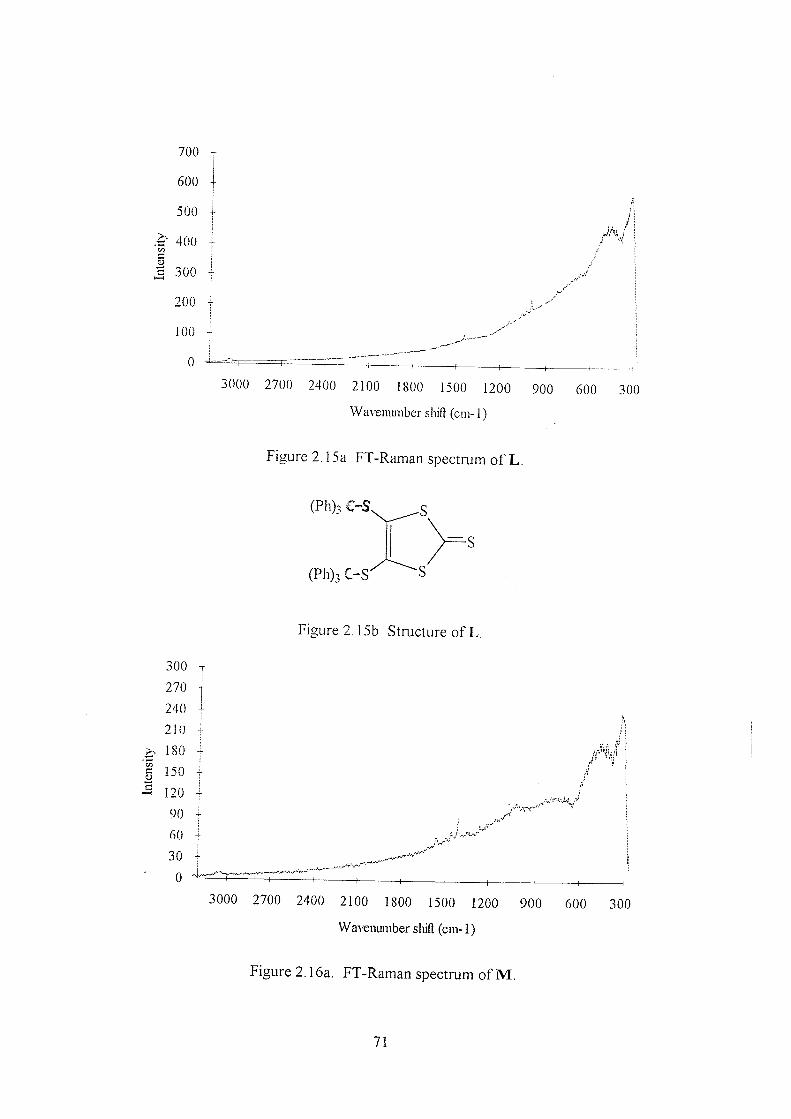
700
600
500
400 '0 5
a 300
200
100
0
(Ph)3 C-S'
Figure 2.15b Structure of L.
300 270 240 210
& 180
I 150
- 120
90 60 -
30 0
3000 2700 2400 2100 1800 1500 1200 900 600 300
Wavemunber shift (cm-1)
Figure 2.15a FT-Raman spectrum of L.
(Ph)3 C-S,
3000 2700 2400 2100 1800 1500 1200 900
Waveniuiiber shift (cm-1)
Figure 2.16a. FT-Raman spectrum of M .
600 300
71

Figure 2.16b Structure of M.
The hrst of these three new compounds - K, with (Ph)2CHS- sidegroups -
scattered reasonably strongly, with many peaks clearly resolvable. Phenyl groups are quite definitely indicated by:
• Ring breathing at 1006 cm"^
« C-H deformations around 1188 cm"^
» Fermi-coupled ring stretches at 1605 and 1583 cm"^
" Aromatic C-H stretch at 3060 cm'^
Without having to resort to finding the characteristic frequencies of the
(Ph)2CH- group, this compound can be differentiated from the other thiones studied
by the apparently symmetric doublet at 1463 and 1455 cm"^ shift - the first example
of such a splitting in the series studied. Thione character is confirmed by the presence
of a strong band at 520 cm'^. It should be noted that despite the large mass of the
side groups, the C=C mode of the thione ring still occurs around 1470 cm"^ shift.
L and M do not give such clear spectra - although the same colour and
crystallimty as K, the two samples fluoresced strongly. Nevertheless, weak bands are
still discernible. However, the 1445 cm"^ band is now difficult to assign to
thione ring C=C, since no other thione-specific bands are in evidence, such as the 510
cm nng mode; the 1445 cm"^ feature may be due to a side group mode. The
spectrum of M is little help; it seems to be dominated by side group bands exclusively
the strongest Raman band of the anthracene-derived side group is barely in evidence
at 1413 cm" shift, yet is the strongest Raman band. The fluorescence may well be
associated with real long wavelength absorption in these materials rather than due to
72
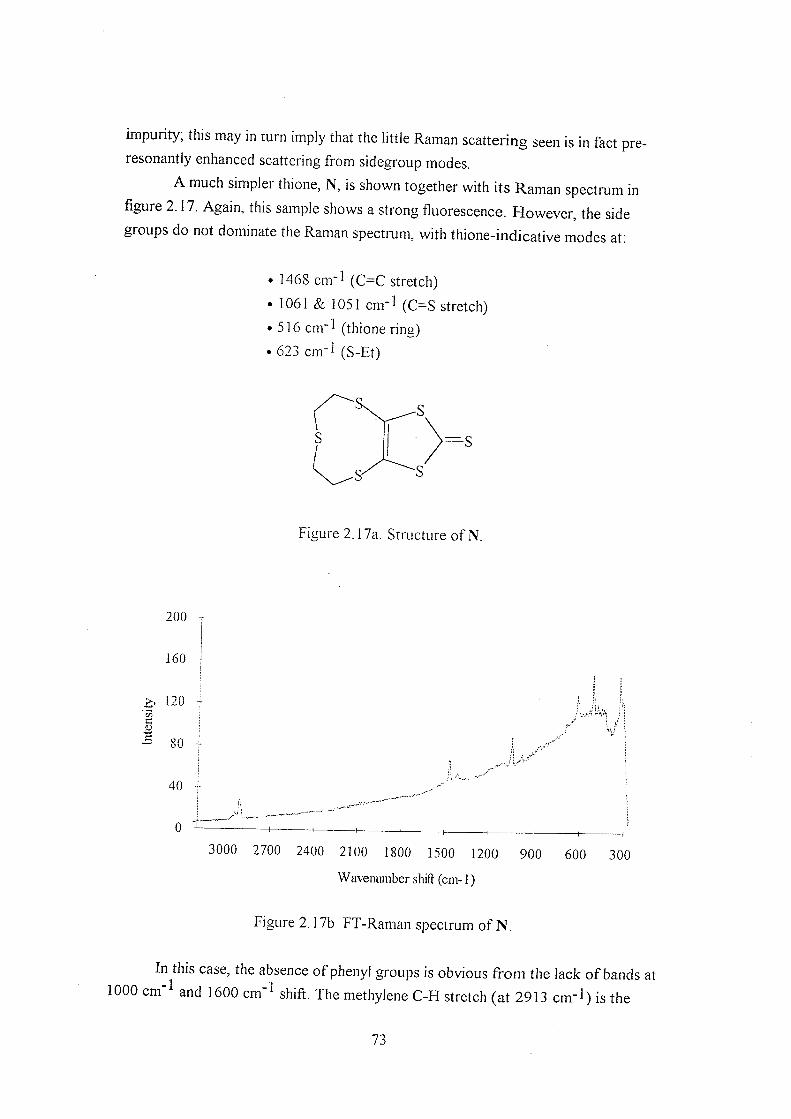
impurity; this may in turn imply that the little Raman scattering seen is in fact pre-
resonantly enhanced scattering from sidegroup modes.
A much simpler thione, N, is shown together with its Raman spectrum in
figure 2.17. Again, this sample shows a strong fluorescence. However, the side
groups do not dominate the Raman spectrum, with thione-indicative modes at:
• 1468 cm'l (C=C stretch)
• 1061 & 1051 cm"l (C=S stretch)
• 516 cm"] (thione ring)
. 623 cm-1 (S-Et)
200
160
a. 120
I ^ 80
40
Figure 2.17a. Structure of N.
3000 2700 2400 2100 1800 1500 1200 900 600 300
Wavenimiber shift (cm-1)
Figure 2.17b FT-Raman spectrum of N.
In this case, the absence of phenyl groups is obvious from the lack of bands at
1000 cm ^ and 1600 cm" shift. The methylene C-H stretch (at 2913 cm" 1) is the
73

strongest high-shift mode. The cyclic side group is difficult to distinguish, the band at
1414 cm ^ shift possibly due to the methylene C-H deformation vibration of the -
(CH2-CH2)- linkages between the sulphur atoms of the side group.
Continuing the theme of cyclic side groups, the two crown thiones O and P
shown in figures 2.18 and 2.19 represent the next step in complexity.
013 -'g B £ 0.1 -
0.05 -
3000 2700 2400 2100 1800 UOO 1200 900 600 300
Wa\'eni.uiiber sliift (cm-1)
Figure 2.18a FT-Raman spectrum of O.
Figure 2.18b Structure of O.
74

aoi6
aoi4
aoi2 ^
^ 0.01
g 0.008
" 0 0 0 6 -
&004 -
0 002
0 —I
% UW
3000 2700 2400 2100 1800 1500 1200 900
Waveiuunber sliift (cm-1)
Figure 2.19a FT-Rainan soectaim of P.
600 300
Figure 2.19b Structure of P.
Despite many recrystallisations u always showed strong fluorescence. The
tricks of "burning out" and "bleaching" the fluorescence often used in conventional
Raman methods were tried unsuccessfully. Still in evidence, albeit weakly, is the C=C
stretch of the thione ring - quite characteristically at 1468 cm ^. p, on the other hand,
has a far clearer Raman spectrum. Using the rules developed so far;
. The phenyl ring in the crown is confirmed by 3061, 1605 & 1583, and 1006 cm"^
• The thione ring structure is confirmed by 888, 514, and 372 cm'^
• Other bands of note; C=C appears at 1461 cm"^, C=S appears at 1046 cm'^'
The last example of a thione to be considered is Q, shown in figure 2.20. This
is another simple symmetric thione, without cyclic or bridging side groups. Once
again;
. Thione-indicative bands at 1462, 893, 327 and 523 cm"^ are quite plain
75
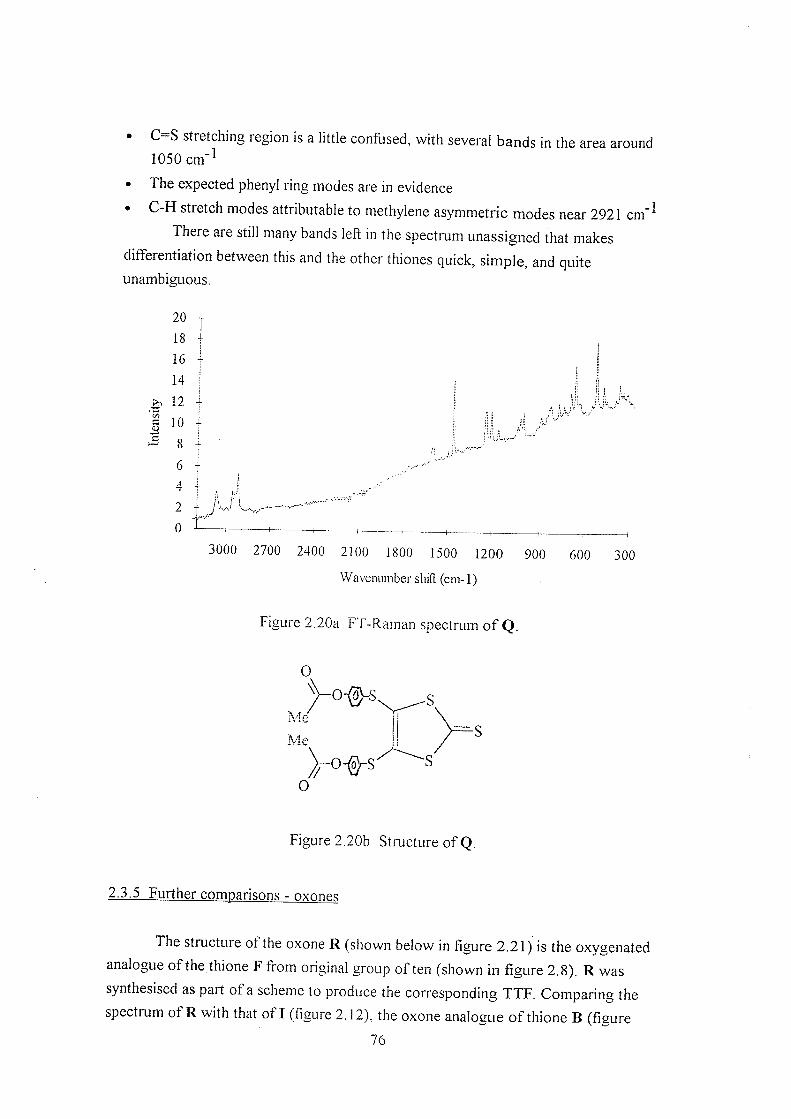
• C S stretching region is a little confused, with several bands in the area around 1050
• The expected phenyl ring modes are in evidence
• C-H stretch modes attributable to methylene asymmetric modes near 2921 cm"*
There are still many bands left in the spectrum unassigned that makes
diaerentiation between this and the other thiones quick, simple, and quite unambiguous.
20
18
16
14
12
# 10
u
3000 2700 2400 2100 1800 1500 1200 900
Waveniuiiber shift (cm-1)
600 300
Figure 2,20a Fl-Raman spectrum of Q.
Figure 2.20b Structure of Q.
2.3.5 Further comparisons - nxnnes
The structure ot the oxone R (shown below in figure 2.21) is the oxygenated
analogue of the thione F from original group often (shown in figure 2.8). R was
synthesised as part of a scheme to produce the corresponding TTF. Comparing the
spectrum of R with that of I (figure 2.12), the oxone analogue of thione B (figure
76
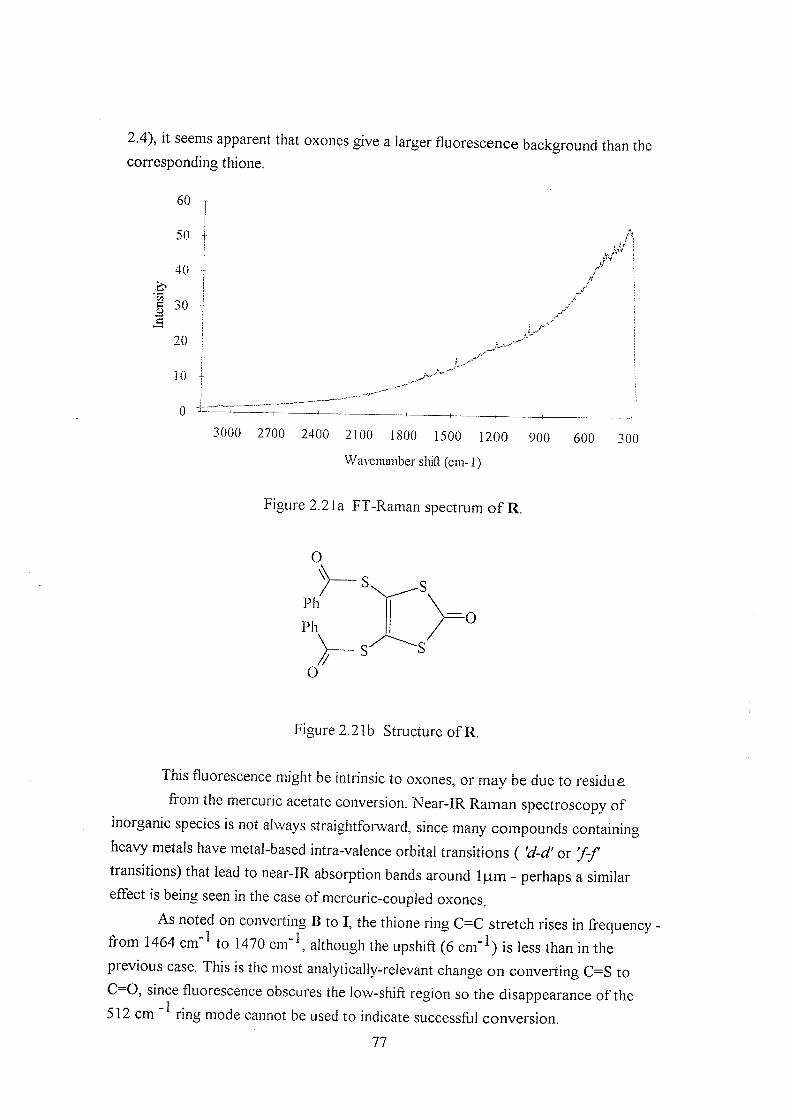
2.4), it seems apparent that oxones give a larger fluorescence background than the corresponding thione.
I
60
50
40
30
20
10 -
3000 2700 2400 2100 1800 1500 1200 900 600 300
Waveiuuiiber shift (cm-1)
Figure 2.21a FT-Raman spectrum of R.
Figure 2.21b Structure of R.
This fluorescence might be intrinsic to oxones, or may be due to residue
from the mercuric acetate conversion. Near-IR Raman spectroscopy of
inorganic species is not always straightforward, since many compounds containing
heavy metals have metal-based intra-valence orbital transitions ( 'd-d' or 'f-f
transitions) that lead to near-IR absorption bands around 1 j.im - perhaps a similar
effect is being seen in the case of mercuric-coupled oxones.
As noted on converting B to I, the thione ring C=C stretch rises in frequency
from 1464 cm to 1470 cm \ although the upshift (6 cm"^) is less than in the
previous case. This is the most analytically-relevant change on converting C=S to
C~0, since fluorescence obscures the low-shift region so the disappearance of the
512 cm ring mode cannot be used to indicate successftil conversion.
77
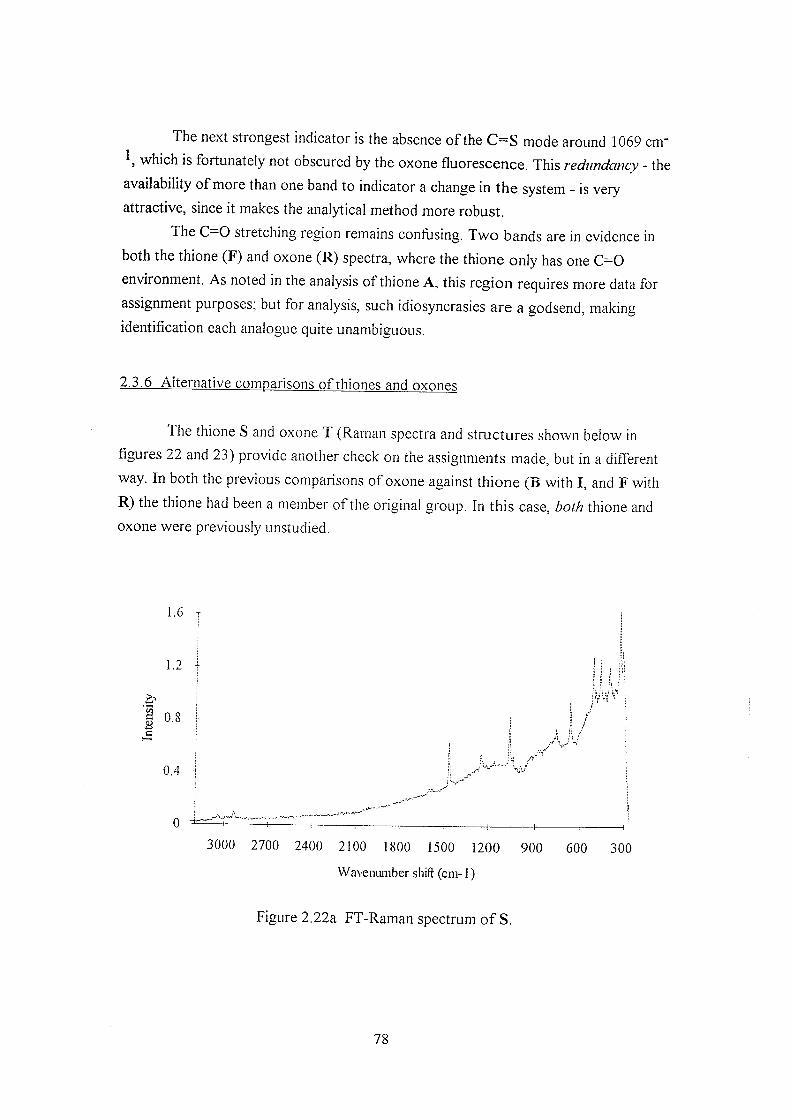
The next strongest indicator is the absence of the C=S mode around 1069 cm"
which is fortunately not obscured by the oxone fluorescence. This redundaticv - the
availability of more than one band to indicator a change in the system - is very
attractive, since it makes the analytical method more robust.
The C—O stretching region remains confusing. Two bands are in evidence in
both the thione (F) and oxone (R) spectra, where the thione only has one C=0
environment. As noted in the analysis of thione A, this region requires more data for
assignment purposes, but for analysis, such idiosyncrasies are a godsend, making
identification each analogue quite unambiguous.
2.3.6 Alternative comparisons of thiones and oxones
The thione S and oxone T (Raman spectra and structures shown below in
figures 22 and 2 j ) provide another check on the assignments made, but in a different
way. In both the previous comparisons of oxone against thione (B with I, and F with
R) the thione had been a member of the onginai group. In this case, both thione and
oxone were previously unstudied.
1.6
1.2
I 0.8
0.4
3000 2700 2400 2100 1800 1500 1200 900 600 300
Waveniuiiber shift (cm-1)
Figure 2.22a FT-Raman spectrum of S.
78

Figure 2.22b Structure of S.
25
20
^ 15
§ 3 10
3000 2700 2400 2100 1800 1500 1200 900 600 300
Waveniuiiber shift (cm-1)
Figure 2.23a FT-Raman spectrum of T.
Figure 2.23b Structure of T.
It has been shown that the band near 510 cm"' peculiar to the thione ring
disappears on conversion to the oxone. This is consistent with the 514 cm"^ band in S
not being evident in T. In place of the prominent thione band at 1070 cm"^ shift, one
appears in the oxone at 1674 cm \ This confirms the change of exocyclic substitution
from (C=S) to (C=0). The thione ring bands at 668 and 468 cm~^ change very little
on conversion to the oxone, appearing at 665 and 463 cm" ^, indicating that they
involve little motion of the exocyclic bond, and are possibly localised around the C=C
79

double bond. Although very weak, the phenyl-associated modes at around 1600 cm'^ shift are just resolvable in both spectra
A reduction of aromaticity was proposed as a consequence of conversion,
based upon a shift in C=C stretching frequency. This is consistent, the 1466 cm'^
band in S moving upwards to 1488 cm" in T. The C-H stretching region provides an
indication of aromaticity, with the phenyl (C-H) stretching bands at 3046 and 3047
cm shift respectively. These two analogues do indicate, however, that the
assessment of aromaticity on the basis of C-H band position needs extra study; the
three bands in the thione at 3047, 2985, and 2934 cm'^ all shift up in ft-equency to
3047, 2987, and 2941 cm'^. The C=C mode around 1480 cm"^ must be a better
indicator of change in electronic structure than the C-H stretching region.
2.4 Postscript
Ihe program to synthesise ITF salts was significantly delayed, so the
expansion of the project was not possible. At the tmie of wntmg (1994), the first
TTF-acceptor salts are being produced in Southampton. Recently published results
have borne out the predicted success of FT-Raman in the TTF field. In the course of
the initial phase of this study (1990-1) Fourier transform surface-enhanced Raman
spectroscopy (FT-SERS)'^ was successfully applied to the study of
tetrathiafulvanene during electrochemical oxidationVeduction. Also, viability was
proven with a combined FT-IR/FT-Raman study of a TTF^ 8 ^^d a FT-Raman study
of a TTF complex with an inorganic salt acceptor^ In addition, studies using long-
wavelength visible excitation and CCD detection has proved very useful as an analysis
method for microscopic quantities of TTF-acceptor materials, with a publication
pending20
2.5 Reference.^
1. G. Schukat, A. M. Richter, and E. Fanghanel, Sulphur Reports 7 155 (1987)
2. J.M. Williams, H.H. Wang, T.J. Emge, U. Geiser, M.A. Ben, P.C.W. Leung,
K.D.Carlson, R.J. Thorn, and A.J. Schultz, Prog. Inorg. Chem. 35 51 (1987)
3. K. Kikuchi, K. Murata, Y. Honda, T. Namiki, K. Saito, K. Kobayashi, T.
Ishiguro, and I. Ikemoto, J. Phys. Soc. Jpn. ^ 4241 (1987)
4. R. Bozio, I. Zanon, A. Girlando, and C. Pecile, J.Chem. Phys. 71 (5) 2282 (1979)
80
5. R. Zamboni, D. Schweitzer, and H.J. Keller, "Lower-dimensional systems and
molecular electronics" Ed. R.M. Metzger et al, p.239 (Plenum Press, 1991)
6. J.R. Ferraro and J.M. Williams, Appl. Spectrosc. 44 (2), 200 (1990)
7. M. Tanaka, M. Shimizu, Y. Saito, and J. Tanaka, Chem. Phys. Lett., 125, 594 (i(%;6)
8. S. Matsuzaki, T. Moriyama, and K. Toyoda, Solid State Commun. 34, 857 (1980)
9. C.J. Petty, G.M. Warnes, P.J. Hendra, and M. Judkins, Spectrochim. Acta
47A(9/10), 1179(1991)
10. E.M. Engler, N. Martinez-Rivera, and R.R. Schumaker, IBM research reports
11. K.R. Gayaihri Devi, D.N. Sathyanarayana, and E.M. Engler, J. Mol. Struct.
71 15(1981)
12. K. Iqbal and N.L. Owen, J. Mol. Struct. 71 91-5 (1981)
1 j . B. Girmay, J. Kilburn, A. Underbill, K. Varma, M. Hursthouse, M. Harman, J.
Becher, and G. Bojesen, J. Chem. Soc. Chem. Comm. 1406 (1989)
14. W. Kiefer and J.A. Topp, Appl. Spectrosc. 28, 26 (1974)
15. L.J. Bellamy, "The Infrared Spectra Of Complex Molecules, Vol.2: Advances
in Infrared Group Frequencies", 2 " edition, p.356 (Chapman and Hall,
1960)
16. W.J. Barreto, M.C.C. Ribeiro. and P S. Santos, J. Mol. Struct. 2 ^ , 75 (1992)
17. S. Nie, and N-T. Yu, J. Raman Spectrosc. 22, 489 (1991)
18. J.R. Ferraro, A.M. Kini, J.M. Williams, and P. Stout, Appl. Spectrosc. 48(4).
531-534 (1994)
19. R. Zamboni, D. Schweitzer, and H.J. Keller, Synth. Metals 41-43. 2241
(1991)
20. J.M. Williams, private communication.
81

Chapter 3:
Allenylketenimine-Tetracyanoethylene Diels-AIder reaction products
3.1 Introduction
The series of compounds known as allenylketenimines constitute a new
development in structural organic chemistry, with many developments pioneered by
researchers at the University of Southampton. During 1991, Dennehy and co-workers
succeeded in syntnesising tnese compounds by the reaction of certain titanium
metallacycles with tertiary butylisonitrile^- see figure 3.1:
( C A h (Me3)CN
hours
(Me3)CN
R? 250c
Figure j . l The reaction scheme to form the allenylketenimines.
A comprehensive structural analysis was required on this class of compounds.
A combination or C and H nuclear magnetic resonance (NMR) spectroscopies are
usually employed for such studies; however, the number of adjacent quaternary
carbon centres made unambiguous determination of the structure difficult bv
NMR - whilst the species also proved to be rather reactive, which made sample
preparation difficult.
Methods were clearly required to produce a more stable structure, amenable
to structural analysis. Derivatisation (reaction to produce a more stable adduct) had
previously been successfully applied to the characterisation of structurally-related
vinylketenimines^. Tetracyanoethylene (TCNE) derivatives of the allenylketenimines
were produced successfully (a brief reaction scheme given in figure 3.2) and
NMR successfully employed-^, enabling the structure of the parent allenylketenimine to be inferred.
82
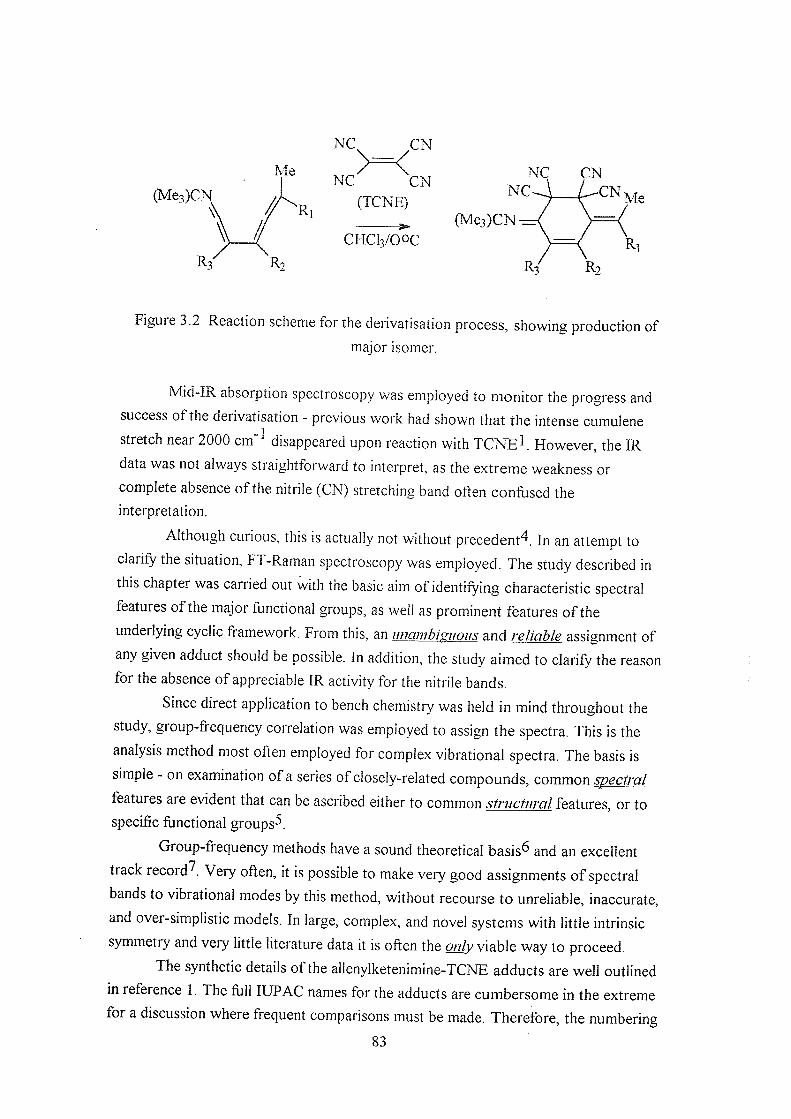
(IV[e3X:N
,» (Me3)CN. CHCI3/OOC
Figure 3.2 Reaction scneme for the derivatisation process, showing production of
major isomer.
Mid-IR absorption spectroscopy was employed to monitor the progress and
success of the derivatisation - previous work had shown that the intense cumulene
stretch near 2000 cm"^ disappeared upon reaction with TCNE^. However, the IR
data was not always straightforward to interpret, as the extreme weakness or
complete absence of the nitrile (CN) stretching band often confused the
interpretation.
Although curious, this is actually not without precedent'^. In an attempt to
clanfy the situation, FT-Raman spectroscopy was employed. The study described in
this chapter was carried out with the basic aim of identifying characteristic spectral
features of the major functional groups, as well as prominent features of the
underlying cyclic framework. From this, an imambi^nous and reliable assignment of
any given adduct should be possible. In addition, the study aimed to clarify the reason
for the absence of appreciable IR activity for the nitrile bands.
Since direct application to bench chemistry was held in mind throughout the
study, group-frequency correlation was employed to assign the spectra. This is the
analysis method most often employed for complex vibrational spectra. The basis is
simple - on examination of a series of closely-related compounds, common spectral
features are evident that can be ascribed either to common structural features, or to
specific functional groups^.
Group-frequency methods have a sound theoretical basis^ and an excellent
track record^. Very often, it is possible to make very good assignments of spectral
bands to vibrational modes by this method, without recourse to unreliable, inaccurate,
and over-simplistic models. In large, complex, and novel systems with little intrinsic
symmetry and very little literature data it is often the only viable way to proceed.
The synthetic details of the allenylketenimine-TCNE adducts are well outlined
in reference 1. The fiall lUPAC names for the adducts are cumbersome in the extreme
for a discussion where frequent comparisons must be made. Therefore, the numbering
83

scheme of reference 1 has been adopted. The functionalities R%, R2, and R3 are listed in table 3.1.
Adduct R t R ? R . i Yield ratio a Ph- C1H7- c l h ? - 6 : 1
b Ph- H- SiMei- Major only c Ph- c s h n - SiMei- Major onlv d C s H n - H- Ph- 1.4:1
e c . i h n - Ph- Ph- 3:1 f C1H7- C1H7- c 1 h 7 - 3:1
Table 3.1 Nomenclature used to describe the allenylketenimine-TCNE adducts.
(la-f refer to major isomeric form. 2a-f refer to minor form.)
The ratio or yield refers to the amount of the major isomer formed with
respect to the minor. The reason for the existence of two isomers for most of the
series is explained in reference I. Briefly, the major isomers (denoted la-f in table
J. 1) formed in the cycloaddition of the TCNE to the dienophile have the methyl
group syn to the nitrile (CN-) groups; this reflects the approach of the dienophile
from the side away from the larger terminal group on the parent allene. The structure
of the allene is such that the terminal groups lie perpendicular to the plane of the
diene, and hence directly on the line of approach of the alkene.
The structural backbone of the series may be described as an essentially-
planar, slightly-distorted 6-member ring. Single-crystal X-ray diffraction (XRD)
studies on one of the series which crystallised well (lb) revealed the tertiary
butylimino- (%uN=) group tilted upwards out of the ring plane, and the R% phenyl
(Ph-) group twisted at an angle to the plane^. These features are primarily due to the
steric interactions of the imino group and the trimethylsilyl functional group (Meg Si-),
and the clash of the Ph- group with the vinylic proton at R?. This results in a loss of
conjugation, since a truly planar compound would have considerably more Ti-orbital
overlap, involving the imino group through to the R% Ph- group. The two 7r-bonds in
the ring do, however, remain conjugated.
84

3.2 Experimental
The FT-Raman spectrometer used in this study was the second PE 1700 series
Southampton prototype. The spectral range covered was 300 -3300 cm"^ Stokes
shift. All Raman spectra are the result of 100 accumulated scans of 4 cm ^ resolution,
and were excited with 200-400 mW of laser power. The Raman spectra were
corrected for wavelength-dependant instrumental response bv the method of Petty et
al^. As usual, the most important pomt is that relative peak heights may be discussed
more meaningfully than for uncorrected spectra.
All the samples studied were off-white, aggregated solids. Although much less
reactive than the parent allenylketenimines, the adducts were kept under refrigeration
in the dark when not being examined, since their long-term stability was still suspect.
For this reason large numbers of co-added scans and high laser powers were avoided.
Most of the adducts were available in good yield, except 2f, which was only available
in very low yield. Since f was also thought to be quite unstable, the spectra had to be
collected without removing the sample from the glass container. This was not ideal
for collecting spectra, yet it proved possible to obtain quite adequate results, hi situ
sampling is required for many toxic or air-sensitive compounds; it is far simpler to
implement using FT-Raman spectroscopy than with mid-IR techniques.
The mid-IR transmission-absorption spectra were recorded in either CCI4 or
CDCI3 solution using a standard potassium bromide (KBr) window cell on a Perkin
Elmer 1600 series FT-IR spectrometer. The spectra presented here are the result of 4
scans at 4 cm resolution, and reproduced from reference 1 with the author's kind
permission. Only two spectra are displayed, over the range 3500-1000 cm'^, since all
the features pertinent to this discussion are clearly demonstrated.
3.3 Results
Figure 3.3 shows the IR spectrum of la, obtained from CCI4 solution. The IR
spectra of the rest of the series were obtained in CDCI3 solutions, since this proved to
be the solvent of choice for ^HNMR spectroscopy. Willi low-yield products, taking
both IR and visible-region absorption spectra from previously-prepared NMR
solutions is not uncommon practice; the product made up into solution is put to the
best possible use, whilst conserving the remaining product for further syntheses.
However, C-D stretching vibration of the solvent appeared around 2250 cm"^,
obscuring the nitrile region - as is shown in figure 3.4, the IR spectrum of lb, making
the collection of mid-IR spectra in this way rather limited in value for these species.
85
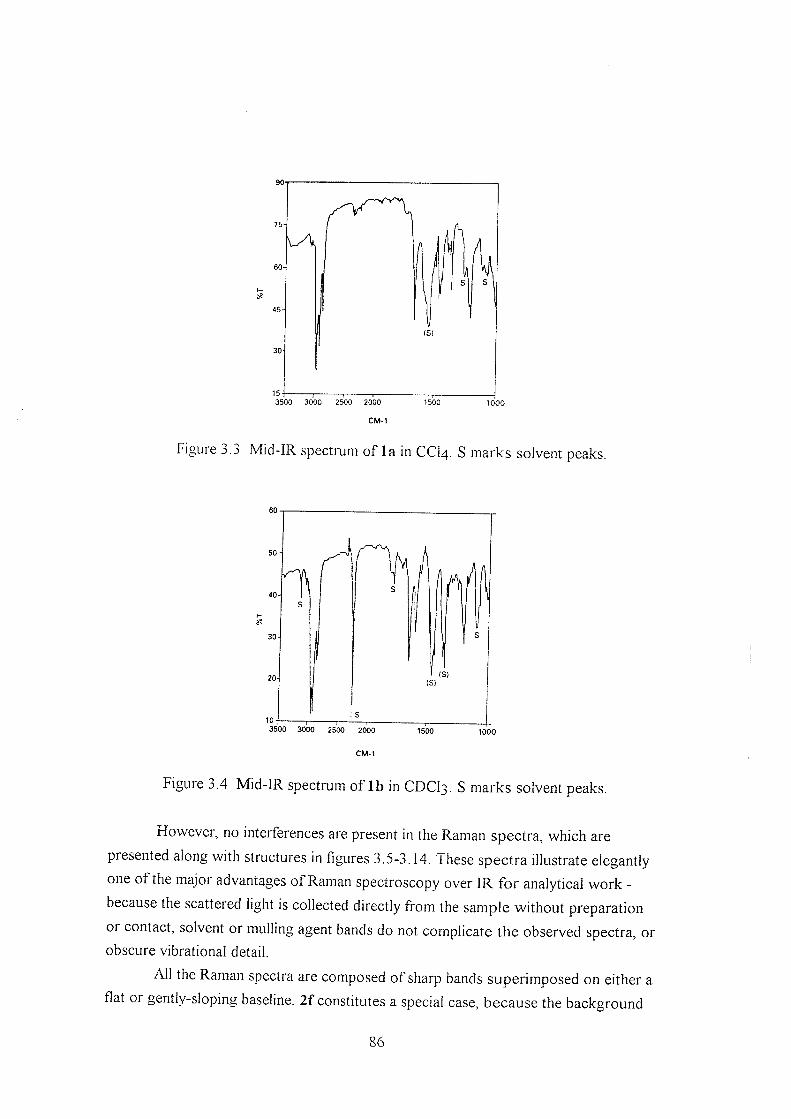
151 r 3500 3000 2500 2000
CM
Figure 3.3 Mid-IR spectrum of la in CCI4. S marks solvent peaks.
3500 3000 2500 2000
CM
Figure 3.4 Mid-IR spectrum of l b in CDCI3. S marks solvent peaks.
However, no interferences are present in the Raman spectra, which are
presented along with structures in figures 3.5-3.14. These spectra illustrate elegantly
one of the major advantages of Raman spectroscopy over IR for analytical work -
because the scattered light is collected directly from the sample without preparation
or contact, solvent or mulling agent bands do not complicate the observed spectra, or
obscure vibrational detail.
All the Raman spectra are composed of sharp bands superimposed on either a
flat or gently-sloping baseline. 2f constitutes a special case, because the background
86

120
100
80 -
I 60 .
£
40
20
0
l i
H f-3300 3000 2700 2400 2100 1800 1500 1200 900 600 300
Waveniunber shift (cm-1)
Figure j,5a T-Raman spectrum of la (major isomer).
NC CN N C ^ \ ^ C N
(Me3)CN
C3H7' C3H7
Figure 3.5b Structure of la. Ph group at R] is 'syn' to CN in 2a below.
40
35
30
25 25
1 20
15
10
5
0 j J ' \
.i-y!
3300 3000 2700 2400 2100 1800 1500 1200 900 600 300
Wavenimiber shift (cm-1)
Figure j.6 FT-Raman spectrum of 2a (minor isomer).
87

160
140
120
100
B 80
60 -
40
20
0
3300 3000 2700 2400 2100 1800 1500 1200 900 600 300
Waveiumiber sliift (cm-1)
Figure j.7a FT-Raman spectrum of lb (single isomer).
NC CN N C ^ / ^ C N
(Me3)CN
MegSi' H
Figure j.7b Structure of lb. H group at position R2 replaced by C^Hj ] in Ic.
40 T
35 j
30 j
. e 25 --
1 20 ;
15 --
10 --
5 f
0 -L
3300 3000 2700 2400 2100 1800 1500 1200 900 600 300
Wavenimiber shift (cm-1)
Figure 3.8 FT-Raman spectrum of Ic (single isomer).

150
3300 3000 2700 2400 2100 1800 1500 1200 900 600 300
Wavemuiiber shift (cm-1)
Figure 3.9a FT-Raman spectrum of Id (major isomer).
NC CN N C ^ L - C N
(Me3)CN—
C5H1:
Figure 3.9b Structure of Id. C$H] ] group at Rj is 'syn' to CN in 2d below.
45
40 -
35
30
25
20
15
10
5
0 — 1 _ 1 1 H 3300 3000 2700 2400 2100 1800 1500 1200 900 600 300
Wavenimiber shift (cm-1)
Figure 3.10 FT-Raman spectrum of 2d (minor isomer).
89

90
80
70 +
60
50 -
10 £ ^
30
20 -
10
0 ; L
3300 3000 2700 2400 2100 1800 1500 1200 900 600 300
Waveiuuiiber shift (cm-1)
Figure 3.1 la FT-Raman spectrum of le (major isomer).
N C ^ ^CN
(Me3)CN—
Me (
C5H11 Ph Ph
Figure 3.11b Structure of le. ] group at R] is 'syn' to CN in 2e below.
80
70
60
50
S 40
30
20
10
0 1 — ' r
3300 3000 2700 2400 2100 1800 1500 1200 900 600 300
Waveniimber shift (cm-1)
Figure 3,12 FT-Raman spectrum of 2e (minor isomer).
90
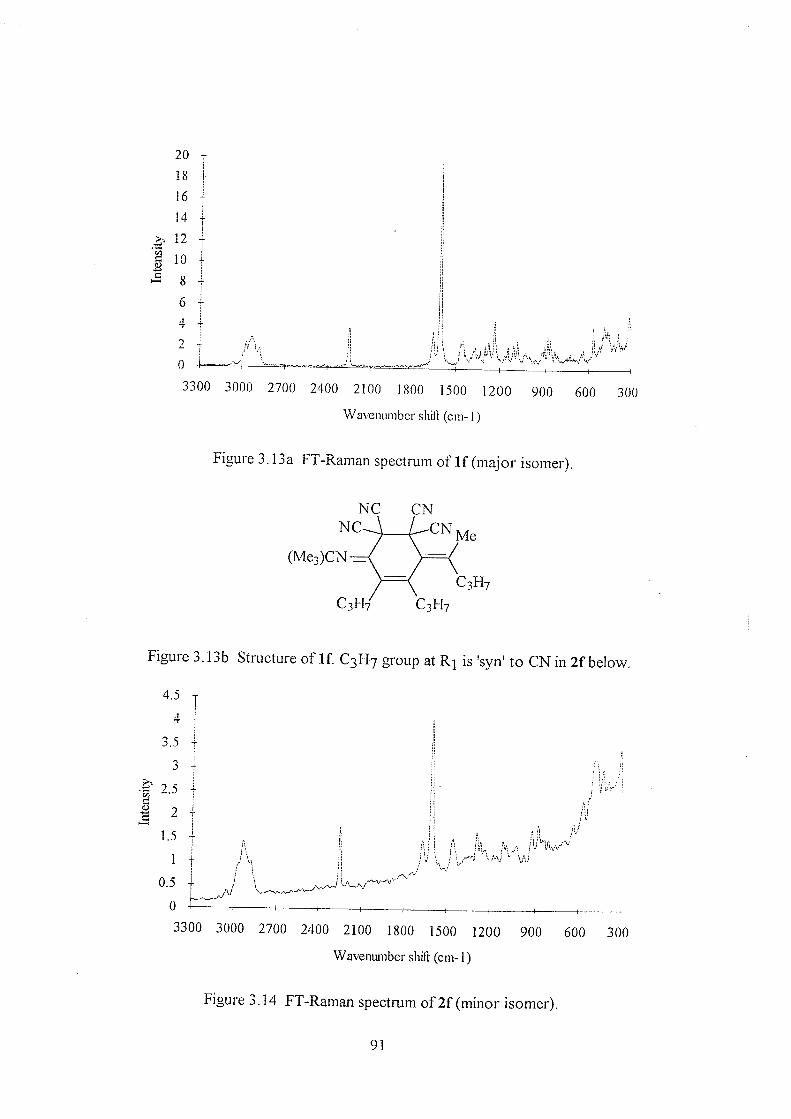
20 T
18
16
14 -
12
§ 10
8
6
4
2
0
3300 3000 2700 2400 2100 1800 1500 1200 900 600 300
Waveniuiiber sliifl (cm-1)
Figure 3.13a FT-Raman spectrum of If (major isomer).
NC CN N C - ^ . / ^ C N
(Mei)CN
C3H7
Figure 3.13b Structure of If. C3H7 group at is 'syn' to CN in 2f below.
4.5
3300 3000 2700 2400 2100 1800 1500 1200 900 600 300
Waveniuiiber shift (cm-1)
Figure 3.14 FT-Raman spectrum of 2f (minor isomer).
91

AJ] the Raman spectra are composed of sharp bands superimposed on either a
flat or gently-sloping baseline. 2f constitutes a special case, because the background
can be attnbuted to fluorescence from the glass container used for this particular
sample. In general, if the sample was pure enough to give good interference-&ee
NMR spectra, that same sample gave good Raman spectra. Put another way,
recrystallised products generally gave good spectra, whilst column-separated
products generally resulted in still-higher quality spectra. The reason is the rigorous
exclusion of by-products fi-om synthetic work-up, known to be very problematical in
conventional Raman spectroscopy.
3.4 Discussion
From the inspection of the I'T-Raman spectra, several features stand out
clearly. The first task is to identify features that are specific to the underlying "ring"
cyclic structure, and to specific functional groups. Analysing the spectra from high to
low Raman shift;
' The presence of nliphntic protons is shown by the broad C-H stretch band
centred around 2930 cm which appears as an asymmetric triplet in several of
the adducts. When aromatic C-H is also present, a much narrower band is
observed at ca. 3060-3070 cm ^ shin. If MegSi- groups are present, they give
rise to another strong C-H stretch at ca. 2910 cm"^ shift.
» The sharp, medium-to-weak intensity band around 2250 cm"^ shift, which in
some cases displays splitting and/or asymmetry, must be due to the nitrile (CN) stretch.
• The sharp band close to 1670 cm ^ shift, medium-to-weak in intensity, can be
attributed to the iniino group C=N stretch, and is in excellent agreement with
previous s t u d i e s ^^,11 provides useful confirmation ihat the imine is not
involved to any great extent in the 7c-system, since the C=N band shifts to lower
frequency on conjugation. The assignment is confirmed by the appearance of an
intense sharp absorption band in the IR spectra at almost exactly the same
frequency - see figure 3.3.
92

. The most intense feature in all but one case (Ic) is a sharp band around 1600
shiA. This IS due to a dienyl C=C stretch, that of the backbone &agment.
Between 1600-1000 cm shift a number of C-H bending and deformation
modes occur, which results in a complex pattern of bands, a situation not simplified
by the appearance of C-C skeletal stretching modes^. However, tentative assignments of certain bands may be made:
• A sharp band, albeit weak, near 1500 cm ^ shift, absent from some members of
the series. This lies outside the usual region for aliphatic methyl or methylene
deformation modes. It is most likely to be a phenyl ring-associated band, probably
due to a complex ring-stretcn plus aeformation mode^-*; this assignment is
supported by the absence of the band from the spectra of both the f isomers,
which contain no phenyl groups.
» A weak, slightly broad band appears in all spectra near 1450 cm"^ shift. This is
probably due to the interaction of methyl and methylene (CH2-) in-plane deformation m o d e s ^2
» The band near 1 J80 cm shift is probably due to methyl symmetric deformation,
although it is unexpectedly absent from the spectrum of 2d.
• A medium-to-weak intensity band near 1033 cm ^ shift, present whether the
species contains phenyl rings or not. The sharp band lies within a narrow range of
values, from 10 j9 cm shift in If to 1024 cm ^ shift in 2d. It is quite conceivable
that this band is due to a C-C stretching mode, although it would not be
appropriate to go further than stating this band is characteristic of the basic ring
structure and not the side groups.
Aromatic substituents (phenyl rings) are confirmed by the strong narrow band at
approximately 1000 cm ^ shift. This is characteristic of the "ring-breathing"
phenyl group mode, and serves to identify the group unambiguously^'^2. The
assignment is quite safe, since both isomers off , which contain no Ph- rings, do
not have these bands.
93

Interestingly, no band indicative of the Si-C moiety can be found in this
region. Stretching modes of alkyl-Si species are strongly IR-active^^; for instance,
figure 3.4 shows the intense Si-C absorption band at 1264 cm"^ in lb.
However, the Raman spectra of lb and Ic do show a pair of quite sharp
bands - 1 j04 & 1287 cm ^ shift in lb, 1299 & 1283 cm ^ shift in Ic. These may well
be indicative of the MeSi]- group. Four points support this argument;
» The separation (14 cm" ) is the same in both cases
• Both pairs are medium to weak in intensity
• The higher-shift component is more intense than the lower,
» No such peaks are seen in any other member of the series.
lb may further be dirrerentiated from Ic simply by the presence of a narrow,
medium-intensity band in the former (where R2 = H) at 1331 cm"^ shift and not in the
latter (R2 = C2H7). Unfortunately, it is not possible to generalise this point to other
R2 = H members of the series, d and f.
Below 1000 cm ^ shift it becomes much more difficult to draw out bands
characteristic of the ring structure. Bands in this region arise from modes coupled
with other vibrations, reaucing their usefulness as group frequencies:
• A sharp, medium-to-strong intensity band near 570 cm ^ in all spectra. This
probably arises from a mode (or modes) of the tertiary butylimino group carbon
skeleton. It falls near the accepted value for an internal quaternary carbon
c e n t r e a l t h o u g h little data seems to be available for this particular vibration.
The band itself is both strong in intensity and quite stable in position, falling
between 555 cm ^ shift in 2d and 578 cm'^ shift in la. Thus assignment to the
tertiary butylimino group seems reasonable, but is not proven.
• A similar medium-intensity narrow band occurs around 410 cm"^ shift, lying
between 421 and 391 cm it is quite characteristic of the series, yet is difficult to
assign to a specific functional group or structural feature.
» The same is true of a band near 630 cm ^ shift; the position ranges between 650
cm ^ for the high-shift doublet component in If, to 607 cm'^ for the low-shift
component in 2a. This particular band is generally weak, can be quite broad, and
may be an asymmetric doublet (Id) or a single peak ( la) . The wide spread (± 20
94

cm ) from the aveiage position (630 cm might be explained if the normal
mode(s) which contribute to this band are sensitive to the exact nature of the
substituents.
Some of the points made above require amplification. The first concerns the
C=C stretching region, the second the CN-stretching.
3.4.1 The C=C stretching region
The strong band lying between 1615-1594 cm ^ shift is the frequency range
expected from a conjugated diene. For instance, the Raman spectrum of liquid 1,3-
butadiene exhibits a very strong band at 1637 cm ^ shift^, which is due to the two
C=C bonds vibrating in-phase. Given the environment of the dienyl C=C double
bonds in the TCNE adducts, it is not unreasonable to propose that the 30 cm"^
downshift is due to mass ettects of the groups attached to the dienvl fragment.
A ftirther point concerns the intensity of the aromatic ring C—C mode. Since
all the adducts except f contain phenyl groups, it is safe to assign the band near 1577
cm shift (lying between 1581-1568 cm ' ) to the phenyl ring stretching mode which
occurs in benzene at 1596 cm . The intensity of this narrow band is quite
unpredictable, no consistent explanation for the strength of this band can be reached
from the data presented here. The very low intensity of the phenyl-associated 1581
cm ^ shift band in both isomers of e, an adduct with two Ph- groups, is still
surprising. Again, the reason for this effect is unknown.
A second sharp band of appreciable intensity occurs in this region in the
spectra of lb (15j9 cm ^), Ic (1536 cm ^), and both isomers of e (1556 cm'^ major,
1557 cm minor). Again, it is difficult to correlate the intensity with any specific
feature.
Two last points must be made about the C=C region for analytical purposes.
The first is the splitting of the intense C=C band in Ic into a doublet at 1601+1594
cm ^ shift, which is the only example of such splitting.
3.4.2 The nitrile CCN-) stretch
The nitrile stretching region around 2250 cm"^ shift provides many interesting
points on which to comment. Experimental IR data is available on a wide range of
nitrile environments^6-18 g^d the theoretical basis for the intensity variations and
95
frequency shifts often observed in the IR absorption spectra is well-developed^^. The
broad features of the previous studies can be neatly summarised:
• Firstly, IR absorption intensities tend to be extremely unpredictable and vary widely.
• Secondly, the intensity can be correlated within certain series to the magnitude of
the inductive effect operating on the nitrile groups, whilst the intensity is
reasonably insensitive to the degree of conjugation in the system.
• Thirdly, it has been proposed that small changes in equilibrium CN bond length
may cause significant change in the equilibrium value of the bond dipole moment,
since in general dipole moment as a function of bond length is a steeply-curved
fijnction, this would give rise to large variations in the intensity of absorption for
environments where the bond length had only changed slightly.
• Fourthly, in contiast to the intensity variability, the absorption frequency is
remarkably stable, and depends on the electronic structure in the location of the
nitrile group, ^atuiateo nitriies aosoro arouna 2250 cm ^, whereas conjugated
uiisaturated nitriies absorb around 2220 cm , with unsaturated unconjugated
systems falling in between, along with aromatic systems, where the exact position
depends on the nature of the side-groups appended to the cyclic system.
In addition to the experimental IR and Raman data, theoretical study has
shown that the frequency is remarkably unarrected by mechanical perturbations, and
also that the CCN- moiety needs to be considered, not just the CN- in isolation
because the CN- mode mixes significantly with the C-C bond adjacent. However, the
CN- mixes strongly only with this band. This work also shows how the IR absorption
strengths vary as a strong function of electronic environment.
Raman data for the intensity of the nitrile species is also available^O, It
confirms the narrow range of band position, and notes a similar trend in band position
as a function of conjugation. However, the intensity of the nitrile band does not vary
as widely, or as unpredictably, as the corresponding IR absorption bands. This has
been attributed to the bond polarisability not being as steeply-curved a function of
bond length as the dipole moment; hence large variations in equilibrium bond length,
reflecting changes in CN environment, may have a small effect on the intensity of the
Raman spectrum.
96

The very low intensity of the nitrile band in the IR spectra of the
allenylketenimine-TCNE adducts was mentioned in the introduction and shown in
figures 3.3 and 3.4. The extremely weak absorption of these compounds is clearly
another example of the unpredictability in nitrile absorption strength.
The simplest model compound for the environment of the CN- groups in the
adducts is malonitrile (urf2(CN)2). Jesson and Thomson reported a low value for the
molar absorption intensity which led them to the conclusion that dinitriles with
CN- groups bonded to the same carbon atom have low IR intensity because of the
inductive effect of one CN- group on the other. If this is the case, then the adducts
under study here are good candidates for very low IR absorption intensities, because
they have two more nitrile groups on the (3-carbon. Figure 3.15 contrasts the two
environments:
NC CN
/ / \ Nc' « / \
Figure 3.15 Malonitrile (leA) and the -CN environment in the TCNE adducts.
In contrast, a great deal of information can be gained from the FT-Raman
spectra in the CN- region, despite the apparent simplicity:
® In general there is one sharp band, around 20 cm ^ in width, with a definite
shoulder or splitting, either to high or low shift. In the single case of the band
being split appreciably (lb), the bandwidth of each component is reduced to 10
cm"^
There are two ditierent environments for the dinitrile groups; one has a C=N
group on the g-carbon, whilst the other has a C=C. Each has the other dinitrile
group as the other p-carbon substituent. A shift or splitting of the CN- band to
reflect these two environments mignt be anticipated; the fact that no major
splitting or large shifts are encountered is possibly a reflection that the two
environments are not widely different in terms of electronic structure.
The position of the band (ca. 2250 ± 5 cm"') is characteristic of a saturated nitrile
group, and is unaffected by changes in the side groups. This confirms the small
degree of mechanical coupling between the side groups and the CCN- bonds.
97
• The intensity of the band is, for the most members of the series, medium-to-weak
in comparison to the C—C stretch. The intensity does not vary widely, and the
band does not become unobservable in any of the series studied. The intensity and
the band-position data agree, indicating a saturated nitrile environment.
Speaking from an analytical standpoint, it would be convenient to be able to
distinguish between the major and minor isomers of the adducts by simply looking for
a band (or bands) sensitive to the methyl group in the J3-position to R j being 'syn' to
the adjacent dinitrile group or not. It is quite plausible that the dinitrile grouping itself
would be sensitive, since some steric interaction between the Me- and CN- groups is
likely. This might explain the splitting in the nitrile region, since it would affect one
dinitrile group and probably not the other.
However, the biggest splitting (resulting in well-resolved, separate bands)
occurs in lb, where it is known that the very bulky Mc^Si- group at R3 greatly
perturbs the imino group. 1 his may result in a "knock-on" effect, either sterically or
through conjugation or both, which affects the dinitrile group in the ^-position to the
imino group, thus the imino-side dinitrile grouping may be affected whilst the other
(C—C side) dinitrile group may not. Ic provides another example of this, with the high
asymmetry of the band leading to the conclusion that a second, weaker band is
present at higher shift. Thus, isomerism is not necessarily the correct explanation for
the nitrile band asymmetry and splitting.
It is quite plain after examining each pair of adduct isomers that no pair have
identical band positions, or even the same band-structure in the nitrile stretching
region band. Curve fitting would in principle yield more accurate estimates for the
wavenumber position of the shoulders. However, without guidance on the number of
functions to fit, the outcome may be of limited meaning. It is quite clear that the
nitrile band may be used to differentiate between the two isomeric forms of a given
adduct.
98

Adduct Band position (cm" ) Description
1 1 2253 (2248) Prominent shoulder
to low shift.
1 2a 2247 Reasonably
symmetric. lb 2265,2250 High-shift band
weaker. Ic 2246, ? Asymmetric (weaker
band to h i ^ shift). Id 2256(2250) Prominent shoulder
to low shift. 2d 2250, ? Slight asymmetry on
low shift side. le 2251, ? Very asymmetric;
low shift shoulder. 2e 2253(2248) Prominent shoulder
to low shift. If 2248 Symmetric; curious
band shape.
2f 2249 Symmetric; simple
line shape.
Table 3.2 Position and band shape of nitrile stretch
3.5 References
1.
2,
3.
4.
5.
6.
7.
R.D. Dennehy, Ph.D. thesis, University of Southampton (1992)
E. Di%rding, and L. Ghosez, Tetrahedron Lett. 2 ^ 1647 (1985)
R.D. Dennehy and R.J. Whitby, Chem. Commun. 35 (1992)
H. Bross, R. Schneider, and H. Hopt; Tetrahedron Lett. 23, 2129 (1979)
N.B. Colthup, L.H. Daly, and S.E, Wiberley, "Introduction to Infrared and
Raman spectroscopy", 2"^ Ed. (Academic Press, 1975)
G. Herzberg, "Molecular Structure and Molecular Spectra. II: Infrared and
Raman spectra of polyatomic molecules" Ch. 2 Pt. 4 (Van Nostrand, 1944)
F.R. Dollish, W.G. Fateley, and P.P. Bentley, "Characteristic Raman
Frequencies of Organic Compounds" (Wiley Interscience, 1974)
99
8. R.J. Whitby, M. Webster, and R.D. Dennehey, Acta Cryst. C48. 1252 (1992)
9. C.J. Petty, G.M. Warnes, P.J. Hendra, and M. Judkins, Spectrochim. Acta
47A. 1179(1991)
10. A. Kirrmann and P. Laurent, Bull. Soc. Chim. Fr. 1499 (1956)
11. J. Fabian, M. Legrand, and P. Poirier, ibid, 1657 (1939)
12. R.G. Snyder and J.H. Schachtschneider, Spectrochim. Acta 21, 169 (1965)
13. E.B.Wilson Jnr., Phys. Rev. 45, 706 (1934)
14. G.Socrates, "Infrared characteristic group frequencies", Wiley-Interscience, J.
Wiley & Sons, London (1980)
15. E.J. Rosenbaum, V. Grosse, and H.F. Jacobson, J. Am. Chem. Soc. 689 (1939)
16. J.P Jesson and H.W. Thompson, Spectrochim. Acta 13, 217 (1958)
17. R E. Kitson and N.E. GriRiths, Anal. Chem. 24(2), 334 (1952)
18. M.F. Amr-Sayed and R.K. Sheline, J. Inorg. Nucl. Chem. 6, 187 (1958)
19. S. Besnainou, B. Thomas, and S. Bratoz, J. Mol. Spectrosc. 21, 113 (1966)
J.P. Jesson and H.W. Thompson, Proc. Roy. Soc. 2 6 8 A , 159 (1962) 20.
100

Chapter 4:
Hydration of the ;K-Aiumina surface
4.1 Introduction
Aluminium oxide (A1203) is one ot tne most important materials used in the
modern chemical industry. It serves as a support in many heterogenous catalytic
systems, whilst the y-alumina surface has catalytic properties in its own right^.
However, y-alumina finds an important application in the electronic components
industry - as it possesses excellent qualities as the dielectricium of electrolytic
capacitors^.
Typically, 100-800 nm thick films or y-alumina are employed in capacitors; the
films are generated by anodic oxidation of extremely pure aluminium foils, in
proprietary electrolyte mixtures. The quality of the capacitor depends strongly on the
homogeneity and thermodynamic stability of the film produced. It has been observed
that treatment of the oxiae film witn phosphate greatly reduces the occurrence of
surface reactions that lead to the formation of aluminium hydroxide Al(OH)g. One of
the most perplexing aspects of the surface stabilisation is the lack of definitive model
concerning the structure of the phosphate-adsorbed alumina surface-'.
As part or a multiaisciplinary research effort in the aqueous-phase chemistry
of alumina, the Swedish universities of Umea and Lulea have been jointly studying the
reactions of the y-alumina surface, as a flinction of pH, by extremely sophisticated
potentiometric titration electrochemical experiments combined with theoretical
modelling. This has led. onto predictive thermodynamic calculations that in part
reveal the surface speciation. The application of such titration techniques to mineral
surfaces is new, and finding increasing application^.
The application of vibrational spectroscopy to the hydrated y-alumina surface,
and to the phosphate-adsorbed surface, is extremely inviting. During a three-month
exchange visit to Lulea in 1992, it was decided to apply FT-Raman techniques to the
problem. This chapter presents the first results obtained from this application.
101
4.2 Experimental
The method used to prepare the hydrated y-alumina samples was exactly the
same as that used at Umea, in order to maintain a direct comparison with the results
obtained by titration.
Extremely well-characterised y-alumina is required for the experiments, and
was supplied by Mandoval AB. The purity was quoted as >99.99% with respect to
trace metals, the mean particle size established as < 0.1 f.im diameter, whilst the
surface area was determined (by the N, BET isotherm method) to be 145 mVg.
In tne first series or experiments, 20 g/i suspensions of y-alumina in deionised
water (conductivity < l|.iS/cm) were hydrated with stirring for 4-5 weeks without
purging in air-tight vessels, thermostated at 25°C. The pH of the suspensions were
monitored by glass electrode potential; after 3-4 weeks, a slow and steady drift to
slightly alkaline (ca. pH 7.5-7) conditions began to stabilise.
After ftnai equilibration of the glass electrode potentials at around 4-5 weeks,
20 cm" of the suspension was added to 30 cm" of 0.167 M NaCI(aq). If required, the
pH was adjusted, then stii red for 12-24 hours, a final check on the pH made, then
filtered under gravity, and dried under mild conditions (40-50°C). After 24 hours, the
samples were ground in an agate pestle and mortar, and stored in a desiccator.
During the study, the hydration method changed slightly - such changes are
outlined in detail where necessaiy in the coming sections. The changes made
essentially involved hydrating at the desired pH rather than afterwards, changing the
ratio of time spent hydrating to that equilibrating at different pH, and also changes in
the hydration temperature, along with the use of a centrifuge for separation.
The first set of results gathered from the stirred samples highlighted a flaw in
the experimental technique, which will be discussed in the next section. The outcome
was that the stirring of the hydration suspension was ceased. Potentiometric studies in
these systems indicated no change in equilibration time or in final pH, whilst
spectroscopic studies revealed no apparent effects from the sodium or chloride ions
introduced during pH adjustment, and no effect could be seen from leaving the
systems to equilibrate in open, rather than sealed, vessels.
Unless otherwise noted, FT-IR/Raman spectra were collected on the Lulea
instrument, a Perkin Elmer 1700 series equipped with a near-IR Raman bench. FT-
Raman spectra were taken from samples pressed into the solid sampling accessory;
320 scans were co-added using 4 cm"' resolution, with an incident power of ca. 600
mW, whilst cooling the InGaAs detector to 77K was always necessary, resulting in a
maximum shift of ca. 2900 cm"^ being detectable. Mid-IR spectra were taken in
102

diffuse reflect&nce, against a 2.5% dilution in dry KBr (refractive index 1.6, particle
size 5-20 im) against a pure KBr reference; typically 100 co-added scans at 4 cm"!
resolution were collected. Spectra were recorded in Kubelka Munk units, and
transformed directly into absorbance units using the PE IRDM software. XRD was
carried out on many of the samples, to attempt verification of any changes brought
about by the surface reactions. The diffractometer was a Philips DCU PW 1710/00,
using Cu Kjj] and radiation at 1.54056 and 1.54435 A respectively. Powder
di#actograms from ca. 650 mg of sample were indexed by the JCPDS indexing
service.
4.3 Results and discussion.
4.3.1 Hvdrating y-alumina
The attack of water upon the oxide surface is two-fold; hydroxylation, and
hydration^. The first describes the attachment of (OH). The reaction of water at the
oxide surface proceeds by attachment of (OH)" to aluminium surface sites, whilst H^
bonds to the oxide sites. The second step - hydration - is the adsorption of molecular
water onto the hydrated layer formed in the first step.
Figure 4.1 shows the FT-Raman spectrum of y-alumina powder before
hydration. All that is seen from the bulk sample is a classic fluorescence background -
sloping steeply towards the Rayleigh line, with no structure, and high intensity.
y-alumina should be considered meta-stable, even at room temperature^'^; a
small amount (ca. 0.02 mole per cent) of incorporated water seems required to
stabilise the structure, although the exact role is still discussed.
Figure 4.2 shows the mid-IR spectrum of unhydrated y-alumina, and clearly
reveals broad hydroxyl bands around 3000 cm-1 and 1500 cm-1. Removing these
bands requires dehydration around 900°C, at which temperature the structure reverts
to a-alumina, known as corundum.
The catalytic activity of the y-alumina surface is greatly improved by heat-
treatment in vacuo to remove many of the hydroxide groups, which are readily
readsorbed from the atmosphere to stabilise the structure. Such heat treatment causes
the appearance of strained Al-0 sites and v a c a n c i e s
103

1.1
1
0.9
0.8
.23 c 0,5 0.4 0.3 0.2
0.1
1800 1400 1000
Waveniunber shift (cm-1)
600 200
Figure 4.1 FT-Raman spectrum of unhydrated y-alumina. NB; feature at near 260
cm-^ shift due to correction function artefact.
0.9
0 .8
0.7
s 0 .6
i 0.5 •e 0 0 .4 0 <
0,2
0.1
0
4000 3600 3200 2800 2400 2000 1600
- Waveniuiibers (cm-1)
1200 800 4:00
Figure 4.2 Mid-IR spectrum of unhydrated y-alumina. NB: feature near 2400 cm'l
due to incomplete ratio of background.
A strong background has been noted in previous Raman studies of aluminas,
inis has generally been labelled fluorescence. Organic species present on the surface^
and transition metal ions included in the bulk play a significant part. Other workers
have identified a more fundamental process^®. Although electronic transitions in
perfectly-ordered alumina start to occur at around 6.8 eV (ca. 55, 000 cm '), disorder
104
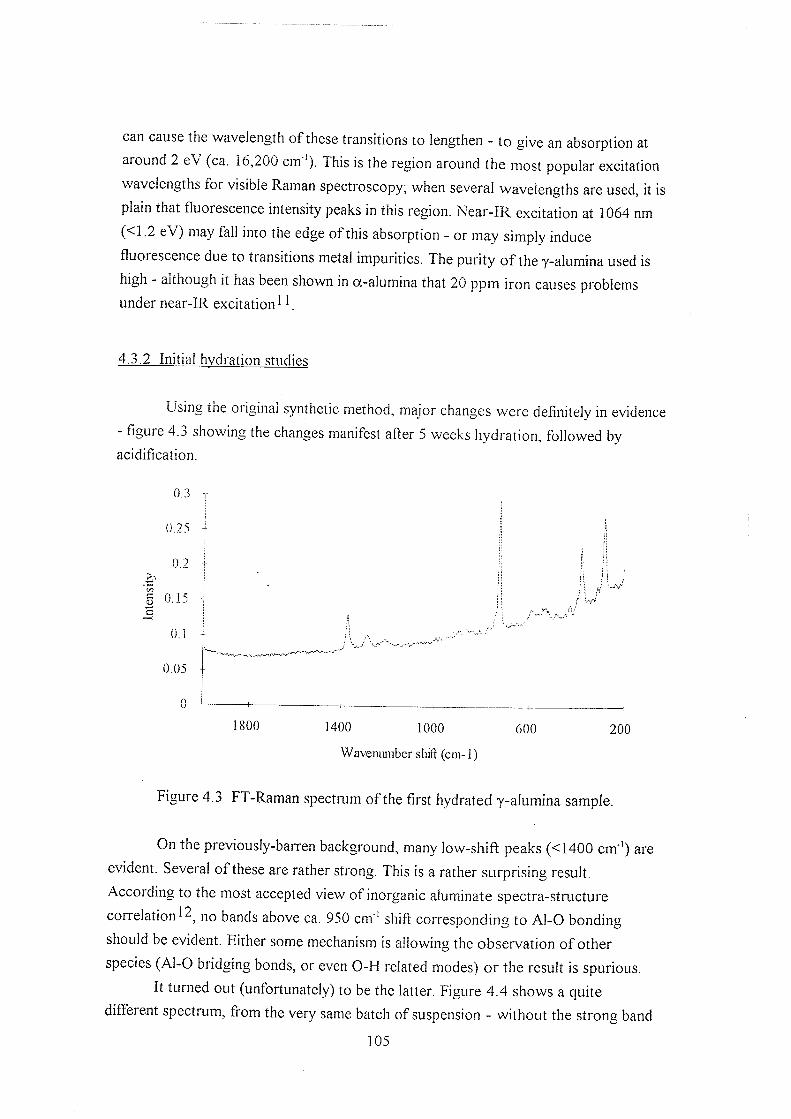
can cause the wavelength of these transitions to lengthen - to give an absorption at
around 2 eV (ca. 16,200 cm ). This is the region around the most popular excitation
wavelengths for visible Raman spectroscopy; when several wavelengths are used, it is
plain that fluorescence intensity peaks in this region. Near-IR excitation at 1064 nm
(<1.2 eV) may fall into the edge of this absorption - or may simply induce
fluorescence due to transitions metal impurities. The purity of the y-alumina used is
high - although it has been shown in ot-alumina that 20 pprn iron causes problems
under near-IR excitation .
4.3.2 Initial hydration studies
Using the original synthetic method, major changes were definitely in evidence
- figure 4. J showing the changes manifest after 5 weeks hydration, followed by
acidiGcation.
0.3
&25
0.2
c
0.1
0.05
1800 1400 1000
Wavenimiber sliift (cm-1)
600 200
Figure 4.3 FT-Raman spectrum of the first hydrated y-alumina sample.
On the previously-barren background, many low-shift peaks (<1400 cm"') are
evident. Several of these are rather strong. This is a rather surprising result.
According to the most accepted view of inorganic aluminate spectra-structure
correlation^^, no bands above ca. 950 cm"' shift corresponding to Al-0 bonding
should be evident. Either some mechanism is allowing the observation of other
species (Al-0 bridging bonds, or even 0-H related modes) or the result is spurious.
It turned out (unfortunately) to be the latter. Figure 4.4 shows a quite
different spectrum, from the very same batch of suspension - without the strong band
105

near 725 cm ' shiA, or the characteristic progression near 1400 cm ' shift. Instead, a
band near 545 cm ' appears.
The difference was only noticed when an alternative filtration method was
tried. The sample was centrifuged. to separate the supernatant liquor from the
suspended matter more thoroughly than by filtration. After this treatment, two distinct
phases were in evidence. Figures 4.3 and 4.4 are in fact spectra from the two different
phases.
It became clear that the contaminant was the Teflon (PTFE, or
poly(tetrafluoroethene) coating on tne stirring bar. Comparison against a spectrum of
bulk Teflon confirmea this. Tnererore, all subsequent hydrations were carried out
without stirring.
0.35 T -
0.23
g 0.2
a 0.15
0.1
0.05
0
1800 1400 1000
Waveniuiiber shift (cm-1)
600 200
Figure 4.4 FT-Raman spectrum of second hydrated y-alumina sample.
As mentioned above, no ill effects were noted - the equilibration times and the
final solution pH were the same, with or without stirring. However, this result would
not have come to light without the Raman study, and Teflon contamination would
have gone unnoticed, perhaps with more serious impact. The change in experimental
procedure is the first success for Raman spectroscopy in this study. In addition,
centrifuging resulted in better separation of liquor and filtrate, whilst the solid phase
also contained less water, reducing the required drying time.
An interesting feature arose during the filtration of PTFE-contaminated
samples. Acidified batches took ca. 5-10 times longer to filter by gravity through the
fine sinters used. Finely-divided alumina with a net positive surface charge due to
proton attachment apparently traps the small easily-polarisable particles of PTFE,
106
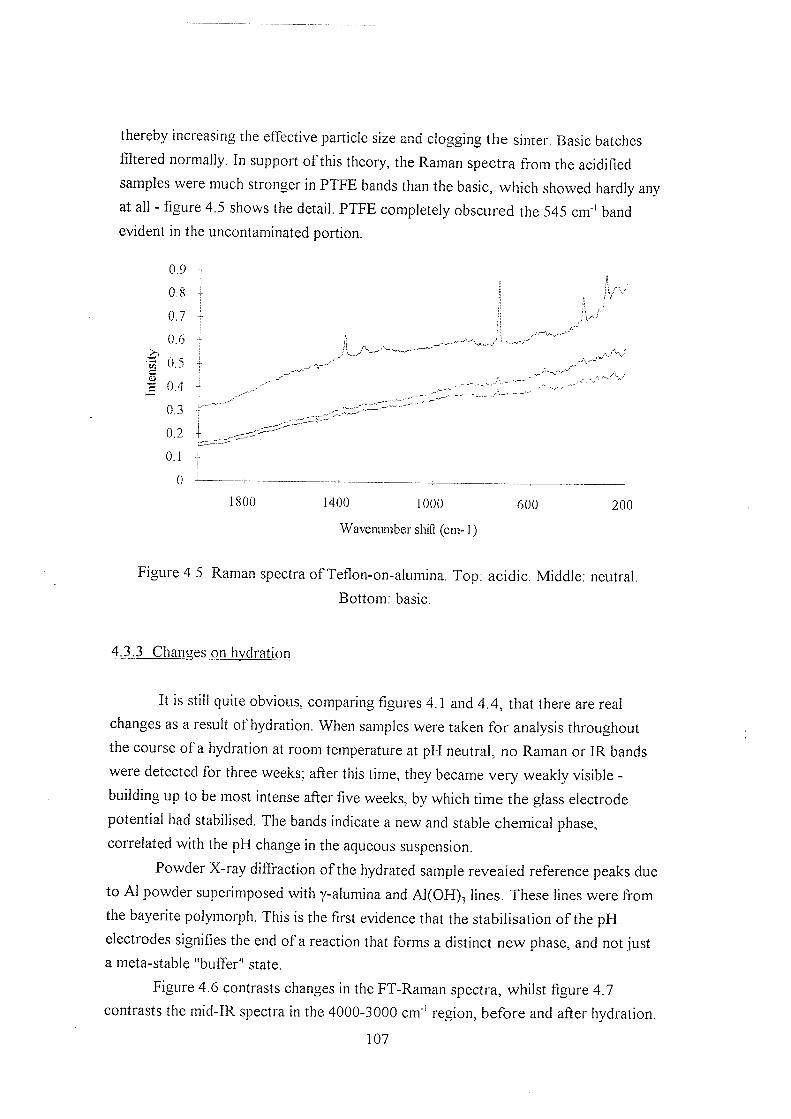
thereby increasing the eiiective particle size and clogging the sinter. Basic batches
Gltered normally. In support of this theory, the Raman spectra from the acidified
samples were much stronger in PTFE bands than the basic, which showed hardly any
at all - figure 4.5 shows the detail. PTFE completely obscured the 545 cm ' band
evident in the uncontaminated portion.
0.9
0 . 8
0.7
0.6
1 0.5
0.4
0.3
0.2
0.1
0
1800 1400 1000
Waveniuiiber shift (cm-1)
600 200
Figure 4.5 Raman spectra of Teflon-on-alumina. Top: acidic. Middle: neutral.
Bottom: basic.
4.3.3 Changes on hydration
It is still quite obvious, comparing figures 4.1 and 4.4, that there are real
changes as a result ot hydration. When samples were taken for analysis throughout
the course of a hydration at room temperature at pH neutral, no Raman or IR bands
were detected for three weeks; after this time, they became very weakly visible -
building up to be most intense after five weeks, by which time the glass electrode
potential had stabilised. The bands indicate a new and stable chemical phase,
correlated with the pH change in the aqueous suspension.
Powder X-ray diffraction of the hydrated sample revealed reference peaks due
to A1 powder superimposed with y-alumina and Al(OH)^ lines. These lines were from
the bayerite polymorph. This is the first evidence that the stabilisation of the pH
electrodes signifies the end of a reaction that forms a distinct new phase, and not just
a meta-stable "buffer" state.
Figure 4.6 contrasts changes in the FT-Raman spectra, whilst figure 4.7
contrasts the mid-IR spectra in the 4000-3000 cm ' region, before and after hydration.
107
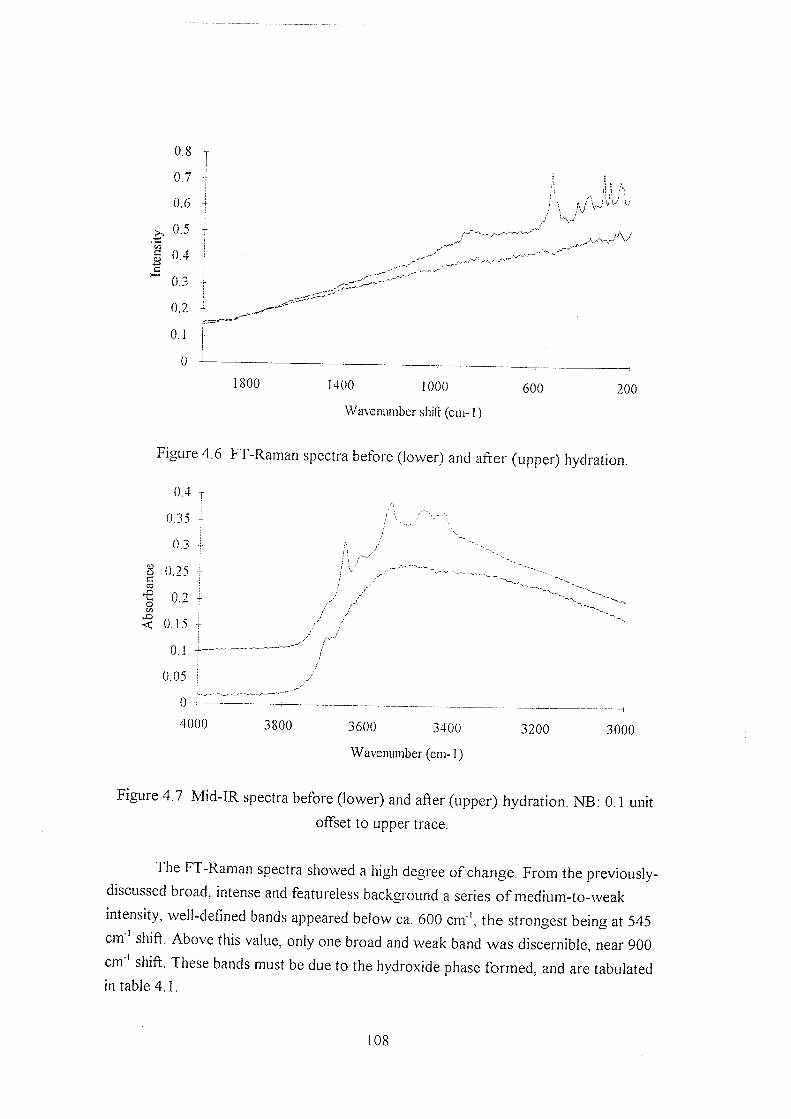
0.8
0.7
0.6
^ &4 £
0.3
0.2
0.1
0 1800 1400 1000
Waveniuiiber shift (cm-1)
600 200
Figure 4.6 FT-Raman spectra before (lower) and after (upper) hydration.
&4T
0J5
0.3
8 &25
0.2 I < CU5
0 .1
&05
0
4000 3800 3600 3400
Wavemmiber (cm-1)
3200 3000
Figure 4.7 Mid-IR spectra before (lower) and after (upper) hydration. NB: 0.1 unit
offset to upper trace.
The FT-Raman spectra showed a high degree of change. From the previously-
discussed broad, intense and featureless background a series of medium-to-weak
intensity, well-defined bands appeared below ca. 600 cm"', the strongest being at 545
cm shift. Above this value, only one broad and weak band was discernible, near 900
cm shift. These bands must be due to the hydroxide phase formed, and are tabulated in table 4.1.
108

Peak position (cm ' ) Relative intensity
1 902 Very weak and broad
1 870 As above
545 Strong slightly asymmetric
1 532 Cn Shoulder to above
524 (?) As above
434 Medium, sharo
323 Medium-to-strong, sharp
297 A^above
280 Weak but sharp
25] Medium-intensity, broad -
241 - asymmetric doublet
Table 4.1 Raman band positions in hydrated y-alumina (1000-200 cm ' shiA).
The IR data confirms this beautifully - the peak positions (given in table 4.2)
unambiguously confirm that the spectra is that of bayerite, superimposed on that of y-
alumina^.
Peak position (cm') Relative intensity
3726 Weak shoulder
3695 As above
3657 Intense and sharp feature
3620 Broad, medium-intensity
3548 As above
1 3557 Weak shoulder on above
3470 Broad, medium-intensity
1 3439 Part of asymmetric doublet
3422 - broad, medium intensity
Table 4.2 IR band positions in hydrated y-alumina (4000-3000 cm ').
Figure 4.8 shows the FT-Raman spectra of the same hydrated alumina sample
run on the Southampton FT-Raman instrument. The 0 - H stretching vibrations above
3500 cm ^ were accessible on this instrument, since the detector did not require
109
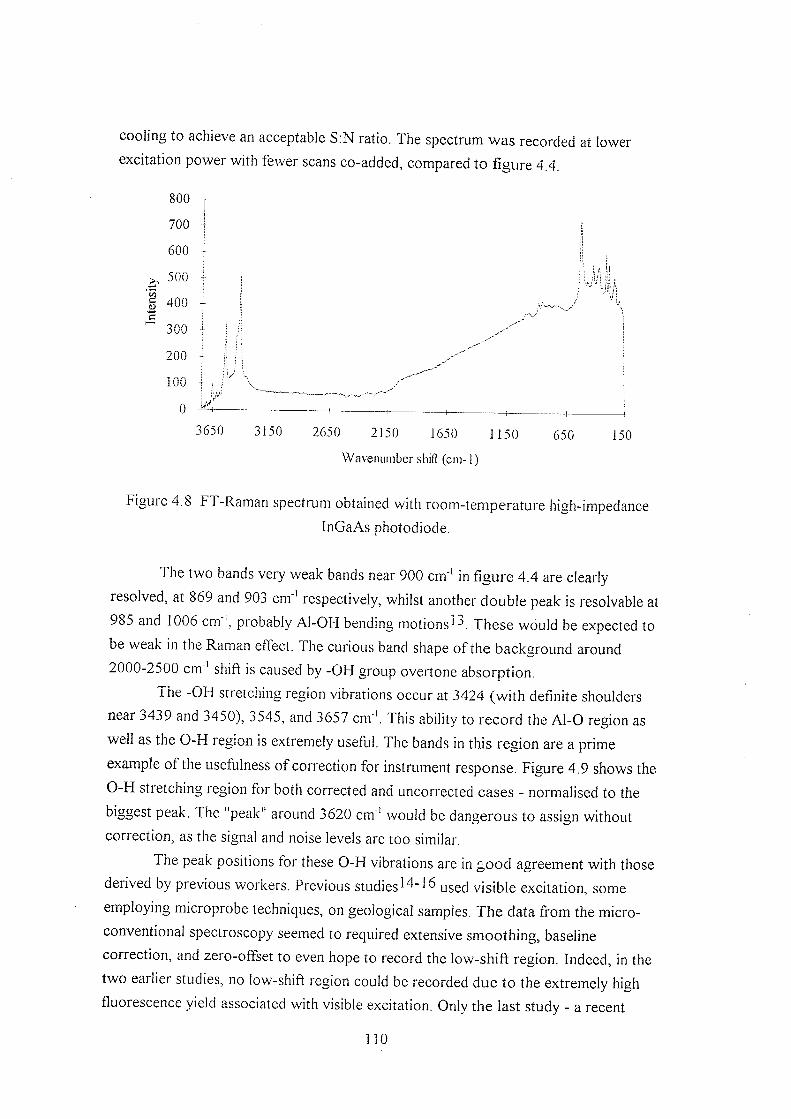
cooling to achieve an acceptable S:N ratio. The spectrum was recorded at lower
excitation power with fewer scans co-added, compared to figure 4.4,
I
800
700
600
500
400
300
200
100
0
3650 3150 2650 2150 1650 1150
Waveiuuiiber shift (cm-1)
650 150
Figure 4.b FT Raman spectrum obtained with room-temperature high-impedance
InGaAs photodiode.
The two bands very weak bands near 900 cm ' in Hgure 4.4 are clearly
resolved, at 869 and 903 cm ' respectively, whilst another double peak is resolvable at
985 and 1006 cm , probably Al-OH bending motions'-^. These would be expected to
be weak in the Raman effect. The curious band shape of the background around
2000-2500 cm ' shift is caused by -OH group overtone absorption.
ihe -OH stretching region vibrations occur at 3424 (with definite shoulders
near j 4 j 9 and 3450), 3545, and 3657 cm '. This ability to record the Al-0 region as
well as the 0 - H region is extremely useful. The bands in this region are a prime
example of the usefulness of correction for instrument response. Figure 4.9 shows the
0 - H stretching region for both corrected and uncorrected cases - normalised to the
biggest peak. The "peak" around 3620 cm"' would be dangerous to assign without
correction, as the signal and noise levels are too similar.
The peak positions for these 0 - H vibrations are in good agreement with those
derived by previous workers. Previous s t u d i e s u s e d visible excitation, some
employing microprobe techniques, on geological samples. The data from the micro-
conventional spectroscopy seemed to required extensive smoothing, baseline
correction, and zero-offset to even hope to record the low-shift region. Indeed, in the
two earlier studies, no low-shift region could be recorded due to the extremely high
fluorescence yield associated with visible excitation. Only the last study - a recent
110

publication using top-flight expensive research equipment - succeeded; this is
marked contrast to the current FT-Raman studv. in
700 T 600
500 -
400 -
i a 300 -
200
100
0 4000
. . J
3800 3600 3400
Waveiuunber shift (cm-1)
3200 3000
Figure 4.9 Corrected (upper) and uncorrected 0 - H stretching region of the Raman
spectrum.
4.3.4 Elevated temperature hydration
Raman and IR spectra of samples hydrated and then adjusted in pH (in the
manner described in the experimental section) showed few differences. Given that the
hydration time is very long compared to the pH adjustment time (ca. 120:1) - to
comply with the methods at Umea used in the potentiometric titration - it is
unsurprising.
Much more inspiring was the greatly enhanced rate of reaction found at 60°C.
After 10 days at 60°C, the integrated band area under the Raman peaks had increased
about 2-2.5 times compared to the sample at 20°C for 120 days - see figure 4.10.
The area under the background did not changed appreciably. In effect,
changing the temperature by 40°C brought about a 10l)% increase in product in 10%
of the time.
No additional bands are evident - implying the reaction products are the same
at the higher temperature. This is in accord with the IR and XRD data, which show
no additional lines or bands, and with phase diagram of the alumina-water system^.
With this extra knowledge, the study of different hydration conditions is
greatly facilitated. As an example of this, the effect of actually hydrating y-alumina at
111
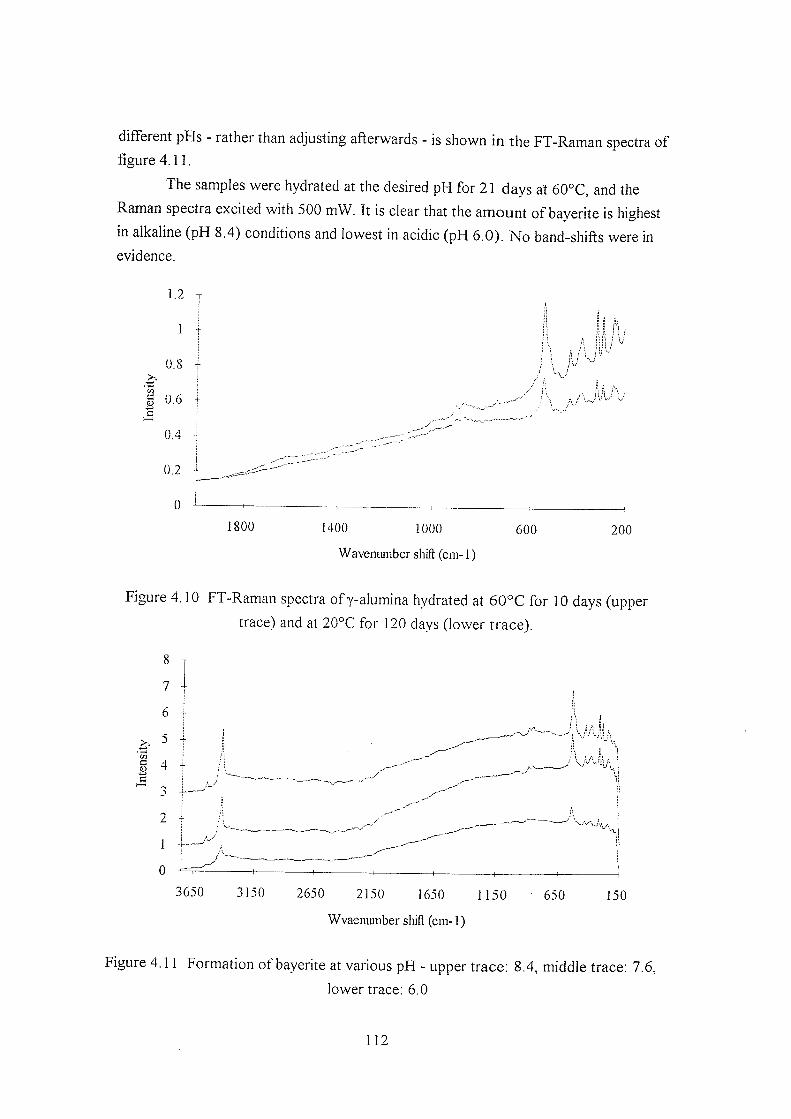
diGerent pHs - rather than adjusting afterwards - is shown in the FT-Raman spectra of figure 4.11.
The samples were hydrated at the desired pH for 21 days at 60°C, and the
Raman spectra excited with 500 mW. It is clear that the amount of baverite is highest
in alkaline (pH 8.4) conditions and lowest in acidic (pH 6.0). No band-shifts were in
evidence.
1.2
1
0.8
g a6 3
0.4
0.2
0 1800 1400 1000
Waveniuiiber shift (cm-1)
600 200
Figure 4.10 FT-Raman spectra of y-alumina hydrated at 60°C for 10 days (upper
trace) and at 20°C for 120 days (lower trace).
§
7
6
5 -
4 A .1, I
2
1
0
3630 3150 2650 2150 1650 1150
Wvaemmiber sliift (cm-1)
650 150
Figure 4.11 Formation of bayerite at various pH - upper trace; 8.4, middle trace: 7.6,
lower trace: 6.0
112

4.3.5 Boehmite
Above 100 C the product likely from the y-alumina/water system is boehmite,
the 0t-A]O(OH) form or aluminium oxyhydroxide. The FT-Raman spectrum of
boehmite is significantly different to that from y-alumina, and therefore may be
recognised easily.
5000 4500 4000 3500 3000
B 2500 5 2000
1500 1000
500
0
3650 3150 2650 2150 1650 1150
Waveiuuiiber shift (cm-1)
650 150
Figure 4.12 FT-Raman spectrum of boehmite, AIO(OH).
The background is much lower than y-alumina. The major peak is a strong AJ-
O vibration at 363 cm much more intense than anything in a comparable y-alumina
spectrum, with three other bands to higher shiA - weakest at 453 c m n e x t at 678 cm"
, with the second most-intense at 498 cm"'. In the 0 - H region, there are two weak
broad bands - compare to the three sharp bands of y-alumina - at 3088 and 3278 cm '.
When hydrated under the same conditions as the y-alumina samples, a similar
lack of reactivity is noted as for a-alumina when hydrated. The boehmite spectrum
only changed in one respect - a typical -OH absorption "inverse" band appeared
around 2250 cm"' shift, due to water incorporated in the sample,
4.3.6 Dehvdroxvlation
The degree to which the hydrated y-alumina surface dehydroxylates, and the
products formed on doing so, are also of interest to industry. Bayerite transforms
most readily into either r|-alumina or boehmite^'^^. The heating of a small portion of
i i ;

hydrated y-alumina to 200°C for 24 hours certainly removed all traces of bayerite •
see figures 4.13 and 4.14 for the Raman and IR spectra.
12
10
a
/A iVv/l/
2
0
1800 1400 1000
Wavenimiber shift (cm-1)
600 200
Figure 4.13 FT Raman spectra ot heat-treated (lower trace) and non-heat-treated
(upper trace) materials.
0.4
0J5
0.3
8 025
0.2 eg b
< CU5
0.1
0.05
0
4000 3750 3500
Waveniuiiber (cm-1)
3250 3000
Figure 4.14 Mid-IR spectra of heat-treated (lower trace) and non-heat-treated (upper
trace) materials.
Unfortunately, XRD could not discern any other form of alumina than y-
alumina. This is not all together surprising, as both transition aluminas have
tetragonally-detormed spinel structures - the difference being in the nature of the
deformation. One-dimensional disorder in the close-packed oxygen lattice is assumed
114
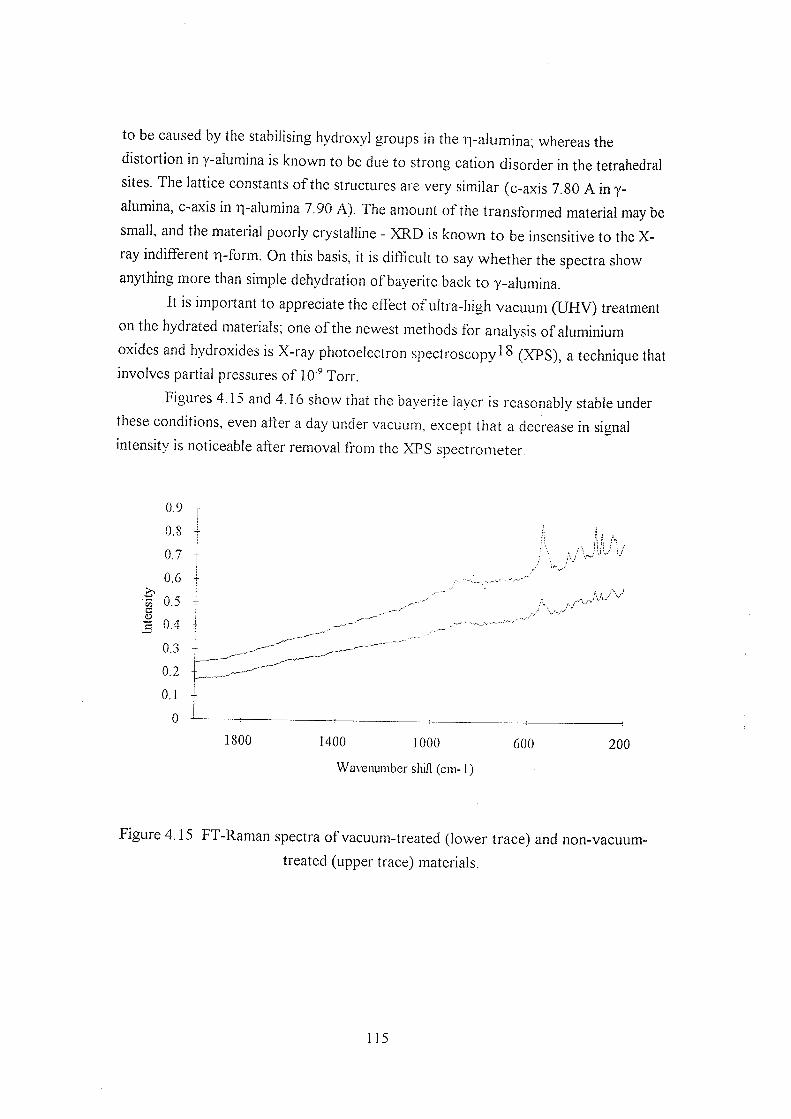
to be caused by the stabilising hydroxy! groups in the n-alumina; whereas the
distortion in y-alumina is known to be due to strong cation disorder in the tetrahedral
sites. The lattice constants of the structures are very similar (c-axis 7.80 A in y-
alumina, c-axis in T|-alumina 7.90 A). The amount of the transformed material may be
small, and the material poorly crystalline - XRD is known to be insensitive to the X-
ray indifferent T|-form. On this basis, it is difficult to say whether the spectra show
anything more than simple dehydration of bayerite back to y-alumina.
It is important to appreciate the effect of ultra-high vacuum (UHV) treatment
on the hydrated materials, one of the newest methods for analysis of aluminium
oxides and hydroxides is X-ray photoelectron s p e c t r o s c o p y 18 (XPS), a technique that
involves partial pressures of 10 ^ Torr.
Figures 4.15 and 4.16 show that the bayerite layer is reasonably stable under
these conaitions, even a tier a a ay unaer vacuum, except that a decrease in signal
intensity is noticeable after removal from the XPS spectrometer.
U.6 -
1800 1400 1000
Wavemunber shifl (cm-1)
600 200
Figure 4.15 FT-Raman spectra of vacuum-treated (lower trace) and non-vacuum-
treated (upper trace) materials.
115

C3 JO
0.4
035
0.3
&25
0.2
^ GU5
0.1
&05
4000 3730 3:00
Wavemunber (cm-1)
3250 3000
Figure 4.16 Mid-IR spectra of vacuum-treated (lower trace) and non-vacuum-treated
(upper trace) materials.
4.3.7 Phenylphosphate adsorption.
Although many more experiments concerned with hydrating y-alumina could
have been carried out, it was decided that the effect of phenylphosphate di-anion
adsorption upon the formation of bayerite should be monitored by Raman
spectroscopy. Since phosphate adsorption is known to block the hydration, and since
Fl-Raman has been shown so far to be sensitive to the changes on hydration, this
seemed likely to be successful.
Figure 4.17 shows an overlay of two spectra. The top trace was recorded
from a simple dry mixture of sodium phenylphosphate and hydrated y-alumina; the
bottom trace was recorded from a sample of hydrated y-alumina that had 1 ml of 70
mM phenylphosphate anion added to the 50 ml aliquot prior to pH-adjustment. The
amount of sodium phenylphosphate added to the dry mix corresponded to the number
of moles of anion added to the wet sample.
On the evidence of the bottom trace, phenylphosphate adsorption has
apparently not stopped the hydration, which is in direct contradiction of many
previous studies. However, by the time the phenylphosphate was added, the five-
week-long equilibration had finished and the pH adjustment was being carried out. As
stated before, this was to conform with the Umea titration methods - their interests lie
in the buffering capacity of hydrated as compared to unhydrated y-alumina. Hence
their interest in changing pH after hydration, rather than hydration at a given pH.
116

1.6 T
1,4
1.2
1
0.8
0.6
0,4
0.2
0
/ \ .A/ ,'Vl/V
1800 1400 1000
Wavenimiber shifl (cm-1)
600 200
Figme 4.17 FT-Raman spectra of y-alumina mixed with phenylphosphate (upper
trace) and adsorbed with phenylphosphate (lower trace).
This result tallies well with the results presented earlier, where no apparent
change was seen in the extent of bayerite transformation when the pH was altered
after hydration.
Nevertheless, a surface reaction involving phenylphosphate had definitely
occurred. On close comparison many phenylphosphate bands had shifted both in
position and shape upon adsorption, the most important being a 30 cm"' shift in band
position of the characteristic P-0-(C^F^ group fingerprint to be at 1222 cm'^ - to
see a shift in this band must reflect a change brought about by bonding to the
hydrated y-alumina surface.
Other bands shift, too - the strongest band in the spectra, the phenyl "ring -
bieathing mode at 1001 cm moves 4 cm"' to higher shift upon adsorption. The
companion star-of-David" mode at 1029 cm"', although weak, perceptibly shifts
down 3 cm to 1026 cm These modes are known^^ to be substituent-sensitive,
from the mono-substituted benzene spectra. However, the usually-insensitive doublet
near 1597 cm ', due to ring stretching modes, is actually perturbed in these spectra -
the well-resolved asymmetric bands at 1586 and 1596 cm blur and shift higher when
adsorbed, to yield a broader band at 1594 cm"' shift, with a weak sideband at 1604
cm"'.
Perhaps the best evidence for a surface reaction having occurred is that given
in figure 4.18, however. Here, the comparison of the Raman spectra of phosphate-
treated y-alumina and the very same sample after heat treatment at 200°C for 24
117
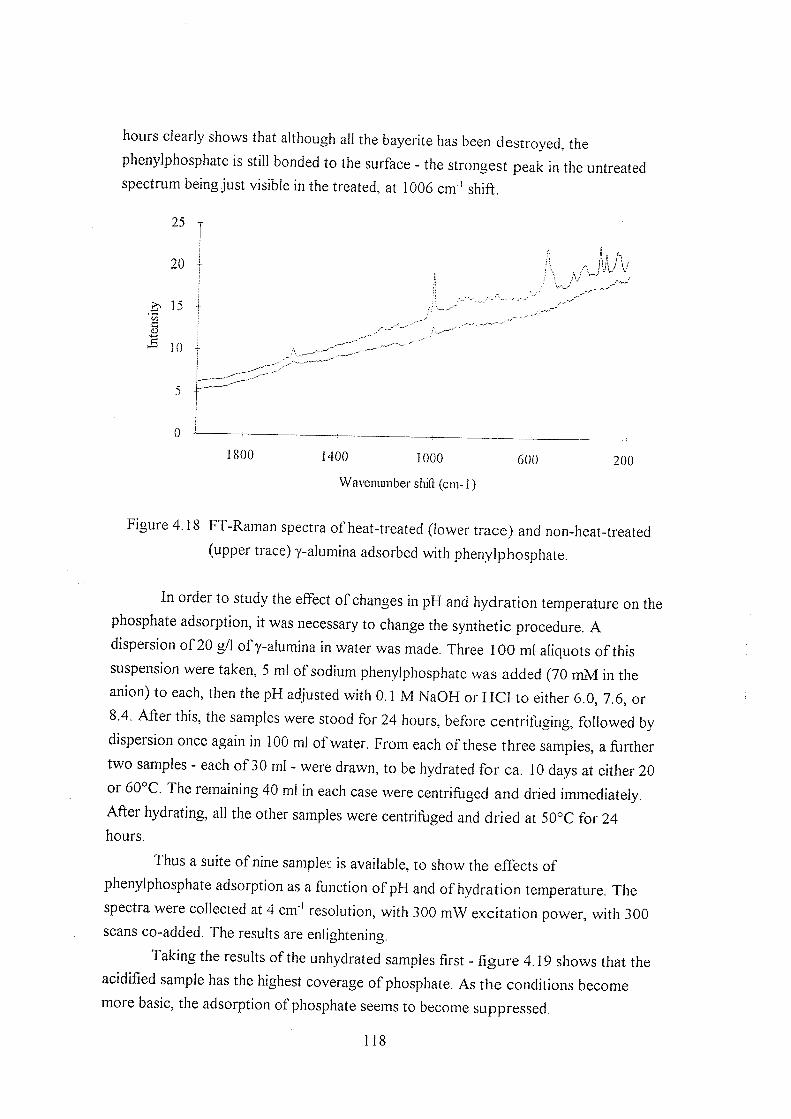
hours clearly shows that although all the bayerite has been destroyed, the
phenylphosphate is still bonded to the surface - the strongest peak in the untreated
spectrum being just visible in the treated, at 1006 cm' shift.
25
20 -
^ 15
I 10
A MA/
1800 1400 1000
Waveniuiiber shift (cm-1)
600 200
Figure 4. lb FT-Raman spectra of heat-treated (lower trace) and non-heat-treated
(upper ti ace) y-alumina adsorbed with phenylphosphate.
In order to study the effect of changes in pH and hydration temperature on the
phosphate adsorption, it was necessary to change the synthetic procedure. A
dispersion of 20 g/1 ofy-alumina in water was made. Three 100 ml aliquots of this
suspension were taken, 5 ml of sodium phenylphosphate was added (70 mM in the
anion) to each, then the pH adjusted with 0.1 M NaOH or HCl to either 6.0, 7.6, or
8.4. After this, the samples were stood for 24 hours, before centrifusing, followed by
dispersion once again in 100 ml of water. From each of these three samples, a further
two samples - each of 30 ml - were drawn, to be hydrated for ca. 10 days at either 20
or 60 C. The remaining 40 ml in each case were centrifuged and dried immediately.
After hydrating, all the other samples were centrifuged and dried at 50°C for 24 hours.
Thus a suite of nine samples is available, to show the effects of
phenylphosphate adsorption as a function of pH and of hydration temperature. The
spectra were collected at 4 cm ' resolution, with 300 mW excitation power, with 300
scans co-added. The results are enlightening.
Taking the results of the unhydrated samples first - figure 4.19 shows that the
acidified sample has the highest coverage of phosphate. As the conditions become
more basic, the adsorption of phosphate seems to become suppressed.
11!
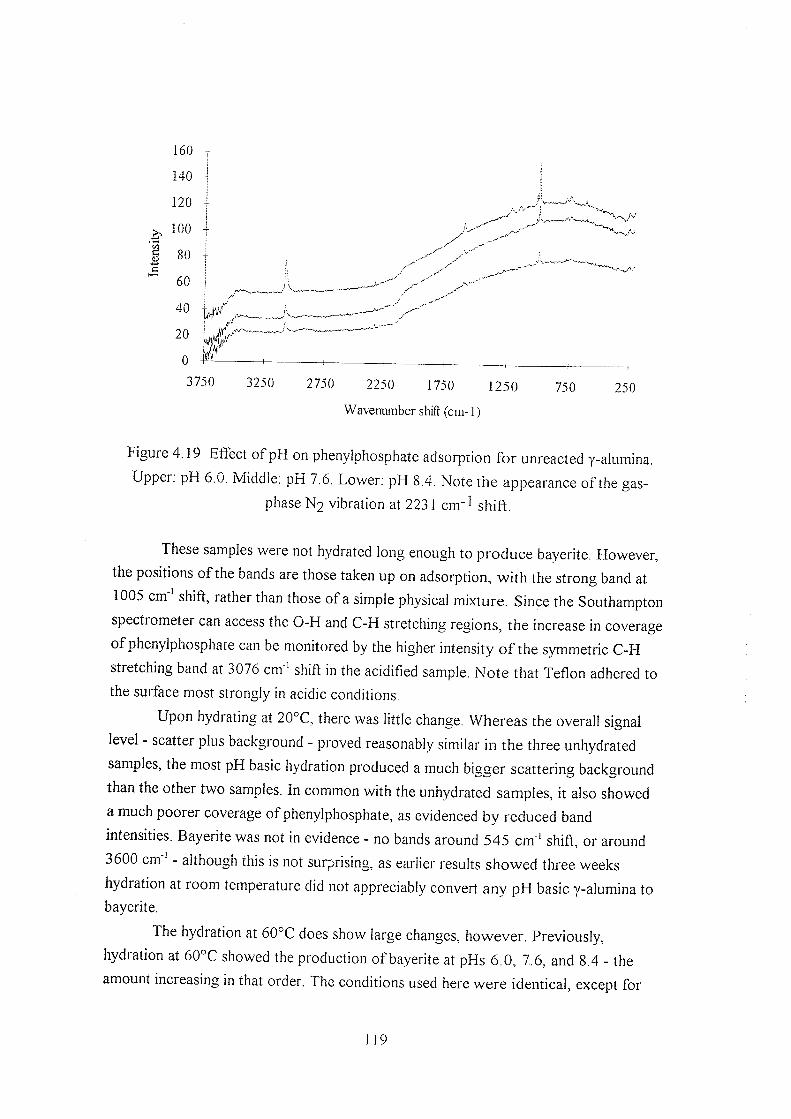
0 B c
160 T
140
120
100 -
80
60 -
40
20 {
0
J
j V
y
3750 3250 2750 2250 1750 1250
Waveiuuiiber shift (cm-1)
750 250
Figure 4.19 Effect of pH on phenylphosphate adsorption for unreacted y-alumina.
Upper. pH 6.0. Middle. pH 7.6. Lower: pH 8.4. Note the appearance of the gas-
phaseN] vibration at 223] cm'^ shift.
These samples were not hydrated long enough to produce bayerite. However,
the positions of the bands are those taken up on adsorption, with the strong band at
1005 cm shift, rather than those of a simple physical mixture. Since the Southampton
spectrometer can access the 0 - H and C-H stretching regions, the increase in coverage
of phenylphosphate can be monitored by the higher intensity of the symmetric C-H
stretching band at j076 cm shift in the acidified sample. Note that Teflon adhered to
the surface most strongly in acidic conditions.
Upon hydrating at 20°C, there was little change. Whereas the overall signal
level - scatter plus background - proved reasonably similar in the three unhydrated
samples, the most pH basic hydration produced a much bigger scattering background
than the other two samples. In common with the unhydrated samples, it also showed
a much poorer coverage of phenylphosphate, as evidenced by reduced band
intensities. Bayerite was not in evidence - no bands around 545 cm ' shift, or around
3600 cm - although this is not surprising, as earlier results showed three weeks
hydration at room temperature did not appreciably convert any pH basic y-alumina to
bayerite.
The hydration at 60°C does show large changes, however. Previously,
hydration at 60°C showed the production of bayerite at pHs 6.0, 7.6, and 8.4 - the
amount increasing in that order. The conditions used here were identical, except for
119
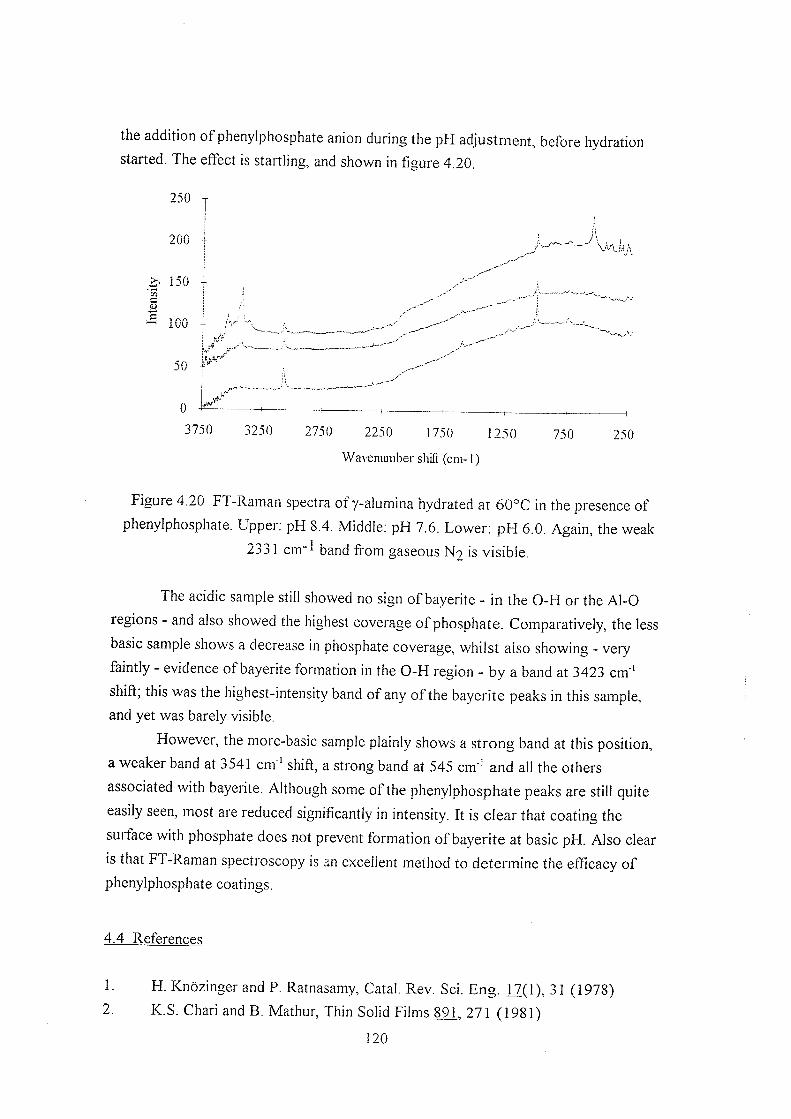
the addition of phenylphosphate anion during the pH adjustment, before hydration
started. The effect is startling, and shown in figure 4.20.
Z W T
200
& 150
I 100
50 4/
0
3750 3250 2750 2250 1750 1250
Wavenimiber shift (cm-1)
750 250
Figure 4.20 FT-Kaman spectra of y-alumina hydrated at 60"C in the presence of
phenylphosphate. Upper; pH 8.4. Middle; pH 7.6. Lower; pH 6.0. Again, the weak
2331 cm-^ band from gaseous N2 is visible.
The acidic sample still showed no sign of bayerite - in the 0 -H or the AI-0
regions - and also showed the highest coverage of phosphate. Comparatively, the less
basic sample shows a decrease in phosphate coverage, whilst also showing - very
faintly - evidence of bayerite formation in the 0 - H region - by a band at 3423 cm"'
shift, this was the highest-intensity band of any of the bayerite peaks in this sample,
and yet was barely visible.
However, the more-basic sample plainly shows a strong band at this position,
a weaker band at j541 cm ' shift, a strong band at 545 cm"' and all the others
associated with bayerite. Although some of the phenylphosphate peaks are still quite
easily seen, most are reduced significantly in intensity. It is clear that coating the
surface with phosphate does not prevent formation of bayerite at basic pH. Also clear
is that FT-Raman spectroscopy is an excellent method to determine the efficacy of
phenylphosphate coatings.
4.4 References
1.
2.
H. Knozinger and P. Ratnasamy, Catal. Rev. Sci. Eng. 17(1), 31 (1978)
K.S. Chari and B. Mathur, Thin Solid Films 8 ^ , 271 (1981)
120
3. A.M. Ahern, P R. Schwartz, and L.A. SchafFer, Appl. Spectrosc. 46(9), 1412
(1992)
4. L. Wu, W. Forsling, and P.W. Schindler, J. Colloid Interfac. Sci. 147, 148 ( l # n )
5. G.A. Parks, in "Mineral-water interface geochemistry", 23, (Ed. M.F.Hochella
Jnr. and A.F.White) 133-176 (Bookcrafters, 1990).
6. R.S. Alwitt, in "Oxides and oxide films" (Ed. J.W.Diggle and A.K.Vijh) Ch.4
(Marcel-Dekker Inc., 1976)
7. K. Wefers and G.M. Bell, Alcoa technical paper 19, Alcoa research
laboratories (1972)
8. J.B. Peri, J. Phys. Chem. ^(1 ) , 220 (1965)
9. P.J. Hendra, J.D.M. Turner, E.J. Loader, and M. Stacey, J. Chem. Phys. 78,
300(1974)
10. H. Jeziorowski and H. Knozinger, Chem. Phys. Lett. ^ ( 1 ) , 162 (1976)
11. A. Mortensen, D.H. Christensen, O F. Nielsen, and E. Pedersen, J. Raman
Spectrosc. 22, 47 (1991)
12. P. Tarte, Spectrochim. Acta 23, 2127 (1967)
13. G.A. Dorsey Jnr., J. Electrochem. Soc. 169 (1966)
14. J.T. Huneke, R.E. Cramer, R. Alvarez, and S.A. El-Swaify, J. Soil Sci. Soc. Am. 44, 131 (1980)
15. K.A. Rodgers, M R. Gregory, and R.P. Cooney, Clay Minerals 24, 531
(1989)
16. K.A. Rodgers, Clay Minerals 28, 85 (1993)
17. T.H. Walter and E. Oldfield, J. Phys. Chem. 93, 6744 (1989)
18. S. Thomas and P.J. Sherwood, Anal. Chem. 2488 (1992)
19. D.H. Williams and I. Fleming, "Spectroscopic Methods in Organic Chemistry"
4" edition (McGraw-Hill, 1987)
20. F.R. Dollish, W.G. Fateley, and F.F. Bentley, "Characteristic Raman
Frequencies of organic compounds" (Wiley Interscience, 1974)
121

Chapter 5:
Raman spectroscopy of cement minerals and related species
5.1 Introduction
During the thiee month placement with Professor Willis Forslins at the
University of Lulea, a project was undertaken to evaluate FT-Raman spectroscopy for
studies of the structure and bonding of calcium silicates relevant to the cement
i n d u s t r y ^ ' 2 Despite a century of careflil research, the chemistry of cements is still not
fully understood^'^.
FT-Raman spectroscopy oners potential advantages* in many areas over the
techniques traditionally used for cement characterisation and identification - which
include X-ray diffraction and fluorescence (XRD/F), thermal analysis (DTA, TGA,
DSC), polarised visible-light microscopies, and mid-IR absorption. FT Raman
spectroscopy is known to oe hazara-free, inexpensive, and non-destructive; and it
offers unambiguous, easy-to-interpret results very rapidly on most systems. It is
especially worth exploring in the light of the difficulties in fast, precise identification
using existing methods.
5.2 Previous work
The prospects ror Raman investigations were originally discussed by
Bensted®. 1 ne twin proolems of fluorescence and sample heating figured strongly in
his appraisal. In a later publication^, Bensted demonstrated that Raman spectra could
be collected by classical scanning methods - using a double-grating additive-
dispersion monochromator, PMT detection, macro sampling optics and visible
excitation at either Ar"^ green or HeNe wavelengths.
The quality of spectra obtained even from pure white synthetic samples was
not inspiring. Most displayed adequate S:N performance, whilst all showed an
extremely large background, increasing rapidly past ca. 1000 cm-1. This was quite
In addition, a review of mineralogical applications of vibrational spectroscopy^ had suggested that
Raman spectroscopy using near-IR e.xcitalion might be useflil in a number of mineralogical
applications.
122

fortuitous, as nearly all the strong Raman-active bands of aluminate, silicate, sulphate,
and carbonate species present occur below ca. 1200 cm"^ shiA^.
Use of a Raman microprobe^ by Conjeaud and Beyer yielded excellent data,
for much the same sort of sample. Their analysis of both synthetic cement minerals
and their analogues found in the industrial blast furnace showed that the simple
silicates were more amenable to study than aluminates or aluminoferrates, whilst the
laboratory-prepared synthetic samples were again easier to study than industrially-
prepared materials. This was attributed to the presence of ferrous iron (Fe """) in the
industrial samples as an impurity causing fluorescence.
5.3 Comments on nomenclature, synthesis and sample identification
The chemical names of the synthetic cement minerals studied are given below
in table 5.1, along with the designations used in the cement industry. The first set of
samples used were supplied by Dr. Eric Hendersson of Euroc Research, via Dr.
Vladimir Ronin. The second set were supplied directly by Mr. Roger Gollop of Blue Circle.
A distinction needs to be made between cement minerals and industrially-
prepared cements, which are mixtures that include cement minerals. Certain cement
mineral forms exist naturally, whilst others may be synthesised. Synthetic cement
minerals are prepared by high-temperature reactions from specially-selected ore
stocks or pure reagent-grade chemicals. On the scale of the industrial research
laboratory, the minimum quantity of cement synthesised tends to be in the region of
10 kilograms.
Overall, the reaction is simple - heat calcium carbonate (or limestone) and
silica (or sand) to around 1300-1600°C, calcining the carbonate to oxide, and reacting
the oxide and silica in the solid state. In comparison, industrial cement manufacture
tends to be a vast exercise. The products from industrial cement syntheses tend to be
mixed, since the reaction conditions and exact chemical composition of the reactants
in the kiln are difficult to control, given the nature of the feed stock and the amounts
of reactant involved.
123
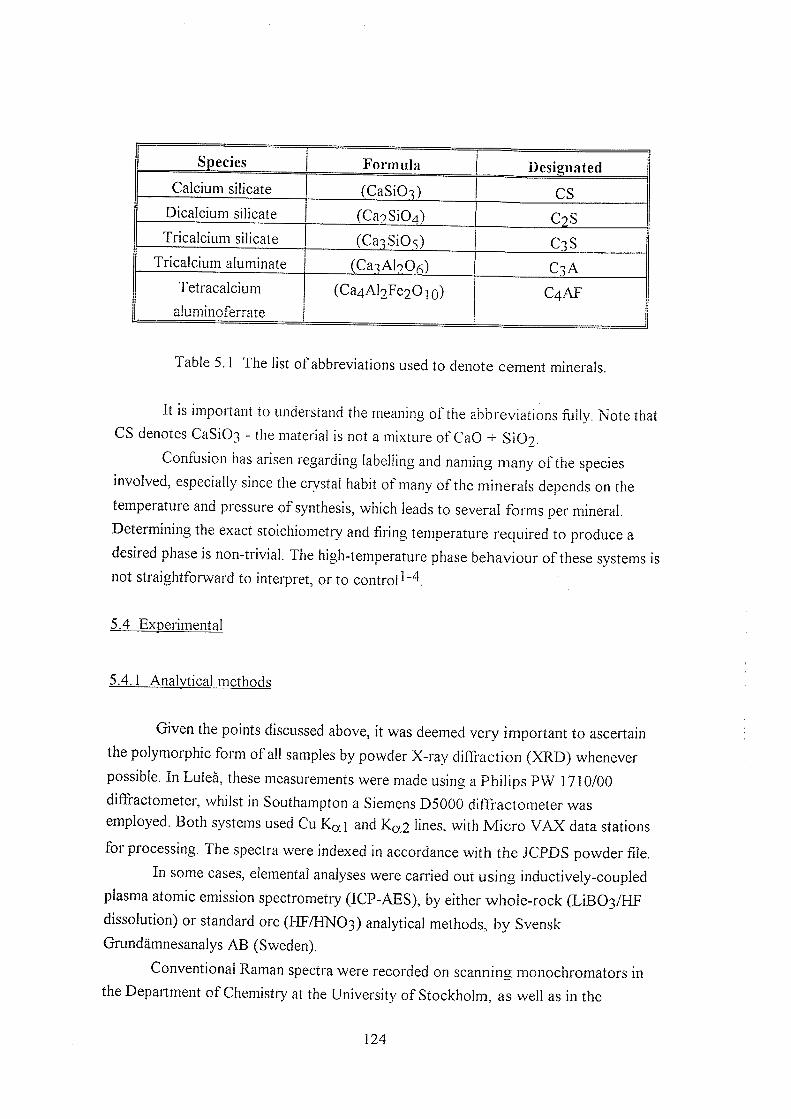
Species Formula Designated Calcium silicate (CaSiOi) CS
Dicalcium silicate (CaiSiOd) C9S Tricalcium silicate (CaiSiOs) CiS
Tricalcium aluminate (CaiAI^O^) CiA Tetracalcium
aluminoferrate (Ca^AloFeoOio) C4AF
Table 5.1 The list ot abbreviations used to denote cement minerals.
It is important to understana ine meaning of the abbreviations fiiiiy. Note that
CS denotes CaSiO] - the material is not a mixture of CaO + SiO?.
Conflision has arisen regarding laoeliing and naming many of the species
involved, especially since the crystal habit of many of the minerals depends on the
temperature ana pressure of synthesis, which leads to several forms per mineral.
Determining the exact stoichiometry and firing temperature required to produce a
desired phase is non-trivial. The high-temperature phase behaviour of these systems is
not straightforward to interpret, or to control
5.4 Experimental
5.4.1 Analytical methods
Given the points discussed above, it was deemed very important to ascertain
the polymorphic form of all samples by powder X-ray diffraction (XRD) whenever
possible. In Lulea, these measurements were made using a Philips PW 1710/00
diffractometer, whilst in Southampton a Siemens D5000 difFractometer was
employed. Both systems used Cu i and K(%2 lines, with Micro VAX data stations
for processing. The spectra were indexed in accordance with the JCPDS powder Ale.
In some cases, elemental analyses were carried out using inductively-coupled
plasma atomic emission spectrometry (ICP-AES), by either whole-rock (LiBOg/HF
dissolution) or standard ore (HF/HNO3) analytical methods, by Svensk
Grundamnesanalys AB (Sweden).
Conventional Raman spectra were recorded on scanning monochromators in
the Department of Chemistry at the University of Stockholm, as well as in the
124

Department of Chemistry at the University of Southampton. Both instruments (Dilor
in Stockholm, Coderg in Southampton) used Ar"'" laser excitation at 514.5 nm. Both
were triple additive dispersion devices equipped with PMT detection used in the
photon-counting mode.
In addition, Raman microspectroscopy usmg a single-grating based
spectrograph employing CCD detection was carried out with Ar^ green (514.5 nm),
HeNe red (6 j2.8 nm) and near-IR AlGaAs laser diode (792 nm) excitation sources on
a Renishaw Raman microscope operated in the microprobe mode.
Near-IR reflectance absorption spectroscopy was carried out using a Perkin
Elmer Lambda 19 spectrophotometer in Southampton and a NIR System 6500
spectrophotometer at the University of Umea, Sweden. Both are fully near-IR-
optimised scanning dual-beam grating instruments, equipped with diffuse reflectance
integrating sphere accessories and PbS photodetectors.
Mid-IR transmission absorption spectra were recorded in Lulea and
Southampton using Perkin Elmer 1700 series FT-IR spectrometers.
Near-IR FT-Raman spectra were recorded using Perkin Elmer 1700 series
commercial FT-IR/Raman combined benches, both in Sweden and in Southampton.
The Southampton instrument had a higher specification; it was equipped with sharper
cut-off laser rejection filters, higher-throughput quartz substrate beamsplitter, gold-
coated reflective optics and a hand-picked very sensitive InGaAs detector. In
comparison, the Lulea instrument required cooling of the detector to yield acceptable
S:N performance.
Near-IR diffuse reflectance measurements were also carried out on both the
above-mentioned Perkin Elmer 1700 series interferometers. The first (based in
Southampton) was used to study the Blue Circle cement samples, whilst the second
(based in Sweden) was used for measurements on Ca(0H)2- Spectra were recorded
against spectrophotometric grade KBr. These spectrometers were not equipped with
optimised near-IR detectors or sources for reflectance absorption spectroscopy,
which lead to low sensitivity - therefore, the detection of trace impurities and/or
defect sites was not attempted on these spectrometers.
5.4.2 Synthetic details
The feed stocks used were analytical grade reagents with very low metal ion
and extraneous matter contents - iron less than 0.05% and alkali metals around 0.1%
by mass, for typical analytical grade material. The apparatus available to carry out the
syntheses was unfortunately not ideal. Furnaces capable of heating to ca. 1600°C and
125
cooling back to ambient at a controlled and defined rate under closed atmospheres are
neither common, nor easy to gain access to. Instead, only small low-temperature
(<1500°C) open-atmosphere furnaces were available, of dubious heritage.
In Sweden, the syntheses of C2S and C3S were attempted using >99% pure
CaCOg and S1O2. in the stoichiometries 2:1 and 3:1. After dehydrating the silica at
950°C, the samples were ground in an agate pestle and mortar to pass a very fine (75
Hm) nickel sieve, loaded into a carefiilly-cleaned (conc. HNO3 / 70°C) platinum
crucible, then covered. The furnace was reasonably clean, being used in the past to
fire ceramic samples. Aftei tiring for an hour at 1350°C, the crucible was removed
with nickel tongs, emptied into the pestle and mortar, and the reactants reground with
2-3 drops of water to improve the intimacy of the mixing for five minutes before re-firing.
After five such firings, the samples were allowed to cool to room temperature
in a sealed desiccator. Cements and calcium silicates are highly hygroscopic,
especially when freshly-prepared. Although the product could be ground to form a
powder, after each successive firing it was found that the reactants were becoming
increasingly more aggregated, and had to be persuaded from the crucible with a nickel
spatula. Other than contact with the platinum crucible, the only other metal in contact
with the reactants could have been in the slight residue of unknown origin present in
the crucible before firing, further syntheses were precluded, due to the limited time
available.
In Southampton, several unavoidable changes were made. The oven could
achieve 1500 C, although it was much less clean - it had previously been used for
annealing steel engine parts. The platinum crucible was replaced with a proprietary
brand of ceramic crucible ( Alcint" from Fisons Ltd.) based on an alumina ceramic. It
was covered during use with another cmcible. The stoichiometry 2:1 CaC03:Si02
was used, with no attempt to dehydrate the silica, or to account for the incomplete
calcination of carbonate. In all other respects, the methods were the same. After the
second firing, it was noticed that the sample had turned light green in colour. This
was not noted during the Swedish syntheses. It probably reflects contamination -
particles suspended on the roof of the furnace may have fallen into the crucible when
the furnace was reloaded, since it proved impossible to load the furnace with the
second crucible "lid" on top.
Furthermore, although the Alcint crucibles used can withstand 1600°C, they
become permeable at 1500'^C, which may result in impurities leeching through the
base. After the fifth firing, the material was still light green, and was firmly stuck to
the crucible - removal from the crucible was not possible other than by smashing the
126

crucible apart. Hot calcium silicates are extremely corrosive - one of the reasons that
several furnace-owners refused to allow the synthesis. The sample was a solid
amorphous mass, fi-om which Raman spectra - but not IR - could be collected quite
simply.
5.5 Result.s
5.5.1 Euroc samples
Irrespective of choice of excitation wavelength, silicates generally have very
poor Raman scattering cross-sections^ - this results in very weak scattering, even
when high excitation powers are used. Both the classical and quantum mechanical
derivations of the expression for the intensity of vibrational Raman scattering^ show
a direct dependence on molecular polarisability^ ^ through the derived polarisability
tensor, 6ajj/6Q. Interpreted simply, silicon-oxygen (Si-0) bonds of low Ti-character
and appreciable tonicity should be weakly Raman a c t i v e G r i f f i t h s commented
on this point in his pioneering work on the Raman spectroscopy of minerals.' FT-Raman spectra of Euroc-supplied C2S and C3S are presented in figures 5.1 and 5.2 below.
I
40
35
30
25
20
15
10
5
0 ^ ^
2500 2250 2000 1750 1500 1250 1000
Waveniuiiber shift (cm-1)
750 500 250
Figure 5.1 FT-Raman spectrum of Euroc C?S.
This point has been made again very recently
127

I c
80
70
60
50
40
30
20
10
0
2500 2250 2000 1750 1500 1250 lOOO
Waveniuiiber shift (cm-1)
750 500 250
Figure 5.2 FT-Raman spectrum of Euroc C3S.
The most striking features of the spectra are the curious shape of the
background, and the lack of any obvious vibrational structure:
C2S has a maximum at 1023 cm with a shoulder near 1105 cm" \ then a weak
feature at 1 j76 cm \ whilst the background continues to decay out past 2000
cm"*.
• C3S has a sharp band at 574 cm ' shift with a shoulder at 626 cm" \ a weak
feature at 1007 cm"', and a further very weak broad peak at 1393 cm"\ whilst
the background decays more rapidly than in C2S.
Since the FT-Raman spectra were carefully corrected for instrument response,
the features seen are definitely not filter transmission artefacts*. Although the FT-
Raman spectra presented above were recorded at 16 cm"^ resolution, very little
change could be seen on comparison with 1 or 4 cm ^ resolution spectra.
Figures 5.j and 5.4 show the obtained using visible excitation at 514,5 nm on
the Dilor system in Stockholm.
All FT-Raman spectra in this chapter have been corrected for instnmiental response function^^.
128

1200 1 1 0 0 1000 900 800 700 500
W a v e n u m b e r ( c m " ' )
Figures 5.3 Conventional Raman spectrum of C2S.
1200 I 1 0 0 1000 9 0 0 800 7 0 0 600
W a v e n u m b e r ( cm )
i'igures 5.4 Conventional Raman spectrum of C^S.
It is quite clear that near-IR excitation at 1064.1 nm does not give rise to the
same spectra as expected from conventional studies. The true vibrational Raman
spectra of calcium silicates is dominated by the symmetric stretching ("breathing")
mode of the Si-0 tetrahedron, situated near 800-900 cm~^ shift. It should be noted
that the tetrahedra prevalent in silicate structures^'4' ^ ^ produce a bigger
contribution than the weakly-polarisable calcium-oxygen bonds that bind the
structures togetherI3,16 plainly evidence:
129

• C2S has a major band at 856 c m " \ a less-intense higher-shift band at 972 cm"\
and a very weak band at 1084 cm" .
C3S has a broader, less-intense main feature at 842 cm ^, no peak around 960
but a more noticeable 1084 cm"l band.
The band at 1084 cm"^ is due to the symmetric stretch of the COg^- anion of
calcium carbonate, present as a carbonation product from the reaction of atmospheric
CO2 with the small amount of calcium silicate hydrate gel produced bv adsorption of
atmospheric moisture^
The most remarkaole feature concerns the power required to excite the
scattering. The conventional study required 1 Watt of Ar^ excitation to record a
reasonably weak spectrum - in sharp contrast, 5 ^ ? ^ of near-IR excitation produced a
signal strength high enough to saturate the detection system on the FT-Raman
instrument.
The ratio of scattered to incident power developed by spontaneous Raman
scattering excited far from resonance can be described c l a s s i c a l l y a s :
^scattered / ^incident ( laser - ^^vibration)'^
Here, I has the units of power, and v is an absolute wavenumber. It can be
seen that the above relationship predicts a 25-fold decrease in scattered power on
changing eom 514.5 nm to 1064.1 nm excitation for a band at 850 cm"^ shift, for
equal excitation powers.
Ignoring detector sensitivities and instrument response functions, and
accepting difficulties in exact quantification because the spectrometers were operated
at different spectral resolutions and have different etendue values^^'^^ one fact
should be obvious - a Irue tiear-IR exciled Raman spectrum should have been almost
comyletelv unobsen>ahle
When reviewed together with the differences in both band shape and position
compared to previous work, this anomalous high intensity must be regarded as non-
vibrational in origin, and probably due to fluorescence.
Although near-IR excitation is the preferred choice for many organic species,
previous inorganic applications suggest a cautious' approach is wise^^'^^ Even if
quite pure, certain inorganic species fluoresce or pyrolyse under near-IR excitation.
This has very recently received siipport^^ - see later.
130

even at extremely low laser powers. Such compounds are not necessarily darkly-
coloured, and can vaiy from simple binary salts to complex co-ordination compounds;
the common factor is that all contain transition metals. None of the compounds in this
study other than C4AF were deeply-coloured at all - mostly off-white, cream, or very
light blue/green.
It should be said that both C3A and C4AF supplied by Euroc behaved exactly
as previous FT-Raman studies of aluminates and ferrates suggested - C3A gave a
broad and featureless background, whilst C4AF simply pyrolised and gave a thermal
emission spectrum, even at tne lowest laser powers and after strong dilution in
potassium bromide (KBr).
XRD showed the material supplied by Euroc to be quite pure, in cement
chemistry terms; C2S was identified in the p-polymorph (JCPDS 33-302), whilst C3S
was shown to contain a little pure triclinic C3S (JCPDS 31-301), but mainly the form
known as alite - 54CaO.l6SiO2.AI2O3.MgO (JCPDS 13-272). This is the usual form
that C3S takes up in industrial syntheses; the structure of 54Ca0.18Si02 is essentially
built up of two unit cells each containing nine C3S molecules, with two SKD? units
being replaced by one MgO and one AI2O3.
ICP-AES revealed a different story. The Euroc samples were made by the
reaction of selected limestone and silica sand deposits in a magnesia pot with calcium
fluoride flux, and contain a huge range of metal ion impurities. Table 5.2 lists the
constituents as revealed by ICP-AES.
Several of the metal listed are known to be incompatible with successful near-
IR-excited Raman spectroscopy in certain environments. These species include Fe- "
(ca. 0.2% by mass) and Mn^"^ (ca. 0.05% by mass), which are present in both
samples; chromium, lead and tungsten are all present in the 25-55 parts per million
(ppm) range.
ihe level of doping required for observable luminescence emission from
minerals is of the order of 0.1%, or 1000 ppm^S for iron and manganese. The
sensitivity of near-IR FT-Raman spectrometers is such that 200 ppm iron impurity
produced luminescence which completely obliterated any observable Raman features
from a sample of alumina (AI2O3), whereas 20 ppm produced acceptable results^^.
131

Species C?.s CiS Si(D9 34.3 ±0.1 25.3 ±0.1
AI2O3 0.789^=0.001 0.351 ±CX001 1
CaO 61.4 ±0.3 68 .9±&3
Fe203 0.217 ± 0.001 0.254 ±(X001 i
K9O 1.33 ±0.001 0.0480 ±0.0027
Na^O 0.158 ±0.001 0.0384 ±0.0006
Tno? 0.0168 ±0.0002 0.0144 ±0.0001
P2O5 0.0493 ± 0.0023 0.0480 ±0.0011 MgO 0.484 ±0.002 1.44 ±0.01
MnO 0.0464 ± 0.0003 0.0528 ±CX0002
Ba 18.4±0.1 14.8±0.1
Cr 28.1 ±6.3 53.9 ± 1.9
La <12 6 <11.8
Ni <6 29 18.8± 1.3
Pb 40.7 ±6 .8 27.0 ± 8.2
Sr 698 ± 1 768 ± 1
W 34.9 ±9 .4 49.4 ±5 .5
Zn 44.5 ±0 .2 23.5 ±0.3
Zr 18.4 ±0 .4 12.8±0.1
Table 5.2 ICP-AES data on Euroc-supplied C2S and C3S. Species Si02-Mn0
quoted as % weight; thereafter, as parts per million (ppm) by weight. Limits bound
95%oconGdence(2olevd).
The prospects for the success do not seem high - fluorescence from one or
more of the metal ions present therefore seems a good explanation for the appearance
of the near-IR excited spectra, and rather damns FT-Raman as a method for analysis.
However, there were three good reasons to continue the study;
No definite assignment had been made for the cause.
The emission from the calcium silicates displayed rarely-seen structure.
The failure of near-IR excitation on many inorganic species is a major concern for
the technique, and should be investigated.
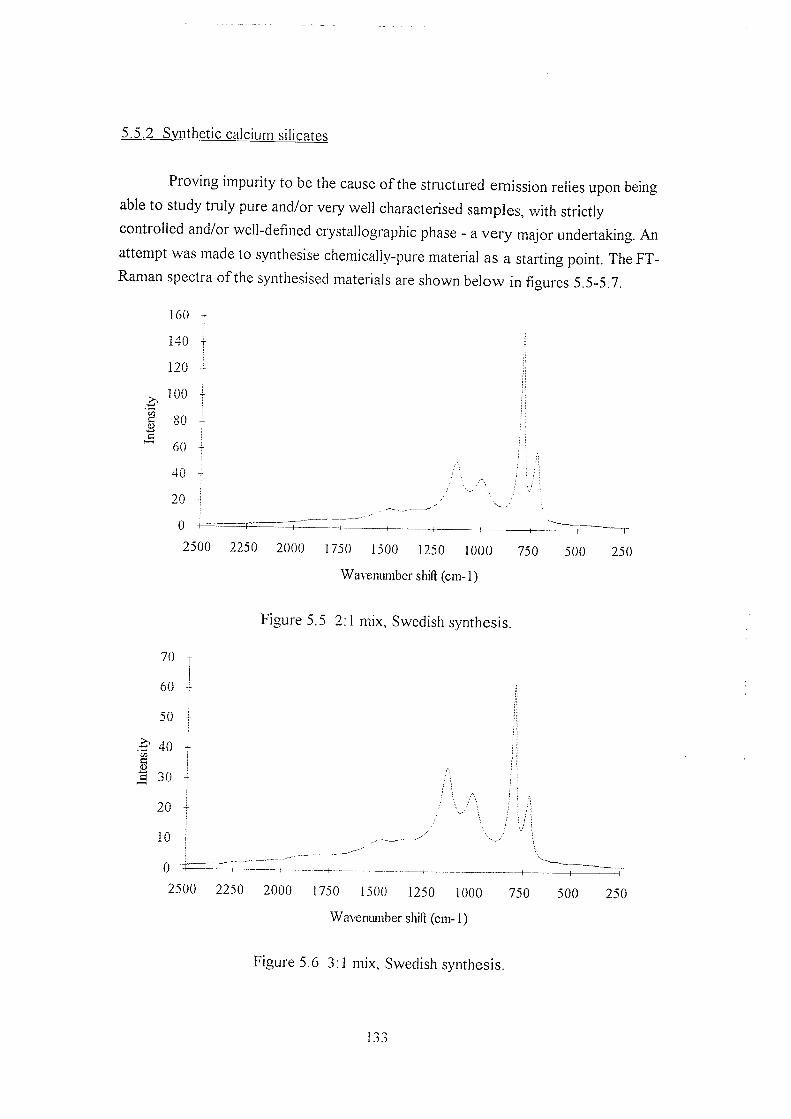
5.5.2 Synthetic calcium silicates
Proving impurity to be the cause of the structured emission relies upon being
able to study truly pure and/or very well characterised samples, with strictly
controlled and/or well-defined crystallographic phase - a very major undertaking. An
attempt was made to synthesise chemically-pure material as a starting point. The FT-
Raman spectra of the synthesised materials are shown below in figures 5.5-5.7.
160
140
120
100
1 80 -
6 0 -
40
20
0
2500 2250 2000 1730 1300 1230 1000
Waveniuiiber shift (cm-1)
730 300 230
Figure 5.5 2:1 mix, Swedish synthesis.
70
60
30
# 40
a 30
20
10
0 i
/ \
2300 2230 2000 1730 1300 1230 1000
Waveniuiiber shift (cm-1)
730 300 230
Figure 5.6 3:1 mix, Swedish synthesis.
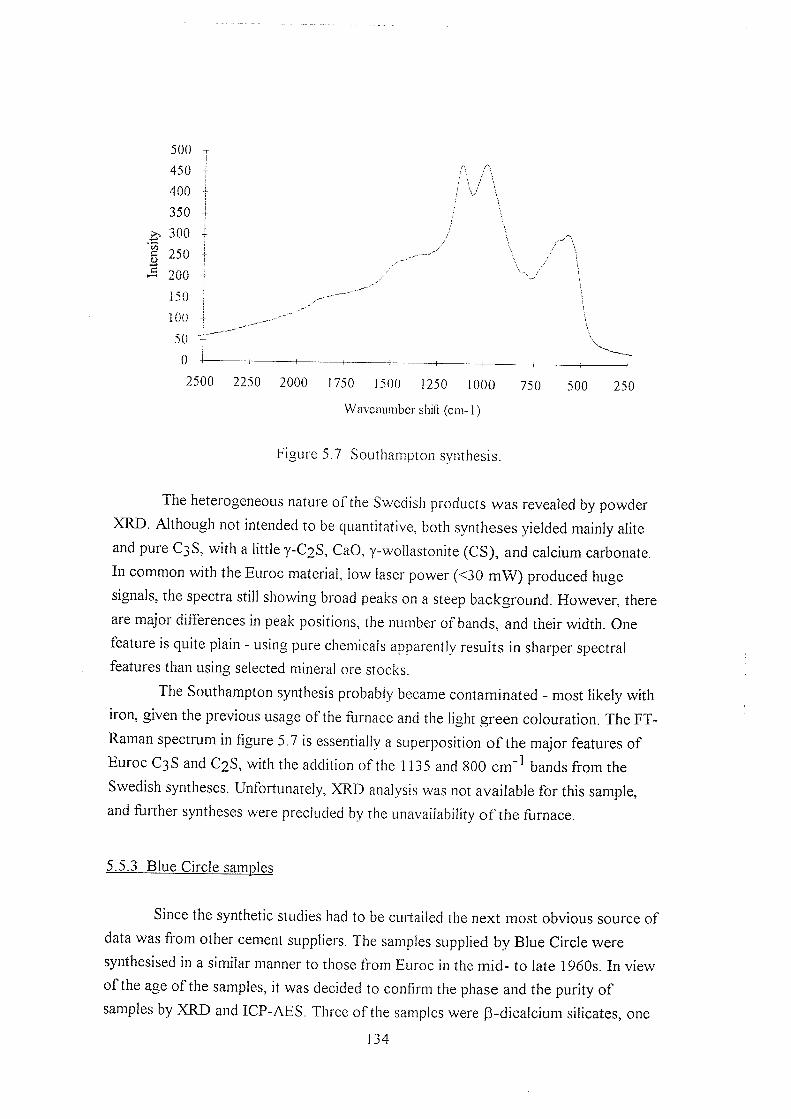
500
450
400
350
^ 300
# 250
200
150
100
50
0
..--•A.
2500 2250 2000 1750 1500 1250 1000
Wavenimiber shift (cm-1)
750 500 250
Figure 5.7 Southampton synthesis.
The heterogeneous nature of the Swedish products was revealed bv powder
XRD. Although not intended to be quantitative, both syntheses yielded mainly alite
and pure C3S, with a little y-C2S, CaO, y-wollastonite (CS), and calcium carbonate.
In common with the Euroc material, low laser power (<30 mW) produced huge
signals, the spectra still showing broad peaks on a steep background. However, there
are major differences in peak positions, the number of bands, and their width. One
feature is quite plain - using pure chemicals apparently results in sharper spectral
features than using selected mineral ore stocks.
The Southampton synthesis probably became contaminated - most likely with
iron, given the previous usage of the furnace and the light green colouration. The FT-
Raman spectrum in figure 5.7 is essentially a superposition of the major features of
Euroc C3S and C2S, with the addition of the 1135 and 800 cm~^ bands from the
Swedish syntheses. Unfortunately, XRD analysis was not available for this sample,
and further syntheses were precluded by the unavailability of the furnace.
5.5.3 Blue Circle samples
Since the synthetic studies had to be curtailed the next most obvious source of
data was from other cement suppliers. The samples supplied by Blue Circle were
synthesised in a similar manner to those from Euroc in the mid- to late 1960s. In view
of the age of the samples, it was decided to confirm the phase and the purity of
samples by XRD and ICP-AES. Three of the samples were P-dicalcium silicates, one
134

of which was stabilised with ca. 0.5% boron oxide (B2O3) during synthesis. The
fourth was y-dicalcium silicate, the fifth pure triclinic tricalcium silicate, and the sixth
alite - monoclinic pseudo-CgS, as discussed above.
Conventional Raman spectroscopy using the Southampton Coderg
spectrometer with Ar green excitation at 514.5 nm revealed no surprises - a high
background, weak scattering, with sharp vibrational features due to Si-0 bonding
between 800-900 cm . Subsequent re-examination using a far more sensitive and
efficient spectrograph-based Raman microscope yielded similar data and the same
conclusion.
The FT-Raman spectra of the P-C2S samples without stabiliser are shown
below in figures 5.8 and 5.9. The spectra are almost identical to that fi-om the Euroc P
-C2S sample. XRD data confirmed unquestionably the phase of these samples
(JCPDS 33-302).
%
30
25
20
15
10
5
0
2500 2250 2000 1750 1500 1250 1000
Waveniuiiber shift (cm-1)
750 500 250
Figure 5.8 Blue Circle |3-C2S #1.
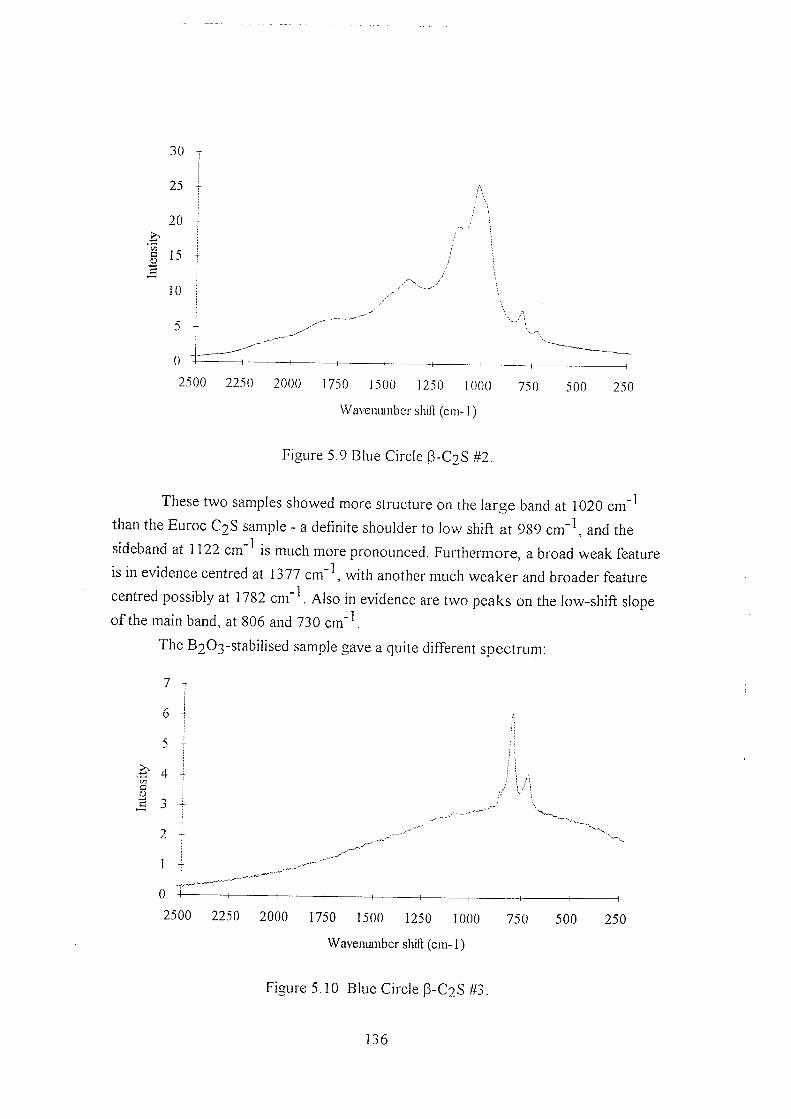
B c
30
25
20
15
10
0 4 ^ ^ ^ ; ,
2500 2250 2000 1750 1500 1250 1000
Waveniunber shift (cm-1)
750 500 250
Figure 5.9 Blue Circle B-C9S #2.
These two samples showed more structure on the large band at 1020 ci - 1 than the Euroc C2S sample - a definite shoulder to low shift at 989 cm"\ and the
sideband at 1122 cm is much more pronounced. Furthermore, a broad weak feature
is in evidence centred at 1377 cm \ with another much weaker and broader feature
centred possibly at 1782 cm Also in evidence are two peaks on the low-shift slope
of the main band, at 806 and 730 cm"\
The B2O]-stabilised sample gave a quite different spectrum:
7
6
g
2
1 -
0 4
2500 2250 2000 1750 1500 1250 1000
Waveniuiiber shift (cm-1)
750 500 250
Figure 5.10 Blue Circle P-C2S #3.
136

Three bands at 860, 802, and 725 crnr^ are clearly in evidence, but the
background has markedly less structure and quite different profile. Since XRD
conBrmed the phase of the material, the changes compared to figures 5.8 and 5.9
must be due to the added BoOg The addition of 0.5% B2O3 appears to quench the
broad emission near 1000 cm shift. XRD can not easily reveal the whereabouts of
light atoms, since the scattering of X-rays is weak from such small areas of electron
density, and the concentration of B2O3 in the silicate is low (1:200); perhaps the
oxide perturbs the crystal structure and changes the fluorescence cross-section so that
non-radiative decay may be favoured.
in order to check whetner the added stabiliser gave an unusual Raman
spectrum B2O3 was re-analysed with near-IR excitation. In accordance with the well-
known hygroscopic conversion of boron oxide to hydroboric acid^^ a 25 year old
sample of B 2 O 3 gave an excellent fluorescence-tree B ( 0 H ) 3 spectrum with a weak
but definite band near 808 cm ^ shift confirming the presence of very little
unconverted oxide - figure 5 .11 shows the overlaid and offset spectra of new B(0H)3
and old B2O3, in accordance with known Raman data^^.
1
8
7
6
5
4
3
2
1
0
3400 3000 2600 2200 1800 1400
Waveiuunber shift (cm-1)
1000 600 200
Figure 5.11 FT-Raman spectra of BoOj (upper) and B(OH)] (lower).
Returning to the comparison of cement samples, the two bands near 800 cm~^
shift were apparent in all FT-Raman spectra from the synthetic materials as well as the
Blue Circle P-CoS samples. Since the Euroc samples have broadened features near
1000 cm ^ it is quite possible that these bands are weakly present in the Euroc
materials too.
137

The band broadening possibly reflects a higher content of transition metals in
the Euroc samples. ICP-AES data on Euroc P-C2S reveals that level of iron in the
sample (ca. 1500 ppm) is ca. 10 times greater than that in Blue Circle P-C2S and both
tricalcium silicate samples (ca. 80-125 ppm). Table 5.3 gives the analysis for these
samples.
1 Species P-C2S Y-CzS Monoclinic
C3S
Triclinic
C3S
1 ^ 190 ± 1 890 ± 7 4600 ± 1 2 486 ± 1
Ca 4 3 9 0 0 0 ±
614
4 5 1 0 0 0 ±
1667
5 0 0 0 0 0 ±
3901
4 7 7 0 0 0 ±
1765
Fe 122 ± 1 665 ± 6 141 ± 1 8 1 . 7 ± 0 . 5
K 59.0 ± 16.2 <50 < 5 0 101 ± 4 4
M g 75.0 ± 2 . 9 1520 ± 1 4 7920 ± 2 3 53.8 ± 2 . 7
Na 234 ± 2 3 56.7 ± 10.3 < 2 0 92.8 ± 3 3 . 6
Mn 2.46 ± 0 . 1 9 287 ± 2 1.94 ± 0 . 1 4 1.86 ± 0 . 0 8
As <3.03 <2 85 <2 9 0 <2 .92
Ba 6.13 ± 0 . 0 7 13.0 ± 0 . 3 47.1 ± 0 . 2 34.1 ± 0 . 1
Co < 1 0 1 <0 948 1.23 ± 0 . 1 9 <0:972
Cr <3 03 8 . 1 4 ± 0 . 7 1 <2 9 0 <2 92
Cu 122 ± 1 58.1 ± 0 . 5 206 ± 1 < & 9 7 2
M o <5 05 <4 74 <4 83 <4 86
Ni 1.36 ± 0 . 7 8 1.05 ± 0 . 8 9 1.56 ± 1 . 1 3 1 3 . 7 ± 1.2
Pb < 1 0 1 <9 48 <9 6 7 < 9 J 2
Sr 43.3 ± 0 . 2 586 ± 4 464 ± 1 370 ± 1
V < 1 0 1 <&948 1 6 0 ± 0 . r 7 1 1.24 ± 0 . 2
Table 5.3. ICP-AES data on Blue Circle-supplied P-C2S, Y-C2S, monoclinic C3S,
and triclinic C3S. Species quoted as parts per million (ppm) by weight. Limits bound
95%oconGdence(2oleve^.
Turning to the other samples, the structure of Y-C2S was also confirmed by
XRD (JCPDS 31-297). The FT-Raman spectrum is given in figure 5.12. This is
surprisingly different from the (3-C2S samples. An extremely strong and sharp band
appears at 802 cm \ whilst another sharp but weaker band lies to low shift at 724
cm"*.
138

300
250
200
150
100
50 t
0
2500 2250 2000 1750 1500 1250 1000 750 500 250
Waveniuiiber shift (cm-1)
Figure 5,12 FT-Raman spectrum of Blue Circle y-C2S,
However - the curious point is that the power recniired to excite spectra so
intense that the detection electromcs saturated for an hour was not iveasnrable on
///g /Ae That is. /W? J mPK This
intensity is far higher even than the pre-resonance scattering of polydiacetylene
polymers that saturate the detector near 3-4 mW, and proved absolutely repeatable.
tsven more curiously, the spectra could be repeated (albeit less intense) with
the laser switched off and the beam path blocked. This startling result lends great
weight to the argument that the spectra are due to luminescence, not Raman
scattering - the only explanation possible is that the "scattering" was caused by the
very small amount of light from the HeNe reference laser that falls onto the sample in
the Raman sample compartment, even on the commercial FT-Raman spectrometers.
A l t h o u g h s e e m i n g l y difficult to believe, this has been confirmed r e c e n t l y 2 4 Excitation
at 6j2.8 nm produces emission which is fixed in wavelength (unlike Raman
scattering, where the shift is constant) and must be luminescence. Also surprising is
the lack of a strong fluorescence background on the near-IR spectra.
In both monoclinic and triclinic C3S the fluorescence background returns - sec
figures 5.1j and 5.14 respectively - although the two bands at 801 and 722 cm'^ are
still in evidence. However, the monoclinic sample also has a broad band at 660 cm" \
whilst the triclinic sample has this feature shifted to 545 cm" , revealing a shoulder to
higher shift near 612 cm"\
1 3 9
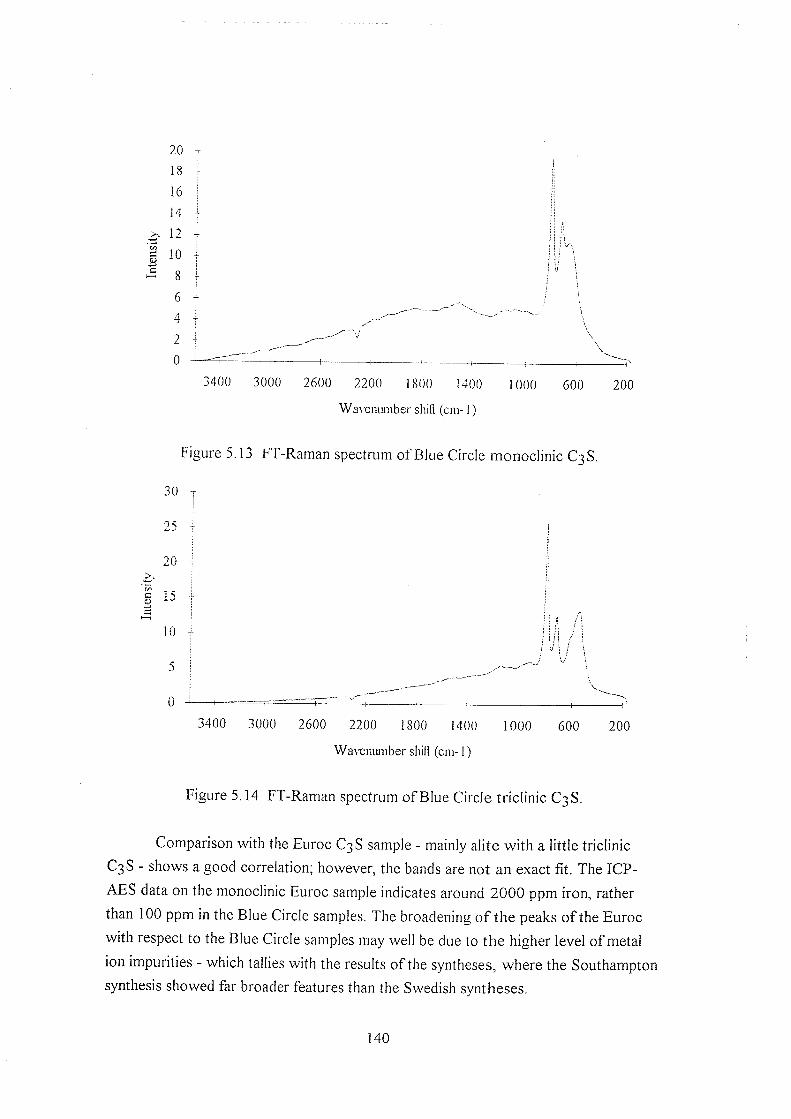
20
18
16
14
12
1 1 ° ^ 8
6
4
2
0
3400 3000 2600 2200 1800 MOO
Wa'i'eniunber shifl (cm-1)
1000 600 200
Figure 5.13 FT-Raman spectrum of Blue Circle monoclinic CgS.
30
25
20
i 15
10
3400 3000 2600 2200 1800 MOO
WaA'eiuuiiber sliifl (cm-1)
1000 600 200
Figure 5.14 FT-Raman spectrum of Blue Circle triclinic C3S.
Comparison with the Euroc C3S sample - mainly alite with, a little triclinic
C3S - shows a good correlation; however, the bands are not an exact fit. The ICP-
AES data on the monoclinic Euroc sample indicates around 2000 ppm iron, rather
than 100 ppm in the Blue Circle samples. The broadening of the peaks of the Euroc
with respect to the Blue Circle samples may well be due to the higher level of metal
ion impurities - which tallies with the results of the syntheses, where the Southampton
synthesis showed far broader features than the Swedish syntheses.
140

Since the near-IR excitation of Raman scattering in the cement minerals is
compromised by a strong and very unusual luminescence, and because absolutely no
details could be found in the literature, furtner studies were carried out to investigate
the problem.
5.5.4 Comparisons against simple systems
A survey of a range of simple species containing silicate and/or calcium
cations was undertaken, to see whether these Raman spectra under near-IR excitation
were also anomalous. 1 he survey proved enlightening.
5.5.4.1 SiO?, A h O i , and FeiOi
ihe 1"T-Kaman spectrum of powdered silica shows a sharp band at 464 cm'^
shift, superimposed on a high background; the peak position is in good agreement
with previous studies-". Also in good agreement with previous near-IR-excited
Raman woik is the bioad and structureless fluorescence of ot-alumina, centred at
around IbOO cm s h i f t - r e r r o u s oxide gave a strong fluorescence spectrum excited
with <5 mW power to avoid burning and thermal emission. This is quite different
from the case of visible excitation-''^, where iron oxide spectra are possible to obtain
under the correct conditions. 1 he contrast between the extremely broad fluorescence
and the structured fluorescence of the supplied and the synthesised cement minerals is
quite obvious.
The errect of iron as an impurity in quartz is seen in the upper trace of figure
5.15. Ihe 1 -Raman spectrum here shows an intense background, with a broad peak
near 58j cm shift, with a weaker broad peak to higher shift at 974 cm~^. Also in
evidence is a much narrower band at 464 cm ^ shift, as a sideband to low shift side of
the strongest peak. This is the "breathing" mode in the Si04^~ unit, as evident in
spectra of powdered silica. All the other features are almost certainly due to
fluorescence, due to the iron which gave this particular quartz sample its distinctive
light yellow hue.
This was proven in the following manner. After pulverising a small section,
grinding, and repeated washing with concentrated hydrochloric acid and distilled
water to pH neutral, the FT-Raman spectrum was again obtained. The effect of the
washing should have been to remove the iron as iron chloride - and the lower trace of
figure 5.15 shows that this took place. The major feature in this spectrum is the 464
141

cm ^ silica band, and although the spectrum does have a background at least it is
quite flat, and the other weaker silica features are visible.
7
6
5
4
I 3
2 4
0
2500 2250 2000 1750 1500 1250 lOOU
Wavenuinber shift (cm-1)
750 500 250
Figure 5.15 Fl -Raman spectra ot natural (upper) and washed (lower) quartz.
5.5.4.2 CaSiO:
To augment the comparison with silicates, CaSiOi was obtained from the
Aldrich Chemical Co. through Professor Ian Beattie. This sample of Wollastonite
(designated CS) was fairly pure, and gave a good and recognisably vibrational FT-
Raman spectrum - see figure 5.16. It is probably the first evidence that calcium
silicates do have a vibrational spectrum that is amenable to FT-Raman study. Not
only is this cause for hope, for near-IR Raman spectroscopy of calcium silicates as a
group, but it also neatly displays the unpredictability of FT-Raman methods in solid-
state inorganic chemistry.
The spectrum has a strong background, peaked near 1600 cm"* shift, on
which are grouped several sets of intense, sharp Raman bands. The three major bands
are at 985, 578, and 371 cm"*.
These positions do not agree 'veil with the niicroprobe spectra of (3-CS by
Conjeaud and Boyer, who reported 971, 638 and 412 cm"* shift for these bands^.
The reason for this difference is not clear. It is known that P-CS exists in closely-
related monoclinic and triclinic forms. Since no crystallographic data was available for
the supplied sample, it is possible that the sample is actually not the same polymorph
as studied by the previous authors. However, the bands are certainly vibrational, as
opposed to the broad intense and featureless peak near 1600 cm"*, which is much
142

more reminisccnt ot a classic FT-Raman fluorescence background, like that in
ferrous oxide.
800
700
600
500
400
300
200
100
0
2500 2250 20W 1750 15W 1250 mOO 750 500 250
Waveiuuiiber shift (cm-1)
Figure 5.16 FT-Raman spectrum ofWollastonite.
5.5.4.3 CaO and CaCOHDo
CaO provided several very interesting results. Despite having no coloration at
all^^ in the solid state, CaO has electronic states in the gas-phase just inside the UV
and near-IR regions, at 385 nm and 865 nm respectively^^. Most interestingly, it
possesses a fully-allowed transition at 1162 nm - just 790 cm" ^ to the red of the
exciting line.
The FT-Raman spectrum of CaO shown below in figure 5.17 is composed of
one strong and narrow band at 644 cm \ with three weaker and broader bands at
around 770, 1025, and 1444 cm ' shift. It has similar overall appearance to several of
the luminescence spectra from the cement minerals. The laser power, however, was
around 200 mW, far higher than for most of the calcium silicates, and far more
characteristic of a Raman spectrum.
CaO crystallises in the rock salt (NaCl) face-centred cubic system for which
there should be^2"^4 no first-order (fundamental) Raman bands - this has been
commented on before in the literature-'^. On comparison with this reference, the
closest match for the 644 cm ^ band in the FT-Raman spectrum is one of the features
seen in polarised second-order (overtone/combination) spectra near 655 cm'^.
According to the literature, however, the second-order Raman spectrum was
143
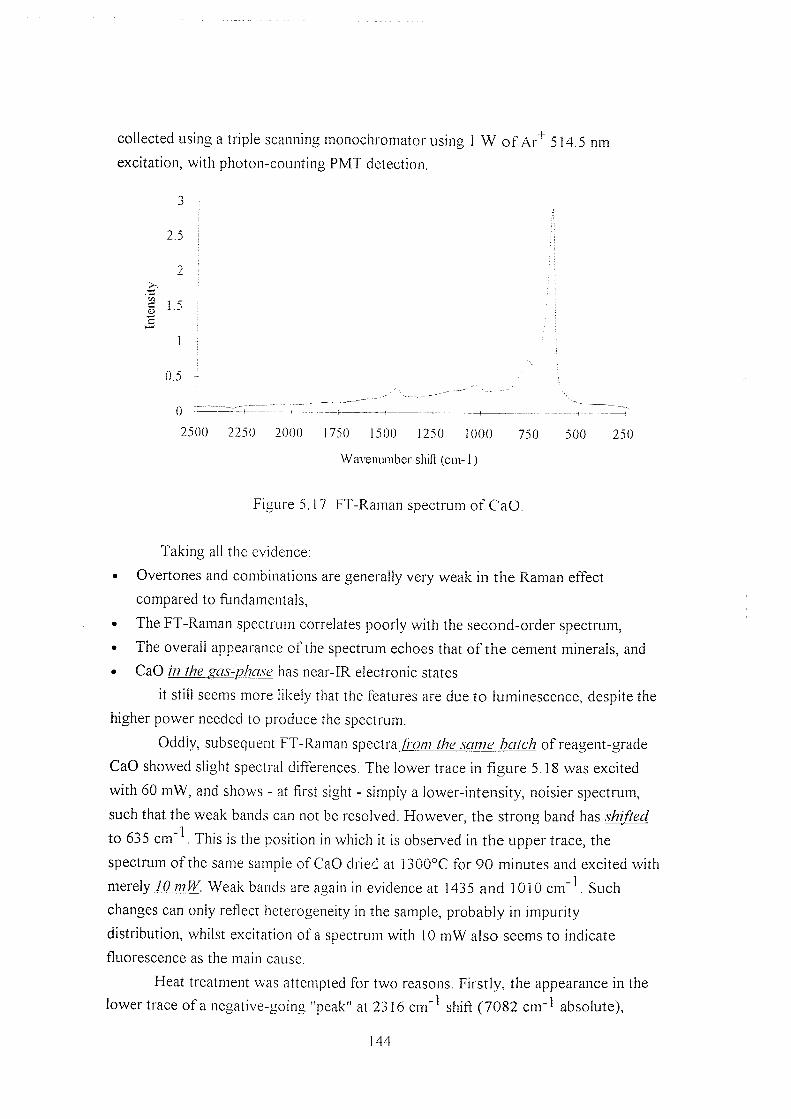
collected using a triple scanning monochromator using 1 W of Ar^ 514.5 nm
excitation, with photon-counting PMT detection.
3 T
2.5 ! fi
1.5 t ; . 0^ -
4 '
I
25M 22^J 20Wj 1750 15M 1250 1000 750 500 250
Wavenimiber sliift (cm-1)
Figure 5. i 7 FT-Raman spectrum of CaO.
Taking all the evidence:
• Overtones and combinations are generally very weak in the Raman effect
compared to fundamentals,
• The FT-Raman spectrum correlates poorly with the second-order spectrum,
• The overall appearance of the spectrum echoes that of the cement minerals, and
• CaO in the 2as-phcise has near-IR electronic states
it still seems more likely that the features are due to luminescence, despite the
higher power needed to produce the spectrum.
Oddly, subsequent FT-Raman spectra /ro/?? the same batch of reagent-grade
CaO showed slight spectral differences. The lower trace in figure 5.18 was excited
with 60 mW, and shows - at first sight - simply a lower-intensity, noisier spectrum,
such that the weak bands can not be resolved. However, the strong band has shifted
to 635 cm V This is the position in which it is observed in the upper trace, the
spectrum of the same sample of CaO dried at 1300°C for 90 minutes and excited with
merely 10 mW. Weak bands are again in evidence at 1435 and 1010 c m " \ Such
changes can only reflect heterogeneity in the sample, probably in impurity
distribution, whilst excitation of a spectrum with 10 mW also seems to indicate
fluorescence as the main cause.
Heat treatment was attempted for two reasons. Firstly, the appearance in the
lower trace of a negative-going "peak" at 2316 cm'^ shift (7082 cm"^ absolute),
144
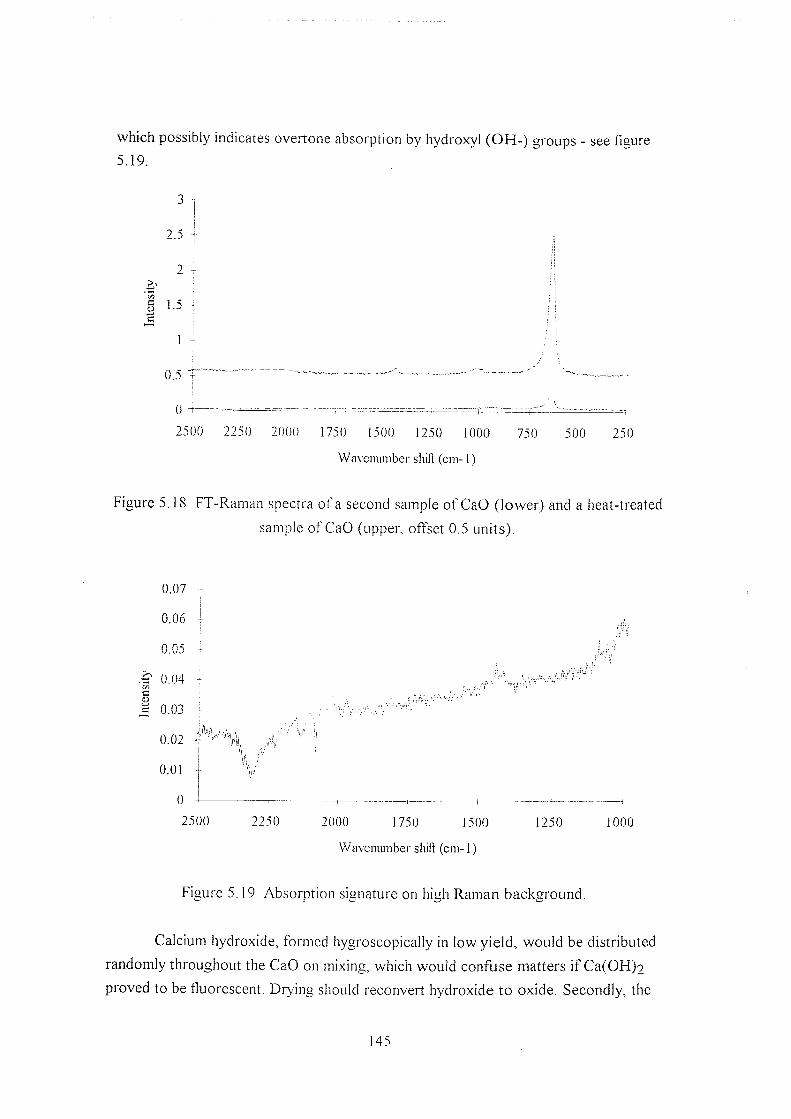
which possibly indicates overtone absorption by hydroxyl (OH-) groups - see figure
5. IS).
3
2.5
0
2500 2250 20U0 175U 1500 1250 1000 750 500 250
Wa\ eniuiiber shill (cm-1)
Figure 5.18 FT-Raman spectra of a second sample of CaO (lower) and a heat-treated
sample of CaO (upper, offset 0.5 units).
0.07
&06
&05
0.04 g
c 0.03
0.02
0 01
0 2500 2250 2000 1750 1500
Waveniuiiber shift (cm-1)
1250 1000
Figure 5.19 Absorption signature on high Raman background.
Calcium hydroxide, formed hygroscopically in low yield, would be distributed
randomly throughout the CaO on mixing, which would confuse matters if CafOH)?
proved to be fluorescent. Drying should reconvert hydroxide to oxide. Secondly, the
145
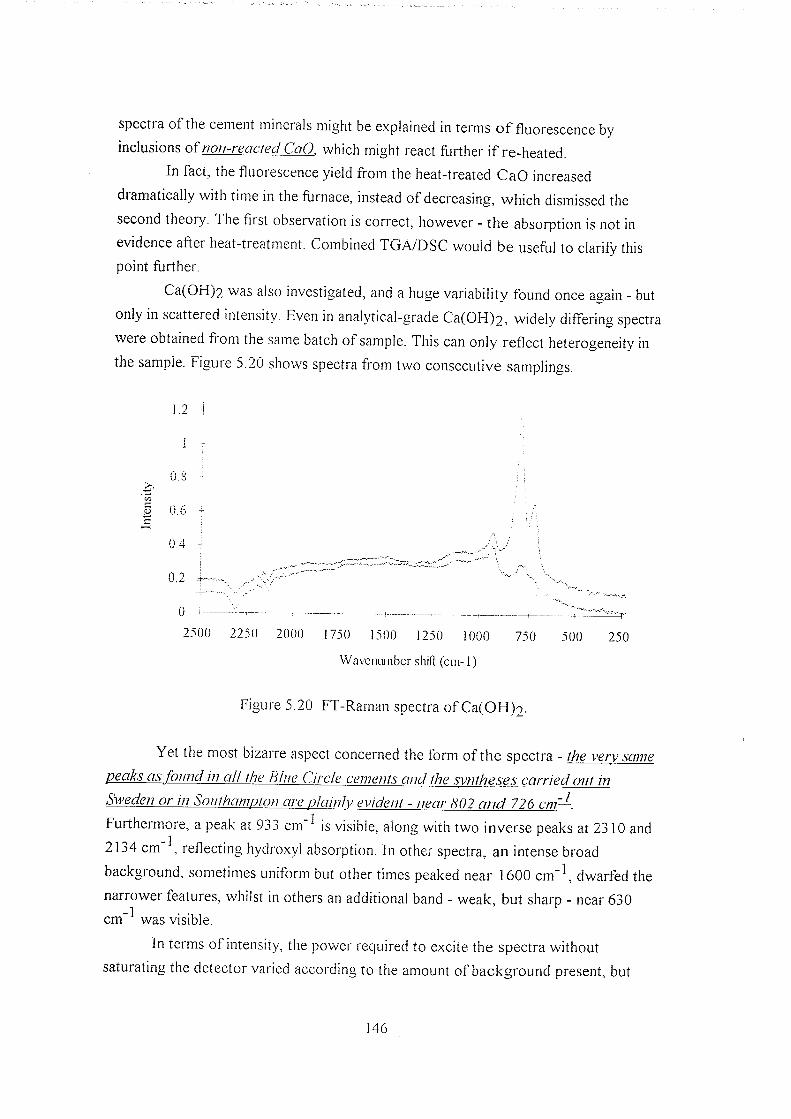
spectra of the cement minerals might be explained in terms of fluorescence by
inclusions o f C o O . which might react further if re-heated.
In fact, tne fluorescence yield from the heat-treated CaO increased
dramatically with time in the furnace, instead of decreasing, which dismissed the
second theory. The first observation is correct, however - the absorption is not in
evidence after heat-treatment. Combined TGAyDSC would be usefijl to clarify this
point further.
Ca(OH)2 was also investigated, and a huge variability found once again - but
only in scattered intensity. Even in analytical-grade Ca(0H)2, widely differing spectra
were obtained from the same batch of sample. This can only reflect heterogeneity in
the sample. Figure 5.20 shows spectra fi-om two consecutive samplings.
1.2
0.8
0 Ub c
0.4
0.2
0
2500 22^) 20W) 17:0 1500 1250 1000 750 500 250
Waveniuiibcr shift (cm-1)
Figure 5.20 FT-Raman spectra ofCa(OH)2.
Yet the most bizarre aspect concerned the form of the spectra - the very same
peaks as found in ali the Bine Circle cements and the syntheses carried out in
or //? ore gWg/?/ - ,902 726 cm?—.
Furthermore, a peak at 933 cm ^ is visible, along with two inverse peaks at 2310 and
2134 cm K reflecting hydroxy I absorption. In othe. spectra, an intense broad
background, sometimes uniform but other times peaked near 1600 cm"\ dwarfed the
narrower features, whilst in others an additional band - weak, but sharp - near 630
cm"^ was visible.
In terms of intensity, the power required to excite the spectra without
saturating the detector varied according to the amount of background present, but
146
ranged from 50 mW to 1 W. Spectra from analytical grade material showed the same
two peaks - with a reasonably broad band to low-shift, peaking around 644 cm~^.
The possible causes are difficult to identify. It is certain Ihcit the spectra cive
not vibi atiojial in oi /gin. J he Ca(0H)2 crystal has structure analogous to that of
Cdl2 - & crystal habit from which first-order Raman spectra may be, and have been,
observed"'' . The Kaman spectra should consist of one 0 - H mode at high shift around -1 -•
3620 cm (impossible to observe with the Lulea spectrometer, although not with
that in Southampton) and three bands at low shift - 254, 357, and 680 cm" shift.
This is most certainly not what is observed under near-IR excitation.
With excitation at 1064.1 nm, the peaks near 800 and 730 cm ^ are always
seen to greater or lesser degree. When taken into consideration with the variable
intensity of the spectia and the unusual shape of the bands, it seems likely - once
again - that the spectrum is due to luminescence.
Calcium hydroxide displays a curious luminescence band after heat-treatment
when excited by visible wavelengths^"'-^^. It has been proposed that this is due to the
formation of 02^" species as lattice defects, in combination with the low
concentration of Mn2+ impurity centres discovered by electron spin resonance (ESR).
It comes as no shock to find that the reagent grade and analytical grade Ca(0H)2
samples used for spectroscopy were quite rich in manganese - as are the cement
minerals.
One simple experiment to test this would be to heat the sample up to just
above the dehydration temperature of Ca(0H)2, and observe the increase in
fluorescence intensity, ihis is a facile experiment, since the temperatures required are
only around 150-250°C, and therefore thermal emission background is not a great
problem. If necessary, a short wave pass filter could be used to cut the high-shift
completely, thereby removing the excessive background with attendant saturation and
shot noise problems, or pulsed/gated techniques used to discriminate against the
background.
5.5.5 Near-IR absorption studies
Inverse" re-absorption bands were evident in the FT-Raman spectra of
Ca(0H)2, and both the mono- and triclinic Blue Circle C3S samples. This demands
rationalisation.
1 • The near-IR 0 -H absorption in calcium hydroxide can be seen at 7085 cm
figure 5.21 - effectively 2312 cm ^ shift from 1064.1 nm excitation. This is in good
agreement with the h 1 -Raman ' inverse'' peak position. Since the very strong IR
147
in
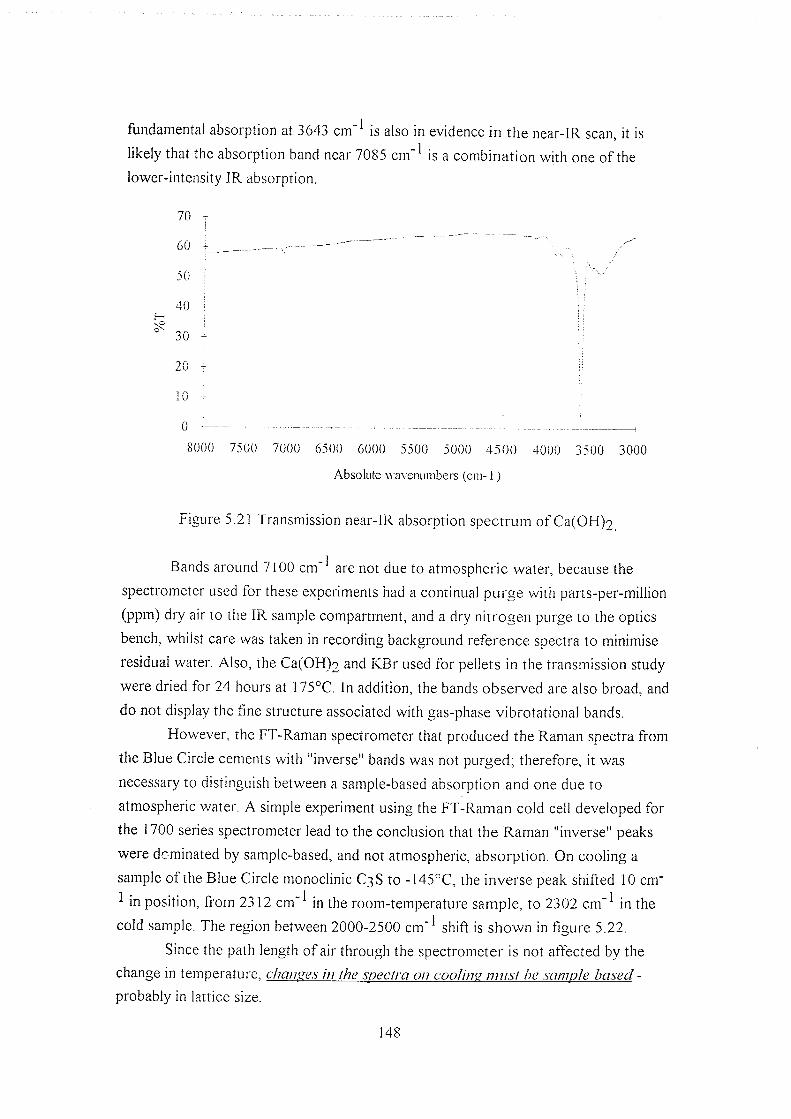
fundamental absoiption at j643 cm ^ is also in evidence in the near-IR scan, it is
likely that the absorption band near 7085 cm"^ is a combination with one of the
lower-intensity IR absorption.
70
60
50
40
30
20
10
0
8000 7500 7000 6500 6000 5500 5000 4 5 0 0 4000 3500 3000
Absolute wavemuiibers (cm-1)
Figure 5.21 Transmission near-IR absorption spectrum of CafOH)]
Bands around 7100 cm"' are not due to atmospheric water, because the
spectrometer used for these experiments had a continual purge with parts-per-million
(ppm) dry air to the IR sample compartment, and a dry nitrogen purge to the optics
bench, whilst care was taken in recording background reference spectra to minimise
residual water. Also, the CafOH)? and KBr used for pellets in the transmission study
were dried for 24 hours at 175°C. In addition, the bands observed are also broad, and
do not display the fine structure associated with gas-phase vibrotational bands.
However, the FT-Raman spectrometer that produced the Raman spectra from
the Blue Circle cements with "inverse" bands was not purged; therefore, it was
necessary to distinguish between a sample-based absorption and one due to
atmospheric water. A simple experiment using the FT-Raman cold cell developed for
the 1700 series spectrometer lead to the conclusion that the Raman "inverse" peaks
were dominated by sample-based, and not atmospheric, absorption. On cooling a
sample of the Blue Circle monoclinic C3S to -145°C, the inverse peak shifted 10 cm"
1 in position, from 2312 cm"* in the room-temperature sample, to 2302 cm"* in the
cold sample. The region between 2000-2500 cm"* shift is shown in figure 5.22.
Since the path length of air through the spectrometer is not affected by the
change in temperature, changes in the spectra on cooline must he sample based -
probably in lattice size.
148

% 1500 -
1000 -
750 -
250
2100 2180 2260 2340
Waveniuiiber shift (cm-1)
2420 2500
Figure 5.22 The "inverse" peak region of the Blue Circle monoclinic C3S sample.
The near-IR absorption spectra of the Blue Circle samples are shown overlaid
in figure 5.23. The band at 7083 cm"^ is possibly due to Ca(OH)2.
120 T
8 n o
B-^ 100 <
90
•-''X
9500 9000 8500 8000 7500
Absolute waveminiber (cm-1)
7000 6500
Figure 5.23 Overlaid near-IR diffuse reflectance spectra of the Blue Circle cements.
Top-^Bottom: Triclinic C3S, Monoclinic C3S, 7-025, and P-C2S.
The bands persisted even after drying the samples at 150°C, which implies
that it is not due to weakly-bound water. The tricalcium silicate samples feature this
band much more strongly than the dicalcium silicates.
149
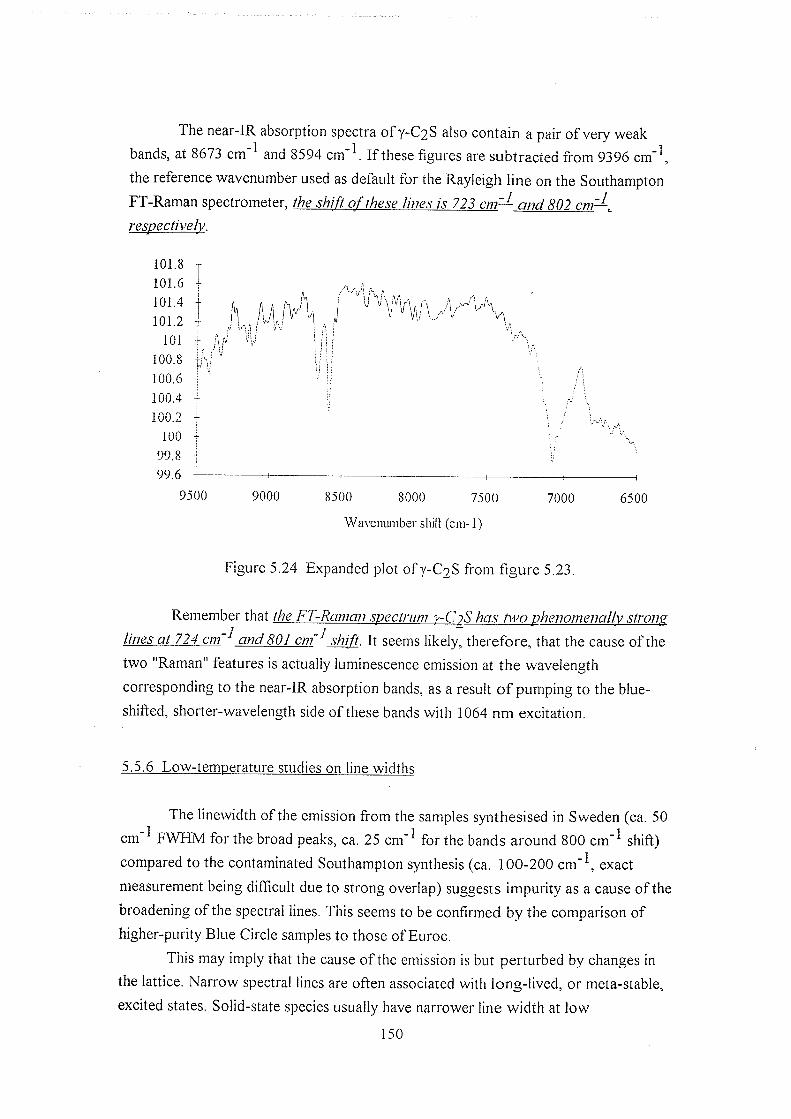
The near-IR absorption spectra of y-C2S also contain a pair of very weak
bands, at 8673 cm"^ and 8594 cm"\ If these figures are subtracted from 9396 cm"\
the reference wavenumber used as default for the Rayleigh line on the Southampton
FT-Raman spectrometer, o/" 72 j w/af ,$02 cm;—.
respectively.
101.8
101.6
101.4
101.2
101
100.8
100.6
100.4
100.2
100
99.8
99.6
a, V
9500 9000 8500 8000 7500
Waveniuiiber shift (cm-1)
7000 6500
Figure 5.24 Expanded plot of Y-C2S from figure 5.23.
Remember that the FT-Raman spectrum y-C yS has two phenomenallv strong
lines at 724 cm ^ and 801 cm ^ shift. It seems likely, therefore, that the cause of the
two "Raman" features is actually luminescence emission at the wavelength
corresponding to the near-IR absorption bands, as a result of pumping to the blue-
shifted, shorter-wavelength side of these bands with 1064 nm excitation.
5.5.6 Low-temperature studies on line widths
The linewidth of the emission from the samples synthesised in Sweden (ca. 50
cm ^ FWHM for the broad peaks, ca. 25 cm'^ for the bands around 800 cm~^ shift)
compared to the contaminated Southampton synthesis (ca. 100-200 c m " \ exact
measurement being difficult due to strong overlap) suggests impurity as a cause of the
broadening of the spectral lines. This seems to be confirmed by the comparison of
higher-purity Blue Circle samples to those of Euroc.
This may imply that the cause of the emission is but perturbed by changes in
the lattice. Narrow spectral lines are often associated with long-lived, or meta-stable,
excited states. Solid-state species usually have narrower line width at low
150
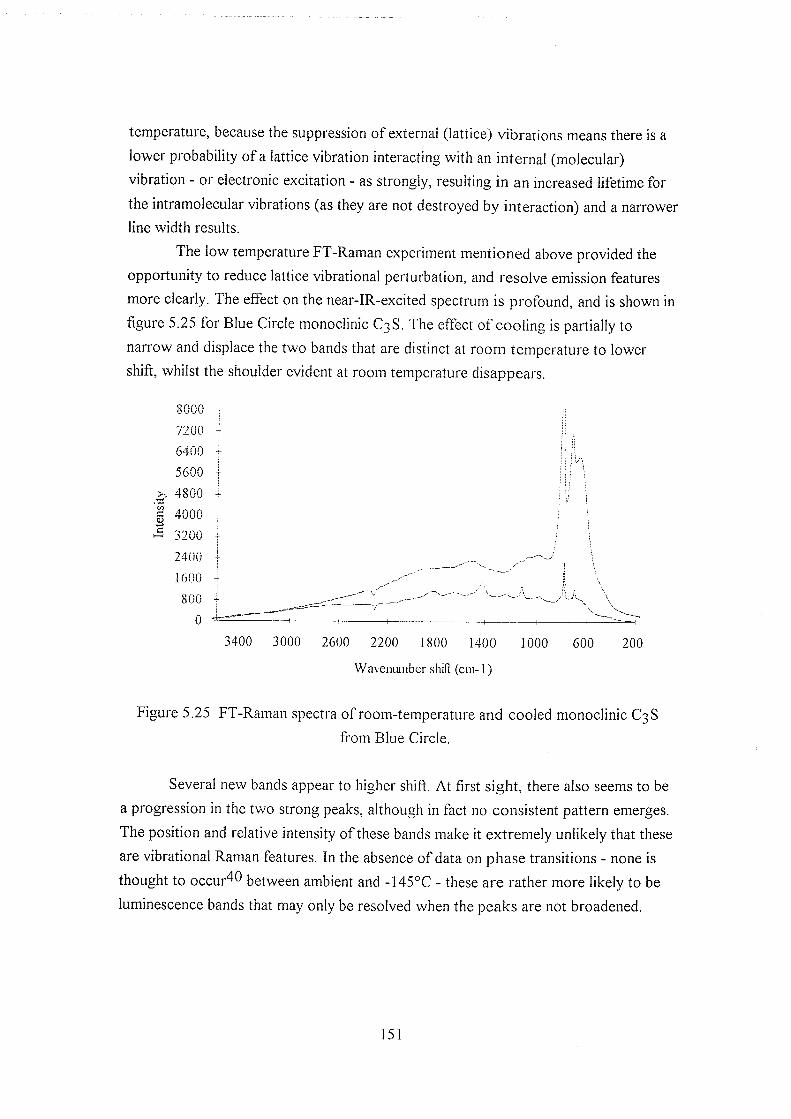
temperature, because the suppression of external (lattice) vibrations means there is a
lower probability of a lattice vibration interacting with an internal (molecular)
vibration - or electronic excitation - as strongly, resulting in an increased lifetime for
the intramolecular vibrations (as they are not destroyed by interaction) and a narrower
line width results.
The low temperature FT-Raman experiment mentioned above provided the
opportunity to reduce lattice vibrational perturbation, and resolve emission features
more clearly. The effect on the near-IR-excited spectrum is profound, and is shown in
figure 5.25 for Blue Circle monoclinic C3S. The effect of cooling is partially to
narrow and displace the two bands that are distinct at room temperature to lower
shift, whilst the shoulder evident at room temperature disappears.
O
8000
7200
6400
5600
4800
4000
3200
2400
1600
800
0
3400 3000 2600 2200 1800 1400
Wa\"eniuiiber shift (cm-1)
1000 600 200
Figure 5.25 FT-Raman spectra of room-temperature and cooled monoclinic C3S
from Blue Circle.
Several new bands appear to higher shift. At first sight, there also seems to be
a progression in the two strong peaks, although in fact no consistent pattern emerges.
The position and relative intensity of these bands make it extremely unlikely that these
are vibrational Raman features. In the absence of data on phase transitions - none is
thought to occur^O between ambient and -145°C - these are rather more likely to be
luminescence bands that may only be resolved when the peaks are not broadened.
151
5.6 Discussion
The near-IR diObse reflectance studies have shown that the -OH group is
present in many of the cements, probably as Ca(0H)2. From the results in this
chapter, it seems that the appearance of two extremely strong "Raman" bands in y-
C2S and in CafOH)? can be strongly correlated with the presence of Ca(0H)2. This
is not to say that the bands are caused by an electronic or vibrational process in pure
Ca(0H)2just that the presence of calcium hydroxide seems required:
• Ca(0H)2 shows the anomalous bands - the true vibrational (phonon) spectrum is
known, and the anomalous bands are definitely fiot due to simple vibrational
modes.
• The synthesised cement samples all show the bands - probably because they
contained non-reacted CaO from the incomplete syntheses, subsequently hydrated
in air to Ca(0H)2.
• The supplied Blue Circle cements all show the two bands, and all show at least
some Ca(0H)2 absorption bands in the near-IR.
The Euroc-supplied samples did not show these features in near-IR absorption
or in the FT-Raman experiment. However, the Raman bands are much broader
(probably due to the higher metal ion content), which probably obscures the features
of interest - and the near-IR FT spectrometer used was on the very lower limit of
acceptability, in terms of sensitivity; it is designed for optimal use in the mid-IR. Thus
the Euroc samples neither prove nor disprove the argument.
What is sure is simple - of all the samples that showed the anomalous two
bands in the Raman spectrum, the biggest near-IR absorption and the largest Raman
intensity was obtained from Blue Circle Y-C2S. This sample also contained the
hishest concentration of manganese Ovin-'^) by 2 orders of magnitude.
Quite apart from being known as problematical under near-IR excitation,
manganese has a "case history" of causing luminescence in Ca(OH)2 under visible
excitation. Previous workers also linked the luminescence to the formation of defect
sites on heating.
Using the data from this chapter and the previous studies, it is tentatively
proposed that the formation of calcium hydroxide on the surface of the cement grains
due to the hygroscopic nature of the calcium silicates results in a disordered
152
amorphous coating, with many structural defects, into which metal ions diffuse,
become trapped at the defects, and form localised and highly luminescent electronic
states.
Many further comparisons could be struck, between model compounds and
the cement minerals. The danger is in becoming too simplistic in the approach, and
whilst searching for simplifying comparisons branching into areas which deserve more
in-depth coverage to interpret correctly. In passing, other alkali earth metal oxide and
hydroxides have been observed to give erratic and bizarre Raman spectra under near-
IR excitation; there is quite simply a whole area of "simple" systems which need to be
re-explored to be understood.
The only real way forward in the study by FT-Raman spectroscopy of calcium
silicates, and of the simpler calcium salts, lies in determining the cause of the strong
and structured emission so often - but apparently unpredictably - encountered, A
body of evidence has been assembled, much of it experimental, some argument by
analogy, which leans heavily towards fluorescence. Given this is the most likely
explanation, there are several outstanding questions.
The first question is by what mechanism does this luminescence arise - that is,
is it due to intrinsic properties of the calcium silicates relating to electronic absorption
in the solid state, or is it - more likely - due to impurities present in the form of one or
many of the metal species revealed by analytical studies. There is evidence to suggest
that it is connected with partial hydration, forming small amounts of oddly-behaved
calcium hydroxide.
The second question is why does the luminescence emission have such a
narrow line width, combined with a much greater amount of apparent structure,
compared to the very broad and featureless fluorescence peaks most often observed
in near-IR Raman spectroscopy - and why does it appear that the luminescence
process is strongly affected by the level of impurity in the sample.
Although part of the answer may lie in crystal field theory and mineralogical
spectroscopy, perhaps the best way to unravel the problem is by extremely pure
synthesis, combined with accurate structural and compositional analysis, then to build
up a body of spectroscopic data based not only on the pure calcium silicates, but also
by doping these structures with the commonly-encountered impurity metals.
In order to do this requires a range of analytical methods. XRD - an often-
used tool in cement analysis - provides little assistance in determining the chemical
constituents, because the Ca(0H)2 coating on silicate grains is thin, amorphous, and
in small yield. Perhaps the best untried method for future application would be the use
of calorimetric techniques DSC and TGA. These could, in principle, reveal the nature
153
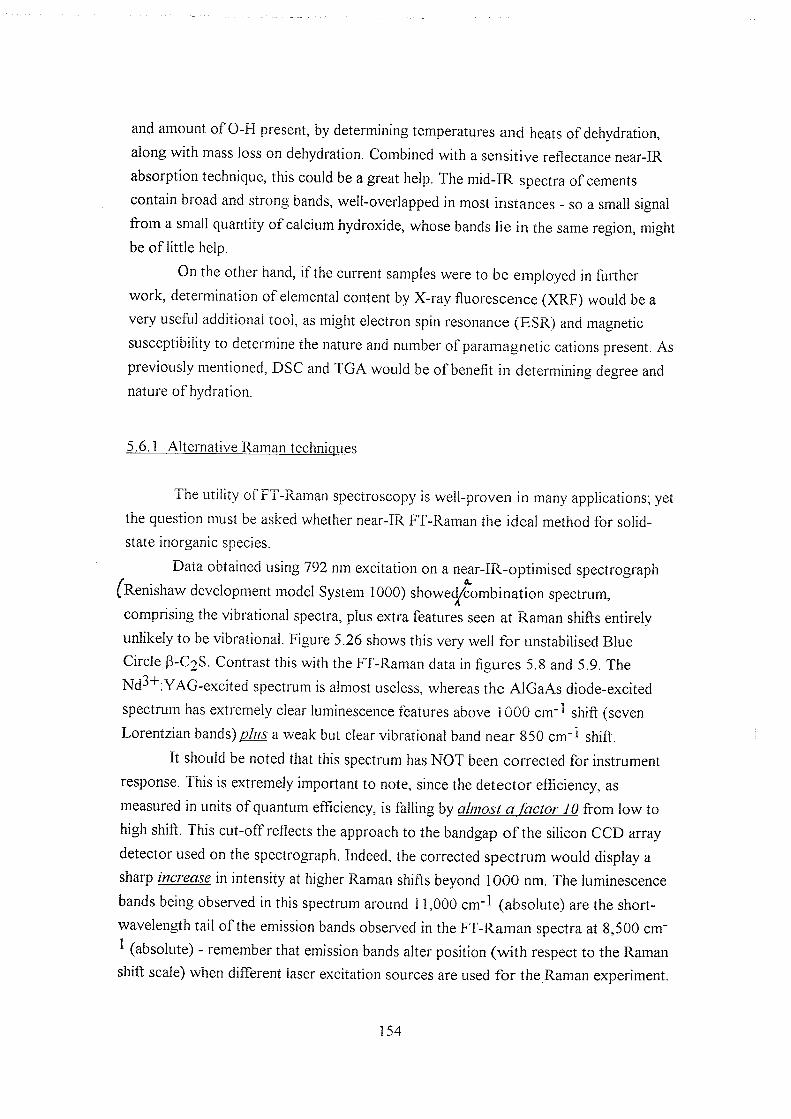
and amount of 0-H present, by determining temperatures and heats of dehydration,
along with mass loss on dehydration. Combined with a sensitive reflectance near-IR
absorption technique, this could be a great help. The mid-IR spectra of cements
contain broad and strong bands, well-overlapped in most instances - so a small signal
from a small quantity of calcium hydroxide, whose bands lie in the same region, might
be of little help.
On the other hand, if the current samples were to be employed in further
work, determination of elemental content by X-ray fluorescence (XRF) would be a
very userul additional tool, as might electron spin resonance (ESR) and magnetic
susceptibility to determine the nature and number of paramagnetic cations present. As
previously mentioned, DSC and TGA would be of benefit in determining degree and
nature of hydration.
5.6.1 Alternative Raman techniques
Ihe utility of r i-Kaman spectroscopy is well-proven in many applications; yet
the question must be asked whether near-IR FT-Raman the ideal method for solid-
state inorganic species.
Data obtained using 792 nm excitation on a near-IR-optimised spectrograph
^Renishaw development model System 1000) showed^ombination spectrum,
comprising the vibrational spectra, plus extra features seen at Raman shifts entirely
unlikely to be vibrational. Figure 5.26 shows this very well for unstabilised Blue
Circle (B-C^S. Contrast this with the FT-Raman data in figures 5.8 and 5.9. The
Nd "*"; YAG-excited spectrum is almost useless, whereas the AlGaAs diode-excited
spectrum has extremely clear luminescence features above 1000 cm"^ shift (seven
Lorentzian bands) plus a weak but clear vibrational band near 850 cm" shift.
It should be noted that this spectrum has NOT been corrected for instrument
response. This is extremely important to note, since the detector efficiency, as
measured in units of quantum efficiency, is falling by almost a factor JO from low to
high shift. This cut-off reflects the approach to the bandgap of the silicon CCD array
detector used on the spectrograph. Indeed, the corrected spectrum would display a
sharp increase in intensity at higher Raman shifts beyond 1000 nm. The luminescence
bands being observed in this spectrum around 11,000 cm"^ (absolute) are the short-
wavelength tail of the emission bands observed in the FT-Raman spectra at 8,500 cm"
^ (absolute) - remember that emission bands alter position (with respect to the Raman
shift scale) when different laser excitation sources are used for the Raman experiment.
154

20000
18000
16000 -
14000
2:. 12000
0 10000
.5 8000
6000
4000
2000
0
; \
1900 1700 1300 1300 1100 900 700
Waveniuiiber sliift (cm-1)
500
Figure 5.26 792 nm excitation of Blue Circle 3-C2S. Upper trace: x25 scale
expansion. 10 seconds exposure time.
Moving back towards near-visible excitation (perhaps using 783 nm excitation
from a titanium sapphire laser) is certainly possible on a FT-Raman spectrometer,
providing the detector used is suitable for the scattered wavelength range (perhaps a
silicon avalanche photodiode); the only questions worth debating are whether the
superior performance of the CCD detector^ renders the dispersive method more
attractive, in terms of analysis time, whether the sharp cut-off in CCD performance
renders the high-shift performance unattractive, and whether the redistributive effect
of the FT process"^^ would spread the noise from the strong luminescence bands over
the weak Raman bands, making the FT technique less attractive.
From the above data, it seems that use of shorter-still wavelengths would
avoid overlaying the fluorescence emission around 1 urn and the Raman spectrum.
Although the "mixed" nature of the 792 nm data - Raman plus luminescence - might
prove useful in identifying the luminescent centre, 792 nm was not ideal, as the
luminescence was still too strong at 792 nm for some samples strongly luminescent at
1064 nm - for instance, y-CiS gave a very strong fluorescence background.
Two points about avoiding luminescence should be remembered. Even if
luminescence occurs, it might be possible to record data close to the excitation
wavelength if the lumifiescence is considerably red-shifted. The spectrum excited at
Ar"*" green (514.5 nm) of the same unstabilised Blue Circle P-C2S (figure 5.27) is a
fine example. It shows that the emission at around 1000 nm is simply not detected
155

when the excitation is near 19, 400 cm ^ and the Raman scattering falls out to about
18, 300 cm'l , or about 550 nm.
30000 T
25000 -
20000
15000
10000
5000
0
1500 1250 1000 750 500
Waveniuiiber shift (cm-1)
250
Figure 5.27 Ar"^ excitation of Blue Circle P-C^S.
Luminescence may even be excited by "stray" light, as noticed during this
study and confirmed by the recent literature^'^. Raman scattering from y-C^S excited
with near-IR radiation was obliterated by luminescence caused by the HeNe reference
laser; although well-shifted from the YAG laser (by nearly 6000 cm'^), it still resulted
in luminescence in the 1-2 um region ot interest to near-IR FT-Raman spectroscopy.
Figure 5.28 shows a conventional spectrum of Blue Circle P-IC2S recorded
using HeNe (632.8 nm) excitation which reinforces the point. The spectrum presented
here is a true vibrational spectrum; the luminescence occurs above 900 nm (see figure
5.26) and so does not obscure the Raman scattering, which occurs below 750 nm.
As an aside: it is always be possible in principle to record a Raman spectrum
encompassing both the Stokes and anti-Stokes bands, to confirm that the observed
spectra are indeed caused by Raman scattering. Band positions in luminescence are
rarely "mirror-image" about the laser line.
In short, the spectral quality and information content could not be in greater
contrast to the FT-Raman spectra. All the samples gave good vibrational spectra -
and in further study, this was even true of industrially-prepared cements^^.
156

I n
4750
4350
3950
3550
3150
2750 -
2350
1950
1550
1200 1000 800 600
Waveniunber sliifl (cm-1)
400 200
Figure 5 .28 HeNe excitation of Blue Circle P-C2S.
5.7 Postscript
As mentioned in the text, several researchers have recently endorsed the
outcome of the findings in this chapter on the luminescence of certain calcium
si l icates^^. However, Griffiths and co-workers have shown that FT-Raman
spectroscopy has a new part to play, reporting excellent spectra from many deeply-
coloured minerals44 it is clear that this particular field is ripe for further
investigation.
5.8 References
1. F.M. Lea, "The chemistry of cement and concrete", Chemical Publishing Co.
Inc., New York (1971)
2. R.H. Bogue, "The chemistry of Portland cements", 2nd edition, Reinland
publishing Inc, NY (1955)
3. W. Eitel, "The physical chemistry of the silicates". University of Chicago
press, (1954)
4. W. Eitel, "Silicate Science", Volumes 1-8 (Academic Press, 1964-1976)
5. P.F. McMillan and A.M. Hofmeister, Rev. Mineral. 1_8, 99 (1988)
6. J. Bensted, Cement Technology, page 161 ff, (Sept/Oct 1975)
7. J. Bensted, J. Am. Ceram. Soc. ^ (3-4), 140 (1976)
157

8. K. Nakamoto, "Infrared and Raman spectra of inorganic and coordination
compounds", g j (Wiley Interscience, 1986)
9. M. Conjeaud and H. Boyer, Cement and Concrete Research 10 (1), 61
(1980)
10. G. Placzek, "The Rayleigh and Raman scattering", UCRL Trans. No. 526 (L)
(1959)
11. J. A. Koningstein, "Introduction to the theory of the Raman eRect", (Reidel
Publishing Co., 1972)
12. J. Tang and A C. Albrecht, J. Chem. Phys. 49 (3), 1144 (1968)
13. W.P.Griffith, Nature, 224 264 (1969)
14. W.P. Griffith, J. Chem. Soc (A) 1372 (1969)
15. W.P. Griffith, Ch.8 in "The infrared spectra of minerals" Mineralogical
Society monograph 4, Ed. V.C. Farmer, Mineralogica! Society (1974)
16. A. Wang, J. Han, L. Guo, J. Yu, and P. Zeng, Appl. Spectrosc. 48(8).
959,(1994)
17. C.J. Petty, G.M. Warnes, P.J. Hendra and M. Judkins, Spectrochim, Acta
^ ( 9 / 1 0 ) , 1179-1188 (1991)
18. F.A. Cotton and G. Wilkinson, "Advanced Inorganic Chemistry" 4^^ Ed.,
Wiley Interscience (1980)
19. J. Bensted, Cement and Concrete Research, 7, 161-164 (1977)
20. A. Crookell, P.J. Hendra, H.M. Mould, and A.J. Turner, J.Raman Spectrosc.
21, 85 (1990)
21. B. Schrader, Pres. J. Anal. Chem. 337, 824 (1990)
22. M.J. Almond, C.A. Yates, R.H. Orrin, and D.A. Rice, Spectrochim. Acta
46A r21 177 (1990)
23. T.N. Day, P.J. Hendra, A.J. Rest, and A.J. Rowlands, Spectrochim. Acta
47A(9/10) 1251 (1991)
24. E.L. Varetti and E.J. Baran, Appl. Spectrosc. ^ ( 8 ) , 1028 (1994)
25. G. Walker, Ch.4 in "Bonding and Spectroscopy in mineral chemistry", Eds.
F.J. Berry and D.J. Vaughan, Chapman and Hall
26. A. Mortensen, D.H. Christensen, O. Faurskov Nielsen, and E. Pedersen, J.
Raman Spectrosc. 22, 47 (1991)
27. M.C. Tobin and T. Ba&k, J. Opt. Soc. Am. 368 (1970)
28. S.M. Shapiro, D C. O'Shea, and H.Z. Cummins, Phys. Rev. Lett. 19, 361
(1967)
29. W. Forsling, private communication
30. A. Russell, private communication
158

31. J.B. Norman, K.J. Cross, H.S. Schweda, M. Polak, and R.W. Field, Mol.
Phys. 235 (1989)
32. S. Bhagavantam and T. Venkatarayudu, "Theory of groups and its application
to physical problems", Academic Press (1969)
33. M.M. Sushchinskii, "Raman spectra of molecules and crystals" Israel Program
for Scientific Translations (1972)
34. R. Loudon, Adv. Phys. 13, 423 (1964)
35. M. Voisin and J.P. Mon, Phys. Stat. Sol. B48. K185 (1971)
36. K.H. Rieder, B.A. Weinstein, M. Cardona, and H. Bilz, Phys. Rev. B8, 4780
(1973)
37. P. Dawson, C D. Hadfield, and G.R, Wilkinson, J. Phys. Chem. Solids 34,
1217 (1973)
38. O. Chaix-Pluchery, J.C. Niepce, B. Jannot, and G. Martinez, J. Solid State
Chem. 73, 563 (1988)
39. O. Chaix-Pluchery, J.C. Niepce, and G. Martinez, J, Mater. Sci. Lett. 6, 1231
(1987)
40. V. Ronin, private communication
41. J.E. Pemberton, R.L. Sobocinski, M.A. Bryant, and D A. Carter,
Spectroscopy 5 (3) 26 (1990).
42. a) J.W. Brault, Chapter 3 in "High resolution in astronomy" (Eds. Booth,
Brault, and Labeyrie) 15 " Advanced Course, SAAS-FEE (1985)
b) J. Chamberlain, "The principles of interferometric spectroscopy" (Eds.
Chantry and Stone) (Wiley, 1979)
43. Renishaw Application Note.
44. E.E. Coleyshaw, W.P. Griffith, and R.J. Bowell, Spectrochim. Acta 50A (11)
1909(1994)
159

Chapter 6 :
Near-IR excited Raman scattering in the gas phase
6.1 Overview and historical introduction
Raman spectroscopy can play an important role in both fundamental and
applied gas-phase research. The various techniques available provide methods to
determine the identity and structure of gaseous species, as well as the composition of
gas-phase mixtures. In certain cases, Raman spectroscopy is the only way to obtain
vibrational or rovibrational information'; more usually, it helps build a more complete
understanding of a gas-phase structure, when used in conjunction with other
methods-.
Ihe intensity ratio of the Raman scattering to light at the laser wavelength
(Rayleigh scattering, stray light, and reflection) in the gas phase tends to be higher
(1:1000) than for liquid or solid samples, as suspended particulate matter and multiple
reflections from the sample contribute far less to the Rayleigh component. This means
in many cases that the gas-phase experiment can be carried out M'ithout triple-grating
spectrometers (operating with additive dispersion) or triple-grating spectrographs
(single spectrograph with double-grating subtractive-dispersion forestage). Double
monochromators and single spectrographs are often adequate for the task, providing
care is taken with stray light and providing low-wavenumber coverage (<100 cm"^) is
not required. The reduced optical complexity of these instruments allows
straightforward accurate alignment, as well as offering fewer optical surfaces and
therefore higher efficiency.
Significant advances were made during the 1930s with arc-lamp excitation and
prism-based spectrometers^. However, the advent of the laser and the development of
the scanning spectrometer with direct photoelectric recording made the technique
much easier^, and began a phase of renewed interest in gas-phase research. As
improvements in instrumentation made higher-sensitivity measurements possible, so
the panial pressure of the analyte mixtures decreased, whilst high resolution was also
demanded^'6.
The signal level in the gas phase experiment is very low. The intensity is
directly proportional to the number of scattering species illuminated within the
spectrometer tield of view, so it is easy to appreciate that the experiment yields far
lower signal levels than those due to liquids or solids, and that very sensitive detection
is required. Scanning spectrometers often employ cooled photon-counting
160

photomultiplier tubes (PMTs), whilst spectrographs (originally using photographic
plates) moved on with the introduction of the intensified diode array (IDA) and more
recently the charge-coupled device (CCD) camera array.
6.2 Aims and goals
It should be clear that the instrumentation used for gas-phase Raman research
has to be of the highest quality and properly maintained. High-luminosity, low-loss
spectrometers matched to sensitive detectors, with powerful excitation sources and
carefully-designed high-efficiency sampling arrangements are pre-eminent. This
accurately portrays the state oX scis-phase Imcar" Raman spectrometry at the present
day. Routine Raman scattering experiments on gases should only be contemplated
with conventional grating-based dispersive instruments using near-UV or visible
excitation, and either photon-counting PMT or CCD detection.
Since 1987, FT-Raman spectroscopy has been ascendant for analytical
Raman applications. Without exception, the major manufacturers of FT-IR
spectrometers either offer near-IR Raman accessories or dedicated stand-alone FT-
Raman systems. The majority of these instruments are being used primarily for
analytical vibrational spectroscopy.
The owner of a FT-IR/Haman spectrometer may occasionally require to
analyse gaseous samples. The aim of this work was simple - to demonstrate feasibility
of a routine gas analysis cell in a commercial spectrometer for analytical purposes.
On a more fundamental level, there are a number of gases that have remained
a challenge to visible Raman techniques. Chief amongst these is nitrogen dioxide
(NO2) as this species fluoresces very strongly under visible excitation as a result of
strongly overlapped low-lying electronic absorption bands. Gas-phase Raman
spectroscopy has proved extremely difficult; more frustratingly, the study of the dimer
dinitrogen tetroxide (N2O4) in the gas-phase, close to dissociation, has been
exceedingly difficult as well (no results published) due to fluorescence from the
monomer NO? with which it exists in equilibrium. Near-IR excitation may offer the
first results on the gas-phase Raman spectrum of the dimer.
* This discussion ignores the role of coherent Raman scattering, produced via higher-order terms in
the molecular scattering tensor, which require quite different techniques.
161
6.3 Initial considerations
Several fundamental factors weigh heavily against the FT technique and
should be discussed in relation to gas-phase methods, despite having been touched
upon in earlier chapters:
• Most gases have well-defined (and well-documented) electronic structure. The
majority lack broaa absorption bands, and tend not to fluoresce - a notable
exception being nitrogen dioxide, which is dark brown. This immediately neuters
the argument that Fl-Raman is the superior analytical Raman method on grounds
of fluorescence-minimisation.
Its also implies that even if the excitation wavelength inadvertently coincides with
an absorption - remembering the linewidth of gaseous absorption spectra is very
low - then the laser may (in principle) be tuned away from resonance in
accordance with the literature.
• The intensity of the scattered radiation follows the well-known relationship that
the total power radiated is proportional to (^Lgcgttered)"'^- ^ re/af/ve in
overall scattered intensity of approximately 23-fold occurs on lengthening the
excitation wavelength from Ar" blue at 488 nm to Nd^"^;YAG at 1064 nm, for a
rotational Raman line at +100 cm"^ shift.
• The detectivity of the two most commonly-used near-IR photodetector systems
leave much to be desired when compared to the systems available in the visible. In
the visible region PMTs, CCDs and IDAs provide detectivity that makes
spectroscopy limited by the shot-noise* of the Raman signal routinely feasible.
The same is simply not true of the Ge and InGaAs photoelements and arrays
available for near-IR spectroscopy. This is partly a fundamental limitation of the
materials, and partly the processing electronics. Devices based on these last two
detector materials suffer in comparison because the signal powers required to
generate a S:N ratio of 1:1 are at least 100 times higher than the comparable
visible detection systems even for the highest quality near-IR detector elements
with the best possible associated electronics^.
Shot noise occurs whenever ihe measured process involves measurement of the random,
uncorrelated movement of quantised species (photons arriving at a detector, electrons moving across
a transistor junction, etc.).
162

Counterbalancing in some part these severe disadvantages is Jacquinot
advantage. Briefly restated:
« "77)6 rArofyg/iyzf/r qyaw /Ag /procAfC/
q/" Am/Zmg goW OMg/e w;//? /7/?77V7M croa^-^ec^;o??o/ orea-ZeMok /o 6g 30-300
times higher than for a grating spectrometer of the same resolving power. "
In the near-IR it has been estimated^ that this benefit is of the order of 200
times.
6.4 Previous work
Although limited, a small amount of interferometric gas-phase and near-IR-
excited gas-phase work has been carried out.
• Non-}iear-IR interferometric studies - the most interesting pre-FT-Raman work
was carried out using a stellar observation interferometer at the Kitts Peak
National Observatory in the United States during the mid-1980s. This
spectrometer is a purpose-designed visible Fourier transform spectrometer (FTS),
employing a complex arrangement of "Cats Eyes" retrorefiectors and multiple
beamsplitters & recombiners^. It operates under vacuum, and utilises either one
or two PMT detectors, dependant on whether the spectrometer is operated in
double-output or double-passed mode. It is a fine example of a 1-meter optical
path difference (OPD) Connes-type interferometer'^, and could never be
described as well-suited to routine analytical methods.
Sample pressures were typically just below atmospheric, whilst scan times were
typically 3-6 hours for good (>150:1) S:N at 0.1 cm"^ resolution. The Raman
spectra were excited using Ar""" blue (488 nm) and green (514 nm) lines. Eight
simple gases were studied^ ^ for both rotational and rovibrational detail, whilst
higher-resolution data was also recorded ^ ^ on D2, as well as the rotational
Raman spectra of H2 and D2 in flames The authors found little to dissuade
them from the technique, apart from the difficulty in rejecting the light at the
excitation wavelength without obscuring the Raman scattering. The authors were
certainly more optimistic in their assessment of the possibilities for FT-Raman
than were Schildkraut and Hirschfeld, in their original article on the method
163

• bry-Perot Iiiterferometry - an ingenious use of a Fabry-Perot interferometer
(FPI) briefly saw cross-over from atomic vapour emission spectroscopy during
the early 1970sl5-17 y^is device may functions as a very narrow passband
wavelength-recursive filter (etalon)^^, or as a high-throughput high-resolution
interferometer (scanning FPI)^^ additional resolution (<0.01 cm"^)
available by this method is greatly advantageous in resolving out the complexity
of bands in the rotational spectrum of even the simplest gas mixture, and therefore
has a greater claim as an analytical device. However, the scanning FPI is difficult
to align and to stabilise, whilst the etalon requires following with a low-dispersion
spectrograph to overcome the coalescence of the individual interference fringe
patterns. It proved possible to achieve satisfactory laser line rejection without pre-
filtering.
• Near-IR non-interferometric studies - one example of this area is available in the
literature'^, where a double-grating additive-dispersion spectrometer was
optimised for the near-IR, and equipped with a cooled Ge photodiode detector
using a phase-sensitive "lock-in" detection technique. Excitation was provided by
a Nd"^' :YAG laser at 1064 nm with prism pre-filtering. Good S:N data was
acquired, albeit at the expense of very high (<10 W) excitation power and
reasonably low (3 cm"^) spectral resolution. However, bands close (20-30 cm"^)
to the Rayleigh line could be detected quite easily with this spectrometer, with
both Stokes and anti-Stokes data available.
6.5 Results
Figure 6.1 shows the spectrum of air obtained on the prototype PE 1700
series FT-Raman spectrometer, simply observing the empty sample position.
164

2600 2500 2400 2300 2200
Waveniunber shift (cm-1)
2100 2000
Figure 6.1 Spectmrn of air with no cell.
This data (the N2 vibrational line at 2331 cm"^) was obtained after co-adding
400 spectra at 4 cm"^ resolution using 2.5 W excitation power. S:N is 3: ] at best,
achieved in almost exactly 1 hour.
In order to realise better quality data it is patently obvious that it is necessary
to collect more Raman scattered light. The simplest way to achieve this is to increase
the effective power density at the focus of the spectrometer - and the most successful
way of achieving this is to multipass the laser beam through the viewed spot. Simply
increasing the laser power is often practical - the two methods are sometimes
combined.
In conventional gas-phase experiments, increasing the brightness in the viewed
patch is most often achieved in one of three ways. These arrangements are illustrated
in figure 6.2, and several references serve as excellent introductions^^"24;
• The cotifocal-resonator or spherical-cavitv cell. The laser is injected off-axis into
a confocal resonator, comprising (a)spheric reflecting surfaces or lens/mirror
combinations, and subsequently traverses the centre focal spot a number of times
determined by the exact geometry. A high-aperture collecting mirror focuses the
scattered light back to the focal point; the spectrometer optics also view this
point.
The intracavitv cell. This takes advantage of the much higher intensity inside the
cavity, although problems in alignment and more fundamental issues involving
165

which lasing transition(s) and mode(s) dominate often render the intra-cavity
method difficult to optimise. Any misalignment drastically reduces the power
available, as it directly affects the lasing of the device - the alignment is veiy
critical.
• The external resonator. This is an arrangement which appears half way between
the first two solutions. After the output-coupling (less reflective) front mirror of
the laser cavity an anti-reflection coated lens is introduced to focus the beam into
the gas cell, then a spherical mirror used to refocus the diverging beam. The gas
cell windows need to be anti-reflection coated, or preferably Brewster-angled to
minimise reflection. This results in a higher power than available directly after the
output coupler, with consequential gain in power in the cell, because the effective
end of the laser cavity is now the "return" spherical mirror. This set-up is much
less difficult to align - and the laser still ftmctions when the external cell is
misaligned slightly.
The major problem is that all of these designs are optimised for the 90°
scattering geometry, and are difficult to adapt to any other. For reasons involving the
much greater ease of alignment inherent to "backscattering" (180°) collection, 90°
collection is not used on most commercial FT-Raman spectrometei"s; since the laser
and spectrometer are in theory focused at the same point in space for the
backscattering method, three degrees of freedom and complexity are removed from
the alignment. Some commercial FT-Raman spectrometers now include the 90°
collection geometry for certain polarisation measurements.
Rather than try to adapt a multipass cell, it was decided to construct a
multireflection cell especially for the backscattering experiment, to retain the ease of
alignment. The solution was to use a "lightpipe" from a gas chromatograph (GC) IR
spectrometer accessory as the basis for the cell design*. The cell would be aligned
colinearly with the instrument optical axis, and the laser focused tightly into one end.
The lightpipe is essentially a glass tube of external diameter 1 cm and internal
bore 1 mm that has been metallicised internally. The metal of choice in the near-IR is
gold, as it has a high (>98 %) reflectivity over the 1-2 pm wavelength range.
One of the major problems associated with this approach is the development
expense. Perkin Elmer (UK) Ltd kindly supplied free-of-charge several lightpipes
from GC/IR spectrometers that had been damaged in transit.
Bruker GmbH have patented a long pathlength liquid cell to similar design^^.
166

netro-tellection nelu'n mirtw
\ Laser injection miirvi • laser »l MimM »#§le w
e -
angled window* Spccltomelcf Optic
i) Confocal resonator.
/ Goi cell with SpectfofimlEi anuleU windows SpectfofimlEi
ii) Intracavity cell.
eiitpul coupler \ EHe ctive
OWM
. - J
/ c _ Spectroinelcf
iii) External resonator.
Figure 6.2 Various classical aas cell geometries.
167
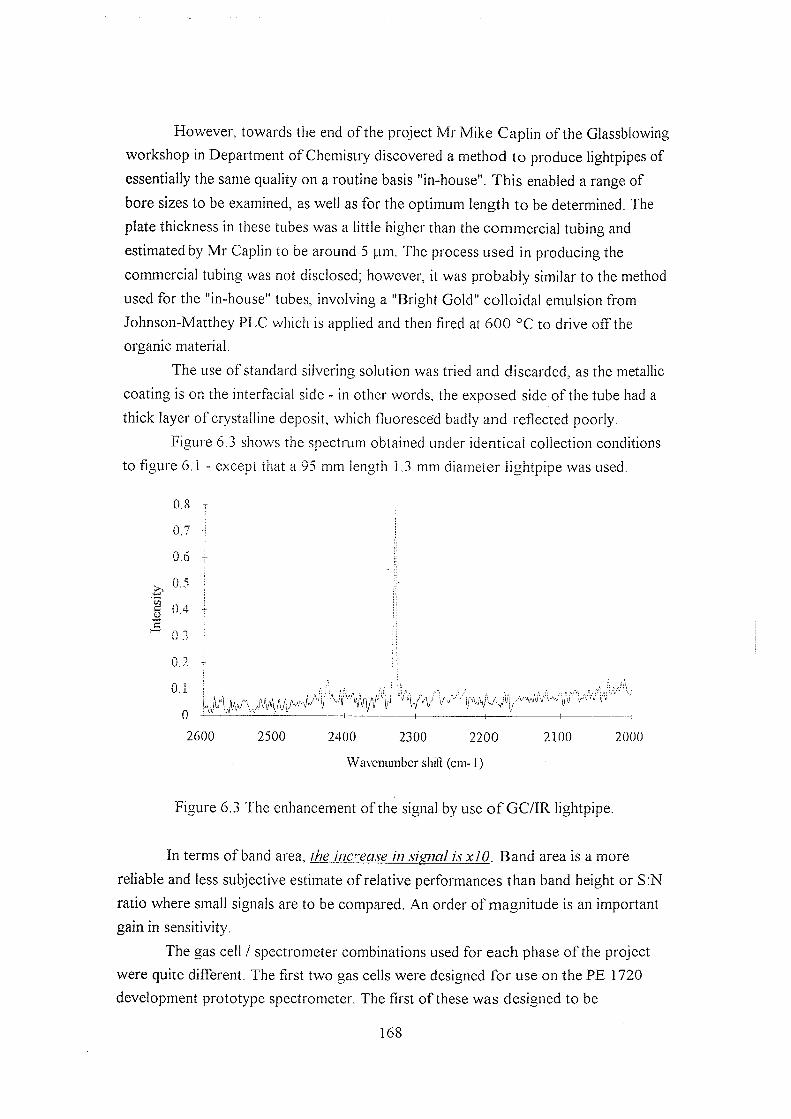
However, towards the end of the project Mr Mike Caplin of the Glassblowing
workshop in Department of Chemistry discovered a method to produce lightpipes of
essentially the same quality on a routine basis "in-house". This enabled a range of
bore sizes to be examined, as well as for the optimum length to be determined. The
plate thickness in these tubes was a little higher than the commercial tubing and
estimated by Mr Caplin to be around 5 ^m. The process used in producing the
commercial tubing was not disclosed; however, it was probably similar to the method
used for the "in-house" tubes, involving a "Bright Gold" colloidal emulsion from
Johnson-Matthey PLC which is applied and then fired at 600 °C to drive off the
organic material.
The use of standard silvering solution was tried and discarded, as the metallic
coating is on the interfacial side - in other words, the exposed side of the tube had a
thick layer of crystalline deposit, which fluoresced badly and reflected poorly.
i"igure 6.3 shows the spectrum obtained under identical collection conditions
to figure 6.1 - except that a 95 mm length 1.3 mm diameter iightpipe was used.
1
0.8
0.7
0.6
0.5
0.4 -
0.3 t
0.2
0.1
0 '•"I •
2600 2500 2400 2300 2200
Waveniunber shift (cm-1)
2100 2000
Figure 6.3 The enhancement of the signal by use o f GC/IR lightpipe.
In terms of band area, the in cease in signal is xlO. Band area is a more
reliable and less subjective estimate of relative performances than band height or S:N
ratio where small signals are to be compared. An order of magnitude is an important
gain in sensitivity.
The gas cell / spectrometer combinations used for each phase of the project
were quite different. The first two gas cells were designed for use on the PE 1720
development prototype spectrometer. The first of these was designed to be
168

demountable on a standard 3 x 2 accessory card. Although the second design was
also demountable, it was held in a specially-designed baseplate/sample stage. The
advantage of the standard accessory approach is that changeover from gas-phase to
other studies remains an easy operation. However, the focusing reproducibility of the
first approach was poor, and so results were vei"y difficult to reproduce. In addition,
filling required the use of a small vacuum line - the cell was be evacuated, then a flask
containing either a gas or a liquid with high vapour pressure connected to the gas line
and the cell opened to admit the gas.
The overall size of the cell and the bulky gas-handling facilities were perfectly
acceptable for use in the laser laboratory, where open sampling arrangements did not
contravene laser safety regulations, but for analytical systems the design was
inappropriate. In order to satisfy the analytical requirements, a third system based
upon a demountable cradle was designed. This cradle accepted a jig for alignment
purposes as well as the cell itself, i he gas handling fittings vv'ere more rudimentary on
this cell, but demonstrated the feasibility of the cell. The cradle fitted directly to the
much-improved sample area baseplate of the PE 1760X commercial spectrometer,
and combined good reproducibility with ease of fitting. The only outstanding issue on
this cell was the need to devise some method of adjusting the positioning of the ceil
with the sample area closed. The cell itself is shown below in figures 6.4 & 6.5 -
notice that although this cell was simpler to fill directly from stock cylinders, no
vacuum line fittings were incorporated.
169
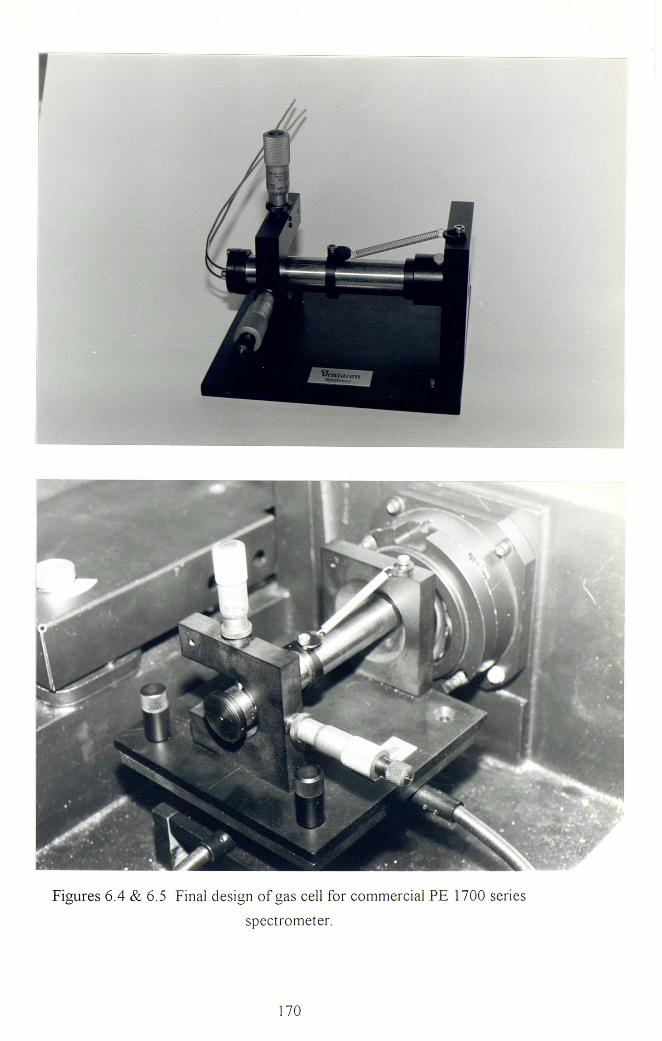
r
rn/4irf»»»
Figures 6.4 & 6.5 Final design of gas cell for commercial PE 1700 series
spectrometer.
170
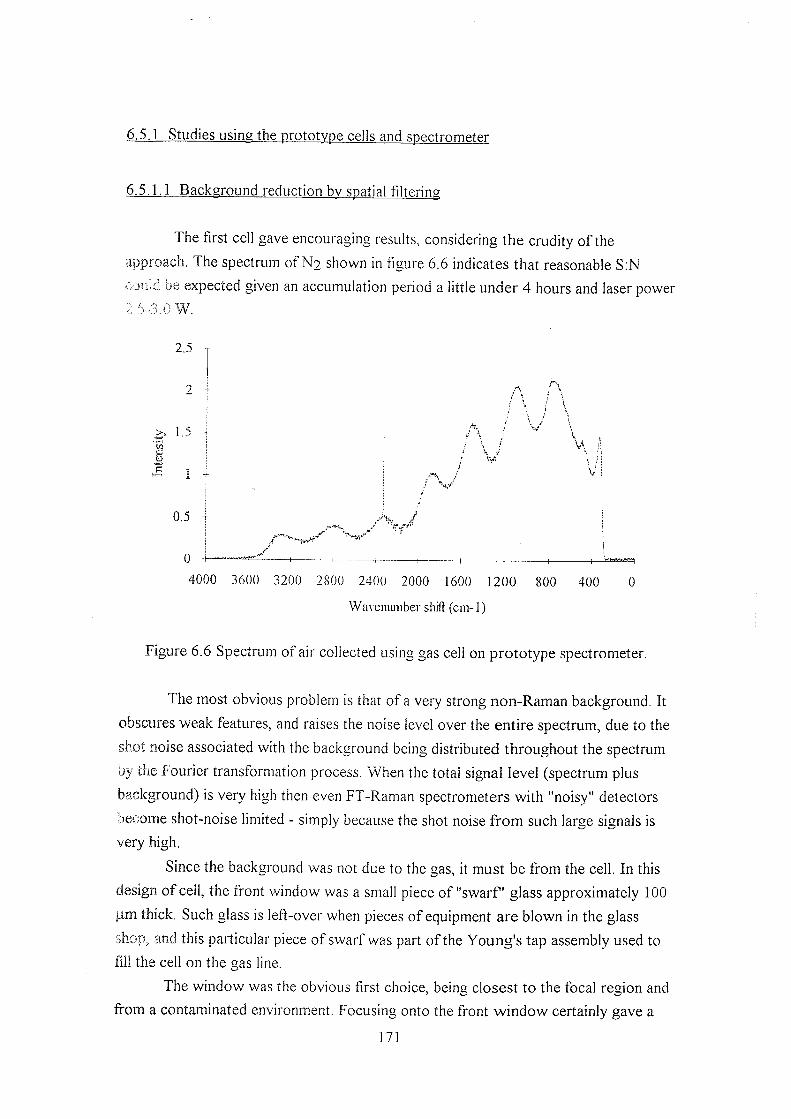
6.5.1 Studies using the prototype cells and spectrometer
6.5.1.1 Background reduction by spatial filtering
The first cell gave encouraging results, considering the crudity of the
approach. The spectrum of N2 shown in figure 6.6 indicates that reasonable S:N
couid 4} be expected given an accumulation period a little under 4 hours and laser power
.5.3.0 W.
T
I , 0.5
V\
0
4000 3600 3200 2800 2400 2000 1600 1200 800 400 0
Waveniuiiber shift (cm- ])
Figure 6.6 Spectrum of air collected using gas cell on prototype spectrometer.
The most obvious problem is that of a very strong non-Raman background. It
obscures weak features, and raises the noise level over the entire spectrum, due to the
shot noise associated with the background being distributed throughout the spectrum
by the Fourier transformation process. When the total signal level (spectrum plus
background) is very high then even FT-Raman spectrometers with "noisy" detectors
become shot-noise limited - simply because the shot noise f rom such large signals is
very high.
Since the background was not due to the gas, it must be from the cell. In this
design of cell, the front window was a small piece of "swarf glass approximately 100
j-im thick. Such glass is left-over when pieces of equipment are blown in the glass
shop, and this particular piece of swarf was part of the Young's tap assembly used to
fill the cell on the gas line.
The window was the obvious first choice, being closest to the focal region and
from a contaminated environment. Focusing onto the front window certainly gave a
1 7 1

spectrum with background - although several orders of magnitude less than the
spectrum in figure 6.6, this implies that the background is a function of the cell body.
and not the window - either the gold coating, an adsorbed species, or the glass.
The latter turned out to be the case. Laser light was leaking through
microscopic holes in the gold coating, and exciting fluorescence in the glass. The
leakage of the laser light could be seen quite easily with the aid of a near-IR viewing
camera; when a 5 mW HeNe laser was shone along the bore axis, the red (633 nm)
light was clearly (albeit weakly) visible to the naked eye. The homogeneity of the
layer was obviously questionable, l he fluorescence was either escaping back through
the holes and reflecting into the focal region, or reflecting along inside the body of the
tube above the gold and emerging into the focal region through the front face.
To prevent this, several front face masks were evaluated. The simplest method
(an iris) proved diirlcuit to align reproducibly, whilst the idea of a cap was not feasible
because the cell end was not iiat; a pronounced ridge existed where the swarf had
been stamped onto the lightpipe to form the window, preventing a stable fit. Even in
the cases where a mask or iris could be positioned reasonably, alignment drifts
invariably led to the laser clipping the mask with a resulting thermal emission
background.
As an alternative, coating the front face seemed to present few problems.
However, gold leaf simply peeled too quickly, and was difficult to size correctly;
black enamel paint proved difficult to spread uniformly over the cell end without also
impinging into the tube bore.
A more elegant method was devised. The development spectrometer
foreoptics demagnify the image of the J-stop by a factor x6. So, if the J-stop were set
to 8 mm diameter, the viewed patch at the sample from which light would be
collected and processed would be 1.33 mm diameter. This is just fractionally greater
than the bore diameter of the Perkin Elmer lightpipe, hence the J-stop size could be
reduced to only imaee the area of the bore itself. Using a relationship derived from
chapter 1:
Av = Vabs.(rstop)^/2(f^ol])^
to relate resolution (Av in cm "), absolute wavenumber (v^bs cm'^), J-stop
radius (rstop in mm) and focal length of collimating optic (fcoll in mm), spectral
resolution at a Raman shift of 1400 cm ' from 1064 nm would be of 0.5 cm"^ and
give a viewed patch size of 0.48 mm if the J-stop were 2.8 mm in diameter.
172
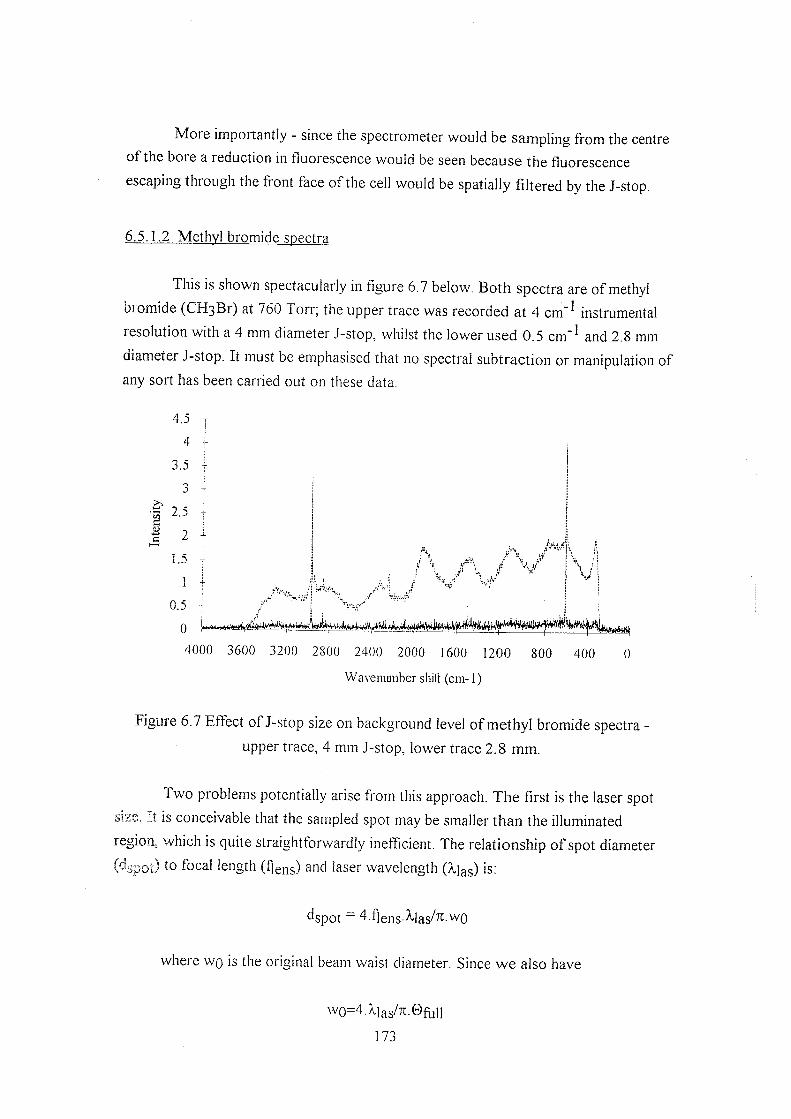
More importantly - since the spectrometer would be sampling from the centre
of the bore a reduction in fluorescence would be seen because the fluorescence
escaping through the front face of the cell would be spatially filtered by the J-stop.
6.5.1.2 Methyl bromide spectra
This is shown spectacularly in figure 6.7 below. Both spectra are of methyl
bromide (CHgBr) at 760 Torr; the upper trace was recorded at 4 cm"^ instrumental
resolution with a 4 mm diameter J-stop, whilst the lower used 0.5 cm"^ and 2.8 mm
diameter J-stop. It must oe emphasised that no spectral subtraction or manipulation of
any sort has been carried out on these data.
4.5
4 -
3.5
3 -
2.3 -
2 -
1.5 '
1
0.5
0 /
N,.
4000 3600 3200 2800 2400 2000 1600 1200 800 400 0
Waveiuuiiber shift (cm-1)
Figure 6.7 Efiect of J-stop size on background level of methyl bromide spectra -
upper trace, 4 mm J-stop, lower trace 2.8 mm.
Two problems potentially arise from this approach. The first is the laser spot
size. It is conceivable that the sampled spot may be smaller than the illuminated
region, which is quite straightforwardly inefficient. The relationship of spot diameter
(dgpot) to focal length (fiens) laser wavelength (^|as) is:
dspot 4.fiens-^las/^-W0
where wq is the original beam waist diameter. Since we also have
wo=4.X|as/7[.0full
173

where ©fuH is the full divergence angle of the beam, we are lead to the most general
expression applicable:
dspot" f|ens Gfull
For our system fiens ~ 160 mm, whilst ©fyH = 2 mrad. Therefore, the laser
spot size is 0.32 mm, well under the 0.48 mm viewed patch size.
The second problem is the reduction in throughput on closing down the
entrance aperture. The background signal component was strongest with large J-stop
- unsurprising if the edges of the 1.3 mm diameter lightpipe were "glowing".
However, closing the J-stop resulted in useful signal from the bore also being
discarded - as this was no longer admitted to the spectrometer. The ratio of the
transmitted intensities is simply the ratio of the aperture areas, so we have (d'/d)^ = (
Av'/Av). In other words, if we change from a 4 mm diameter aperture to a 2.8 mm
aperture, we reduce the light throughput by x2. Put another way, we would have to
collect x4 as many accumulations to generate equal S:N. The reduction in throughput
can be verified by measuring the integrated band areas, with J-stop at 4 mm and 2.8
mm - the agreement with simple theory was good (18.2/9.7 = 1.9).
However, this last point neglects another effect on changing the J-stop size -
the change in aspect ratio (the height:width ratio of the band) on increasing the
resolution. Since S;N is generally a subjective assessment of peak-to-peak amplitude
at a Raman band position versus peak-to-peak noise amplitude in a nearby region free
from signal other than a baseline of similar magnitude, the apparent S;N remains
approximately the same on changing resolution.
Two aspects of the spectra in figure 6.7 are of interest. The C-H stretch at
2973.5 cm ^ in the low-resolution shifts up to 2973 cm"^ in the high-resolution
spectrum, as does the C-Br stretch at 611 and 612 cm"^ respectively. This is purely
systematic J-stop error as discussed in chapter 1. The second point is that even at
high resolution the effect of the 50.5:49.5 ^^Br:"^Br isotope splitting is not visible on
the band. This could be due to a combination of large natural linewidth with mass
effects. During the C-Br stretch, the Br- atom moves remarkably little in comparison
to the CH3- fragment, due to the six-fold higher mass of the Br- atom. It should be
noted that the limiting resolution on a PE series 1700 spectrometer is 0.5 cm"^, which
results in these experiments being spectrometer-resolution limited, and not laser-
174

linewidth limited , since Spectron 301 and 501 series YAG lasers have a linewidth of
around 0.05 cm' l .
6.5.1.3 Chlorine isotopic splitting
Chlorine (CI2) gives a fine example of an isotopic splitting requiring relatively
low resolution to observe. The spectrum shown in Hgure 6.8 required 800
accumulations at 1 cm ^ resolution with a 2.8 mm diameter J-stop and 3 Watts
excitation. Despite the very high background, two bands at 555.5 and 548.0 cm"^ are
clearly visible.
1
3
2.8
2.6
2.4
2.2
2
1,8
1.6
1.4
1.2
1
800 700 600 500
Waveiuuiiber sliift (cm-1)
400
Figure 6.8 Chlorine isotopic splitting
If the simple theory of simple harmonic oscillators is to be believed, then the
&equency diRerence between the " CI ^CI, ^^CI^^CI, and should be
simple to predict. The bond force constant kyib should remain constant for all
isotopomers of the diatomic species A-B, and then use the equation
where vvib = (kvib/|.i)^^^/27c
\l\x— 1 /RAMy^ + 1 / R A M g
MB. Our paper in The Analyst (Appendix 1) incorrectly stated the opposite to be true; this point
has been confirmed with Spectron Ltd.
175

In this equation RAM stands for relative atomic mass, and has units Kg/mol.
Using these equations, and knowing the two isotopes of CI have relative atomic mass
(in g/mol) 35 and 37 respectively:
^37:37/^37:35
^37:35 /^35:35 ^ 2 / 7 4
^37:37 /^35:35 ^ ^ / y ^
Since the relative abundance "'^Cl:'^'CI is 75.5:24.5, a 1 ;6;9 isotopic pattern
for the intensities should be observed, assuming in the usual way that scattering
efficiency is not influenced by isotopic mass.
It is clear that the two bands are due to the ^^CI^^Cl and ^^CI^^Cl
isotopomers, and that the highest-mass, lowest-abundance species is unresolvable at
this S:N level. The splitting of the bands (7.5 cm"^) agrees with the
predicted splitting (9-5 cm \) using the theory above and is in agreement with
the value26 fbr liquid CI? (7.4 crn-l) whilst the integrated band area ratio is 0.83 -
predicted to be 0.67 by simple theory. The gas-phase band position for the
fundamental transition is in good agreement with the literature value (554.9 cm"^)^^.
Alternate explanations that the weaker band is the "hpt-band" transition of the
most abundant isotopomer can be discounted, because the intensity ratio would be
0.05-0.10 at room temperature; a ratio of 0.67 would imply a sample temperature in
excess of 700 °C by simple Boltzmann statistics. Also, previous work^^ on liquid CI?
shows that the "hot-band" transition is displaced by 5 cm ^ from the fundamental, not
7.5 cm"^ as witnessed above.
Despite using a small J-stop, the background on the CI2 spectrum is still very
pronounced. This implies alignment is at fault - such problems can not be solved by
closing the J-stop. The background merits comment for two further reasons.
Firstly, the periodicity is due to ripples in the passband of the multilayer
dielectric filters used. Driven mainly by the surge in interest in FT-Raman methods,
the quality of these filters has improved dramatically in the last five years. Figure 6.9
shows the improvement in performance achieved with modern filters over the
development optics originally available*.
NB: Our paper in The Analyst (Appendix 1) has these diagrams incorrectly labelled.
176
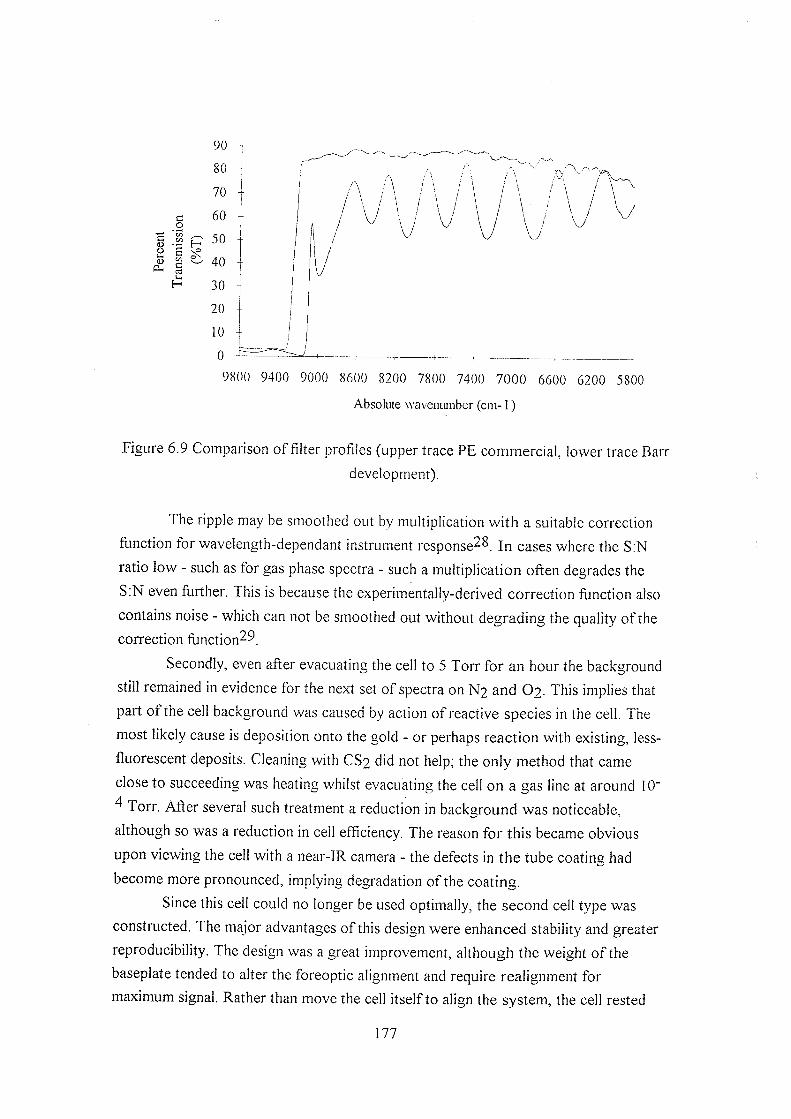
8 ^ 50
9800 9400 9000 8600 8200 7800 7400 7000 6600 6200 5800
Absolute waveniunber (cm-1)
Figure 6.9 Comparison of filter profiles (upper trace PE commercial, lower trace Barr
development).
The ripple may be smoothed out by multiplication with a suitable correction
function for wavelength-dependant instrument response^^. In cases where the S:N
ratio low - such as for gas phase spectra - such a multiplication often degrades the
S:N even further. This is because the experimentally-derived correction function also
contains noise - which can not be smoothed out without degrading the quality of the
correction function^^
Secondly, even after evacuating the cell to 5 Torr for an hour the background
still remained in evidence for the next set of spectra on N2 and O2 This implies that
part of the cell background was caused by action of reactive species in the cell. The
most likely cause is deposition onto the gold - or perhaps reaction with existing, less-
fluorescent deposits. Cleaning with CS? did not help; the only method that came
close to succeeding was heating whilst evacuating the cell on a gas line at around 10"
^ Torr. After several such treatment a reduction in background was noticeable,
although so was a reduction in ceil efficiency. The reason for this became obvious
upon viewing the cell with a near-IR camera - the defects in the tube coating had
become more pronounced, implying degradation of the coating.
Since this cell could no longer be used optimally, the second cell type was
constructed. The major advantages of this design were enhanced stability and greater
reproducibility. The design was a great improvement, although the weight of the
baseplate tended to alter the foreoptic alignment and require realignment for
maximum signal. Rather than move the cell itself to align the system, the cell rested
177
on four screws which could be independently raised or lowered to steer the cell
coaxial with the optic axis.
The front window was affixed to the cell 2-3 mm forward of the front face to
keep the window out of the focal region. The window itself needs to be highly-
transmissive and low in fluorescence. The best material was 0.5 mm thickness fused
quartz manufactured under the trade name "Spectrosil WF" as supplied by UQG Ltd.
This material had very low (ppm) metal ion content, and gave a very weak Raman
spectrum (of Si02J witn almost no iiuorescence. The window bonded cleanly to the
brass cell with cyanoacrylate-based adhesive (Loctite "SuperGlue"), forming a gas-
tight seal. At first problems were encountered with "fogging" of the cell window
internally aue to tne vapours given off on curing; this was avoided by gently flowing
N2 up the cell interior with an extraction fan on the exterior.
Given that this design of cell and mounting proved more stable and the results
were repeatable, it was possible to investigate the foreoptics more closely. Despite the
improvements, the fluorescent background was still noticeable on a good number of
spectra. The effect correlated not to sample, but to date of operation. The reason was
quickly discovered, and concerned the method of alignment.
On the development prototype, the HeNe interferometer alignment/timing
laser is not blocked after the J-stop. The collimated laser beam propagates along the
optic axis, and focuses at the J-stop and the conjugate focus, in the IR sample
compartment. This provides an ideal front-end alignment method, as the laser
diverges out of the J-stop, is intercepted by the collection optics, and therefore
focuses at the Raman sample position; since the collection optics are focused on the
J-stop. Since the HeNe beam propagating out of the J-stop is split into three spots,
the focus is established by noting where the weak red beams coalesces into one.
The problem with this method for very accurate alignment of small objects is
that in reality the HeNe does propagate exactly on-axis, and is arranged not to do
so deliberately. This is to avoid potential external resonator effects in the HeNe laser,
which would seriously disrupt the timing sequence and "crash" the interferometer.
The laser is deliberately knocked 2 mm askew by placing a washer under one of its
mountings. Obviously, this leads to a significant displacement of the focal spot for the
HeNe beam with respect to the optic axis after the beam has traversed the collection
optics.
Compounding this problem, the excitation laser was found to be non-axial
with respect to the HeNe axis by ± 1 mm. The focal position was also determined to
be incorrect, by about 1 mm. Such slight misalignments went essentially unnoticed
before these studies because the large (± 2 mm) depth of field of the collection optics
178

and the large viewed patch made these errors unimportant. Once the spectrometer
fbreoptics were realigned, the HeNe put back on-axis, and the exciting laser made
coaxial, the incidence of high background diminished markedly. This could not have
been achieved without a more stable cell design.
6.5.1.4 Carbon disulphide - higher order transitions
To demonstrate the improved performance, carbon disulphide (CS2) at a
pressure of 400 Torr was studied - the high and low resolution spectra shown in
figure 6,10a.
The Fermi-enhanced first overtone of the Raman-inactive stretching mode can
be seen quite clearly at 802 cm'^ in figure 6.10b. This is a classic and much-discussed
example-^0,j 1 of a weak Fermi resonance, in the sense that the unperturbed levels lie
reasonably far apart, which shows in the comparatively small enhancement of the
overtone band. Compare this with the Fermi resonance in carbon dioxide (CO2)
which is the best-known example of Fermi resonance to most Raman
spectroscopists32.
The bands at 659.1, 657.0, 651.8, and 649.9 cm"' are assigned as "hot-bands"
and isotopomers. The 657.0 and 649.9 cm~^ bands are included here even though
they appear close to the noise level because they can been seen as shoulders on the
lower-resolution spectrum; the band at 654.4 cm"' is not included, despite being of
similar intensity, because no evidence was seen in the lower-resolution spectrum.
7
6 -
5
i r 2 -
0
700 690 680 670 660 650 640 630 620 610 600
Wavemunber shift (cm-1)
Figure 6.10a Carbon disulphide. Lower trace: higher resolution.
179

2.5
&
- 1 II ^
0.5
900 )0 700
Wa\'eniuiiber shift (cm-1)
600
Figure 6.10b Fermi resonance in carbon disuiphide.
Briefly, the 659.1 cm feature is ascribed to the fundamental transition of the
symmetric stretch in both the and ground-state species.
whilst the 657 cm band is attributed to the first "hot-band" of this transition in the 32 12 32 ' 1
S C S isotopomer. The 651.8 cm band is due to the fundamental excitation of
the symmetric stretching mode of vibrationally-excited species with
single excitation in both the antisymmetric stretch and bending modes. The 649.9 cm"^
feature is due to the fundamental symmetric stretch of the ground-state
species and the first "hot-band" of the transition giving rise to the 651.8 cm~^ band.
6.5.2 Comparison of cell designs for the prototype Raman spectrometer
The obvious improvement of the second cell design is clearly seen in figure
6.11, comparing the C-H stretching region of two methane (CH4) spectra. It should
be noted that CH4 is a rather good Raman scatterer - it has a normalised differential
Raman scattering cross-section approximately 8 times higher^^ than that of N9.
180

25
20
^ 15
I ^ 10
3000 2600
Waveniuiiber shift (cm-1)
Figure 6.11 Overlaid spectra from the two cell designs - lower trace old design, upper
trace new design, offset by one unit.
The spectra used almost-equal excitation powers (2.5-2.75 W) and tube
lengths (100-110 mm); the old cell used 2 cm'^ resolution and a 5.6 mm J-stop,
whilst the new cell used 1 cm ^ resolution and 4 mm J-stop. The band shift noticeable
is partly J-stop error, partly due to a difference in laser reference wavenumber. The
details are contained in the table 6.1 below:
Conditions: Old prototvoe ceil New Drototvoe cell
Instrumental resolution 2 cm"^ 1 cm"^
J-stop diameter 5.6 mm 4.0 mm
Signal level (peak-peak,
2945-2880 cm"I)
5.21 24.8
Noise level (peak-peak,
2500-2100 cm-1)
0.09 0.47
S;N 57.9 52.8
Table 6.1 Comparison of gas cell efficiencies
The old cell appears marginally better in terms of S;N - yet this spectrum took
7 ^ accumulations, compared to 25 for the new cell. In other words, a x30 reduction
in scanning time.
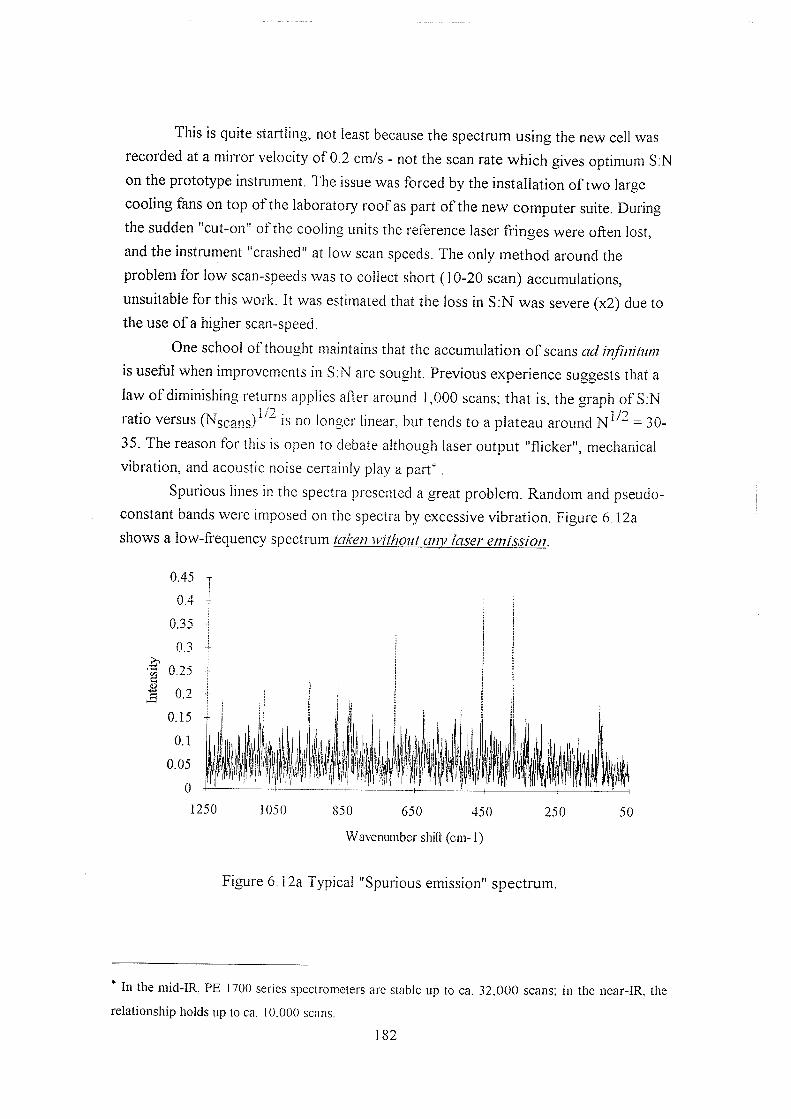
This is quite startling, not least because the spectrum using the new cell was
recorded at a mirror velocity of 0.2 cm/s - not the scan rate which gives optimum SiN
on the prototype instrument. The issue was forced by the installation of two large
cooling fans on top of the laboratory roof as part of the new computer suite. During
the sudden cut-on or the cooling units the reference laser fringes were often lost,
and the instrument "crashed" at low scan speeds. The only method around the
problem for low scan-speeds was to collect short (10-20 scan) accumulations,
unsuitable for this work. It was estimated that the loss in S:N was severe (x2) due to
the use of a higher scan-speed.
One school of thought maintains that the accumulation of scans ad infinitum
is useful when improvements in S:N are sought. Previous experience suggests that a
law of diminishing returns applies aAer around 1,000 scans; that is, the graph of S:N
ratio versus (Ngcang)^'" is no longer linear, but tends to a plateau around = 30-
35. The reason for this is open to debate although laser output "flicker", mechanical
vibration, and acoustic noise certainly play a part'.
Spurious lines in the spectra presented a great problem. Random and pseudo-
constant bands were imposed on the spectra by excessive vibration. Figure 6.12a
shows a low-frequency spectrum 1ake7i without any laser emission.
II m m
1250 ]050 850 650 450
Wavenmnber sliifl (cm-1)
250 50
Figure 6.12a Typical "Spurious emission" spectrum.
In the niid-IR, PE 1700 series spectrometers are stable up to ca. 32.000 scans; in the near-IR, the
relationship holds up to ca. 10.000 scans.
182

A band near 1495 cm"^ was also noted
below; in many spectra, seen in figure 6.12b
I
2.5
0.5
1600 ^ 5 0 1500 1450
Wa\ eniiniber shift (cm-1)
1400
Figure 6.12b Reference HeNe laser-derived band.
This was not due to vibration or the room lighting, nor leakage through the
laser plasma-line rejection filters, but appeared to be caused by the HeNe reference
laser. In absolute wavenumbers, the band is at 7901 cm"^; this is almost exactlv half
the HeNe laser wavenumber, 15803 cm '. Hence, this band may be put down to a
problem with the electronic anti-aliasing filters, again not noticed until very high
sensitivity was required.
If the excitation laser intensity is time-varying at around the same rate as the
data collection rate (scan-speed dependant, usually around 1-3 KHz for near-IR
wavelengths) then the interferogram may contain additional unwanted periodicities,
because the actual intensity of the Raman scattering will not be constant at each data
collection point - the FT process may interpret such periodic variations of the
interferogram as "real" features, and generate unwanted spectral components. At the
very least, a noisy laser output will degrade the S: N of the spectrum by increasing
noise in the interferogram. For this reason, an active stabilisation circuit was added to
the laser head, feeding a fraction of the power to a fast-response photodiode, with
control loop to the 3-phase supply. This method stabilised the power output to 0.1%
RMS of the maximum output intensity. The less-welcome outcome was that the
maximum power available at the sample was restricted to 2-3 W to ensure stability.
In order to overcome low sensitivity, other methods o f S:N improvement that
were assessed, including retrorefiection of the laser down the tube to create a two-

pass cell, and cooling the detector. Retroreflection proved non-trivial, as plane
mirrors channel an appreciable proportion of the diverging light into the glass of the
cell even when the back face is coated in the same way as the front; this obviously
causes increased fluorescence. iNevertneless, in favourable cases improvements
between 20-80% were acnieved, so the method has promise. The use of a curved
mirror to focus the laser back into the tube was briefly investigated; the difficulty here
was of alignment with little feedback to aid the optimisation. Cooling the detector
should have led to a lactor x2 improvement in S;N, after calculation using figures
provided by the manufacturer. In the case of the development prototype spectrometer
this was unattainable, due a fault in the Dewar design, which led to the InGaAs
photoaiode element vibrating excessively at 77 K against the strained gold electrical
contacts to the photoelement.
6.5.2.1 Rotational Raman spectra
Rotational and rovibrational Kaman spectroscopy is desirable for several
reasons, bpecies without a permanent electric dipole moment or significant change in
dipole moment during rotation may be studied, unlike with IR or microwave
techniques; it is possible to deduce accurate values for bond lengths and centrifugal
distortion coefficients from rotational spectra, as well as molecular symmetries^.
Any attempt at rotational Raman spectroscopy requires very low stray light
levels and very strong Rayieigh line rejection, because pure rotational bands nearly
always lie in the 1-300 cm ^ shift region'. Only for the lightest of molecules do the
rotational bands lie greatly outside this region. Mixtures present a great challenge.
High resolution is needed to decongest the overlapping series of bands. This suggests
the need for high-dispersion, low-stray-light triple grating devices.
Fortuitously, it has long been known that the ititesrated intensity of pure
rotational Raman lines far exceeds the integrated intensity of rovibrational lines, by a
factor of X100 in most cases^' . Thus a strong rotational line is usually more intense
than a pure vibrational line. It should be perfectly possible to collect rotational Raman
spectra on an FT-Raman spectrometer, since this work has shown vibrational gas-
phase spectroscopy to be viable.
To demonstrate this, the pure rotational spectra of N ? and O? were studied
using the second cell design. Given that CH4 has eight times the relative normalised
* As a "ball-park" figure, reckon on the rotational line spacing being ca. 1/100^^ of the
vibrational transition energy.
184

differential Raman scattering cross-section than either of these species^^, it seems
strange at Brst glance not to use this instead. However, CH4 is tetrahedral (Tj) in
symmetry, and does not possess a pure rotational spectrum since it is a spherical top
molecule - the polarisability is not modulated during rotation or any symmetric
v i b r a t i o n - ^ 3 , 3 4
The rotational spectra of N2 and O2 are shown below, displayed over the
range 200-50 cm \ These spectra were recorded at 1 cm"^ resolution using 100
accumulations and 2 W excitation power at 760 Torr pressure. It should be noted that
the total acquisition time was only one hour.
1
0.9 T
0.8
0.7
0 ^
0.5
0 ^
0.3
&2 -
0.1 -
0 iNl
190 170 150
V \I
130 110 90 70
Waveiuuiiber sliift (cm-1)
Figure 6.13 Pure rotational Raman spectrum o f N ? .
50
Considering N2 first (spectrum figure 6.13, data figure 6.14) it is clear that a
line between 154.5 and 170.0 cm ^ is missing from the progression. This line should
be near 162.0 cm ^. This absence must be caused by a filter artefact. The major
practical problem that arises with detection of low-frequency bands with the FT-
Raman technique concerns the laser rejection filters. These exhibit large changes in
transmissivity in the low-frequency region where the rotational lines appear, which
obscures many lines and distorts the intensity "envelope".
It is, however, possible to angle-tune the band edge or blocked region over a
short range to shorter wavelength, thus increasing the low-shift performance^^. The
problem is that the optical density (OD) - defined as equal to -log}Q(%T) - decreases
as a strong function of tuning angle. With the filters supplied by Perkin Elmer, it
proved possible to achieve a suitable balance at around 15°. Transmission data on
these filters was not obtained at the working angle.
1 8 5

The band at 83.0 cm looks as though it should be included in the series,
although this is possibly dubious since the S:N is about 1:1 at this band. However, if
the data is plotted as in figure 6 .15a straight line fit between the data points of slope
7.86 and correlation coefficient 0.9999 is obtained-the intercept at zero being 83.7
cm"^. Therefore, the addition of the band at the 83 cm"^ position could be justified.
190
170
N 150 --9 a O 130 -r P (3 Eg 110 j
90
70 -
50 -
4 6
Arbilran,' J number
10 12
Figure 6.14 Plot of band position versus arbitrary J number for N?.
Classically, the energy of a non-vibrating, non-translating diatomic molecule
rotating in space about one of the two equivalent orthogonal axes perpendicular to
the internuclear axis is given by:
E = '/21 ©2
Where I represents the moment of inertia of the system about the chosen axis,
given by I = ^.r". Here, jii (Kg) represents the reduced mass once again and r is the
interatomic distance (m).
There is no moment of inertia for rotation about the internuclear axis - all the
mass lies on this axis; there is no angular momentum generated by motion around this
axis.
Re-writing the equation in terms of angular momentum about the axis, P = I ©
proves useful:
E = p2 / 21
P = V2EI
The quantum-mechanical expression for the diatomic rigid rotator has
solutions:
186
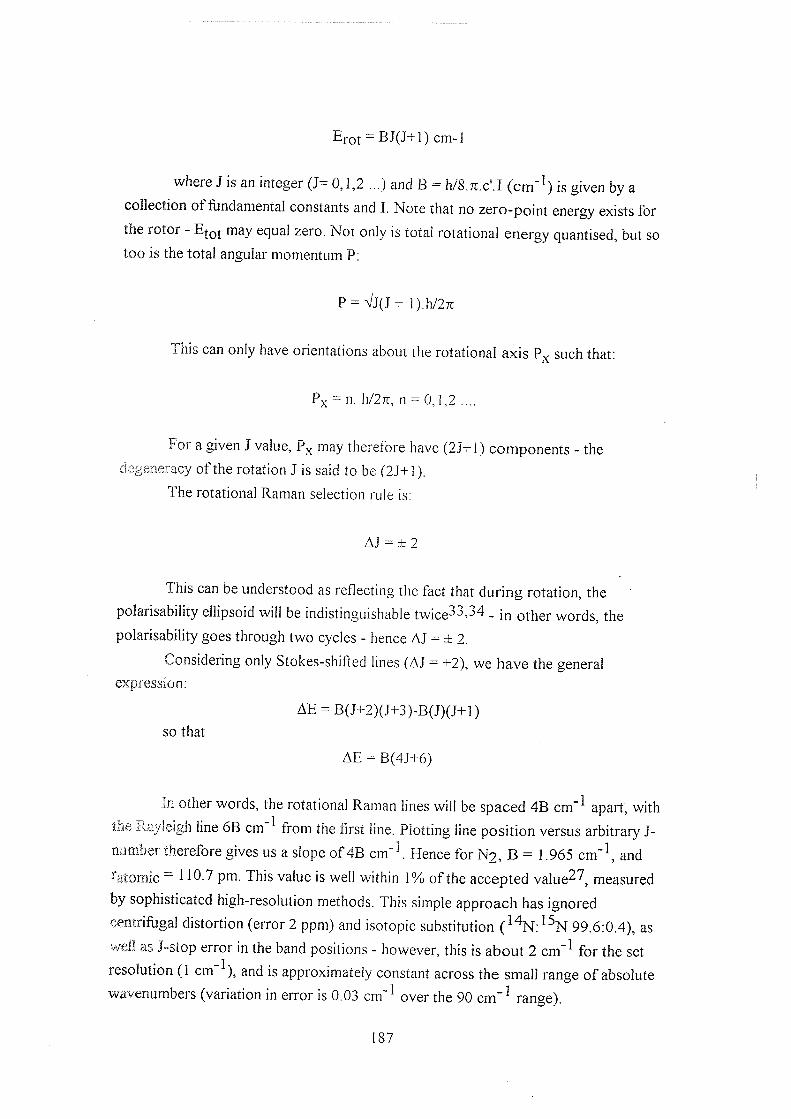
Ej-ot - BJ(J+]) cm-1
where J is an integer (J— 0,1,2 ...) and B = h/S.K.c'.I (cm is given by a
collection of fundamental constants ana I. Note that no zero-point energy exists for
the rotor - may equal zero. Not only is total rotational energy quantised, but so
too is the total angular momentum P:
P = Vj(j + l).h/27r
This can only have orientations about the rotational axis P^ such that:
Px = n. lT/27r, n = 0,1,2 ....
For a given J value, may therefore have (2J+1) components - the
degeneracy of the rotation J is said to be (2J+]).
The rotational Raman selection rule is:
AJ = ± 2
This can be understood as reflecting the fact that during rotation, the
polarisability ellipsoid will be indistinguishable twice-^-'->-' - in other words, the
polarisability goes through two cycles - hence AJ = ± 2.
Considering only Stokes-shifted lines (AJ = +2), we have the general
expression:
AE = B(J+2)(J+3)-B(J)(J+l)
so that
AE = B(4J+6)
In other words, the rotational Raman lines will be spaced 4B cm"^ apart, with
the liayleigh line 6B cm ^ from the first line. Plotting line position versus arbitrary J-
number therefore gives us a slope of 4B cm ^. Hence for N9, B = 1.965 c m " \ and
%tomic ~ 110.7 pm. This value is well within 1% of the accepted value^^, measured
by sophisticated high-resolution methods. This simple approach has ignored
centrifugal distortion (error 2 ppm) and isotopic substitution 99.6:0.4), as
well as J-stop error in the band positions - however, this is about 2 cm'^ for the set
resolution (1 cm ), and is approximately constant across the small range of absolute
wavenumbers (variation in error is 0.03 cm"^ over the 90 cm"^ range).
187
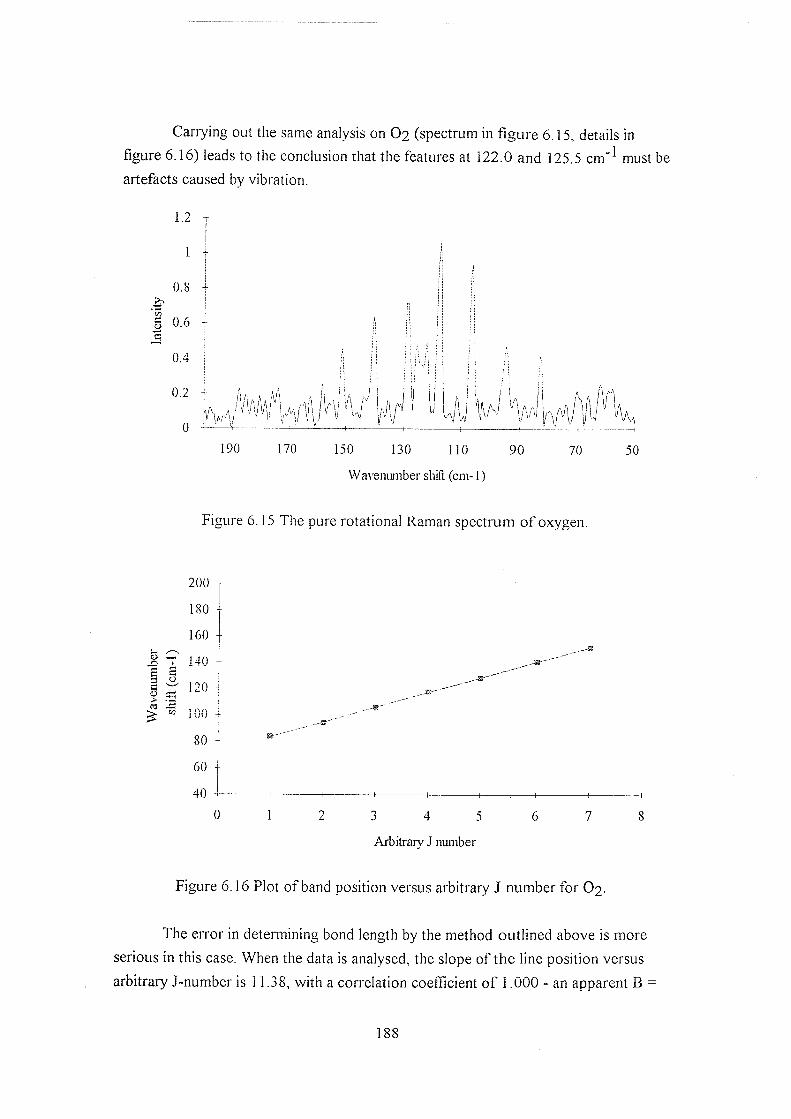
Carrying out the same analysis on O2 (spectrum in figure 6.15, details in
figure 6.16) leads to the conclusion that the features at 122.0 and 125.5 cm"^ must be
artefacts caused by vibration.
1.2
1
0.8
0^ -
0.2
0
II A! I I
"lAAihA'
190 170 LiO 130 110 9 0
Waveniunber shift (cm-1)
70 50
Figure 6.15 1 he pure rotational Raman spectrum of oxygen.
200 %
180
160
5= 140
a 1 2 0 -
1 100-
80-
60 -
4 0 -
0 1 2 3 4 5 6 7 8
Arbitrary J number
Figure 6.16 Plot of band position versus arbitrary J number for O?
The error in determining bond length by the method outlined above is more
serious in this case. When the data is analysed, the slope of the line position versus
arbitrary J-number is 11.38, with a correlation coefficient of 1.000 - an apparent B =
188

2.845 cm . This would lead to an O2 molecule of length 272.1 pm - which is
approximately 124 % too large^^.
The error occurs in the assumption that every transition is allowed with equal
intensity. In fact, for O2 every rotational state with an even J-value remains
unpopulated - thus every Raman transition from these states has a zero intensity-^
Hence we only see half as many lines as in the case of N2, so that the slope should be
8B cm ^ and B = 1.4225 cm ^ This leads to an internuclear distance of 121.7 pm,
again well within 1 % accuracy. The reason for the lack of population in every O2
state with even J-number is to do with the overall symmetry that these states would
possess - the symmetry of the product of the electronic, rotational, and nuclear spin
wavefunctions; it transpires that these states have disallowed symmetries.
One further point need be considered. If the laser line is not blocked strongly
enough by the rejection filters, the line can appear so intensely that "ringing" can be
seen extending many tens of wavenumbers into the spectrum. This is as a result of
incomplete apodisation, and should not be confused with rotational structure. The
ringing bands are quite broad, and occur in an area where the comparatively weak
Raman bands would still be strongly blocked by the rejection filters. The plasma
filters used on the laser output should be of the highest quality for this application,
since lamp-pumped \ AG lasers have strong sharp emission bands in the frequency
range that corresponds to the low shiA region.
The method of rotational FT-Raman spectroscopy seems perfectly viable on
the basis of these measurements. The S:N performance in the spectra above is
modest; with higher laser powers, cooled detectors, longer scans, and optimised scan
velocity values an increase in sensitivity of one order of magnitude should be quite
attainable. This is encouraging, as it suggests that partial pressures in the 70-80 Torr
region should be open to study.
Unfortunately, the rejection filters cut off too far from the laser line. This will
always be the limiting feature of the FT-Raman approach, and will restrict the
technique to analytical usage. This is the case even with the best currently-available
alternative rejection filter technologies, some of which display band edges near 40
cm ^ Stokes/anti-Stokes. Also, the sensitivity of the technique requires that the
spectrometer be perfectly optimised for every experiment, with the sample cell aligned
very accurately for each experiment.
The last two points place high demands on the stability of the spectrometer,
and the reproducibility of the sampling arrangement. Despite the great improvements
made over the first cell, the problems still encountered on the development prototype
189

spectrometer led to the development of the third cell design for the commercial
instrument.
6.5.2.2 "Filterless" FT-Raman spectrometry ?
Before moving on to the design of the third cell, the last point on the
development prototype concerns the possibility of doing away with Rayleigh filters all
together. Two factors give this approach credence. Firstly, the ratio of Rayleigh to
Raman scattering in the gas-phase is much lower when compared to solid or liquid-
phase results, so that the ratio lies between 10^-10^:1; and secondly, the Rayleigh line
should be highly p o l a r i s e d ^ ^ , 3 6 , 3 7
Because of these factors, it should be possible to use an efficient polariser to
reject the Rayleigh line, whilst most of the rotational Raman intensity would be
transmitted, because pure rotational lines (which exist for all molecules except
spherical tops, such as C H 4 and S F 5 ) are ahmvs d e p o l a r i s e d ^ ^ Hence the idea of
removing the Rayleigh filters, and replacing them with a polariser set at the J-stop to
pass linearly-polarised light orthogonal to the polarisation incident on the sample, the
polarisation of which would be retained (to excellent approximation) by the Rayleigh
scattering.
However, the success relied upon the spectrometer being isolated from stray
light, and upon the Rayleigh line remaining strongly polarised. It proved impossible to
satisfy these criteria on the development spectrometer - especially since the reflecting
prism was only 99 % reflective at best, so that the prism "glow" could not be masked
from the spectrometer effectively without obscuring >80 % of the collection volume.
Because light at the laser wavelength comprised a mixture of scatter, reflection, and
luminescence, the polarisation was not preserved - so that a significant amount of the
residual signal passed through the polariser at the laser wavelength. Given that the
LOT-Oriel linear near-IR polariser only had a 35 % transmission efficiency and 100:1
extinction coefficient at 1 f.im, the experiment failed. Even the substitution of more
efficient Perkin Elmer-supplied polarisers, additional spatial filtering, placing the
polarisers in collimated light, and installing a gold- coated highly-reflective prism did
not make the substantive gains required.
6.5.3 The commercial spectrometer
Although a great improvement, the second cell design/prototype spectrometer
combination still did not present the stability and reproducibility required of a routine
190

analytical method. The third design was constructed to fit the commercial PE 1760X
spectrometer.
Since this spectrometer is laser safety-rated "Class 1" in normal operation, the
HeNe alignment spots and the excitation laser may not ordinarily be used to align the
cell. Therefore, alternative alignment methods needed to be devised.
As detailed above, the cell was based on a demountable cradle which locates
with two bolts to the M5-drilled sample area baseplate of the spectrometer, after
removing the 3" x 2" accessory card holder. The cell is aligned with the aid of a jig,
which has removable end-caps. After rough alignment by eye, the rear end-cap is
removed, an optical power meter placed on the sample stage behind the jig, and the
"XYZ" sample stage positioners are adjusted to give maximum laser throughput. The
positioners exhibit considerable backlash. After this, the rear end-cap is replaced, and
the two micrometer positioners on the cell are adjusted to maximise the throughput.
Although the "Chinese Lock" used to hold the jig and cell steady is stable, it does
mean that any adjustment to the micrometers alters slightly the position of the cell
front. Therefore, it is also necessary to make slight adjustments to the "XYZ"
positioners. After this, the spectrometer is placed into "Monitor" mode, and the
energy throughput noted, t he idea is to make small adjustments to the alignment of
the cell to minimise the figure-this figure is due to the fluorescence of the brass used
to make the end-caps, and drops dramatically when the cell is properly aligned. The
power meter is then removed, and the jig replaced with the gas cell.
The problem with this approach is quite obvious - since it requires many
iterations, it requires that the sample compartment be opened very often. This means
that the laser is switched to "Standby" (zero-emission) mode, with the subsequent
need to wait a couple of minutes for the output power to restabilise, on every
iteration. This is unduly time-consuming, so for much of the development work, the
interlocks were defeated during the alignment phase. In a commercial design, the
micrometer positioners would have longer barrels, so that the controls might be
accessed via ports recessed into the sample compartment lid. The other advantage of
this approach is that the constant raising and lowering of the lid, with attendant
chance for misaligning the cell, is removed.
The cell itself had "Spectrosil WF" front and rear windows, with an "in-house"
tube of 100 mm length and 1 mm bore. The front and rear faces were coated with
gold paint, which proved an ideal mask material, to avoid severe fluorescence
backgrounds where slight misalignments occurred.
Before choosing this tube it was necessary to check the performance against
the Perkin Elmer-supplied tube. The spectra in figure 6.17 show quite clearly that the
191

"in-house" tube gave almost identical results in terms of signal levels and fluorescence
performance when similar tube lengths and bore sizes were compared at identical scan
conditions (100 scans at 4 cm'^ resolution with 1 W excitation).
0.6
0.5
0.4
0.3
0,2
0.1
0
3550 3050 2550 2050 1550 1050 550 50
Waveniuiiber shift (cm-1)
Figure 6.17 Comparison of PE and "In-house" tubes.
Slightly startling about this result is the fact that the Perkin Elmer tube had no
gold paint on the end-face to blank out luminescence from the glass, yet the
background is of a similar order of magnitude as the "in-house" tube with proven gold
end-coat. This must imply that it was possible to align the cell to a remarkably high
accuracy using the new cell holder.
This is borne out by a remarkable result, achieved quite by chance, M'ith hi si
the lis in place. Figure 6.18 was collected with 1 W excitation at 2 cm'^ resolution
after 100 scans. The spectrum proved repeatable - if the cell was driven through the
focal point and then re-positioned after taking up the backlash, the same spectrum
resulted. However, after demounting and remounting the jig the spectrum could not
be recovered. This conclusively shows the criticalitv of the alignment.
192
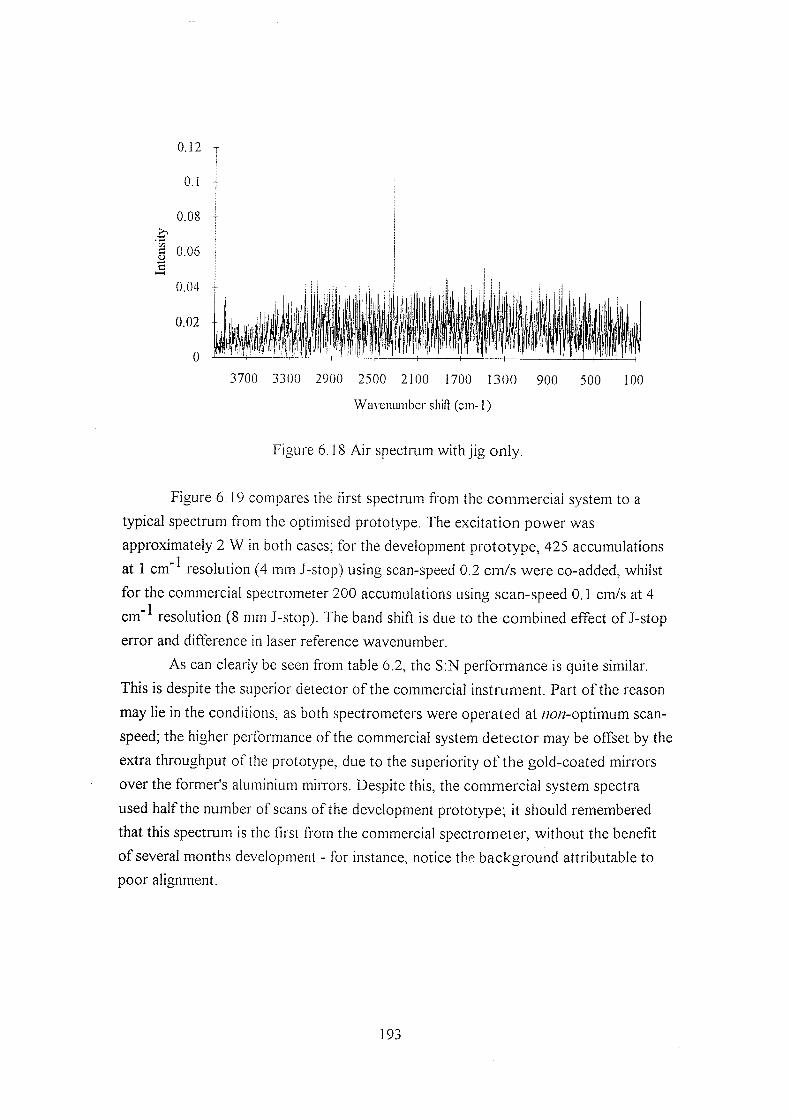
C U.U6
3700 3300 2900 2500 2100 1700 1300 900 500 100
Waveniuiiber sliifl (cm-1)
Figure 6.18 Air spectrum with jig only.
Figure 6.19 compares the first spectrum from the commercial system to a
typical spectrum from the optimised prototype. The excitation power was
approximately 2 W in both cases; for the development prototype, 425 accumulations
at 1 cm'^ resolution (4 mm J-stop) using scan-speed 0.2 cm/s were co-added, whilst
for the commercial spectrometer 200 accumulations using scan-speed 0.1 cm/s at 4
cm ^ resolution (8 mm J-stop). The band shift is due to the combined effect of J-stop
error and difference in laser reference wavenumber.
As can clearly be seen from table 6.2, the S:N performance is quite similar.
This is despite the superior detector of the commercial instrument. Part of the reason
may lie in the conditions, as both spectrometers were operated at /?o»-optimum scan-
speed; the higher performance of the commercial system detector may be offset by the
extra throughput of the prototype, due to the superiority of the gold-coated mirrors
over the formers aluminium mirrors. Despite this, the commercial system spectra
used half the number of scans of the development prototype; it should remembered
that this spectrum is the first from the commercial spectrometer, without the benefit
of several months development - for instance, notice the background attributable to
poor alignment.
193

2
1.8
1.6
1.4
1.2
1
0.8
0.6
0.4
0.2
0
3000 2700 2400 2100
Wavemuiiber sliift (cm-1)
1800 1500
Figure 6.19 Comparison of prototype and commercial systems - lower trace is from
commercial cell/spectrometer, upper trace from prototype systems - note 0.5 unit
ofkeL
Conditions: Commercial Prototype
Signal (peak-peak, 2350-
2 3 0 0 cm"^)
0 3 3 7 1.48
Noise (peak-peak, 2800-
2 6 0 0 c m - b
0 0 2 9 0 13
1 11.5 11.4
Table 6.2 Comparison of commercial and prototype spectrometers
The whole point of this development was to increase reproducibility to the
stage where it is a viable analytical method. As previously mentioned, problems that
were encountered with the prototype spectrometer itself engendered in part the move
to the commercial system. To justify the move, several factors were investigated.
The first area concerned the reproducibility of the spectra themselves. The
repeatability of measurement seems reasonable - figure 6.20 is a representative result.
Each of the five spectra resulted from 50 co-additions at 4 cm~^ resolution, with 1 W
excitation.
194
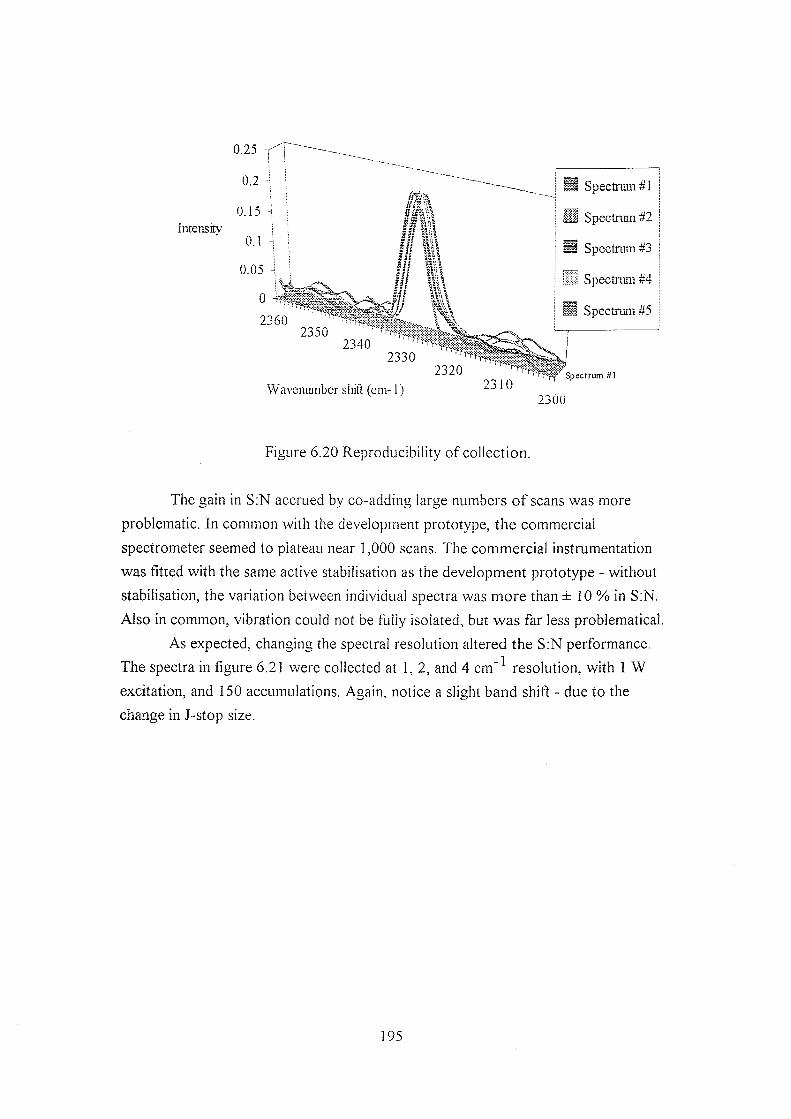
Interns ih'
Spectrum #1
i i Spectrum #2
H Spectrum #3
l i i Spectrum #4
Spectrum #5
2330
Waveiuuiiber sliill (cm-1)
2320
2300
Figure 6.20 Reproducibility of collection.
The gain in S:N accrued by co-adding large numbers of scans was more
problematic. In common with the development prototype, the commercial
spectrometer seemed to plateau near 1,000 scans. The commercial instrumentation
was fitted with the same active stabilisation as the development prototype - without
stabilisation, the variation between individual spectra was more than ± 10 % in S;N.
Also in common, vibration could not be fully isolated, but was far less problematical.
As expected, changing the spectral resolution altered the S:N performance.
The spectra in figure 6.21 were collected at 1,2, and 4 cm'^ resolution, with 1 W
excitation, and 150 accumulations. Again, notice a slight band shift - due to the
change in J-stop size.
195
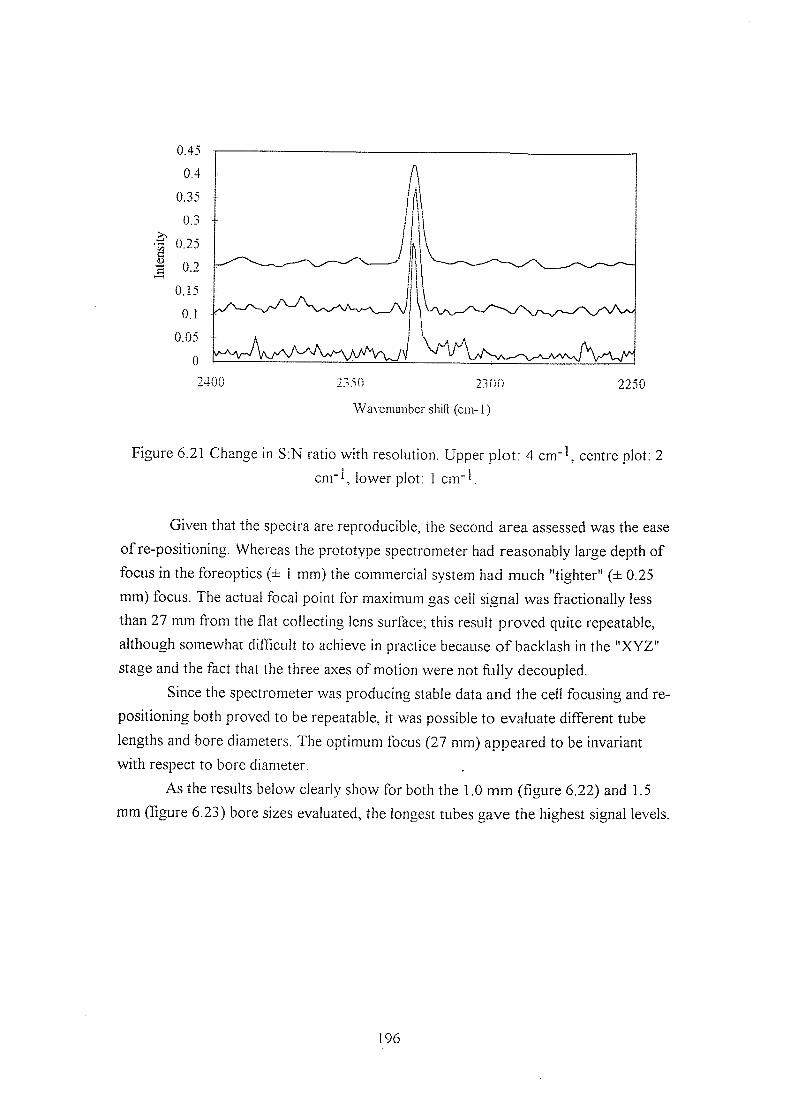
400 2350 230
WaNeniuiibcr shift (cm-1)
2250
Figure 6.21 Change in S:N ratio with resolution. Upper plot: 4 cm"^, centre plot: 2
crn'l , lower plot: 1 cm"V
Given that the spectra are reproducible, the second area assessed was the ease
of re-positioning. Whereas the prototype spectrometer had reasonably large depth of
focus in the foreoptics (± 1 mm) the commercial system had much "tighter" (± 0.25
mm) focus. The actual focal point for maximum gas cell signal was fractionally less
than 27 mm from the flat collecting lens surface; this result proved quite repeatable,
although somewhat difficult to achieve in practice because of backlash in the "XYZ"
stage and the fact that the three axes of motion were not fully decoupled.
Since the spectrometer was producing stable data and the cell focusing and re-
positioning both proved to be repeatable, it was possible to evaluate different tube
lengths and bore diameters. The optimum focus (27 mm) appeared to be invariant
with respect to bore diameter.
As the results below clearly show for both the 1.0 mm (figure 6.22) and 1.5
mm (figure 6.23) bore sizes evaluated, the longest tubes save the highest signal levels.
196
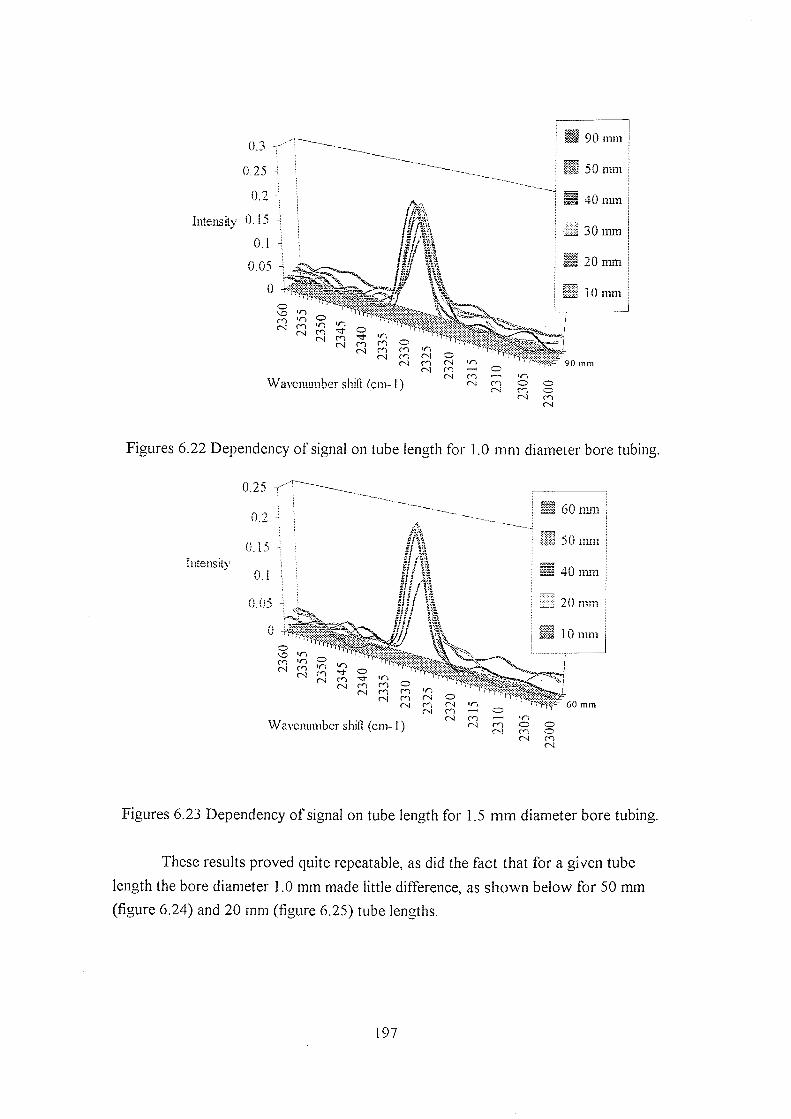
0.23 -
Intensih' 0 1 ^
90 mill
50 mm
40 mm
— 30 mm
20 mm
10 mm o
^
m 2
rs n (N o (N m rs (N m Wavenuinber sliift (cm-1)
m rs
Figures 6.22 Dependency of signal on tube length for 1.0 mm diameter bore tubing.
IntGnsk\'
60 rniD
)0 mm
U mm
:f f / M 20 mm
10 mm
6 0 m m
Wavemimber shift (cm-1)
Figures 6.23 Dependency of signal on tube length for 1.5 mm diameter bore tubing.
These results proved quite repeatable, as did the fact that for a given tube
length the bore diameter 1.0 mm made little difference, as shown below for 50 mm
(figure 6.24) and 20 mm (figure 6.25) tube lengths.
197

&25
0,2
0 15
I
a O.I
&05
0
1,0 mm
1.3 mm
2360 2340 2320
Wavenimiber shift (cm-1)
2300
Figure 6,24 Dependency of signal on bore size for 50 mm tubing.
§
0 25
0,:
OJii
0,1
0.05
! .5 mm
i ,0 mm
2360 2340 2320
Waveniunber shift (cm-1)
2300
Figure 6,25 Dependency of signal on bore size for 20 mm tubing.
The larger bore size was preferable, as it proved easier to align.
Given that the stability of the experiment was very good, further investigations
were made on retroreflectors. The results gained on the development instrument were
vindicated-plane retroreflectors gave 20-80 % enhancements in signal, whilst often
increasing backgrounds appreciably if the two end faces were un-coated, and were
still remarkably difficult to align.
198

6.5.4 Results using the commercial spectrometer
Once the cell was developed, several areas of application presented
themselves. The first was based on the analytical requirements of the Westinghouse-
Hanfbrd Corporation; the second was based upon a fundamental study of N2O4, a
species never before studied in the gas phase, where near-IR excitation provided the
prospect for success.
6.5.4.1 Westinghouse experiments
The studies carried out for Westinghouse were remarkably simple. Their
concern is to prevent the storage facilities used for high-level nuclear waste from the
Manhattan nuclear weapons project from exploding. This may seem unduly dramatic,
but the gas pressure build-up generated by the various chemical, radiochemical and
nuclear reactions inside the containers is serious and needs careful monitoring. At
present this is a hazardous, time-consuming, and extremely expensive. Given the well-
proven ability of fibre-optic Raman probes-'^, it may prove possible in the long run to
carry out in-sitii on-line gas monitoring by Raman methods.
As a preliminary demonstration of the viability, two gases of interest to
Westinghouse were recorded at highest possible S:N to indicate the likely trace
detection capabilities with current macro cell designs. These gases were H2 and D2
Although somewhat uninspiring, the study of these species and their isotopomers has
been the subject of feverish recent activity by several Japanese researchers^^.
The data for H? and D2 is given below in table 6.3, along with the spectra
themselves in figures 6.26 and 6.27. The spectra were recorded at 4 cm'^ resolution,
with 1,000 accumulations, using 1 W excitation.
The most obvious thing to note is the very large spacing between the
rotational lines. This is because the molecules are light and the moment of inertia is
small. The study of pure rotation on the commercial instmment was limited to these
species, as the filters are installed in non-tuneable mounts. In figure 6.27, the D2
vibrational line is quite clear at 2989.0 cm"^. The H? vibrational band lies at 4123
cm this corresponds to 4275 cm"^ absolute, well below the Ing <^gGao 47AS long-
wavelength cut-off, determined by the bandgap threshold of the alloy^O.
199

0.7
0.6
0.5
0.4
0.3
0.2
0 , 1
0
3100 2800 2500 2200 1900 1600 1300 1000 700 400 100
Wavemunber sliift (cm-1)
Figure 6.26 Rotational spectrum of o.
0.43
0.4
0 3 5
0.3
025
0,2
0 15
0,1
&05
0
3100 2800 2500 2200 1900 1600 1300 1000 700 400 100
Waveiuuiiber shift (cm-1)
Figure 6,27 Rotational spectrum of
Interestingly, the derived values for the rotational constants and bond lengths
of both species are in error with the accepted values^^ by 3-4 %. Contrast this with
the accuracy (< 1 %) using No and Oo The magnitude of the error is almost certainly
due to an insufficient number of lines in the fit giving an erroneous B-value.
200

Transition: Hydrogen Deuterium
( J j l n n e r ^ J t ,nwpr) ( i H , ) (ZR?)
2-0 3 ^ ^ . ^ cm-^ ISI .O cm-^
3-1 cm-1 2^)9.0 cm"^
4-2 SiS.Q cm-1 4-16.0 cm'l
5-3 cm"^ S3( ,0 cm"^
6-4 — cm"^ 644.0
BRnf (cm-1)
RRnnd (pm)
Table 6.3 Rotational parameters of Ho and Do.
The S:N performance is encouraging. Although only about 45:1 after 1000
scans, this means that without further improvement the study of species around
1/10^^ atmospheric pressure should be viable.
It should be noted that the background present resulted from a previous
abortive attempt to study HOCl vapour, not due to alignment, and could not be
removed. In addition the seal on the windows eroded slightly, hence the vibrational 1 1
lines of air at 2331 cm"' (N2) and 1556 cm" (O?) can be seen. Since air was
obviously present in the cell, the partial pressure of H2 or D? was necessarily sub-
atmospheric, and therefore an additional gain in efficiency would be made by re-
sealing the windows.
However, an estimate of the degree of leakage can be attempted. The relative
band areas o f D ? and N? vibrational bands is about 2.8. Since the scattering cross-
section of D2 is reported^^ to be 2.5 times greater than that of N?, this implies that
the cell was only around half-full o fD? . This simple approach ignores the fact that the
leakage would be dynamic (the ratio would decrease with time) and relies on
the cross-section data being reliable in the near-IR.
Given that the laser power could easily be increased 3-fold, the detector
cooled to decrease noise two-fold, and the retroreflector aligned to yield about 50 %
higher signal, it should be possible to push S:N to 30-40:1 even at 1/10^^ atmospheric
pressure. After optimising the scan-speed by reducing vibration, and fitting gold
reflective optics rather than aluminium, a further two or threefold gain in signal could
be attained - plus the ability to scan right up to 10,000 accumulations, in extreme
cases.
The viability of analysing low partial pressures in gas mixtures seems proven.
One last point of interest to Westinghouse - CH4 is also of great importance to the
201
nuclear industry, as a trace impurity in the process stream of tritium (^H2) in fusion
reactors^ Since it is a three-times better vibrational Raman scatterer than any of the
hydrogen isotopomers^^, the sensitivity of the optimised experiment to methane (and
its isotopomers) should be very high indeed, and the study comparatively easy.
6.5.4.2 Dinitrogen tetroxide in the gas phase
The equilibrium N 2 O 4 0 2 N O 2 continues to present theoreticians and
experimental spectroscopists alike with many challenges, in terms of the electronic
structure and geometry of the ground and excited states. The driving force behind
much of the research into nitrogen oxides is concern over the role played in severe
atmospheric pollution caused by automobile exhaust emission'^2
Monomeric nitrogen dioxide (NO2) is a stable free radical,
possessing one unpaired electron, and exhibits a strong tendency to dimerize^^. The
dimeric species dinitrogen tetroxide (N2O4') has a rather long (178 pm) N-N bond^^,
with both NO2 groups showing geometry very little changed from those found in free
N02'^^. The evidence of calculation supports the experimental view that the two
NO2 groups are held together by weak Tt-bonding, explaining the planarity of the
species^^'^^ although the role of the a-bonding is still incompletely determined^^.
Interest exists in the nature of the bonding in the dimer for other reasons; the
partial rotation about this bond (the torsional vibration) has been the object of quite
intense study^^. Unfortunately, it is neither IR nor Raman active, being of Aq
character in the D2h point group, and therefore its frequency must be inferred from
combination band frequencies.
Gas-phase linear Raman spectroscopy of the dimer has previously proved
impossible. Whilst the liquid phase at 20°C is approximately 99.9% N2O4, the gas
phase^^ is almost 16% NO? - only at around 120 °C would the equilibrium be
thrown completely to the monomer (100% NO2). Since gaseous N2O4 can never be
free entirely of NO2 at atmospheric pressure, the strong resonantly-enhanced Raman
scattering and structured fluorescence emission from the minority NO2 gas-phase
species have previously made observation of the much weaker unenhanced
spontaneous scattering from the dimer impossible, with any wavelength chosen in the
near-UV or visible.
The dense and strongly-overlapping rovibrational bands of NO2 have been
identified as belonging to no less than three low-lying electronic excited states of the
same spin multiplicity, all transitions therefore being electric-dipole allowed; the rich
structure of the near-IR absorption spectrum of NO2 should be contrasted against the
202

broad and featureless visible absorption spectrum of N2O4, which has its first
resonance in the near-UV at around 340 nm (3.6 eV)^^.
The fact that NO2 is absorbing around 1064.1 nm is confirmed beyond doubt
by a simple experiment. The power incident on the front face and exiting the back
face of the 150 mm cell was measured. With 2.75 W incident on the front of an empty
cell, 90-95 % was transmitted; when measured after filling the cell to atmospheric
pressure, this value dropped to around 35-40 %. It should be remembered that
attenuation of the excitation beam and reabsorption of the Raman scattering both act
to reduce the scattered signal level.
With a suitable method employing off-resonance excitation, it should be
possible to directly probe the dimeric species. Near-IR excitation at around 1.064 (.im
provides such an opportunity - with the first gas-phase spectrum* of N2O4 being
given in figure 6.28.
The strongest band in the spectrum occurs at 254 c m " \ with a group of sharp
but weak lines at 1304, 1322, and 1380 c m ' ' . Also evident is a band at 1877 c m " \ as
well as a broad band at 806 cm" \ Two rather weak bands near 407 and 355 cm"* are
probably due to the cell; the signal-to-noise (S:N) ratio of the present data does not
justify a closer examination.
Referring to previous Raman data^^-SS N2O4, it seems quite obvious
that this spectrum contains the first gas-phase data on the dimeric species.
a
0.6
0.5 -
0.4
0.3
0^ -
0.]
0 4-
2100
: V
'•vl J . ,1
rmo 13M <M0
Wavemuiiber shift (cm-1)
500 100
Figure 6.28 FT-Raman spectrum of NO2/N2O4 in the gas phase.
This work has recently been accepted for publication in Chemical Physics Letters.
203

The cell background is due to the presence of impurities from a previous
experiment; the spectrum of air, taken over 100 accumulations, is shown as proof in
figure 6.29.
0.6
0.5
0 4 -
0.3
0.2
0,1
%
0
2100 rmo 13M swo
Waveiuunber shift (cm-1)
500 100
Figure 6.29 FT-Raman spectrum of air showing cell background (0% at 1556 cm'^).
The bands correlate very well with the following previously-made
observations:
• 1380 cnr^ (in-phase N - 0 symmetric stretch)
• 806 cm' l (in-phase O-N-0 bend)
• 254 cm"* (N-N stretch)
These bands are the three totally-symmetric vibrations (symmetry species Ag),
which are usually the strongest features in a Raman spectrum. The intensity pattern
(with the 254 cm"* band the strongest) shows the trend anticipated from the previous
studies.
The N-N stretch at 254 cm"* is shifted downwards by a significant amount
from the reported liquid^^ and solid^^ values, by 10 cm"* and 27 cm"* respectively.
The shift in N-N stretch band position possibly signifies a reduction in the force
constant for the N-N bond in the gas phase, in anticipation o f dissociation into the
monomer. It should be remembered that band position (and shape) is usually
perturbed by the physical phase of the sample - see section 6.5.1.3 in relation to C b .
2 0 4

It is almost certain that dissociation is occurring during this experiment, as the
band at 1322 cm"* is probably due to the symmetric stretch o f the monomer NO2
The correlation with high-resolution dispersed fluorescence measurements^'^ of the
vibrational parameters is very good, and the similarity to the values derived from
matrix-isolation resonance Raman studies using inert gas matrices make this
assignment compelling. It should be noted that low-pressure gas-phase^^'^^ and very
dilute matrix-isolation^^ studies using resonantly-enhancing excitation wavelengths
have been the only way to obtain gas-phase linear Raman data on NO2 in the past.
The minority NO? monomer probably causes the absorption, via an overtone
transition; the heated NOo then equilibrates with the rest of the sample, raising the
overall temperature in the cell - causing Association of the dimer to ensure
thermodynamic stability for the system at the new higher temperature.
Since it is difficult to accurately judge the concentration of the species under
the conditions in the cell with the current apparatus, it is impossible to say what
degree of resonance Raman enhancement to the NO? signal, if any, is being observed.
Certainly at this S:N level, no characteristic overtone progressions are apparent.
Despite the excitation wavenumber being close in value to the predicted energy
difference to the first allowed electronic excited state, the most probable direct
transition to this state lies at much higher wavenumber^^. This may explain the
apparent lack of strong enhancement. * 1
The band at 1877 cm" is undoubtedly due to NO, by correlation with
previous measurements on the species27,58 y^is raises the question how did such a
reactive species come to be present in the cell so prominently. The possibilities
include:
• through gas-phase chemical reaction (with water vapour)
• through reactions occurring on the gold surface (possibly catalysed by or including
impurities)
• direct photochemical activation of the N O ? species.
Given the high absorption noted for the laser radiation, it would be convenient
to ascribe the presence of NO to direct photochemical activation, but without
additional study it is impossible to comment on this further; the simplest of the
photochemical pathways sees an electronically-excited NO2 colliding with a ground-
state molecule, producing 2 N 0 and O2.
The lack of evidence for O2 should not be used to eliminate this possibility, as
the oxygen may react further, or may be in low concentration. This would imply the
205

NO scattering to be surface- or resonance-enhanced. The reason is clear; NO and 0%
would be in similar concentration, and NO is less than 40 % as efficient a scatterer as
O2, extrapolating visible^^ data to the near-IR; hence some process whereby the NO
species scattering dominates that from On would need to be invoked.
Previous work involving very high resolution mid-IR a b s o r p t i o n ^ ^ studies on
NO2 has shown that NO will be present in the cell as a reaction product with
atmospheric water, and that its concentration is very low. This would imply that the
observed NO scattering is indeed strongly enhanced by some mechanism, or that the
concentration in the cell is abnormally high, as a result of either photochemical
dissociation or chemical reaction.
It is difficult to rule out the possibility that trace oxide species may be seeing a
surface-enhanced Raman effect by bonding to the gold cell wall; certainly, this effect
is known, and it was suggested earlier in this chapter that CI2 attacked the cell or
contaminants corrosively. The possibility that trace species and contaminants were
introduced into the cell on filling cannot be discounted, as no efforts were made to
purify or check composition of the fill - the lack of vacuum line fittings was at fault.
The band at 1304 cm ^ raises slightly harder problems in its assignment. Fermi
enhancement of an overtone band in the dimer would in principle produce a
reasonable explanation. A weak interaction would produce the relatively small
enhancement seen here; suitable pairs of bands need to be identified in further studies.
In fact, the solid and liquid phase dimer spectra do show Fermi efFects^^ since
the overtone of the 677 cm"' IR-active band is enhanced by resonance with the 1382
cm ^ band to give a peak near 1325 cm 'k No peak at this position is evident in the
gas-phase spectrum of N2O4 presented here, as it is possibly covered by the wings of
the strong band at 1322 cm"'.
Less plausible assignments are worth exploring briefly. The band at 1304 cm"^
is possibly the first "hot-band" (2<-\) transition of the NO? symmetric stretch, the
band position being in good agreement with previous data. This would imply a
Boltzmann temperature around 725 °C to achieve a significant population of the first
vibrational excited state. This very high effective temperature could be due to the high
absorption noted at the excitation wavelength, but is rather tenuous as an explanation
without further investigation.
Isotopic shifts can be discounted straight away, as the relative abundance of
the isotopes for oxygen and nitrogen are quite against an appreciable population of
isotopomers. It is also unlikely that the band represents a fundamental vibrational
transition in an excited electronic state; this would raise questions as to how this state
became appreciably populated, and also why the scattered signal was so strong.
206

Following the discussion of the 1877 cm"^ feature, the band may also be due
to resonance- or surface-enhanced trace species, or an impurity from the fill.
Another possibility which should be addressed is the possibility of overlap
with spectral features from HNO3. The presence of NO may be ascribed to gas-phase
chemical reactions, which also form HNO3; Ae effect of the Raman spectrum of this
species on the current data is unknown at present, but seems unlikely from previous
data^^.
6.6 References
1. P.J. Hendra and C.J. Vear, Spectrochim. Acta. 28/L 1949 (1972)
2. E.M. Nour, L.-H. Chen, and J. Laane, J. Phys. Chem. 87. 1113 (1983)
3. W.F. Murphy, W. Holzer, and H.J. Bernstein, Appl. Spectrosc. 23(3), 211
(1969)
4. J.J. Freeman, J. Heaviside, and P.J. Hendra, Appl. Spectrosc. 35(2), 196
(1981)
5. S. Broderson and J. Bendtsen, J. Raman Spectrosc. i , 97 (1973)
6. M. D'Orazio and R. Hirschberger, Opt. Eng. 22(3), 308 (1983)
7. J.E. Pemberton, R.L. Sobocinski, M.A.Bryant, and D.A. Carter, Spectroscopy
5(2)
8. B.Schrader, Fresenius J. Anal. Chem. 337, 824 (1990)
9. D.E. Jennings, R. Hubbard, and J.W. Brault, Appl. Opt. 24(21), 3438 (1985)
10. G. Guelachvili, Appl. Opt. 16(8), 2097 (1977)
11. A. Weber, D.E. Jennings, and J.W, Brault, Proceedings of 4^^ ICORS
Conference (Tokyo, 1984), page 58
12. D.E. Jennings, A. Weber, and J.W. Brault, Appl. Opt. 25(2), 284 (1986)
13. D.E. Jennings, A. Weber, and J.W. Brault, J. Mol. Spectrosc. 126, 19 (1987)
14. T. Hirschfeld and E.R. Schildkraut, in "Laser Raman Gas Diagnostics" (Eds.
Lapp and Penney), page 379 (Plenum, New York, 1974)
15. W.J. Jones, Contemp. Phys. 13(5), 419 (1972)
16. R.J. Butcher, D.V. Willetts, and W.J. Jones, Proc. Roy. Soc. Lon. 324A. 231
(1971)
17. J.J. Barrett and S.A. Myers. J. Opt. Soc. Am. M(9). 1246 (1961)
18. C. Engert, T. Michelis, and W. Kiefer, Appl. Spectrosc. ^ ( 8 ) , 1333 (1991)
19. A. Weber, S.P.S. Porto, L.E. Cheeseman, and J.J. Barrett, J. Opt. Soc. Am.
57(1), 19 (1967)
20. J.J. Barrett and N.I. Adams IH, J. Opt. Soc. Am. 58(3), 311 (1968)
207
21. A. Weber and J. Schlupf) J. Opt. Soc. Am. ^ ( 3 ) , 428 (1972)
22. T.G. Matthews. Appl. Opt. 21(4), 577 (1982)
23. W.R. Trutna and R.L. Byer, Appl. Opt. 19(2), 301 (1980)
24. R.A. Hill, AJ. Mulac, and C.E. Hackett, Appl. Opt. 16(7), 2004 (1977)
25. J. Sawatzki and A, Simon, Proceedings of 12^^ ICORS Conference (South
Carolina, 1990), poster reprint
26. H. Stammreich and R. Forneris, Spectrochim. Acta. 17, 775 (1961)
27. H.W. Schrotter, in NATO ASI Series C93 "Non-Linear Raman Spectroscopy
and its Chemical Applications" (Eds. Kiefbr and Long), page 19 (Reidel,
Dordrecht, 1982)
28. C.J. Petty, G.M. Warnes, P.J. Hendra, and M. Judkins, Spectrochim. Acta.
47Ar9/101 1179(1991)
29. C.J. Petty, Ph.D Thesis, University of Southampton (1991)
30. B P. StoichefiF, Can. J. Phys. 36, 218 (1958)
31. S. Montero, C. Domingo, F. Wetzel, H. Finsterholzl, and H.W. Schrotter, J.
Raman Spectrosc. 15(8) 380 (1984)
32. E. Fermi, Z. Physik 21, 250 (1931)
33. J.M. Hollas, "Modern Spectroscopy" 2"d Ed. Chapter 5 (Wiley, 1992)
34. G.W. Chantry, in "The Raman Effect" Vol. 1 (Ed. A. Anderson) Chapter 2
(Marcel Dekker, New York, 1971)
35. P.W. Atkins, "Molecular Quantum Mechanics" 2nd Chapter 11 (Oxford
University Press, 1983)
36. E. Hecht, "Optics" 2"d Ed. Chapter 8 (Addison-Wesley, 1987)
37. N.J. Bridge and A.D. Buckingham, Proc. Roy. Soc. Lon. 295A, 334 (1966)
38. C D. Newman, G.G. Bret, and R.L. McCreery, Appl. Spectrosc. 46(2), 262
(1992)
39. T. Uda, K. Okuno, and Y. Naruse, Radiochim. Acta. 209 (1992)
40. V.S. Ban, G.H. Olsen, and A.M. Joshi, Spectroscopy, 6(3)
41. T. Uda, K. Okuno, S. O'Hira, and Y. Naruse, J. Nucl. Sci. Tech. 28(7), 618
(1991)
42. See, for instance, reference 1 in V.M. Donnelly, D.G. Keil, and F, Kaufman, J.
Chem. Phys. 71, (1979) 659.
43. G.D. Gillispie, A.U. Khan, A C. Wahl, R.P. Hosteny, and M. Krauss, J.
Chem. Phys. (1978) 3425.
44. R. Lui and X. Zhou, J. Phys. Chem. 97, (1993) 4413.
45. C.W, Bauschlicher Jr., A. Komornicki, and B. Roos, J. Am. Chem. Soc. 105.
(1983) 745.
208
46. R.D. Harcourt, J. Chem. Soc, Farad. Trans. 87, (1991) 1089.
47. C.H. Bibart and G.E. Ewing, J. Chem. Phys. (1974) 1284.
48. P. Gray and A.D. YoHe, Chem. Rev. 55, (1955) 1069.
49. T.C. Hall Jr. and F.E. Blacet, J. Chem. Phys. 20, (1952) 1745.
50. G.M. Begun and W.H. Fletcher, J. Mol. Spectrosc. 4, (1960) 388.
51. D.E. Tevault and L. Andrews, Spectrochim. Acta 3OA. (1974) 969.
52. T. Kato and H. Kato, Mol. Phys. (1989) 1183.
53. A. Givan and A. Loewenschuss, J. Chem. Phys. 93, (1990) 7592.
54. A. Delon and R. Jost, J. Chem. Phys. 95, (1991) 5686.
55. M.J. Marsden and G.R. Bird, J. Chem. Phys. 59, (1973) 2766.
56. H.D. Bist, J.C.D. Brand, and R. Vasudev, J. Mol. Spectrosc. (1977) 399.
57. F. Bolduan and H.J. JodI, J. Mol. Spectrosc. (1982) 404.
58. F. Melen and M. Herman, J. Chem. Phys. Ref. Data 21(4), 831 (1992)
59. A. Perrin, J-Y. Mandin, C. Camy-Peyret, J-M.Flaud, and J-P. Chevillard, J.
Mol. Spectrosc. 103. (1994) 417
209

Chapter 7:
Conclusions
7.1 Introduction
Since 1987, the research group of Professor Patrick Hendra based in the
Department of Chemistry at the University of Southampton has vigorously developed
many aspects of the FT-Raman technique. Early in the program, the emphasis was
biased towards instrumental development. However, the developments were inspired
by the needs of chemists - the philosophy being to produce a routine analytical
instrument to complement the more-prevalent mid-IR technique.
As the development progressed in conjunction with the Applied Research
Group of Perkin Elmer Ltd, more emphasis was placed on exploiting the rapidly-
improving performance. A wide range of previously-intractable chemical systems
became open to study, due to the excellent suppression of fluorescence with
excitation beyond 1 ^m.
A wide range of collaborative projects were also undertaken with industrial
partners. Although the benefits of Raman spectroscopy were well-known to a small
community (essentially academic, along with some government and industrial
research laboratories), major applicability of the technique in industry had never been
shown - again, nearly always due to fluorescence.
The recent emphasis of the research in Professor Hendra's group has been
directed towards novel chemical systems. As a part of this group between 1990-1993,
I instigated and undertook several extended studies based on the evaluation of FT-
Raman spectroscopy as a routine analysis method for a range of chemical systems.
This thesis comprises the results of the projects. In order of presentation,
these chemical applications of FT-Raman spectroscopy have been critically appraised,
and the conclusions presented below.
7.2 l,3-dithiole-2-thione and related compounds.
A series of highly-coloured thione-ring-based synthetic intermediates for the
important tetrathiafulvalene (TTF) system have been investigated, and reported in
chapter 2.
This study was undertaken to support the research of Dr Jeremy Kilburn.
Mid-IR sampling techniques were not suitable for the thiones, and many were too
210
deeply-coloured or impure to successfully employ conventional Raman spectroscopy.
However, FT-Raman techniques have been successfully applied, yielding very good
spectra in acceptable timescales.
Literature assignments of l,3-dithioIe-2-thione were found to be dubious. In
an attempt to clarify the literature, Raman depolarisation studies and transmission IR
spectroscopy have been undertaken on this simplest thione. These studies have
resulted in a far more plausible assignment of those fundamentals of the thione ring
system considered important in an analytical context.
The major features of the thiones have been deduced from group frequency
argument, and the changes on conversion to oxones or coupling to form TTFs
documented, with a view to laboratory analysis.
The original study did not envisage expansion. However, as more compounds
became available, the Raman data obtained from these samples has been used to
verify the claims made in the original study. With few exceptions, the claims have
been vindicated. In areas of conflict, the original findings have been revised where
necessary.
FT-Raman spectroscopy has been shown to be a good technique for
identifying thiones, and to differentiate between them, on the basis of simple spectra-
structure correlation. The method was not compromised by the fluorescence that was
present quite strongly in some of the spectra. There are enough resolvable features in
each spectrum to make the identification and differentiation possible even without all
the spectrum being usable.
As a routine bench technique for the analytical spectroscopy of thione ring
systems, F i -Raman has shown great promise, and furthermore provided data good
enough to begin unravelling the underlying problems of the vibrational structure.
7.3 Allenvlketenimine-TCNE derivatives
FT-Raman spectroscopy has been employed to probe the structure of a
completely novel series of organic compounds, synthesised at Southampton by Dr
Richard Whitby. As reported in chapter 3, the vibrational study of allenylketenimine-
TCNE adducts with mid-IR methods was hampered by difficulties in sampling, and in
the apparent variability of absorption by the -CN moiety.
In contrast, FT-Raman spectroscopy gave very good quality results. An
assignment of the major functionalities of the structure has been made. It has been
shown that allenylketenimine-TCNE adducts may be differentiated unambiguously by
means of FT-Raman spectroscopy. In addition, structural data derived from XRD and
211
NMR studies has been confirmed where possible. The nitrile (CN-) stretch has been
shown to be well-resolved and of reliable intensity.
From an analytical standpoint, there are features common to all spectra which
allow assignment of the basic TCNE-allenylketenimine structural unit. Sufficient
differences exist to be able to differentiate between individual adducts; and the exact
shape of the nitrile band allows unambiguous determination of the isomeric form,
once the adduct has been identified.
On the basis of this study, it is clear that FT-Raman is the method of choice
for the vibrational analysis of allenylketenimine-TCNE adducts.
7.4 Hydration of the v-alumina surface
The opportunity arose to take part in a Swedish exchange to the Department
of Chemistry at Lulea University, to study with Professor Willis Forsling. One of the
projects undertaken was a combined FT-lK/Raman study of the y-alumina surface
under various hydration conditions. The results are presented in chapter 4.
Changes to the oxide surface during hydration have been studied, as a
function of pH, temperature, and hydrolysis period. The study conclusively and
unambiguously shows that the bayerite polymorph of aluminium hydroxide is formed
at the surface, after several weeks at room temperature, much faster at elevated
temperatures, with larger conversions at alkaline pH.
The study has also indicated that phenylphosphate anion interacts with the
surface, forming a reasonably strong bond. In addition, phenylphosphate adsorption
was shown to be a good method to protect the y-alumina surface from hydrothermal
conversion to bayerite, providing the phenylphosphate was administered at the very
start of any process likely to cause this reaction and providing the pH of the system
did not drift too alkaline. Even at elevated temperatures, providing the pH was kept
about neutral, the use of phenylphosphate as a coating agent was shown to be quite
efficacious.
7.5 Cement minerals and some simple calcium-bearing inorganic compounds
Also as part of the Swedish exchange visit, a study was attempted of the
structure of several calcium silicate-based cement mineral species. The results
presented in chapter 5 clearly show that near-IR excitation at 1064 nm in many cases
does not result in Raman scattering but a structured luminescence. It is proposed that
this luminescence may involve transition metal impurities,
212
The study deviated from its original goal, in order to provide an introduction
to this unexplored area. Synthetic studies have been undertaken, and results obtained
from two independent sources of cement minerals. These results indicate a possible
dependency of linewidth on impurity content, which is partially endorsed by low-
temperature experiments on supplied material.
It has been shown that calcium hydroxide exhibits strong resemblance to
several of the supplied calcium silicates' luminescence. After undertaking near-IR
studies on this species and on several of the supplied minerals, it is proposed that the
luminescence in the silicates might require both calcium hydroxide (formed on the
surface of cement mineral grains) and manganese ions (present as impurity).
In addition, the study demonstrates the use of modern visible excitatioti
Raman techniques for the study of cement minerals. A single-stage spectrograph with
micro-sampling, Ar green excitation and CCD detection seems preferable to the
near-IR macro-FT-Raman method for the calcium silicates, on the basis of results
presented here. This is at variance with some of the older work in the literature.
7.6 Near-IR-excited Raman scattering in the gas phase.
The viability of gas-phase ibT-Raman spectroscopy with near-IR excitation has
been demonstrated, for both vibrational and rotational spectroscopy, the details given
in chapter 6.
A method for obtaining Kaman spectra from gas-phase species using
commercial instiumentation and a simple sampling accessory have been designed,
developed, tested and implemented from first principles, necessitating critical
evaluation of spectrometer performance and requiring several gas-cell redesigns.
The use of a^multiple reflection cell has been shown to be vital, and the
experimental technique tor this method developed. The prospects for low-pressure
studies or mixtures with low partial pressures have been discussed with reference to
the sensitivity of the methods.
The application of the method developed to the NO9/N9O4 system has led to
a previously-intractable problem being solved - the study presented is the first success
on the gas-phase dimer, and has provided quite fundamental data. The data also
possibly reflects the first instance of a gas-phase NO2 spectrum exhibiting minimal
resonance Raman enhancement - and also possibly reflects strongly-enhanced
scattering from the minority NO species.
2 1 ;
All of the projectSxwere successful to varying degree, delivering novel results
on a diverse range of systerhs. For chemical applications, FT-Raman spectroscopy has
been shown to be a powerful and versatile technique,
7.7 Further work
As discussed in chapter 2, a full vibrational analysis o f the thione ring
structure requires more data than is currently available, and a considerably improved
model.
Modern ab initio methods show promise and have merit; much of the
subjectivity and propagation of error may be eliminated when force constants are
calculated from first principles, and not derived from previous studies. However, the
methods commonly available are still too primitive and inaccurate to be of help in the
nuances of the assignment.
The best way forward lies in collecting IR absorption data ranging from the
near-IR (overtones) to the far-IR (low-frequency bands), along with Raman data over
the widest possible shift range (from as close to the Rayleigh line as possible), and
attempting to resolve as many combination and overtone modes as possible.
Combined with polarisation measurements and isotopic substitution studies, this data
should provide a normal co-ordinate analysis with enough parameters to at least
predict fundamentals accurately.
In the case of the y-alumina surface studies of chapter 4, the elucidation of the
phenylphosphate bond to the hydrated surface, especially its geometry and the
chemical nature of the bonding sites, would provide additional data to evaluate its
efficacy as a prevention for hydration.
1 he study was not conceived to provide a quantitative method for analysing
the distribution of species at the y-alumina surface, but in view of the evident
successes scored, further studies are on-going with a view to developing such a
method. One of the aims of this further work is to determine the amount of surface
coverage afforded by mM phenylphosphate concentration.
In the light of this study, the theoretical models of the hydrated surface may
require revision, as they operate under the assumption that the proton
adsorption/desorption reactions on which they are based occur at a "boundary" which
is simply the oxide surface with hydroxylation and hydration mechanisms.
The study of the calcium silicates in chapter 5 has already provoked much
discussion, with several researchers now active in the area. Calcium silicates are
complex solid-state species, far more so than the simple binary salts (oxides and
214
hydroxides) on which some of the arguments by analogy have been based in this
study. However, few researchers in the near-IR FT-Raman community seem to have
appreciated the complex nature of the fluorescence backgrounds apparent in simple
inorganic species, let alone the more complex "real" mineral samples. There is plainly
much work to do in determining what factor determine which inorganic species are
suitable for analysis with near-IR excitation.
In addition, the results suggest that FT-Raman is best used in concert, and not
in competition, with modern visible Raman methods.
In relation to the gas-phase work of chapter 6, several areas of instrumental
importance have been identified. These correspond to the need for a well-maintained,
high-specification, near-IR-optimised spectrometer, with special care to stabilise
interferometer and laser; hence instrumental development, including detector
performance improvements, should be continued.
In terms of the cell, a focusing retro reflect or would be of great use, providing
its alignment could be made as reproducible as that of the cell. In the long term, the
cell and collection fbreoptics should probably be modelled theoretically, to optimised
collection and transfer efficiency. With these developments, perhaps the very weak
rovibrational spectra would be open to study.
The study of the oxides of nitrogen should be expanded and consolidated. The
non-resonance of NOo, and the dependency of the N-N bond stretching frequency as
a function of progress towards dissociation should be evaluated.
The most pressing needs are to correlate the absorption of the laser with path
length, sample temperature, and species concentration - and to fully characterise the
species flowing into the cell on fill, then present after irradiation. Of great help in this
respect would be high-resolution near-IR absorption data in the 12,000-4,000
cm ^ spectral range, along with accurate instrument response correction and
calibration functions for the Raman experiment.
These further studies require the construction of a cell which may be heated
and cooled between 20-120 °C. The cell must also be able to be purged with dry,
inert gas, as well as evacuated down to 1 -2 Torr for low-pressure studies, and to hold
vacuum for several hours during a long high-resolution experiment. Only in this way
will it be possible to rigorously exclude O? and water vapour.
The reactivity of nitrogen oxides towards gold, the likely products, and their
surface-enhanced Raman scattering efficiencies should be evaluated - as should the
Raman spectra of NO and HNO-^ in the gas phase under these conditions.
A further intriguing experiment awaits: a high-quality set of holographic notch
filters (HNFs) would allow coverage of low-frequency rotational structure and anti-
2 1 5
Stokes lines, facilitating the determination of effective temperature of the various
species involved by measurement of intensity ratios and envelope profiles. Since
N2O4 has no permanent electric dipole moment, the Raman spectrum is one of the
few methods available to study the rotational spectrum. In a similar vein, the use of
tuneable near-IR excitation with alkali metal vapour filters might provide useful low-
frequency capability
7.8 Other studies and published work
The projects in chapters 2 and 3 yielded published data, in collaboration with
Drs Kilburn and Whitby, respectively. Chapter 4 has yielded one paper published,
with a description of further studies in preparation. Chapter 5 has yielded, similarly,
one paper published, with one further to be submitted. Chapter 6 yielded a study of
the feasibility of near-IR FT-Raman gas-phase spectroscopy with initial results, whilst
the nitrogen oxide work has recently been accepted for publication in Chemical
Physics Letters.
Although not detailed in this thesis, a highly-successful project on the
vibrational assignment, Fermi resonance, low-temperature spectroscopy, pre-
resonance scattering, near-IR absorption, and previous Raman studies of a
polydiacetylene conducting polymer was undertaken in collaboration with Dr Bill
Maddams, who receives grateful and heartfelt thanks. This work is currently being
collated and submitted.
7.9 References
1. M.J. Pelletier, Appl. Spectrosc. ^ ( I ) , 69 (1993)
216

Appendix 1;
Published work
Only work actually in print in refereed journals is reproduced here - the paper
"Raman spectroscopy of NO2/N2O4 in the gas phase using near-infrared excitation"
by Chris Dyer and Patrick J. Hendra, accepted to Chemical Physics Letters December
1994, is omitted.
C.D. Dyer, J.D. Kilbum, W.F. Maddams, and P. A. Walker,
Spectrochim. Acta, 47A, 1225-1234 (1991)
"Fof/r/gr 0 / or^w7/c q/"
aUenylketenimine-tetracyanoethylene Diels-AIder reaction products", R.D. Dennehy,
C.D. Dyer, W.F. Maddams, and R.J. Whitby, Spectrochim. Acta, 5OA. 819-831
(1994)
"Surface hydration of aqueous y-AhO^ studied by Fourier transform Raman and
infrared spectroscopy - /. Initial results. Chris Dyer, Patrick J. Hendra, Willis
Forsling, and Maine Ranheimer, Spectrochim. Acta, ^ A , 691-705 (1993)
"The Raman spectroscopy of cement minerals under 1064 nm excitation", Chris
Dyer, Patrick J. Hendra, and Willis Forsling, Spectrochim. Acta, 49A, 715-722
(1993)
"Near-infrared Fourier transform Raman spectroscopy of gases", Chris D. Dyer and
Patrick J. Hendra, Analyst, jj_7, 1393-1399 (1992)
217
The following published papers were included in the bound thesis. These have not been digitised due to copyright restrictions, but the links are provided.
C.D. Dyer, J.D. Kilburn, W.F. Maddams, P.A. Walker (1991)
Fourier Transform Raman Spectroscopy of 1,3-Dithiole-2-Thione and Related Compounds
Spectrochimica Acta Part A: Vol. 47, Nos. 9–10, pp.1225–1234
http://dx.doi.org/10.1016/0584-8539(91)80209-2
R.D. Dennehy, C.D. Dyer, W.F. Maddams, R.J. Whitby (1994)
Fourier transform Raman spectroscopy of novel organic systems. The analysis of
allenylketenimine—tetracyanoethylene Diels—Alder reaction products
Spectrochimica Acta Part A: Vol. 50, No. 4, pp.819-831
http://dx.doi.org/10.1016/0584-8539(94)80018-9
Chris Dyer, Patrick J. Hendra, Willis Forsling, Maine Ranheimer (1994)
Surface hydration of aqueous γ-Al2O3 studied by Fourier transform Raman and infrared spectroscopy—I. Initial results
Spectrochimica Acta Part A: Vol. 49, Nos. 5-6, pp.691-705

http://dx.doi.org/10.1016/0584-8539(93)80092-O
Chris D. Dyer, Patrick J. Hendra, Willis Forsling (1993)
The Raman spectroscopy of cement minerals under 1064 nm excitation
Spectrochimica Acta Part A: Vol. 49, Nos. 5-6, pp.715-722
http://dx.doi.org/10.1016/0584-8539(93)80094-Q
Chris D. Dyer, Patrick J. Hendra
Near-infrared Fourier transform Raman spectroscopy of gases
The Analyst: Vol. 117, No. 9, pp.1393
https://doi.org/10.1039/an9921701393