chemical composition of arctic snow: concentration levels ... caritat et al. ste.2005... ·...
TRANSCRIPT

www.elsevier.com/locate/scitotenv
Science of the Total Environment 336 (2005) 183–199
Chemical composition of arctic snow: concentration levels and
regional distribution of major elements
Patrice de Caritata,*, Gwendy Hallb, Sigurdur Gıslasonc, William Belseyd,Marlene Braune, Natalia I. Goloubevaf, Hans Kristian Olseng,
Jon Ove Scheieh, Judy E. Vaiveb
aGeological Survey of Norway, Trondheim N-7491, NorwaybGeological Survey of Canada, 601 Booth St, Ottawa, ON, Canada K1A 0E8cScience Institute, University of Iceland, Dunhagi 3, Reykjavik IS-107, Iceland
dLeo Ussak Elementary School, GNWT Postal Bag 002, Rankin Inlet, Canada X0C 0G0 NTeBureau of Land Management, Northern District Office, 1150 University Ave, Fairbanks, AK 99709, USA
fMurmansk Marine Biological Institute, 17 Vladimirskaya, Murmansk, RussiagMinerals Office, P.O. Box 1015, Nuuk DK-3900, GreenlandhSysselmannen pa Svalbard, Longyearbyen N-9170, Svalbard
Received 29 January 2004; received in revised form 25 May 2004; accepted 30 May 2004
Abstract
At the end of the northern winter 1996/1997, 21 snow samples were collected from 17 arctic localities in Norway, Sweden,
Finland, Svalbard, Russia, Alaska, Canada, Greenland and Iceland. Major element concentrations of the filtered (0.45 Am)
melted snow indicate that most samples are consistent with a diluted seawater composition. Deviations from this behaviour
indicate additional SO42 � and Cl� relative to seawater, suggesting a minor contribution from (probably local) coal combustion
emissions (Alaska, Finland, Sweden, Svalbard). The samples with the highest Na and Cl� content (Canada, Russia) also have
higher Na/SO42� and Cl�/SO4
2 � ratios than seawater, suggesting a slight contamination from (probably local) deicing activities.
Local soil or rock dust inputs in the snow are indicated by ‘excess’ Ca contents (Alaska, Svalbard, Greenland, Sweden). No
overall relationship was found between pH (range: 4.6–6.1) and total or non-seasalt SO42� (NSS), suggesting that acidification
due to long-range transport of SO2 pollution is not operating on an arctic-wide scale. In a few samples (Alaska, Finland,
Sweden, Svalbard), a significant proportion (>50%) of SO42� is non-marine in origin. Sources for this non-marine SO4
2� need
not all be found in long-range atmospheric transport and more likely sources are local industry (Finland, Sweden), road traffic
(Alaska) or minor snow-scooting traffic (one Svalbard locality). A few samples from northern Europe show a relatively weak
trend of decreasing pH with increasing NO3�.
D 2004 Elsevier B.V. All rights reserved.
Keywords: Snow chemistry; Long-range transport; Acidification; Pollution; Contamination
0048-9697/$ - see front matter D 2004 Elsevier B.V. All rights reserved.
doi:10.1016/j.scitotenv.2004.05.031
* Corresponding author. Present address: CRC LEME, c/-
Geoscience Australia, GPO Box 378, Canberra, ACT 2601,
Australia.
E-mail address: [email protected] (P. de Caritat).
1. Introduction
Themajor element composition of snowhas been in-
vestigated for many years, and increasingly trace ele-

P. de Caritat et al. / Science of the Total Environment 336 (2005) 183–199184
ment and isotopic data are also being reported (e.g.,
Busenberg and Langway, 1979; Delmas, 1986; Gor-
zelska, 1989; Baisden et al., 1995; Suzuki et al., 1995;
Krachler and Kosmus, 1996; Caritat et al., 1998;
Douglas and Sturm, 2004). However, systematic, de-
tailed chemical composition of snow is poorly docu-
mented, even in the Northern Hemisphere, especially
with regards to its regional variability. Some studies in
the Northern Hemisphere have compared snow compo-
sition over areas of up to 200,000 km2 (e.g., Caritat et
al., 1998), but an arctic-wide perspective is still lacking.
Single-site studies of the composition of ice, the
product of the accumulation and compaction of snow
over many years, have been documented in detail from
various cores, such as in Greenland (Hammer et al.,
1985; Herron and Langway, 1985; Dansgaard and
Oeschger, 1989). The downcore chemical and isotopic
compositional changes observed in ice have been
related to climate change or anthropogenic pollution
(Delmas, 1994, and references therein). However, there
is little documentation or understanding of the changes
in snow (or ice) composition laterally over regional
scales, or of the dominant controls on its chemical
composition. Now that analytical instrumentation en-
abling analysis at ultratrace levels of chemical elements
has become available, regional surveys of snow chem-
istry can be carried out to answer such questions.
The present study was designed to address these
issues, in a preliminary way, by attempting to obtain
and analyse snow samples from as wide an area as
possible over the Arctic. This region, being the most
sparsely populated one in the Northern Hemisphere,
provides a unique opportunity to study precipitation
chemistry away from major human activity centres.
In 1997, the Geological Survey of Norway (NGU)
supported a pilot project, dubbed ‘ARCTIS’ (a per-
mutation of the acronym for Regional Composition of
Snow In The Arctic), to test the feasibility of low-cost,
pragmatic, arctic-wide, background (remote from
point-sources) snow sampling, and, together with the
Geological Survey of Canada (GSC), to assess the
related analytical challenges. Scientists from univer-
sities and Government, or schoolteachers, who either
lived in remote arctic areas or intended to conduct
field trips there, were contacted and invited to partic-
ipate in this arctic snow survey. Thus, all samples
were collected with the same equipment, according to
identical detailed field instructions, and analysed in a
single laboratory. Initially, more field parties were
contacted (e.g., Siberia), but for a number of reasons,
they were not able to participate in the end.
2. Objectives
The objectives of the ARCTIS project were:
(1) to establish the concentration levels of a wide range
of soluble chemical elements in arctic snow; and
(2) to document the spatial variability (geochemical
patterns) of these elements in arctic snow.
The results presented here are the first, to our
knowledge, of an arctic-wide, internally consistent,
and fully quality assurance (QA) monitored study of
snow composition over such a vast area. In total, 21
samples of snow fallen during the 1996/1997 winter
were obtained from 17 locations in Norway, Sweden,
Finland, Svalbard, Russia, Alaska, Canada, Greenland
and Iceland. All locations are from latitudes between
62 and 79jN. It is anticipated that these results will
complement other initiatives to document the extent
of arctic pollution (e.g., AMAP, 1998).
3. Potential sources of elements
Elements measured in arctic precipitation often
originate from a mixture of natural and anthropogenic
sources; both sources can contribute to the wet (sol-
uble) and dry (aerosols, dust) components of precip-
itation. For example, the major sources of dissolved
solids in Icelandic precipitation are seaspray, global
pollution, and transient and sometimes enormous
inputs from volcanic eruptions (Gıslason et al.,
1992, 1996; Frogner et al., 2001).
3.1. Natural sources
The arctic region is characterised by a vast expanse
of sea and sea ice, the Arctic Ocean (14 million km2).
Therefore, seaspray is expected to be an important
contributor in the region to the composition of the
atmosphere, and thus of precipitation. The influence
of seaspray on precipitation chemistry generally de-
creases with distance from the ocean and with altitude.

P. de Caritat et al. / Science of the Total Environment 336 (2005) 183–199 185
Volcanic activity (e.g., in Iceland) will be a sporadic,
but significant, contributor to snow composition, main-
ly via the deposition of particulate matter from volcanic
ash after eruptions. Quiescent volcanic emissions
(exhalations) are now recognised as an important
contributor to background atmospheric concentrations
of tracemetals (Matsumoto andHinkley, 2001).Natural
mechanical and chemical weathering of outcropping
rocks, and winnowing of soil dust from snow-free areas
are further natural sources of chemical elements to the
atmosphere, and thus to snow and ice (Hansson et al.,
1993; Hinkley, 1994). Migration of chemical elements
from soil into the overlying snowpack (mineralization)
is also a process that may be operating, particularly
where temperatures are quite variable and occasionally
high (Fedoseeva et al., 1986, 1990). Finally, biogenic
emissions from the Arctic Ocean and surrounding seas
can contribute not only S, but also trace elements such
as metals through biologically mediated methylation
(Buat-Menard, 1984). This may be significant in arctic
coastal areas near discontinuous ice cover or polynias.
3.2. Anthropogenic sources
Man-induced sources of elements are an important
consideration in the Arctic because the area, despite
being remote and sparsely populated, is nevertheless
developed and inhabited in places, especially at its
periphery (3.78 million inhabitants in the Arctic, as
defined by AMAP, 1998). Economic activities in the
Arctic include the manufacture of chemicals, con-
struction materials, electric power plants (powered
by atomic, hydro or thermal energy), fishing and
shipping, food processing, machine building, metal-
lurgy, mineral and fuel extraction, wood processing
and pulping and light industry (CIA, 1978). Of
particular interest here are the mining-related activities
because they have the potential to release into the
environment large quantities of particulate and dis-
solved elements, often in typical assemblages. The
most important commodities mined in the Arctic (e.g.,
CIA, 1978) are coal, copper, diamond, gold, iron, lead
and zinc, nickel, oil and gas, tin and others (tungsten,
mercury, platinum, cobalt, graphite, fluorite, manga-
nese, aluminium, apatite, mica, silver and asbestos).
Geogenic dust is likely to be important in these
regions of (often) sparse vegetation cover and harsh
climate, compared to more temperate regions. Human
activity may locally result in vegetation damage or
destruction, enhancing dust generation (e.g., Kola
Peninsula). Thus, even if small parts of a region are
not covered with snow, they may generate quite
important fluxes of mineral dust (together with its
chemical elements content) to the atmosphere.
Cities, with their associated industry, traffic and
electricity generating plants, can be significant centres
of emissions. The most populated cities in the survey
area include Murmansk, Archangelsk, Magadan, An-
chorage, Fairbanks, Reykjavik and several townships
in northern Norway, Sweden and Finland. Smaller
centres have an impact not so much due to their
population size, but to their industrial activities.
Of course, areas outside the Arctic can contribute
to the atmospheric and precipitation chemistry
recorded in the Arctic. Data from Barrie and Hoff
(1984) and Raatz (1991), for example, identify zones
of airflow into and out of the arctic region. According
to these authors, it appears that northwestern Europe
(UK, Scandinavia) and eastern Europe (via northern
central Russia), together with the northern west coast
of the USA and Alaska, are areas that can be on the
path of arctic-bound air masses (Pfirman et al., 1994).
The phenomenon of ‘arctic haze’ leads to the migra-
tion of polluted air masses from the industrialized
temperate zones into the Arctic, especially during late
winter (Shaw, 1995; AMAP, 1998).
Snow is an efficient scavenger of aerosols in the at-
mosphere, and thus even moderate falls deposit a sub-
stantial proportion of elements from the atmosphere
(regardless of their origin). Heavy snowfalls will there-
fore record a progressive drop of concentrations in
snow from start to end of a snow event. To gain some
appreciation of this dilution effect, average snow depth
at each site is reported. It should also be noted that
analysis of snow does not directly allow the differen-
tiation between the wet and dry contributions to preci-
pitation, and thus ‘bulk’ precipitation chemistry is
obtained.
4. Materials and methods
4.1. Sampling
Late in the northern winter of 1997 (March–May),
21 fresh snow samples (Table 1) were collected at 17

Table 1
Overview of sampling locations and samples details
Samplea Country Subset Latitude N
(j)Longitude E
(j)Snow depth
(cm)
Date collected Locality Remarks
C1 Canada C 62.83 268.02 44 April 15, 1997 Rankin Inlet Upwind from airstrip
C2 Canada C 62.83 268.02 71 April 15, 1997 Rankin Inlet Close proximity to C1
F21 Finland N 69.09 27.53 89 April 17, 1997 Inari
F22 (D) Finland N 69.09 27.53 88 April 17, 1997 Inari Duplicate of F21
G34 Greenland G 76.53 291.30 26 April 5, 1997 Pittufik
G35(D) Greenland G 76.53 291.30 40 April 5, 1997 Pittufik Duplicate of G34
I34 Iceland I 64.60 339.66 330 March 13, 1997 Langjokull
I35 Iceland I 64.58 342.67 340 March 20, 1997 Dyngjujokull 0–275 cm (above ash layer)
I36(D) Iceland I 64.58 342.67 340 March 20, 1997 Dyngjujokull Duplicate of I35
N39 Norway N 68.44 18.08 96 April 16, 1997 Bjørnefjell
R57 Russia R 69.34 54.52 53 May 3, 1997 Pechora Bay Snow on floating icepack
R58 Russia R 69.12 36.04 296 April 4, 1997 Jarnysknaya Inlet Onshore
R60 Russia R 73.03 80.38 27 April 21, 1997 Enisej Gulf Snow on floating icepack
S68 Sweden N 67.28 23.63 93 April 17, 1997 Pajala
U70 USA (Alaska) U 66.69 210.64 45 March 17, 1997 Bonanza Fork Dalton Hwy 127.2 miles
U72 USA (Alaska) U 69.42 212.70 32 March 19, 1997 Sagwon Dalton Hwy 354 miles
U73 USA (Alaska) U 67.24 210.17 51 March 20, 1997 Coldfoot Dalton Hwy 172.5 miles
Z62 Svalbard Z 78.18 16.83 78 April 11, 1997 Adventdalen
Z63 Svalbard Z 76.51 13.02 60 April 14, 1997 Hopen Island On small offshore island
Z64 Svalbard Z 78.93 11.81 75 May 20, 1997 Kongsfjorden
Z65 (D) Svalbard Z 78.93 11.81 71 May 20, 1997 Kongsfjorden Duplicate of Z64
QA samples from Meech Lake
M1 Canada 45.54 284.10 March 1997 Meech Lake 15–30 cm at ‘‘Loc 2’’
M2 Canada 45.54 284.10 March 1997 Meech Lake 0–60 cm at ‘‘Loc 1’’
M3 Canada 45.54 284.10 March 1997 Meech Lake 0–60 cm at ‘‘Loc 1’’
M4 Canada 45.54 284.10 March 1997 Meech Lake 0–70 cm at ‘‘Loc 1’’
M5 Canada 45.54 284.10 March 1997 Meech Lake 15–30 cm at ‘‘Loc 1’’
M6 Canada 45.54 284.10 March 1997 Meech Lake 0–60 cm at ‘‘Loc 1’’
M7 Canada 45.54 284.10 March 1997 Meech Lake 0–15 cm at ‘‘Loc 2’’
M8 Canada 45.54 284.10 March 1997 Meech Lake 0–15 cm at ‘‘Loc 1’’
M9 Canada 45.54 284.10 March 1997 Meech Lake 0–60 cm at ‘‘Loc 1’’
M10 Canada 45.54 284.10 March 1997 Meech Lake 0–60 cm at ‘‘Loc 1’’
a (D) indicates that sample is a field duplicate of previous sample (see text).
P. de Caritat et al. / Science of the Total Environment 336 (2005) 183–199186
onshore (or close to shore) localities around the
Arctic, north of latitude 62jN, as shown in Fig. 1.
Samples originate from Norway (sample identification
starts with ‘N’), Sweden (‘S’), Finland (‘F’) (these
three countries are later collectively grouped as the
Nordic region, ‘N’), Svalbard (Spitzbergen, ‘Z’),
Russia (‘R’), Alaska (USA, ‘U’), Canada (‘C’),
Greenland (‘G’) and Iceland (‘I’). The area covered
by this survey is ca. 22 million km2 (smallest rectan-
gle encompassing all sampling points).
In addition to these, 10 snow samples were col-
lected at two adjacent localities near Meech Lake
(M1–M10; 45.54jN, 284.10jE), close to Ottawa in
Quebec (Canada). This was done to test sampling
methods, determine small-scale horizontal and vertical
variations, test laboratory preparation methods and
optimize QA protocols. One other sample (I38) was
collected from a volcanic ash layer in the Dyngjujo-
kull Glacier of Iceland (64.58jN, 342.67jE). Samples
M1–10 and I38 are not included in the following
discussion, which focuses on background, remote
snow composition. Data for M1–10, however, are
given in Table 3 for QA purposes.
The arctic snow samples, taken to represent the
cumulative bulk (wet + dry) snowfall of the 1996/
1997 winter, were collected prior to the onset of the
spring thaw. All samples were collected using equip-
ment centrally provided by NGU, which consisted of

Fig. 1. Location of the arctic snow sampling sites.
P. de Caritat et al. / Science of the Total Environment 336 (2005) 183–199 187
polycarbonate (PC) coring tubes, pre-numbered poly-
ethylene (PE) bags and PE gloves, and according to a
clear set of instructions made available in both En-
glish and Russian (for Russia).
The clear PC coring tubes were 1 m long, with an
internal diameter of 74 mm and 3-mm-thick walls.
The cutting end was cut obliquely at an angle of ca.
60j and its walls were sharpened to facilitate pene-
tration of the snow cover. The other end had two
diametrically opposed holes to allow a PC rod to be
inserted to assist with rotating the corer while taking
samples. The corers were cleaned by immersion in a
10% UltrapurR MerckR nitric acid bath (48 h), then
rinsed with double distilled water, immersed in a
double distilled water bath (24 h), air-dried and sealed
off in PE sleeves at NGU before dispatching to the
various field parties.
The exact locations chosen for sampling were flat,
open (free of vegetation) and undisturbed (free of
tracks, etc.) spaces with a homogeneous snow cover,
as shown by several depths measurements. The sam-
pling sites were approached from the downwind side
to avoid contamination. Prior to collecting a new
snow sample, the corer was plunged three times into
the snowpack to remove any inherited contamination
from cleaning (NO3� from the nitric acid cleaning
step), transportation or previous sampling. We believe
this pre-conditioning is by far the most efficient
quality control procedure one can follow for snow
sampling. Each sample consists of 1 to 12 composited
subsamples (depending on snow thickness) taken
from an area of ca 20� 20 m (to a total snow volume
of 5–8 l). The snow cores were collected from the
side (wall) of a small trench dug through the snow-
pack. A clean PC plate was inserted horizontally into
the snow wall about 5 cm above the ground surface to
stop the penetration of the corer (to avoid contamina-
tion by ground vegetation and soil/rock) and help

P. de Caritat et al. / Science of the Total Environment 336 (2005) 183–199188
retrieve the snow samples. The corer was then pushed
down vertically about 5–10 cm away from the
trench’s wall into the untouched snowpack until it
contacted the horizontal PC plate. The corer was then
pulled sideways out of the trench wall and the snow
was emptied into bags without touching it. Where
duplicate samples were taken, the same procedure was
carried out about 100 m away (upwind) from the
original location. Sampling was done wearing PE
disposable gloves and smoking was forbidden.
4.2. Chemical analysis
Once taken, the samples were sealed in PE bags,
stored in styrofoam boxes (all centrally provided) and
transported frozen all the way to the laboratory of the
GSC, where they were kept frozen until analysis. The
total volume of meltwater was calculated by weighing
each sample as received and correcting for the weight
of the empty sample bag. Prior to analysis, the
samples were allowed to thaw slowly and were
filtered at 0.45 Am (pre-weighed DuraporeR, hydro-philic polyvinylidene fluoride membrane filters from
MilliporeR, see Hall, 1998).
While the sample still contained a small portion of
ice slush, the filtration was begun. The all-glass acid-
washed MilliporeR apparatus was first assembled
without the DuraporeR filter membrane and 1 l of
MilliQR water (18 MV, from MilliQR Plus water
system) was flushed through the frit and associated
apparatus. The system was reassembled with the filter
in place and 10–15 ml of the sample was filtered and
this initial amount discarded. Filtering was then con-
tinued and the filtered sample was transferred into an
acid-cleaned 6-l high density PE container to homog-
enize it. It was then immediately divided into three
aliquots: a 10- to 15-ml aliquot for Hg determination;
a second aliquot of 500–1000 ml for anions, pH,
conductivity, dissolved organic carbon (DOC) and
alkalinity; and a the third aliquot (about 4 l) was left
in the 6-l container and acidified to 0.4% with
SeastarR high-purity double-distilled HNO3. The en-
tire process of filtering the meltwater, splitting and
acidifying was carried out in a clean room with Class-
100 benches and a Class-10 hood. The chemist wore
clean lab apparel throughout the entire process includ-
ing powder-free vinyl gloves, TyvecR lab coat, shoe
covers and a bouffant cap. The sample was then
immediately refrigerated. The entire process was car-
ried out while the sample was ice-cold to decrease any
loss of elements prior to preservation.
The filtered meltwater samples only are discussed
here; the composition of the filter residues will be re-
ported separately. A series of analytical methods was
applied to the filtrate aliquots, including, among others:
� Ion Chromatography (IC, DionexR 2100 Ion
Chromatograph) for Br�, Cl�, F�, NO2�, NO3
�,
PO43�, SO4
2�;� Inductively Coupled Plasma-Optical Emission
Spectrometry (ICP-OES, Perkin-Elmer OptimaR3000 DV) for Ca, K, Mg, Na, S; and
� Measurements for pH, electrical conductivity (EC),
alkalinity and DOC were done using various
standard instruments.
Results for elements/compounds with 50% or more
of the analysed samples above detection limit (DL)
are of greatest interest. Thus, we shall limit the
discussion in this paper to the following results: pH,
EC, Cl�, NO3�, SO4
2�, Ca, K, Mg, Na and S. Con-
centrations of particulate matter, as determined by the
weighed filter residues (particles >0.45 Am) recalcu-
lated to the volume of filtered meltwater, are also
included here. Discussion of trace element concen-
trations will be reported separately.
4.3. Quality assurance
All efforts were made throughout the project to en-
sure internal consistency and avoid contamination from
sampling to analysis. This was achieved by issuing
each field party with identical, clean sampling equip-
ment from the same source and with clear sampling
instructions. Avoidance of contamination was best
achieved by cleaning the corer in the snow at each
sampling locality, and by sampling only down to a PC
plate inserted horizontally 5 cm above soil/vegetation
to avoid physical contamination.All samplepreparation
and analysis were performed in the same laboratory.
Additional QA procedures included: (1) analysis of
blank samples of various types (see below); (2)
analysis of a number of control reference materials
(CRMs); (3) analysis of each sample in duplicate; (4)
analysis of field duplicate samples; and (5) verifica-
tion of charge balances.
P. de Caritat et al. / Science of the Total Environment 336 (2005) 183–199 189
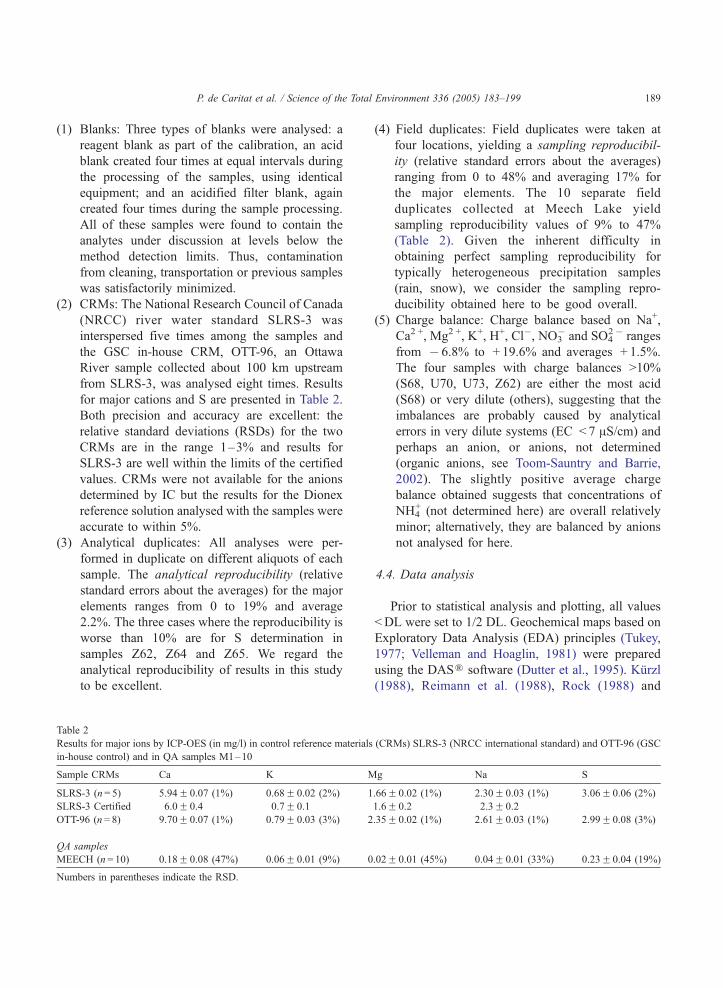
(1) Blanks: Three types of blanks were analysed: a
reagent blank as part of the calibration, an acid
blank created four times at equal intervals during
the processing of the samples, using identical
equipment; and an acidified filter blank, again
created four times during the sample processing.
All of these samples were found to contain the
analytes under discussion at levels below the
method detection limits. Thus, contamination
from cleaning, transportation or previous samples
was satisfactorily minimized.
(2) CRMs: The National Research Council of Canada
(NRCC) river water standard SLRS-3 was
interspersed five times among the samples and
the GSC in-house CRM, OTT-96, an Ottawa
River sample collected about 100 km upstream
from SLRS-3, was analysed eight times. Results
for major cations and S are presented in Table 2.
Both precision and accuracy are excellent: the
relative standard deviations (RSDs) for the two
CRMs are in the range 1–3% and results for
SLRS-3 are well within the limits of the certified
values. CRMs were not available for the anions
determined by IC but the results for the Dionex
reference solution analysed with the samples were
accurate to within 5%.
(3) Analytical duplicates: All analyses were per-
formed in duplicate on different aliquots of each
sample. The analytical reproducibility (relative
standard errors about the averages) for the major
elements ranges from 0 to 19% and average
2.2%. The three cases where the reproducibility is
worse than 10% are for S determination in
samples Z62, Z64 and Z65. We regard the
analytical reproducibility of results in this study
to be excellent.
Table 2
Results for major ions by ICP-OES (in mg/l) in control reference materials
in-house control) and in QA samples M1–10
Sample CRMs Ca K M
SLRS-3 (n= 5) 5.94F 0.07 (1%) 0.68F 0.02 (2%) 1
SLRS-3 Certified 6.0F 0.4 0.7F 0.1
OTT-96 (n= 8) 9.70F 0.07 (1%) 0.79F 0.03 (3%) 2
QA samples
MEECH (n= 10) 0.18F 0.08 (47%) 0.06F 0.01 (9%) 0
Numbers in parentheses indicate the RSD.
(4) Field duplicates: Field duplicates were taken at
four locations, yielding a sampling reproducibil-
ity (relative standard errors about the averages)
ranging from 0 to 48% and averaging 17% for
the major elements. The 10 separate field
duplicates collected at Meech Lake yield
sampling reproducibility values of 9% to 47%
(Table 2). Given the inherent difficulty in
obtaining perfect sampling reproducibility for
typically heterogeneous precipitation samples
(rain, snow), we consider the sampling repro-
ducibility obtained here to be good overall.
(5) Charge balance: Charge balance based on Na+,
Ca2 +, Mg2 +, K+, H+, Cl�, NO3� and SO4
2� ranges
from � 6.8% to + 19.6% and averages + 1.5%.
The four samples with charge balances >10%
(S68, U70, U73, Z62) are either the most acid
(S68) or very dilute (others), suggesting that the
imbalances are probably caused by analytical
errors in very dilute systems (EC < 7 AS/cm) and
perhaps an anion, or anions, not determined
(organic anions, see Toom-Sauntry and Barrie,
2002). The slightly positive average charge
balance obtained suggests that concentrations of
NH4+ (not determined here) are overall relatively
minor; alternatively, they are balanced by anions
not analysed for here.
4.4. Data analysis
Prior to statistical analysis and plotting, all values
<DL were set to 1/2 DL. Geochemical maps based on
Exploratory Data Analysis (EDA) principles (Tukey,
1977; Velleman and Hoaglin, 1981) were prepared
using the DASR software (Dutter et al., 1995). Kurzl
(1988), Reimann et al. (1988), Rock (1988) and
(CRMs) SLRS-3 (NRCC international standard) and OTT-96 (GSC
g Na S
.66F 0.02 (1%) 2.30F 0.03 (1%) 3.06F 0.06 (2%)
1.6F 0.2 2.3F 0.2
.35F 0.02 (1%) 2.61F 0.03 (1%) 2.99F 0.08 (3%)
.02F 0.01 (45%) 0.04F 0.01 (33%) 0.23F 0.04 (19%)

P. de Caritat et al. / Science of the Total Environment 336 (2005) 183–199190
O’Connor and Reimann (1993) provide an introduc-
tion to the advantages of using exploratory data
analysis methods when dealing with geochemical
data. Correlation coefficients (r) presented in this
study are based on raw data (not log-transformed).
Table 3
Chemical composition of < 0.45-Am-filtered meltwater from arctic snow
Analyte pH EC Particles Cl� NO3�
Methoda pH
meter
Conductivity
meter
IC IC
DL 5.0 0.10 0.050
Unit AS/cm mg/l mg/l mg/l
C1 5.85 436 42.31 134.50 0.42
C2 5.18 282 8.90 81.50 0.28
F21 4.77 7.6 5.37 0.77 0.60
F22(D) 4.73 7.3 2.60 0.71 0.57
G34 5.99 25.5 55.17 8.93 0.35
G35(D) 6.13 17.8 65.68 5.68 0.54
I34 5.35 17.9 1.20 6.22 0.10
I35 5.45 < 5.0 1.41 1.11 < 0.05
I36(D) 5.42 < 5.0 1.65 1.17 < 0.05
N39 5.37 34.2 1.27 11.50 0.13
R57 4.73 56.5 0.53 19.35 0.38
R58 4.85 33.8 40.32 11.05 0.15
R60 5.68 1317 2.54 415.50 0.89
S68 4.61 6.5 13.25 0.23 0.67
U70 5.11 < 5.0 7.71 < 0.10 0.14
U72 5.77 < 5.0 90.27 0.15 0.32
U73 5.64 < 5.0 12.75 0.18 0.21
Z62 5.66 6.1 7.20 0.82 0.11
Z63 5.23 80.4 5.07 20.70 0.16
Z64 6.04 46.5 9.91 11.80 0.14
Z65(D) 5.63 32.8 7.36 8.36 0.07
Min 4.61 < 5.0 0.53 < 0.10 < 0.05
Med 5.42 17.9 7.36 6.22 0.21
Max 6.13 1317 90.27 415.50 0.89
QA samples from Meech Lake
M1 4.43 10.25 14.41 0.13 1.61
M2 4.47 10.70 35.47 0.16 1.91
M3 4.52 8.04 29.41 0.12 1.42
M4 4.66 9.79 30.20 0.14 1.79
M5 4.54 11.85 11.86 0.13 1.92
M6 4.59 7.70 14.89 < 0.10 1.35
M7 4.46 11.22 19.68 0.12 2.19
M8 4.46 11.31 13.60 0.12 2.20
M9 4.49 9.45 17.37 0.13 1.63
M10 4.36 10.49 15.91 0.15 1.88
(D): duplicate; DL: (lower) detection limit; EC: electrical conductivity.a Method-ICP: ICP-OES.
5. Results and discussion
Results of the melted snow analyses are presented
in Table 3. The snow is moderately acidic with pH
values between 4.6 and 6.1 (Table 3). The most acid
survey, winter 1996/1997
SO42� Ca K Mg Na S
IC ICP ICP ICP ICP ICP
0.05 0.01 0.05 0.005 0.01 0.05
mg/l mg/l mg/l mg/l mg/l mg/l
7 9.56 2.77 2.50 8.125 65.31 3.09
5 3.61 1.63 1.63 5.245 37.74 1.25
8 0.40 0.02 < 0.050 0.051 0.39 0.12
9 0.40 0.02 < 0.050 0.049 0.37 0.18
6 1.22 0.40 0.21 0.623 4.08 0.47
9 0.95 0.60 0.17 0.449 2.55 0.30
8 0.88 0.12 0.18 0.377 2.86 0.32
0 0.22 0.02 < 0.050 0.071 0.57 0.07
0 0.23 0.02 < 0.050 0.071 0.57 0.08
7 1.71 0.25 0.22 0.746 5.66 0.54
0 2.34 0.45 0.49 1.381 8.87 0.79
8 1.75 0.26 0.25 0.608 5.46 0.57
4 22.25 7.82 7.33 23.642 232.3 7.64
3 0.35 0.03 < 0.050 0.026 0.15 0.13
6 0.19 0.03 < 0.050 0.008 0.02 0.06
8 0.28 0.23 < 0.050 0.023 0.05 0.11
7 0.24 0.20 < 0.050 0.020 0.08 0.10
4 0.47 0.35 < 0.050 0.086 0.46 0.17
2 2.82 0.48 0.47 1.378 9.76 0.88
5 1.83 0.59 0.30 0.827 5.50 0.58
1 1.29 0.36 0.20 0.540 3.91 0.38
0 0.19 0.02 < 0.050 0.008 0.02 0.06
7 0.95 0.26 0.18 0.449 2.86 0.32
4 22.25 7.82 7.33 23.642 232.3 7.64
9 0.73 0.13 0.059 0.017 0.06 0.26
3 0.69 0.18 < 0.050 0.026 0.09 0.24
7 0.47 0.11 < 0.050 0.014 0.05 0.15
7 0.66 0.17 < 0.050 0.024 0.07 0.23
6 0.83 0.12 0.067 0.018 0.06 0.29
6 0.46 0.10 < 0.050 0.013 0.05 0.16
1 0.79 0.32 < 0.050 0.042 0.08 0.24
1 0.79 0.32 < 0.050 0.043 0.08 0.26
9 0.62 0.13 < 0.050 0.017 0.06 0.23
2 0.70 0.17 < 0.050 0.024 0.08 0.25
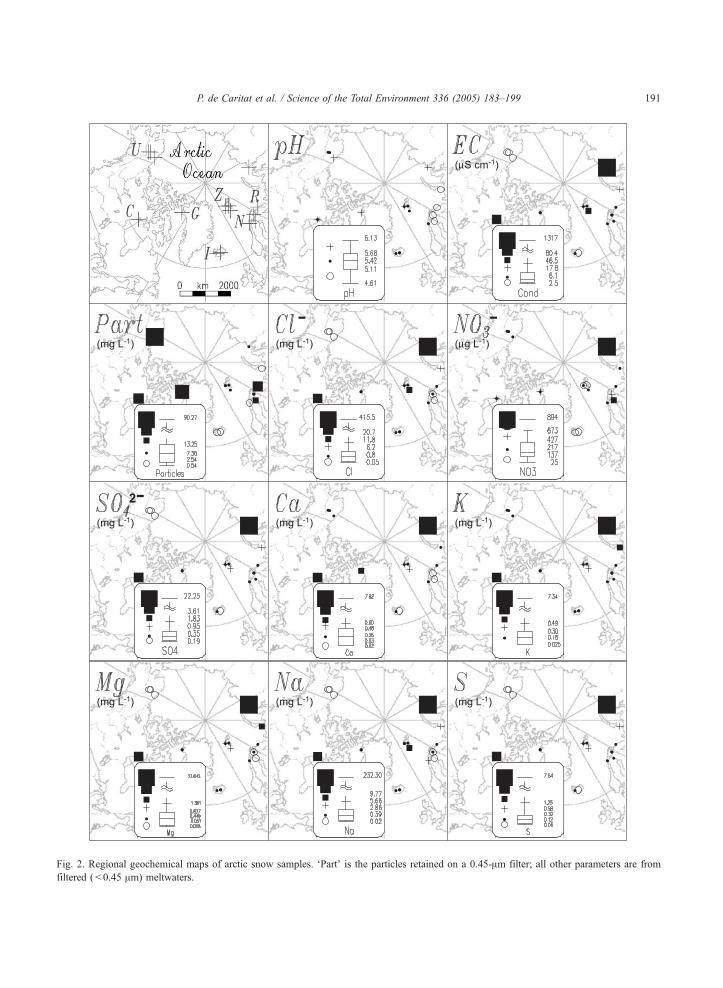
Fig. 2. Regional geochemical maps of arctic snow samples. ‘Part’ is the particles retained on a 0.45-Am filter; all other parameters are from
filtered ( < 0.45 Am) meltwaters.
P. de Caritat et al. / Science of the Total Environment 336 (2005) 183–199 191

P. de Caritat et al. / Science of the Total Environment 336 (2005) 183–199192
samples (pH < 5.11, the 25th percentile) are from the
sector of northern Europe between Sweden and Nova
Zemblya (Fig. 2). Samples from more remote areas or
higher latitudes tend to have a higher pH.
The samples are all (very) dilute, with EC values
between 2 and 1320 AS/cm (all but one sample are
< 500 AS/cm). The most saline sample (R60) is from
the vicinity of Dickson, not far from Norilsk, and may
have contained more soluble rock/soil dust than the
others, as shown by its high pH and high concentra-
tion of all major elements; it may also shown sign of
slight contamination with deicing salts (see below).
Particle concentrations range from 0.5 to 90 mg/l.
The highest concentrations of insoluble particles (>13
mg/l, the 75th percentile) are found in snow samples
U72, G35, G34, C1, R58 and S68.
Major elements (Cl�, NO3�, SO4
2�, Na, Ca, Mg, K,
S) range in concentrations from about 0.008 to 416
Fig. 3. Scatterplots of major elements of arctic snow samples ( < 0.45-Amticks are at 2� , 4� , 6� and 8� the labelled values. Location abbrevi
mg/l (Table 3). Histograms (not shown) and geo-
graphic distributions (Fig. 2) for the major elements
are very similar, with generally highest concentrations
(>75th percentile) at R60 and C1 (for all major
elements), Z63 (Na, Cl�), G34 (Ca), S68 (NO3�)
and R57 (K, Mg). The range of concentrations ob-
served was great, especially for Mg, Na and Cl�,
reaching four orders of magnitude. This indicates a
large range of natural variation in the composition of
snow in the Arctic.
The order of decreasing median concentrations of
cations (in meq/l) was found to be Na (0.1244)HMg
(0.0369)>Ca (0.0129)>K (0.0047)>H+ (0.0038). The
order of decreasing median concentrations of anions
(in meq/l) was found to be Cl� (0.1755)HSO42�
(0.0197)HNO3� (0.0035). These sequences are quite
different from, if not opposite to, those found closer to
more densely populated and industrialized places
meltwaters). Ratios based on mmol/l values. Intermediate log scale
ations as per Table 1. SW: seawater.
P. de Caritat et al. / Science of the Total Environment 336 (2005) 183–199 193
(e.g., samples M1–10 in Table 3; Turk et al., 2001),
indicating that we were successful in obtaining largely
uncontaminated, or background, snow samples.
Scatterplots of major elements show that snow
composition is dominated by seawater dilution (as
expected), but deviations from this behaviour (as
brought out in Fig. 3) shed light on additional pro-
cesses. Most (18 of 21) samples have Cl�/Na (molar)
ratios (slightly) higher than that of seawater (1.166).
The samples with the highest Cl�/Na ratios (>1.415,
the 75th percentile) are those from Alaska (1.881 for
U72) and Greenland (1.419–1.444) (NB: The samples
from Alaska are among the most dilute, see Table 3,
and hence, the errors on their reported concentrations
are greater, making interpretations more speculative,
as explained above).
In order to explain these high Cl�/Na ratios, one
must look for sources with such characteristics or
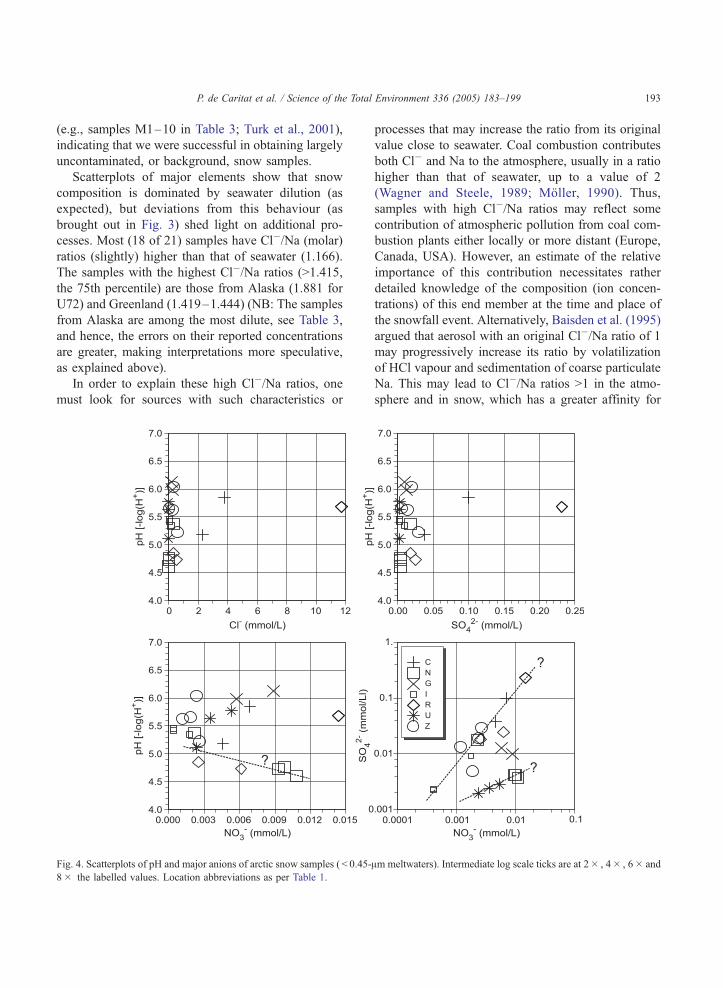
Fig. 4. Scatterplots of pH and major anions of arctic snow samples ( < 0.45-
8� the labelled values. Location abbreviations as per Table 1.
processes that may increase the ratio from its original
value close to seawater. Coal combustion contributes
both Cl� and Na to the atmosphere, usually in a ratio
higher than that of seawater, up to a value of 2
(Wagner and Steele, 1989; Moller, 1990). Thus,
samples with high Cl�/Na ratios may reflect some
contribution of atmospheric pollution from coal com-
bustion plants either locally or more distant (Europe,
Canada, USA). However, an estimate of the relative
importance of this contribution necessitates rather
detailed knowledge of the composition (ion concen-
trations) of this end member at the time and place of
the snowfall event. Alternatively, Baisden et al. (1995)
argued that aerosol with an original Cl�/Na ratio of 1
may progressively increase its ratio by volatilization
of HCl vapour and sedimentation of coarse particulate
Na. This may lead to Cl�/Na ratios >1 in the atmo-
sphere and in snow, which has a greater affinity for
Am meltwaters). Intermediate log scale ticks are at 2� , 4� , 6� and
P. de Caritat et al. / Science of the Total Environment 336 (2005) 183–199194
vapour phase pollutants. The lowest Cl�/Na ratio
(0.973) occurs in sample S68; this ratio is lower than
it is in seawater and is nearly equivalent to that of
halite (1.0).
Many samples have a Cl�/SO42� (molar) ratio
similar to that of seawater (19.346) (Fig. 3), but
several have much lower ratios with the lowest ones
from samples in Alaska (down to 0.713 for U70),
three samples from the Nordic countries and one
from Svalbard. Other samples (C2, R60, C1) have a
Cl�/SO42� ratio distinctly greater than that of sea-
water. It is interesting to note that, in contrast with
the Cl�/Na ratio discussed previously, the Cl�/SO42�
ratio increases fairly regularly with increasing salin-
ity (or Cl�). In order to interpret what this may be
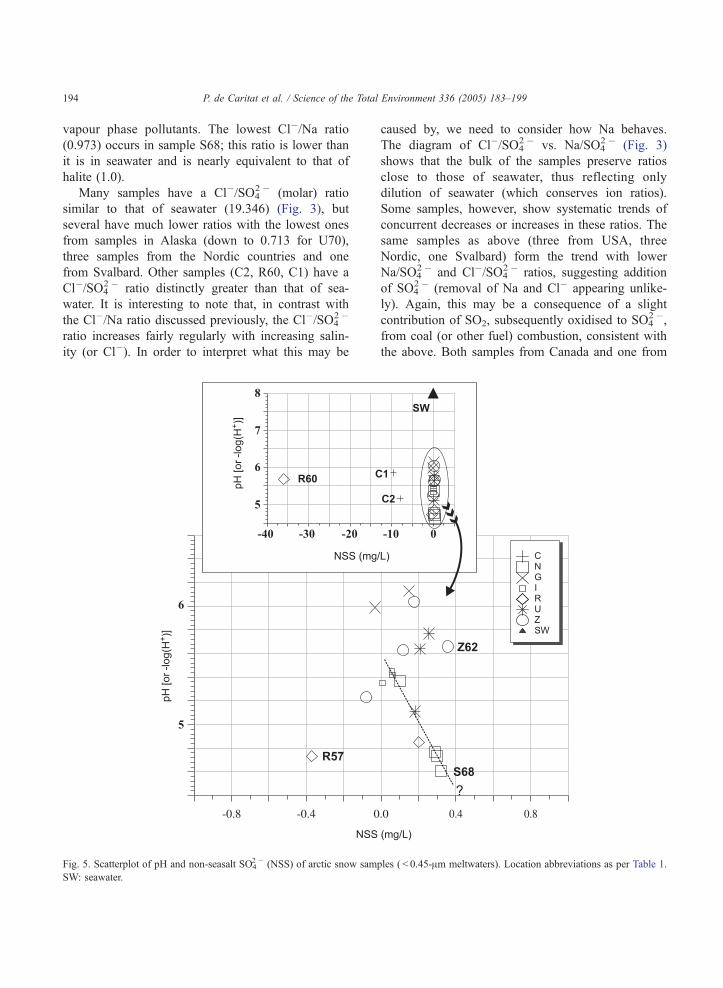
Fig. 5. Scatterplot of pH and non-seasalt SO42� (NSS) of arctic snow sam
SW: seawater.
caused by, we need to consider how Na behaves.
The diagram of Cl�/SO42� vs. Na/SO4
2� (Fig. 3)
shows that the bulk of the samples preserve ratios
close to those of seawater, thus reflecting only
dilution of seawater (which conserves ion ratios).
Some samples, however, show systematic trends of
concurrent decreases or increases in these ratios. The
same samples as above (three from USA, three
Nordic, one Svalbard) form the trend with lower
Na/SO42� and Cl�/SO4
2� ratios, suggesting addition
of SO42� (removal of Na and Cl� appearing unlike-
ly). Again, this may be a consequence of a slight
contribution of SO2, subsequently oxidised to SO42�,
from coal (or other fuel) combustion, consistent with
the above. Both samples from Canada and one from
ples ( < 0.45-Am meltwaters). Location abbreviations as per Table 1.

P. de Caritat et al. / Science of the Total Environment 336 (2005) 183–199 195
Russia (R60) have higher ratios, suggesting addition
of Na and Cl� (removal of SO42� appearing unlike-
ly). This may reflect a small contamination from
NaCl (halite) aerosols from local deicing activities
(Rankin Inlet has an airstrip, which was downwind
of the sampling location; the Dickson sample was
collected on driftice from a ship, whose deck may
have been deiced).
The relationship between Ca, Mg and Cl� (Fig. 3)
shows that all but two samples have greater Ca/Mg
(molar) ratios than seawater (0.194). This probably
represents a contribution from mineral particles com-
prising calcium carbonate (calcite), which, where
present, would be soluble in these dilute, acidic melt-
waters. The highest Ca/Mg ratios (0.674, the 75th
percentile, to 6.26, the maximum) are from samples
from USA (all three), one from Svalbard (Z62), one
from Greenland (G35) and one from Sweden (S68).
The next highest are also from Svalbard and Green-
land. Local rock (or soil) dust is likely the source of
this Ca ‘excess’.
Fig. 6. Ternary diagrams of major cations and anions of arctic snow sam
Location abbreviations as per Table 1. SW: seawater.
Relationships between pH and Cl� or SO42� (Fig.
4) show no obvious trend, suggesting the lack of a
dominant ‘acidification’ process for the whole area.
The six samples with the lowest pH ( < 5.11, the 25th
percentile) are not necessarily associated with high
Cl� or SO42 � concentrations. The seven samples
mentioned above with a slight SO42� addition (three
USA, three Nordic, one Svalbard) do not form a trend
of decreasing pH with increasing SO42�. This suggests
that the additional amount of SO42� that these samples
contain is not sufficient to influence the acidity of the
meltwaters, in contrast to interpretations based on local
snow samples for example on Svalbard (Simoes and
Zagorodnov, 2001). In terms of NO3�, some samples
(three Nordic, two Russia, one USA, one Canada, one
Svalbard) do form a broad trend of decreasing pH with
increasing NO3� concentration (Fig. 4), but the rest are
rather scattered, or perhaps even define a rough trend
of increasing pH. The strong correlation between pH
(or H+) and NO3� commonly observed in snow sam-
ples from areas with a higher population density at
ples ( < 0.45-Am meltwaters). Proportions based on meq/l values.

P. de Caritat et al. / Science of the Total Environment 336 (2005) 183–199196
lower latitudes (e.g., Baisden et al., 1995; Turk et al.,
2001) is not as obvious here, where the relationship
appears to be more complex.
The diagram of SO42� vs. NO3
� (Fig. 4) indicates
that most samples fall along one of two trends. One
has a higher SO42�/NO3
� ratio (f 17) and comprises
two samples from Russia, two from Canada, two from
Iceland, one of the Nordic and three from Svalbard.
The other trend is characterised by a lower SO42�/
NO3� ratio ( < 1) and comprises three USA and three
Nordic samples. Other samples (two Greenland, one
Svalbard, one Russia and one Iceland) have interme-
diate compositions. All these values are well below
the SO42�/NO3
� ratio of seawater (f 40). The median
SO42�/NO3
� molar ratio of the snow samples is 5.29,
but it decreases to between 0.34 (minimum) and 0.84
(25th percentile) in the samples from Sweden, Finland
and Alaska, suggesting that NO3� might be a major
source of ecosystem acidity during snowmelt (Schae-
fer and Driscoll, 1993) here.
Fig. 5 shows the relationship between non-seasalt
SO42� (NSS) and pH. NSS is calculated by assuming
all the Cl� to be of marine origin:
NSS ¼ SO2�4 � ð0:14*Cl�Þ
where 0.14 is the mass ratio SO42�/Cl� in seawater.
Three samples stand out immediately because they
have very high deficits in SO42�: R60, C1 and C2
(Fig. 5 inset). These are the samples suspected above of
having experienced some contamination through deic-
ing salts (NaCl). Thus, for these three samples, the
Table 4
Correlation coefficients (r) for the measured parameters in arctic snow sa
EC Particles Cl� N03� SO4
2� C
pH 0.186 0.460 0.188 � 0.160 0.206
Cond � 0.095 1** 0.564* 0.990*
Particles � 0.093 0.165 � 0.073 �Cl� 0.565* 0.991**
NO3� 0.550*
SO42�
Ca
K
Mg
Na
Based on raw values in mg/l, except pH (pH units) and EC (AS/cm).
*Correlation significant at p= 0.01 level.
**Correlation significant at p= 0.001 level.
assumption inherent to the calculation of NSS is clearly
not justified. Thus, looking more closely at the rest of
the samples (Fig. 5 main), there is only a minor
correlation of increasing NSS and decreasing pH,
which holds for four Nordic, one USA, one Russia
and two or three Iceland samples. For the bulk of the
samples, however, one cannot conclusively show an
overriding trend of acidification related to NSS. Thus,
no evidence is found here for acidification processes to
be operating at the arctic-wide scale of this survey.
Ternary diagrams for major anions and cations
(Fig. 6) indicate that Cl� and Na are commonly the
dominant major ions. However, for some samples,
other ions are also relatively important, even domi-
nant: SO42� and NO3
� (for USA, three Nordic and one
Svalbard samples), Ca (USA, one Svalbard) and,
importantly, H+ (one USA, three Nordic). The two
Russian samples with low pH (R57 and R58) do not
stand out on these ternary diagrams with a high relative
importance of H+ because they also contain high
amounts of other major cations. It is also clear from
Fig. 6 that Mg and K are of secondary importance as
major cations relative to those discussed above.
The least-square regression between SO42� and S
concentrations (not shown) yields a slope of 2.94 (r = 1)
(Table 4), very similar to the SO42�/S mass ratio (2.99),
indicating, as expected, that most S in the snow
samples is oxidised and present as dissolved SO42�.
Correlation coefficients between the various phys-
ical parameters and major elements (Table 4) indicate
that pH is not strongly correlated with any other
chemical variable under consideration. The highest
mples (n= 21)
a K Mg Na S
0.249 0.188 0.190 0.184 0.202
0.997** 1** 1** 0.998** 0.993**
0.048 � 0.091 � 0.091 � 0.099 � 0.075
0.997** 0.999** 1** 0.999** 0.994**
0.566* 0.562* 0.563* 0.569* 0.557*
0.990** 0.992** 0.991** 0.987** 1**
0.997** 0.997** 0.995** 0.993**
1** 0.997** 0.994**
0.997** 0.994**
0.991**

P. de Caritat et al. / Science of the Total Environment 336 (2005) 183–199 197
degree of correlation of pH values is with the particle
content (r = 0.46, which is significant at p < 0.05),
suggesting that dust acts to neutralise the acidity of
the snowpack (see above), decreasing negative ecosys-
tem impacts attending snowmelt in spring. EC does not
correlate with the particle concentration of snow, sug-
gesting that the meltwater’s dissolved ions do not
dominantly originate from dissolution of solid particles
during melting of the samples. This shows that the wet
component of precipitation is chemically quite inde-
pendent of the dry precipitation component: more
solute laden snow may or may not be dust-rich. The
particle concentration does not correlate strongly, in
fact, with any of the other variables. Finally, as expec-
ted, all major anions and cations are strongly correlated
to each other ( p < 0.01 or p < 0.001 in all cases).
6. Conclusions
Arctic snow samples were collected in 1997 from
17 localities in Norway, Sweden, Finland, Svalbard,
Russia, Alaska, Canada, Greenland and Iceland. The
pH of the meltwaters varies from 4.6 to 6.1 (median
5.4), the EC from < 5 to 1317 AS/cm (median 17.9)
and the particulate matter load from 0.5 to 90 mg/l
(median 7.4). The median concentration (in meq/l)
of the major elements decreases in the order Cl�
(0.1755)>Na (0.1244)HMg (0.0369)>SO42 �
( 0 . 0 1 9 7 ) > C a ( 0 . 0 1 2 9 ) >K ( 0 . 0 0 4 7 ) >H +
(0.0038)>NO3� (0.0035). This sequence is quite dif-
ferent from that typical of snow collected closer to
more densely populated and industrialized places.
Snow composition varies regionally by up to four
orders of magnitude in terms of major element con-
centrations. Therefore, while attempting to reconstruct
past changes in snow (or ice) composition, it is
important to consider that at least part of the reported
variability can depend on geographic location and
weather pattern changes (influence of seaspray, etc.)
from winter to winter or within any season’s accumu-
lated snowpack.
The overall major element composition of melt-
waters is consistent with seawater diluted to various
degrees, indicating the dominant influence of this
natural source of atmospheric aerosols over the whole
region. However, departures from seawater dilution
trends indicate the subtle influence of coal combustion
emissions (addition of SO42 � and Cl� relative to
seawater, observed in Alaska, Finland, Sweden, Sval-
bard) or deicing activities (Na/SO42� and Cl�/SO4
2�
ratios higher than seawater, observed in Canada,
Russia). These probably result from local (proximal)
point-sources imparting only a weak contamination to
the surrounding snow.
Mineral dust inputs are detected by ‘excess’ Ca
contents relative to seawater dilution trends, as
observed in Alaska, Svalbard, Greenland and Swe-
den. There is no overall correlation between melt-
water pH and total SO42� concentration, although
some samples define a trend of decreasing pH with
increasing non-seasalt SO42�. A weak local relation-
ship exists between pH and NO3� in Sweden, Finland
and Russia.
No arctic-wide contamination or acidification pro-
cess was detected, suggesting that long-range atmo-
spheric transport is not operating at this scale.
Acknowledgements
This study was initiated after stimulating discus-
sions with Clemens Reimann, and was supported
morally by David Banks, Ron Boyd and Arne
Bjørlykke and financially by the Geological Survey
of Norway and the Geological Survey of Canada.
Discussions about analytical requirements with
Heikki Niskavaara, and the assistance of Tore Volden
and Øystein Jaeger in the preparation of the fieldgear
kits for all participants are greatly acknowledged. The
authors were assisted in the arctic-wide sampling by
Deborah A. Kliza; Alan Everard and Leo Ussak
School’s Grade 6 students Devon Karak, Deano
Kodlak and Sam Curley; Missy Fisk; M.V. Gerasi-
mova; Flemming Green Hansen; Øystein Jaeger; D.V.
Shirokolobov; Kevin Telmer and their field teams; we
thank them all as well as their supportive organiza-
tions. Finally, this manuscript was greatly improved
by the constructive criticisms of Christian M.
Zdanowicz and anonymous journal referees.
References
AMAP. Assessment Report: Arctic Pollution Issues. Oslo, Norway:
Arctic Monitoring and Assessment Programme, 1998 (859 pp.).

P. de Caritat et al. / Science of the Total Environment 336 (2005) 183–199198
Baisden WT, Blum JD, Miller EK, Friedland AJ. Elemental con-
centrations in fresh snowfall across a regional transect in the
northeastern U.S.: apparent sources and contributions to acidity.
Water Air Soil Pollut 1995;84:269–86.
Barrie LA, Hoff RM. The oxidation rate and residence time of sul-
phur dioxide in the arctic atmosphere. Atmos Environ 1984;
18:2711–22.
Buat-Menard PE. Fluxes of metals through the atmosphere and
oceans. In: Nriagu JO, editor. Changing metal cycles and human
health. Berlin: Springer; 1984. p. 43–69.
Busenberg E, Langway Jr CC. Levels of ammonium, sulfate, chlo-
ride, calcium and sodium in snow and ice from southern Green-
land. J Geophys Res 1979;84:1705–9.
CIA. Polar region atlas. Washington: Central Intelligence Agency,
1978 (66 pp.).
Dansgaard W, Oeschger H. Past environmental long-term records
from the Arctic. In: Oeschger H, Langway Jr CC, editors. The
environmental record in glaciers and ice sheets. Dahlem Kon-
ferenzen: Wiley; 1989. p. 287–318.
de Caritat P, Ayras M, Niskavaara H, Chekushin V, Bogatyrev I,
Reimann C. Snow composition in eight catchments in the cen-
tral Barents Euro-Arctic Region. Atmos Environ 1998;32:
2609–26.
Delmas RJ. Past and present chemistry of north and south polar
snow. In: Stonehouse B, editor. Arctic air pollution. Cambridge,
United Kingdom: Cambridge Univ. Press; 1986. p. 175–86.
Delmas RJ. Ice records of the past environment. Sci Total Environ
1994;143:17–30.
Douglas TA, Sturm M. Arctic haze, mercury and the chemical
composition of snow across northwestern Alaska. Atmos Envi-
ron 2004;38:805–20.
Dutter R, Leitner T, Reimann C, Wurzer F. DASR data analysis
system handbook. Vienna, Austria: Technical Univ. Vienna,
1995 (236 pp.).
Fedoseev NF, Fedoseeva VI, Makarov VN. Revised estimate
of pollutant in the snow cover. Meteorol Gidrol 1990;2:
72–82.
Fedoseeva VI, Makarov VN, Fedoseev NF. Mineralization of the
snow cover. Meteorol Gidrol 1986;1:75–9.
Frogner P, Gıslason SR, Oskarsson N. Fertilization potential
of volcanic ash in ocean surface waters. Geology 2001;29:
487–90.
Gıslason SR, Andresdottir A, Sveinbjornsdottir A.E., Oskarsson N,
Thordarson T, Torssander P, et al. Local effects of volcanoes on
the hydrosphere: example from Hekla, southern Iceland. In:
Kharaka YK, Maest AS, editors. Water– rock interactions. Rot-
terdam: Balkema; 1992. p. 477–81.
Gıslason SR, Arnorsson S, Armannsson H. Chemical weathering of
basalt in SW Iceland: effects of runoff, age of rocks and vege-
tative/glacial cover. Am J Sci 1996;296:837–907.
Gorzelska K. Locally generated atmospheric trace metal pollution
in Canadian Arctic as reflected by chemistry of snowpack sam-
ples from the Mackenzie Delta region. Atmos Environ 1989;
23:2729–37.
Hall, GEM, 1998. Cost-effective protocols for the collection, filtra-
tion and preservation of surface waters for detection of metals
and metalloids at ppb (Ag l� 1) and ppt (ng l� 1) levels. Aquatic
Effects Technology Evaluation Program, Canmet, Natural
Resources Canada Report.
Hammer CU, Clausen HB, Dansgaard W, Neftel A, Kristinsdottir P,
Johnson E. Continuous impurity analysis along the Dye 3 deep
ice core. In: Langway Jr CC, Oeschger H, Dansgaard W, editors.
Greenland ice core: geophysics, geochemistry and environment.
Geophys Monogr, vol. 33. Washington, DC: American Geo-
physical Union, 1985. pp. 90–4.
Hansson ME, Hansson HC, Jonsson S, Heintzenberg J. Chemical
composition of insoluble particles in superimposed ice on Stor-
øya, Svalbard. Department of Meteorology, Stockholm, Swe-
den: Stockholm University, 1993 (Report CM-82).
Herron MM, Langway Jr CC. Chloride, nitrate and sulfate in the
Dye 3 and Camp Century Greenland ice cores. In: Langway Jr
H, Oeschger H, Dansgaard W, editors. Greenland ice core: geo-
physics, geochemistry and environment. Geophys Monogr, vol.
33. Washington, DC: American Geophysical Union; 1985. p.
77–84.
Hinkley TD. Composition and sources of atmospheric dusts in
snow at 3200 meters in the St-Elias Range, southeastern Alaska,
USA. Geochim Cosmochim Acta 1994;58:3245–54.
Krachler M, Kosmus W. Heavy metal deposition at the north pole.
Fresenius Environ Bull 1996;5:418–23.
Kurzl H. Exploratory data analysis: recent advances for the inter-
pretation of geochemical data. J Geochem Explor 1988;30:
309–22.
Matsumoto A, Hinkley TK. Trace metal suites in Antarctic pre-
industrial ice are consistent with emissions from quiescent
degassing of volcanoes worldwide. Earth Planet Sci Lett 2001;
186:33–43.
Moller D. The Na/Cl ratio in rainwater and the seasalt chloride
cycle. Tellus 1990;42B:254–62.
O’Connor PJ, Reimann C. Multielement regional geochemical re-
connaissance as an aid to target selection in Irish Caledonian
terrains. J Geochem Explor 1993;47:63–89.
Pfirman S, Crane K, deFur P. Arctic contamination distribution.
CARC-North Perspect 1994;21:8–15.
Raatz WE. The climatology and meteorology of Arctic air pollu-
tion. In: Sturges WT, editor. Pollution of the arctic atmosphere.
New York: Elsevier; 1991. p. 13–41.
Reimann C, Kurzl H, Wurzer F. Applications of exploratory data
analysis to regional geochemical mapping. In: Thornton I, edi-
tor. Monograph series environmental geochemistry and health:
Geochemistry and health. Proceedings Second International
Symposium, London 1987. Northwood, UK: Science Reviews;
1988. p. 21–7.
Rock NMS. Numerical geology. Lecture notes in earth sciences.
Berlin: Springer, 1988. p. 18.
Schaefer DA, Driscoll CT. Identifying sources of snowmelt acidi-
fication with a watershed mixing model. Water Air Soil Pollut
1993;67:345–65.
Shaw GE. The Arctic haze phenomenon. Bull Am Meteorol Soc
1995;76:2403–13.
Simoes JC, Zagorodnov VS. The record of anthropogenic pollution
in snow and ice in Svalbard, Norway. Atmos Environ 2001;35:
403–13.
Suzuki T, Ohta K, Watanabe O. Vertical distribution of 210Pb in the

P. de Caritat et al. / Science of the Total Environment 336 (2005) 183–199 199
arctic glacier, Snøfjellafonna, in northwestern Spitsbergen. Bull
Glacier Res 1995;13:133–6.
Toom-Sauntry D, Barrie LA. Chemical composition of snowfall in
the high Arctic: 1990–1994. Atmos Environ 2002;36:2683–93.
Tukey JW. Exploratory data analysis. Reading, UK: Addison-Wes-
ley; 1977.
Turk JT, Taylor HE, Ingersoll GP, Tonnessen KA, Clow DW, Mast
MA, et al. Major-ion chemistry of the Rocky Mountain snow-
pack, USA. Atmos Environ 2001;35:3957–66.
Velleman PF, Hoaglin DC. Applications, basics and computing
of exploratory data analysis. Boston, USA: Duxbury Press;
1981.
Wagner GH, Steele KF. Na/Cl ratios in rain across the USA. Tellus
1989;41B:444–51.