chemical composition of seawater; salinity and the major ... · mole fraction (used for mixtures of...
TRANSCRIPT
Chemical composition of Chemical composition ofseawater;seawater;
Salinity and the majorSalinity and the majorconstituentsconstituents
OCN 623 – Chemical Oceanography

Salt dissolved in ocean water alters the properties of water
Freezing point of seawater is ~ -1.8˚C
Density continually increases to freezing point

Drives the circulation mode of the oceans-completely different from freshwater in lakes

Molar units 1. Molarity = moles per litre of solution = M
• Commonly used terms include:
mM = millimolar = millimoles per litre = 10-3 moles per litreµM = micromolar = micromoles per litre = 10-6 moles per litre
nM = nanomolar = nannomoles per litre = 10-9 moles per litre
pM = picomolar = picomoles per litre = 10-12 moles per litre
fM = femtomolar = femtomoles per litre = 10-15 moles per litre
aM = attomolar = attomoles per litre = 10-18 moles per litre
gM?
2. Molality = moles per kilogram of solvent = m
• No longer in common use except in some computer programsthat calculate distribution of chemical species
Concentration units for aqueous solutions,Concentration units for aqueous solutions,gases, and solidsgases, and solids

3. Moles per kilogram of solution
• The preferred usage in geochemistry, if not in marinechemistry, about 1.024 smaller than M
• Sometimes defined as "formality"; however, this latter termhas been inconsistently defined in the past and is in disuse
4. Normality = moles of charge equivalents per litre of solution(analogous to molarity, except that it refers to charge)
Comes from acidity, i.e. moles H+ per litre
• Can also use equivalents per kg of solution (meq/kg)
5. g-atom/litre = mole/litre (a gram-atom is a mole)
6. Mole fraction (used for mixtures of gases and for solidsolutions) = n1/n1+n2+n3….
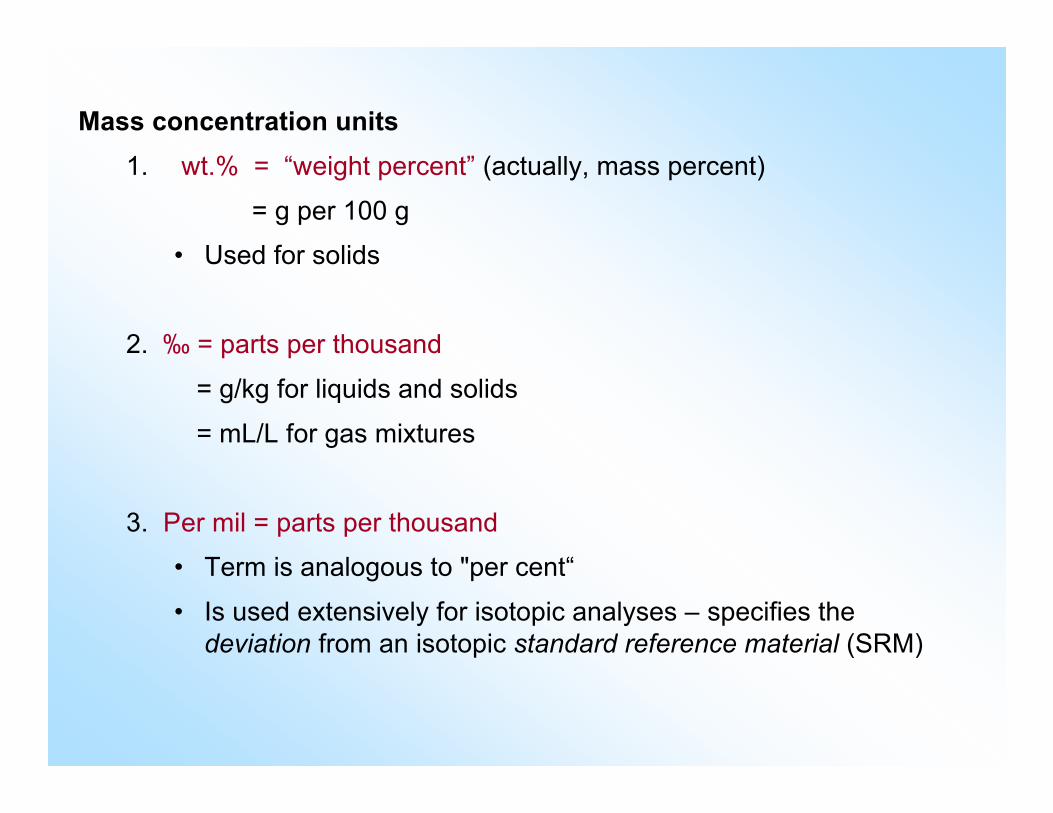
Mass concentration units1. wt.% = “weight percent” (actually, mass percent)
= g per 100 g
• Used for solids
2. ‰ = parts per thousand
= g/kg for liquids and solids
= mL/L for gas mixtures
3. Per mil = parts per thousand
• Term is analogous to "per cent“
• Is used extensively for isotopic analyses – specifies thedeviation from an isotopic standard reference material (SRM)

4. ppm = parts per million = µg/g or mg/kg for liquids and solids
= µL/L for mixtures of gases = ppmv
• "ppm" is commonly used for solids, whereas "mg/kg" is generallypreferred for liquids
5. ppb = parts per billion = ng/g or µg/kg
6. mg/L = milligrams per litre
• commonly used for solutions

Conservative Conservative vs.vs. Nonconservative Nonconservative ElementsElements
• Conservative
• Non-reactive• Thus, remain in ocean for long periods (long residence
time
• Examples: Na, K, S, Cl, Br, Sr, B (“conservative majorelements”)
• Nonconservative
• Biologically and/or chemically reactive• Examples: C, P, Fe

Symbol Name % of mmoles gms /kg
total
Cl- Chloride 55.29 546 19.353Na+ Sodium 30.74 469 10.76Mg2+ Magnesium 3.69 53 1.292SO4
2- Sulphate 7.75 28 2.712Ca2+ Calcium 1.18 10.3 0.412K+ Potassium 1.14 10.2 0.399
Total 99.8
Major ions in seawater of salinity 35
Chemical composition of seawater


Salinity
• Salinity is the amount of dissolved solids in seawater
•Used for determining the density of seawater
•Affects the freezing point of seawater
•Affects the temperature of maximum density of seawater
•Changes in salinity drive thermohaline circulation
•Temperature and salinity characteristics fingerprint origin of water masses
•Accuracy of determination needed is a function of the problem being addressed, e.g. estuaries vs deep ocean

• Salinity is roughly the number of grams of dissolved matter per kilogramof seawater
• Salinity is difficult to measure gravimetrically because many of the saltsare hydrophilic, and some decompose on heating to dryness
• From about 1900 to the 1960's, salinity was calculated from chlorinityCl, as determined by titration with silver ion
Salinity = 1.80655 Cl
• As of 1978, it became standard to calculate “practical salinity” S frommeasured conductivity (PSS-78)
• Note: practical salinity is unit-less, and is not a SI quantity!
Salinity Measurement Salinity Measurement –– The Past The Past
Standard Mean Ocean Water (SMOW): S ≈ 35, Cl ≈ 19‰

• A salinity measure (g-salt/kg) isneeded that is more accurate thanconductivity-based Practical Salinity
• Spatial variations in the compositionof seawater upsets the relationshipbetween
• Practical Salinity S (which is afunction of conductivity,temperature and pressure) and
• Absolute Salinity SA (defined asthe mass of dissolved materialper mass of seawater solution)
Salinity MeasurementSalinity Measurement–– The Future? The Future?

• Absolute Salinity would:
• end the ongoing debate in the oceanographic literature about the use of“psu” or “pss”
• make research papers more readable to the outside scientific community
• be consistent with SI
• A Reference Composition consisting of the major components of Atlantic surfaceseawater is being determined using existing analytical measurements
• A new Reference-Composition Salinity SR is defined to provide the best availableestimate of the Absolute Salinity
• The value of SR can be related to Practical Salinity S by
SR = (35.165 04 / 35) g kg–1 × S
• An algorithm will account for the variation of seawater composition from thestandard composition – using either measured parameters (e.g., total alkalinity,silicate and nitrate) or simply the spatial location (longitude, latitude andpressure)

Why are major ion distributions so consistent?
Source of major ions to ocean is continental weathering
Reservoirs and fluxes
Ocean 1.4 x 10²¹ LEvap from ocean 43 x 1016 L yr-1
Precip over ocean 38 x 1016
Precip over land 11 x 1016
River flow 3.7 x 10¹⁶ Hydrothermal 0.017 x 10¹⁶

Continental materials are unlike seawater or river water
Most common ions in seawater and river water and the elemental composition of the Earth’s crust* listed in order of abundance
Seawater Earth’s crust River water(as ions) (as elements) (as ions)
Chloride (Cl-) Silicon (Si) Bicarbonate (HCO3-)
Sodium (Na+) Aluminium (Al) Calcium (Ca2+)Sulphate (SO4
2-) Iron (Fe) Silicate (SiO2)Magnesium (Mg2+) Calcium (Ca) Sulphate (SO4
2-)Calcium (Ca2+) Sodium (Na) Magnesium (Mg2+)Potassium (K+) Potassium (K) Potassium (K+)Bicarbonate (HCO3
-) Magnesium (Mg) Sodium (Na+)Bromide (Br-) Titanium (Ti) Iron (Fe3+)Borate (H2BO3
-) Manganese (Mn)Strontium (Sr2+) Phosphorous (P)
* Excluding oxygen

Residence time of species in seawater affects concentration Long residence time facilitates good mixing ---Marcet’s principle

• Variations in salinity depend almost entirely on:
• Balance between evaporation and precipitation
• Extent of mixing between surface and deeper waters
• The salinity of surface sea water:
• High (up to 37.5) in mid-latitudes due to net evaporation
• Low at high latitudes (to ~33 above 40°N and S) and at theequator (~35) due to net precipitation
Salinity VariabilitySalinity Variability
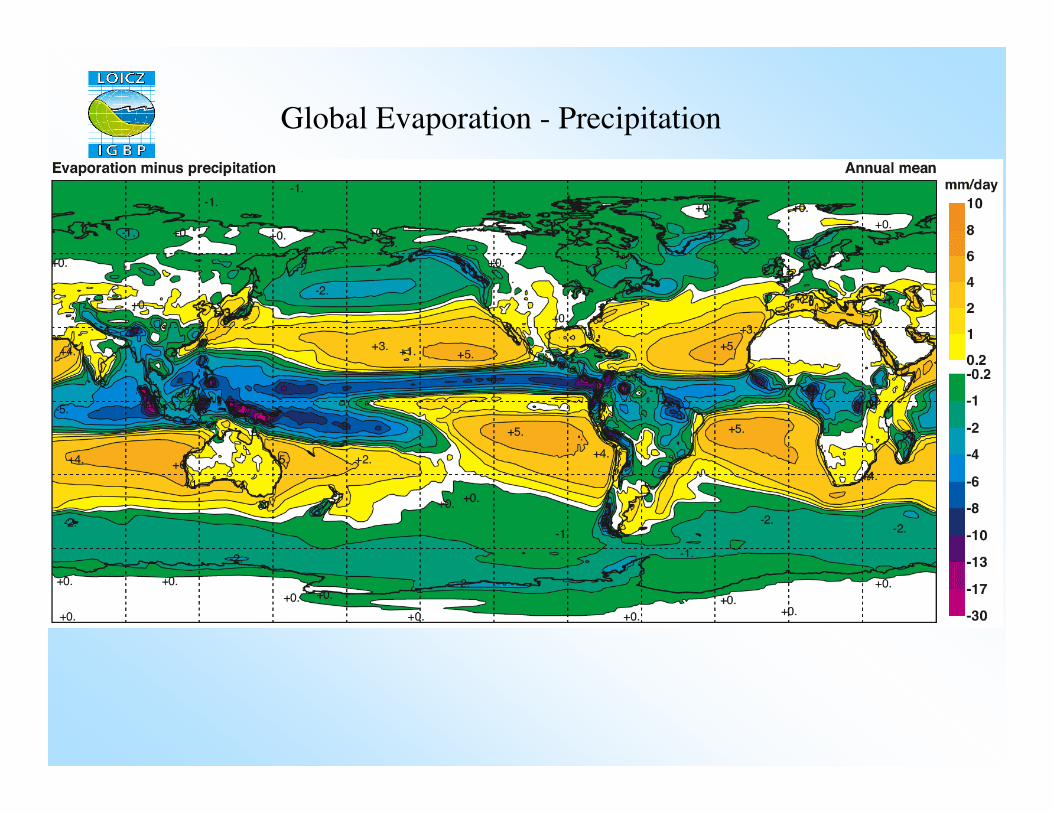
Global Evaporation - Precipitation


There typically is a haloclinefrom the base of the mixedsurface layer to about 1000 mdepth
• At high latitudes:salinity increases withdepth
• At mid and lowlatitudes: salinitydecreases with depth
• Below 1000 m,salinities are generallybetween 34 and 35 atall latitudes
sam.ucsd.edu/sio210/gifimagess

Most ocean water falls in a narrow salinity range

Temperature and salinityare fingerprint characteristicsof seawater origin

Sarmiento & Gruber, 2006
The “densityanomaly” ofseawater in“mass pervolume in excessof 1 kg/m3,multiplied by1000”, isdesignated by thesymbol “σ”(sigma)
In this notation, aspecific gravity of1.025 kg/m3 isexpressed as σ =25
