chemical informatics and target identification in a ...dminor/pdf/nchembio.732_laggner_2012.pdf ·...
TRANSCRIPT
144 nature chemical biology | vol 8 | february 2012 | www.nature.com/naturechemicalbiology
brief communicationpublished online: 18 december 2011 | doi: 10.1038/nchembio.732
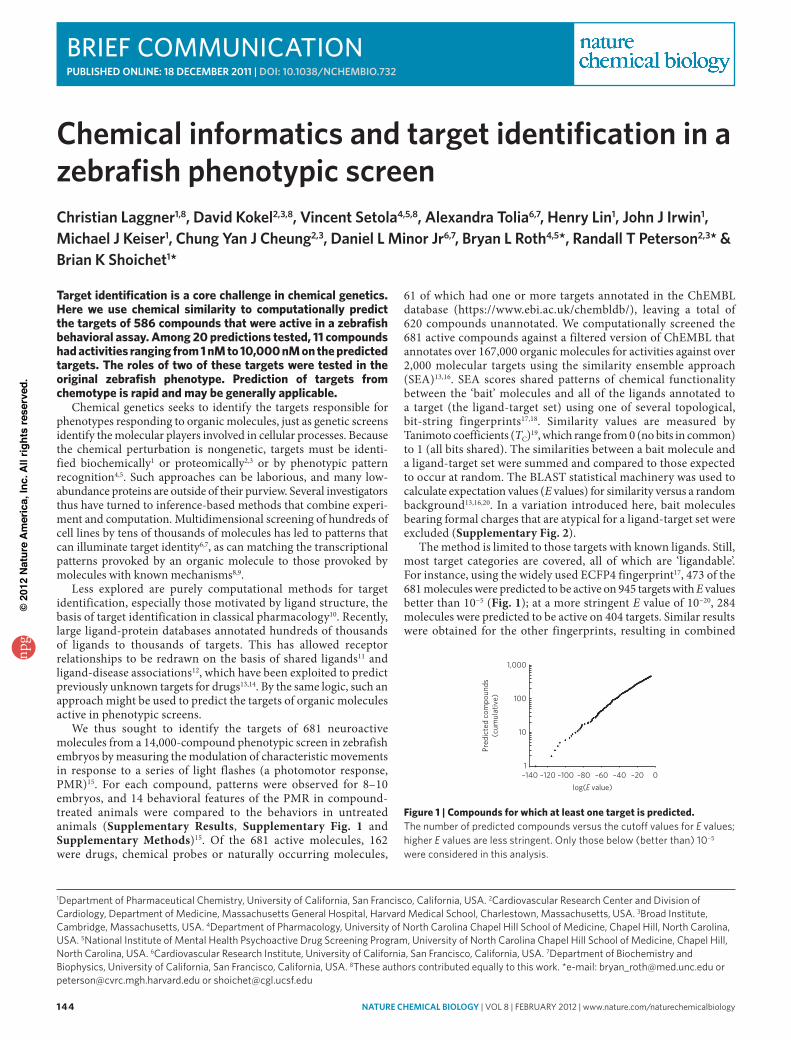
Target identification is a core challenge in chemical genetics. Here we use chemical similarity to computationally predict the targets of 586 compounds that were active in a zebrafish behavioral assay. Among 20 predictions tested, 11 compounds had activities ranging from 1 nM to 10,000 nM on the predicted targets. The roles of two of these targets were tested in the original zebrafish phenotype. Prediction of targets from chemotype is rapid and may be generally applicable.
Chemical genetics seeks to identify the targets responsible for phenotypes responding to organic molecules, just as genetic screens identify the molecular players involved in cellular processes. Because the chemical perturbation is nongenetic, targets must be identi-fied biochemically1 or proteomically2,3 or by phenotypic pattern recognition4,5. Such approaches can be laborious, and many low-abundance proteins are outside of their purview. Several investigators thus have turned to inference-based methods that combine experi-ment and computation. Multidimensional screening of hundreds of cell lines by tens of thousands of molecules has led to patterns that can illuminate target identity6,7, as can matching the transcriptional patterns provoked by an organic molecule to those provoked by molecules with known mechanisms8,9.
Less explored are purely computational methods for target identification, especially those motivated by ligand structure, the basis of target identification in classical pharmacology10. Recently, large ligand-protein databases annotated hundreds of thousands of ligands to thousands of targets. This has allowed receptor relationships to be redrawn on the basis of shared ligands11 and ligand- disease associations12, which have been exploited to predict pre viously unknown targets for drugs13,14. By the same logic, such an approach might be used to predict the targets of organic molecules active in phenotypic screens.
We thus sought to identify the targets of 681 neuroactive molecules from a 14,000-compound phenotypic screen in zebrafish embryos by measuring the modulation of characteristic movements in response to a series of light flashes (a photomotor response, PMR)15. For each compound, patterns were observed for 8–10 embryos, and 14 behavioral features of the PMR in compound-treated animals were compared to the behaviors in untreated animals (Supplementary Results, Supplementary Fig. 1 and Supplementary Methods)15. Of the 681 active molecules, 162 were drugs, chemical probes or naturally occurring molecules,
61 of which had one or more targets annotated in the ChEMBL database (https://www.ebi.ac.uk/chembldb/), leaving a total of 620 compounds unannotated. We computationally screened the 681 active compounds against a filtered version of ChEMBL that annotates over 167,000 organic molecules for activities against over 2,000 molecular targets using the similarity ensemble approach (SEA)13,16. SEA scores shared patterns of chemical functionality between the ‘bait’ molecules and all of the ligands annotated to a target (the ligand-target set) using one of several topological, bit-string fingerprints17,18. Similarity values are measured by Tanimoto coefficients (TC)19, which range from 0 (no bits in common) to 1 (all bits shared). The similarities between a bait molecule and a ligand-target set were summed and compared to those expected to occur at random. The BLAST statistical machinery was used to calculate expectation values (E values) for similarity versus a random background13,16,20. In a variation introduced here, bait molecules bearing formal charges that are atypical for a ligand-target set were excluded (Supplementary Fig. 2).
The method is limited to those targets with known ligands. Still, most target categories are covered, all of which are ‘ligandable’. For instance, using the widely used ECFP4 fingerprint17, 473 of the 681 molecules were predicted to be active on 945 targets with E values better than 10−5 (Fig. 1); at a more stringent E value of 10−20, 284 molecules were predicted to be active on 404 targets. Similar results were obtained for the other fingerprints, resulting in combined
chemical informatics and target identification in a zebrafish phenotypic screenchristian laggner1,8, david Kokel2,3,8, Vincent setola4,5,8, alexandra tolia6,7, henry lin1, John J irwin1, michael J Keiser1, chung yan J cheung2,3, daniel l minor Jr6,7, bryan l roth4,5*, randall t peterson2,3* & brian K shoichet1*
1Department of Pharmaceutical Chemistry, university of California, San francisco, California, uSa. 2Cardiovascular research Center and Division of Cardiology, Department of Medicine, Massachusetts General Hospital, Harvard Medical School, Charlestown, Massachusetts, uSa. 3broad Institute, Cambridge, Massachusetts, uSa. 4Department of Pharmacology, university of North Carolina Chapel Hill School of Medicine, Chapel Hill, North Carolina, uSa. 5National Institute of Mental Health Psychoactive Drug Screening Program, university of North Carolina Chapel Hill School of Medicine, Chapel Hill, North Carolina, uSa. 6Cardiovascular research Institute, university of California, San francisco, California, uSa. 7Department of biochemistry and biophysics, university of California, San francisco, California, uSa. 8These authors contributed equally to this work. *e-mail: [email protected] or [email protected] or [email protected]
1,000
100
10
Pred
icte
d co
mpo
unds
(cum
ulat
ive)
1–140 –120 –100 –80
log(E value)–60 –40 –20 0
Figure 1 | Compounds for which at least one target is predicted. The number of predicted compounds versus the cutoff values for E values; higher E values are less stringent. only those below (better than) 10−5 were considered in this analysis.
npg
© 2
012
Nat
ure
Am
eric
a, In
c. A
ll rig
hts
rese
rved
.

nature chemical biology | vol 8 | february 2012 | www.nature.com/naturechemicalbiology 145
brief communicationNATure CHeMiCAl biology doi: 10.1038/nchembio.732
predictions for 586 compounds with E values <10−5. Targets with strong predictions included G protein–coupled receptors (GPCRs), ligand-gated ion channels, nuclear hormone receptors, transporters and soluble enzymes (Supplementary Table 1).
We emphasized those targets that were predicted with strong E values, were previously unknown for the phenotypi-cally active molecules and were experimentally accessible to us. For this study, we investigated GPCRs, ion channels, trans-porters and kinases. Many target predictions were unknown in ChEMBL but were subsequently found through a literature search (Supplementary Table 2). Because we were interested in new predictions, we focused on 20 compounds predicted against unknown targets. Of these compounds, 11 were active at 22 of their predicted 31 targets (Table 1, Supplementary Table 3 and Supplementary Fig. 3) and 9 compounds had no measurable activity at their predicted targets, and these predictions were considered falsified (Supplementary Table 4). Potencies, mea-sured in full concentration-response, ranged from about 10 μM to low nanomolar (Table 1 and Supplementary Fig. 3). As noted previously14, there was little correlation between potency and SEA E value. Potency is ignored in weighting the ligand similarities in SEA; E values only indicate the likelihood that the compound will be active at a relevant concentration13,16.
It is appropriate to consider the accuracy and the novelty of the predictions. Arguably, any method that uses a library of ligand-target sets such as ChEMBL and a metric of chemical similarity could have predicted targets for some of these molecules. For instance, pairwise compound similarity alone, or one of the more sophisticated methods now available7,11,12,21,22, might well have sug-gested that compounds 6 and 7 (Supplementary Table 3) target the Kv1.2 potassium channel or that 8 targets vasopressin receptors. Any such approach must confront the problem of what level of chemical similarity usefully identifies likely targets; if a similarity cutoff is too permissive, too many targets will be captured, and if it is too stringent, many likely targets will be missed. For instance, the pairwise similarity of 2 for β-adrenergic receptor ligands and of 3 for α2-adrenergic receptor ligands never rose above a TC of 0.61 (Daylight fingerprints) or 0.43 (ECFP4 fingerprints), respec-tively. At these relatively low similarities, a simple two-dimensional similarity search of ChEMBL predicts 217 targets for 2 and 57 tar-gets for 3, many of which will be false positives. SEA attempts to address this problem by comparing observed similarities to those expected at random and by screening any bait molecule against an entire ligand-target set13,16. This at once increases the number of addressable targets, ranks the predictions by confidence level and eliminates many predictions that are based on a bait molecule’s association with one or two ligands in a target set that might anno-tate hundreds of molecules. Because SEA is model free and uses all information represented in a fingerprint without weighting, it can interrogate any ligand-target set for similarity to any bait molecule without defining warheads or pharmacophores.
A key challenge, for us and for the field, is linking the targets for which in vitro affinity is measured to the in vivo phenotype that was originally observed. One way to investigate this is to test another molecule, known to be active on the target but structurally dissimilar to the active compound from the phenotypic screen, for its ability to phenocopy the original bait molecule in the animal or cell23. The voltage-gated potassium channel Kv1.2 is attractive for this purpose in that it is modulated by structurally diverse mole-cules. Psora-4 (12), for instance, has low- to mid-nanomolar activity against members of the Kv1 family, including Kv1.2, but is structur-ally orthogonal to compounds 6 and 7. Consistent with the predic-tion that compounds 6 and 7 exert their excitatory phenotype by blocking this family of ion channels, the PMR profile induced by the chemically unrelated compound 12 closely resembles that induced by compounds 6 and 7 (Fig. 2 and Supplementary Fig. 4).
A second pharmacological test for a target-based effect is to use the screening compound to compete against the function of a known ligand for the target of interest. We tested the ability of compound 1 to reverse the excitatory activity of the β-adrenergic agonist isoproterenol (13) in the PMR assay. Consistent with the prediction and in vitro observation of activity on the β-adrenergic receptors, compound 1 reversed isoproterenol’s excitatory PMR as
Table 1 | Successful target predictions for compounds active in the zebrafish PMr screencompound predicted targets E value Ki (nm)
1 β1-ar 2.99 × 10⁻¹⁸ 337β2-ar 4.69 × 10⁻¹⁵ 728β3-ar 4.55 × 10⁻¹⁹ 589
2 β1-ar — 965β2-ar 2.98 × 10⁻⁵ a 550β3-ar 2.98 × 10⁻⁵ a 3,128
3 D2r 3.54 × 10⁻³³ 120D3r 8.16 × 10−41 >10,000D4r 1.00 × 10⁻²⁴ 5.0α1a-ar 2.07 × 10−48 113.6α1b-ar 1.19 × 10−48 29.7α1D-ar 3.89 × 10−48 25.4α2a-ar 2.01 × 10⁻²⁷ 164α2b-ar 2.83 × 10⁻²⁶ 96.4α2C-ar 1.84 × 10⁻²⁶ 80.85-HT1a 3.83 × 10−67 65.05-HT1b 1.62 × 10⁻¹⁶ 9,4225-HT1D 7.55 × 10⁻¹⁷ 153
4 D2r 2.78 × 10−42 4,869D3r 1.46 × 10−46 946D4r 2.25 × 10−49 11815-HT1a 1.24 × 10⁻³¹ 2,4395-HT1b 1.61 × 10⁻¹² >10,0005-HT1D 2.32 × 10⁻¹⁶ 4,512
5 (arC-239) D2r 2.15 × 10−38 207D3r 9.25 × 10−44 164D4r 8.28 × 10⁻²⁵ 530
6 Kv1.1 4.05 × 10−71 n.d.Kv1.2 9.40 × 10−85 1,930b
Kv1.3 1.28 × 10⁻¹⁴ n.d.
7 Kv1.1 9.69 × 10−56 n.d.Kv1.2 1.18 × 10−66 2,810b
Kv1.3 1.74 × 10⁻¹⁰ n.d.
8 oXTra 1.60 × 10⁻²⁶ >10,000avPr1a 8.32 × 10⁻¹⁰ 690
9 (NaN-190) SerT 2.06 × 10⁻¹⁹ 6,200c
10 abl2 1.62 × 10−54 7,460b,d
SrC 3.38 × 10⁻³⁴ 3,820b,d
lCK 2.51 × 10⁻³⁰ 1,890b,d
11 p38α 2.68 × 10⁻¹⁰ 47%e
aCalculated with Daylight fingerprints. bIC50 (nM). ceC50 (nM). dassuming competitive inhibition, and on the basis of the Cheng-Prusoff equation, Ki values would be about half the IC50 values for the kinase inhibitors. ePercentage inhibition at 10 μM. ar, adrenergic receptor. Chemical structures and PMr plots of these compounds are shown in Supplementary Table 3.
npg
© 2
012
Nat
ure
Am
eric
a, In
c. A
ll rig
hts
rese
rved
.

146 nature chemical biology | vol 8 | february 2012 | www.nature.com/naturechemicalbiology
brief communication NATure CHeMiCAl biology doi: 10.1038/nchembio.732
effectively as the well-known β-adrenergic antagonist bopindolol (Fig. 2 and Supplementary Fig. 5). In contrast, 1 did not reverse the excitatory phenotype of drugs acting on other receptor classes, such as the digitoxigenins, nor did sedative drugs from other classes reverse the excitatory activity of isoproterenol (Supplementary Fig. 6). These results are consistent with the zebrafish phenotype of compound 1 being mediated via β-adrenergic receptors.
Chemoinformatic target identification in phenotypic screens has important advantages: it is rapid, has a relatively high success rate and can address both high- and low-abundance targets. Admittedly, there are important caveats: the approach is limited to liganded targets, and even for these, almost half of the predictions that were tested failed, as in earlier studies13,14. Still, this success rate seems high enough to be pragmatic for experimental prioritization. Especially when a purely empirical screen is laborious, and when low-abundance targets will be missed, this approach and related methods11,12,22,24 will usefully complement purely experimental approaches. Although finding that a molecule is active against a particular target does not establish the role of that target in the phenotype, it does provide a testable molecular hypothesis. Whereas the method is restricted to the targets for which ligand information is available, one can at least be sure that these are ligandable and that small-molecule probes already exist within the small part of chemical space that has been explored25. Within this set, the method is systematic and comprehensive enough to suggest testable targets for most of the ligands that are active in even a diverse ligand library, as was tested here (Table 1). This method may thus find broad application to target identification in phenotypic screens, and we have developed a website from which the method may be accessed by the community (http://sea.bkslab.org/).
received 25 april 2011; accepted 19 September 2011; published online 18 December 2011
references1. Harding, M.W., Galat, A., Uehling, D.E. & Schreiber, S.L. Nature 341,
758–760 (1989).2. Leung, D., Hardouin, C., Boger, D.L. & Cravatt, B.F. Nat. Biotechnol. 21,
687–691 (2003).3. Ong, S.E. et al. Proc. Natl. Acad. Sci. USA 106, 4617–4622 (2009).4. Mayer, T.U. et al. Science 286, 971–974 (1999).5. Haggarty, S.J. et al. Chem. Biol. 7, 275–286 (2000).6. Schreiber, S.L. Nat. Chem. Biol. 1, 64–66 (2005).7. Seiler, K.P. et al. Nucleic Acids Res. 36, D351–D359 (2008).8. Palchaudhuri, R. & Hergenrother, P.J. ACS Chem. Biol. 6, 21–33 (2011).9. Lamb, J. et al. Science 313, 1929–1935 (2006).10. Keiser, M.J., Irwin, J.J. & Shoichet, B.K. Biochemistry 49, 10267–10276 (2010).11. Paolini, G.V., Shapland, R.H., van Hoorn, W.P., Mason, J.S. & Hopkins, A.L.
Nat. Biotechnol. 24, 805–815 (2006).12. Yildirim, M.A., Goh, K.I., Cusick, M.E., Barabasi, A.L. & Vidal, M.
Nat. Biotechnol. 25, 1119–1126 (2007).13. Keiser, M.J. et al. Nat. Biotechnol. 25, 197–206 (2007).14. Keiser, M.J. et al. Nature 462, 175–181 (2009).15. Kokel, D. et al. Nat. Chem. Biol. 6, 231–237 (2010).16. Hert, J., Keiser, M.J., Irwin, J.J., Oprea, T.I. & Shoichet, B.K. J. Chem. Inf.
Model. 48, 755–765 (2008).17. Rogers, D. & Hahn, M. J. Chem. Inf. Model. 50, 742–754 (2010).18. James, C., Weininger, D. & Delany, J. Daylight Theory Manual (Daylight
Chemical Information Systems Inc., 2011).19. Willett, P., Barnard, J.M. & Downs, G.M. J. Chem. Inf. Comput. Sci. 38,
983–996 (1998).20. Altschul, S.F., Gish, W., Miller, W., Myers, E.W. & Lipman, D.J. J. Mol. Biol.
215, 403–410 (1990).21. Young, D.W. et al. Nat. Chem. Biol. 4, 59–68 (2008).22. Mestres, J., Gregori-Puigjane, E., Valverde, S. & Sole, R.V. Mol. Biosyst. 5,
1051–1057 (2009).23. Alderton, W., Davenport, R. & Fish, P.V. Drugs Future 35, 517–521 (2010).24. Kinnings, S.L. et al. PLOS Comput. Biol. 5, e1000423 (2009).25. Hert, J., Irwin, J.J., Laggner, C., Keiser, M.J. & Shoichet, B.K. Nat. Chem. Biol.
5, 479–483 (2009).
acknowledgmentsWe thank S. Morris for help with Cytoscape. This work was supported by US National Institutes of Health grants GM71896 (to J.J.I. and B.K.S.), AG02132 (to S. Prusiner and B.K.S.), MH085205 and MH086867 (to R.P.), MH091449 (to D.K.), R01 MH093603 and R01 NS49272 (to D.L.M.); a Rogers Family Foundation award (to M.J.K.); the National Institutes of Mental Health Psychoactive Drug Screening Program, grant U19MH82441; the Michael Hooker Chair (to B.L.R.); and fellowships from the Max Kade Foundation (to C.L.) and the European Molecular Biology Organization (to A.T.).
author contributionsThe strategy was devised by B.K.S. and R.T.P., the PMR assay by D.K., and target predictions and other calculations by C.L., with assistance and editing by J.J.I., M.J.K., H.L. and B.K.S. Electrophysiology was designed by D.L.M. and implemented by A.T., and GPCR and kinase experiments were designed and implemented by B.L.R. and V.S., who also advised on target-phenotype associations. Zebrafish pharmacology was conducted by D.K. with assistance by C.Y.J.C.
competing financial interestsThe authors declare no competing financial interests.
additional informationSupplementary information and chemical compound information is available online at http://www.nature.com/naturechemicalbiology/. Reprints and permissions information is available online at http://www.nature.com/reprints/index.html. Correspondence and requests for materials should be addressed to B.L.R., R.T.P. or B.K.S.
0
0
0.2
0.4
Mot
ion
inde
x
0.6
0.8
1.0
5 10 15 20Time (s)
25 30
DMSO
Background Excitation Refractory
1.0
0.8
0.6
Mot
ion
inde
x
0.4
0.2
00 5
Time (s)10 15 20 25 30
13 (iso)
a
d
12 (psora-4)
1.0
0.8
0.6
Mot
ion
inde
x
0.4
0.2
00 5
Time (s)10 15 20 25 30
1.0
0.8
0.6
Mot
ion
inde
x
0.4
0.2
00 5
Time (s)10 15 20 25 30
13 + 14 (bopin)e
b
61.0
0.8
0.6
Mot
ion
inde
x
0.4
0.2
00 5
Time (s)10 15 20 25 30
1.0
0.8
0.6
Mot
ion
inde
x
0.4
0.2
00 5
Time (s)10 15 20 25 30
13 + 1f
c
Figure 2 | Testing target relevance by phenocopy and functional competition. Compounds 6 and 7 phenocopy the known Kv inhibitor psora-4 (12). (a–c): The PMr phenotypes of animals treated with DMSo (a), compound 12 (b) or compound 6 (c). The same phenotype was obtained for compound 7 (detailed in Supplementary Table 3). Compound 1 suppresses β-adrenergic receptor agonist-induced motor excitation (d–f): PMr phenotypes of animals treated with: compound 13 (iso, isoproterenol) (d), compound 13 and the known β-adrenergic receptor antagonist compound 14 (bopin, bopindolol) (e), or compounds 13 and 1 (f).
npg
© 2
012
Nat
ure
Am
eric
a, In
c. A
ll rig
hts
rese
rved
.

1
Supplementary Information for Chemical Informatics and Target Identification in a Zebrafish
Phenotypic Screen
Christian Laggner1,8, David Kokel2,3,8, Vincent Setola4,5,8, Alexandra Tolia6,7, Henry Lin1,
John J. Irwin1, Michael J. Keiser1, Chung Yan J. Cheung2,3, Daniel L. Minor, Jr. 6,7, Bryan
L. Roth4,5*, Randall T. Peterson2,3* & Brian K. Shoichet1* 1Department of Pharmaceutical Chemistry, University of California, San Francisco, California,
USA. 2Cardiovascular Research Center and Division of Cardiology, Department of Medicine,
Massachusetts General Hospital, Harvard Medical School, Charlestown, Massachusetts, USA. 3Broad Institute, Cambridge, Massachusetts, USA. 4Department of Pharmacology, University of
North Carolina Chapel Hill School of Medicine, Chapel Hill, North Carolina, USA. 5National
Institute of Mental Health Psychoactive Drug Screening Program, University of North Carolina
Chapel Hill School of Medicine, Chapel Hill, 6Cardiovascular Research Institute, University of
California, San Francisco, California, USA. 7Department of Biochemistry and Biophysics,
University of California, San Francisco, California, USA. 8These authors contributed equally to
this work.
*Correspondence:
Bryan Roth: [email protected], phone: 919-966-7539, fax: 919-843-5788
Randall Peterson: [email protected], phone: 617-724-9569, fax: 617-726-5806
Brian Shoichet: [email protected], phone: 415-514-4126, fax: 415-514-4126
Nature Chemical Biology: doi:10.1038/nchembio.732

2
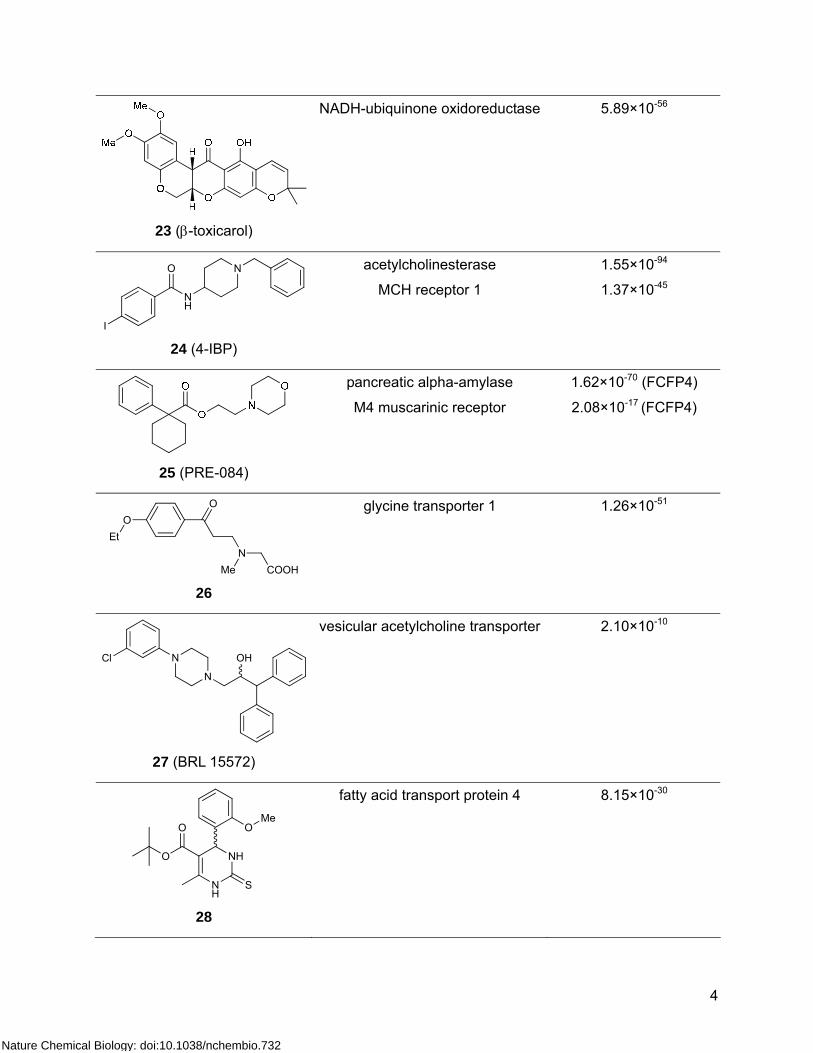
SUPPLEMENTARY RESULTS Supplementary Table 1 | Representative, high-confidence but untested target predictions for compounds active in the zebrafish screen. Targets across biological categories (i.e.,
GPCRs, ligand-gated ion channels, transporters, nuclear hormone receptors, enzymes) are
predicted.
Compound Predicted Target Confidence relative to random (SEA E-value)
N
N
O
N
NO
F
F
Me
O
Me
15
PDE1B 7.76×10⁻¹¹
16
PDE4A 6.52×10-65
17 (SKF-82958)
adenylate cyclase VII 2.99×10-57
18 (A-77636)
adenylate cyclase IX 6.38×10-44
Nature Chemical Biology: doi:10.1038/nchembio.732

3
N O
N
N
Cl
O
19
malic enzyme 1 2.52×10-60
O
NEtEt
20
Δ8-Δ7 sterol isomerase 3.23×10⁻¹⁵
NH O
F F
F
21
sirtuin 1 1.00×10⁻¹²
O
O
OAcO
O
OH
H H
22 (strophanthidinic acid
lactone acetate)
Na/K-transporting ATPase
1.54×10⁻²³
Nature Chemical Biology: doi:10.1038/nchembio.732
4
23 (β-toxicarol)
NADH-ubiquinone oxidoreductase
5.89×10-56
I
O
NH
N
24 (4-IBP)
acetylcholinesterase
MCH receptor 1
1.55×10-94
1.37×10-45
25 (PRE-084)
pancreatic alpha-amylase
M4 muscarinic receptor
1.62×10-70 (FCFP4)
2.08×10⁻¹⁷ (FCFP4)
O
NCOOHMe
OEt
26
glycine transporter 1
1.26×10-51
N
N
OHCl
27 (BRL 15572)
vesicular acetylcholine transporter 2.10×10⁻¹⁰
NH
NH
OMe
S
O
O
28
fatty acid transport protein 4 8.15×10⁻³⁰
Nature Chemical Biology: doi:10.1038/nchembio.732

5
O O
N
N
Me
OAc
29
macrophage migration inhibitory
factor
4.84×10⁻¹⁸
30
tubulin 1.92×10-43
31
Nav1.1
2.87×10⁻¹⁴
32
Nav1.5
2.01×10⁻²¹
33
GABA-A
4.16×10⁻¹⁰
(FCFP4)
Nature Chemical Biology: doi:10.1038/nchembio.732

6
34
5-HT3B
1.34×10⁻²¹
35
adenosine A1 receptor 2.34×10⁻²¹
36
vanilloid receptor 1
9.07×10⁻¹¹
NCl
N
NHO
37
mGluR5
5.83×10⁻¹¹
38
progesterone receptor
6.73×10⁻³⁰
Nature Chemical Biology: doi:10.1038/nchembio.732

7
N
HO
39
nociceptin receptor 2.14×10⁻³⁴
40 (fluspirilene)
nociceptin receptor
1.99×10-41
41
κ opioid
3.76×10⁻¹²
OHN
N
O
42
dopamine D3 7.75×10⁻²⁶
Nature Chemical Biology: doi:10.1038/nchembio.732

8
Supplementary Table 2 | Compound-target predictions that, though not in our databases, could be verified by literature search.
Compound Predicted Target Confidence relative to random (SEA E-value)
O
O
HH
H
43 (progesterone)
CYP17a
1.5710-15
NH
HN
O
44
melatonin MT3 1
melatonin MT1 1
melatonin MT2 1
3.78×10-60
3.78×10-60
7.97×10-58
HN
O
45
melatonin MT2 2
melatonin MT1 2
3.54×10⁻¹⁵
8.66×10⁻¹⁵
NH
O
OMe
Cl
Cl
OEt
O
46 (felodipine)
voltage-dependent L-type
calcium channel Cav1.2 3
8.22×10⁻²⁶
Nature Chemical Biology: doi:10.1038/nchembio.732

9
47 (5-methylurapidil)
5-HT1A 4
1.52×10-96
48 (zolantidine)
histamine N-
methyltransferase (HMT) 5
1.36×10- 54
49
5-HT1A 6 2.92×10⁻³¹
50 (CY 208-243)
dopamine D1 7 8.65×10⁻²⁰
SH2N O
OS
NH
HN
Cl
Cl
O O
Cl
51 (trichlormethiazide)
carbonate dehydratase IV 8 4.16×10⁻¹⁰ (FCFP4)
Nature Chemical Biology: doi:10.1038/nchembio.732
10
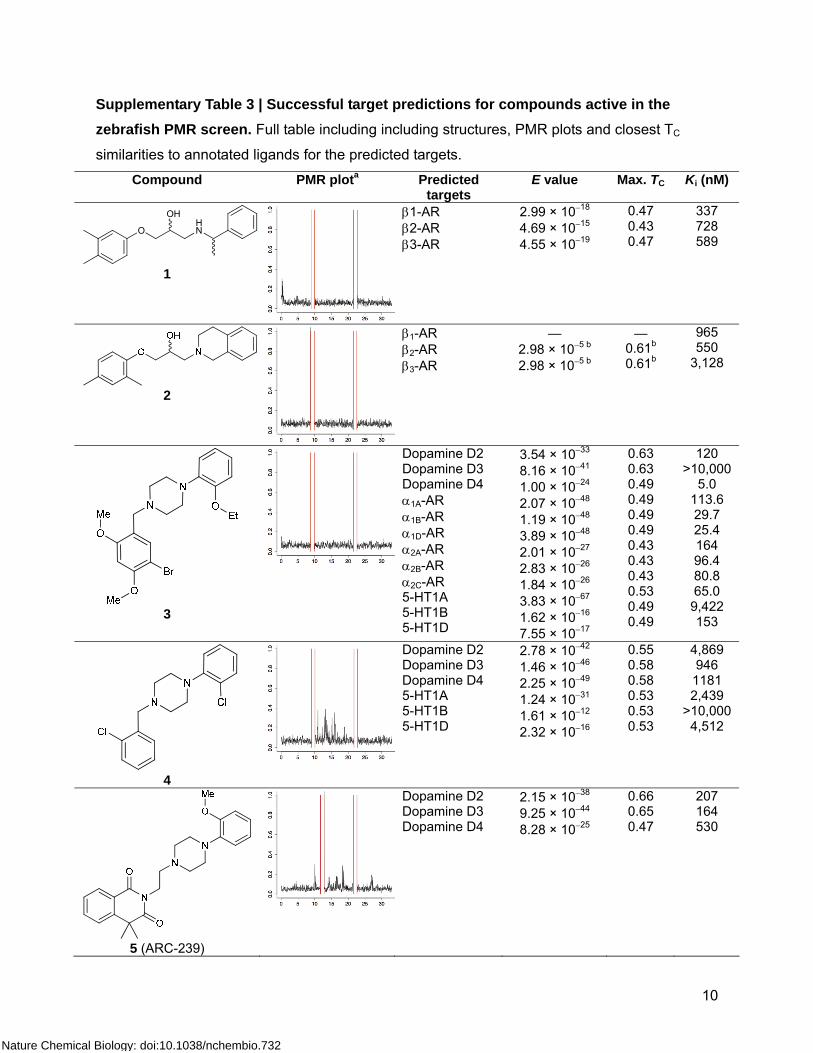
Supplementary Table 3 | Successful target predictions for compounds active in the zebrafish PMR screen. Full table including including structures, PMR plots and closest TC
similarities to annotated ligands for the predicted targets. Compound PMR plota Predicted
targets E value Max. TC Ki (nM)
HNO
OH
1
β1-AR β2-AR β3-AR
2.99 × 10⁻¹⁸ 4.69 × 10⁻¹⁵ 4.55 × 10⁻¹⁹
0.47 0.43 0.47
337 728 589
2
β1-AR β2-AR β3-AR
— 2.98 × 10⁻⁵ b 2.98 × 10⁻⁵ b
— 0.61b 0.61b
965 550
3,128
3
Dopamine D2 Dopamine D3 Dopamine D4 α1A-AR α1B-AR α1D-AR α2A-AR α2B-AR α2C-AR 5-HT1A 5-HT1B 5-HT1D
3.54 × 10⁻³³ 8.16 × 10−41 1.00 × 10⁻²⁴ 2.07 × 10−48 1.19 × 10−48 3.89 × 10−48 2.01 × 10⁻²⁷ 2.83 × 10⁻²⁶ 1.84 × 10⁻²⁶ 3.83 × 10−67 1.62 × 10⁻¹⁶ 7.55 × 10⁻¹⁷
0.63 0.63 0.49 0.49 0.49 0.49 0.43 0.43 0.43 0.53 0.49 0.49
120 >10,000
5.0 113.6 29.7 25.4 164 96.4 80.8 65.0 9,422 153
4
Dopamine D2 Dopamine D3 Dopamine D4 5-HT1A 5-HT1B 5-HT1D
2.78 × 10−42 1.46 × 10−46 2.25 × 10−49 1.24 × 10⁻³¹ 1.61 × 10⁻¹² 2.32 × 10⁻¹⁶
0.55 0.58 0.58 0.53 0.53 0.53
4,869 946 1181 2,439
>10,000 4,512
5 (ARC-239)
Dopamine D2 Dopamine D3 Dopamine D4
2.15 × 10−38 9.25 × 10−44 8.28 × 10⁻²⁵
0.66 0.65 0.47
207 164 530
Nature Chemical Biology: doi:10.1038/nchembio.732

11
6
Kv1.1 Kv1.2 Kv1.3
4.05 × 10−71 9.40 × 10−85 1.28 × 10⁻¹⁴
0.72 0.72 0.72
n.d. 1,930c
n.d.
7
Kv1.1 Kv1.2 Kv1.3
9.69 × 10−56 1.18 × 10−66 1.74 × 10⁻¹⁰
0.56 0.56 0.56
n.d. 2,810c
n.d.
8
Oxytocin Vasopressin 1A
1.60 × 10⁻²⁶ 8.32 × 10⁻¹⁰
0.52 0.52
>10,000 690
N
N NO
O
MeO
9 (NAN-190)
SERT 2.06 × 10⁻¹⁹ 0.52 6,200d
10
ABL2 SRC LCK
1.62 × 10−54 3.38 × 10⁻³⁴ 2.51 × 10⁻³⁰
0.42 0.42 0.45
7,460c,e 3,820c,e 1,890c,e
11
p38α 2.68 × 10⁻¹⁰ 0.42 47%f
Nature Chemical Biology: doi:10.1038/nchembio.732

12
aThe aggregate motor activity of ten zebrafish embryos during the PMR assay. The y and x axes
represent the motion index and time, respectively. Red vertical bars at 10 s and 23 s represent the timing
and duration of the stimulus. bCalculated with Daylight fingerprints (note that TC values are not
comparable across different fingerprints; Daylight fingerprints usually give higher TC values than ECFP4
fingerprinting for the same compound pairs). cIC50 (nM). dEC50 (nM). eAssuming competitive inhibition, and
on the basis of the Cheng-Prusoff equation, Ki values would be about half the IC50 values for the kinase
inhibitors. f% Inhibition at 10 μM. AR, adrenergic receptor.
Nature Chemical Biology: doi:10.1038/nchembio.732

13
Supplementary Table 4 | Tested compounds that failed to show activity on the predicted molecular target.
Compound Predicted targets
E-value Ki (nM)
52
oxytocin
vasopressin 1A
1.49×10⁻²⁷
1.22×10-07
> 10,000
> 10,000
O
O
OO
N
53 (flavoxate)
5-HT4 1.50×10⁻²³ > 10,000
N
HNO
N
54
NK3 8.54×10-96 Agonist 1.8%
Antagonist 2.7%
Nature Chemical Biology: doi:10.1038/nchembio.732

14
N
N
N N
O
55
NK3 2.38×10-67 Agonist 3.1%
Antagonist 0.8%
56 (fenbendazole)
TIE-2 3.46×10⁻¹⁸ > 10,000
57 (albendazole)
TIE-2 7.53×10⁻¹⁸
> 10,000
58
CDK7
CDK9
1.92×10⁻¹³
7.19×10⁻¹³
> 10,000
> 10,000
59
CDK4
CDK7
CDK9
Aurora-A
Aurora-B
1.53×10⁻⁷
2.19×10⁻²³
1.54×10⁻¹⁸
4.69×10⁻⁵
3.88×10⁻⁸
> 10,000
> 10,000
> 10,000
> 10,000
> 10,000
60
LCK 1.01×10⁻¹⁴ > 10,000
Nature Chemical Biology: doi:10.1038/nchembio.732

15
Supplementary Figure 1 | The PMR is a behavior-based HTS screening assay in zebrafish.
(a) The aggregate motor activity of 10 zebrafish embryos during the PMR assay. The y-axis and
x-axis represent the motion index and time, respectively. Red vertical bars at 10s and 23s
represent the timing and duration of the stimulus. Dashed, solid and dotted lines indicate the
PMR background, excitation and refractory phases. (b) Image of 10 zebrafish embryos in a
single well of a 96-well plate. (c) Plots from ten independent control wells during the PMR
assay. (d) Bar plot showing the mean number ± s.d. of motor activity spikes/s during the
indicated PMR phase. (e) Four representative drugs that exhibit a specific PMR response. (f)
Plots showing the motor activity of animals in wells treated with the compounds indicated in
panel e.
Nature Chemical Biology: doi:10.1038/nchembio.732
16
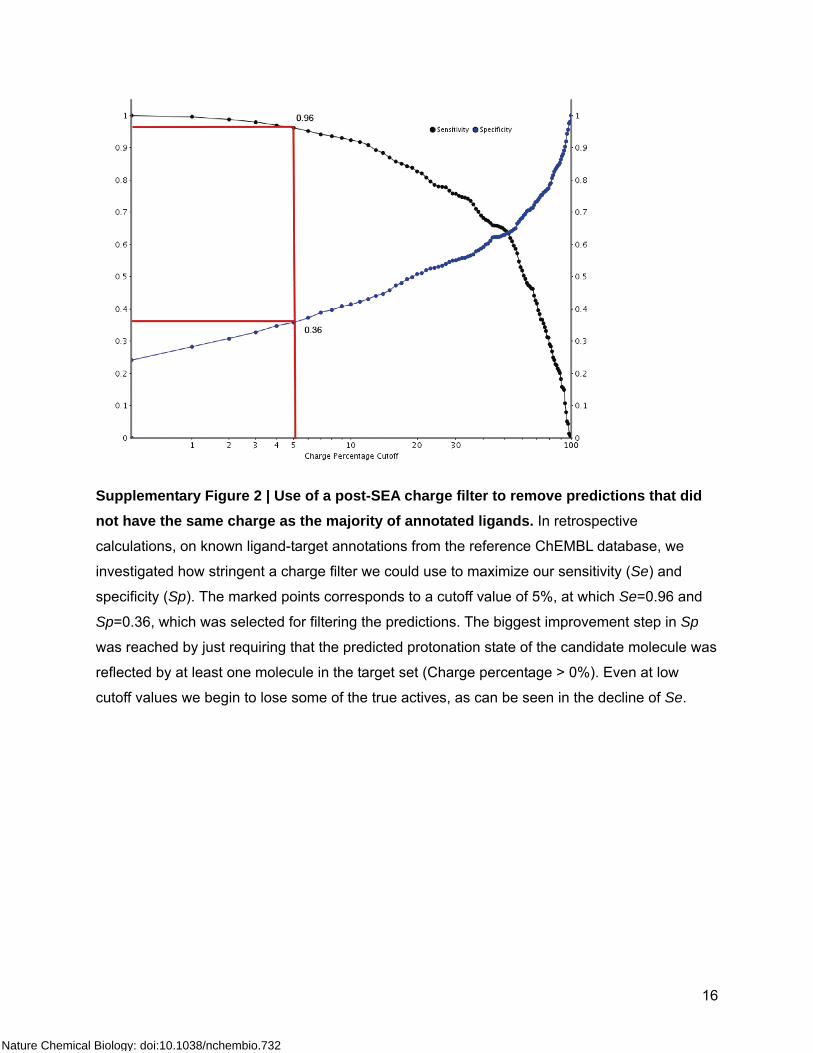
Supplementary Figure 2 | Use of a post-SEA charge filter to remove predictions that did not have the same charge as the majority of annotated ligands. In retrospective
calculations, on known ligand-target annotations from the reference ChEMBL database, we
investigated how stringent a charge filter we could use to maximize our sensitivity (Se) and
specificity (Sp). The marked points corresponds to a cutoff value of 5%, at which Se=0.96 and
Sp=0.36, which was selected for filtering the predictions. The biggest improvement step in Sp
was reached by just requiring that the predicted protonation state of the candidate molecule was
reflected by at least one molecule in the target set (Charge percentage > 0%). Even at low
cutoff values we begin to lose some of the true actives, as can be seen in the decline of Se.
Nature Chemical Biology: doi:10.1038/nchembio.732

17
Nature Chemical Biology: doi:10.1038/nchembio.732

18
Supplementary Figure 3 | Concentration-response curves for all active molecules on their predicted targets. The black curves in A-S and V are those of reference compounds that were
measured together with our compounds. For Ki and IC50 values see Table 1. Concentration
values on the x-axis of T and U are given as log micromolar. Cpd. 5 was also assayed at
α1A,B,DARs, α2A,B,CARs, and 5HT1A – these targets were predicted, but found out later to be
known.9-11 In our hands, affinities of cpd. 5 at these targets were 0.8, 8.7, 1.1, 213.8, 15.7, 80.8,
and 25.0 nM, respectively. (a) β1AR, cpd. 1 (red), 2 (blue). (b) β2AR, cpd. 1 (red), 2 (blue). (c)
β3AR, cpd. 1 (red), 2 (blue). (d) 5-HT1A, cpd. 3 (red), 4 (blue). (e) 5-HT1B, cpd. 3 (red). (f) 5-
HT1D, cpd. 3 (red), 4 (blue). (g) dopamine D2, cpd. 3 (red), 4 (blue). (h) dopamine D3, cpd. 4
(red), 5 (blue). (i) dopamine D4, cpd. 3 (red), 4 (blue). (j) α1AAR, cpd. 3 (red), 5 (blue). (k) α1BAR,
cpd. 3 (red), 5 (blue). (l) α1DAR, cpd. 3 (red), 5 (blue). (m) α2AAR, cpd. 3 (red), 5 (blue). (n)
α2BAR, cpd. 3 (red), 5 (blue). (o) α2CAR, cpd. 3 (red), 5 (blue). (p) dopamine D2, cpd. 5 (red). (q)
dopamine D4, cpd. 5 (red). (r) 5-HT1A, cpd. 5 (red). (s) vasopressin V1A, cpd. 8 (red). (t) Kv1.2,
cpd. 6. (u) Kv1.2, cpd. 7. (v) SERT, cpd. 9 (red). (w) ABL2, cpd. 10. (x) SRC, cpd. 10. (y) LCK,
cpd. 10. (z) p38α, cpd. 11.
Nature Chemical Biology: doi:10.1038/nchembio.732

19
Supplementary Figure 4 | Compound 12 phenocopies compounds 6 and 7. (a)
Dendrogram and heatmap showing hierarchical clustering of behavioral profiles from wells
treated with DMSO, compound 12 (psora-4), compound 6, or compound 7. Colorbar shows the
range of sigma values displayed in the heatmap. (b) Bar plot showing the mean number of
motor activity spikes in animals treated with DMSO or compounds 12, 7 or 6. Activities during
background, excitation and refractory phases of the PMR are shown. Error bars represent mean
values ± s.d.
Nature Chemical Biology: doi:10.1038/nchembio.732

20
Supplementary Figure 5 | Compound 1 normalizes isoproterenol (compound 13)-induced behavioral stimulation. (a-c): Heatmaps showing behavioral profiles from multiple wells
treated with (a) DMSO, (b) compound 13 (Iso), or (c) compounds 13 + 1. The colorbar shows
the range of sigma values displayed in the heatmap. (d) Bar plot showing the mean number of
motor activity spikes in animals treated with DMSO, compound 13, compounds 13 and 14 (bopin), and compounds 13 and 1. Activities during background, excitation and refractory
phases of the PMR are shown. Error bars represent mean values ± s.d.
Nature Chemical Biology: doi:10.1038/nchembio.732

21
Supplementary Figure 6 | The predicted beta antagonist compound 1 shows specific interactions with compound 13 (isoproterenol). (a) Compound 1 does not rescue the
stimulating effects of the Na+/K+ ATP-ase blocker digitoxigenin. Bar plot showing the mean
number of motor activity spikes/s in animals treated with the indicated compounds. (b)
Compound 1, but not the Na+ channel blocker benzocaine, nor the GABA-A agonist diazepam,
rescues the stimulating effects of 13. (c) Line chart showing the percentage of animals rescued
by the indicated treatments. See also Supplemetary Fig. 1 for the PMR plots of 13,
digitoxigenin, benzocaine, and diazepam.
Nature Chemical Biology: doi:10.1038/nchembio.732

22
SUPPLEMENTARY METHODS Zebrafish behavioral pharmacology. Embryos were collected from group matings of Ekwill or
TuAB zebrafish and raised in HEPES (10 mM) buffered E3 media in a dark 28 °C incubator. At
28 hpf, groups of 8-10 embryos were distributed into the wells of a 96 well plate. Compound
stocks were diluted into each well at the specified concentration and allowed to incubate for 1
hour.
To assay the PMR, 1000 frames of digital video were recorded at 33fps using a Hamamatsu
ORCA-ER camera attached to a Nikon TE200 microscope at 1X magnification. Light stimuli
(1s)—from a 300Watt xenon bulb housed in a Sutter Lambda LS illuminator— were delivered
10s and 20s after the start of the video. Instrument control and data measurement were
performed using custom programs for Metamorph Software (Universal Imaging). Each video
was saved for review.
To analyze digital video recordings, custom software scripts (Metamorph) were used to
automatically draw six evenly spaced line segments across the well such that each embryo is
likely to be crossed by one of the lines. The software then tracks the average intensity of the
pixels for each segment over time. Embryo movement changes the light intensity at some
pixels, leading to a commensurate change in the average intensity of the affected lines. A
motion index was formed by taking the absolute value of the difference in average pixel intensity
for adjacent time points and then summing over the six segments. This motion index correlates
with the overall amount of motion in the well, both in terms of contraction frequency and number
of animals in motion. The value of this motion index over time constitutes the basic behavioral
phenotype. The motion index profile for each well was partitioned into three periods—
background, excitation and refractory— based on the following landmarks: Background = start
to pulse 1, Excitation = pulse 1 to pulse 2, refractory = pulse 2 to stop.
To treat zebrafish with chemicals, stock solutions in DMSO were added to each well, mixed, and
allowed to incubate for 1h. Final DMSO concentrations were <1%. In experiments with multiple
compounds, the compounds were added simultaneously.
Hierarchical clustering of behavioral profiles. For each well, the Motion Index was divided
into six behavioral features based on time and representing the PMR background, latency, early
Nature Chemical Biology: doi:10.1038/nchembio.732
23
excitation, late excitation, early refractory and late refractory phases (B, L, E1, E2, R1, R2).
These values were then transformed to the relative number of standard deviations (sigma
values) from the control mean for each feature. These six values comprise the behavioral
profile. Behavioral profiles were clustered using Euclidean distance and average linkage
clustering.
Chemoinformatics. We used the similarity ensemble approach (SEA) algorithms to predict
candidate molecular targets for every hit compound, using a selection of Scitegic12 and
Daylight13 topological fingerprints. SEA relates proteins based on the set-wise chemical
similarity of their ligands, or single molecules to target-ligand sets, correcting for the similarity
one might expect at random, as previously described.14-16 A filtered pre-release version of the
ChEMBL database (https://www.ebi.ac.uk/chembldb/) provided a reference set of target-
annotated compounds. Pipeline Pilot version 6.1.1.0 (Accelrys) provided Scitegic fingerprints
and was used to compare some behavioral similarities. For compound clustering we used
Cytoscape 2.8 with the Cluster, Cheminformatics, and VistaClara plugins. Charges for the
charge-filtering protocol were computed with Epik 2.1107 (Schrödinger), and chemical
structures were drawn with ChemDraw 12.0.
Clustering of hits by chemical and phenotypic similarity. Chemical and phenotypic
similarities were computed with Pipeline Pilot as Tanimoto values based on ECFP4 fingerprints
and Euclidean distance values based on the behavioral σ values for the different time slots,
respectively. Chemical distances above 0.72 and behavioral distances above 0.4 were
discarded. The compounds, their phenotypic profiles and remaining pairwise distance values
were imported into Cytoscape and clustered with Markov (MCL) and Transitivity Clustering
methods using chemical similarities. Several interesting clusters of compounds sharing both
chemical and behavioral similarities emerged, which helped us in prioritizing compounds that
were inspected for their predicted targets.
Target prediction using SEA. For each compound active in the behavioral screen, possible
targets were calculated with SEA, using Scitegic ECFP4, ECFP6, FCFP4, and FCFP6,12 as well
as Daylight fingerprints13 with the widely used Tanimoto coefficient (TC)17 as similarity metric.
Unless otherwise noted, numbers in the manuscript are given for the ECFP4 results. The
ChEMBL database (https://www.ebi.ac.uk/chembldb/) was filtered for compounds annotated for
protein targets with affinity values below 10μM and at least five molecules annotated for each
Nature Chemical Biology: doi:10.1038/nchembio.732

24
target. Only compound-target predictions that were not already known in ChEMBL were
considered. Initial predictions were filtered with a charge-filter protocol: for a given target, all
protonation states with a better than a 1% likelihood were calculated for each target compound
at pH 6-8. The most likely protonation state at pH 6-8 of predicted compounds also was
calculated. A compound-target prediction was only kept if the primary protonation state of the
candidate molecule was represented in at least 5% of the target set compounds
(Supplementary Fig. 2). As an additional guide during visual inspection, targets were annotated
with biological process information from the Gene Ontology (GO) database
(http://www.geneontology.org) and pathway information from the Reactome database
(http://www.reactome.org).
Ligands selected for target identification. Selected hits from our SEA prediction that passed
a visual inspection and had testable targets were sourced from the following commercial
vendors: compounds 1, 3, 4, 6-8, 10, 11, and 52, 54, 55, 58, and 60 were ordered from
ChemBridge, compound 2 from Life Chemicals, compound 5 from Tocris, compounds 9, 56, and
57 from Sigma-Aldrich, compound 53 from MP Biomedicals, and compound 59 from Otava
Chemicals. All compounds were sourced at 95% or greater purity as described by the vendors.
All active compounds were further tested at UCSF for purity by LC/MS, and all were found to be
pure as judged by peak height and identity. For the phenocopy and phenotype inversion
experiments, compounds 12 and 13 were sourced from Sigma-Aldrich and compound 14 from
Enzo Life Sciences, at 98% or greater purity grades.
Radioligand competition binding assays of compounds 1-5, 8, 52 and 53. Crude P2
(21,000 x g) membrane preparations were prepared from cell lines expressing (either stably or
transiently) recombinant human GPCRs using 50 mM Tris, 1% BSA, pH 7.4 at a concentration
of ca. 50 μg protein/μL (assayed by Bradford assay using BSA as a standard). Next, 50 μL of
membrane suspension were added to the wells of a 96-well plate containing 100 μL of binding
assay buffer, 50 μL of radioligand at a concentration equal to five times the dissociation constant
(Kd) for the receptor being assayed, and 50 μL of test drug or reference compound at a
concentration equal to five times the desired assay concentration (Supplementary Table 5).
Reactions were incubated for 60 to 90 min at room temperature in the dark, and then harvested
onto 0.3% PEI-treated GF/A filtermats (Wallac). After three washes with ice-cold wash buffer (50
mM Tris, pH 7.4), filter mats were dried in a microwave oven and impregnated with Meltilex
scintillant (Wallac). Residual binding of radioligand, measured by scintillation counting using a
Nature Chemical Biology: doi:10.1038/nchembio.732
25
TriLux microbeta counter (Wallac), was fit to the one-site radioligand competition binding model
(i.e., a three-parameter logistic equation) in Prism 4.0 (GraphPad) to obtain log IC50 values.
Affinity constants (Ki values) were calculated from best-fit IC50 values using the Cheng-Prusoff
approximation.
Functional Agonist/Antagonist Assays of compounds 54 and 55. HEK293 cells stably
expressing recombinant human NK3 receptors were plated in poly-L-lysine-coated 384-well
plates at a density of 20,000 cells per well in DMEM containing 1% dialyzed fetal bovine serum.
The next day, the cell culture media was replaced with 20 μl/well of HBSS, 20 mM HEPES, 2.5
mM probenecid, pH 7.4 (assay buffer) containing 1X Fluo4 direct calcium assay reagent
(Invitrogen). After a one-hour incubation at 37˚C, the plates were loaded into a FLIPR Tetra
(MDS) and the baseline fluorescence was read for 10 sec (1 read/sec). To measure agonist
activity, the cells were stimulated with 10 μL of 3X test drug or reference compound (substance
P) prepared in assay buffer, and calcium responses (fold over baseline) were recorded for 180
sec (1 read/sec). To assess antagonist activity, the cells were treated with test compound or
buffer and incubated for 6 min, after which the cells were challenged with agonist (substance P)
at a concentration equal to the EC90 at the receptor being assayed.
Electrophysiological studies of compounds 6 and 7. For these recordings, 10ng of rat Kv1.2
mRNA (T7 mMessenger, Ambion) were microinjected into defolliculated stage V-VI Xenopus
laevis oocytes.18 Two-electrode voltage clamp recordings were performed 24 hours post-
injection in a bath of 90K solution (90 mM KCl, 2.0 mM MgCl2, 10mM HEPES pH 7.5) using
standard microelectrodes (0.3 to 3 MΩ) filled with 3M KCl. Currents were recorded using a
GeneClamp 500B amplifier (Axon Instruments) controlled by a 1200 MHz processor computer
(Celeron Gateway) running CLAMPEX 8.2.0.244. Currents were digitized at 1 kHz with Digidata
1332A (Axon Instruments) and analyzed with Clampfit 8.2 (Axon Instruments).To generate
concentration-response curves, membrane potential was held at -80mV and depolarized from -
100 to +30mV in 10mV steps, followed by a tail current command of -80mV. Current amplitudes
were compared at +30mV after application of various compound concentrations for 1300msec,
and the data were fitted using the Hill equation: I=Imin + (Imax-Imin)/[1+([inh]/IC50)H], where I is the
percentage of remaining current in the presence of the inhibitor, Imax and Imin are maximal and
minimal current values respectively, [inh] represents the inhibitor concentration and H is the Hill
coefficient. Each data point represents the mean of four to seven independent measurements
and error bars indicate SEM.
Nature Chemical Biology: doi:10.1038/nchembio.732

26
Inhibition of SERT uptake by compound 9. Substrate uptake into HEK-SERT cells treated
with vehicle, compound 9, or reference compounds was assessed using the Molecular Devices
Transporter Explorer Kit following the manufacturer’s protocol. Compound 9 inhibited substrate
uptake by HEK-SERT cells with a potency similar to that of cocaine. HEK cells not expressing
SERT exhibited no specific substrate uptake (i.e., fluorescence values were comparable to
those observed in HEK-SERT cells treated with 10 μM fluoxetine). Furthermore, compound 9
exhibited an IC50 > 10 μM for substrate uptake by HEK-DAT cells, suggesting that the effect
seen in HEK-SERT cells reflects compound activity at SERT itself and not modulation of some
other component of transporter activity (e.g., ion gradients, ATP, etc.).
Off-chip Mobility Shift Assay (MSA) for compounds 10, 11, and 56-60. Assays were
performed by CarnaBio using the following procedure: The 5 μL of x4 compound solution, 5 μL
of x4 substrate/ATP/Metal solution, and 10 μL of x2 kinase solution were prepared with assay
buffer (20 mM HEPES, 0.01% Triton X-100, 2 mM DTT, pH7.5) and mixed and incubated in a
well of a polypropylene 384 well microplate for 1 or 5 hours at room temperature (depending on
the kinase). To stop the reactions, 60 μL of Termination Buffer (QuickScout Screening Assist
MSA; Carna Biosciences) were added to the well. The reaction mixture was applied to a
LabChip3000 system (Caliper Life Science), and the product and substrate peptide peaks were
separated and quantitated. Substrate-to-product conversion was calculated from the peak
heights of the product(P) and substrate(S) peptides as P/(P+S). Detailed reaction conditions are
given in Supplementary Table 6.
Nature Chemical Biology: doi:10.1038/nchembio.732

27
Supplementary Table 5 | Assay conditions for GPCR radioligand competition binding assays.
Receptor Binding Assay Buffer Reference Radioligand
α1A 20 mM Tris, 145 mM NaCl, pH 7.4 Prazosin [125I]HEAT
α1B 20 mM Tris, 145 mM NaCl, pH 7.4 Prazosin [125I]HEAT
α1D 20 mM Tris, 145 mM NaCl, pH 7.4 Prazosin [125I]HEAT
α2A 50 mM Tris, 5 mM MgCl2, pH 7.7 Prazosin [125I]Clonidine
α2B 50 mM Tris, 5 mM MgCl2, pH 7.7 Prazosin [125I]Clonidine
α2C 50 mM Tris, 5 mM MgCl2, pH 7.7 Prazosin [125I]Clonidine
β1 50 mM Tris, 3 mM MnCl2, pH 7.7 Alprenolol [125I]Pindolol
β2 50 mM Tris, 3 mM MnCl2, pH 7.7 Alprenolol [125I]Pindolol
β 3 50 mM Tris, 3 mM MnCl2, pH 7.7 Alprenolol [125I]Pindolol
D2 20 mM HEPES, 100 mM NMDG, 10 mM
MgCl2, 1 mM EDTA, 1 mM EGTA, pH 7.4
Haloperidol [3H]N-
methylspiperone
D3 20 mM HEPES, 100 mM NMDG, 10 mM
MgCl2, 1 mM EDTA, 1 mM EGTA, pH 7.4
Chlorpromazine [3H]N-
methylspiperone
D4 20 mM HEPES, 100 mM NMDG, 10 mM
MgCl2, 1 mM EDTA, 1 mM EGTA, pH 7.4
Chlorpromazine [3H]N-
methylspiperone
5-HT1A 50 mM Tris, 10 mM MgCl2, 0.1 mM EDTA,
pH 7.4
Methysergide [3H]8-OH-DPAT
5-HT1B 50 mM Tris, 10 mM MgCl2, 0.1 mM EDTA,
pH 7.4
Ergotamine [3H]5-CT
5-HT1D 50 mM Tris, 10 mM MgCl2, 0.1 mM EDTA,
pH 7.4
Ergotamine [3H]5-CT
5-HT4 50 mM Tris, 10 mM MgCl2, 0.1 mM EDTA,
pH 7.4
GR113808 [3H]GR113808
Nature Chemical Biology: doi:10.1038/nchembio.732

28
OT 20 mM Tris, 100 mM NaCl, 10 mM MgCl2,
0.1 mg/ml bacitracin, 1 mg/ml BSA, pH 7.4
Oxytocin [3H]Oxytocin
V1A 20 mM Tris, 100 mM NaCl, 10 mM MgCl2,
0.1 mg/ml bacitracin, 1 mg/ml BSA, pH 7.4
Arg-
Vasopressin
[3H]Arg-
Vasopressin
Supplementary Table 6 | Assay conditions for kinase mobility shift assays. Substrate ATP (µM) Metal
Kinase Name (nM) Km Assay Name (mM)
Positive controlReaction
time (hr)
ARG (ABL2) ABLtide 1000 24 25 Mg 5 Staurosporine 1
LCK Srctide 1000 14 10 Mg 5 Staurosporine 1
SRC Srctide 1000 31 50 Mg 5 Staurosporine 1
TIE2 Blk/Lyntide 1000 94 100 Mg 5 Staurosporine 1
AurA Kemptide 1000 27 25 Mg 5 Staurosporine 1
AurB/INCENP Kemptide 1000 16 25 Mg 5 Staurosporine 1
CDK4/CycD3 DYRKtide-F 1000 200 200 Mg 5 Staurosporine 5
CDK7/CycH/MAT1 CTD3 peptide 1000 32 50 Mg 5 Staurosporine 5
CDK9/CycT1 CDK9 substrate 1000 9.4 10 Mg 5 Staurosporine 5
p38α Modified Erktide 1000 150 150 Mg 5 SB202190 1
Nature Chemical Biology: doi:10.1038/nchembio.732

29
SUPPLEMENTARY REFERENCES
1. Teh, M.T. & Sugden, D. Naunyn Schmiedebergs Arch. Pharmacol. 358, 522-8 (1998).
2. Durieux, S. et al. Bioorg. Med. Chem. 17, 2963-74 (2009).
3. Cohen, C.J., Spires, S. & Van Skiver, D. J. Gen. Physiol. 100, 703-28 (1992).
4. Gross, G., Hanft, G. & Kolassa, N. Naunyn Schmiedebergs Arch. Pharmacol. 336, 597-
601 (1987).
5. Dyson, H.J., Rance, M., Houghton, R.A., Lerner, R.A. & Wright, P.E. J. Mol. Biol. 201,
161-200 (1988).
6. Barton, A.C. et al. Brain Res. 547, 199-207 (1991).
7. Markstein, R. et al. in Progress in Catecholamine Research, Part B: Central Aspects,
Vol. Neurology and Neurobiology 42B (eds. Sandler, M., Dahlstrom, A. & Belmaker,
R.H.) 59-64 (Alan Liss, New York, 1988).
8. Temperini, C., Cecchi, A., Scozzafava, A. & Supuran, C.T. Bioorg. Med. Chem. 17, 1214-
21 (2009).
9. Montorsi, M., Menziani, M.C., Cocchi, M., Fanelli, F. & De Benedetti, P.G. Methods 14,
239-54 (1998).
10. Blaxall, H.S., Murphy, T.J., Baker, J.C., Ray, C. & Bylund, D.B. J. Pharmacol. Exp. Ther.
259, 323-9 (1991).
11. Meana, J.J., Callado, L.F., Pazos, A., Grijalba, B. & Garcia-Sevilla, J.A. Eur. J.
Pharmacol. 312, 385-8 (1996).
12. Rogers, D. & Hahn, M. J. Chem. Inf. Model. 50, 742-54 (2010).
13. James, C., Weininger, D. & Delany, J. Daylight Theory Manual (Daylight Chemical
Information Systems Inc., 2011).
14. Keiser, M.J. et al. Nat. Biotechnol. 25, 197-206 (2007).
15. Hert, J., Keiser, M.J., Irwin, J.J., Oprea, T.I. & Shoichet, B.K. J. Chem. Inf. Model. 48,
755-65 (2008).
16. Keiser, M.J. et al. Nature 462, 175-81 (2009).
17. Willett, P., Barnard, J.M. & Downs, G.M. J. Chem. Inf. Comput. Sci. 38, 983-996 (1998).
18. Minor, D.L. et al. Cell 102, 657-70 (2000).
Nature Chemical Biology: doi:10.1038/nchembio.732