chemical kinetics and - xiamen universitychemical kinetics and reaction dynamics santosh k. upadhyay...
TRANSCRIPT


Chemical Kinetics andReaction Dynamics

Chemical Kinetics andReaction Dynamics
Santosh K. UpadhyayDepartment of Chemistry
Harcourt Butler Technological InstituteKanpur-208 002, India
Anamaya
A C.I.P. catalogue record for the book is available from the Library of Congress
ISBN 1-4020-4546-8 (HB)ISBN 1-4020-4547-6 (e-book)
Copublished by Springer233 Spring Street, New York 10013, USAwith Anamaya Publishers, New Delhi, India
Sold and distributed in North, Central and South America bySpringer, 233 Spring Street, New York, USA
In all the countries, except India, sold and distributed bySpringer, P.O. Box 322, 3300 AH Dordrecht, The Netherlands
In India, sold and distributed by Anamaya PublishersF-154/2, Lado Sarai, New Delhi-110 030, India
All rights reserved. This work may not be translated or copied in whole or in partwithout the written permission of the publisher (Springer Science+Business Media,Inc., 233 Spring Street, New York, 10013, USA), except for brief excerpts in connectionwith reviews or scholarly adaptation, computer software, or by similar or dissimilarmethodology now known or hereafter developed is forbidden.
The use in this publication of trade names, trademarks, service marks and similar terms,even if they are not identified as such, is not to be taken as an expression of opinion asto whether or not they are subject to proprietary rights.
Copyright © 2006 Anamaya Publishers
9 8 7 6 5 4 3 2 1
springeronline.com
Printed in India.

To
My Mother

Preface
Reaction dynamics is the part of chemical kinetics which is concerned withthe microscopic-molecular dynamic behavior of reacting systems. Molecularreaction dynamics is coming of age and much more refined state-to-stateinformation is becoming available on the fundamental reactions. Thecontribution of molecular beam experiments and laser techniques to chemicaldynamics has become very useful in the study of isolated molecules andtheir mutual interactions not only in gas surface systems, but also in solute-solution systems.
This book presents the important facts and theories relating to the rateswith which chemical reactions occur and covers main points in a manner sothat the reader achieves a sound understanding of the principles of chemicalkinetics. A detailed stereochemical discussion of the reaction steps in eachmechanism and their relationship with kinetic observations has been considered.
I would like to take the opportunity to thank Professor R.C. Srivastavaand Professor N. Sathyamurthy with whom I had the privilege of workingand who inspired my interest in the subject and contributed in one way oranother to help complete this book. I express my heavy debt of gratitudetowards Professor M.C. Agrawal who was gracious enough for sparing timeout of his busy schedule to go through the manuscript. His valuable commentsand suggestions, of course, enhanced the value and importance of this book.I also express my gratitude to my colleagues, friends and research students,especially Dr. Neelu Kambo who took all the pains in helping me in preparing,typing and checking the manuscript.
Finally, I thank my wife Mrs. Manju Upadhyay, daughter Neha and sonAnkur for their continuous inspiration during the preparation of the text.
SANTOSH K. UPADHYAY

Contents
Preface vii
1. Elementary 11.1 Rate of Reaction 1
1.1.1 Experimental Determination of Rate 21.2 Rate Constant 31.3 Order and Molecularity 41.4 Rate Equations 6
1.4.1 Integral Equations for nth Order Reaction of a SingleReactant 6
1.4.2 Integral Equations for Reactions Involving More thanOne Reactants 7
1.5 Half-life of a Reaction 81.6 Zero Order Reactions 101.7 First Order Reactions 121.8 Radioactive Decay as a First Order Phenomenon 171.9 Second Order Reactions 201.10 Third Order Reactions 281.11 Determination of Order of Reaction 30
1.11.1 Integration Method 301.11.2 Half-life Period Method 341.11.3 Graphical Method 341.11.4 Differential Method 351.11.5 Ostwald Isolation Method 35
1.12 Experimental Methods of Chemical Kinetics 391.12.1 Conductometric Method 391.12.2 Polarographic Technique 401.12.3 Potentiometric Method 411.12.4 Optical Methods 421.12.5 Refractometry 421.12.6 Spectrophotometry 43Exercises 44
2. Temperature Effect on Reaction Rate 462.1 Derivation of Arrhenius Equation 46

2.2 Experimental Determination of Energy of Activation andArrhenius Factor 48
2.3 Potential Energy Surface 502.4 Significance of Energy of Activation 51
Exercises 53
3. Complex Reactions 553.1 Reversible Reactions 55
3.1.1 Reversible Reaction When Both the OpposingProcesses are Second Order 57
3.2 Parallel Reactions 593.2.1 Determination of Rate Constants 59
3.3 Consecutive Reactions 633.3.1 Concentration-Time Relation 64
3.4 Steady-State Treatment 663.5 Chain Reactions 67
3.5.1 Rate Determination 683.5.2 Reaction between H2 and Br2 693.5.3 Chain Length 703.5.4 Chain Transfer Reactions 703.5.5 Branching Chain Explosions 703.5.6 Kinetics of Branching Chain Explosion 713.5.7 Free Radical Chains 723.5.8 Chain Length and Activation Energy in Chain
Reactions 75Exercises 76
4. Theories of Reaction Rate 794.1 Equilibrium and Rate of Reaction 794.2 Partition Functions and Statistical Mechanics of
Chemical Equilibrium 804.3 Partition Functions and Activated Complex 824.4 Collision Theory 83
4.4.1 Collision Frequency 844.4.2 Energy Factor 864.4.3 Orientation Factor 874.4.4 Rate of Reaction 874.4.5 Weakness of the Collision Theory 88
4.5 Transition State Theory 894.5.1 Thermodynamic Approach 914.5.2 Partition Function Approach 934.5.3 Comparison with Arrhenius Equation and Collision
Theory 934.5.4 Explanation for Steric Factor in Terms of Partition
Function 94
x Contents

4.5.5 Reaction between Polyatomic Molecules 954.6 Unimolecular Reactions and the Collision Theory 100
4.6.1 Lindemann’s Mechanism 1004.6.2 Hinshelwood Treatment 1034.6.3 Rice and Ramsperger, and Kassel (RRK) Treatment 1054.6.4 Marcus Treatment 1064.6.5 RRKM Theory 107
4.7 Kinetic and Thermodynamic Control 1094.8 Hammond’s Postulate 1104.9 Probing of the Transition State 111
Exercises 113
5. Kinetics of Some Special Reactions 1155.1 Kinetics of Photochemical Reactions 115
5.1.1 Grotthuss-Draper Law 1155.1.2 Einstein Law of Photochemical Equivalence 1155.1.3 Primary Process in Photochemical Reactions 1165.1.4 H2-Br2 Reaction 1185.1.5 H2 and Cl2 Reaction 119
5.2 Oscillatory Reactions 1205.2.1 Belousov-Zhabotinskii Reaction 122
5.3 Kinetics of Polymerization 1245.3.1 Step Growth Polymerization 1255.3.2 Polycondensation Reactions (in Absence of the
Catalyst) 1255.3.3 Acid Catalyzed Polycondensation Reaction 1265.3.4 Chain Growth Polymerization 1275.3.5 Kinetics of Free Radical Polymerization 1275.3.6 Cationic Polymerization 1305.3.7 Anionic Polymerization 1315.3.8 Co-polymerization 132
5.4 Kinetics of Solid State Reactions 1355.5 Electron Transfer Reactions 139
5.5.1 Outer Sphere Mechanism 1395.5.2 Inner Sphere Mechanism 140Exercises 141
6. Kinetics of Catalyzed Reactions 1426.1 Catalysis 142
6.1.1 Positive Catalysis 1426.1.2 Negative Catalysis 1436.1.3 Auto Catalysis 1436.1.4 Induced Catalysis 1446.1.5 Promoters 144
Contents xi

6.1.6 Poisons 1446.2 Theories of Catalysis 145
6.2.1 Intermediate Compound Formation Theory 1456.2.2 Adsorption Theory 145
6.3 Characteristics of Catalytic Reactions 1466.4 Mechanism of Catalysis 1476.5 Activation Energies of Catalyzed Reactions 1496.6 Acid Base Catalysis 1506.7 Enzyme Catalysis 152
6.7.1 Influence of pH 1546.8 Heterogeneous Catalysis 1566.9 Micellar Catalysis 159
6.9.1 Models for Micellar Catalysis 1616.10 Phase Transfer Catalysis 165
6.10.1 General Mechanism 1666.10.2 Difference between Micellar and Phase Transfer-
Catalyzed Reactions 1676.11 Kinetics of Inhibition 168
6.11.1 Chain Reactions 1686.11.2 Enzyme Catalyzed Reactions 1696.11.3 Inhibition in Surface Reactions 172Exercises 173
7. Fast Reactions 1757.1 Introduction 1757.2 Flow Techniques 176
7.2.1 Continuous Flow Method 1777.2.2 Accelerated Flow Method 1787.2.3 Stopped Flow Method 178
7.3 Relaxation Method 1797.4 Shock Tubes 1817.5 Flash Photolysis 1827.6 ESR Spectroscopic Technique 1837.7 NMR Spectroscopic Techniques 183
Exercises 184
8. Reactions in Solutions 1858.1 Introduction 1858.2 Theory of Absolute Reaction Rate 1858.3 Influence of Internal Pressure 1878.4 Influence of Solvation 1878.5 Reactions between Ions 1878.6 Entropy Change 1898.7 Influence of Ionic Strength (Salt Effect) 190
xii Contents

8.8 Secondary Salt Effect 1928.9 Reactions between the Dipoles 1938.10 Kinetic Isotope Effect 1958.11 Solvent Isotope Effect 1978.12 Hemmett Equation 1988.13 Linear Free Energy Relationship 1998.14 The Taft Equation 2008.15 Compensation Effect 201
Exercises 202
9. Reaction Dynamics 2049.1 Molecular Reaction Dynamics 2049.2 Microscopic-Macroscopic Relation 2059.3 Reaction Rate and Rate Constant 2079.4 Distribution of Velocities of Molecules 2099.5 Rate of Reaction for Collisions with a Distribution of
Relative Speeds 2099.6 Collision Cross Sections 210
9.6.1 Cross Section for Hard Sphere Model 2109.6.2 Collision between Reactive Hard Spheres 211
9.7 Activation Energy 2139.8 Potential Energy Surface 216
9.8.1 Features of Potential Energy Surface 2199.8.2 Ab initio Calculation of Potential Energy Surface 2229.8.3 Fitting of ab initio Potential Energy Surfaces 2259.8.4 Potential Energy Surfaces for Triatomic Systems 226
9.9 Classical Trajectory Calculations 2299.9.1 Initial State Properties 2309.9.2 Final State Properties 2329.9.3 Calculation of Reaction Cross Section 232
9.10 Potential Energy Surface and Classical Dynamics 2349.11 Disposal of Excess Energy 2399.12 Influence of Rotational Energy 2409.13 Experimental Chemical Dynamics 241
9.13.1 Molecular Beam Technique 2419.13.2 Stripping and Rebound Mechanisms 2439.13.3 State-to-State Kinetics 244
Suggested Readings 247Index 251
Contents xiii

Chemical Kinetics andReaction Dynamics

1Elementary
Chemical kinetics deals with the rates of chemical reactions, factors whichinfluence the rates and the explanation of the rates in terms of the reactionmechanisms of chemical processes.
In chemical equilibria, the energy relations between the reactants and theproducts are governed by thermodynamics without concerning the intermediatestates or time. In chemical kinetics, the time variable is introduced and rateof change of concentration of reactants or products with respect to time isfollowed. The chemical kinetics is thus, concerned with the quantitativedetermination of rate of chemical reactions and of the factors upon which therates depend. With the knowledge of effect of various factors, such asconcentration, pressure, temperature, medium, effect of catalyst etc., on reactionrate, one can consider an interpretation of the empirical laws in terms ofreaction mechanism. Let us first define the terms such as rate, rate constant,order, molecularity etc. before going into detail.
1.1 Rate of ReactionThe rate or velocity of a reaction may be expressed in terms of any one of thereactants or any one of the products of the reaction.
The rate of reaction is defined as change in number of molecules ofreactant or product per unit time, i.e.
Rate of reaction = – = R pdndt
dndt
(1.1)
where dnR and dnp are the changes in number of molecules of reactant andproduct, respectively, for a small time interval dt. The reactant is beingconsumed, i.e. number of molecules of reactant decreases with time. Hence,minus sign is attached so that rate will be positive numerically. For comparingthe rates of various reactions, the volume of reaction system must be specifiedand rate of reaction is expressed per unit volume. If Vt is the volume ofreaction mixture, then
Rate of reaction = – 1 = 1t
R
t
p
Vdndt V
dndt
(1.2)
2 Chemical Kinetics and Reaction Dynamics
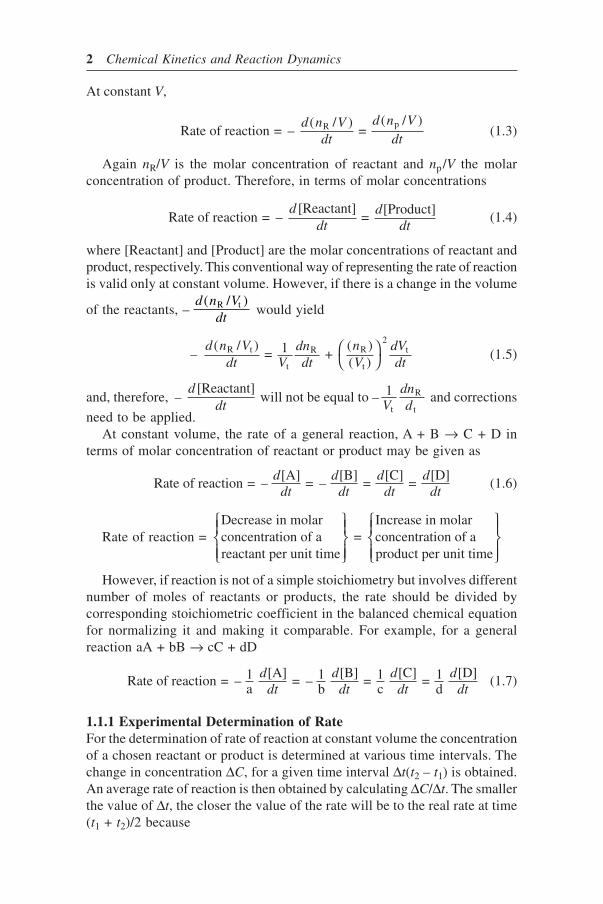
At constant V,
Rate of reaction = – ( / )
= ( / )R pd n V
dtd n V
dt(1.3)
Again nR/V is the molar concentration of reactant and np/V the molarconcentration of product. Therefore, in terms of molar concentrations
Rate of reaction = – [Reactant]
= [Product]d
dtd
dt(1.4)
where [Reactant] and [Product] are the molar concentrations of reactant andproduct, respectively. This conventional way of representing the rate of reactionis valid only at constant volume. However, if there is a change in the volume
of the reactants, –d n V
dt( / )R t would yield
–d n V
dt Vdndt
nV
dVdt
( / ) = 1 +
( )( )
R t
t
R R
t
2t⎛
⎝⎞⎠ (1.5)
and, therefore, –[Reactant]d
dt will not be equal to – 1
t
R
tVdnd
and corrections
need to be applied.At constant volume, the rate of a general reaction, A + B → C + D in
terms of molar concentration of reactant or product may be given as
Rate of reaction = –[A]
= –[B]
= [C]
= [D]d
dtd
dtd
dtd
dt(1.6)
Rate of reaction = Decrease in molarconcentration of areactant per unit time
= Increase in molarconcentration of aproduct per unit time
⎧⎨⎪
⎩⎪
⎫⎬⎪
⎭⎪
⎧⎨⎪
⎩⎪
⎫⎬⎪
⎭⎪
However, if reaction is not of a simple stoichiometry but involves differentnumber of moles of reactants or products, the rate should be divided bycorresponding stoichiometric coefficient in the balanced chemical equationfor normalizing it and making it comparable. For example, for a generalreaction aA + bB → cC + dD
Rate of reaction = – 1a
[A] = – 1
b[B]
= 1c
[C] = 1
d[D]d
dtd
dtd
dtd
dt(1.7)
1.1.1 Experimental Determination of RateFor the determination of rate of reaction at constant volume the concentrationof a chosen reactant or product is determined at various time intervals. Thechange in concentration ∆C, for a given time interval ∆t(t2 – t1) is obtained.An average rate of reaction is then obtained by calculating ∆C/∆t. The smallerthe value of ∆t, the closer the value of the rate will be to the real rate at time(t1 + t2)/2 because

Elementary 3
lim 0∆
∆∆t
Ct
dCdt→
→ (1.8)
The rate of reaction can also be obtained by plotting concentration ofreactant or product against time and measuring the slope of the curve (dc/dt)at the required time. The rate of reaction obtained from such method isknown as instantaneous rate. The concentration of the reactant or productvaries exponentially or linearly with time as shown in Fig. 1.1.
Slope = [ ]d R
dt
Slope = [ ]d P
dt
Time
[Rea
ctan
t]
[Pro
duct
]
Time
a
Fig. 1.1 Concentration variation of the reactant/product with time.
For determination of the instantaneous rate at any point a, the slope of thecurve is determined. It may also be noted from Fig. 1.1 that if the concentrationvaries linearly with time, the slope of the curve or rate of the reaction willremain same throughout the course of reaction. However, if concentration ofthe reactant or product varies exponentially with time the slope of the curveor the rate of reaction will be different at different time intervals. Thus, it isnot necessary that rate of reaction may always remain same throughout thecourse of reaction. The reaction may proceed with a different rate in theinitial stage and may have different rate in the middle or near the end of thereaction.
In place of concentration of reactant or product any physical property,which is directly related with concentration, such as viscosity, surface tension,refractive index, absorbance etc. can be measured for the determination ofthe rate of reaction.
1.2 Rate ConstantFor a general reaction
aA + bB → cC + dD
the rate is proportional to [A]a × [B]b, i.e.
Rate = k [A]a [B]b (1.9)
where proportionality constant k, relating rate with concentration terms, isknown as rate constant or velocity constant at a given temperature.
When the reactants are present at their unit concentrations,
Rate = k

4 Chemical Kinetics and Reaction Dynamics
Thus, the rate constant is the rate of reaction when concentrations of thereactants are unity. The rate constant under these conditions is also known asthe specific rate or the rate coefficient. The rate constant for any reaction canbe determined
(i) either by measuring the rate of the reaction at unit concentrations ofthe reactants.
(ii) or by knowing the rate at any concentration of reactant using therelation
Rate constant = Rate/ [A]a [B]b (1.10)
The rate constant is measured in units of moles dm–3 sec–1/(moles dm–3)n,where n = a + b. Time may also be in minutes or hours. It should be notedthat in case where the reaction is slow enough, the thermal equilibrium willbe maintained due to constant collisions between the molecules and k remainsconstant at a given temperature. However, if the reaction is very fast the tailpart of the Maxwell-Boltzmann distribution will be depleted so rapidly thatthermal equilibrium will not be re-established. In such cases rate constantwill not truly be constant and it should be called a rate coefficient.
1.3 Order and MolecularityFor reaction
αA + βB + . . . → Product
rate of reaction is proportional to αth power of concentration of A, to the βth
power of concentration of B etc., i.e.
Rate = k [A]α [B]β . . . (1.11)
Then the reaction would be said to be αth order with respect to A, βth orderwith respect to B, . . . and the overall order of reaction would be α + β +. . . . Thus, order of reaction with respect to a reactant is the power to whichthe concentration of the reactant is raised into the rate law, and the overallorder of reaction is the sum of the powers of the concentrations involved inthe rate law.
The term ‘molecularity’ is the sum of stoichiometric coefficients of reactantsinvolved in the stoichiometric equation of the reaction. For example, a reactionwhose stoichiometric equation is
2A + 3B == 3C + 2D
the stoichiometric coefficient of A and B are 2 and 3, respectively, and,therefore, the molecularity would be 2 + 3 = 5.
There is not necessarily a simple relationship between molecularity andorder of reaction. For differentiating between molecularity and order of areaction, let us consider some examples.
For the reaction, A + 2B → P, the molecularity is 1 + 2 = 3. If the reaction

Elementary 5
occurs in a single step the order of reaction with respect to A would be oneand order with respect to B would be two, giving overall order of reaction 3.Thus the molecularity and order would be same. However, if the reactionoccurs in two different steps giving overall same reaction, e.g.
(a) A + B = I → Slow
(b) I + B = P fastA + 2B P
→→
Now the rate of reaction will be governed by only slow step (a) and order ofreaction would be one with respect to each reactant, A and B, giving overallorder two. And, therefore, the order and molecularity will be different.
The inversion of cane sugar is
C12H22O11 + H2O → C6H12O6 + C6H12O6
and the rate of inversion is given by
Rate = k [Sucrose] [H2O] (1.12)
This reaction seems to be second order, i.e. first order with respect to eachsucrose and H2O. The [H2O] is also constant as it is used as solvent andpresent in large amount. Therefore, the reaction is only first order withrespect to sucrose.
The hydrolysis of ester in presence of acid is first order reaction (keepingcatalyst constant)
CH3COOC2H5 + H2O [H ] +⎯ →⎯ CH3COOH + C2H5OH
Since [H2O] remain constant as in case of inversion of cane sugar, it does noteffect the rate of reaction and reaction is simply first order with respect toester. However, the hydrolysis of ester in presence of alkali
CH2COOC2H5 + NaOH → CH3COONa + C2H5OH
is second order being first order with respect to both ester and NaOH. Whilethe molecularity of the reaction in each case, i.e. in hydrolysis of ester inpresence of acid as well as in presence of alkali, is two.
The reactions, in which molecularity and order are different due to thepresence of one of the reactant in excess, are known as pseudo-order reactions.The word (pseudo) is always followed by order. For example, inversion ofcane sugar is pseudo-first order reaction.
The molecularity will always be a whole integer while order may be aninteger, fraction or even a negative number. Molecularity is a theoreticalconcept, whereas order is empirical. Molecularity is, therefore, less significantas far as kinetic studies are concerned.
The order of reaction provides the basis for classifying reactions. Generally,the order of reaction can be anywhere between zero and three. Reactionshaving order three and above are very rare and can be easily counted.

6 Chemical Kinetics and Reaction Dynamics
The rate of a chemical reaction is proportional to the number of collisionstaking place between the reacting molecules and the chances of simultaneouscollision of reacting molecules will go on decreasing with an increase innumber of molecules. The possibility of four or more molecules comingcloser and colliding with one another at the same time is much less than incase of tri- or bi molecular reactions. Therefore, the reactions having orderfour or more are practically impossible. Further, many reactions which appearto be quite complex proceed in stepwise changes involving maximum two orthree species. The stoichiometric representation has no relation either withthe mechanism of reaction or with the observed order of reaction.
In older literature the terms unimolecular, bimolecular and termolecularhave been used to indicate the number of molecules involved in a simplecollision process and should not be confused with first, second and thirdorder reactions.
1.4 Rate EquationsFor a reaction
nA k→ Product
The rate is related with concentration of A with the following differentialform of equation
Rate = – [A]
= [A]d
dtk n (1.13)
or log –[A]
= log + log [A]d
dtk n⎛
⎝⎞⎠ (1.14)
where k is the rate constant.As discussed previously the rate is determined by drawing a graph between
concentration and time and taking the slope corresponding to a concentration.If we have the values of the rates for various concentrations, we can find theorder of reaction by plotting log (rate) against log [concentration]. The slopeof the straight line obtained from the plot gives the order of reaction n whilethe intercept gives log k. Thus, order and rate constant can be determined.
However, the average rates calculated by concentration versus time plotsare not accurate. Even the values obtained as instantaneous rates by drawingtangents are subject to much error. Therefore, this method is not suitable forthe determination of order of a reaction as well as the value of the rateconstant. It is best to find a method where concentration and time can besubstituted directly to determine the reaction orders. This could be achievedby integrating the differential rate equation.
1.4.1 Integral Equations for nth Order Reaction of a Single ReactantLet us consider the following general reaction:

Elementary 7
nA k→ Product
If c0 is the initial concentration of the reactant and c the concentration ofreactant at any time t, the differential rate expression may be given as
– dc/dt = kcn (1.15)
Multiplying by dt and then dividing by cn, we get
– dc/cn = kdt (1.16)
which may be integrated. The limits of integration are taken as c = c0 and cat t = 0 and t = t, respectively, as
∫ ∫dcc
k dtn = (1.17)
For various values of n, the results may be obtained as follows:
n = 0; kC c
t =
– 0
n = 1; ln c = ln (c0) – kt or c = c0 e–kt
n = 2; k = 1/t [1/c – 1/c0]
n = 3; k = 1/2t [1/c2 – 1/ c02 ]
n = n; k = 1/(n–1)t [1/(cn–1) – 1/( cn0
–1 )]
1.4.2 Integral Equations for Reactions InvolvingMore than One Reactants
When the concentrations of several reactants, and perhaps also products,appear in the rate expressions, it is more convenient to use as the dependentvariable x, i.e. the decrease in concentration of reactant in time t. Thenc = a – x, where a is commonly used to indicate the initial concentration inplace of c0 and rate equation (1.15) becomes
dx/dt = k (a – x)n (1.18)
or ∫ ∫dx a x kdtn/( – ) =
which can be integrated taking the conditions: at t = 0 , x will also be zero,the value of rate constant can be obtained.
For various values of n the results obtained are as follows:
n = 0 dx/dt = k; k = x/t
n = 1 dx/dt = k(a – x); k = 2.303/t log a/a – x
n = 2 dx/dt = k(a – x)2; k = 1/t [1/a – x – 1/a]

8 Chemical Kinetics and Reaction Dynamics
n = 3 dx/dt = k(a – x)3; k = 1/2t [1/(a – x)2 – 1/a2]
n = n dx/dt = k(a – x)3; k = 1/(n – 1)t [1/(a – x)n–1– 1/an–1]; n ≥ 2
1.5 Half-life of a ReactionThe reaction rates can also be expressed in terms of half-life or half-lifeperiod. The half-life period is defined as the time required for the concentrationof a reactant to decrease to half of its initial value.
Hence, half-life is the time required for one-half of the reaction to becompleted. It is represented by t1/2 and can be calculated by taking t = t1/2
when x = a/2 in the integrated rate equation of its order.
Problem 1.1 Write the differential rate equations of the following reactions:
(a) A + 2B k→ P
(b) 3A + 2B ′→k 3C + D + 2E
Solution The differential rates of above reactions can be written assumingthem to be elementary steps
(a) –[A]
= – 12
[B] =
[P] = [A] [B]2d
dtd
dtddt
k
(b) – 13
[A] = – 1
2[B]
= 13
[C] =
[D] = 1
2[ ]
= [A] [B]3 2ddt
ddt
ddt
ddt
d Edt
k ′
Problem 1.2 Write the differential rate equations of the following reactions:
(a) A + 3B → 4C(b) A + 2B → C + 3D(c) 3A + B + 2C → D + 3E
Solution Assuming these reactions as elementary steps, the differential ratecan be written as:
(a) –[A]
= – 13
[B] = 1
4[C]
= [A][B]3ddt
ddt
ddt
k
(b) –[A]
= – 12
[B] =
[C] = 1
3[D]
= [A][B]2ddt
ddt
ddt
ddt
k
(c) – 13
[A] = –
[B] = – 1
2[C]
= [D]
= 13
[ ] = [A] [B][C]3 2d
dtd
dtd
dtd
dtd E
dtk
Problem 1.3 Express the rate constant k in unit of dm3 mol–1s–1, if
(i) k = 2.50 × 10⁻⁹ cm3molecule–1s–1
(ii) k = 2 × 10⁻⁶ s–1 atm–1

Elementary 9
Solution(i) 1 dm3 = 1000 cm3, i.e. 1 cm3 = 10–3 dm3
1 mol = 6.02 × 10²³ molecule
molecule–1 = 6.02 × 10²³ mol–1
k = 2.50 × 10⁻⁹ cm3 molecule–1s–1
= 2.50 × 10⁻⁹ (10–3 dm3)(6.02 × 10²³ mol–1)s–1
= 2.50 × 6.02 × 10–9–3+23 dm3 mol–1 s–1
= 15.05 × 10¹¹ dm3 mol–1 s–1
(ii) We know P n RT CRT(1 atm)
= = v
or C PRT
= = 1 atm0.0821 atm dm mol K 273 K3 –1 –1 ×
= 0.0446 mol dm–3
Therefore, 1 atm = 0.0446 mol dm–3
or 1 atm–1 = 10.0446
mol dm–1 3
k = 2.0 × 10⁻⁶ s–1 atm–1
= 2.0 × 10⁻⁶ s–1.1
0.0446⎛⎝
⎞⎠ mol–1dm3
= 44.8 × 10⁻⁶ dm3 mol–1 s–1
Problem 1.4 For a certain reaction, the value of rate constant is 5.0 × 10⁻³
dm3 mol–1sec–1. Find the value of rate constant in (i) dm3 molecule–1 sec–1
(ii) cm3 mol–1 sec–1 and (iii) cm3 molecule–1 sec–1.
Solution(i) in dm3 mol–1sec–1
Rate constant = 5.0 × 10⁻³ dm3 mol–1sec–1
1 mol = 6.02 × 10²³ molecules
Rate constant = 5.0 × 10⁻³ dm3 (6.02 × 10²³ mol)–1 sec–1
= 0.83 × 10⁻²⁶ dm3 molecule–1 sec–1
(ii) in cm3 mol–1sec–1
1 dm3 = 1000 cm3
10 Chemical Kinetics and Reaction Dynamics
Rate constant = 5.0 × 10⁻¹ dm3 mol–1sec–1
= 5.0 × 10⁻³(1000) cm3 mol–1sec–1
= 5.0 cm3 mol–1 sec–1
(iii) in cm3 molecules–1sec–1
Rate constant = 5.0 cm3 (6.02 × 10²³)–1 molecules–1sec–1
= 0.83 × 10⁻²³ cm3 molecules–1sec–1
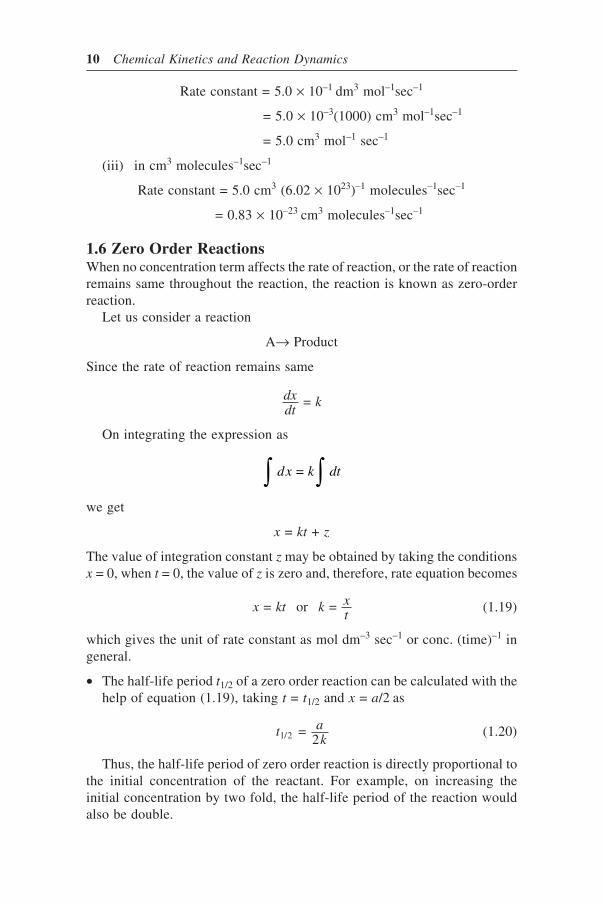
1.6 Zero Order ReactionsWhen no concentration term affects the rate of reaction, or the rate of reactionremains same throughout the reaction, the reaction is known as zero-orderreaction.
Let us consider a reaction
A→ Product
Since the rate of reaction remains same
dxdt
k =
On integrating the expression as
∫ ∫dx k dt =
we get
x = kt + z
The value of integration constant z may be obtained by taking the conditionsx = 0, when t = 0, the value of z is zero and, therefore, rate equation becomes
x kt k xt
= or = (1.19)
which gives the unit of rate constant as mol dm–3 sec–1 or conc. (time)–1 ingeneral.
• The half-life period t1/2 of a zero order reaction can be calculated with thehelp of equation (1.19), taking t = t1/2 and x = a/2 as
t ak1/2 =
2(1.20)
Thus, the half-life period of zero order reaction is directly proportional tothe initial concentration of the reactant. For example, on increasing theinitial concentration by two fold, the half-life period of the reaction wouldalso be double.

Elementary 11
• According to equation (1.19) the slope of a plot of x or (a – x) (i.e. theconcentration of product or concentration of reactant) versus time willgive the value of rate constant k (Fig. 1.2).
t t
x
(a –
x)
Slope = kSlope = k
Intercept = a
Fig. 1.2 Concentration versus time plot for zero order reaction.
The combination of H2 and Cl2 to form HCl in presence of sunlight is azero order reaction
H2 + Cl2 → 2HCl
The rate of formation of HCl is not affected by a change in concentrationof either the reactant or product. However, it is influenced by the intensity ofsun light.
Problem 1.5 A zero order reaction is 50% complete in 20 min. How muchtime will it take to complete 90%?
Solution Let a = 100 mol dm–3. For a zero-order reaction
k xt
= = 50 (mol dm )20 60 (sec)
–3
×
When reaction is 90% completed, x = 90. Therefore,
Thus, 501200
= 90t
or t = 90 120050
= 2160 sec = 36 min×
Problem 1.6 A reaction is 50% complete in 20 min. How much time will betaken to complete 75% reaction?Solution For a zero order reaction
k = x/t
x = a/2 for 50%
k at
a = 2
= 2 20×
x a = 34
for 75% reaction

12 Chemical Kinetics and Reaction Dynamics
Therefore, k at
= 34
or a at2 20
= 34×
t = 40 34
= 30 min×
75% reaction will complete in 30 min.
1.7 First Order ReactionsLet us consider a first-order reaction
A ⎯ →⎯⎯ Products
Initially, a 0
At time t, a – x xWe know that in case of a first-order reaction, the rate of reaction, dx/dt
is directly proportional to the concentration of the reactant. Therefore,
dxdt
k a x = ( – ) or dxa x
kdt( – )
=
Integrating, we get ln (a – x) = kt + z.The integration constant z is determined by putting t = 0 and x = 0. Thus
z = ln a
and, therefore, the rate constant for a first order reaction is obtained as
kt
aa x
= 1 ln –
or kt
aa x
= 2.303 log –
(1.21)
• The units of rate constant for a first order reaction from equation (1.21) ismeasured as (time)–1 and can be represented as sec–1, min–1 or hour–1.
• The half-life period for a first-order reaction may be obtained from equation(b) by substituting t = t1/2 when x = a/2, i.e.
kt
aa a
= 2.303 log – /21/2
or tk1/2 =
2.303 log2(1.22)
Thus, the half-life period of a first-order reaction is independent of initialconcentration of reactant. Irrespective of how many times the initialconcentration of reactant changes, the half-life period will remain same.

Elementary 13
• Further, equation (1.21) can be rearranged as
log ( – ) = – 2.303
+ log a x k t a (1.23)
which suggests that a plot of log (a – x) versus time will give a straight linewith a negative slope (k/2.303) andan intercept log a (Fig. 1.3).
Thus, in case of a first-orderreaction a plot between log [conc.]and time will always be linear andwith the help of slope, the value ofrate constant can be obtained.
Examples1. Inversion of cane sugar (sucrose)
log
(a –
x)
log a
t
Slope = k/2.303
Fig. 1.3 The log [conc.] versus time plotfor first-order reaction.
C H O + H O C H O + C H O12 22 11 2 6 12 6D-glucose
6 12 6D-fructose
→
The reaction is pseudo-first order and rate is proportional to [Sucrose]. Theprogress of the reaction can be studied by measuring the change in specificrotation of a plane of polarised light by sucrose. Let r0, rt and r∞ are therotation at initially (when t = 0), at any time t and final rotation, respectively.The initial concentration a is proportional to (r0 – r∞) and concentration atany time t, (a – x) is proportional to (r0 – rt). Thus, the rate constant may beobtained as
kt
r rr rt
= 2.303 log ( – )( – )
0 ∞
∞(1.24)
2. The hydrolysis of ester in presence of acid
CH COOC H + H O CH COOH + C H OH3 2( – )
5 2 H
3 ( ) 2 5+
a x x⎯ →⎯
Rate = k [ester]
Since one of the product is acetic acid, the progress of reaction may bestudied by titrating a known volume of reaction mixture against a standardalkali solution using phenolphthalein as indicator. Let V0, Vt and V∞ be thevolumes of alkali required for titrating 10 ml of reaction mixture at zerotime, at any time t and at the completion of the reaction, respectively.
V0 = Amount of H+ (catalyst) present in 10 ml of reaction mix.Vt = Amount of H+ (catalyst) in 10 ml of reactions mix + Amount of CH3COOH
formed at any time t.V∞ =Amount of H+ (catalyst) present in 10 ml of reaction mix + Amount of
CH3COOH formed at the end of reaction (or amount of ester presentinitially because 1 mol of ester gives 1 mol of CH3COOOH).

14 Chemical Kinetics and Reaction Dynamics
Thus, we can take V∞ – V0 = a
Vt – V0 = x
or (V∞ – V0) – (Vt – V0) = V∞ – Vt = a – x
Therefore, the rate constant for the reaction may be obtained as
kt
V VV Vt
= 2.303 log ( – )( – )
0∞
∞(1.25)
3. Decomposition of N2O5
N2O5 → 2 NO2 + 1/2 O2
Nitrogen pentaoxide in carbon tetrachloride solution decomposes to give O2.The progress of reaction is monitored by measuring the volume of O2 at
different time intervals and using the relation
kt
VV Vt
= 2.303 log –
∞
∞(1.26)
where V∞ is the final value of O2 when reaction is complete and correspondsto initial concentration of N2O5, Vt is the value of O2 at any time t and(V∞ – Vt) corresponds to (a – x).4. Decomposition of H2O2 in aqueous solution
H O H O + O2 2 Pt
2→
The concentration of H2O2 at different time intervals is determined by titratingthe equal volume of reaction mixture against standard KMnO4.
Problem 1.7 The specific rotation of sucrose in presence of hydrochloricacid at 35°C was measured and is given as follows:
Time (min) 0 20 40 80 180 500 ∞Rotation (°C) 32.4 28.8 25.5 19.6 10.3 6.1 –14.1
Calculate the rate constant at various time intervals and show that the reactionis first order.
Solution
kt
aa x t
r rr rt
= 2.303 log –
= 2.303 log – –
0 ∞
∞
k20–1 = 2.303
20 log
32.4 – (–14.1)28.8 – (–14.1)
= – .00403 min
k40–1 = 2.303
40 log
32.4 – (–14.1)25.5 – (–14.1)
= – .00406 min

Elementary 15
k80–1 = 2.303
80 log
32.4 – (–14.1)19.6 – (–14.1)
= – .004025 min
k200–1 = 2.303
200 log
32.4 – (–14.1)6.1 – (– 14.1)
= – .004002 min
Average = 0.0040295 min–1
Since the first order rate constant remains same, the reaction is of first order.
Problem 1.8 A first order reaction is 25% complete in 50 min. What wouldbe concentration at the end of another 50 min if the initial concentration ofthe reactant is 5.0 × 10³ mol dm–3?
Solution Reaction is 25% consumed in 50 min. After 50 min the concentrationc will be
a x – = 5.0 10 – 5.0 10 25
100 = 3.75 103
33× × × ×
Now kt C
= 2.303 log C
= 2.30350
log (5.0 10 )3.75 10
= 5.375 10 min03
33 –1×
××
Again, concentration after another 50 min, i.e. (50 + 50 = 100 min)
c = c0 e–kt = 5.0 103 –(5.35 10 /100)–3× ×e = 2.81 × 10³ mol dm–3
Problem 1.9 Following observations were made for decomposition of areactant at 35°C:
[A] Rate of decompositionmol dm–3 [–d[A]/dt] (mol dm–3 sec–1)
0.15 0.050.30 0.100.60 0.20
Find the order of reaction. Calculate rate constant and the rate of decompositionof A, when [A] = 0.45 mol dm–3.
Solution It can be observed from the data that the rate of decomposition indirectly proportional to [A], i.e.
–[A]
[A]d
dt∝
or –[A]
[A]d
dtk

16 Chemical Kinetics and Reaction Dynamics
where k is the rate constant. Hence, the reaction is first order.
kd dt
= – [A]/
[A] = 0.05
0.15 = 0.33; 0.10
0.30 = 0.33 and 0.20
0.60 = 0.33 sec –1
k (average) = 0.33 sec–1
Again, rate of decomposition when [A] = 0.45 mol dm–3 is
–[A]
= [A]d
dtk = 0.33 (sec–1) × 0.45 mol dm–3
= 0.1485 mol dm–3 sec–1 = 0.15 mol dm–3 sec–1
Problem 1.10 The kinetics of a reaction was followed by measuring theabsorbance due to a reactant at its λmax at 25°C. The log (absorbance) versustime (min) plot was a straight line with a negative slope (0.30 × 10⁻²) and apositive intercept. Find the half-life period of reaction.
Solution When log (a – x) versus time plot is straight line, the reaction is firstorder and slope gives the value of k/2.303 while intercept gives the value oflog a.
Rate constant 2.303
= Slope = 0.30 10 –2k ×
Therefore, k = 0.6909 × 10⁻² min–1
Half-life period t1/2 = 2.303 log 2(min )
= 0.69390.6939 10
= 100 min–1 –2k ×
Problem 1.11 In a first order reaction the log (concentration of reactant) versustime plot was a straight line with a negative slope � 0.50 × 10⁴ sec–1. Findthe rate constant and half-life period of reaction.
Solution The equation of first order rate constant may be written as
log ( – ) = – 2.303
+ log a x k t a
Thus, plot of log (a – x) versus time will be a straight line with a negative
slope equal to k2.303
.
Therefore, k2.303
= Slope = 0.50 × 10⁴ sec–1
or k = 2.303 × 0.5 × 104 = 1.1515 × 10⁴ sec–1

Elementary 17
Again half-life period t1/2 = 2.303 log 2
= 0.6931.1515 10 4k ×
= 0.60 × 10⁻⁴ sec–1 = 60 µsec
1.8 Radioactive Decay as a First Order PhenomenonWhen a radioactive substance is separated from its parent and its activity ismeasured from time to time, the rate of decay follows the law as
– = dIdt
Iλ (1.27)
where I is activity at any time t and λ a constant called the radioactivedisintegration constant which is characteristic of the radioactive elementirrespective of its physical condition or state of chemical combination. Thisequation, on integration, gives
I = I0 e–λt (1.28)
where I0 in the initial activity, i.e. when t = 0.Since the activity I is proportional to number of atoms that have not yet
disintegrated, we can use relation
n = n0 e–λt (1.29)
or λ = 2.303 log 0
tnn
⎛⎝
⎞⎠
where n0 and n are the number of atoms of radioactive substance at time t =0 and at any time t, respectively.
Equation (1.29) suggests that there is a definite probability of any particularatom disintegrating at a given moment and this is proportional to the numberof atoms present at that moment.
Half-life period gives the time T which must elapse for the radioactivityto decay to half its value at any instant and may be obtained by pulling
n = 12
n0 in equation (1.29).
Thus
12
n0 = n0 e–λT
or T = log 2
= 0.693λ λ (1.30)
In time T the activity is reduced to one-half of its initial value and, therefore,
in nT time, the activity is decreased to 1 – 12( )n
. Theoretically, therefore the
activity never falls to zero.

18 Chemical Kinetics and Reaction Dynamics
Average-life period ι of any radioactive atom is the length of time, whichcan exist before the atom disintegrates and can be calculated as follows.
Since the activity is proportional to number of atoms, which have notdisintegrated, equation (1.27) may be written as
–dn/dt = λn
or –dn = λn0 e–λtdt; n = n0 e–λt (from eq. (1.29) (1.31)
The number of atoms disintegrating in the interval between t and t + dt isequal to dn. Since dt is very small, dn may be taken as number of atomdisintegrating at time t. The period of average life ι is obtained by multiplyingevery possible life period t from zero to infinity, by the number of atoms dnand then dividing the product by the total number of atoms n0 present at thebeginning of the time. Thus,
ι = 0 0
∞
∫ t dnn (1.32)
Substituting the value of dn from equation (1.31) and ignoring the sign of dn,we have
ι λ λ = 0
–∞
∫ t e dtt (1.33)
or ι = 1/λ (1.34)
The average-life ι of a radioactive atom is thus equal to the reciprocal of itsradioactive constant λ and is a measure of mean expectation of future life ofthe atoms present at any instant.
Radioactive EquilibriumThe rate of decay of a given radioactive substance must also represent therate at which its disintegration product is being formed. The product willalso disintegrate at a rate depending on its amount present. This will be smallinitially, but will increase with time. Thus, in any given series a state ofequilibrium will eventually be reached, when the rate of formation of anyelement from its parent is equal to the rate at which it itself disintegrated.Mathematically, it can be represented as
dndt
dndt
dndt
1 2 3 = = . . . (1.35)
where n1, n2, n3 . . . represent the number of atoms of different radioactiveelements in the series present at equilibrium.
Again, since –dn/dt = λn, we may have
λ1n1 = λ2n2 = λ3n3 . . .

Elementary 19
orλλ
1
2
2
1 = . . .
nn
(1.36)
Therefore, at radioactive equilibrium, the amount of different radio elementspresent will be inversely proportional to their decay constant, or directlyproportional to their half- or average-life periods.
The time taken for the complete equilibrium to be established depends onthe life periods of elements involved. The longer the average life of anyelement, more slowly an equilibrium with its product is reached.
Problem 1.12 The half-life of a radioactive substance 91X is 20 years. Calculatethe decay constant. In how many years three quarters of the given amount ofsubstance will disappear?
Solution
1 year = 365 × 24 × 60 × 60 = 3.15 × 10⁷ sec
t1/2 = 0.693(decay constant)λ
λ = 0.69320 3.15 107× ×
Since decay follows first-order kinetics, t1/2 is independent of a i.e. initialconcentrations. 50% of substance decays in 20 years, next 50% of remaining,i.e. 25% will decay in 20 years. Therefore, 75% will decay in 40 years.
Problem 1.13 A radioactive element gives 2000 counts per min at a giventime. After one hour, counts were found to be 750 per min. What is half-lifeof the element?
Solution The decay constant
λ = 0.303 log = 0.6930
1/2tNN t
⎛⎝
⎞⎠
N0 ∝ 2000 and N ∝ 750
t = 1 hour = 60 min
0.30360
log 2000750
= 0.6931/2t
or t1/2 = 42.5 min
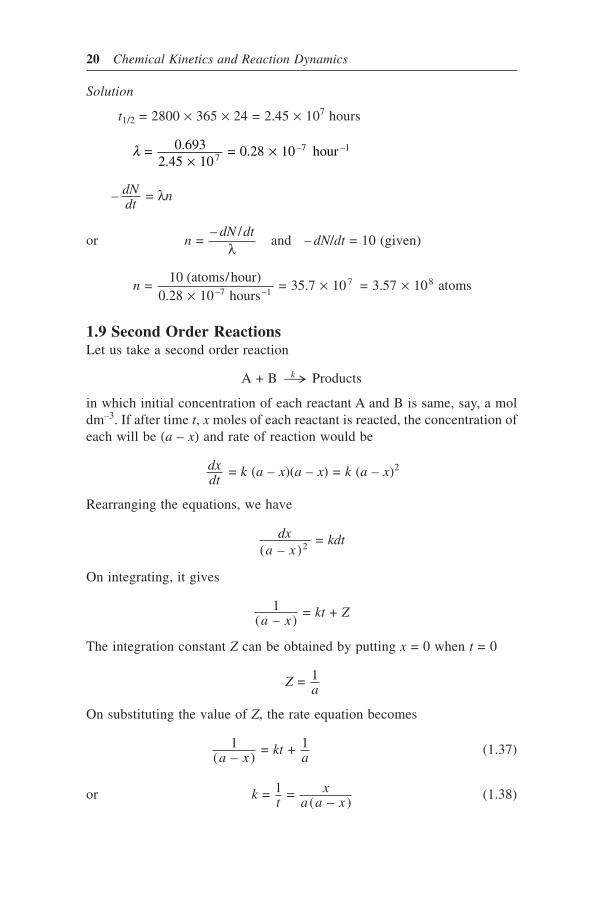
Problem 1.14 Half-life of radioactive element is 2800 years. How manyatoms of the element are required to produce an average of 10 beta emissionsper hour?
20 Chemical Kinetics and Reaction Dynamics
Solution
t1/2 = 2800 × 365 × 24 = 2.45 × 10⁷ hours
λ = 0.6932.45 10
= 0.28 10 hour7–7 –1
××
– = dNdt
nλ
or ndN dt
= – /
λ and – dN/dt = 10 (given)
n = 10 (atoms/hour)
0.28 10 hours = 35.7 10 = 3.57 10 atoms–7 –1
7 8
×× ×
1.9 Second Order ReactionsLet us take a second order reaction
A + B k→ Products
in which initial concentration of each reactant A and B is same, say, a moldm–3. If after time t, x moles of each reactant is reacted, the concentration ofeach will be (a – x) and rate of reaction would be
dxdt
= k (a – x)(a – x) = k (a – x)2
Rearranging the equations, we have
dxa x
kdt( – )
= 2
On integrating, it gives
1( – )
= + a x
kt Z
The integration constant Z can be obtained by putting x = 0 when t = 0
Za
= 1
On substituting the value of Z, the rate equation becomes
1( – )
= + 1a x
kta
(1.37)
or kt
xa a x
= 1 = ( – )
(1.38)

Elementary 21
• The unit of rate constant is (conc.)–1 (time)–1 or mol–1 dm3 sec–1
• The half-life period t1/2 is obtained by putting t = t1/2 and x = a/2 inequation (1.38) as
kt
aa a a
= 1 /2( – /2)1/2
⋅
or tka1/2 = 1 (1.39)
Thus the half-life period of a second order reaction is inversely proportionalto the initial concentration of the reactant.
Fig. 1.4 Second order plot.
with a positive intercept.
Second Order Reaction with Reactants having Different InitialConcentrationsLet the reaction
A + B k ⎯ →⎯ ProductsInitially a b 0At time t, (a – x) (b – x) x
The rate of reaction is represented as
dxdt
k a x b x = ( – )( – )
or dxa x b x
kdt( – )( – )
= (1.40)
Now we use the method of partial fractions to write the left side as sumof two simple terms. Let
1( – )( – )
= ( – )
+ ( – )a x b x
pa x
qb x
where p and q are evaluated by using a common denominator and equatingcoefficients of like powers of x in numerator. The values of p and q may bedetermined as p = 1/(b – a) and q = –1/(b – a). Equation (1.40) then becomes
dxb a a x
dxb a b x
kdt( – )( – )
– ( – )( – )
= (1.41)
1
( –
)
ax
1/a
Slope = k
Time
• According to equation (1.37), it isobserved that a plot of 1/(a – x)versus time should be linear withslope k and a positive intercept1/a (Fig. 1.4).
Thus, in case of a second-orderreaction, a plot of 1/(conc. of reactant)versus time would always be linear

22 Chemical Kinetics and Reaction Dynamics
Now the integration of each term is simple and the result is
1/(b – a) ln a/(a – x) – 1/(b – a) ln b/(b – a) ln b/(b – x) = kt
which reduces to
kb a t
b x ab a x
= 1( – )
ln ( – )
( – )⎧⎨⎩
⎫⎬⎭
or ka b t
b a xa b x
= 1( – )
ln ( – )( – )
⎧⎨⎩
⎫⎬⎭
or kb a t
b x ab a x
= 2.303( – )
log ( – )
( – )⎧⎨⎩
⎫⎬⎭
(1.42)
Thus, equation (1.42) is used to obtain the rate constant for a second-order reaction in which both the reactants have different initial concentration.Whether the experimental data satisfy this expression can be checked byplotting log {a(b – x)/b(a – x)} against time, which should be a straight linepassing through the origin. The slope of straight line gives the value of2.303/k(b – a) from which the value of rate constant k can be evaluated.
The half-life period in this case can only be determined if the reactants aretaken in stoichiometric amounts.
Let a and b be the initial concentrations of A and B, respectively, for thereaction
lA + m B → Products
A + ml
B → Products
Initially a b 0
At time t a – xml
x⎛⎝
⎞⎠ x
The rate,
dxdt
k a x bml
x = ( – ) – ⎛⎝
⎞⎠
If a and b are in stoichiometric amounts, i.e. b = (m/l)a, the above equationreduces to
dxdt
k m l a x = ( / )( – )2
Rearranging and integrating, the rate constant and half-life period may beobtained as
kt m l a x a
= 1( / )
1( – )
– 1⎛⎝
⎞⎠ (1.43)
and t1/2 = l/mka (1.44)
Elementary 23
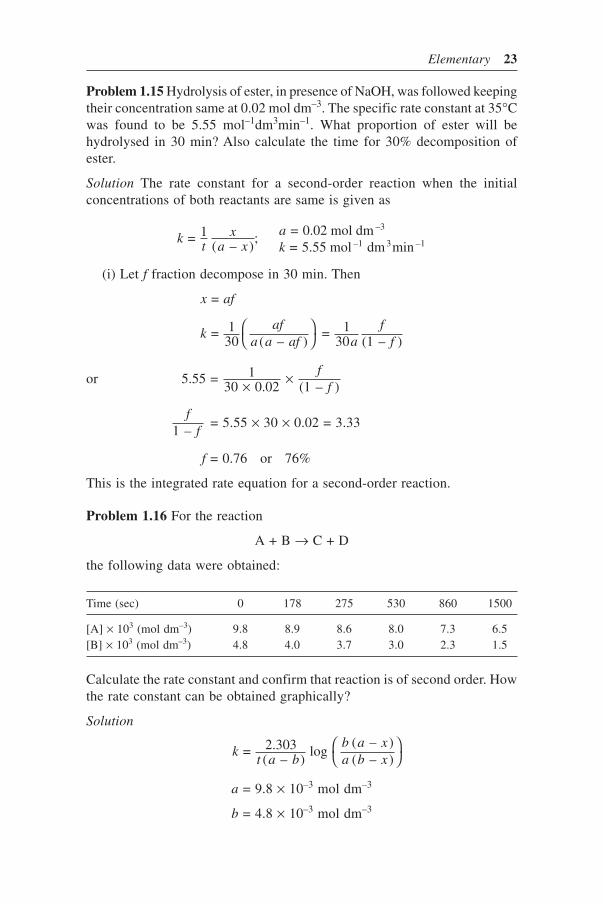
Problem 1.15 Hydrolysis of ester, in presence of NaOH, was followed keepingtheir concentration same at 0.02 mol dm–3. The specific rate constant at 35°Cwas found to be 5.55 mol–1dm3min–1. What proportion of ester will behydrolysed in 30 min? Also calculate the time for 30% decomposition ofester.
Solution The rate constant for a second-order reaction when the initialconcentrations of both reactants are same is given as
kt
xa x
ak
= 1( – )
; = 0.02 mol dm = 5.55 mol dm min
–3
–1 3 –1
(i) Let f fraction decompose in 30 min. Then
x = af
kaf
a a af af
f = 1
30 ( – ) = 1
30 (1 – )⎛⎝
⎞⎠
or 5.55 = 130 0.02 (1 – )× × f
f
ff1 –
= 5.55 × 30 × 0.02 = 3.33
f = 0.76 or 76%
This is the integrated rate equation for a second-order reaction.
Problem 1.16 For the reaction
A + B → C + D
the following data were obtained:
Time (sec) 0 178 275 530 860 1500
[A] × 103 (mol dm–3) 9.8 8.9 8.6 8.0 7.3 6.5[B] × 103 (mol dm–3) 4.8 4.0 3.7 3.0 2.3 1.5
Calculate the rate constant and confirm that reaction is of second order. Howthe rate constant can be obtained graphically?
Solution
kt a b
b a xa b x
= 2.303( – )
log ( – )( – )
⎛⎝
⎞⎠
a = 9.8 × 10⁻³ mol dm–3
b = 4.8 × 10⁻³ mol dm–3

24 Chemical Kinetics and Reaction Dynamics
Time(sec) log(a – x) log(b – x) b(a – x)/a(b – x) k
0 3 .9912 3 .6812 – –
178 3 .9420 3 .6020 1.078 0.844 × 10⁻⁴
275 3 .9340 3 .5682 1.138 0.939 × 10⁻⁴
530 3 .9030 3 .4770 1.306 1.007 × 10⁻⁴
860 3 .8633 3 .3617 1.554 1.025 × 10⁻⁴
1500 3 .8125 3 .1760 2.122 1.003 × 10⁻⁴
Average = 0.9636 × 10⁻⁴
k almost remains constant. Therefore, the reaction is of second order.
Problem 1.17 A reactant reacts 30% in 30 min. If the reaction follows asecond order kinetics, find rate constant and remaining concentration ofreactant after 60 min.
Solution For a second order reaction
kt a x a
= 1 1 –
– 1[ ]Let a = 100, x = 30 and a – x = 70. Putting the values in above, we get
k = 130
170
– 1100
= 17000
= 1.42 10 mol dm sec–4 –1 3 –1[ ] ×
Further, ka x
= 160
1 –
– 1100[ ]
1.42 10 = 160
100 – ( – )( – )100
–4× ⎡⎣⎢
⎤⎦⎥
a xa x
1.42 × 10–4 × 60 × 100 (a – x) = 100 – (a – x)
85.20 (a – x) + (a – x) = 100
86.20 (a – x) = 100
( – ) = 10086.20
= 1.16,a x i.e. 1.16% concentration of reactant will remain
after 60 min.
Reduction of OrderLet us consider a second order reaction which is first order with respect toeach reactant and the reactants have different initial concentrations.
A + B Productsa b
k→

Elementary 25
The rate constant for this reaction is given by
kt b a
a b xb a x
= 2.303( – )
log ( – )( – )
⎧⎨⎩
⎫⎬⎭
If one of the reactants, say B, has a very high concentration in comparisonto that of A, i.e. b � a then, the following conditions would be valid:
b – a ≈ b and b – x ≈ b
(because x depends on both A and B and is small as a is small). Therefore,the equation of rate constant reduces to
kb t
aa x
= 1 2.303 log ( – )
(1.45)
This rate expression is similar to the integrated expression for a first orderreaction, only the magnitude of rate constant is changed by (1/b) times.Therefore, the reaction is said to be pseudo-first order. The reaction is firstorder with respect to reactant A, which is present at low concentration. Theorder with respect to B is arranged to be zero by virtue of its high concentration.
Thus, it may be concluded that if any reactant is present at a very highconcentration, it does not affect the rate of reaction. The rate will dependonly on those reactants, which are present at low concentrations. This isbecause, if reactant B is taken in very large concentration compared to otherreactant A, then even if all of the reactant A is used up in the reaction, therewill be very little decrease in the concentration of B. Therefore, the reactionis taking place under the conditions, where the concentration of B is practicallyconstant. For this reason, the rate of the reaction is a function of theconcentration of only the reactant, which is present at low concentration.Usually, to maintain the concentration of one reactant constant during thereaction, its concentration should be taken in at least ten-fold excess of theother reagent.
Second Order Reaction When Concentrations of Reactants Differ OnlySlightlyIf the concentration of two reactants differ only slightly, i.e. by a smallamount, (a – x)/(b – x) will almost be unity and, therefore, equation
kt a b
b a xa b x
= 1 ( – )
ln ( – )( – )
cannot be used. In this case, an equation is obtained by expansion of thelogarithm.
Let a = d + S and b = d – S, where d is the mean initial concentration, i.e.d = (a + b)/2 and 2S is excess of concentration of a over that of b.

26 Chemical Kinetics and Reaction Dynamics
This can be written in terms of S and d as
2 ln 1 + –
– ln 1 – –
+ ln 1 – – ln 1 + kSt = Sd x
Sd x
Sd
Sd( ) ( ) ( ) ( )
On expanding the logarithm terms, the equation may be obtained as
2( – )
– 2 ( – )
– 3( – )
+ . . .2
2
3
3kSt = Sd x
Sd x
Sd x
⎛⎝⎜
⎞⎠⎟
– – ( – )
– 2 ( – )
– 3( – )
+ . . .3
2
3
3S
d xS
d xS
d x⎛⎝⎜
⎞⎠⎟
+ – – 2
– 3
+ . . . – – 2
– 3
+ . . .2
2
3
3
2
2
3
3Sd
Sd
Sd
Sd
Sd
Sd
⎛⎝⎜
⎞⎠⎟
⎛⎝⎜
⎞⎠⎟
(1.46)
On collecting the terms and arranging, the equation becomes
ktd x d
Sa x d
= 1( – )
– 1 + 3
1( – )
– 1 + . . .2
3 3
⎛⎝⎜
⎞⎠⎟
(1.47)
When S is zero, the equation reduces to
ktd x d
= 1( – )
– 1 (1.48)
This is equivalent to equation used when both the reactants have same initialconcentrations, i.e.
ktC C
= 1 – 10
⎛⎝
⎞⎠ or 1
( – ) – 1
a x a⎛⎝
⎞⎠
Equation (1.48) may be used to determine the value of rate constant whenthe concentrations of two reactants differ only slightly (S << d). Here, a plotof 1/(d – x) against time will be linear with a slope equal to k.
Second Order Autocatalytic ReactionWhen a product, formed in a second order reaction, acts as a catalyst oreffects the rate of reaction, the reaction is known as autocatalytic reaction.For example, the acid catalysed hydrolysis of various esters and similarcompounds and various biochemical processes.
Let us take the example of hydrolysis of an ester in presence of HCl
Initially at time t Ester
( – )
+ H O
( – )
Acid0
+ Alcohol0
2 HCl
aa x
bb x
cx x
⎯ →⎯
Since, water being in excess, its concentration may be taken constant.Again concentration of acid (HCl) is c, the rate will depend on (c + x), i.e.

Elementary 27
acid present initially + acid formed at any time t. Thus, the rate of reactionis given by
dxdt
k a x c x = ( – )( + )
On rearranging and integrating, we get
kt a c
a c xc a x
= 2.303( + )
– log ( + )( – )
(1.49)
Equation (1.49) can be used for calculating the rate constant for a second-order autocatalytic reaction.
When the concentration (c + x) isplotted against time t, a S-shapedcurve is obtained. (Fig. 1.5). Thiscurve is characteristic of autocatalyticreactions and many growth processes.It can be seen from equation (1.49)that rate will be maximum when
(a – x) = (c + x) or x = (a – c)/2
Thus, if c is small in comparison to
Fig. 1.5 Plot of (c + x) versus time.
Time
[c +
x]
a, the maximum rate will be obtained when the concentration a has decreasedby 50%. Again the rate constant at the point, where the rate is maximum, canbe obtained by substituting c = (a – 2x) in equation (1.49). Thus, the rate willbe given as
kt a x
aa x
= 2.3032 ( – )
log ( – 2 )
(1.50)
Problem 1.18 A second order reaction with initial concentration of eachreactant as 0.5 mol dm–3 was carried out in presence of acid as catalyst. AtpH 4.0 the half-life of reaction was found to be 60 min. Calculate the observedand true rate constant for the reaction.
Solution
Rate = ktrue [H+][A][B] = kobs [A][B], when kobs = ktrue [H
+]
[A]0 = [B]0 = 0.5 mol dm–3
[H+] = 10–pH = 10–4 mol dm–3
For a second order reaction
tk1/2
obs = 1
[initial conc.]×

28 Chemical Kinetics and Reaction Dynamics
kobs = 160 0.5× mol–1dm3 min–1 = 0.0333
= 3.33 × 10⁻² mol–1dm3min–1
kk
trueobs
+
–2
–4 –3–1 3 –1 =
[H ] = 3.33 10
10 mol dm mol dm min×
= 3.33 × 10² mol−2dm6min−1
1.10 Third Order ReactionsA third order reaction can be the result of the reaction of a single reactant,two reactants or three reactants. If the two or three reactants are involved inthe reaction they may have same or different initial concentrations. Dependingupon the conditions the differential rate equation may be formulated andintegrated to give the rate equation. In some cases, the rate expressions havebeen given as follows.
(a) Where three reactants are involved with same initial concentrationsConsider the reaction:
Initially at time t A
( – )
+ B
( – )
+ C
( – )
Products0a
a xa
a xa
a x x
k→
Then
Rate = = ( – )3dxdt
k a x
On rearranging and integrating the equation, We get
kt a x a
= 12
1( – )
– 12 2
⎛⎝⎜
⎞⎠⎟
(1.51)
which can be used for calculating the rate constant of a third-order reaction,when all the reactants have same initial concentrations.
• Units of rate constant is (conc.)–2 (time)–1 or generally mol–2 lit2sec–1 ormol–2 dm6 sec–1.
• Half-life period may be obtained from equation (1.51) by substitutingt = t1/2 when x = a/2. Thus,
tka1/2 2 = 3
2(1.52)
Therefore, in case of third order reactions the half-life period is inverselyproportional to the square of initial concentration.
• Equation (1.51) can be rearranged as

Elementary 29
1( – )
= 2 + 12 2a x
kta
(1.53)
Therefore, a plot of 1/(a – x)2 versus time will give a straight line with apositive intercept (1/a2) and a slope (2k). Thus, the value of rate constantmay by obtained from the slope of the straight line.
1
( –
)2
ax
Time
Slope = 2k
1/a2
Fig. 1.6 Third order plot.
(b) Where three reactants are involved with different initialconcentrations
Let us consider the reaction
Initially at time t A
( – )
+ B
( – )
+ C
( – )
Products0a
a xb
b xc
c x x
→
The rate expression is given by
dxdt
k a x b x c x = ( – )( – )( – )
This equation can be integrated with help of partial fractions. The integratedrate equation is obtained as
kt a b b c c a
= 2.303( – )( – )( – )
( – ) log ( – )
+ ( – ) log ( – )
+ ( – ) log ( – )
b c aa x
c a bb x
a b cc x
⎛⎝
⎞⎠(1.54)
(c) Where two reactants are involved and stoichiometry is 2:1
Initially at time t 2A
( – 2 )
+ B
( – )
+ Products0a
a xb
b x x
→
The differential rate equation is given by
dxdt
k a x b x = ( – 2 ) ( – )2

30 Chemical Kinetics and Reaction Dynamics
After rearranging and integrating, the integrated form of equation is obtained as
ktb a a x a b a
b a xa b x
= 1(2 – )
– 1( – 2 )
– 1 + 2.303(2 – )
log( – 2 )( – )2
⎛⎝
⎞⎠
⎛⎝
⎞⎠ (1.55)
(d) Where two reactants have same initial concentrations and third hasdifferent concentration
Initially at time t A
( – )
+ B
( – )
+ C
( – )
Productsa
a xa
a xc
c x x
→
The differential rate equation is given by
dxdt
k a x c x = ( – ) ( – )2
and integral form of equation for the rate constant may be obtained as
ktt b a a x a a b
b a xa b x
= 1( – )
1( – )
– 1 + 2.303( – )
log( – )( – )2
⎛⎝
⎞⎠
⎛⎝
⎞⎠ (1.56)
The differential rate equations, corresponding integral rate equations andrate constants for various reactions (having order zero to three) under differentsets of conditions are summarized in Table 1.1.
1.11 Determination of Order of ReactionThe kinetic investigation of a reaction is carried out to establish the rate lawand to measure the rate coefficients. The first step is to identify or examinethe role of each component, i.e. to determine the order of reaction withrespect to each reactant or product. There are various methods, which can beused to determine the order of reaction with respect to a reactant. However,every method requires essentially the measurement of concentration of thereactant or product at various time intervals.
1.11.1 Integration MethodIn this method, the different rate equations in their integrated forms (givenin Table 1) are used. The amount of reactant a – x or product x at different timeintervals t is first experimentally determined. Then the values of x, a – x andtime are introduced into the different rate equations and the value of rateconstant k is calculated at different time intervals. The equation which givesthe constant value of rate constant indicates the order of reaction. For example,the values of rate constants at different time intervals are same in equation
kt a x a
= 12
1 –
– 1{ }the order of reaction will be 2. Thus, this is the method of trial and can beused for simple homogenous reactions.

Elementary 31
Tab
le 1
.1D
iffe
rent
ial
rate
equ
atio
ns, c
orre
spon
ding
int
egra
l ra
te e
quat
ions
and
rat
e co
nsta
nts
for
vari
ous
reac
tion
s
Rea
ctio
nO
rder
Dif
fere
ntia
lIn
tegr
al e
quat
ion
t 1/2
Uni
ts o
f k
Nat
ure
of p
lot
equa
tion
A
Pro
duct
(a)
k⎯
→⎯⎯
0dx dt
k =
k
x t =
a k
2m
ol d
m–3
s–1S
lope
= k
or
Inte
rcep
t =
a
A P
rodu
ct(a
)
k⎯
→⎯⎯
1/2
dx dt =
kt
= 2
0.58
61/
2
ka
mol
1/2 dm
–3/2
s–1S
lope
= k
/2In
terc
ept
= a
/2
k (a
– x
)1/2
[a1/
2 – (
a –
x1/2 ]
A P
rodu
ct(a
)
k⎯
→⎯⎯
1dx dt
=k
t =
2.30
30.
693
ks–1
Slo
pe =
k/2
.303
,In
terc
ept
= l
og a
k(a
– x
)lo
g(
–
)a
ax
A P
rodu
ct(a
)
k⎯
→⎯⎯
3/2
dx dt =
kt
= 2
0.82
81/
2ka
mol
–1/2
dm3/
2 s–1S
lope
= k
/2,
Inte
rcep
t =
1 1/2
a
k (a
– x
)3/2
1(
–
) –
1
1/2
1/2
ax
a
⎛ ⎝⎜⎞ ⎠⎟
A+
B
Pro
duct
(a)
(a)
k⎯
→⎯
2dx dt
=k
t =
11 ka
mol
–1/2
dm3 s–1
Slo
pe =
kIn
terc
ept
=
1 a
k (a
– x
)21
( –
) –
1a
xa
⎛ ⎝⎜⎞ ⎠⎟
A+
B
Pro
duct
(a)
(b)
k⎯
→⎯
2dx dt
=k
ta
b =
2.
303
( –
)
–m
ol–1
dm3 s–1
Pas
sing
thr
ough
Slo
pe =
k (a
– x
)(b
+ x
)lo
g b
ax
ab
x(
–
)(
–
)
the
orig
in,
ka
b(
–
)2.
303
Tim
e
(a – x)
Tim
e
x
Tim
e
(a – x)1/2
Tim
e
log (a–x)
Tim
e
1/(a –x)
Tim
e
logb(a –x)/a(b –x)
Tim
e
1/(a –x)1/2
(Con
td.)

32 Chemical Kinetics and Reaction Dynamics
Rea
ctio
nO
rder
Dif
fere
ntia
lIn
tegr
al e
quat
ion
t 1/2
Uni
ts o
f k
Nat
ure
of p
lot
equa
tion
A +
BA
utoc
atal
ytic
k →2
dx dt =
kt
ac
=
2.30
3(
+
)–
mol
–1dm
3 s–1P
assi
ng t
hrou
ghS
lope
=P
rodu
ctk
(a –
x)(
c +
x)
log
ac
xc
ax
( +
)
( –
)
the
orig
in,
ka
c(
+
)2.
303
A +
B +
C
(a)
(a)
(a)
k →3
dx dt =
kt
=
1 23
22
kam
ol–2
dm6 s–1
Slo
pe =
2k,
Inte
rcep
t =
1 2
aP
rodu
ctk(
a –
x)3
1(
–
) –
1
22
ax
a
⎛ ⎝⎜⎞ ⎠⎟
A+
B+
C
(a)
(b)
(c)
k⎯
→⎯
3dx dt
=k
ta
bb
cc
a
=
2.30
3(
–
)(
–
)(
–
)
–m
ol–2
dm6 s–1
Pro
duct
bc
aa
x
ca
bb
x
ab
cc
x
–)l
og(
–)
+(
–)l
og(
–)
+(
–)l
og(
–)
⎛ ⎝⎜ ⎜ ⎜ ⎜ ⎜ ⎜
⎞ ⎠⎟ ⎟ ⎟ ⎟ ⎟ ⎟
Tim
e
k(a
– x
)(b
– x)
(c –
x)
Tim
e
loga(c + x)/c(a – x) 1/(a –x)2

Elementary 33
2A
+B
P
rodu
ct(a
)(b
)
k⎯
→⎯
3dx dt
=1
12
–)
1(
–2
)–
1
+2
–30
3
(2–
)
log
(–
2)
(–
)
2t
ba a
xa
ba b
ax
ab
x
×⎧ ⎨ ⎩
⎫ ⎬ ⎭
×
⎛ ⎝⎜ ⎜ ⎜ ⎜ ⎜ ⎜ ⎜ ⎜
⎞ ⎠⎟ ⎟ ⎟ ⎟ ⎟ ⎟ ⎟ ⎟
–m
ol1/
2 dm–6
s–1
k (a
– 2
x)2
(b –
x)
A +
B+
C+
(a)
(a)
(a)
…→k
n≥
2dx dt
=1
(–
1)t
n2
– 1
( –
1)
(–1
)
(–1
)
n
nn
Ka
mol
–(n–
1)
Slo
pe =
(n
– 1)
k,In
terc
ept
=
Pro
duct
k (a
– 2
x)2
×1
( –
)
–
1–1
–1a
xa
nn
⎛ ⎝⎜⎞ ⎠⎟
dm3(
n–1)
s–11 –1
an
1/(a – x)n–1

34 Chemical Kinetics and Reaction Dynamics
1.11.2 Half-life Period MethodTable 1 shows that the half-life depends on the initial concentration in acharacteristic manner for reactions of different order and thus its measurementserves as a guide to the order. In general it may be concluded that
t1/2 ∝ 1/(an–1)
If a1 and a2 are the initial concentrations of the reactant in two experimentsof same reactions and (t1/2)1 and (t1/2)2 are the corresponding half-life periods,respectively, then
( ) 1( )1/2 1
1–1t
a n∝ and ( ) 1( )1/2 2
2–1t
a n∝
or( )( )
= ( )( )
1/2 1
1/2 2
2
1
–1tt
aa
n⎛⎝
⎞⎠
Taking logarithms on both sides, the equation becomes
log( )( )
= ( – 1) log 1/2 1
1/2 2
2
1
tt
naa
⎛⎝⎜
⎞⎠⎟
⎛⎝
⎞⎠ (1.57)
The order n may be calculated with the help of above equation. Again aplot of logarithms of ratio of half-life periods versus ratio of initialconcentrations will be linear passing through the origin with a slope equal to(n – 1) and thus the order can be determined from its slope.
1.11.3 Graphical MethodThe integrated forms of equations (Table 1) can be rearranged in the form ofa straight line equation y = mx + c. For example
Order Equation0 x = kt
1 log ( – ) = –2.303
+ log a x k t a
2 1( – )
= + 1a x
kta
3 1( – )
= 2 + 12 2a x
kta
. . . . . .
n 1( – )
= ( – 1) + 1–1 –1a x
n ktan n
In order to confirm the order of a reaction, the left hand side of the expression,when plotted against time, should give a straight line. Thus, if a plot of(1/a – x) versus time is a straight line, reaction would be of second order. Thisis a simple and accurate method and is applied generally for determination

Elementary 35
of the order of the reaction. The method is also advantageous, as the rateconstant for the reaction can be evaluated with slope of the straight line andif initial concentration of the reactant is not known, can be determined withthe help of intercept.
1.11.4 Differential MethodThis method, used by Van’t Hoff, is called Van’t Hoff’s differential method.Consider a reaction
nA→ Product
The rate of reaction at two different concentrations c1 and c2 can be given as
Rate = – = 11
1dcdt
kcn (I)
Rate = – = 22
2dcdt
kcn (II)
Dividing equation (I) by (II), we get
RateRate
= (– / )(– / )
= 1
2
1
2
1
2
dc dtdc dt
cc
n⎛⎝
⎞⎠
or nc c
= log(Rate ) – log (Rate )
log – log 1 2
1 2(1.58)
The reaction is carried out with different initial concentrations of thereactant. The concentration versus time plots for both the experiments areobtained. The slope (–dc/dt) at a given time interval is measured in both thecases and using these values, n is determined with the help of above equation.
The differential rate equation can also be used alternatively as
– = dcdt
kcn
or – log = log + log dcdt
k n c⎛⎝
⎞⎠ (1.59)
Thus, a plot of log (rate) versus log [concentration] will be a straight linewith an intercept log k and slope n. This is one of the procedures that givesthe order directly. However, if log (rate) versus log [concentration] plot isnot linear, the reaction is of complex nature.
1.11.5 Ostwald Isolation MethodWhen more than one reactant is involved in the reaction, it is necessary toisolate one of the reactants and its influence on the rate of reaction. Thetechnique of isolating one reactant from rest of the reactants, developed by

36 Chemical Kinetics and Reaction Dynamics
Ostwald (1902), is based on the fact that ‘if any reactant is taken in largeexcess, its concentration virtually remains constant, and thus it will notaffect the rate of reaction’.
Let us consider a reaction in which three reactants, viz. A, B and C areinvolved, and α, β and γ are the order with respect to A, B and C, respectively.Now if reaction is carried out under the conditions of large excess of B andC, the reaction rate will be given by
– [A]
= CAd
dtk α
Then apparent order α with respect to A may be determined by any methoddescribed earlier. The value of β can similarly be determined by using a largeexcess of A and C. For determination of γ, the experiment can be repeated bytaking large excess of A and B. Thus, order with respect to each reactant canbe determined.
The methods discussed above are suitable for simple and direct reactionswhere rates are simple power function of concentrations. These methodswould not be helpful when the reactions are of complex nature and areoccurring in multiple steps. The methods are also not applicable for thestudy of fast reactions where some special technique are required to beemployed.
Problem 1.19 In a reaction when initial concentration doubles, the half-lifeis reduced to half. What is the order of reaction?
Solution
tan1/2 –1
1∝ ⎛⎝
⎞⎠ (a)
When a = 2a, and t1/2 = t1/2
2
Therefore,t
a n1/2
–121
(2 )∝ (b)
From equations (a) and (b), we get
2 = (2)n–1
log 2 = (n – 1)log 2
n – 1 = 1
n = 2
The reaction is, therefore, of second order.
Problem 1.20 The rate of decomposition of a substance was 14.5 when it

Elementary 37
reacted 5% while the rate of decomposition in same unit was 10.25 when itreacted 20%. Find the order of reaction.
Solution
– = dcdt
kcn (assume initiation concentration c0 = 100 unit)
14.5 = k(100 – 5)n = k(95)n
10.25 = k(100 – 20)n = k(80)n
9580
= 14.510.25
= 1.414⎛⎝
⎞⎠
n
(1.5)n = 1.414
n = 2
Hence, reaction is of second order.
Problem 1.21 The data of a chemical reaction is plotted as 1/[reactant] vstime and the plot is a straight line with intercept 4.0 × 10² mol–1 dm3 andslope 4.0 mol dm3 s–1 as shown in the figure. Calculate the half-life of thereaction.
Time
4.0 × 10²
Slope = 4.0 mol dm3s–11
[Reactant]
Solution Given that 1/[reactant] vs time plot is a straight line, the reaction isof second order and intercept gives the initial concentration (intercept = 1/a)and slope = k.
Therefore, a = 14.0 102×
= 0.25 × 10⁻² mol–1 dm3
k = 4.0 mol dm–3s–1
Now half-life period for second order reaction is given as
tka1/2 –3 –1 –2 –1 3 = 1 = 1
4 mol dm s 0.25 10 mol dm = 100 sec
× ×
Problem 1.22 In an experiment consisting of two reactants A and B, the

38 Chemical Kinetics and Reaction Dynamics
half-life of reaction was measured. The half-life remained same whenconcentration of B doubled keeping [A] constant. On the other hand, whenconcentration of B is kept constant and [A] was doubled, the half-life reducedto half of its original value. Find the order of reaction with respect to each Aand B. Suggest the rate law and also suggest which of the following mechanismagrees with rate law:
(i) 2A + B → E (slow)
E + B k2→ C + D (fast)
(ii) 2A k1→ A2 (fast)
A2 + B k2→ C + D (slow)
Solution When concentration of B was doubled, half-life remained same,half-life is independent to initial concentration in case of first order reaction.Therefore, reaction is first order with respect to B.
When concentration of A was doubled, half-life reduces to its half value, i.e.
t1/21
[A]∝
Therefore, the reaction is second order with respect to [A].
The rate law may be given as
Rate = k[A]2[B]
(i) According to this mechanism
Rate = [C]ddt
or d
dtk
[C] = [E][B]2
By applying the steady state with respect to [E], we get
k1[A]2[B] = k2[E][B]
or [E] = [A]1
2
2kk
Therefore, rate law becomes
Rate = k2 [E][B] = [A] [B] = [A] [B]21
2
21
2kkk
k
which is matching with experimental results.(ii) The rate of reaction is given as
Rate = [C]
= [C]
= [A ][E] 2 2d
dtd
dtk

Elementary 39
Applying the steady state conditions with respect to [A2], we get
k1[A]2 = k2[A2][B] or [A ] = [A][B]2
12
2
kk
Thus, rate law becomes
Rate = k2[A2][B] =[A] [B]
[B]1 2
2
k k = k1k2[A]2 = k[A]2
This rate law does not match with the experimental results. Thus, mechanism(i) agrees with the rate law.
1.12 Experimental Methods of Chemical KineticsA kinetic study requires the determination of the concentration (in moldm–3) of at least one of the reactant or product as a function of time. In caseof gaseous phase, in place of concentration, the partial pressure is determined.The method of analysis employed must be faster than the rate of reaction.The conventional methods of analysis can be applied to the reactions whichhave a half-life of at least a few minutes. The measurement of some physicalproperty which is proportional to the concentration/partial pressure can alsobe taken for determination of the rate. In many cases of reactions in solution,it is necessary to take out aliquots from the reaction mixture at suitableintervals of time, arrest the reaction in aliquots by means of suitable meansand then analyse the sample. Some conventional physical methods used tostudy the kinetics of slow reactions are described as follows.
1.12.1 Conductometric MethodIf the reaction system has a ionic species and if there is a change in numberand/or nature of the ionic species during the reaction, the electrical conductanceof the solution can be measured as a function of time. Let us consider thehydrolysis of an ester in presence of NaOH
RCOOR′ + Na+ + OH– → RCOO– + Na+ + R′OH
The conductivity at time t = 0 will be due to only Na+ and OH– while theconductivity at time t = ∞ (when reaction is complete) will be due to contributionof RCOO– and Na+. At any time t, the conductivity will be the result of Na+,OH– and RCOO–. Let y be the number of equivalents of ester that has reactedat any time t, and c the concentration in equivalent per liter. Then specificconductance at t = 0, i.e.
k0 = ( + ) 1000Na OH+ –λ λ C
t = ∞, i.e.
k∞ = ( + ) 1000RCOO Na– +λ λ C

40 Chemical Kinetics and Reaction Dynamics
t = t, i.e.
kC y y
t = ( + ) ( – )
1000 + ( + )
1000Na OH RCOO Na+ – – +λ λ λ λ
and k k yt = + [ – ] /10000 RCOO OH– –λ λ
= k0 + (k∞ – k0) × 1000/c × y/1000
= k0 + (k∞ – k0)y/c (1.60)
Thus, y at any time t can be determined with the relation
yk kk k
ct = – –
0
0∞
⎛⎝
⎞⎠
The kinetics of various ligand exchange reactions have been studied by theconductometric methods.
1.12.2 Polarographic TechniquePolarography is electrolysing a solution of an electroactive substance betweena dropping mercury electrode (DME, microelectrode) and some referenceelectrode (usually a pool of mercury), which acts as anode. The area ofanode is large so that it may be regarded as incapable of becoming polarisedand potential of such an electrode remains fairly constant. On applying thepotential between these two electrodes, the current-voltage relationship isobserved as shown in Fig. 1.7. The curve is known as polarogram.
Cur
rent
Applied voltage
Residual currentDecomposition voltage
Diffusion current
Limiting current
Fig. 1.7 A typical polarogram.
Initially, a small current, called residual current, flows and continues tillthe decomposition potential of reducible ionic species is reached. A furtherincrease in applied potential increases the current linearly and reaches to amaximum value called limiting current. Three factors effect the current thatduring the electrolysis are: (i) migration or an electrical effect which dependsupon the charge and transference number of the electroactive species,(ii) diffusion of all charged and uncharged species in solution between the
Elementary 41
two electrodes and (iii) convection, i.e. the motion of small particles underthe influence of temperature, stirring and mechanical agitation. The migrationeffect is usually eliminated by electrolysis in presence of excess of a supportingelectrolyte. The convection effects are also eliminated by electrolysis undercontrolled conditions. Thus, the only process by which the mass transferoccurs is diffusion and under appropriate conditions, the limiting current isalmost solely a diffusion current. The diffusion current is given by the followingequation:
id = 607 n D1/2 c m2/3 t 1/6 (1.61)
where n is the number of electrons consumed in reduction of one moleculeof the electroactive species (e.g. Mnn++neaM; n = 2), D is diffusion coefficientof the reducible or oxidisable substance in cm2sec–1, c is concentration ofdepolarizer in millimoles per liter, m is rate of flow of mercury from droppingelectrode in mg sec–1 and t is drop time in sec. Thus, the diffusion current isrelated to the concentration of the species getting reduced at the electrode.The diffusion current can be measured at various time intervals andcorresponding concentration can be estimated. A calibration curve relatingdiffusion current and concentration must be prepared in order to estimate thecorrect concentration and to obtain rate constant. The method has been usedto measure the rate of relatively fast redox reactions, e.g.
Fe2+ + V5+ → Fe3+ + V4+
Cd(CN) + CN Cd (CN)3– –
4– –→
1.12.3 Potentiometric MethodThe half-cell potential of metal electrode (M → Mn++ ne) in a solution of itsown ion is given by
E = E 0 + 2.303 RT/(nF) logQM (1.62)
where E 0 is the standard potential of the electrode, n its valency and QM isthe activity of metal-ion. The above equation in terms of pH can be written as
E = E 0 + 2.303 RT/(nF) pH (1.63)
The half-cell potential is thus related with the concentration of the active ionand, therefore, the measurement of half-cell potential can be used to studythe progress of reaction. For example, the formation of complex betweenFe3+ and F– can be studied by measuring the potential of half-cell Fe2+/Fe3+
at various time intervals. Since the complex formation changes the concentrationof Fe3+, the potential of half-cell Fe2+/Fe3+ will also change.
If there is a change in pH of the medium due to reaction and this changecorresponds to the change in concentration of the reactant species (e.g. H+),the measurement of pH as a function of time can also be used to follow theprogress of the reaction.

42 Chemical Kinetics and Reaction Dynamics
1.12.4 Optical Methods
The specific rotation of an optically active substance [ ]α DT at a given
temperature is given by
[ ]α DT = θ/(l × c × M × 1000) (1.64)
where θ is the angle through which polarised light is rotated, l (in decimeters)is the path length of beam of polarised light through the solution, c (moldm–3) is the concentration and M the molecular weight of the substance.Therefore,
c = θ/( [ ]α DT × l × M × 1000)
or c ∝ θ (1.65)
Thus, if optically active substance is involved in the reaction, the change inoptical rotation can be used directly to follow the progress of reaction. Theinversion of sucrose in presence of HCl giving rise to fructose and glucosecan, thus, be monitored polarimetrically.
1.12.5 RefractometryWhenever a beam of light enters from a rarer (air) medium into a densermedium (glass or liquid) it bends towards the normal. Conversely, the beamof light is deflected away from the normal when it leaves a denser mediumto enter a rarer medium (Fig. 1.8). According to Snell’s Law
sin i/sin r = Constant = η
where i and r angles of incidence and refraction, respectively. The constantη is called refractive index and can be defined as
η = (Velocity of light in vacuum)/(Velocity of light in a given medium) = c/cn
The refractive index is a characteristic of a chemical species and dependsupon temperature, wavelength of light and pressure.
The change in refractive index of the reaction mixture can be used tofollow the progress of reaction provided all the constituents present in the
Refracted ray
Angle of refraction
Liquid
Air
Incident ray
Normal
Angle of incidence
Fig. 1.8 Deflection of beam of light from normal.
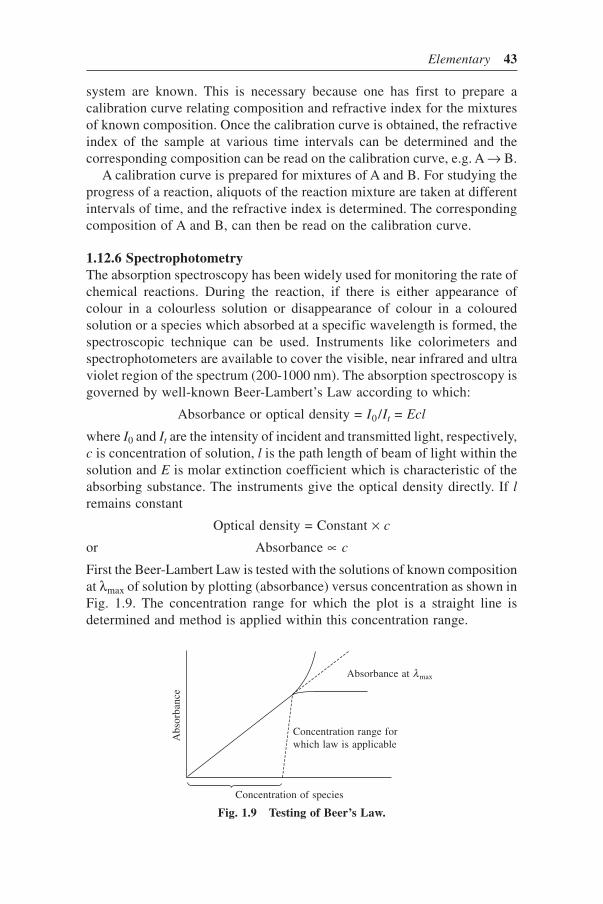
Elementary 43
system are known. This is necessary because one has first to prepare acalibration curve relating composition and refractive index for the mixturesof known composition. Once the calibration curve is obtained, the refractiveindex of the sample at various time intervals can be determined and thecorresponding composition can be read on the calibration curve, e.g. A → B.
A calibration curve is prepared for mixtures of A and B. For studying theprogress of a reaction, aliquots of the reaction mixture are taken at differentintervals of time, and the refractive index is determined. The correspondingcomposition of A and B, can then be read on the calibration curve.
1.12.6 SpectrophotometryThe absorption spectroscopy has been widely used for monitoring the rate ofchemical reactions. During the reaction, if there is either appearance ofcolour in a colourless solution or disappearance of colour in a colouredsolution or a species which absorbed at a specific wavelength is formed, thespectroscopic technique can be used. Instruments like colorimeters andspectrophotometers are available to cover the visible, near infrared and ultraviolet region of the spectrum (200-1000 nm). The absorption spectroscopy isgoverned by well-known Beer-Lambert’s Law according to which:
Absorbance or optical density = I0/It = Ecl
where I0 and It are the intensity of incident and transmitted light, respectively,c is concentration of solution, l is the path length of beam of light within thesolution and E is molar extinction coefficient which is characteristic of theabsorbing substance. The instruments give the optical density directly. If lremains constant
Optical density = Constant × c
or Absorbance ∝ c
First the Beer-Lambert Law is tested with the solutions of known compositionat λmax of solution by plotting (absorbance) versus concentration as shown inFig. 1.9. The concentration range for which the plot is a straight line isdetermined and method is applied within this concentration range.
Abs
orba
nce
Absorbance at λmax
Concentration of species
Concentration range forwhich law is applicable
Fig. 1.9 Testing of Beer’s Law.

44 Chemical Kinetics and Reaction Dynamics
The optical density of samples are measured at different times using samecell (to keep l constant) and concentration can be calculated using relationc = A/El. To verify the order of reaction, optical density data can be useddirectly.
EXERCISES
1. Differentiate between the following:
(a) Order and molecularity.(b) Rate constant and equilibrium constant.(c) Rate constant and specific rate constant.(d) First order and pseudo-first order reaction.
2. What is meant by rate of reaction? How it can be determined experimentally?Explain why the rate cannot be determined by dividing total amount of a reactantreacted by total time taken?
3. What is meant by half-life period (t1/2) of a reaction. Show that ta n1/2 –1
1∝ for
nth order of reaction, where a is initial concentration of the reactant.4. Show that a second-order reaction behave like a first order, if concentration of
one reactant is at least ten times greater than that of other reactant.5. Explain why the H2O in following reactions does not effect the rate of reaction
and reaction is simple first order with respect to the substrate:
C12H22O11 + H2O → C6H12O6 + C6H12O6
CH3COOC2H5 + H2O [H ] +⎯ →⎯ CH3COOH + C2H5OH
6. Explain, why hydrolysis of an ester follows first-order kinetics in presence of anacid and it follows a second-order kinetics in presence of dilute alkali.
7. What is meant by an autocatalytic reaction? Derive an expression for rate constantof a simple autocatalytic reaction.
8. How the graphical method is most useful in determining the order of a reaction?
9. The reaction A k→ P follows the rate law – d c
dtk c
( ) = [ ]3/2 , where c is the
concentration of A at time t. If C0 is initial concentration of A, calculate the half-life period of reaction. Also find units of k.
10. Discuss the various techniques that can be used in determination of the rate of areaction.
11. In an experiment, the following data have been measured for the reactionA + B → C:
[A] × 103 (mol liter–1) 10.0 2.0 30 10.0 10.0[B] × 103 (mol liter–1) 10.0 10.0 10.0 20.0 30.0(Rate) × 102 (mol liter–1 min–1) 2.5 5.0 7.5 2.45 2.5
Determine the order with respect to A and B. Also find the total order of reactionand suggest rate law.
12. For a gaseous reaction between A and B, the half-life period (t1/2) were measuredand data reported are

Elementary 45
PA (mm) 400 200 200PB (mm) 20 40 20t1/2 (min) 40 40 20
Find the order with respect to A and B. Suggest rate law and evaluate the rateconstant.
13. A second-order reaction in which both the reactants were at same initialconcentration was 50% completed in 500 sec. How long will it take to complete75% of the reaction? Determine the rate constant also.
14. A first-order reaction has the rate constant = 1.0 × 10⁻⁴ sec–1at 298 K. Calculatethe half-life period of the reaction.
15. Derive an expression for the rate constant of a reaction having order n. Alsocalculate the half-life period.

2Temperature Effect on
Reaction Rate
It has been observed that in homogeneous thermal reactions, for every tendegree rise in temperature, the rate constant is doubled or tripled. The ratioof rate constants at two temperatures separated by 10°C is called the temperaturecoefficient. Mathematically
Temperature coefficient = + 10
2 to 3k
kt
t≈ (2.1)
For majority of reactions the temperature coefficient lies between 2 and 3.However, it has also been found to be less than 2 or greater than 3 in somespecific reactions.
The first mathematical relation between the rate constant k and absolutetemperature T was given by Hood (1878) as
ln k = A – B/T (2.2)
where A and B are constants for the reaction system. The values of A and Bmay be obtained from the intercept and slope of the linear plot between ln kand 1/T.
The Hood’s equation was based on the experimental results. Some theoreticalsignificance to this equation was given by Vant Hoff (1884) on the basis ofthe effect of temperature on equilibrium constants. This idea was extendedby Arrhenius in his attempt to obtain the relation between rate constant andtemperature. The relation obtained was successfully applied by him to theeffect of temperature data for a number of reactions and the equation isusually called the Arrhenius equation.
2.1 Derivation of Arrhenius EquationLet us consider a general reaction
A ` BA 1
1
B==
E k
k
E′

Temperature Effect on Reaction Rate 47
where k1 is forward rate constant and ′k1 backward rate constant are relatedwith equilibrium constant, Kc for the reaction as
K k kc 1 1 = / ′ (2.3)
Again, let ∆E = EA – EB, i.e. the energy change.The variation of equilibrium constant Kc with absolute temperature can be
given by Vant Hoff’s relation,
d KdT
E RTc(ln ) = / 2∆ (2.4)
Substituting the values of Kc and ∆E, the above equation becomes
d k kdT
E ERT
(ln / ) =
– 1 1 A B2
′(2.5)
Equation (2.5) can be split into two equations, viz.
d kdT
ERT
Z(ln )
= + 1 A2 (2.6)
d kdT
ERT
Z(ln )
= + 1 B2
′(2.7)
where Z is a constant and can be set equal to zero. From equations (2.6) and(2.7) it can be considered that the rate constant is always related with energy
of the reactant. And, therefore, for a general reaction A P,E
k→ the followingrelation may be given
d kdT
ERT
(ln ) = 2 (2.8)
Integrating above equation and assuming E as independent of temperature,we get
ln k = – E /RT + Z ′ (2.9)
where Z ′ is an integration constant.Equation (2.9) is similar as Hood’s equation and can also be written as
k = Ae–E/RT (2.10)
where A is constant and is usually known as frequency factor or Arrheniusfactor for the reaction and E is known as energy of activation. When thereaction occurs, there exists an equilibrium between the reactants on theone hand and a particular collision complex on the other. This complexrepresents a special type of collision complex, which is generally calledactivated complex.

48 Chemical Kinetics and Reaction Dynamics
The energy required to pass the reactant to activated complex is known asenergy of activation or the activation energy as shown in Fig. 2.1.
A + B X C + DReactant Activated
complexProduct
→ →≠
∆H
Activated complex
Products(Final state)
Reactants(Initial state)
Activation energyfor forward reaction
Activation energyfor backward reaction
Fig. 2.1 Energy representation and Eact.
2.2 Experimental Determination of Energy of Activation andArrhenius Factor
Equation (2.10) can be written in the form
log k = log A – Eact/2.303RT (2.11)
According to equation (2.11) a plot of log k versus 1/T will be linear with
Fig. 2.2 Arrhenius plot.
0 1/T
log A
log
k Slope = Eact /2.303R
a negative slope (Fig. 2.2) equal toEact/2.303R and an intercept equal tolog A. Thus, the values of Eact andArrhenius factor may be determinedwith the help of slope and intercept,respectively.
This law has been applied andfound to be obeyed with high accuracyfor all types of chemical reactions.The energy of activation may also becalculated by another form of theArrhenius equation as follows:
log (k1/ k2) = Eact/2.303R [1/T2 – 1/T1] (2.12)
where k1 and k2 are rate constants at two different absolute temperatures T1
and T2, respectively.According to equation (2.10), a plot of k versus T is shown in Fig. 2.3.The value of k reaches the constant value z asymptotically. For most of the
reactions, k remains in lower (rising) part of curve in the accessible temperaturerange. However, in reactions involving free radicals or atoms with very lowactivation energy k reaches a value of z asymptotically and in these conditions

Temperature Effect on Reaction Rate 49
the value of z is also a function of temperature. Therefore, a more accurateequation must be used as follows:
k AT en E RT = – /act (2.13)
or ln k = – Eact/RT + n ln T + ln A (2.14)
where exponent n has a particular value depending on nature of reaction.In treating the experimental data by equations (2.10) and (2.13), the activation
T
z
k
Fig. 2.3
energy will differ and the differenceof the two activation energies willbe of hundreds or a few thousands ofcalories per mole. According toequation (2.14), a plot of log k versus1/T will show a slight curvature(Fig. 2.4).
Sometimes the curve may beresolved into two parts, each of whichapproaches linearity. This may beobserved in the case where twocompeting reactions with differentactivation energies take place or same
Fig. 2.4 Plot of log k versus 1/T.
1/T
log
k
reaction may occur—both homogenously (higher activation energy) andheterogeneously (lower activation energy).
Problem 2.1 The values of rate constants for reaction
2HI [ H2 + I2
were observed as 3.0 × 10⁻⁵ mol–1 dm3s–1 and 2.5 × 10⁻³ mol–1dm3s–1 at357°C and 447°C, respectively. Calculate the Eact for forward and backwardreaction of ∆H = 15.5 kJ mol–1.
Solution For Eact (forward)
( )8.314
1630
– 1720
= ln 2.50 103.0 10
act for–3
–5
E ⎛⎝
⎞⎠
××
⎧⎨⎩⎫⎬⎭

50 Chemical Kinetics and Reaction Dynamics
Hence, (Eact)forward = 185.08 kJ mol–1
We have ∆H = (Eact)forward – (Eact)backward
or (Eact)backward = (Eact)forward – ∆H = 185.08 – 15.5 = 169.58 kJ mol-1.
2.3 Potential Energy SurfacePotential energy surface (PES) can be understood by making a plot of energyas a function of various interatomic distances in the complex that is formedduring the reaction. For simplicity, let us consider a simplet chemical reactionbetween an atom A and a diatomic molecule BC to yield another atom C anda diatomic molecule AB as
A + BC A – B – C AB + CReactants Activated complex Products
→ →
The activated complex must be described in terms of three internucleardistances, i.e. RAB, RBC and RAC or in terms of two internuclear distances andangle between the bonds. Thus, in order to plot energy against three parameters,a four dimensional diagram would be necessary. However, if only a linearactivated complex (A–B–C ) is considered, only two distances are involved(because RAC = RAB + RBC) and a three dimensional diagram is adequateto describe the energy variation with internuclear distances as shown inFig. 2.5.
Fig. 2.5 Schematic diagram of a potential energy surface for a collinear reactionA + BC →→→→→ AB + C.
The course of reaction may be considered to be transition on potentialenergy surface from point P to Q. Point R represents the activated complexA–B–C.
To trace the course of such reaction it is necessary to make the quantummechanical calculations corresponding to a number of points in the interiorof the diagram, i.e. at different number of values of RAB and RBC. Eyring andPolanyi made such calculations which were based on theoretical treatment
R
Energy
P
A + BC
RAB
RBC
AB + C
Endo
ThermoneutralExo
Q

Temperature Effect on Reaction Rate 51
of London. These calculations have shown that starting from points P and Q(Fig. 2.5), there are two valleys, which meet in the interior of the diagram ata point which is known as col or saddle point. The results are indicated bycontour lines shown in Fig. 2.6.
RAB
A + BC
RBC
AB + C
Saddle point
Fig. 2.6 Potential energy contour diagram for a thermoneutral reaction.Dashed line is the minimum energy path and the arrows indicatethe direction of reaction.
The reaction path is represented by the dashed line. In order to pass thesystem from point P to Q, using the minimum amount of energy, it will travelalong the first valley over the saddle point and down into the second valley.The energy corresponding to saddle point is minimum energy from one pointof view and maximum energy from another view point. It is minimum energysince the system cannot pass from P to Q by using less energy than thisenergy while it is maximum energy because the system travels along its path,the saddle point represents the highest point in the path. The height of saddlepoint represents the activation energy of the system. The saddle point generallylies in the entrance channel in exothermic reactions and lies in exit channelin case of endothermic reactions.
2.4 Significance of Energy of ActivationThe activation energy of a chemical reaction may conveniently be consideredusing method of potential energy surface.
As the reactants approach each other, there is some repulsion leading to amaximum barrier when the reactants are close to each other and subsequentlythere is a drop in the energy leading to the separation of products. Thismeans that before the chemical reaction can occur, the reactants involvedmust be raised to a higher energy level, i.e. they must be in an energy rich oractivated state before they can react. The variation of energy of a reactingsystem (A + B → C + D) in relation to the reaction coordinate (all internucleardistances and structural variation) can be represented as shown in Fig. 2.7.
There is minimum energy level for the reaction denoted by Ex to whichthe reactant molecules must be raised in order to enable them to convert

52 Chemical Kinetics and Reaction Dynamics
into products. Since reactants already having the energy ER, the additionalenergy
A + B → X≠ → C + D
i.e. EX – ER must be acquired by the reactants to undergo transformation.This additional amount of energy, which should be supplied to reactants inorder to form the activated complex is known as energy of activation. Thisadditional energy may be supplied in any form, i.e. mechanical, chemical orthermal. This concept that molecules must possess the activation energybefore they can undergo the chemical change has now been universallyaccepted for all reactions.
For the reverse reaction.
C + D → X≠ → A + B
Again the C and D (which are now reactants) must reach the level of EX byacquiring energy ′Eact and thus be activated to be transformed into A and B.It is also clear from Fig. 2.7 that energies of activation for forward andbackward reactions may be same or different depending on the nature ofreaction. For a thermoneutral reaction, ∆H = 0, energy of activation for bothdirection is same. For endothermic reaction, E Eact act > ′ while for exothermicreaction ′E Eact act > . However, knowing Eact and ′Eact , ∆H can be evaluated.It is also understood that higher the value of energy of activation, the reactionwill be slower.
Problem 2.2 Prove that for nth order reaction, the plot of ln t1/2 versus 1/T isa straight line and slope of the line is equal to Eact.
Ene
rgy
Reaction coordinate
X#
EX
ER
A + B (Reactant)
Eact (forward)
′Eact (backward)
C″ + D″Endo
∆H
∆H
C + D
C′ + D′
Thermoneutral
Exo
EP
Fig. 2.7 Energy-reaction coordinate diagram for reaction (ER: energy of reactant;EP: energy of products; EX: energy corresponding to activated complex(also known as threshold energy); ∆∆∆∆∆H: heat of reaction).
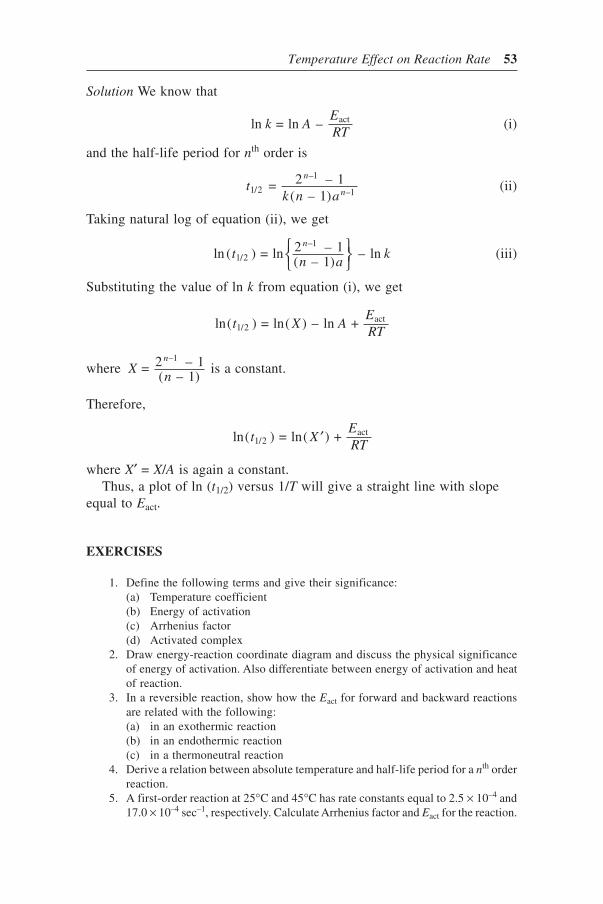
Temperature Effect on Reaction Rate 53
Solution We know that
ln = ln – actk AERT
(i)
and the half-life period for nth order is
tk n a
n
n1/2
–1
–1 = 2 – 1( – 1)
(ii)
Taking natural log of equation (ii), we get
ln ( ) = ln 2 – 1( – 1)
– ln1/2
–1t
n ak
n⎧⎨⎩
⎫⎬⎭
(iii)
Substituting the value of ln k from equation (i), we get
ln( ) = ln( ) – ln + 1/2actt X A
ERT
where Xn
n = 2 – 1
( – 1)
–1 is a constant.
Therefore,
ln( ) = ln( ) + 1/2actt X
ERT
′
where X′ = X/A is again a constant.Thus, a plot of ln (t1/2) versus 1/T will give a straight line with slope
equal to Eact.
EXERCISES
1. Define the following terms and give their significance:(a) Temperature coefficient(b) Energy of activation(c) Arrhenius factor(d) Activated complex
2. Draw energy-reaction coordinate diagram and discuss the physical significanceof energy of activation. Also differentiate between energy of activation and heatof reaction.
3. In a reversible reaction, show how the Eact for forward and backward reactionsare related with the following:(a) in an exothermic reaction(b) in an endothermic reaction(c) in a thermoneutral reaction
4. Derive a relation between absolute temperature and half-life period for a nth orderreaction.
5. A first-order reaction at 25°C and 45°C has rate constants equal to 2.5 × 10⁻⁴ and17.0 × 10–4 sec–1, respectively. Calculate Arrhenius factor and Eact for the reaction.

54 Chemical Kinetics and Reaction Dynamics
6. The rate constant of a reaction becomes double on increasing the temperaturefrom 20°C to 30°C. Calculate Eact.
7. Calculate the ratio of rate constants of two reactions which have some value ofArrhenius factor and a difference of 5 k mol–1 in Eact at 25°C.
8. A reaction has an activation energy of 50 kJ mol-1. Calculate the ratio of rateconstant at 117°C and 127°C.
9. The following data was obtained for a reaction:
t°C k × 104(sec–1)
35 3.8140 5.1145 7.6750 12.70
Plot log k versus 1/T and determine Eact from slope of the straight line. Check theanswer using method of least squares.
10. Derive Arrhenius equation and explain how the parameters involved in equationcan be determined experimentally?
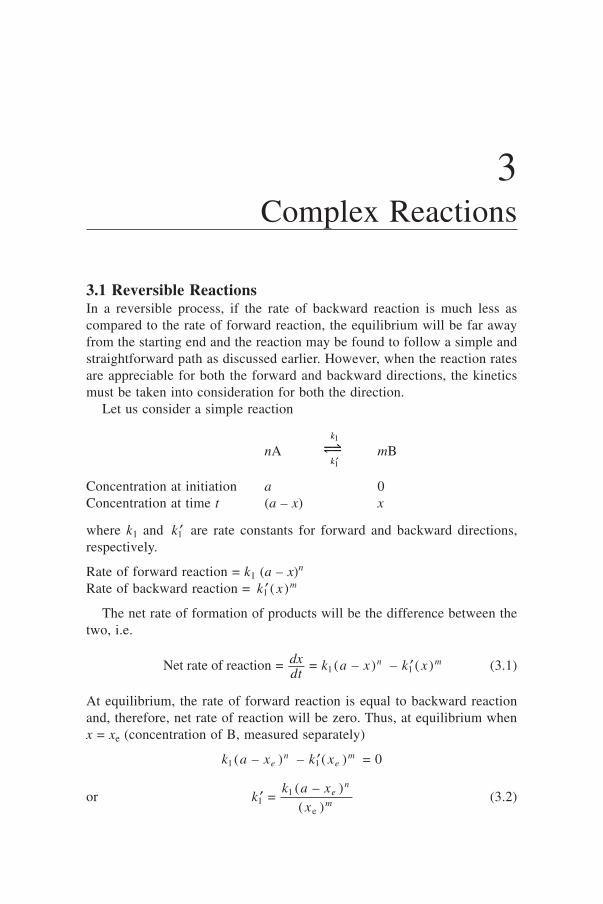
3Complex Reactions
3.1 Reversible ReactionsIn a reversible process, if the rate of backward reaction is much less ascompared to the rate of forward reaction, the equilibrium will be far awayfrom the starting end and the reaction may be found to follow a simple andstraightforward path as discussed earlier. However, when the reaction ratesare appreciable for both the forward and backward directions, the kineticsmust be taken into consideration for both the direction.
Let us consider a simple reaction
nA ==1
1
′k
k
mB
Concentration at initiation a 0Concentration at time t (a – x) x
where k1 and ′k1 are rate constants for forward and backward directions,respectively.
Rate of forward reaction = k1 (a – x)n
Rate of backward reaction = ′k x m1 ( )
The net rate of formation of products will be the difference between thetwo, i.e.
Net rate of reaction = = ( – ) – ( )1 1dxdt
k a x k xn m′ (3.1)
At equilibrium, the rate of forward reaction is equal to backward reactionand, therefore, net rate of reaction will be zero. Thus, at equilibrium whenx = xe (concentration of B, measured separately)
k a x k xen
em
1 1( – ) – ( ) = 0′
or ′kk a x
xe
n
m11
e =
( – )( )
(3.2)

56 Chemical Kinetics and Reaction Dynamics
Substituting the value of ′k1 from equation (3.2), in (3.1), we get
dxdt
k a xk a x x
xn
n m
m = ( – ) – ( – )
11 e
e
ordxdt
kx
a x x a x xmn m n m = [( – ) – ( – ) ]1
ee e (3.3)
If reaction is simple first order in both directions, i.e.
A ==1
1
′k
k
B
equation (3.3) reduces to
dxdt
k ax
x x = ( – )1
ee
which on integration gives
kxat
xx x1
e e
e = ln
– ⎛⎝
⎞⎠ (3.4)
The measurement of x at different times would give the value of k1. Thevalue of ′k1 can be obtained with the help of equation (3.2), which reducesto
′kk a x
x11 e
e =
( – )( ) (3.5)
An alternate expression may also be used if equilibrium concentration xe isnot known. Equation (3.1) for above simple reaction can be reduced to
dxdt
k a x k x k a k k x = ( – ) – ( ) = – ( + )1 1 1 1 1′ ′
On integration, we get
tk k
k a k k x z = – 1( + )
ln { – ( + ) } + 1 1
1 1 1′ ′
The value of integration constant z is obtained as follows:
When t = 0, x = 0; zk k
k a = 1( + )
ln ( )1 1
1′
Substituting the value of z and rearranging, gives
( + ) = 1 ln – ( + )1 1
1
1 1 1k k
tk a
k a k k x′ ′
⎛⎝
⎞⎠ (3.6)
Complex Reactions 57
Again, equilibrium constant K = k1/ ′k1 and, therefore, equation (3.6) can bewritten in terms of K as
kt K
KaKa K x1 = 1
( + 1) ln
– ( + 1)⎛⎝
⎞⎠ (3.7)
Thus, with the help of equations (3.6) and (3.7), the values of k1 and ′k1 canbe obtained.
For a given reaction at constant temperature, the equilibrium concentrations,i.e. (a – xe) and xe attain the definite values depending on the value of a andtherefore, a/xe can be considered to be a constant under these conditions. Thedifferential equation can be written as
dxdt
k x x = ( – )1 e′′ (3.8)
where ′′k k a x1 1 e = / .Equation (3.8) on integration and rearrangement becomes
′′ ⎛⎝⎜
⎞⎠⎟
kt
xx x1
e
e = 1 ln
– (3.9)
Also k a x k x1 e 1 e( – ) = ′
orkk
a xx
1
1
e
e =
– ′
ork k
kax
1 1
1 e
+ =
′ (adding 1 on both sides in equation)
Therefore, k kk ax
k1 11
e1 + = = ′ ′′
Thus, equation (3.9) becomes
k kt
xx x1 1
e
e + = 1 ln
– ′ ⎛
⎝⎜⎞⎠⎟
(3.10)
Therefore, the reaction will behave like a first order with ( + )1 1k k ′ as therate constant and xe as the initial concentration in place of a.
3.1.1 Reversible Reaction When Both the Opposing Processes areSecond Order
Let us consider a general reaction
A + B ` C + D==1
1
′k
k

58 Chemical Kinetics and Reaction Dynamics
Concentration at starting a b c dConcentration at time t (a – x) (b – x) (c + x) (d + x)
The net rate of reaction can be written as
dxdt
k a x b x k c x d x = ( – )( – ) – ( + )( + )1 1′ (3.11)
or 1 = ( – )( – ) – ( + ) ( + );1′k
dxdt
K a x b x c x d x where Kkk
= 1
1′
= K [ab – (a + b)x + x2] – [cd + (c + d)x + x2]
= (K – 1)x2 – K{(a + b) + (c + d)}x + K(ab – cd)
or 1( – 1)
= – {( + ) + ( + )}
– 1 +
( – ) – 11
2
′k Kdxdt
xK a b c d
Kx
K ab cdK
= x2 – Lx + M (3.12)
where LK a b c d
KM
K ab cdK
= {( + ) + ( + )}
– 1 and =
( – ) – 1
.
Again, equation (3.12) can be written as
1 –
= – – – 4
2 –
+ – 421 1
2 2
k kdxdt
xL L M
xL L M
′⎛
⎝⎜
⎞
⎠⎟
⎛
⎝⎜
⎞
⎠⎟
= (x – A) (x – B)
where A L L M B L L M = 12
( – – 4 ) and = 12
( + – 4 )2 2 .
The above equation can also be written as
dxx A x B
k k dt( – )( – )
= ( – )1 1′
or 1( – )
1( – )
– 1( – )
= ( – )1 1A B x A x Bdx k k dt⎛
⎝⎞⎠ ′
Which, on integrating and rearranging, gives
k kt A B
B x AA x B1 1 – = 1
( – ) ln
( – )( – )
′ ⎛⎝
⎞⎠ (3.13)
Since K = k1/ ′k , knowing the value of equilibrium constant, k1 and ′k1 can bedetermined.
Problem 3.1Find the values of kf and kb for reaction
Complex Reactions 59
A ` B==f
k
k
b
if [A]0 = 0.30 mol dm–3 [A]e = 0.172 mol dm–3
[A]10 = 0.285 and [A]100 = 0.21 M
Solution
kk
a xx
f
b
e
e =
– = 0.30 – 0.172
0.172 = 0.744
Again aa x
k ta xx x –
= ln – – e
fe
t e
⎧⎨⎩
⎫⎬⎭
0.300.30 – 0.172
10 = ln 0.30 – 0.1720.285 – 0.172fk ⎧
⎨⎩
⎫⎬⎭
kf = 5.31 × 10⁻³ sec–1
0.300.30 – 0.172
100 = ln 0.30 – 0.1720.21 – 0.172fk ⎧⎨
⎩⎫⎬⎭
kf = 5.18 × 10⁻³ sec–1
kf–3 –1
average = 5.25 10 sec×
kb
–3–3 –1 = 5.25 10
0.744 = 7.05 10 sec× ×
3.2 Parallel ReactionsWhen a reactant in the reaction undergoes in more than one pathway givingrise to different products, the reactions are termed as parallel or side reactions,e.g.
A
L
Mor A + B
L
M
3.2.1 Determination of Rate ConstantsConsider a parallel reaction as follows:
L
M
A
n1, k1
n2, k2
Let a be the initial concentration of A and x the amount of A disappeared intime t, partly as L and partly as M. Let n1 and n2 be the orders of reaction

60 Chemical Kinetics and Reaction Dynamics
with respect to A and k1 and k2 the rate constants for paths 1 and 2, respectively.Then,
dxdt
= Rate of formation of L + Rate of formation of M
=[L]
+ [M]d
dtd
dt
Againddt
k a x n[L] = ( – )1
1 (a)
ddt
k a x n[M] = ( – )2
2 (b)
Therefore,dxdt
k a x k a xn n = ( – ) + ( – )1 21 2 (3.14)
If the reaction is first order with respect to reactant in both the paths, i.e.n1 = n2 = 1, equation (3.14) reduces to
dxdt
k k a x = ( + )( – )1 2
ordx
a xk k dt
( – ) = ( + )1 2
On integration, we get
( + ) = 1 ln ( – )1 2k k
ta
a x(3.15)
Thus, the value of the sum of two rate constants can be found by followingthe concentration changes in reactant with time.
Further, for the determination of individual values of k1 and k2, followingrelation between k1 and k2 is needed
Rate of formation of LRate of formation of M
= ( – )
k ( – ) = = (say)1
2
1
2
k a xa x
kk
z (3.16)
The estimation of L and M at any state will give the value of ratio of k1/k2.Using equations (3.15) and (3.16), the individual rate constants k1 and k2 canbe evaluated.
For a simple second order reaction, which is first order with respect toeach reactant, i.e.
L
M
k1
k2A
(a – x)B
(b – x)+

Complex Reactions 61
The differential rate law may be given as
dxdt
k a x b x k a x b x = ( – )( – ) + ( – )( – )1 2
= (k1 + k2)(a – x) (b – x)
The above equation, on integration will give
( + ) = 1( – )
ln ( – )( – )1 2k k
t a bb a xa b x
⎛⎝
⎞⎠ (3.17)
Again, using equations (3.16) and (3.17) the individual rate constants k1 andk2 can be evaluated.
Equation (3.16) is valid only when the orders of two parallel reactions aresame (Wegschider test). However, if order of two side reactions˛is not same,an alternate method may be applied as follows:
From equations (a) and (3.14), we get
ddx
k a xk a x k a x
n
n n
[L] =
( – )( – ) + ( – )
1
1 2
1
1 2= 1
1 + ( / )( – )2 1–2 1k k a x n n (3.18)
According to equation (3.18), a plot between [L] (i.e., concentration ofone of the product) and x will give a curve, and tangent of the curve atx = 0 will be equal to {1 + (k2/k1) a n n( – )2 1 . Thus for (n2 – n1) = 1, the ratio(k2/k1) may be determined. However, when (n2 – n1) >1, the determination of(n2 – n1) is also involved.
Problem 3.2 For a reversible reaction
A ` P==2
1
k
k
k1 is 4.0 × 10⁻² s−1 and k2 is half of k1. Initial concentration of A is2.0 mol dm−3. At what time the concentration of P will be 1.0 mol dm−3.
Solution
kk
xa x
1
2
e
e =
–
4.0 102.0 10
= 2.0 –
–2
–2e×
×x
xe
Thus xe = 1.33 mol dm−3
Again kxat
xx x1
e e
e = ln
– ⎛⎝⎜
⎞⎠⎟

62 Chemical Kinetics and Reaction Dynamics
or tx
ax
x x =
2.303 log
– = 2.303 1.33
2.0 log 1.33
1.33 – 1.00e e
e
⎛⎝
⎞⎠
× ⎛⎝
⎞⎠
= ~ 56 sec approximately
Problem 3.3For a side reaction
A 11
k P→
k P21→
Prove that [P1] : [P2] = k1 : k2.
SolutionLet A0 is initial concentration of A
–[A]
= [A] + [A]1 2d
dtk k
–[A]
= ( + )[A]1 2d
dtk k
–[A]
[A] = ( + ) 1 2
dk k dt
Integrating with the condition that when t = 0, [A] = A0, we get
[A] = 0–( + )1 2A e k k t
or [A] = A0e–kt, where k = k1 + k2
Nowd P
dtk
d Pdt
k[ ]
= [A] and [ ]
= [A]11
22
Taking d P
dtk k A e kt[ ]
= A] = 11 1 0
–[ and integrating, we get
Pkk
A e zkt1
10
– = – + (integration constant)
When t = 0, P1 = 0 and therefore, zkk
A = 10 .
Substituting the value of z, we get
Pkk
A e kt1
10
– = (1 – )
Similarly Pkk
A e –kt2
20 = (1 – )

Complex Reactions 63
Therefore, PP
kk
1
2
1
2 =
3.3 Consecutive ReactionsThe reactions in which the reactants are converted to products through oneor more intermediate stages are called consecutive reactions. The overallreaction is a result of several consecutive steps. Every stage has its ownreactant and rate constant.
Let us consider a simple reaction
A B C1 2 k k→ →
The concentration of the reactant A decreases regularly with time while thatof intermediate B increases, passes through a maximum and then finallydecreases to zero. The value of maximum concentration will depend on therate of its formation and rate of its disappearance. The formation of finalproduct C will start after formation of a certain amount of intermediate.Therefore, the final product will be formed with a certain induction period.
Let c0 be the initial concentration and c1, c2 and c3 be the concentrationsof A, B and C, respectively, at any time t, then
c0 = c1 + c2 + c3 (3.19)
The concentration of various species at different time is obtained by solvingthe corresponding differential equations.
The rate of disappearance of A is given as
–[A]
or – = 11 1
ddt
dcdt
k c
Integrating, we get
c c e k t1 0
– = 1 (3.20)
Equation (3.20) gives the concentration of reactant A at any time t.Again,
Rate of formation of B, dc2/dt = k1c1
Rate of disappearance of B, –dc2/dt = k2c2
Therefore, rate of accumulation of B in the system, i.e.
dc2/dt = k1c1 – k2c2
or dc2/dt + k2c2 = k1 c0 e–kt (c1 = c0 e k t– 1 ) (3.21)
This is a differential equation in terms of c2 and can be integrated by
multiplying ek t2 on both sides of equation

64 Chemical Kinetics and Reaction Dynamics
edcdt
k c e k c e ek t k t k t k t2 2 1 222 2 1 0
– + = = 1 0( – )2 1k c e k k t
Integrating, we get
c ek c
k ke k k t zk t
21 0
2 12 1
2 = –
( – ) + (constant)
when t = 0, c2 = 0 and, therefore, z = – k1 c0 / (k2 – k1).Substituting the value of z, the above equation becomes
c ek c
k kek t k k t
21 0
2 1
( – )2 2 1 = –
( –1)
or ck c
k ke ek t k t
21 0
2 1
– – = –
( – )1 2 (3.22)
The value of c3 may be obtained by substituting the values of c1 and c2
from equations (3.20) and (3.22), respectively, in equation (3.19). Thus, weget
c ck
k ke
kk k
ek t k t3 0
2
2 1
– 1
1 2
– = 1 – –
– –
1 2⎛⎝
⎞⎠ (3.23)
which reduces to
c c e k k c c e k kk t k t3 0
– / )2 1 3 0
–1 2 = (1 – ) when >> and = (1 – ) when >> 1 2
Thus, with the knowledge of initial concentration c0 and experimentaldetermination of c1, c2 and c3 at any time t, the value of k1 and k2 may beevaluated.
3.3.1 Concentration-Time RelationIt is clear from equation (3.20) that c1 decreases exponentially while theamount of product c3 will rise until it approaches that of A.
Equation (3.22) shows that c2, i.e. concentration of the intermediate willfirst increase and then decrease. The concentration-time plots for variousspecies are given in Fig. 3.1.
The concentration of intermediate c2 will be maximum when dc2/dt = 0,
i.e.dcdt
k ck k
k e k ek t k t2 1 0
2 11
–2
– 2 = –
(– + ) = 01 2 (3.24)
or k e k ek t k t1
–2
–1 2 =
or k k e k k t1 2
( – )/ = 1 2
or tk kk k
= ln – ln
– 1 2
1 2(3.25)

Complex Reactions 65
Thus, time at which the concentration of intermediate is maximum, willdepends on the rate constants k1 and k2.
Problem 3.4 For a first order parallel reaction, the Arrhenius factor forformation of two products are 1010 and 108 sec−1 and their energy of activationare 150 and 75 kJ mol−1, respectively. At what temperature the two productswill be formed at the same rate?
Solution
A1 = 1010; Eact = 150 kJ mol–1
A2 = 108; Eact′ = 75 kJ mol–1
k1 = A1e – Eact/RT = 1010–
150 108.314
3
e T×
×
k A e E RT e T2 2 act
8–
75 108.314 = – / = 10
3
′
××
k1 = k2
10 = 1010–
150 108.314 8
–75 108.314
3 3
e eT T×
××
×
Taking log on both sides, we get
2.303 10 – 150 108.314 T
= 2.303 8 – 75 108.314
3 3× × × ×
T
2.303 (10 – 8) = (150 – 75) 10
8.314
3
× ×× T
2.303 2 = 75 108.314
3× ×
× T
T = 75 102.303 2 8.314
= 1958.5 K3×
× ×
B
CA⎯→
⎯→
Con
cent
rati
on
Time
B
C
A
Product
ReactantIntermediate
Fig. 3.1 Variation of concentration with time.

66 Chemical Kinetics and Reaction Dynamics
Problem 3.5 For two parallel reactions of the same order, the rate constantsare k1 and k2 and the energies of activation are E1 and E2, respectively. Prove
that apparent overall energy of activation Ek E k E
k k =
+ +
.1 1 2 2
1 2
Solution Let x moles of first product are formed. The number of moles ofother product will be 1–x.
Energy of activation per mole of A = E1
For x mole, energy of activation = xE1
Similarly, the energy of activation for product B = (1 – x) E2
Thus E = xE1 + (1 – x) E2
again[Product A][Product B]
= /( + )/( + )
= (1 – )
1 1 2
2 1 2
k k kk k k
xx
When one mol of reactant disappears x mol of A and (1 – x) moles of B are
formed Ek
k kE
kk k
Ek E k E
k k =
+ +
+ =
+ +
1
1 21
2
1 22
1 1 2 2
1 2
Problem 3.6 If the initial concentration of A is 2.0 mol dm –3 and k1 and k2
are 0.30 and 0.15 min–1, respectively, at what time the concentration of B inthe following reaction will be maximum:
A B C1 2k k→ →
Also calculate the maximum concentration of B.
Solution
Time (max) = ln – ln
– =
ln (0.30) – ln (0.15)(0.30) – (0.15)
= 0.600.15
= 4 min1 2
1 2
k kk k
[B] = [A] = 2.0 0.150.30
= 1.0 mol dmmax 02
1
–0.15
0.30–0.15 –3
2
1 2kk
kk k⎛
⎝⎞⎠
⎛⎝
⎞⎠
3.4 Steady-State TreatmentMany reactions which seem to be quite simple are indeed very complex. Thereactions proceed in different steps. In such stepwise complex reactions, theoverall reaction rate is determined by the slowest step among different steps.Various intermediate or unstable species are produced in different steps.Thus, a reaction involving many steps will lead to complex equations. Inorder to express the overall rate of a complex reaction in terms of the individualrate constants, a special treatment is required. In simple procedure, theintermediates such as the atoms and free radicals, the concentrations of

Complex Reactions 67
which are necessarily low, are assumed to have a constant concentrationduring the course of reaction. According to steady-state treatment, it may beassumed that the rate of formation of intermediate is equal to its rate ofdisappearance, or
net[Intermediate]
= 0d
dt
This way, simple expressions for the concentration of intermediates canbe obtained and hence an equation for the overall rate can be derived.
3.5 Chain ReactionsMany reactions proceed through series of self repeating steps involvingformation of active species called free radicals, as intermediates. These specieseither regenerate themselves or produce other active species that can carryon the reaction and are responsible for the formation of products. Suchreactions are called chain reactions.
The chain reaction, in general, involves following three steps:
(a) Initiation step: In this step the intermediate or free radicals which areresponsible to carry on the reaction, are formed from the ordinary molecules.For example in the reaction of H2 and Br2, at the first stage, the molecules ofbromine are dissociated into atoms
Br2 → Br + Br (chain initiation) (i)
(b) Propagation step: The initiation step is followed by reactions leading tothe formation of the product with simultaneous generation of one or morereactive species. Such steps are called propagation steps
Br + H2 → HBr + H (ii)
H + Br2 → HBr + Br (iii)
Br atom which leads to the formation of HBr in steps (ii) and (iii) is alsorequired to continue the cycle. These self-propagating steps are likely tocontinue through repeated generation of chains of H and Br atoms. Thus, forany initial Br atom, the formation of a large number of HBr would result.
(c) Termination step: The removal of the active species from the participationin the propagation steps results in breaking of the chain and stopping of thereaction. This step is called termination step. For example, when two Bratoms come together to unite into a Br2 molecule, the chain is broken andstopped
Br + Br → Br2 (termination step) (iv)
In any controlled chain reaction steps (a) to (c) are essentially present.However, in some chain reactions, a step, which may inhibit the process,may also be involved. This step is called inhibition step. For example, in Br2

68 Chemical Kinetics and Reaction Dynamics
and H2 reaction, a collision between H atom and HBr inhibit the process andinhibition step is also present
H + HBr → H2 + Br (inhibition step) (v)
3.5.1 Rate DeterminationLet us consider a general chain reaction
A ki nF→ ˙ (initiation) (i)
˙ ˙F + B Fp + Pk→ (propagation) (ii)
˙ ˙F + F F2kt→ (termination) (iii)
Now,
Rate of initiation = ddt
ddt
nki[F]
= –[A]
= [A]˙
(3.26)
Rate of propagation = [P]
= [Fp ][B]ddt
k ˙ (3.27)
which is also rate of formation of product
Rate of termination = 2 [F]kt˙ (3.28)
For determination of the rate of formation of product, the concentration ofintermediate free radical, i.e. [F]˙ must be known. For determination of [F]˙ ,the steady state approximation with respect to [F]˙ can be applied, since it isusually present in very small concentrations. According to steady stateapproximation, the rate of formation of intermediate must be equal to rate ofits disappearance.
Since F is formed in above steps (i) and (ii) and disappears in steps (ii)and (iii), therefore
nk k k ki p p t [A] + [F][B] = [F][B] + 2 [F]2˙ ˙ ˙
Hence, [F] = [A]
2
1/2˙ nk
ki
t
⎛⎝
⎞⎠ (3.29)
On substituting the value of [F]˙ in equation (3.27), the rate of propagationstep can be given as
Rate of propagation = 2
[A] B]1/2
1/2knkkp
i
t
⎛⎝
⎞⎠ [ (3.30)

Complex Reactions 69
3.5.2 Reaction between H2 and Br2Consider the following reactions:
Br Br + Br2ki→ (i)
Br + H HBr + H21
k p→ (ii)
H + Br HBr + Br22
k p→ (iii)
H + HBr H + Br2inhk⎯ →⎯ (iv)
Br + Br Br2kt→
Rate of formation of product
ddt
k k kp p[HBr]
= [Br][H ] + [H][Br ] – [H][HBr]1 22 2 inh (a)
For determination of rate of reaction, [Br] and [H] must be known and canbe determined by applying steady state approximation with respect to [H]and [Br], respectively.
On applying the steady state approximation with respect to [H], we get
k k kp 2 p 2 inh1 2[Br][H ] = [H][Br ] + [H][HBr] (b)
or [H] = [Br][H ]
[Br ] + [HBr]p 2
p 2 inh
1
2
kk k (c)
Applying the steady state with respect to [Br], we get
k k k k ki 2 p 2 inh t2
p 2[Br ] + [H][Br ] + [H][HBr] = [Br] + [Br][H ]2 1 (d)
From equations (b) and (c), we get
ki[Br2] = kt[Br]2
or [Br] = [Br ]i
t
1/2
21/2k
k⎛⎝
⎞⎠ (e)
Substituting the value of [Br] in equation (c), the value of [H] becomes
[H] = ( ) [Br ] [H ]
[Br ] + [HBr]p i t
1/22
1/22
p 2 inh
1
2
k k kk k
/(f)
Again, from equations (a) and (b), we get
ddt
k[HBr]
= 2 [H][Br ]p 22 (g)
Substituting the value of [H] from equation (f), the rate of reaction becomes

70 Chemical Kinetics and Reaction Dynamics
ddt
k k k kk k
[HBr] =
2 ( / ) [Br ] [H ][Br ] + [HBr]
p p i t1/2
23/2
2
p 2 inh
1 2
2
ord
dtk k k k
k k[HBr]
= 2 ( / ) [Br ] [H ]
1 + [HBr]/ [Br ]p p i t
1/22
1/22
inh p 2
1 2
2(3.31)
3.5.3 Chain LengthThe average number of chain propagation steps taking place for every singlechain carrier generated in the initiation step is called the chain length andcan be measured by determining the ratio of overall rate of propagationreaction to the rate of initiation step, i.e.
Chain length = Rate of propagation
Rate of initiation(3.32)
3.5.4 Chain Transfer ReactionsSometimes in chain reactions, the active species are free radicals, which areinitially formed and reacts with a reactant molecule to give a new activespecies. This active species in turn reacts again with a reactant molecule toform yet another new active species. This way, at every stage of propagation,a new active species of higher molecular weight is formed. The mutualcombination of two chain carriers or inactivation of a chain carrier maycause the termination of the chain. Such type of reactions are called chaintransfer reactions. Polymerization involving free radicals in propagation aregood examples of such reactions. The general mechanism is given as
˙ ˙ ˙F F + F2 ik→ initiation
˙ ˙F + A AFp1k⎯→⎯
AF + A A F
2p2˙ ˙k⎯ →⎯ propagation
. . . . . . . . . . . . . . .
A F + A A F–1pn
nk
n˙ ˙⎯→⎯
AF + AF (AF) 2
t˙ ˙ k→ termination
3.5.5 Branching Chain ExplosionsSome reactions proceed explosively. The explosion are of two types (i)thermal explosion and (ii) explosion depends on chain reaction. The basicreason for a thermal explosion is the exponential dependence of reaction rateon the temperature. In an exothermic reaction, if the evolved energy cannotescape, the temperature of the reaction system increases and this acceleratesthe rate of reaction. The increase in reaction rate produces heat at an evengreater rate. As the heat cannot escape, hence the reaction is even faster. Thisprocess continues and an explosion occurs.
⎫
⎬⎪⎪
⎭⎪⎪

Complex Reactions 71
The other basic type of explosion depends on a chain reaction. In somechain reactions, each chain carrier produces more than one free radical inpropagation steps resulting in a rapid increase in the concentration of activespecies with time with a consequent rapid increase in the reaction rate. Thisin turn would further increase the production of free radicals. The reactionthus occurs instantaneously and an explosion takes place. The chain is calledto branch when an active species or chain carrier produces more than onefree radical or carrier, e.g.
H2 → H + H (chain initiation) (a)
H + O2 → OH + O(chain branching) (b)
O + H2 → OH + H
OH + H2 → H2O + H (chain propagation) (c)
In (b) and (c), it can be seen that from each H atoms, two radicals O andH are produced which propagate the chain. Thus, a branching of chain occurs.When reactions proceed to some extent, the amount of free radicals wouldbe very large and an explosion would occur. The free radicals may also bedestroyed mainly by collision with the walls.
Below a certain pressure, the reaction takes place slowly and smoothly. Atlow pressure, the active species or radicals reach the surface easily and getdestroyed. The rate of destruction of radicals counter balances the increaseof formation of radicals from branching of the chain. Hence, the reactionproceeds smoothly.
On increasing the pressure, the rate of diffusion of the radicals to thewalls decreases and therefore the rate of destruction of radicals also slowsdown while the rate of propagation and branching increases. Thus due to aconsiderable rise in concentration of radicals the rate of reaction increasesenormously leading to an explosion. This is called lower explosion limit anddepends upon the size and shape of the vessel.
On further increasing the pressure, the radicals more readily destroyinternally in the gas than at the walls. This results in the removal of theactive species or radicals and any increase in production of radicals is againcounter balanced. The reaction, therefore, proceeds smoothly. The third limitis due to thermal explosion. In exothermic reactions when the reaction iscarried out in closed space, the heat generated cannot be dissipated. Thereaction rate suddenly becomes very rapid and a thermal explosion occurs.These limits are shown in Fig. 3.2
3.5.6 Kinetics of Branching Chain ExplosionLet n be the number of chain carrier or radicals formed from each initialradical (F)˙ which is produced from the reactant A. Then the mechanism, ingeneral, will be as follows:
⎫⎬⎭

72 Chemical Kinetics and Reaction Dynamics
A F ik→ ˙
A + F P + F p˙ ˙k
n→
F Destruction tk→
The termination constant kt involves two rate constants, i.e. rate constants,due to gas phase destruction kg and rate constant due to wall destruction kw.For smooth reaction the steady state conditions with respect to F shouldprevail.
On applying the steady state conditions with respect to F , we get
k nk k ki p p t[A] + [A][F] = [A][F] + [F]˙ ˙ ˙
or [F] = [A]
+ [A](1 – )i
t p
˙ kk k n
(3.33)
For reactions, where n = 1
[F] = [A]
= [A]i
t
˙ kk
k ′′ (3.34)
When n >1, the branching of chain is involved. If n is large enough so that
kt = kp [A] (n – 1), [F]˙ tends to infinity and explosion occurs.At low pressure kw is large and (kw + kg), i.e. kt >> kp [A] (1 – n), i.e. rate
of destruction is greater than rate of formation of intermediate species andreaction occurs smoothly.
At high pressure, when kw falls, the rate of formation of reactive speciesbecomes large, i.e., kp [A] (1 – n) > kt and explosion occurs. Further increasein pressure lowers the value of kw but kg will increase and again the conditionof (kw + kg) >> kp [A] (1 – n) prevails which slows down the rate.
3.5.7 Free Radical ChainsRice, Hetzfeld and others explained the kinetic laws governing many organic
Pressure
Rat
e
I II III Limits
Sm
ooth
Rea
ctio
n
Exp
losi
on
Exp
losi
on
Sm
ooth
Rea
ctio
n
Fig. 3.2 Explosion in branching chain reactions.

Complex Reactions 73
reactions on the basis of chain propagation through free radicals. For example,the thermal decomposition of acetaldehyde, decomposition of ethane etc.
(a) Thermal decomposition of acetaldehyde: The following mechanism inwhich formation of methyl radical is involved in initiation step has beenproposed for thermal decomposition of acetaldehyde:
(i) CH CHO CH + CHO3
31k⎯→⎯ ˙ ˙ initiation
(ii) CHO CO + H 2k⎯→⎯(iii) H + CH CHO H + CH CO3
2 3
3k⎯ →⎯ ˙
(iv) CH CO CH + CO3
34k⎯→⎯
propagation(v) CH + CH CHO CH + CH CO3 3
4 3
5k→
(vi) 2CH C H3
2 66˙ k→
(vii) ˙ ˙CH + CH CO CH COCH3 3
3 37k⎯→⎯ termination
(viii) 2CH CO CH COCOCH3
3 38˙ k→
Applying the steady state treatment for CHO and H, we get
k k1 3 2[CH CHO] = [CHO]˙
and k k2 3 3[CHO] = [H][CH CHO]˙
Therefore,
[H] = k1/k3 (a)
From steady state treatment for [CH ]3˙ and [CH CO]3
˙ , we get
k k k k1 3 4 3 5 3 3 6 32[CH CHO] + [CH CO] = [CH ][CH CHO] + [CH ]˙ ˙
+ [CH ][CH CO]7 3 3k ˙ (b)
and
k k k k3 3 5 3 3 4 3 7 3 3[H][CH CHO]+ [CH ][CH CHO] = [CH CO]+ [CH ] [CH CO]˙ ˙ ˙ ˙
+ [CH CO]8 32k ˙ (c)
It is probable that the CH3 radical is the most abundant chain carrier andtherefore, neglecting steps (vii) and (viii), the equation may be written as
k k k k1 3 4 3 5 3 3 6 32[CH CHO] + [CH CO] = [CH ][CH CHO] + [CH ]˙ ˙ ˙ (d)
kkk
k k31
33 5 3 3 4 3[CH CHO] + [CH ][CH CHO] = [CH CO]⎛
⎝⎞⎠
˙ ˙ (e)
where [H] = k1/k3 (equation (a)).
⎫⎬⎭
⎫⎬⎭
74 Chemical Kinetics and Reaction Dynamics
From equations (d) and (e), we get
[CH ] = 2 [CH CHO]
31 3
6
1/2˙ k
k⎧⎨⎩
⎫⎬⎭
(f)
The rate of disappearance of acetaldehyde may be given as
–[CH CHO]
= [CH CHO] + [H][CH CHO] + [CH ][CH CHO]31 3 3 3 5 3 3
ddt
k k k ˙
= k1[CH3CHO] + k3(k1/k3) [CH3CHO]
+2 [CH CHO]
[CH CHO]51 3
6
1/2
3kk
k⎧⎨⎩
⎫⎬⎭
= 2 [CH CHO] + (2 )
[CH CHO]1 3 51
6
1/2
33/2k k
kk
⎛⎝
⎞⎠ (g)
If step (i) is relatively slow, the rate law (g) reduces to
–[acetaldehyde]
= [CH CHO]33/2d
dtk ′′ (h)
where ′′ ⎛⎝
⎞⎠k k
kk
= 2
51
6
1/2
.
Therefore, the order of the reaction is 1.5, which has been observedexperimentally.(b) Decomposition of ethane: Pease (1928) proposed the following chainradical mechanism for decomposition of ethane:
(i) C H CH + CH2 6
3 31k→ ˙ ˙ (initiation)
(ii) CH + C H CH + C H3 2 6
4 2 52k→
(iii) C H C H + H2 5
2 43k⎯ →⎯
(iv) H + C H C H + H2 6
2 5 24k→
(propagation)
(v) H + C H C H2 5
2 65k⎯→⎯ (termination)
Applying steady state conditions for [CH3], we get
k1[C2H6] = k2 [CH3] [C2H6]
Therefore [CH3] = k1/k2 (a)
Again applying steady state conditions for [C2H5] and [H], we get
k k k k2 3 2 6 4 2 6 3 2 5 5 2 5[CH ][C H ] + [H][C H ] = [C H ] + [H][C H ]˙ (b)
and k3[C2H5] = k4[H] [C2H6] + k5[H] [C2H5] (c)
⎫⎬⎭

Complex Reactions 75
From equations (a), (b) and (c), we can get
2k5 [H] [C2H5] = k1[C2H6] (d)
and k3 [C2H5] = k1 [H] [C2H6] (e)
Dividing equation (d) by (e), we get
2 = 1
[H]5
3
kk
or [H] = 2
3
5
1/2kk
⎛⎝
⎞⎠ (f)
Therefore, [C2H5] can be obtained as
[C H ] = [H][C H ]2 51
32 6
kk (from equation (e))
=2
[C H ]1
3
3
5
1/2
2 6kk
kk
⎛⎝
⎞⎠ (g)
Now, rate of reaction is given as
ddt
k[C H ]
= [C H ]2 43 2 5
=2
[C H ]31
3
3
5
1/2
2 6kkk
kk
⎛⎝
⎞⎠ (from equation (g))
=2
[C H ] = [C H ]13
5
1/2
2 6 2 6kkk
k⎛⎝
⎞⎠ (h)
where k = k1 (k3/2k5)1/2. Hence, the reaction is first order.
3.5.8 Chain Length and Activation Energy in Chain ReactionsThe chain length of chain reaction is defined as follows:
Chain length = Rate of overall reactionRate of initiation
For example, in case of thermal decomposition of acetaldehyde
Chain length = (2 / ) [CH CHO]
[CH CHO]=
2[CH CHO]5 1 6
1/23
3/2
1 35
1 6
1/2
31/2k k k
kk
k k⎛⎝
⎞⎠
The energy of activation in such chain reactions can be evaluated from thoseof the individual steps in the process. For example, in decomposition ofacetaldehyde, we have

76 Chemical Kinetics and Reaction Dynamics
–[acetaldehyde]
= 2
[CH CHO]51
6
1/2
33/2d
dtk
kk
⎛⎝
⎞⎠
= 2. . [CH CHO]5– / 1
– /
6– /
1/2
33/25
1
6√ ⎛
⎝⎜⎞⎠⎟
A eA eA e
E RTE RT
E RT (can be written as)
where A1, A5 and A6 are frequency factors and E1, E5 and E6 are the activationenergies for the corresponding steps (i), (v) and (vi), respectively.
Or
–[acetaldehyde]
= 2. [CH CHO]51
6
1/2–(2 + – /2 )
33/25 1 6
ddt
AAA
e E E E RT√ ⎛⎝
⎞⎠
Therefore, Eact for overall reaction is
Eoverall = 12
[2E5 + E1 – E6]
Problem 3.7 (Chain Reaction) The thermal decomposition of acetone isfound to follow the rate law as
–[acetone]
= [acetone]i
t
1/2
pd
dtkk
k⎛⎝
⎞⎠
and Eact for initiation, propagation and termination steps are 350, 200 and50 kJ mol−1, respectively. Calculate overall Eact.
Solution
( ) = 12
[( ) – ( ) ] + ( )act overall act ini act termi act proE E E E = 12
[350 – 50] + 200
= 150 + 200 = 350 kJ mol–1
EXERCISES
1. Determine the values of rate constants k1 and k2 in the following reactions:
(a) AB
C
k1
k2
(b) A B C 1 2k k→ →
(c) A B2
1
[k
k
2. Discuss the mechanism of the following reaction
H2 + Br2 → 2HBr
and show that
ddt
kk
[HBr] =
[H ][Br ]1 + [HBr]/[Br]
2 21/2
′′

Complex Reactions 77
3. What is meant by steady state approximation? Determine the rate law, i.e. ddt[P]
in the following reaction, using the steady state approximation:
A + B I2
1
1[k
k
I + C I13
2k→
I P24k→
What will beddt[P]
if,
(i) k2 >> k3
(ii) k3 >> k2
4. Following is the decomposition of O3 in the mechanisms
O O + O (fast)3 2[
O + O2 → 2O2 (slow)
Show that –[O ]
= [O ]
O3 3
2
2
ddt
k .
5. In reaction
A B C 1 2k k→ →
show that [B] = [A]max o2
1
/( – )2 1 2kk
k k k⎛⎝⎜
⎞⎠⎟
and tk k
k kmax1 2
1 2 =
ln( / ) –
where tmax is the time at which concentration of B is maximum.6. In reaction
show that [B] : [C] = k1 : k2.7. A reaction has following mechanism:
A + B I + I (fast)2
1
1 2[k
k
I + B P + I (slow)1
1 23k→
2I P2
24k→
where A and B are reactants, P1 and P2 are products, I1 and I2 are reactionintermediates. Find rate of reaction in terms of reactants and total order of reaction.
8. For reaction A B C 1
3
2k
k
k
⎯→⎯ [ ; k2 is twice the value of k3. Show that at the completion
of reaction the ratio [B] : [C] will be 1/3 : 2/3.
>
>A
k1
k2
B
C

78 Chemical Kinetics and Reaction Dynamics
9. Consider the following mechanism:
H (Para) 2H (initiation)2 01k→
H0 + H2 (Para) p k→ H2 (ortho) + H* (propagation)
H + H H (termination)0 0 i2
k→
Determine the rate of propagation, chain length and Eact for the reaction.
10. One mole of reaction gives two moles of the product A 2Bb
f[k
k⎛⎝⎜
⎞⎠⎟
, where
kf = 2.0 × 10⁻² s–1 and kb = kf. If the initial concentration of reaction, i.e. [A]0 =2.0 mol dm–3, at what time the concentration of product will be 1.0 mole dm–3.

4Theories of Reaction Rate
4.1 Equilibrium and Rate of ReactionThe feasibility (i.e. direction and extent of the chemical change) and mechanism(i.e. study of rate and factors effecting it) are two important aspects, whichshould be distinguished clearly while considering a chemical reaction. Thereis no simple connection between the two aspects. For a general reaction
aA + bB ==cC + d D
The equilibrium constant is defined as
Kc d
a bc = [C] [D][A] [B]
Kc does not depend on concentrations but depends on temperature. At thegiven temperature, if the equilibrium concentrations of C and D are higherthan those of A and B and indicates high value of Kc, then A and B havereacted to a considerable extent. On the other hand, if Kc is small, there willbe little of C and D at equilibrium. Thus, the extent of chemical reaction isdetermined by equilibrium constant and is not related in any simple way tothe rate or velocity of reaction with which the chemical change takes place.The reaction between two reactants may occur to almost completion, but thetime for even very small fraction of the molecules to react may be extremelylong.
The theory of equilibrium is treated on the basis of thermodynamicsconsidering only the initial and final states. Time or intermediate states haveno concern. However, there is a close relationship between the theory ofrates and the theory of equilibria, in spite of there being no general relationbetween equilibrium and rate of reaction. A good approximation of equilibriumcan be regarded between the reactants and activated state and the concentrationof activated complex can, therefore, be calculated by ordinary equilibriumtheory and probability of decomposition of activated complex and hence therate of reaction can be known.

80 Chemical Kinetics and Reaction Dynamics
4.2 Partition Functions and Statistical Mechanics ofChemical Equilibrium
Partition function Q per unit volume of a molecule represent the energyincrease at absolute zero temperature when molecule reacts and is defined as
Q g e e k T = i i– /i bΣ (4.1)
where kb is the Boltzmann constant, e i is the energy with respect to zeropoint energy for a given energy state of the molecule and gi the number ofstates corresponding to that level. Since the energy include electronic Ee,transitional Et, vibrational Ev and rotational energy Er, we have
e E E E Ei e t r v = + + + i i i i (4.2)
The partition function, therefore, becomes
Q g e g e g e g eE k T E k T E k T E k Te = i e
– /t
– /v
– /r
– /i
i bi
t i bi
vi bi
ri bΣ (4.3)
Equation (4.3) can be written as
Q q q q q Q Q Q Q = = ee
tt
rr
vv
e t r v (4.4)
where qe, qt, qr and qv are partition functions for each degree of freedom forelectronic, translational, rotational and vibrational changes, respectively, ande, t, r and v are respective degrees of freedom.
The partition function has thus been factorised so that each term may beevaluated separately. The partition function for electronic energy is given by
Q g ei
E k Teii e
– / = ibΣ (4.5)
At ordinary temperatures the excited energy levels of an atom or moleculeare usually too high to make significant contribution to the partition function.If the lowest state is singlet state, the statistical weight ge is unity. Thus iflowest state is taken as the zero level, the other levels are sufficiently highand the partition function is approximately unity.
For translation motion, the partition functions of each degree of freedomis given by
qmk T
htb
1/2
= (2 )π
· l (4.6)
where h is Planck’s constant and l the distance in x-direction through whichthe molecule of mass m is allowed to move. For 3 degrees of freedom oftranslation, the product of such three functions is the partition function perunit volume for translational motion and is given by
Qmk T
htb
3/2
3 = (2 )π
(4.7)

Theories of Reaction Rate 81
The rotational partition function is given as
QIk T
hr
2b
2 = 8π
(4.8a)
(for linear molecule which has only 2 degrees of rotational freedom) whereI is the moment of inertia of the molecule and
QABC k T
hr
2 3 1/2b
3/2
3 = 8 (8 ) ( )π π
(4.8b)
(for non-linear molecule which has 3-degrees of rotational freedom) whereA, B and C are the moment of inertia about three mutually perpendicularaxis.
A molecule consisting of N atoms has 3N total degrees of freedom. Out ofthese 3N degrees of freedom, three relate to translational motion and 2 or 3(depending on linear or nonlinear molecule, respectively) relate to rotationalenergy. Remainder degrees of freedom, i.e. 3N – 5 in case of linear moleculeand 3N–6 in case of nonlinear molecule apply for vibrational energy. In diatomicmolecule, which will be linear, there will be 3 degrees of freedoms fortranslational motion, 2 for rotational motion and 3N – 5, i.e. (3 × 2) – 5 = 1degree of freedom for vibrational motion. The partition function for vibrationalmotion is
Q ei
h k Tv
– / –1 = (1 – )bΣ ν (4.9)
where ν is the vibrational frequency/sec. For a diatomic molecule partitionfunction consists of a single function, i.e.
q e h k Tv
– / –1 = (1 – )bν (4.10)
Table 4.1 gives the expressions for partition functions and approximate orderof magnitude.
Table 4.1 Partition functions
Motion Degree of Partition function Order offreedom magnitude
Translational 3 (2π mkbT )1/2/h3 1024-1025
Rotational linear 2 8π2IkbT /h2 10-102
Non linear 3 8π2(8π3ABC)1/2(kbT)3/2/h3 102-103
Vibrational 1 (1 – )– v/ b –1e h k T 1-10
Restricted rotation 1 (8π2IkbT )3/2/h 1-10
The equilibrium constant, for a general reaction
aA + bB == cC + dD

82 Chemical Kinetics and Reaction Dynamics
in terms of partition function may be written as
KQ Q
Q Qe
c d
a bE RT
cC D
A B
– / = 0 (4.11)
where Q’s are the partition functions per unit volume of the molecules A, B,C and D and E0 is the energy increase at the absolute zero when a moles ofA react with b moles of B, to give c moles of C and d moles of D, allsubstances being in their standard states.
Since the energy is the amount of energy that the reactant must acquire at0°K, before they can react, E0 is the hypothetical energy of activation at thistemperature. The partition functions in this expression must be evaluatedwith respect to zero point levels of the respective molecules.
4.3 Partition Functions and Activated ComplexLet us consider a equilibrium between reactants and activated complex asfollows:
A + B ==K
X≠
≠
• Number of atoms NA NB (NA + NB)• Total degree 3NA 3NB 3(NA + NB)
of freedom• Translational 3 3 3
degree of freedom• Rotational 2 2 2 (for linear molecules)
degree of freedom3 3 3 (for linear molecules)
• Vibrational 3NA – 5 3NB – 5 3(NA + NB) – 6degree of freedom (linear mole)
3NA – 6 3NB – 6 3(NA + NB) – 7(non-linear mole)
The equilibrium constant for formation of activated complex (K≠) is given by
KX≠
≠ =
[ ][A][B]
(4.12)
This equilibrium constant in terms of the appropriate partition functionscan be written as
KQ
Q Qe E RT≠
≠ =
A B
– /0 (4.13)
In activated complex, one degree of vibration has been considered of adifferent character from the rest, since it corresponds to a very loose vibration

Theories of Reaction Rate 83
which allows the complex to dissociate into products. Hence, this vibrationaldegree of freedom will vanish during the dissociation of complex into theproducts. In case of activated complex the vibrational degrees of freedom,therefore, have been taken as 3(NA + NB) – 6 (when molecule is linear) or3(NA + NB) – 7 (when molecule is nonlinear) in place of 3(NA + NB) – 5or 3(NA + NB) – 6.
Since the vibrational partition function is given by (1 – – / –1be h k Tν ) , thevalue of this function when ν → zero, becomes
lim 11 –
= 11 – (1 – / )
= 0 – /
b
bbν ν ν ν→ e h k T
k Thh k T (4.14)
where only first term has been taken in expansion.The term kbT/hν should be included in the equilibrium constant given by
equation (113). Therefore, the equation becomes
KX k T
hQ
Q Qe E RT≠
≠ ≠ =
[ ][A][B]
= b
A B
– /0
ν (4.15)
The concentration of activated complex is given by the following equation:
[ ] = [A][B]b
A B
– /0Xk Th
QQ Q
e E RT≠≠
ν (4.16)
4.4 Collision TheoryAccording to collision theory, the collision between the reactant moleculesis the first step in the chemical reaction. The rate of reaction will be proportionalto the number of collisions per unit time between the reactant, but it has beenobserved that not every collision between the reactant molecules results in areaction. When we compare the calculated number of collisions per secondwith the observed reaction rate, we find that only a small fraction of the totalnumber of collisions is effective. There can be following reasons why acollision may not be effective.
(i) During the collisions some of the molecules having low energy (lessthan the energy of activation) are not capable of undergoing transformation.This can be understood with the help of energy-reaction coordinate diagramshown in Fig. 4.1.
If the sufficient energy (≈ Eact) has been provided to the reactants and thereactants have reached at energy level A, i.e. energy of activated complex,the collision between the reactants will result in the formation of activatedcomplex and the activated complex would yield the products. However, ifreactants are not having sufficient energy (i.e. they are at energy level B), thecollision between the reactants would not result in the formation of activatedcomplex. Therefore, the collision will be ineffective. Thus, only those collisions,in which reactant molecules have sufficient energy (≥ Eact) are useful collisions.

84 Chemical Kinetics and Reaction Dynamics
(ii) The molecules are not properly orientated or aligned during the collisions.The importance of the proper orientation of molecules during the collisionmay be considered with the following example (Fig. 4.2) where alignment(a) leads to reaction while alignment (b) does not. In case (b), the molecule B B is not properly oriented and one B atom is far away and not capableof forming bond with any atom of A.
Fig. 4.1 Energy-reaction coordinate diagram.
Ene
rgy
A
B
Reactants
Eact
Activated complex
Products
Reaction coordinate
(a)Reactants Transition state Products
A
A B
BA B
BA
(b)
A
AB B
A
AB B
A
A
B B
Fig. 4.2
On the basis of above discussions we can express the rate as the productof three factors as
Number of effectivecollisionscc/sec
Totalnumber ofcollisions/cc/sec
Fraction of collisions thathave sufficientenergy ( )
Fraction of collisions thathave properorientationact
=⎧⎨⎪
⎩⎪
⎫⎬⎪
⎭⎪×
≥
⎧
⎨⎪
⎩⎪
⎫
⎬⎪
⎭⎪
×⎧
⎨⎪
⎩⎪
⎫
⎬⎪
⎭⎪
E
or
Rate = {Collision frequency} × {Energy factor} × {Orientation factor}
4.4.1 Collision FrequencyIf we take three molecules of reactant A and three molecules of reactant B ina container, each molecule of reactant A can collide with three molecules of

Theories of Reaction Rate 85
reactant B and the total number of collisions between reactants A and B willbe 3 × 3 = 9. The number of collisions is, therefore, proportional to theproduct of number of molecules of reactants, i.e.
No. of collisions ∝ (No. of molecules of A) × (No. of molecules of B)
Now let us consider the reaction between two gases A and B.Let nA and nB be the number of molecules per unit volume of gases A and
B, respectively. Let mA and mB be the masses of molecules of A and B,respectively and σA and σB be their diameters. Again, let us assume thatmolecule of gas A is moving with a velocity uA and colliding with themolecule of gas B which is stationary (Fig. 4.3).
uA
B
AA(σA + σB)
Fig. 4.3
uA
B
AA
Fig. 4.4
In one second, molecule A travels a distance uA and collides with moleculeB. In traveling the distance uA, molecule A not only collides with one moleculeof B, but will collide with all the molecules of B, which are present in thisdistance.
Number of molecules of B present in distance uA = π σ σA B2
A B + 2
⎛⎝
⎞⎠ u n
Number of collisions/sec/cc when all themolecules of A collide with molecules of B
However, in above derivation it has been assumed that molecules of B arestationary, which is not correct. Because the molecules of gases are movingwith different velocities and cannot be assumed to be stationary. Thus, the
average velocity of molecules uA may be replaced by 8 / ,bk T πµ where kb
is Boltzmann’s constant and µ the reduced mass given by
1 = 1 + 1A Bµ m m
The number of collisions sec/cc, i.e. collision frequency may be given as
Collision frequency = + 2
8A B bA Bπ σ σ
πµ⎛⎝
⎞⎠
k Tn n (4.17)
When the collision is between the molecules of a single reactant takingσA = σB = σ, mA = mB = m and nA = nB = n, the equation reduces to
Collision frequency = 2 /2 2bσ πn k T m (4.18)
= + 2
A B2
A B Aπ σ σ⎛⎝
⎞⎠ u n n

86 Chemical Kinetics and Reaction Dynamics
4.4.2 Energy FactorAt a given temperature the molecules of a substance have an average velocityand, therefore, an average kinetic energy. The average kinetic energy ischaracteristic of the substance. But all the molecules do not travel with thesame velocity. Some molecules move faster than the average velocity whilesome move slower. The distribution of energy is shown in Fig. 4.5(a). Thenumber of molecules with a particular velocity or energy is greatest for avelocity near the average and decreases as the velocity becomes longer orsmaller than the average.
Num
ber
of m
olec
ules
of
apa
rtic
ular
ene
rgy
(a) (b)
E1
E2
(E2 > E1)
Average
Energy
Fig. 4.5 Energy: (a) distribution and (b) collision.
The collisions of particular energies E1 and E2 are shown in Fig. 4.5(b).It is evident that greater the value of energy, smaller the number of molecules(hence the collisions) having that energy.
The proportion of molecules having a particular energy, at temperature Tis given by the Boltzmann’s factor (assuming only translational energy alongtwo degrees of freedom) as
n nE
e E RTi 0
i – // = Number of molecules having energy
Total number of molecules = i
Therefore, if n0 is total number of molecules of the reaction, the n numberof molecules having energy ≥ Eact can be given as
n n e E RT/ = 0– /act
Since the number of collisions is directly proportional to the number ofmolecules, we get
Z Z n n e E RT/ = / = 0 0– /act
where Z0 is total collision and Z the effective collision in which moleculeshave energy ≥ Eact. Thus
Z Z e E RTeffective 0
– / = act (4.19)
and e E RT– /act gives the fraction of collisions with energy ≥ Eact.
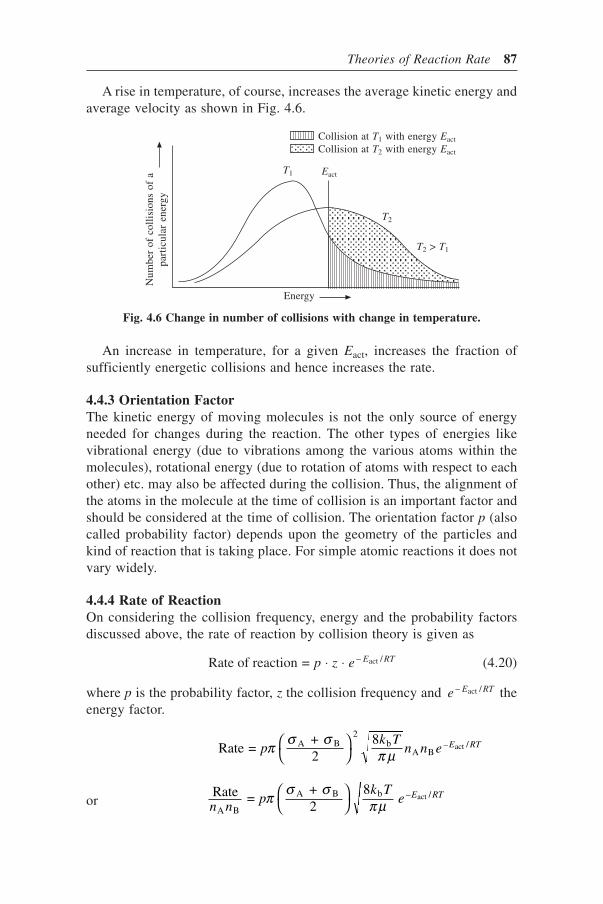
Theories of Reaction Rate 87
A rise in temperature, of course, increases the average kinetic energy andaverage velocity as shown in Fig. 4.6.
T1 Eact
T2
T2 > T1
Energy
Num
ber
of c
olli
sion
s of
apa
rtic
ular
ene
rgy
Collision at T1 with energy Eact
Collision at T2 with energy Eact
Fig. 4.6 Change in number of collisions with change in temperature.
An increase in temperature, for a given Eact, increases the fraction ofsufficiently energetic collisions and hence increases the rate.
4.4.3 Orientation FactorThe kinetic energy of moving molecules is not the only source of energyneeded for changes during the reaction. The other types of energies likevibrational energy (due to vibrations among the various atoms within themolecules), rotational energy (due to rotation of atoms with respect to eachother) etc. may also be affected during the collision. Thus, the alignment ofthe atoms in the molecule at the time of collision is an important factor andshould be considered at the time of collision. The orientation factor p (alsocalled probability factor) depends upon the geometry of the particles andkind of reaction that is taking place. For simple atomic reactions it does notvary widely.
4.4.4 Rate of ReactionOn considering the collision frequency, energy and the probability factorsdiscussed above, the rate of reaction by collision theory is given as
Rate of reaction = – /actp z e E RT⋅ ⋅ (4.20)
where p is the probability factor, z the collision frequency and e E RT– /act theenergy factor.
Rate = + 2
8A B2
bA B
– /actpk T
n n e E RTπ σ σπ µ
⎛⎝
⎞⎠
orRate =
+ 2
8
A B
A B b – /act
n np
k Te E RTπ σ σ
π µ⎛⎝
⎞⎠

88 Chemical Kinetics and Reaction Dynamics
or k pk T
e E RT(rate constant) = + 2
8A B2
b – /actπ σ σπ µ
⎛⎝
⎞⎠ (4.21)
(Rate/nAnB = Rate constant in cc/mol/sec).Equation (4.21) gives the rate constant for a bimolecular reaction in terms
of collision theory.For simple atomic reactions (p = 1), the rate constant in cc/mole/sec can
be given as
k Nk T
e E RT = + 2
8A B2
b – /actπ σ σπ µ
⎛⎝
⎞⎠ (4.22)
Comparing equation (4.22) with Arrhenius equation, i.e. k Ae E RT = – /act , theArrhenius factor (or frequency factor) is given as
A Nk T
= + 2
8 liter mol secA B
2b –1 –1π σ σ
π µ⎛⎝
⎞⎠ (4.23)
The expression on right hand side of equation (4.23) is known as collisionnumber Z. The frequency factor of the reaction is, therefore, identified withcollision number. In reactions between two like molecules, the expressionfor the frequency factor becomes
A Nk Tm
= 2 2 bσ π(4.24)
4.4.5 Weakness of the Collision TheoryAlthough the collision theory of reaction rates is evidently satisfactory whenapplied to a number of reactions, it fails conspicuously in many cases suchas rapid chain reactions, reactions involving complex molecules etc. Thecollision theory has been oversimplified and suffers from following weaknesses:
1. No attempt has been made to correlate the value of probability factor pwith the structure and properties of the reacting molecules and it is also notpossible to interpret the abnormally high rates that we sometimes observe.The value of p has been found to vary from unity to 10–9 when we movefrom simple atomic reaction to reactions involving complex molecules. Thereis no explanation in terms of collision theory for such a wide variation in thevalue of p.
Consider the reaction
A + B ` 2AB2 2 ==2
1
k
k
From collision theory, we get

Theories of Reaction Rate 89
k p Z e E RT1 1 1
– / = (forward reaction)1
k p Z e E RT2 2 2
– / = (backward reaction)2
Then, the equilibrium constant
Kkk
p Zp Z
e E E RT = = 1
2
1 1
2 2
–( – )/1 2 (4.25)
Again, the equilibrium constant in terms of free energy change is given as
K = e–∆G/RT = e∆S/Re–∆H/RT, (∆G = ∆H – T∆S) (4.26)
where ∆G, ∆S and ∆H are the increase in free energy, entropy and enthalpy,respectively.
On comparing equations (4.25) and (4.26), we get
p Zp Z
e e eE E RT S R H RT1 1
2 2
–( – )/ / – /1 2 = ∆ ∆ (4.27)
If the molecules A2, B2 and AB are of comparable dimensions, Z1 = Z2 and
also e eE E RT H RT–( – )/ – /1 2 .≈ ∆ Therefore,
pp
e S R1
2
/ = ∆ (4.28)
i.e. ratio of probability factor must be approximately equal to e∆S/R (entropyterm). Therefore, the probability factor must be interpreted in terms of entropyconsideration in a precise manner.
2. The reacting molecules might acquire the energy from translational,potential, vibrational and rotational energies. In collision theory, the moleculeshave been treated as hard spheres undergoing elastic collisions and in terme E RT– /act only the translational energy involving two degrees of freedom hasbeen considered. The whole kinetic energy is not involved. The moleculeshave a structure with rotational and vibrational degrees of freedom and theyshould be taken into account in considering the effective collision.
3. The intermolecular distance at which the reaction can occur may alsobe different from the collision diameter taken in the collision theory.
4. The collision theory is silent on the cleavage and formation of bondsinvolved in the reaction.
4.5 Transition State TheoryThe transition state theory (also known as absolute reaction rate theory) wasfirst given by Marcellin (1915) and then developed by Erying and Polanyi(1935). According to this theory, the reactant molecules are first transformedinto intermediate transition state (also known as activated complex). Theactivated complex is formed by loose association or bonding of reactant

90 Chemical Kinetics and Reaction Dynamics
Reactants Activated Complex Products
A
A
A2
B
B
B2
A B
BA
A B
BA
1. The activated complex has been considered as a separate entity andthere exists an equilibrium between reactants and activated complex.
A + B ` C + D==K
X≠
≠ →
The concentration of activated complex can thus be obtained by applying theequilibrium conditions, i.e.
[X≠] = K≠ [A][B] (4.29)
where ≠ refers to the activated complex.2. Energy of activation is the additional energy which should be supplied
to the reactants in order to form activated complex or to reach at the peak ofthe energy barrier as shown in Fig. 4.7.
Reaction coordinate
Eact
A + B
Ene
rgy
C + D
X#
Fig. 4.7
3. One vibrational degree of freedom of activated complex is quite unstableand responsible for disrupting the activated complex (vibrating at the top ofthe barrier) into the products. The frequency of such vibration will be lowand average energy will be of the order of kbT, i.e.
Evib = kbT = hν
Therefore,
ν = bk Th
(4.30)
molecules or by redistribution of energy. The activated complex is unstableand breaks into the products at a definite rate as follows:

Theories of Reaction Rate 91
where kb and h are Boltzmann’s and Planck’s constants, respectively.4. The rate at which the complex breaks up into the products, i.e. the rate
of reaction depends on two factors: (i) concentration of the activated complexand (ii) frequency of vibration of activated complex. Hence,
Rate of reaction = [X ≠] ν (4.31)
Substituting the values of [X≠] and ν from equations (4.29) and (4.30), weget
Rate of reaction = [A][B]bk Th
K ≠ (4.32)
Now, if k is the rate constant for above reaction, we have
A + B Products k→
Experimentally
Rate of reaction = k[A][B] (4.33)
Comparing equations (4.32) and (4.33), we get
kk T
hK = b ≠ (4.34)
Thus, rate constant for a reaction can be given by equation (4.34) in terms ofequilibrium constant for the formation of activated complex K ≠ which canbe expressed either in terms of partition or thermodynamic functions.
4.5.1 Thermodynamic ApproachThe equilibrium constant of a chemical reaction is related with standard freeenergy change ∆G0 as
RT ln K = –∆G0 (4.35)
Also ∆G 0 = ∆H 0 – T∆S 0 (Gibb’s-Helmholtz relation).Therefore,
K e e eH T S RT S R H RT = = –( – )/ / – /0 0 0 0∆ ∆ ∆ ∆ (4.36)
In the formation of activated complex, if ∆G ≠, ∆H ≠ and ∆S ≠ are change infree energy, enthalpy and entropy, respectively, for one gram mole of thesubstance, then equilibrium constant
K ≠ = e– ∆G≠ / R T (4.37)
K ≠ = e∆S ≠/Re–∆H≠/RT (4.38)
Substituting the value of K≠ in equation (3.34), the rate constant

92 Chemical Kinetics and Reaction Dynamics
kk T
he G RT = b – /∆ ≠
(4.39)
and kk T
he eS R H RT = b / – /∆ ∆≠ ≠
(4.40)
Again, on taking the logarithms of equation (4.34) and differentiatingwith respect to T, we get
ln k = ln (kb/h) + ln (T ) + ln (K≠)
ord K
dT Td K
dT(ln )
= 1 + (ln )≠
(4.41)
Again, from Arrhenius equation
k Ae E RT = – /act
where Eact is the energy of activation per mole for complex formation.
Or
d kdT
ERT
(ln ) = act
2 (4.42)
By comparing equations (4.41) and (4.42), we get
ERT T
d KdT
act2 = 1 +
(ln )≠
or E RT RTd K
dTact2 = +
(ln )≠
(4.43)
Butd K
dTE RT
(ln ) = / 2
≠≠∆ (Van’t Hoft isochore).
Therefore, Eact = RT + ∆E≠ (4.44)
Again ∆E ≠ = ∆H ≠ – ∆nRT
where ∆n is change in the number of molecules in going from reactants toactivated complex.
Thus, equation (4.44) becomes
Eact = RT + ∆H≠ – ∆nRT (4.45)
If, ∆n = 1, Eact = ∆H ≠ and the rate constant may be obtained by equation(4.40) replacing ∆H≠ by Eact, i.e.
kk T
he eS R E RT = b / – /act∆ ≠
(4.46)

Theories of Reaction Rate 93
In case ∆n ≠ 1, equation (4.45) may be written as
–∆H ≠ = – Eact – RT (∆n – 1)
and then rate constant would be
kk T
he e eS R E RT n = b / – / – ( –1)act∆ ∆≠
(4.47)
When ∆n = 0, for unimolecular reaction
k ek T
he eS R E RT = b / – /act∆ ≠
(4.48)
and when ∆n = –1,
k ek T
he eS R E RT = 2 b / – /act∆ ≠
(4.49)
Thus, rate constant may be obtained by equations (4.47), (4.48) or (4.49)depending upon the value of ∆n.
4.5.2 Partition Function ApproachWhile the concentration of activated complex in terms of partition functionsis given as
[ ] = [A][B]A B
– /0XQ
Q Qe E RT≠
≠
The rate of reaction from transition state theory is given by equation (4.31) as
Rate of reaction = {X≠} ν
Therefore, in terms of partition function
Rate of reaction = [A][B]b
A B
– /0k T
hQ
Q Qe E RT
≠(4.50)
Now, experimentally the rate of reaction = k[A][B], where k is the rateconstant.
Thus, the rate constant is given by equation (4.51)
kk T
hQ
Q Qe E RT = b
A B
– /0≠
(4.51)
4.5.3 Comparison with Arrhenius Equation and Collision TheoryThe rate constant for a reaction in terms of various theories is given as
k Ae E RT = (Arrhenius equation)– /act
k p ze E RT = (collision theory)– /act⋅

94 Chemical Kinetics and Reaction Dynamics
k ek T
he en S R E RT = (transition state theory)–( –1) b / – /act∆ ∆ ≠
or kk T
hQ
Q Qe E RT = b
A B
– /0≠
Thus, comparison of these theories gives
A pz ek T
hen S R = = –( –1) b /∆ ∆ ≠ (4.52)
where A is the frequency factor and p the Steric factor.Generally, at ordinary temperatures,
k Thb 13 –1 10 sec≈ and z ≈ 1014 cc mol–1sec–1 and e–(∆n–1) ≈ 10
Therefore,
p e S R 10 10.1014 13 /⋅ ≈ ≠∆
or p e S R/≈ ≠∆ (4.53)
Thus, the steric factor may be explained with the help of entropy change.When two molecules come together to produce the activated complex, thetotal translational degrees of freedom are reduced (from 6 to 3) and rotationaldegrees of freedom also diminish. This is compensated by an increase invibrational degrees of freedom. But the definite orientation in forming theactivated complex necessarily reduced the entropy, i.e. ∆S≠ is negative. Thisdecrease in entropy is small when reaction takes place between simple atoms.The calculated value of kbT/h · e S R∆ ≠ / corresponds to collision frequency(A ≈ Z, p ≈ 1). However, there would be a large decrease in entropy when reactioninvolves large polyatomic molecules. The value of p being smaller (variesfrom 1 to 10–9), the value of A would also be lower than collision frequency.
4.5.4 Explanation for Steric Factor in Terms of Partition FunctionIf the contributions of single translational, rotational and vibrational degreesof freedom are written as qt, qr and qv respectively, the total partition functionQ for a molecule is expressed as
Q q q q = tt
rr
vv
where t, r and v are the number of the degrees of freedom contribution.For a simple reaction, atom A + Atom B [ X≠ (a linear molecule having
two atoms). Partition functions, Q q Q q Q q qA T3
B T3
T3
r2 = , = , = ≠ X≠ will have
one less degree of vibrational freedom and, therefore, rate constant is given by
kk T
hq q
q qe E RT = b T
3r2
T3
T3
– /0 (4.54)

Theories of Reaction Rate 95
or kk T
hqq
e eE RT E RT = 10b r2
T3
– / 10 – /0 0≈
4.5.5 Reaction between Polyatomic MoleculesLet us consider a complex reaction
A + B [ X ≠
where A is the nonlinear molecule having NA atoms, B a nonlinear moleculehaving NB atoms and X ≠ a nonlinear molecule having (NA + NB) atoms. Thenthe partition functions may be given as
Q q q q NA T
3r3
v3 –6 = A
Q q q q NB T
3r3
v3 –6 = B
Q q q q N N*T3
r3
v3( + ) = A B
–7
The activated complex has always one degree of vibrational freedom lessthan a normal molecule with (NA + NB) atoms. Now, the rate constant forcomplex reaction
kk T
hq q q
h q q q q q qe
N N
N NE RT =
( )( )b T
3r3
v3( + )–7
T3
r3
v3 –6
T3
r3
v3 –6
– /A B
A B0
or kk T
hq
q qe E RT = b v
5
T3
r3
/0
or kk T
hqq
e E RT = b r2
T3
v
r
5– /0⎛
⎝⎞⎠ (4.55)
A comparison of equations (4.54) and (4.55) shows that the rate constantfor a complex reaction differs from that obtained in simple atomic reactionby a factor of (qv/qr)
5. Since qv is nearly unity, while qr varies from 10 to 100for a complex molecule, the ratio qv/qr, therefore, varies from 10–1 to 10–2
and (qv/qr)5 varies from 10–5 to 10–10. This factor may link to steric factor p.
On comparing equation (4.55) with collision theory and Arrhenius equation,we get
A pzk T
hqq
p = = 10 ( )b r2
T3
v
r
510⎛
⎝⎞⎠ ≈
or p = [qv /q r]5
Steric factor p varies from 10–5 to 10–10 for complicated reactions. It may,

96 Chemical Kinetics and Reaction Dynamics
therefore, be concluded that the reactions between polyatomic molecules areslower than expected on the rigid sphere model because several rotationaldegrees of freedom are lost, being replaced by vibrational degrees of freedom,which have a smaller probability associated with them.
Problem 4.1 The Eact and pre-exponential factor for a reaction
A2 + B2 [ 2AB
are 15.5 kJ mol–1 and 10.9 × 10¹⁰ dm3 mol–1sec–1, respectively. Calculate thevalues of ∆H ≠ and ∆S ≠ at 1000 K.
Solution
∆ H ≠ = Eact – 2RT = 15.5 kJ mol–1–2(8.314J mol–1K–1)(1000 K)
= –1.13 kJ mol–1
Ae k T
he S R =
2b /∆ ≠
or
∆S R Ahk T
≠ = ln b
= (8.314 J mol K ) ln(6.626 10 Js)(10.9 10 dm mol sec )
(1.00 mol dm )(1.38 10 Jk )(1000K)
–1 –1
–34 10 3 –1 –1
3
–23 –1
×××
⎧⎨⎪
⎩⎪
⎫⎬⎪
⎭⎪
= – 60.3 Jk–1 mol–1
Problem 4.2 It is assumed that the values of qt, qv and qr for differentmolecules in reaction
Atom + Linear molecule (diatomic) → Nonlinear molecule
are equal. Calculate the value of Arrhenius factor A at 298°K for abovereaction, if qt = 108, qr = 10 and qv = 1.
Solution
k Aek T
hQ
Q QeE RT E RT = = – /
(Arrhenius equation)
b
A B
– /
(Transition state theory in terms of partition function)
act act⋅≠
Therefore, Ak T
hQ
Q Q = b
A B
≠
Partition function: Atom = A T3Q q

Theories of Reaction Rate 97
Linear molecule Q q q qB t3
r2
v =
Q≠ (nonlinear triatomic molecule) = q q q q q qT3
r3
v(3–1)
t3
r3
v2 =
A = 1.38 10 Jk (298 K)
6.62 10 Js(10 ) (10) (1)
(10 ) (10 ) (10) (1)
–23 –1
–34
8 3 3 2
8 3 8 3 2
××
= 62.12 × 10⁻⁸ sec–1
= 62.12 × 10–8 × 6.02 × 1023 mol–1 dm3 sec–1
= 3.79 × 10¹⁰ mol–1 dm3 sec–1
Problem 4.3 The value of ∆S # for a reaction has been obtained as–80.5 Jk–1 mol–1 at 400 K. Find the value of A for the reaction.
Solution From transition state theory
kk T
he eS R E RT = b / – /#
act∆
From Arrhenius equation
k Ae E RT = – /act
Ak T
he eS R = =
1.38 10 JK mol 400 K6.63 10 Js
b–23 –1 –1
–34–80.5/8.314∆ ≠ × ×
×/
= 5.189 × 10⁸ mol–1 dm3s–1
Problem 4.4 The pre-exponential terms for a bimolecular gas reactionoccurring at 350°C is 8.0 × 10¹⁰ dm3 mol−1 s−1. Calculate the entropy ofactivation.
Solution
k Ae E RT = – /act (Arrhenius equation)
kK T
he e en S R E RT = b 1– / – /act∆ ∆ ≠
(transition state theory)
Therefore, Ak T
he en S R = b 1– /∆ ∆ ≠
∆n = – 1 (for bimolecular reaction)
A + B [ X
log = log + 2.303 8.314
bAK T
hS⎛
⎝⎞⎠ ×
≠∆

98 Chemical Kinetics and Reaction Dynamics
∆S ≠ × × × ××
⎡⎣⎢
⎤⎦⎥
= (2.303 8.314) log(8.0 10 ) – 0.8686 – log1.37 10 623
6.62 1010
–23
–14
= – 58.89 kJ K−1 mol−1
Problem 4.5 Taking qt = 108, qrot = 10 and Qv = 1, calculate the value ofArrhenius factor for the following reaction at 35°C:
Atom + Linear molecule Nonlinear moleculeA B AB
→
Solution
k Ae E RT = – /act
kK T
hQ
Q Qe E RT = b
A B
– /act≠
(from transition state theory)
Therefore, AK T
hQ
Q Q = (cm mol s )b
A B
3 –1 –1≠
=1.38 10 JK (308K)
(6.62 10 Js)(10 ) (10) 1
(10 ) (10 ) (10) (1)
–23 –1
–34
8 3 3
8 3 8 3 2
××
× ⋅
× (10–3 × 6.02 × 1023) dm3 mol–1s–1
= 386.51 × 108 = 3.86 × 10¹⁰ dm3mol–1s–1
Problem 4.6 The plot of log k versus 1/T, i.e. Arrhenius plot was linear witha negative slope 4.50 × 10³ and intercept equal to 11.90 for a reaction.Calculate Eact, ∆H* (at 25°C) and ∆S≠.
Solution
log = log – 2.303
actk AE
RT
Eact = 2.303 × R × Slope
= 2.303 × 8.314 × 4.50 × 103 = 86.16 kJ mol−1
∆H ≠ = Eact – RT = 86.16 × 10³ – 8.314 × 298
= 83.68 kJ mol– l
Again Ak T
he eS R n = b / 1–∆ ∆≠
log = log + log( ) + 2.303 8.314
b –2Ak Th
eS⎛
⎝⎞⎠ ×
≠∆
log Alog k Slope2.303
act≈ E
R
1/ T
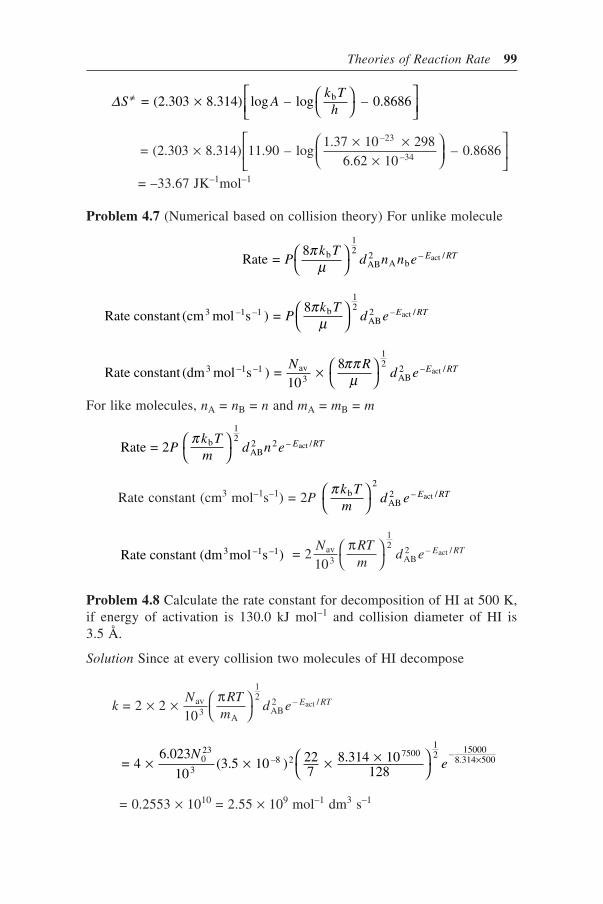
Theories of Reaction Rate 99
∆S Ak Th
≠ × ⎛⎝
⎞⎠
⎡⎣⎢
⎤⎦⎥
= (2.303 8.314) log – log – 0.8686b
= (2.303 8.314) 11.90 – log1.37 10 298
6.62 10 – 0.8686
–23
–34× × ××
⎛⎝⎜
⎞⎠⎟
⎡
⎣⎢
⎤
⎦⎥
= –33.67 JK–1mol–1
Problem 4.7 (Numerical based on collision theory) For unlike molecule
Rate = 8 b
12
AB2
A b– /actP
k Td n n e E RTπ
µ⎛⎝
⎞⎠
Rate constant (cm mol s ) = 83 –1 –1 b
12
AB2 – /actP
k Td e E RTπ
µ⎛⎝
⎞⎠
Rate constant (dm mol s ) = 10
83 –1 –1 av3
12
AB2 – /act
N Rd e E RT× ⎛
⎝⎞⎠
ππµ
For like molecules, nA = nB = n and mA = mB = m
Rate = 2 b
12
AB2 2 – /actP
k Tm
d n e E RTπ⎛⎝
⎞⎠
Rate constant (cm3 mol–1s–1) = 2Pπ k T
md e E RTb
2
AB2 – /act⎛
⎝⎞⎠
Rate constant (dm mol s )3 –1 –1 = 210
av3
12
AB2 – /act
N RTm
d e E RTπ⎛⎝
⎞⎠
Problem 4.8 Calculate the rate constant for decomposition of HI at 500 K,if energy of activation is 130.0 kJ mol–1 and collision diameter of HI is3.5 Å.
Solution Since at every collision two molecules of HI decompose
kN RT
md e E RT = 2 2
10av3
A
12
AB2 – /act× × ⎛
⎝⎞⎠
π
= 4 6.023
10(3.5 10 ) 22
78.314 10
128023
3–8 2
750012 – 15000
8.314 500× × × ×⎛⎝
⎞⎠
×Ne
= 0.2553 × 1010 = 2.55 × 10⁹ mol–1 dm3 s–1

100 Chemical Kinetics and Reaction Dynamics
4.6 Unimolecular Reactions and the Collision TheoryIn the unimolecular reactions which are also of the first order, only onemolecule takes part in the reaction. The process of activation in unimolecularreactions, if caused by collisions should ordinarily lead to second orderreactions. How then the observed rate of reaction could be of first order. Ifhowever, the activation is by absorption of the radiant energy, this problemcan be avoided. But many unimolecular reactions take place under conditionswhere there is no absorption of radiant energy. For example
C H 2C4 8 Conversion
2 4⎯ →⎯⎯⎯ Η
C H NH C + NH2 5 2Decomposition
2 4 3⎯ →⎯⎯⎯ Η
(CH3)2O → CH2 + H2 + CO2
CH NC CH CN3 Isomerization
3⎯ →⎯⎯⎯
Therefore, the view of absorption of radiant energy was found to beunsatisfactory and finally rejected. Lindemann (1922) offered a solution tothe problem.
4.6.1 Lindemann’s MechanismAccording to Lindemann’s hypothesis, the activation by collision can stillgive rise to first order kinetics if the activated molecules decompose onlyslowly compared to the rate at which they are deactivated. There is a time-log between the moment of activation and the moment of decomposition andin such a case, a stationary concentration of the activated molecules getsbuilt up. Since the activated molecules will be in equilibrium with the normalmolecules, their concentration will be proportional to that of normal molecules.The activated molecules disappear through two parallel processes, i.e. throughdeactivation and decomposition, represented as follows:
A + A A + A (activated) *1k→ (i)
A + A A + A (deactivation)* 1′→k (ii)
Again, we get A Products (decomposition)* 2k→ (iii)
Rate of activation = [A ]
= [A]*
12d
dtk
Rate of deactivation = –[A ]
= [A ] [A]*
1*d
dtk ′
Rate of decomposition = –[A ]
= [A ]*
2*d
dtk
Applying the steady state conditions with respect to A*, as the concentrationof A* is very small, we get

Theories of Reaction Rate 101
k k k12
1*
2*[A] = [A ][A] + [A ]′
or [A ] = [A]
[A] + * 1
2
1 2
kk k′
Again, the rate of reaction = –[A]
= [Product]
= [A ]2*d
dtd
dtk
Substituting the value of [A*], we get
Rate of reaction = [A]
+ [A]1 2
2
2 1
k kk k ′ (4.56)
At sufficiently high concentration or pressure, where ′k k1 2[A] >> equation(4.56) reduces to
Rate of reaction = A]1 2
1
k kk
[′ (4.57)
Under these conditions the reaction is first order. This happens whentime lag is relatively large. At very low concentrations or pressure, wherek2 >> ′k1 [A], equation (4.56) reduces to
Rate of reaction = k1[A]2 (4.58)
and the reaction will be second order.This behavior has been observed in many unimolecular reactions. Many
first order reactions have been found experimentally to tend to the secondorder at a very low pressure.
Further, equation (4.56) may be written as
kd
dtk k
k k1 1 2
2 1 = – 1
[A][A]
= [A]
+ [A]′ (4.59)
where k1 is the first order rate coefficient.At higher concentration where deactivation is prominent, i.e. ′k k1 2[A] >>
– 1[A]
[A] = = Constant1 2
1
ddt
k kk ′
at low concentrations, when k2 >> ′k1 [A], it becomes
– 1[A]
[A] = [A]1
ddt
k
Therefore, a plot of – 1[A]
[A]ddt
versus [A] will be a curve as shown inFig. 4.8.
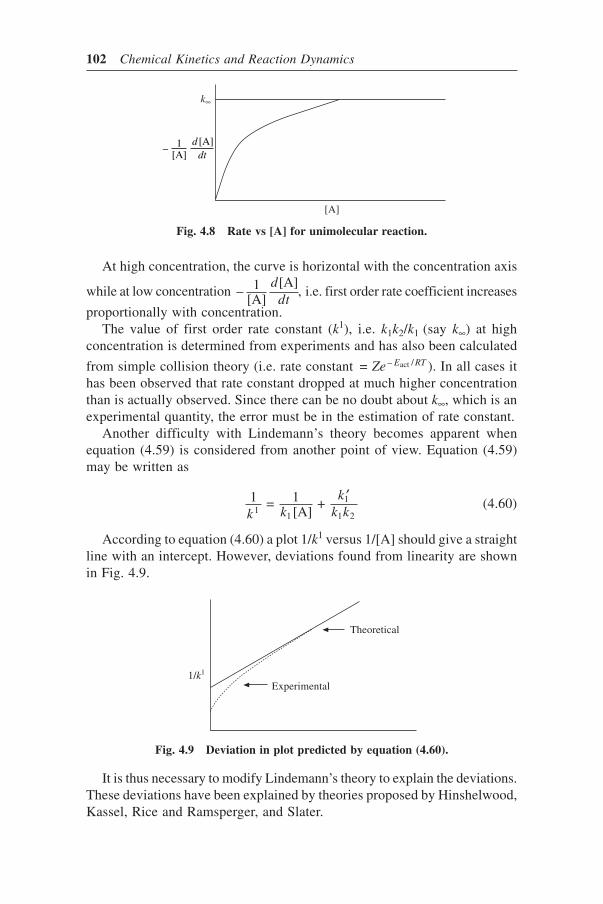
102 Chemical Kinetics and Reaction Dynamics
At high concentration, the curve is horizontal with the concentration axis
while at low concentration – 1[A]
[A],
ddt
i.e. first order rate coefficient increases
proportionally with concentration.The value of first order rate constant (k1), i.e. k1k2/k1 (say k∞) at high
concentration is determined from experiments and has also been calculated
from simple collision theory (i.e. rate constant = – /actZe E RT ). In all cases ithas been observed that rate constant dropped at much higher concentrationthan is actually observed. Since there can be no doubt about k∞, which is anexperimental quantity, the error must be in the estimation of rate constant.
Another difficulty with Lindemann’s theory becomes apparent whenequation (4.59) is considered from another point of view. Equation (4.59)may be written as
1 = 1[A]
+ 11
1
1 2k kk
k k′
(4.60)
According to equation (4.60) a plot 1/k1 versus 1/[A] should give a straightline with an intercept. However, deviations found from linearity are shownin Fig. 4.9.
1/k1
Theoretical
Experimental
Fig. 4.9 Deviation in plot predicted by equation (4.60).
It is thus necessary to modify Lindemann’s theory to explain the deviations.These deviations have been explained by theories proposed by Hinshelwood,Kassel, Rice and Ramsperger, and Slater.
[A]
k∞
Fig. 4.8 Rate vs [A] for unimolecular reaction.
– 1[A]
[A]ddt
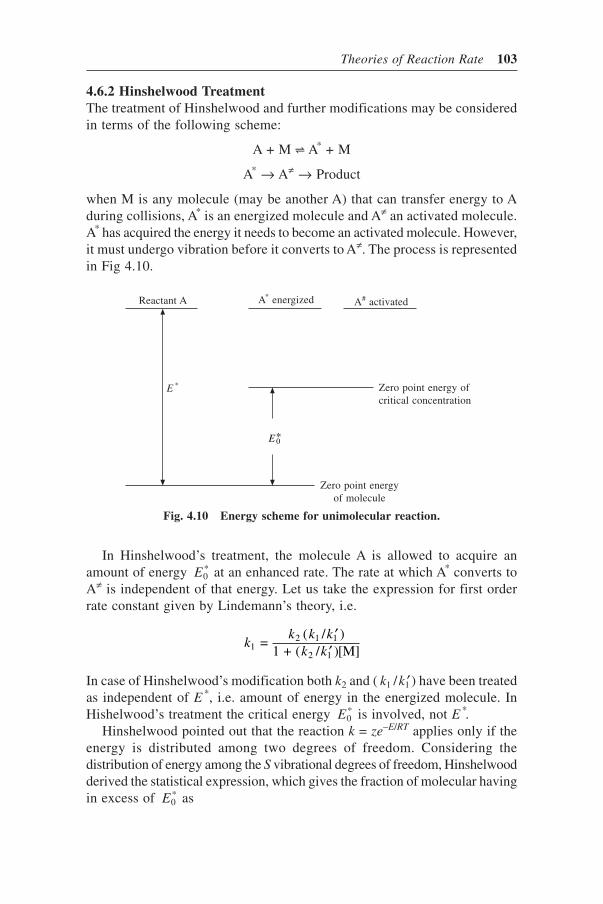
Theories of Reaction Rate 103
4.6.2 Hinshelwood TreatmentThe treatment of Hinshelwood and further modifications may be consideredin terms of the following scheme:
A + M [ A* + M
A* → A≠ → Product
when M is any molecule (may be another A) that can transfer energy to Aduring collisions, A* is an energized molecule and A≠ an activated molecule.A* has acquired the energy it needs to become an activated molecule. However,it must undergo vibration before it converts to A≠. The process is representedin Fig 4.10.
E *
Reactant A A* energized A# activated
Zero point energyof molecule
Zero point energy ofcritical concentration
Fig. 4.10 Energy scheme for unimolecular reaction.
In Hinshelwood’s treatment, the molecule A is allowed to acquire anamount of energy E0
* at an enhanced rate. The rate at which A* converts toA≠ is independent of that energy. Let us take the expression for first orderrate constant given by Lindemann’s theory, i.e.
kk k k
k k12 1 1
2 1 =
( / )1 + ( / )[M]
′′
In case of Hinshelwood’s modification both k2 and ( k k1 1/ ′) have been treatedas independent of E *, i.e. amount of energy in the energized molecule. InHishelwood’s treatment the critical energy E0
* is involved, not E *.Hinshelwood pointed out that the reaction k = ze–E/RT applies only if the
energy is distributed among two degrees of freedom. Considering thedistribution of energy among the S vibrational degrees of freedom, Hinshelwoodderived the statistical expression, which gives the fraction of molecular havingin excess of E0
* as
E 0*

104 Chemical Kinetics and Reaction Dynamics
fS
Ek T
eE k T = 1
( – 1)!0*
b
– /0*
b⎛⎝⎜
⎞⎠⎟ (4.61)
and then he expressed that rate constant
k zS
Ek T
eE k T
1 10*
b
– / = 1
( – 1)!0*
b⎛⎝⎜
⎞⎠⎟ (4.62)
instead of simple expression k ze E k T1
– / = 0*
b .Thus, an addition factor which has appeared in equation (4.62) is1
( – 1)!0*
bSEk T
⎛⎝⎜
⎞⎠⎟
which may be greater than unity by many powers of 10
when S is sufficiently large.Further equation (4.62) can be written in the form
k TT
eS
E k T1
1/2–1
– / ( ) 1 0*
b∝ ⎛⎝
⎞⎠ (4.63)
which on taking logarithms and then differentiating gives
d kdT
S k T E
k T
(ln ) =
(3/2 – ) + 1 b 0*
b2 (4.64)
Again, the experimental activation energy is given by equation (4.65)
d kdT
E
k T
(ln ) = 1 exp
b2 (4.65)
where Eexp is the experimental energy per molecule. From (4.64) and (4.65)it follows that
E E S k T0*
exp b = + ( – 3/2) (4.66)
Thus, E0* is higher than the experimental activation energy and can give
much higher rates of activation and, therefore, much higher value of k1/ ′k1
than simple collision theory.However, the following difficulties still remain, which could not be explained
on the basis of Hinshelwood’s treatment.1. According to Hinshelwood’s proposal,
kk kk
kS
Ek T
e E k Tlim
1 2
12
0*
b
– / = = 1( – 1)!
0 b
′ ′⎛⎝⎜
⎞⎠⎟
*(4.67)
which indicates a strong temperature dependence of pre-exponential factor.There is no experimental evidence for it.
2. The explanation for the non-linearity in plot of 1/k1 versus 1/[A] is notgiven in Hinshelwood’s theory.

Theories of Reaction Rate 105
3. The number of S required to give agreement with experiment usuallywas found to be only about one-half of the total number of vibrational mode.This has not been explained.
4.6.3 Rice and Ramsperger, and Kassel (RRK) TreatmentRice and Ramsperger and independently Kassel proposed the theories toexplain unimolecular reaction, in which both (k2) and (k1/ ′k1 ) have beentreated as dependent on the energy of an individual energized molecule E*.These theories jointly are referred as RRK theory. According to the theorythe expression for the first order rate constant given by Lindemann theoryi.e.
kk k k
k k12 1 1
2 1 =
( / )1 + ( / )[M]
′′
can be written as
dkk E f E
k E kdE1
2* *
2*
1
* = ( ) ( )
1 + ( ( )/ ) [M]′ (4.68)
where k2(E*) shows that k2 is a function of E*, k1/ ′k1 replaced by f is also a
function of E* and f (E*) is known as distribution function.In equation (4.68), dk1 is a canonical rate constant, relating to energized
molecule having energy between E* and E*+ dE*. The expression can beintegrated between the limits from minimum energy ( E0
*) to infinity to getthe ordinary rate constant k1, i.e.
kk E f E
k E kdE
E1
2
2 1 =
( *) ( *)1 + ( ( *)/ )[M]
*0*
∞
∫ ′
The theories of Rice and Ramsperger, and Kassel are very similar andbased on the assumption that k2 will be a function of energy possessed by theenergized molecule A*. It has been postulated that the rate constant k2 fordecomposition of the active molecule increases with the energy possessedby the molecule in its various degrees of freedom. At high pressure, wherethere is a greater number of highly activated molecules, the rate, therefore,will be higher than predicted by the simple theory. It is supposed that onevery vibration, there is reshuffling of energy between the normal modes,and after a number of vibrations the critical energy E* may be found in oneparticular normal mode (referred as critical mode) and then the reactionoccurs.
The larger the energy E possessed by the excited molecule, greater is thechance that necessary amount E * can pass into critical mode and greater is,therefore, the rate of reaction. On the basis of quantum model, they obtainedthe rate which the required energy passes into the particular degree of freedom

106 Chemical Kinetics and Reaction Dynamics
and is proportional to (E – E*/E)S–1, where S is the degree of vibrationalfreedom, E the total energy of molecule and E* the minimum energy that amolecule must have for reaction to take place. Therefore, the rate constant k2
can be obtained as
k k E EE
S
2
* –1
= – ≠ ⎛⎝
⎞⎠ (4.69)
k≠ is the rate constant corresponding to the free passage of the system overthe potential energy barrier. When E is sufficiently large, the energized moleculeis essentially an activated molecule and therefore can convert immediatelyinto the final state, i.e. k2 is large. The variation of k2 with E is shownschematically in Fig. 4.11.
E/E*
k#
k2
S = 1
S = 3
S = 17
Fig. 4.11 Variation of k2 with E/E*.
The expression for k∞ has also been obtained by Kassel and is given by
k k e E k T∞
≠ = – */ b (4.70)
Therefore, according to this theory, K≠ would be equal to kbT/h provided thepartition functions are same in the initial and activated states.
Therefore, in the treatment of Kassel and that of Rice and Ramaspergerthe only condition for energization is that the molecule must acquire thecritical amount of energy E*.
Any molecule that has acquired this energy will, unless it is deenergizedby collision, pass through the activated state into final state. k≠ in aboveexpressions is readily the frequency of energy redistribution.
4.6.4 Marcus TreatmentMarcus developed a quantum mechanical formulation of Kassel-Rice-Ramsperger theories in which zero point energies have been taken into account(see flow chart). However, due to lack of data for individual molecules it isdifficult to apply the theory of Rice-Ramsperger-Kassel-Marcus (RRKM)

Theories of Reaction Rate 107
to many reactions, but wherever it has been applied, it has been proved verysatisfactory.
Flow Chart
kk E f E
k E kdE
E1
2
2 10*
=( *) ( *)
1+ ( ( *)/ [A])*′
∞
∫
When k2 and (k1/ ′k1 ) are independent of E*
E
f E dE k k0*
( *) * = /1 1
∞
∫ ′
kk k k
k k12 1 1
2 1 =
( / )1 + / [A]
′′
Lindemann’s theory
kk
e E k T1
1
– / = 0*
b
′
Hinshelwood theory
kk S
Ek T
eS
E k T1
1
0*
b
–1– 0
*/ b= 1( –1)!′
⎛⎝⎜
⎞⎠⎟
when k2(E*) and f (E*)are depending of E*
RRK theory
f E dES
e
k Te dE
E k T
E k T
( *) * = 1( – 1)!
(
+ 1 *
– */ b
b
– */ b
)
k E* kE E
E
S
20* –1
( ) = * –
*≠ ⎛
⎝⎜⎞⎠⎟
RRKM theory
f EN E e dE*
N E* e dE
E k T
E* k T
( *)=( )
( ) *
– */ b
– / b
0
≠ ≠
∞
∫k E
I P EhN E F2
act*
r( *) =
( )( *)
≠ Σ
4.6.5 RRKM TheoryThis theory, developed by extending the Rice-Ramsperger-Kassel (RRK)theory by Marcus, is known as RRKM theory. Only a brief account of thetheory is given here. In RRKM theory the initial degrees of freedom of A*
and A≠ have been designated as either active or inactive (adiabatic). It hasbeen assumed that active modes exchange energy freely while inactive moderemains in the same quantum states during the reaction. Thus, inactive energythat remains in the same quantum state during the course of reaction and,

108 Chemical Kinetics and Reaction Dynamics
therefore, cannot contribute to the breaking of bonds. During the formationof activated molecule A≠, the zero point energy, which is the energy ofoverall translation and rotation, is remained preserved as such and, therefore,is inactive. The vibrational energy and energy of internal rotational are active.
In RRKM theory, k2(E*) and distribution functions f (E*) are represented
as
f E dEN E e dE
N E e dE
E k T
E k T
( ) = ( )
( )
* ** – */ *
0
* – */ *
b
b
∞
∫(4.71)
and k EI P EhN E F2
* act*
r( ) =
( )( )
≠ Σ(4.72)
where N(E*) is the density of states, i.e. nuclear of states pursuit havingenergy between E* and E* + dE*, I ≠ is the statistical factor, ΣP E( )act
* innumber of vibrational-rotational quantum states of activated molecule, Fr isa factor introduced to correct the fact that the rotations may not be same inthe activated molecule as in the energized molecule.
A A* A#
E0*
Einactive#
Eactive#
Einactive#
Einactive#
E*
E#
Zero point energy of molecule
Total energy
Energy in activemode
Zero point energy ofcritical configuration
Fig. 4.12 Energy scheme for RRKM theory.
Vibrational frequencies for various normal modes must be estimated andactive as well as inactive energies should be decided. Numerical methodsmay be used to calculate rate constant k1 at various concentrations obtainedby RRKM theory. The rate constant has been found to be same as given byconventional transition state theory, i.e.

Theories of Reaction Rate 109
kk T
hQQ
e E k T1(lim)
b
A
– / = 0*
b≠
where Q≠ and QA are partition functions for activated state and reactant,respectively. Thus, theory is able to explain the abnormally high pre-exponentialfactors that are sometimes obtained.
4.7 Kinetic and Thermodynamic ControlIn many reactions under a given set of conditions, a reactant may undergocompeting reactions to give different products. The products compositionmay be governed either by equilibrium thermodynamic or by competing rateof formation of product.
Let a reactant R gives two products A and B in two different steps asfollows:
R
B
A
The energy profile for the reaction is shown in Fig. 4.13.
When both the steps are irreversible, product A is more stable (havinglower energy) but product B will be formed in larger amount because it isformed with faster rate (low energy activation). The product is said to bekinetically controlled.
When the reactions are reversible as follows:
R
B
C
Fig. 4.13 Energy profile for competing reactions.
Reaction coordinate
Ene
rgy
AB
R∆EA
# ∆EB#

110 Chemical Kinetics and Reaction Dynamics
the product composition may be controlled either thermodynamically orkinetically.
Case I. If the reaction stopped well before the equilibrium has been established,the faster-formed product will be present in larger amount and the reactionwill be kinetically controlled.
Case II. If the reaction is allowed to attain the equilibrium, the slowerformed product A will be predominant, because product B (formed withfaster rate) is first formed and converts back to reactants. While product A(which is formed with slower rate) is more stable and converts to reactant inmuch less amount. The product is called thermodynamically controlled.
Further the process depends on the reaction conditions, magnitude of∆ ∆E EA
#B# and and stability of the products.
4.8 Hammond’s PostulateAs the transition state (TS) has zero life-time, it is difficult to observe themdirectly. However, the information about the transition-state may be obtainedon the basis of some inference. George S. Hammond (1955) laid out hispostulate which may be stated as:
“If two states, as for examples, a transition state and an unstable intermediate,occur consecutively during a reaction process and have nearly the sameenergy content, their interconversion will involve only a small reorganizationof the molecular structure”.
Thus along the reaction coordinate, the species with similar energies,have similar structures.
With the help of Hammond’s postulate the transition state can be assumedto be reasonably approximated by the structure of either the reactant,intermediate or product.
Consider the following three cases (Fig. 4.14):
Fig. 4.14 Hammond’s postulate.
ACase I B
Case II
Case III
BA A
B
TS1
TS2TS3

Theories of Reaction Rate 111
Case I. Highly Endothermic ReactionIn highly endothermic reaction, the transition-state (TS1) resembles product B.
Case II. Highly Exothermic ReactionAccording to Hammond’s postulate in highly exothermic reaction, the transitionstate (TS2) resembles reactant A.
Case III. Slightly Exothermic ReactionIf reaction is slightly exothermic with a high activation energy, neither reactantnor product resemble transition state (TS3).
Hammond postulate has been used to explain the effect of substituents onthe rate of benzilic acid rearrangements, mechanism of electrophillic aromaticsubstitution reactions and reactions involving highly reactive intermediatessuch as carbonium ions and carbon ions.
4.9 Probing of the Transition StateWe are aware of the fact that reactants go through a transition state beforethey convert into products. There was a feeling that the transition state of achemical reaction could not be characterized directly in the laboratory becauseit won’t be stable enough to be observed. Now the time has changed and ithas become possible to characterize the transition state experimentally aswell as theoretically.
Polanyi and coworkers (1980-83) monitored the ‘wings’ to the sodium D-line emission in the reaction
F + Na [FNaNa] FNa + Na
Na D-line
** *→ →
It was realized that the wings was six orders of magnitude lower in intensitythan the D-line and the life-time of transition-state was around 10–12s, aboutfour order less than that of Na*. In a subsequent experiment they also identifiedthe transition state for the reaction
H + D2 → [HDD]* → HD + H
by velocity selected time of flight mass spectrometry. In their pump andprobe experiment, the H atoms was generated from H2S by pumping firstlaser (L1). H atoms were reacted with D2 to form [HD2]
* which in turn wasprobed by second laser (L2) through resonantly enhanced multiphotonionization. On variating the time delay between L1 and L2, they observedthat the detected [HD2]
+ came from [HD2]*. By varying the wave length of
L2, the probing of the transition state was possible.Brooks and collaborators (1980-86) in a 3-beam experiments, crossed
w

112 Chemical Kinetics and Reaction Dynamics
beams of K, HgBr2 and hν and monitored fluorescence from the productHgBr*
(TS)K + HgBr [KHgBr ]
[KHgBr ] KBr +
HgBr
HgBr
2 2#
2+* *
↑→
→
They also carried out a similar experiment with K, NaCl and hν andmonitored the D line emission from Na*
↑→
→(TS)
K + NaCl [KClNa]
[KClNa]
Na
KCl + Na
#
#**
Witting and coworkers (1988) used laser (193 nm) to photo dissociate HBrin a {CO2-HBr} van der Waal complex and monitored the OH– rotationaldistribution arising out of the reaction
H + CO2 → HO + CO
They observed that transition state is long lived with a life-time of ~1 ps.At the end of the 1980s Zewail performed a series of experiments that were
to lead to the birth of a new research field called femtochemistry. This couldbe described as using a high-speed camera to image molecules during theactual course of chemical reactions and trying to capture snap-shots of themjust in the transition state. The camera was based on a new laser technology,with light flashed of some tens of femtoseconds (1 fs = 10–15 sec).
To achieve a “molecular movie” of a chemical reaction, Zewail mixed thereactants in the form of molecular beams in a vacuum chamber. In a simplecase, a so-called unimolecular reaction step which concerns only one type ofmolecule, the reaction was started using a powerful pump pulse which excitesthe molecule to a higher energy state. The pump pulse was followed by asecond (weaker) pulse. This pulse was timed to arrive at precise intervalsafter the reaction has been started, to reveal how long it takes for variousmolecular species to appear or vanish. The time interval between pulses canbe varied simply by delaying the probe pulse by letting it travel a detour viasome mirrors. The fingerprints and the time elapsing are then compared withtheoretical simulations based on quantum chemical calculations on spectraand energies of the molecules in their various states.
In his first experiment (1987) Zewail studied the unimolecular disintegrationof iodine cyanide into iodine atom and cyano radical: ICN → I + CN. Theymanaged to observe a transition state corresponding to the I–C bond breaking.The whole reaction was over in 200 fs.
In another important experiment (1989) Zewail and his group studied thedissociation of sodium iodide (NaI): Na+ I– → Na + I. The pump pulseexcites the ion pair Na+I– which has an equilibrium distance of 2.8 Å between
ww

Theories of Reaction Rate 113
the nuclei to an excited from [Na–I]* which at this short bond distanceassumes a covalent bonding character. However, its properties change whenthe molecule vibrates: when the Na and I atoms are at their outer turningpoints, 10-15 Å apart, the electron structure is ionic, [Na+…I–]*, as oneelectron has moved from Na to I. When the atoms move back together thebonding becomes covalent again: [Na–I]*, and so forth. A critical point wasobserved during the vibration where the excited state and ground state arevery close to each other. At this point there is a great probability that theexcited [Na-I]* will either fall back to its ground state [Na-I] or decay intosodium and iodine atoms.
Zewail also studied bimolecular reactions, such as the reaction betweenhydrogen atoms and carbon dioxide: H + CO2 → CO + OH which occurs inthe atmosphere and during combustion, and which he showed was going viaa long-lived (1000 fs) molecule HOCO. In a reaction between benzene andiodine (I2), they observed that when the two molecules come close togetherthey form a complex. The laser flash makes an electron from benzene jumpover to the iodine molecule, which then becomes negatively charged whilebenzene becomes positively charged. The negative and positive charges attracteach other. The bond between the two iodine atoms is stretched as the oneclosest to benzene is attracted toward benzene, the other then goes off andflies away. All happens within 750 fs.
Femtosecond studies being performed intensely the world over, using notonly molecular beams but studying also processes on surfaces and clustersand in polymers. In addition, femtochemistry has been applied to the studyof many important biological systems.
Besides the experimental studies, the theoretical approaches have alsobeen developed to study the details of state-to-state chemistry to probing thetransition-state. Polanyi and coworkers computed classical trajectories tofollow the dynamics of
F + Na2 → FNa + Na
reaction on the excited state surface using London-Eyring-Polanyi-satoformations. The similar study were extended to predict the absorption spectrumsof (H )3
# in H + H2 collisions and the absorption spectrum of transition statein K + NaCl collisions.
A time-independent quantum mechanical study by Engel and coworkers(1985) gave qualitatively the same results as the time dependent analog andthe quassi classical trajectory method. A quantum theory for probing transition-state absorption/emission has also been developed by Lee et al. (1989).
EXERCISES
1. Calculate the value of pre-exponential factor and rate constant at 298 K in followingcases:

114 Chemical Kinetics and Reaction Dynamics
(a) Atom + Atom → Linear molecule(b) Atom + Linear molecule → Nonlinear molecule(c) Atom + Nonlinear molecule → Nonlinear molecule
Assuming that the values of qt, qr and qv for different molecules are equal and108, 10 and 1, respectively, for each degree of freedom.
2. The value of ∆S ≠ for a reaction is –160 J mol–1 K–1, calculate the value ofArrhenius factor at 400 K.
3. The second order rate constant for a reaction 2A → P is 2.0 × 10¹⁰ mol–1 dm3 s–1
and∆H ≠ and ∆S≠for the reaction and 190 kJ mol–1 and 15.0 Jmol–1 K–1, respectively.Calculate the Eact and pre-exponential factor for the reverse reaction.
4. Compare the rate constant obtained from collision theory and transition state
theory and prove that ∆H ≠ = Eact + 12 RT.
5. Explain the following
(a) The steric factor involved in collision theory may be interpreted in terms of∆S≠.
(b) For reaction A + B → (AB)# → A + B the entropy of activation is negativewhile for reverse reaction, i.e. AB → (AB)≠ → A + B the entropy of activationis positive.
(c) Some reactions proceed with a very slow speed even though there is a largedecrease in free energy.
6. If activation energy for a reaction is 100 kJ mol–1, calculate the fraction ofmolecules which have energy ≥ Eact.
7. Calculate pre-exponential factor and rate constant for the reaction
CH3 + H2 → CH4 + H
at 100°C if collision diameter is 3.0 ×10⁻¹⁰ m and Eact of reaction is 20 kJ mol–1.8. With the help of transition state theory, prove that value of steric factor varies
from 10–5 to 10–10 for complex reactions.9. Explain that: (i) for gaseous reactions, the entropy of activation is generally
negative and (ii) larger the decrease in entropy, smaller will be the value ofArrhenius factor.
10. Assuming qt = 108, qr = 10, qv = 1 and k T
hb 13 = 10 , calculate the value of rate
constant for nAA + nBB → X≠ in cc molecules–1 sec–1 and liter moles–1 sec–1.

5Kinetics of Some Special
Reactions
5.1 Kinetics of Photochemical ReactionsThere are certain reactions in which the activation may be carried out byelectromagnetic radiations in visible and ultraviolet region having wavelengthapproximately between 100 to 1000 nm. These reactions are calledphotochemical reactions. A photon of radiation, referred to as quantum withenergy hν (ν being its frequency), is primary unit of radiation. When a photonfrom high energy electromagnetic radiations such as X- and γ-ray is used,the chemical processes are then called radiolytic reactions. The photochemicalreactions are governed by two basic principles, viz. the Grotthus-Draper lawand Einstein law of photochemical equivalence.
5.1.1 Grotthuss-Draper LawThis law states that only those radiations which are absorbed can be effectivein producing the chemical change.
Although photochemical reaction is a result of absorption of light, it maynot always lead to chemical change. Sometimes the absorption of photonmay only increase the thermal energy or it may be reemitted (fluorescence).
5.1.2 Einstein Law of Photochemical EquivalenceIn 1912, Einstein extended the concept of quantum theory of radiation tophotochemical processes and stated that ‘each quantum of radiation absorbedby molecule activates one molecule in the primary step of a photochemicalprocess’. This is known as Einstein law of photochemical equivalence.
According to this law, if every molecule so activated in primary absorptiondirectly decomposes, the number of molecules taking part in chemical changewould be equal to the number of quanta of energy absorbed. However, amolecule activated photochemically may initiate a sequence of reactions sothat many reactant molecules through a chain mechanism would undergochemical change. In such cases the number of molecules undergoing chemicalchanges will be many times of the quanta of energy absorbed.

116 Chemical Kinetics and Reaction Dynamics
The efficiency of a photochemical reaction is expressed in terms of quantumyield φ defined as
φ = Number of molecules reacting
Number of quanta of radiation absorbed(5.1)
For example, in the photolysis of HI,
HI + hν → H + I
H + HI → H2 + I
2I → I2
absorption of photon leads to destruction of two HI molecule and φ is thereforeequal to 2. In chain reactions a high value of quantum efficiency has beenobserved (~104).
According to law of photochemical equivalence, the energy absorbed permole E is given by
E N hN hc
= = ergs per mole00ν λ (5.2)
c = 3.0 × 1010cm/sec; h = 6.625 × 1027 ergs-sec; N0 = 6.02 × 10²³
E = 1.196 10 ergs per mole8×
λ
If λ is expressed in Å (1Å = 10–8cm)
E = 1.196 10 ergs per mole16×
λ (5.3)
= 1.196 10 4.184 10
calories per mole16
7×
× ×λ
= 2.859 10 k.cals per mole5×
λ (5.4)
This energy which activates one mole of reactant is called one Einstein.As E ∝ 1/λ, so one Einstein corresponding to UV radiations would involvemore energy than that in the visible region.
5.1.3 Primary Process in Photochemical ReactionsThe primary process consists of raising of the electronic quantum level ofmolecule by absorption of energy from photon. The excited molecule maythen behave in different ways. The energy of the photon is transformed intoheat and temperature of absorbing system is raised but the excited moleculemay behave in other ways resulting in a chemical change.
The electronic transition which occurs on absorption of energy is

Kinetics of Some Special Reactions 117
accompanied with changes in vibrational and rotational quantum levels andis governed by Frank-Condon principle. The behavior of excited moleculecan be understood from the potential energy curves as follows:
1. When an excited molecule also consists of a definite vibrational levelas shown in Fig. 5.1(a), there shall be no direct dissociation of molecule anda fine structure in the electronic band spectra of the molecule will be observed.The excess energy, in usual course may be dissipated as heat or may give riseto fluorescence. But the molecule may retain its energy until it has notreacted with another molecule or transfer its energy to another molecule, e.g.decomposition of NOCl as follows:
NOCl + hν → NOCl*
NOCl* + NOCl → 2NO + Cl2
Fig. 5.1 Potential energy curves showing processes that can occur onabsorption of radiation.
Interatomic distance
Pot
enti
al e
nerg
y
(a) (b) (c) (d)
IIIII
I
2. When a molecule raised to higher electronic state acquires a quantumlevel above the maximum stability level (Fig. 5.1(b)), the energy gained ishigher than the binding energy of the molecule and the molecule will undergodissociation in its first oscillation. The products of dissociation may start achain reaction. In such a case, a continuum spectra will be observed, e.g.decomposition of HI or H2–Cl2 as follows:
HI + hν → H + I
H + HI → H2 + I
I + I → I2
Cl2 + hν → 2Cl
Cl + H2 → HCl + H
H + Cl2 → HCl + Cl
3. When an excited molecule is in an electronic state which is quite
118 Chemical Kinetics and Reaction Dynamics
unstable (Fig. 5.1(c)), i.e. as soon as a photon is absorbed by the molecule,it breaks into atoms or radicals with different kinetic energy, a continuousspectrum without any fine structure is obtained. The products of dissociationmay start secondary chemical changes or chain reactions as in 2 above.
4. Sometimes two higher electronic levels, stable state II and unstablestate III may exist quite close to each other (Fig. 5.1(d)). By absorption oflight, the molecule is raised to higher stable electronic state II. If the oscillationsare relatively slow, there is a chance of the molecule of shifting from stablestate II to unstable state III. If such a shift takes place, the molecule woulddissociate producing atoms or radicals. The spectrum would show fine structureat lower levels of vibrations followed by a continuum. This is calledpredissociation.
5.1.4 H2-Br2 ReactionThe mechanism for reaction is as follows:
Br2 + hν → Br + Br; Iobs
Br + H2 → HBr + H; k2
H + Br2 → HBr + Br; k3
H + HBr → H2 + Br; k4
Br + Br → Br2; k5
The rate of formation of HBr is given as
ddt
k k k[HBr]
= [H][Br ] + [Br][H ] – [H][HBr]3 2 2 2 4 (a)
Under the steady state conditions, we have
ddt
ddt
[H] = 0 and
[Br] = 0
ddt
k k k[H]
= [H ][Br] – [H][Br ] – [H][HBr] = 02 2 3 2 4 (b)
ddt
k I k k k k[Br]
= – [H ][Br] + [H][Br ] + [H][HBr] – [Br] = 01 abs 2 2 3 2 4 52 (c)
On adding (b) and (c), we get
k1Iabs = k5[Br]2
or [Br] = 1 abs
5
1/2k Ik
⎛⎝
⎞⎠ (d)
Substituting the value of [Br] in equation (b) and simplifying

Kinetics of Some Special Reactions 119
[H] = [H ]
[Br ] + r]
21 abs
5
1/2
2
3 2 4
kk I
kk k
⎛⎝
⎞⎠
[ΗΒ(e)
Again on substituting the values of [H] and [Br] in (a), the rate of reactioncan be given as
ddt
kk I
kk k
[HBr] =
2 [H ]
1 + [HBr]/ Br ]
21 abs
5
1/2
2
4 3 2
⎛⎝
⎞⎠
[(5.5)
It is the same rate as given in thermal reaction given by equation (3.31).Thus, both in thermal and photochemical reactions, the primary process isthe dissociation of Br2 molecules. In spite of the chain mechanism, thequantum yield of H2 and Br2 reaction is very small, i.e. about 0.01 at ordinarytemperature, although it increases as the temperature is raised. The reason isthat the reaction immediately after initiation following the primary state, i.e.
Br + H2 → HBr + H
is an endothermic process and requires a high energy of activation. At ordinarytemperature this reaction is so slow that most of bromine atoms recombineto produce molecules resulting in a low yield. As the temperature is raised,the rate of reaction increases and, therefore, quantum efficiency of the wholeprocess also increases.
5.1.5 H2 and Cl2 ReactionThe quantum yield of H2-Cl2 combination is exceptionally high; it varieswith the experimental conditions but is found to be between 104 and 106 inabsence of O2 with light of wavelength 4800 Å. The process occurs in therange 5460 to 4800 Å with an apparently lower efficiency because only asmall proportion of light absorbed is capable of dissociating Cl2 molecule.The mechanism can be proposed as
Cl + 2Cl2 1h kν→ 1st stage (i)
Cl + H HCl + H
H + Cl HCl + Cl chain reaction
2
2
2
3
k
k
⎯→⎯
⎯→⎯
⎤
⎦⎥⎥
(ii, iii)
Cl + Wall 1/2Cl 2
3k⎯→⎯ termination (iv)
Reaction (ii) between chlorine atom and hydrogen molecule is very rapid,since it is an exothermic process and has low energy of activation whereascorresponding reaction with bromine atom is very slow at ordinary temperature.
Applying the steady state treatment with respect to chlorine atom, we canget
120 Chemical Kinetics and Reaction Dynamics
k1Iabs + k3[H][Cl2] = k2[Cl][H2] + k4 [Cl] (a)
assuming that reaction (iv) is a first order reaction. Similarly, consideringsteady-state treatment with respect to hydrogen atom, we get
k2[Cl][H2] = k3[H][Cl2] (b)
Hence, from (a) and (b)
k1Iabs = k4[Cl]
or [Cl] = (k1/k4) Iabs (c)
The rate of formation of HCl is given as
ddt
k k[HCl]
= [Cl][H ] + [H][Cl ]2 2 3 2
= 2k2[Cl][H2] (from equation (b))
Substituting the value of [Cl] from equation (c), we get
ddt
k kk
I[HCl]
= 2
[H ]1 2
4abs 2 (5.6)
The rate law (5.6) is in agreement with experimental results. At highchlorine pressure, the termination step (iv) may be replaced by followingequilibria
Cl + Cl2 [ Cl3
2Cl3 [ 3Cl2
This will lead to a different kinetic law. In presence of O2, the followingchain termination processes take place:
H + O2 → HO2
Cl + O2 + HCl → HO2 + Cl2
HO2 subsequently reacting to give products which do not propagate chains.
5.2 Oscillatory ReactionsOscillations are familiar phenomena in mechanical systems and in electriccircuits. Noyes and Field discussed the possibilities for concentrationoscillations in closed systems and illustrated the principles by means ofOregonator model consists of the following five steps:
A + Y → X (i)
X + Y → P (ii)
B + X → ZX + Z (iii)

Kinetics of Some Special Reactions 121
X + X → Q (iv)
Z → fy (v)
if [X] is always small. Because all the steps are irreversible, the free energyof the model system is indefinitely far removed from its equilibrium value.Species A and B are irreversibly consumed and P and Q are irreversiblyproduced. A stoichiometric factor is denoted by f. The species X, Y and Z areboth consumed and produced, and their concentrations may oscillate dependingupon the relative rates of production and consumption.
A chemical reaction can be designated as oscillatory, if repeated maximaand minima in the concentration of the intermediates can occur with respectto time (temporal oscillation) or space (spatial oscillation). A chemical systemat constant temperature and pressure will approach equilibrium monotonicallywithout overshooting and coming back. In such a chemical system theconcentrations of intermediate must either pass through a single maximumor minimum rapidly to reach some steady state value during the course ofreaction and oscillations about a final equilibrium state will not be observed.However, if mechanism is sufficiently complex and system is far fromequilibrium, repeated maxima and minima in concentrations of intermediatecan occur and chemical oscillations may become possible.
First model for oscillating system was proposed by Volterra for prey-predator interactions in biological systems and by Lotka for autocatalyticchemical reactions. Lotka’s model can be represented as
A + X 2X 1k→ (i)
X + Y 2Y 2k→ (ii)
Y Z 3k→ (iii)
According to the above model, we have
ddt
k k[X]
= [A][X] – [X][Y]1 2 (5.7)
andd
dtk k
[Y] = [X][Y] – [Y]2 3 (5.8)
The solution of these differential equations for [X] and [Y] indicate that theconcentrations of intermediates of X and Y oscillate periodically with time.The concentrations of A and Z do not oscillate but rate of consumption of Aand formation of Z do oscillate.
Oscillations of concentrations of intermediates can occur when one substancein a sequence of reactions is either an activator or an inhibitor for a reactionstep that occurs earlier in the sequence. Such activation or inhibition cancontrol intermediate forming steps and will be responsible for producingoscillation in the concentration of the intermediate. The important conditionsrequired to generate oscillations in a chemical system are:

122 Chemical Kinetics and Reaction Dynamics
(i) Continuous flow of matter into system so as to keep [Reactant] constant.(ii) A mechanism that allows coupled indirect feedback. Chemical
oscillations generally operate by delayed feed back, e.g. autocatalyticsteps (i) and (ii) in Lotka’s mechanism.
(iii) System should be far from equilibrium, i.e. system should involvesome irreversible steps.
5.2.1 Belousov-Zhabotinskii ReactionAn acidic bromate solution can oxidize various organic compounds and thereaction is catalyzed by species like cerous and manganous ions that cangenerate 1-equivalent oxidants with quite positive reduction potential. Belousov(1959) first observed oscillations in [CeIV]/[CeIII] during Ce (III) catalysedoxidation of citric acid by bromate ion. Zhabotinskii made extensive studiesof both temporal and spatial oscillations and also demonstrated that insteadof Ce (III), weak 1- equivalent reductants like Mn(II) and Fe (II) can also beused. The reaction is called Belousov-Zhabotinskii reaction. This reaction,most studied and best understood, can be represented as
2H + 2BrO + 3CH (COOH) 2BrCH(COOH) + 3CO + 4H O+3–
2 2 2 2 2→
or HMa → BrMa
3H + 3BrO + 5CH (COOH) 3BrCH(COOH) + 4CO + 5H+3–
2 2 2 2 2→ Ο
An initial rapid change in concentration is followed by a long inductionperiod and finally a series of oscillations in both [Br–] and [Ce (IV)]/[Ce(III)]are observed. These oscillations were followed potentiometrically.
Field and Noyes based on Oregonator model have proposed a mechanisminvolving three intermediates HBrO2, Br– and cerium (IV). The concentrationof HBrO2 changes between two limits whenever [Br–] passes through a criticalvalue. Cerium (IV) is the intermediate which regenerates Br–. The oscillationsarise because of the switching from one reaction sequence to other. This isshown in Scheme A.
HMa
Sequence A
Br– Ce (III)BrO3–
BrMaHOBr
Sequence B
At low [Br–], Ce(III) + BrO3–
At high [Br–]
Sequence CBrMa
HBrO2 Ce(IV) + HBrO2
Scheme A

Kinetics of Some Special Reactions 123
The series of elementary reactions can be divided into following threegroups:
Sequence A
When solution contains sufficient amount of Br–, reduction of Br O3– and
bromination of malonic acid (HMa) take place by HOBr or Br2 as follows:
2H + BrO + Br HBrO + HOBr+3– – slow
2⎯ →⎯ (A1)
HBrO + Br + H 2HOBr2– + slow⎯ →⎯ (A2)
Br + HOBr + H Br + H O– + fast2 2⎯ →⎯ (A3)
Br + HMa BrMa + H + Br2 fast + –⎯ →⎯ (A4)
Molecular bromine may or may not be an intermediate in this reaction. Theoverall reaction will be given by (A1) + (A2) + 3 (A3) + 3 (A4), i.e.
2Br + BrO + 3H + 3HMa 3BrMa + 3H O–3– +
2→ (a)
Sequence BWhen [Br–] is low, cerium (III) is oxidized to Ce (IV). The reaction isautocatalytic but inhibited by Br– and, therefore, sequence B occurs onlywhen system contains very low [Br–].
BrO + HBrO + H 2BrO + H3–
2+ slow
2*
2⎯ →⎯ Ο (B1)
H + BrO + Ce HBrO + Ce+2* III
2IV→ (B2)
2HBrO BrO + HOBr + H2 3– +→ (B3)
The overall reaction 2(B1) + 4(B2) + B3, i.e.
BrO + 4 Ce(III) + 5H HOBr + 4Ce + 2H3– + IV
2→ Ο (b)
constitute the sequence B.
Sequence CWhen enough CeIV is produced by reaction (b), sequence C starts in whichoxidation of HMa or BrMa starts.
BrMa + 4CeIV + 2H2O → Br– + HCOOH + 2CO2 + 4CeIII + 5H+
or HMa + 6CeIV + 2H2O → 6CeIII + HCOOH + 2CO2 + 6H+ (C1)
HOBr + HCOOH → Br– + CO2 + H+ + H2O (C2)
and overall reaction of sequence C will be (C1) + (C2), i.e.
BrMa + 4CeIV + HOBr + H2O → 2Br– + 3CO2 + 4CeIII + 6H+ (c)

124 Chemical Kinetics and Reaction Dynamics
or HMa + 6CeIV + HOBr + H2O → 6CeIII + 3CO2 + 7H+ + Br–
The stoichiometric reaction for the oxidation of HMa is obtained by addingreaction (a), (b) and (c)
2BrO + 3HMa + 2H 2BrMa + 2CO + 2H O3– +
2 2→
which does not involve the concentrations of Br– and CeIII indicating thatthese species play a true catalytic role (Fig. 5.2).
Fig. 5.2 Periodic behaviour in [Br–] and [CeIV]/[CeIII] in Belousov reaction.
5.3 Kinetics of PolymerizationA polymeric compound (polymer) is formed by the combination of numeroussmall units called monomer by appropriate chemical reactions. The highpolymers are substances of very high molecular weight, which may occur innature or may be synthesised. The degree of polymerization refers to thenumber of repeating units in the polymer chain and is related to the length ofthe chain. The molecular weight of the polymer is given by
(Mol. wt. of polymer) = (Degree of polymerization)× (Mol. wt. of repeating unit)
Since the chain length may vary in any polymer, the average degree ofpolymerization is used.
For a substance to act as monomer, it should have two or more bondingor active sites (called functional groups, through which each can link toother monomers to form the polymer chain. The number of functional groupsor bonding sites per monomer molecule is referred to as its functionality.Bifunctional monomers forms linear polymers which can be a straight orbranched chain. When monomer is poly-functional, a three dimensional networkcontaining both branches and cross links is possible. Since these monomerscan undergo condensation or addition reactions, Carothers had originallyclassified the process as addition and condensation polymerizations. Theaddition polymers are formed by addition of monomers without any eliminationand molecular weight of the polymer is an integral multiple of that monomer
Time
[Br– ]
log
{[C
eIV]/
[CeII
I ]}

Kinetics of Some Special Reactions 125
n(CH2 = CH2) → —(CH2—CH2 )n—
Addition polymerization may proceed through a free radical, cationic oranionic process. Condensation polymers, on the other hand, are formed byelimination of small molecules like that of water, alcohol or ammonia in thereaction of monomeric units, e.g.
nH2N—(CH2)6—NH2 + nHOOC—(CH2)4—COOH
→ [HN—(CH2)6—NH—CO—(CH2)4—CO ]n + 2nH2O
On the basis of polymerization mechanism, the processes of polymerizationcan be classified in two groups: (i) step growth polymerization and (ii) chaingrowth polymerization.
5.3.1 Step Growth PolymerizationIn step growth polymerization, initially dimer formation takes place due tocondensation, addition or ring opening etc., e.g.
HO—R—COOH + HO—R—COOH → HO—R—COO—R—COOHdimer
↓HO—(R—COO) —R—COOH Trimer
Polymern ←
The dimer formed still has reactive groups. Hence, the polymerization willcontinue to take place in a stepwise fashion. Each step in this type ofpolymerization is identical and, therefore, the rate and mechanism of eachstep remains same as in the initial step. Polyestrification reactions are examplesof step growth polymerization
HO—(CH ) COOH —[CO(CH ) —O—] + ( – 1)H O2 5 heat
2 5 2⎯ →⎯ n n
or Dicarboxylic acid + Diol → Polymer + Water
The water formed in the reaction is continuously removed from the reactionmixture by azeotropic distillation, in order to avoid reversible reaction betweenwater and ester. The progress of reaction can be followed either by measuringthe amount of water or by determining the amount of unreacted acid inaliquots withdrawn at regular intervals of time. The reaction can be carriedout either in presence of a catalyst, i.e. a weak acid like p-toluene sulphonicacid (a strong acid can hydrolyse the polymer, formed) or in absence of thecatalyst.
5.3.2 Polycondensation Reactions (in Absence of the Catalyst)The rate of uncatalyzed polycondensation reaction follows the rate law
–[dicarboxylic acid]
= [dicarboxylic acid] [diol]2ddt
k (5.9)

126 Chemical Kinetics and Reaction Dynamics
The second order in acid arises as it acts both as reactant and the catalyst.If acid and diol are taken in equivalent concentrations, say c, the rate law canbe written as
– = 3dcdt
kc (5.10)
On integrating the equation with the conditions that when t = 0, c = c0,equation becomes
kt c c
= 12
1 – 12
02
⎛⎝⎜
⎞⎠⎟
(5.11)
The fraction of the functional group that has reacted at any time t is givenas
fc c
cc c f =
– or = (1 – )0
00 (5.12)
Equation (5.11), therefore, can be written as
ktc f
= 12
1(1 – )
– 102 2
⎛⎝⎜
⎞⎠⎟
(5.13)
According to equation (5.13), a plot of 1/(1 – f )2 versus time should belinear. This has been tested in many polyestrification reactions.
5.3.3 Acid Catalyzed Polycondensation ReactionIn case of acid catalyzed polyestrification reactions, the rate is given as
–[Acid]
= [dicarboxylic acid][catalyst][diols]d
dtk ′′ (5.14)
Since concentration of catalyst remains constant, the rate law may be givenas
–[Acid]
= [dicarboxylic acid][diols]d
dtk (5.15)
when k = k″ [catalyst].Further, at equivalent concentrations of dicarboxylic acid and diol i.e. c,
the rate law equation (5.15) becomes
– = 2dcdt
kc (5.16)
where k is a second order rate constant.

Kinetics of Some Special Reactions 127
Integrating equation (5.16) under the conditions that c = c0 at t = 0, andconsidering c = c0 (1 – f ), the rate equation is obtained as
ktc f
= 1 11 –
– 10
⎛⎝
⎞⎠ (5.17)
Thus, f may be given as
fkc t
kc t =
1 + 0
0(5.18)
Equation (5.18) has also been verified experimentally.
5.3.4 Chain Growth PolymerizationThe unsaturated monomers of type H C = C
R
R2
′ are bifunctional and their
reactivity towards polymerization can be attributed to the π bond whichundergo homolytic or heterolytic fission in presence of free radicals, cationsor anions. Therefore, chain growth polymerization can progress through thefollowing different mechanisms:
(i) Free radical polymerization(ii) Cationic polymerization
(iii) Anionic polymerization
The polymerization proceeds in three distinct stages, viz. (i) initiation, (ii)propagation and (iii) termination. Initiation is the act of creating active centersin monomers. The activated monomers are the chain carrier species, i.e.these add on to the monomer to give another chain carriers. Such repeatedsequence of monomers reacting with chain carriers contribute to growth ofthe polymer chain. These steps are known as propagation steps and willcontinue till the monomer is present in the system. However, these reactivechain carriers are deactivated and growth of polymer chain stops. This processis known as termination process.
5.3.5 Kinetics of Free Radical PolymerizationFree radical polymerization involves the generation of free radicals whichpropagate by addition of monomer molecules ultimately to give a largepolymer molecule. It is generally carried out with a suitable initiator dissolvedin the monomer solution.
Initiation: This is a two stage process, viz.(i) Decomposition of initiator to give free radical
I 2Rdk→ • (i)
(ii) Attacking of free radical on monomer to give chain carrier
R + M Mi1
• •→k (ii)
The rate of dissociation of initiator is given as

128 Chemical Kinetics and Reaction Dynamics
–[I]
= [I] = 12
[R ]d
ddt
kd
dt
•
(a)
ddt
k[R ]
= 2 [I]d
•
On applying the steady-state treatment with respect to [R•], we get
ddt
ddt
[R ] = –
[R ]• •
2kd [I] = ki[R•][M]
Now
Rate of initiation = [M ]
= [R ][M] = 2 [I]i dd
dtk k
•• (b)
if f is the factor which represents the fraction of free radical effective ininitiation process, then we can write
Rate of initiation = 2kd f [I] (c)
Propagation: Initiation is followed by propagation represented as follows:
M + M M1
2p• •→k
(iii)
M + M M2
3p• •→k
(iv)
M + M M–1 p
xk
x• •→ (v)
Since the radical reactivity is independent of chain length, all propagationsteps are assumed to have same rate constant kp. Therefore, rate of propagationmay be represented as
Rate of propagation = kp [M][M•] (d)
where [M] is concentration of monomer and [M•] the concentration of reactivefree radical.
Termination: The final step is termination which may involve the combinationof two growing chain carriers
M + M M 2
t• • →k (vi)
Rate of termination is given by
–[M ]
= 2 [M ][M ]td
dtk
•• • (e)
where factor 2 shows that in any termination process, two radicals are involved.

Kinetics of some Special Reactions 129
For many cases the concentration of free radical becomes practicallyconstant since the radical is formed and consumed at identical rates. Therefore,under steady state conditions
Rate of initiation = Rate of termination
2kd f [I] = 2kt [M•]2
or [M ] = [I]d
t
1/2• ⎛
⎝⎞⎠
k fk
(f)
Again, overall rate of monomer consumption is
–[M]
= Rate of initiation + Rate of propagationd
dt
When a very long polymer is formed, the rate of propagation is much greaterthan the rate of initiation and therefore, overall rate of polymerization issame as the rate of propagation. Hence
Rate of polymerization = [I] [M]p d
1/2
t1/2
1/2 1/2k k
kf (5.19)
Thus, the rate of polymerization is proportional to [M] and [I]1/2, if f ishigh and independent of M, i.e. if f = 1.
When the initiation efficiency f << 1, f becomes function of M and
Rate of polymerization = [f] [M]p d
1/2
t1/2
1/2 3/2k k
k(5.20)
Experimental Determination of Rate ConstantsThe decomposition of initiator can be followed by usual analytical methodsand kd can be determined. The efficiency factor f can be obtained by comparingthe amount of initiator [I] decomposed with the number of polymer chainformed. The rate of polymerization can be determined by monitoring thechange in a physical or chemical property of the system. Generally, dilatometrytechnique is used for determination of the rate of polymerization. Let theextent of polymerization be small and concentration of initiator be constant.Let r0, rt and r∞ be the readings on dilatometer initially, at time t and at thecompletion of reaction, respectively. If reaction is first order in [M],
Rate of polymerization = k [M]
where k is first order rate constant given as
kt
aa x t
r rr r
= 2.303 log –
= 2.303 log––
0
t
∞
∞
⎛⎝
⎞⎠ (5.21)
130 Chemical Kinetics and Reaction Dynamics
Thus, a plot of (r0 – r∞/rt – r∞) versus time will be linear and slope of the plotwill give the value
kk k
kf = { [I]}
p d1/2
t1/2
1/2
Now, if kd, f and [I] are known, (kp / k t1/2 )can be evaluated. For calculating
individual values of kt and kp one more relation can be obtained as follows.Under the steady state condition, the average life time τ is given as
τ = [M ] at any time
Rate of disappearance of M =
[M ]2 [M ]
= 12 [M ]t
2t
•
•
•
• •k k(5.22)
The value of M• can be obtained from rate of polymerization.
Rate of polymerization = kp [M] [M•]
Therefore, we get
τ = [M]
2 (Rate of polymerization)p
t
kk
(5.23)
From equation (5.23) kp/kt can be calculated.Kinetic chain length is defined as the average number of monomers reacting
with a given active centre from initiation to termination and is given by
nk
k f =
Rate of propagationRate of initiation
= [M][M*]2 [I]
p
d
=[M]{ [I]/ }
2 [I] =
[M]
2 { [I] }p d t
1/2
d
p
t1/2
d1/2 1/2
k k f kk f
k
k k f(5.24)
5.3.6 Cationic PolymerizationIn anionic polymerization, the initiators are either Bronsted or Lewis acids.In Bronsted acid, H+ is the effective catalyst while in Lewis, co-catalyst isinvolved to give catalytically active species, e.g.
BF + H O H [BF OH]3Lewis acid
(A)
2co-catalyst
(RH)
+3
–
active species(H —AR)+
[→
The mechanism of anionic polymerization, in general, may be represented as
A + RH H —AR
H —AR + M HM —AR
+
+ +i
[K
k→
⎫⎬⎪
⎭⎪(initiation)
HM —AR + M HM — ARx+
x+1+pk→ (propagation)

Kinetics of some Special Reactions 131
HM —AR M + H — ARx+
x+tk→ (termination)
We can give
Rate of initiation = [H —AR][M] = K[A][RH]Mi+
ik k (a)
Rate of termination = [HM —AR]t x+k (b)
It is a first order process under the steady state conditions,
Rate of initiation = Rate of termination
k ki t x+K[A][RH][M] = [HM —AR]
Therefore
[HM —AR] = [A][RH][M]x+ i
t
k Kk
(c)
Rate of polymerization = Rate of propagation
= [M][HM —AR]p x+k = [A][RH][M]
p i
t
2K k k
k(5.25)
In absence of a co-catalyst, the initiation step will be
HA + M HM A + –ik→
and correspondingly the rate of polymerization may be obtained as
Rate of polymerization = [HA][M]p i
t
2k kk
(5.26)
It has also been observed that only ion-pair and not the discrete ionicspecies are involved in the initiation process.
The chain length = Rate of polymerization
Rate of termination
=/ [A][RH][M]
( )[A][RH][M] = ( / )[M]
p i t2
ip t
Kk k kk K
k k (5.27)
5.3.7 Anionic PolymerizationThe polymerization of olefinic compounds like acrylonitrile, vinyl chloride,styrene, methylmethacrylate can be initiated by anion. The mechanism, ingeneral, can be given as
AB A + B
B + M M (initiation)
+ –
– –i
k
k
→
→
⎤
⎦⎥⎥

132 Chemical Kinetics and Reaction Dynamics
M + M M ]n–
n+1–pk→ (propagation)
M + B M + B ]n–
n–tk→ (termination by chain transfer)
where B is the species involved in chain transfer process.
Rate of initiation = ki[B–][M] (a)
Rate of propagation = kp [M] [Mn]– (b)
Rate of termination = [M ][B]t n–k (c)
Under the steady state conditions
Rate of initiation = Rate of termination
i.e. k ki–
t n–[B ][M] = [M ][B]
Therefore
[M ] = [B ][B]
[M]n– i
t
–kk
(d)
Again
Rate of polymerization = Rate of propagation
Thus, we can write
Rate of polymerization = [M][M ] = [B ][B]
[M]p n– p i
t
–2k
k kk (5.28)
which shows that reaction is second order in monomer.
Chain length = Rate of polymerization
Rate of termination
=( / )[B ][M] /[B]
[B ][M] = ( / )[M]/[B]
p i t– 2
i– p t
k k k
kk k (5.29)
5.3.8 Co-polymerizationThe polymer prepared from same monomer is called homopolymer. If morethan one monomer is used, the polymer obtained is called copolymer whichmay be of following four types depending on their structure arrangements:
(a) Alternating copolymer—when two structural units alternate in a linearfashion as ABABA . . . .
(b) Random copolymer—when the distribution is random as AABABBAAA . . . .
(c) Block copolymer—when alternations of substantial sequences appearin the chain as AAABBBAAABBB etc.
Kinetics of some Special Reactions 133
(d) Graft copolymer—when blocks of one monomer present as brancheson the main backbone of the other polymer as
—A|B
—A—A|B|
—A—A—A—
|
|
|Β
Β
Β
Β
Polymer chains containing more than one type of monomer can be synthesisedby selecting suitable monomers A and B and initiating the polymerizationprocess using free radical or ionic initiators. The process is calledcopolymerization. The copolymer can exhibit better qualities than the parenthomopolymer.
Let us consider a radical initiated copolymerization of two monomers M1
and M2. The four possibilities in which monomers M1 and M2 can add to
radicals M1• and M 2
• are:
M + M M —M ;1 1
1 111• •⎯→⎯k W Rate = [M ][M ]11 1 1k •
M + M M —M ;1 2
1 212• •⎯→⎯k W Rate = [M ][M ]12 1 2k •
M + M M —M ;2 1
2 121• •⎯→⎯k W Rate = [M ][M ]21 2 1k •
M + M M —M ;2 2
2 222• •⎯ →⎯k W Rate = [M ][M ]22 2 2k •
where k11 and k22 are the rate constants for self propagating and homoreactions.While k12 and k21 are rate constants for cross propagation, it has been assumedthat the reactivity of any growing chain depends only on the end monomerunit carrying the free radical site and not on the length of the chain. Now, thedisappearance of M1 and M2 can be given as
–[M ]
= [M ][M ] + [M ][M ]111 1 1 21 2 1
ddt
k k• • (a)
and –[M ]
= [M ][M ] + [M ][M ]222 2 2 12 1 2
ddt
k k• • (b)
Assuming a steady state, i.e. rate of disappearance of a particular chainend M1
• is equal to its rate of formation, we get
k k12 1 2 21 2 1[M ][M ] = [M ][M ]• •
or[M ][M ]
= [M ][M ]
1
2
21 1
12 2
•
•kk
(c)

134 Chemical Kinetics and Reaction Dynamics
From equations (a) and (b), we can get
dd
k kk k
k kk k
[M ][M ]
= [M ][M ] + [M ][M ][M ][M ] + [M ][M ]
= [M ]{ [M ]/[M ] + }[M ]{ [M ]/[M ] + }
1
2
11 1 1 21 2 1
12 1 2 22 2 2
1 11 1 2 21
2 12 1 2 22
• •
• •
• •
• •
(d)
Substituting the value of (M )/(M )1 2• • from equation (c) into (d), we get
d Md
k k k kk k k k
[ ][M ]
= [M ]{ ( [M ]/ [M ]) + }[M ]{ ( [M ]/ [M ]) + }
1
2
1 11 21 1 12 2 21
2 12 21 1 12 2 22
=[M ]{ [M ]/ [M ] + 1}[M ]{[M ]/[M ] + / }
1 11 1 12 2
2 1 2 22 21
k kk k
Let k11/k12 = r1 and k22/k21 as r2
The relative reactivity ratios r1 and r2 are the ratios of rate constant for agiven radical adding to its own monomer to the rate constant for its addingto the other monomer. For example when r1 > 1, radical prefers to add to M1
while if r1 < 1, i.e. M1• prefers to add to M2. Now, we can write
dd
rk k k
rr
[M ][M ]
= [M ]{ [M ]/[M ] + 1}
[M ]{ [M ]/ [M ] + } =
[M ][M ]
[M ] + [M ][M ] + [M ]
1
2
1 1 1 2
2 12 1 12 2 22
1
2
1 1 2
1 2 2
⎧⎨⎩⎫⎬⎭ (e)
If X1 and X2 are the mole fractions of monomers M1 and M2 being added tothe growing chain at any time t and x1 and x2 are mole fractions of M1 andM2, respectively, in the feed, then
dd
XX
X[M ][M ]
= = (say)1
2
1
2
and[M ][M ]
= = (say)1
2
1
2
XX
x
Then equation (e) can be simplified as
X xr xx r
= + 1
+ 1
2
⎛⎝
⎞⎠ (f)
or 1 – = 1 – + 1
+ =
+ – – +
1
2
2 12
2X x
r xx r
x r r x xr x
⎛⎝
⎞⎠
or (1 – X) (r2 + x) = x + r2 – r1x2 – x
r2 + x – Xr2 – xX = x + r2 – r1x2 – x
or x(1 – X) = r2X – r1x2
x XX
r rxX
(1 – ) = –2 1
2⎛⎝
⎞⎠ (5.30)

Kinetics of some Special Reactions 135
According to equation (5.30) a plot of {x(1 – X)/X} against (x2/X) shouldgive a straight line with a slope ( = r1) and an intercept ( = r2). The values ofr1 and r2 can be evaluated from this straight line. For different ratio of feedcomposition [M1]/[M2], i.e. x, the polymerization is carried out keeping lowpercentage conversion.
The polymers are isolated and their composition is determined. This givesthe value of x, i.e. instantaneous polymer composition ratio. Since X and xare different as polymerization progresses, the unreacted polymer ratio x willchange resulting in a continuous change in the composition of the polymerformed. This is known as the composition drift.
The copolymerization depends on values of r1 and r2. The conclusionsmay be summarized as follows:
1. When r1 = 1, k12 = k11, i.e. rate constant for self-propagation and crosspropagation are same, the radical M1
• can add to M1 or M2 with equalprobability.
2. When r1 ≈ r2 ≈ 0, self-propagation reactions are not taking place, M1•
will add to M2 and M 2• will add to M1. The formation of an alternating
copolymers is expected.3. When r1 < 1 and r2 < 1, the cross propagation reactions 12 and 21 are
preferred to self-propagation reactions 11 and 22. M2 can add to M1• and M1
can add to M 2• resulting in a copolymer formation. Predomination of one
sequence depends on the values of r1 and r2 and feed ratio.4. When r1 = r2 = 1, all four types of propagation reactions are equally
possible. The copolymer will have same ratio of monomer as that of themonomer feed. A random copolymer is formed.
5. When both r1 and r2 >1, a mixture of the two homopolymers is expectedand it is possible to have block polymer.
6. When r1 > 1 and r2 < 1, the self-propagation reaction of type 11 andcross propagation reaction of type 21 are more probable. The copolymerformed will be richer in M1. Similarly if r2 > 1 and r < 1, copolymer will bericher in M2.
5.4 Kinetics of Solid State ReactionsThe solid state reactions are extremely complex due to intervention of manyphysical parameters and it becomes often necessary to make somegeneralizations in the complex reactions. The rate in solid state reactionscannot be defined in the same way as that for a homogeneous reactionsbecause the concept of concentration in solid state reactions has no significance.The energy of activation in a solid state reaction has also no significance,except in some rare cases.
The lattice imperfections play an important role in reactions in solid state.The reactivity of solids are due to the defect or fault in the lattice. The moreperfect a crystal is, the smaller is its reactivity. The defect may be pointdefect, dislocations, stacking faults, bulk defects etc.
136 Chemical Kinetics and Reaction Dynamics
The simple solid state reaction may involve either (i) the interfacial reactionor (ii) the diffusion of reactants to each other, as the rate determining step.For example, decomposition of a solid giving rise to another solid
Solid → Solid
CaCO3(s) → CaO(s) + CO2(g)
An interface is formed at the point where the decomposition takes placeand the interfacial reaction becomes important.
When a gas or liquid involves in the reaction, for example, the oxidationof a metal surface
2Fe(s) + O2(g) → 2FeO(s)
The interface where the reaction takes place must be accessible to thesereactants. In such cases, the diffusion of reactants to the reaction front becomesan important factor and diffusion of reactions to each other is rate determiningstep.In reactions
Solid (A) + Gas (B) → Solid (AB)
or Solid (A) + Liquid (B) → Solid (AB)
When the molar volume of product, i.e. solid (AB) is less than that of solid(A), the product layer will be porous and the rate determining step is thechemical process occurring at the interface of solid (A). Such reactions arealso known as topochemical reactions. The rate of reaction may be determinedby the available surface area of A. For example, if reaction involves sphericalparticle, the rate of reaction (i.e. – dV/dt, where V is the volume of particleat time t) is given as
– = (surface area) = (4 )2dVdt
k k rπ (5.31)
where r is radius of particle at time t.
Since, volume V r = 43
3π
– 43
= 43 2ddt
r krπ π⎛⎝
⎞⎠
or – = drdt
k (5.32)
Thus, radius of the particle reduces at a constant rate.In above reactions when molar volume of product (AB) is greater than
that of reactant (A), the product (AB) will usually form a protected layer

Kinetics of some Special Reactions 137
around (A), the diffusion process becomes the rate determining step. Sincethe diffusion is the rate controlling step in these reactions, according toWagner’s theory the rate of reaction is given by
Rate of reaction = = /dxdt
k x
or x2 = 2kt (5.33)
where constant k is proportional to diffusion coefficient. This is known asparabolic law and is frequently observed. Various other laws have also beenobtained.
When a solid-solid reaction starts, a layer of product is formed betweenthe two reactant phases and a single phase boundary converts into two differentphase boundaries as
Product
Phase boundaries
Solid (B)Solid (A)
The product layer progressively becomes thicker until the original reactantsare completely consumed. These reactions involve two steps: (i) the diffusionof reactants through the product layer and (ii) the reaction at the phaseboundary. The relative rates of these steps determine the overall rate ofreaction.
The experimental methods which give informations on the structure ofthe phases (for example, x-ray diffraction analysis of polycrystalline substances,diffuse reflectance spectra) may be used to follow the kinetics of solid-solidreactions.
Wagner gave a quantitative thermodynamic theory based on a simpleaddition reaction of type
AX + BX → ABX2
The theory is based on the assumptions that:
(i) the rate of reaction is determined by diffusion through the productlayer.
(ii) only cations are mobile with no change in their mobility.(iii) the mobility of cations corresponds to their transport fraction in an
electrolysis experiment.(iv) there is no appreciable electronic conduction.
The rate of reaction, determined as the sum of two individual particlecurrents, may be given as

138 Chemical Kinetics and Reaction Dynamics
Rate = –[A ] + [B ]Z
1 +Z [B ]V
[A ]V
V [B ]+ +
B
B+
B
A+
A
B+
Ζ
µ∫ d (5.34)
where [A+] and [B+] are concentrations, ZA and ZB are valencies, VA and VB
are mobilities of cations A and B, respectively, and l is diffusion length. Onintegration, the above expression shows that under the condition VB >> VA,the rate is proportional to transport number of A and in case VA >> VB it isproportional to transport number of B. The theory has also been extended tocover the movement of anions i.e. diffusion of anions.
The progress of the reactions like
Solid + Gas → Gas
or Solid Gases Thermal decomposition⎯ →⎯⎯⎯⎯⎯⎯
can be studied thermogravimetrically. The amount of solid can be weighedat regular intervals of time. The reactions in which temperature is progressivelychanged at constant rate, can also be studied using thermogravimetry.
Let us consider the decomposition of a solid
Solid → Gases
If α is the fraction of solid decomposed at time t, and the order of the reactionis one, the rate of disappearance of solid at any time t, may be given as
–[solid]
= = (1 – )d
dtddt
kα α (a)
where k is rate constant.Taking Arrhenius equation
k k e E RT = – /act∞ (b)
where k∞ is the value of rate constant when temperature is infinite, i.e. upperlimit for the rate constant.
Further, for a linear heating, the rate of heating may be given as
θ = dTdt
(c)
From equations (a), (b) and (c), we obtain
dk e dTE RTα
α θ(1 – ) = 1 – /act
∞ (5.35)
Taking logarithms of the integrated form of the equation (5.35), we get
log –log(1 – )
= log 1 –2
–2.3032
act act
actαθTk RE
RTE
ERT
⎡⎣⎢
⎤⎦⎥
⎛⎝
⎞⎠
⎧⎨⎩
⎫⎬⎭
∞ (5.36)

Kinetics of some Special Reactions 139
For usual values of Eact and nominal temperature range, the value of
log 1 –2
act act
k RE
RTE
∞ ⎛⎝
⎞⎠
⎧⎨⎩ θ is constant and thus a plot of log –
log(1 – )2
αT
⎡⎣⎢
⎤⎦⎥
versus 1/T will be a straight line with a negative slope. From the slope thevalue of Eact/2.303R (and hence Eact) may be obtained.
Considering the general reaction
–[solid]
= = (1 – )d
dtddt
knnα α (5.37)
for n th order of reaction, the order of reaction may also be determined.
5.5 Electron Transfer ReactionsElectron transfer reactions may follow two types of mechanism: (i) outersphere mechanism and (ii) inner sphere mechanism.
5.5.1 Outer Sphere MechanismIn principle, outer sphere mechanism involves electron transfer from reductantto oxidant when there is no change in the number or nature of the groups(coordination shells or spheres) attached to each of them. For example,
Fe Ir Fe Ir
3–3–2–4–
CN
CN
CN
CN
CN
CN
Cl
Cl
Cl
Cl
Cl
Cl
CN
CN
CN
CN
CN
CN
Cl
Cl
Cl
Cl Cl
Cl
In outer sphere mechanism, one reactant becomes involved in the outer orsecond coordination sphere of the other reactant and an electron flows fromthe reductant to oxidant. It is also possible that the electron is transferredfirst to the solvent and then from the solvent to an ion.
Such reactions are observed in electron transfer reactions of substitutionallyinert complexes. The mechanism involves three steps.
(i) Formation of complex between oxidant and reductant.(ii) Chemical activation of complex, electron transfer and relaxation of
the successor complex.(iii) Dissociation of successor complex.
Step (ii) is generally the rate determining step; for example
Fe + Fe Fe – FeII2+
(Oxidant)III3+
(Reductant)*2+
*3+
(Complex)[K
(i) formation of complex
Fe – Fe Fe – Fe*2+
*3+
(Complex)
*3+
*2+
(Complex)
k→ (ii) transfer of electrons
Fe – Fe Fe + Fe*3+
*2+
(Complex)III3+
II2+
(Ions)→ (iii) separation of ions

140 Chemical Kinetics and Reaction Dynamics
where asterisks represent the organized shells. The oxidant and reductantmust structurally reorganize themselves before electron transfer so that energiesof their transition states are equal.Step (i) i.e. formation of complex is considered to be fast and rate is generallydetermined by step (ii). The rate may be given as,
Rate = k K
Further electronic structure of oxidant and reductant, solvent reogranisationaffects the rate of reaction.
5.5.2 Inner Sphere MechanismWhen two reactants (oxidant and reductant) spare a ligand in their primarycoordination sphere, the electron is transferred across a bridging group andmechanism is known as inner sphere electron transfer mechanism. In thiscase the oxidant usually possesses at least one ligand capable of bindingsimultaneously to two metal ions. The other reactant is substitutionally labilei.e. one ligand must be replaced by bridging ligand. For example,
4+
NH3
NH3
NH3
NH3
H3N
Co Cr
Cl
OH2 OH2
OH2
OH2
OH2
[Co(H2O)6]2+ + [Cr(H2O)5Cl]2+ + 5 NH3
[Co(NH3)5Cl]2+ + Cr(H O)2 62+ + 5H2O
According to Taube, the inner sphere mechanism can takes place whenboth oxidizing and reducing agents are substitution inert and when ligandtransfer from oxidant to reductant is accompanied by electron transfer. Theinner sphere electron transfer mechanism may be represented by the scheme
O – X + R – H O [O---X---R] + H O2(Complex)
2==2
1
k
k
(i)
Complex O + R---X==4
3– +
k
k
(ii)
where O is oxidant with a ligand X and R is reductant. The rate of reactionmay be obtained as
Rate = +
[Oxidant][Reductant]1 3
2 3
k kk k
where k1 is rate limiting and k3 is rate determining. Thus, generally the reactionis second order being first order with respect to each oxidant and reductant.
Kinetics of some Special Reactions 141
The electronic structure of oxidant and reductant, nature of bridging ligand,formation as well as fission of complex are the factors which can effect therate of the inner sphere electron transfer mechanism.
The outer sphere mechanism may take place in all redox active systemswhile inner sphere mechanism requires substitutionally labile reactants andproducts.
When oxidants and reductants change their oxidation state by an equalnumber of units, the reaction is known as complementary reaction. When theoxidant and the reductant change their oxidation state by a different numberof units, the electron transfer reaction is known as a non-complementaryreaction.
EXERCISES
1. State and explain the ‘law of photochemical equivalence’ and ‘quantum efficiency’.2. Describe the primary process in photochemical reactions with help of suitable
examples.3. Discuss the kinetics of H2 + Cl2 → 2HCl reaction and explain why quantum yield
of the reaction is exceptionally high?4. Describe the ‘Volterra model’ for oscillatory reaction.5. Give a brief account of Belousov-Zhabotinskii mechanism of oscillatory reaction.6. Derive the equations for the rate of reaction and chain length of a free radical
polymerization reaction.7. Derive the equation for the rate of polymerization in (a) Anionic polymerization
and (b) Cationic polymerization.8. What is meant by relative reactivity ratios in copolymerization process? How the
copolymerization depends on the relative reactivity ratios? Discuss.9. Describe in brief, the kinetics of solid state reactions.
10. How the kinetics of thermal decomposition of a solid can be studied experimentally?

6Kinetics of Catalyzed Reactions
6.1 CatalysisIn 1836, Berzelius observed that there are some substances, which increasethe rate of reaction without changing themselves. He thought that such asubstance loosens the bonds holding the atoms in reacting molecule andhence helps in increasing the rate of reaction. Such a process was calledcatalysis (Greek: Kata = wholly, lein = to loosen) and the substance calledcatalyst. A number of cases are now known in which a catalyst slows down(retards) the rate of reaction. In general, the catalyst may be defined as ‘asubstance, which alters the rate of reaction, remaining itself chemicallyunchanged at the end of the reaction’.
Catalysis
Homogeneous catalysis Heterogeneous catalysis
6.1.1 Positive CatalysisThe catalyst which increases the rate of a chemical reaction is called positivecatalyst and the phenomenon is known as positive catalysis. Examples are
(i) 2KClO 2KCl + 3O3[MnO ]
22⎯ →⎯
Catalysts and reactants in Catalyst and reactants insame phase different phases
2SO + O 2SO2(g)
2(g)
[NO] 3
(g)
g⎯ →⎯⎯ 2SO + O 2SO2(g)
2(g)
[Pt] 3
(g)
s⎯ →⎯
CH CHO CH + CO3(vapor)
[I ] 4
(g) (g)
2 vapor⎯ →⎯⎯ N + 3H NH2(g)
2(g)
[Fe] 3
(g)
s⎯ →⎯
(Haber Process)
Ester + H O Acid + Alcohol( )
2( )
[H ]
( ) ( )
+
l l l l
l⎯ →⎯ CH = CH CH – CH2 2(g)
[Ni] 3 3
(g)
s⎯ →⎯
2H O 2H O + O2 2( )
[Pt] 2
( )2
(g)
s
l l⎯ →⎯
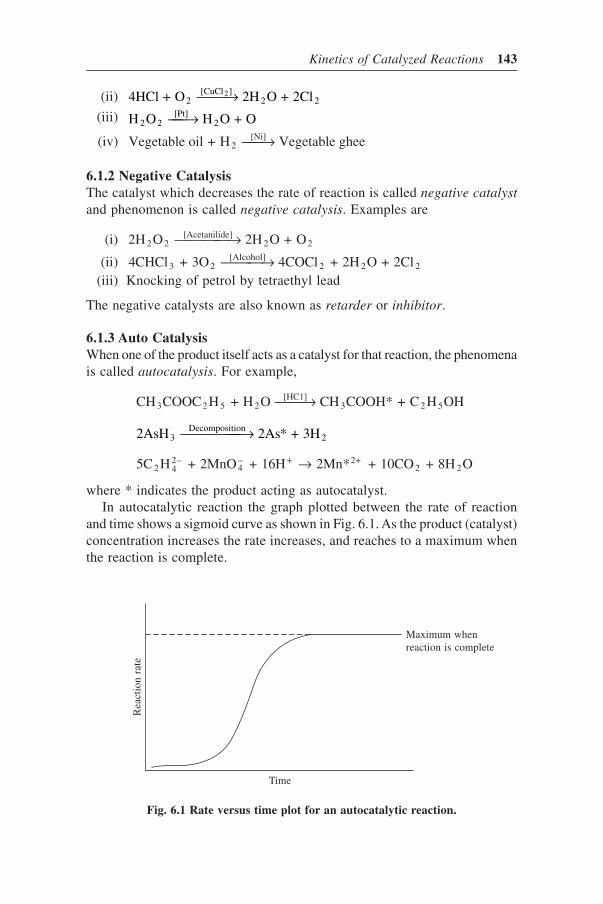
Kinetics of Catalyzed Reactions 143
(ii) 4HCl + O 2H O + 2Cl2[CuCl ]
2 22⎯ →⎯
(iii) H O H O + O2 2 [Pt]
2⎯ →⎯(iv) Vegetable oil + H Vegetable ghee2
[Ni]⎯ →⎯
6.1.2 Negative CatalysisThe catalyst which decreases the rate of reaction is called negative catalystand phenomenon is called negative catalysis. Examples are
(i) 2H O 2H O + O2 2 [Acetanilide]
2 2⎯ →⎯⎯⎯(ii) 4CHCl + 3O 4COCl + 2H O + 2Cl3 2
[Alcohol]2 2 2⎯ →⎯⎯
(iii) Knocking of petrol by tetraethyl lead
The negative catalysts are also known as retarder or inhibitor.
6.1.3 Auto CatalysisWhen one of the product itself acts as a catalyst for that reaction, the phenomenais called autocatalysis. For example,
CH COOC H + H O CH COOH* + C H OH3 2 5 2 [HC1]
3 2 5⎯ →⎯
2AsH 2As* + 3H3 Decomposition
2⎯ →⎯⎯⎯⎯
5C H + 2MnO + 16H 2Mn* + 10CO + 8H O2 42–
4– + 2+
2 2→
where * indicates the product acting as autocatalyst.In autocatalytic reaction the graph plotted between the rate of reaction
and time shows a sigmoid curve as shown in Fig. 6.1. As the product (catalyst)concentration increases the rate increases, and reaches to a maximum whenthe reaction is complete.
Time
Rea
ctio
n ra
te
Maximum whenreaction is complete
Fig. 6.1 Rate versus time plot for an autocatalytic reaction.

144 Chemical Kinetics and Reaction Dynamics
6.1.4 Induced CatalysisWhen a reaction influences the rate of some other reaction which does notoccur under ordinary conditions, the phenomenon is called induced catalysis.For example
1. Sodium arsenite does not oxidize in air while sodium sulphite oxidizes.When mixture of sodium arsenite and sodium sulphite is treated, both ofthem undergo simultaneous oxidation. Oxidation of sodium sulphite catalysesthe oxidation of sodium arsenite.
2. Reduction of mercuric chloride with oxalic acid is slow whereas reductionof KMnO4 by oxalic acid is fast. When mixture of mercuric chloride andoxalic acid is treated with KMnO4, both get reduced simultaneously. Reductionof KMnO4 induces the reduction of mercuric chloride.
6.1.5 PromotersSometimes the activity of a catalyst may be increased by addition of smallamount of a second substance. The second substance, which though itself isnot a catalyst, promotes the activity of a catalyst, is called the promoter.
For example, in reaction
N + 3H 2NH2 2 [Fe]
Mo or Al O3
2 3⎯ →⎯⎯⎯⎯
[Fe] is the catalyst and presence of Mo or Al2O3 increase the activity of ironand, therefore, acts as promoter. In reaction
CO + 2H CH OH2 [ZnO]
Cr O3
2 3⎯ →⎯⎯
Cr2O3 acts as promoter and increases the activity of catalyst ZnO.The phenomena of promotion is a common feature of heterogeneous
catalysis. Generally, the presence of promoter increases the peaks and crackson the surface of the catalyst and therefore is responsible for increasing therate of reaction by increasing the activity of the catalyst.
6.1.6 PoisonsSometimes the rate of a catalysed reaction is reduced by the presence of asmall amount of same substance (may be as impurities in the reactants).Such a substance, which destroys the activity of a catalyst, is called poisonand the process is called catalytic poisoning. For example, in reaction
2H + O 2H O2 2 [Pt]
CO2⎯ →⎯
activity of catalyst Pt is poisoned by presence of CO. In reaction
N + 3H 2NH2 2 [Fe]
H S3
2⎯ →⎯
presence of H2S reduces the activity of Fe.

Kinetics of Catalyzed Reactions 145
Poisoning of the catalyst by presence of a catalytic poison may be either dueto chemical reaction between catalyst and poison (e.g. Fe + H2S→Fe + H2)or poison may render surface of the catalyst unavailable for adsorption ofreactants.
6.2 Theories of CatalysisThe two main theories of catalysis are: (i) intermediate compound formationtheory and (ii) adsorption theory.
6.2.1 Intermediate Compound Formation TheoryAccording to this theory, the catalyst reacts with one of the reactants to givean intermediate, which reacts with another reactant to yield products and thecatalyst as follows:
A + [Catalyst] s (Intermediate)
Intermediate + B → Products + [Catalyst]
For example
(i) 2SO + O 2SO2 2 [NO]
3⎯ →⎯
proceeds as
2NO + O2 → 2NO2
NO2 + SO2 → SO3 + NO
(ii) C H + CH Cl C H CH + HCl6 6 3 [AlCl ]
6 5 33⎯ →⎯⎯
proceeds as
CH3Cl + AlCl3 → [CH3]+ [AlCl4]–
[CH ] [AlCl ] + C H C H CH + AlCl + HCl3+
4–
6 6 6 5 3 3→
6.2.2 Adsorption TheoryThe heterogeneous catalysis e.g. gaseous reaction on a solid surface, is explainedby this theory as follows:
A(g) + B(g) C(g) + D(g) Catalyst⎯ →⎯⎯
Generally, following four steps are involved in the heterogeneous catalysis:
(i) Diffusion of reactants at the surface of the catalyst.(ii) Adsorption of reactants at the surface.
(iii) Reaction of reactants at the surface.(iv) Desorption of products from the surface.
The reactants are adsorbed at the surface of the catalyst and held up at the
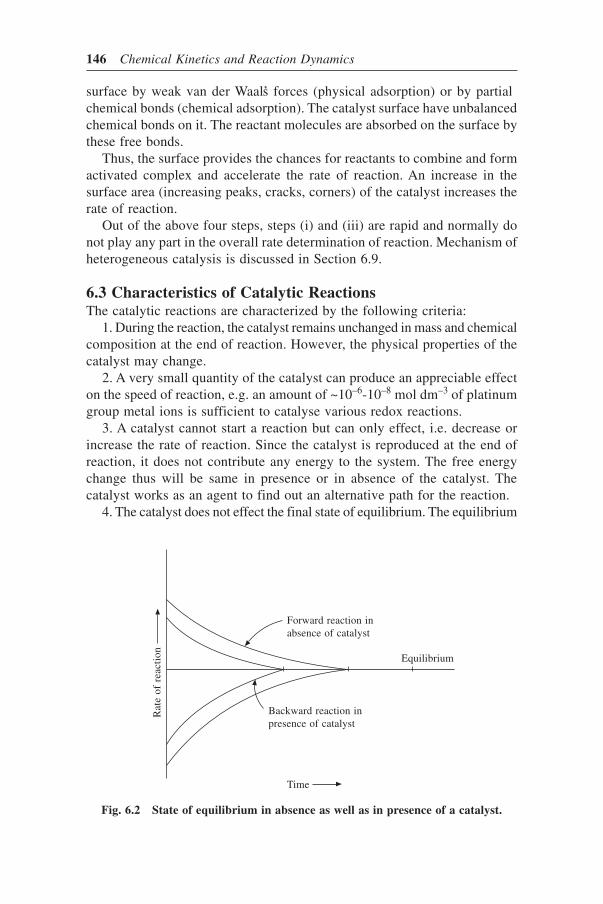
146 Chemical Kinetics and Reaction Dynamics
surface by weak van der Waal’s forces (physical adsorption) or by partialchemical bonds (chemical adsorption). The catalyst surface have unbalancedchemical bonds on it. The reactant molecules are absorbed on the surface bythese free bonds.
Thus, the surface provides the chances for reactants to combine and formactivated complex and accelerate the rate of reaction. An increase in thesurface area (increasing peaks, cracks, corners) of the catalyst increases therate of reaction.
Out of the above four steps, steps (i) and (iii) are rapid and normally donot play any part in the overall rate determination of reaction. Mechanism ofheterogeneous catalysis is discussed in Section 6.9.
6.3 Characteristics of Catalytic ReactionsThe catalytic reactions are characterized by the following criteria:
1. During the reaction, the catalyst remains unchanged in mass and chemicalcomposition at the end of reaction. However, the physical properties of thecatalyst may change.
2. A very small quantity of the catalyst can produce an appreciable effecton the speed of reaction, e.g. an amount of ~10–6-10–8 mol dm–3 of platinumgroup metal ions is sufficient to catalyse various redox reactions.
3. A catalyst cannot start a reaction but can only effect, i.e. decrease orincrease the rate of reaction. Since the catalyst is reproduced at the end ofreaction, it does not contribute any energy to the system. The free energychange thus will be same in presence or in absence of the catalyst. Thecatalyst works as an agent to find out an alternative path for the reaction.
4. The catalyst does not effect the final state of equilibrium. The equilibrium
Rat
e of
rea
ctio
n
Time
Equilibrium
Backward reaction inpresence of catalyst
Forward reaction inabsence of catalyst
Fig. 6.2 State of equilibrium in absence as well as in presence of a catalyst.

Kinetics of Catalyzed Reactions 147
constant K k k = / ,1 1′ the ratio of rate constant for forward and backwardreactions, remains same. The catalyst effects the rate constants for forwardand backward reactions in same proportion and equilibrium reaches earlierwithout effecting equilibrium constant.
6.4 Mechanism of CatalysisIn enhancing the rate of a reaction, the catalyst does combine with a reactantforming an intermediate complex, which subsequently breaks up to yield theproducts along with the catalyst itself. The reactant with which the catalystcombines is often mentioned as a substrate. A general mechanism, whichappears to apply to most of the catalytic reactions may be represented as follows:
S + C ` X + Y==1
1
′k
k
(a)
X + W P + C 2k⎯→⎯ (b)
where S and C represent the substrate and catalyst, respectively, X is theintermediate complex, Y some substance formed in addition to X and W isa molecule which reacts with the complex to give product P with eliminationof the catalyst.
In surface catalysis, where X is an adsorption complex and Y and W arenon-existent, the mechanism may be represented as follows:
S + C ` X==1
1
′k
k
(c)
X P + C 2k→ (d)
′k1 and k2 are the first order rate constants while k1 is a second order rateconstant.
The species Y is also probably non-existent in most of the enzyme catalysedreactions involving only one substrate. In acidic or basic reactions, Y and Wdo, however, play roles. In acid catalysed reactions, where C is an acid,transfer of proton to S takes place giving Y as a conjugate base of C. W is abasic or amphoteric substance which accepts a proton from X. In base catalysis,Y is a conjugate acid to the base C while W transfers a proton to X and maybe the solvent or another acidic substance. With regard to the stability of theintermediate complex X, the two possibilities, which may be considered,are:
(i) When rate of reconversion of complex into catalyst and the substrateis significantly greater than the rate with which it undergoes to give product(i.e. ′k k1 2 >> ), the concentration of the complex, i.e. [X] can be obtained byconsidering equilibrium (a) alone. And then rate can be calculated bymultiplying [X] by k2[W]. The complexes relevant to this type of catalysisare known as Arrhenius complexes.

148 Chemical Kinetics and Reaction Dynamics
(ii) When intermediate complex is much less stable species, i.e. rate of itsconversion to products is not small compared with the reverse rate of reaction(a), it is then not possible to calculate the concentration of X by making useof equilibrium (a) alone because the rate of reaction (b) cannot be neglected.
The concentration of complex in such a case must be calculated by makingthe use of steady-state-treatment. This type of complex is known as a Van’tHoff complex.
Let us take a simple homogeneously catalyzed reaction
S + C ` X==1
1
′k
k
(e)
X P + C 2k→ (f)
The rate of formation of product, i.e. rate of reaction may be given as
Rate of reaction = k2[X]
If intermediate complex is a Arrhenius complex i.e. ′k k1 2 >> , the concentrationof X can be determined from equilibrium (1), and we get
[X] = K[S][C]
where (equilibrium constant) K = k k1 1/ ′ and, therefore,
Rate of reaction = k2K[S][C] (6.1)
However, if complex is of Van’t Hoff type complex, [X] is determined bysteady state treatment. On applying steady state conditions with respect to X,we get
k k k1 1 2 [S][C] = [X] + [X]′
or [X] = [S][C] +
1
1 2
kk k′
and, therefore,
Rate of reaction = [S][C]
+ 1 2
1 2
k kk k′ (6.2)
However, when ′k k1 2 >> , the rate law becomes same as in case of Arrheniuscomplex. Thus, the steady state treatment is the general one, and reduces tothe equilibrium treatment (Arrhenius complex) when ′k k1 2 >> .
The above rate laws clearly show that the rate is dependent on the catalystconcentration. For a given concentration of the catalyst, we may write
Rate of reaction = k″[S] (6.3)
where ′′ ′ ′kk kk k
k K k k = [C]
+ or [C] (when >> ).1 2
1 22 1 2
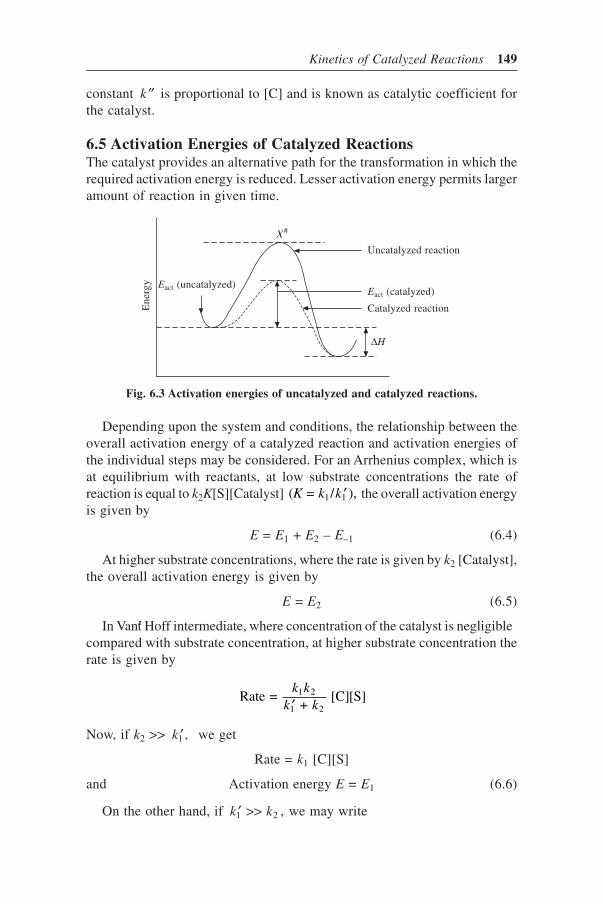
Kinetics of Catalyzed Reactions 149
constant ′′k is proportional to [C] and is known as catalytic coefficient forthe catalyst.
6.5 Activation Energies of Catalyzed ReactionsThe catalyst provides an alternative path for the transformation in which therequired activation energy is reduced. Lesser activation energy permits largeramount of reaction in given time.
Depending upon the system and conditions, the relationship between theoverall activation energy of a catalyzed reaction and activation energies ofthe individual steps may be considered. For an Arrhenius complex, which isat equilibrium with reactants, at low substrate concentrations the rate ofreaction is equal to k2K[S][Catalyst] ( = / ),1 1K k k ′ the overall activation energyis given by
E = E1 + E2 – E–1 (6.4)
At higher substrate concentrations, where the rate is given by k2 [Catalyst],the overall activation energy is given by
E = E2 (6.5)
In Van’t Hoff intermediate, where concentration of the catalyst is negligiblecompared with substrate concentration, at higher substrate concentration therate is given by
Rate = +
[C][S]1 2
1 2
k kk k′
Now, if k2 >> ′k1 , we get
Rate = k1 [C][S]
and Activation energy E = E1 (6.6)
On the other hand, if ′k k1 2 >> , we may write
Ene
rgy
X#
∆H
Uncatalyzed reaction
Eact (catalyzed)
Catalyzed reaction
Fig. 6.3 Activation energies of uncatalyzed and catalyzed reactions.
Eact (uncatalyzed)

150 Chemical Kinetics and Reaction Dynamics
Rate = [C][S]1 2
1
k kk ′
therefore, overall energy is given by
E = E1 + E2 – E–1 (6.7)
This, in fact, is the case of Arrhenius complex. These energies are representedin Fig. 6.4.
(a) Arrhenius complex ( >> )1 2′k k (b) Van’t Hoff complex ( >> )2 1k k ′
Rate controlling step is second barrier Rate controlling step is first barrier
E1
E2
E–1
C + S C + P C + S
C + P
E1E–1
E2
X#X#
Fig. 6.4 Energy diagram for catalyzed reaction.
6.6 Acid Base CatalysisThere are certain reactions, e.g. inversions of sucrose and methane etc. inwhich the rate of reactions were found to be proportional to the concentrationof H+ ions. Similarly, there are reactions which are catalyzed by OH– ions,e.g. conversion of acetone into diacetone alcohol or decomposition of nitroso-triacetoneamine. These are known as specific hydrogen ion catalyzed orspecific hydroxyl-ion catalyzed reactions. Also there are some reactions inwhich both H+ and OH– ions act as catalysts probably along with water. Theundissociated acid or base have negligible effect on the rate of reaction. Thehydrolysis of ester is an example in which both H+ and OH– ions act as catalyst
CH —C||O
—O—R + H CH —C||O
—O|R
+—H CH COOH + ROH + H3
+3
H O 3
+2→ ⎯ →⎯
and
CH —C||O
—O|R
+ OH CH — C|OH
|O
—O—R CH COOH + ROH + OH3–
3
–
H2O3
–→ ⎯ →⎯
Intermediate

Kinetics of Catalyzed Reactions 151
If catalysis is effected simultaneously by H+ and OH– ions and reactionalso occurs in absence of these ions, the rate of reaction may be written as,
Rate = [S] + [H ][S] + [OH ][S]H O H+
OH–
2 + –k k k (6.8)
where S is the substrate, kH+ and k
OH – are known as catalytic constants for
H+ and OH– ions, respectively and kH O2 is the rate constant in absence of the
catalyst.The first order rate constant is, therefore, given by
k k k k = + [H ] + [OH ]H O H+
OH–
2 + – (6.9)
Equation (6.9) can also be written in a more convenient form as
k k kk K
= + [H ] + [H ]H O H
+ OH w
+2 +
–
(6.10)
or k kk K
k = + [OH ]
+ [OH ]H OH w
– OH–
2
+
– (6.11)
In most of the cases, one of these terms containing concentration is smallcompared with other terms and can be neglected.
For example, if reaction is carried out in 0.1N HCl, the term, kH
++ [H ]
would be kH
–1+ 10× while term k K
OH W+
– /[H ]× would be kOH
–13– 10×
which is negligible compared to kH
–1+ 10× and, therefore, rate constant
may be given as
k k k = + [H ]H O H+
2 +
or, log = log + log + log[H ]H O H+
2 +k k k
or log = log + log – pHH O H2 +k k k (6.12)
Similarly, in 0.1N NaOH solution, the rate constant may be represented as
k kk K
= + [H ]H OOH w
+2
or log = log + log( ) – pHH O OH w2 –k k k K× (6.13)
Various possibilities that may arise in the reactions have been classified bySkrabal who plotted log k against the pH of the solution as shown in Fig. 6.5.Curve (a) represents a most general type of behavior for catalysis by H+ andOH– ions. The velocity in the intermediate region is equal to kH O2 [S] so thatkH O2 can also be determined directly from the rate in this region. A curve ofthe type a is given by the mutarotation of glucose, if kH O2 is sufficiently

152 Chemical Kinetics and Reaction Dynamics
small, the horizontal part of the curve is not found. Two limbs of the curveintersects sharply (curve (b)) in case of hydrolysis of carboxylic esters.
If either kH+ or k
OH – is negligibly small, the corresponding sloping limbof the curve is found to be missing. If k
H+ is small, we obtain curve (c) andif k
OH – is small, then we get curve (d). When uncatalyzed reaction, i.e.reaction in absence of catalyst is very slow and rate of reaction is negligiblein absence of the catalyst, these curves will be simple straight lines witheither a positive slope (curve (c) when kH O2 is small and k
H+ is negligible)or with a negative slope (curve (d) when kH O2 is small and k
OH – is alsosmall and negligible).
6.7 Enzyme CatalysisMany chemical changes occurring in living processes are catalyzed by enzymeswhich are complex protein substances produced by living cells. Enzymes areoften present in colloidal state and are very specific in their catalytic action.Zymase obtained from yeast catalyses the fermentation of dextrose but isineffective in breakdown of cane sugar.
The mechanism of an enzymatic process may be represented as follows:
Substrate (S) + Enzyme (E) ` ES==1
1
(Complex)′k
k
(i)
(ES) + Products (P)2k E→ (ii)
In the study of enzyme catalyzed reactions, the molar concentration ofsubstrate is usually much greater than that of enzyme and, therefore, verylittle of substrate is bound to the enzyme. The total concentration of enzyme[E]T should be considered as the sum of the concentration of the enzyme andconcentration of complex (ES), i.e.
[E]T = [E] + [ES]
log
k
pH
General case
OH
– ion
cata
lyze
d
(d)
(c′)(d′)
(c)
H + ion catalyzed
(a)(c′)(c)
(b)(b)(d)
(d′)(a)
Fig. 6.5 Skrabal diagram: variation of rate constant with pH for acid basecatalyzed reaction.

Kinetics of Catalyzed Reactions 153
Applying the steady-state treatment with respect to complex, we get
k k k1 1 2[E][S] – [ES] – [ES]= 0′
or [ES] = [E][S] +
1
1 2
kk k′ (6.14)
Again, [ES] can be determined in terms of [E]T as
[E] = [E][E][S] + T
1
1 2
kk k′
or [E] = { + }[E]
+ + [S]1 2 T
1 2 1
′′k k
k k k(6.15)
Hence, [ES] may be given as
[ES] = [S][E]
+ + [S]1 T
1 2 1
kk k k′ (6.16)
Now, we can give
Rate of reaction = [P]
= [ES]2ddt
k (6.17)
Substituting the value of [ES], we get
Rate of reaction = [E] [S]
+ + [S] =
[E] [S] +
+ [S] =
[E] [S] + [S]
1 2 T
1 2 1
2 T
1 2
1
2 T
m
k kk k k
kk k
k
kk′ ′ (6.18)
where k k k km 1 2 1 = ( + )/′ is known as Michaelis Menten constant.When [S] is sufficiently small, the rate law reduces to
Rate of reaction = [E] S2
mT
kk
[ ] (6.19)
and the reaction will show first order dependence with respect to substrateand a plot of rate versus [substrate] will be linear at lower substrateconcentrations. At higher substrate concentrations, where [S] >> km, the ratelaw becomes
Rate of reaction = k2 [E]T (6.20)
and the reaction will be zero order with respect to the substrate and the plotof rate versus [substrate] will be horizontal to concentration axis as shown inFig. 6.6. When [S] is quite high and km + [S] = [S], the rate will also bemaximum, i.e. (Rate)max = k2[E]T. Again at this stage, the rate law may bewritten as

154 Chemical Kinetics and Reaction Dynamics
Rate of reaction = (Rate) [S]
+ [S]max
mk(6.21)
Similarly, when km = [S]
Rate of reaction = 12
(Rate)max (6.22)
Therefore, km (in mol dm–3) is equal to the concentration of the substrateat which the initial rate is half of its maximum value. The value of km for anenzyme depends on the particular substrate and also on experimental conditionslike pH, temperature, solvent, ionic strength etc. km gives an idea of strengthof binding and saturation of enzyme and substrate.
The applicability of equation to experimental data may be tested as follows.Equation (6.18) may be written in its reciprocal form as
1Rate
= + [S]
[S][E] =
[S][E] + 1
[E]m
2 T
m
2 T 2 T
kk
kk k
(6.23)
Thus, a plot of 1/Rate versus 1/[S] would give a straight line with an intercept(1/k2[E]T) and a slope (km/k2[E]T). Therefore, the values of k2 and km can bedetermined from the intercept and slope of the plot.
6.7.1 Influence of pHWhen the pH is varied, the rates of enzyme catalyzed reaction shows amaximum value at certain pH called the optimum pH as shown in Fig. 6.7.
The influence of pH can be explained on the basis that the active centerof the enzyme exists in three states of ionization as
EH EH E2 b aK K⎯ →⎯ ⎯ →⎯
Rat
e
[Substrate]
Limiting value of rate
Rate = k2[E]T
km = [S]
(Rate)max/2
Rate = [E] [S]2
mT
k
k
Fig. 6.6 Plot of rate versus [substrate] for enzyme catalyzed reaction.

Kinetics of Catalyzed Reactions 155
EH2 bears one more positive charge (or one less negative charge) than EHand EH has one more positive charge than E. For simplicity, charges havenot been shown. Ka or Kb are the dissociation constants. Each of these threeforms of enzyme can interact with the substrate to give the complex. Thefollowing mechanism may be proposed for reaction:
EH == EH == E
EH||
S == EHS
EH + P
|| == ES
||2
2
b a
b
2
1 1 a
K K
K
k
k k K′ ′ ′
↓
It is assumed that it is the only (EHS) form of the complex which givesrise to products. In acidic solution, the equilibrium will lie over to left, EH2Sform of complex will dominate and rate of reaction will be low because EHSform is the reactive form.
In highly basic solution the ES form will be dominating and again the ratewill be low. At some intermediate pH, when EHS is dominating, the rate willbe maximum. Application of steady state treatment to this scheme of mechanismleads to a very complicated rate law and it is difficult to apply it to theexperimental data.
A considerable simple form of rate equation has also been obtained assumingEH2+S = EH2S and E+S = ES equilibria to be unimportant and consideringthe following scheme:
EH == EH == E
EH S == EHS
EH + P
|| == ES
2
2
1
b a
b 1 a
K K
K k k K′ ′ ′
pH
Optimum pH
Rat
e
Fig. 6.7 Variation of rate of enzyme catalyzed reaction with pH.
k2

156 Chemical Kinetics and Reaction Dynamics
The application of steady state treatment to this scheme, gives the followingrate equation:
Rate = [E] [S]
1 + [H ]
+ [H ]
1 + H ]
+ [H ]
[S]
2 T
a+
+
bm
a+
+
b
k
KK
kK⎛
⎝⎜⎞⎠⎟
′′
⎛⎝⎜
⎞⎠⎟[ Κ
(6.24)
By measuring the rates over a range of [S] and pH, the values of k2, km,Ka, ′Ka, Kb and ′Kb can be obtained.
6.8 Heterogeneous CatalysisIn heterogeneous catalyzed reaction, the surface of a solid serves as a catalystwhile the reactants are in gaseous or liquid phase. One or more reactants getadsorbed on the surface of the solid. This phenomenon is similar to theformation of intermediate complex in homogeneous catalysis. In many cases,heat of adsorption leads to the activation of reactants and the reaction takesplace easily. The surface thus provides an alternative path for the reaction toproceed with an accelerated rate. The reaction consists of the following fourconsecutive steps.
(i) Diffusion of reactants to the surface.(ii) Adsorption of reactants on the surface.
(iii) Chemical transformation, i.e. reaction on the surface.(iv) Desorption and diffusion of the products from the surface.
Steps (i) and (iv) are generally very fast and do not play any part indetermination of rate of the reaction. The adsorption and desorption equilibriaare easily attained. The concentration of reactant molecules on the surface isan important factor because the molecules which are adsorbed on the surfacewill undergo the chemical transformation. The concentration of the adsorbedmolecules on the surface at any moment is proportional to the fraction of thesurface (say θ) covered. Therefore, the rate of reaction will also then beproportional to the covered portion of the surface, i.e.
Rate of reaction ∝ θ = βθ (6.25)
where β is the proportionality constant.In Langmuir adsorption isotherm, the fraction of the surface θ covered by
adsorption has been related to the pressure P of the gas by relation
θ αα =
1 + P
P(6.26)
where α is a constant.Therefore, we can write
Rate of reaction = 1 + α β
αPP (6.27)

Kinetics of Catalyzed Reactions 157
Let us now consider the reaction rates for some simple heterogeneouscatalyzed reactions.
Case I. Dissociation of a single reactant on surfaceWhen there is a single reactant, it is first adsorbed on the surface, activatedand subsequently dissociates into products.
A + Surface → Surface → Surface + Products
Rate of reaction = = 1 +
βθ αβαP
P(6.28)
When adsorption is low either due to very low pressure or due to low adsorptioncapacity of the surface and αP is negligible compared to unity, then
Rate of reaction = αβP (6.29)
i.e. rate of reaction is proportional to pressure and reaction will behave asfirst order.
However, when pressure is very high or adsorption capacity of surface isquite high, i.e. αP >> 1,
Rate of reaction = β = constant (6.30)
i.e. reaction rate is independent of pressure. At moderate pressure, when theadsorption is neither high nor low, the rate of reaction will be given byequation (6.28), which may be approximated to
Rate of reaction = k P n (6.31)
where n lies between 0 and 1, i.e. the order of reaction will be a fractional.These conditions are represented in Fig. 6.8.
Case II. When two reactants undergo change on the surface
Mod
erate pressure
At low
pre
ssur
e
Pressure
Rat
e
Fig. 6.8 Rate-pressure relationship for dissociation ofsingle reactant on solid surface.
At high pressure
158 Chemical Kinetics and Reaction Dynamics
Let us consider a reaction in which two molecules A and B react on thesurface adsorbed as
A + B + Surface → Surface → Surface + Products
Let θ1 and θ2 be the fractions of surface covered by adsorption of A and B,respectively. Assuming that total area of surface for adsorption is 1 sq. cm,the surface portion remaining unaffected is = (1 – θ1 – θ2).
Since the rate of adsorption and desorption should be equal, we get
k p k1 1 2 1 1 1(1 – – ) = for Aθ θ θ′ (a)
k p k2 1 2 2 2 2(1 – – ) = for Bθ θ θ′ (b)
where p1 and p2 are partial pressures of A and B, respectively, k1, k2 ′ ′k k1 2 and are proportionality constants. Dividing equation (b) by (a), we get
θ θ22 1 2
1 2 11 =
k k pk k p
′′ (c)
Substituting equation (c) in (a), we get
θ11 1
1 1 12 1
22
= + +
k p
k k pk kk
p′ ′′
(d)
Substituting equation (c) in (b), we get
θ22 2
2 2 21 2
11
= + +
k p
k k pk kk
p′ ′′
(e)
The rate of reaction will be
Rate of reaction = Zθ1θ2 (6.32)
where Z is a constant.The rate of reaction can be considered in different conditions as follows:(i) When each gas is adsorbed very low, i.e. θ1 and θ2 are quite small, we
get
θ θ11 1
12
2 2
2 = and =
k pk
k pk′ ′
Thus
Rate of reaction = 1 1 2 2
1 2
Zk p k pk k′ ′ (6.33)
Rate ∝ p1p2 suggests that rate will be of second order.

Kinetics of Catalyzed Reactions 159
(ii) When one reactant (say A) is relatively more strongly adsorbed than theother (say B). In this case, θ1 is much larger than θ2. The term k2 p2
is small and negligible and hence θ1 and θ2 would be given as
θ θ11 1
1 1 12
2 2
21 2
11
1 2 2
2 1 1 1 =
+ and =
+ =
( + )k p
k k pk p
kk kk
p
k k pk k k p′ ′ ′
′
′′ ′
Hence,
Rate of reaction = = ( + )
= (1 + )1 2
1 1 2 1 2
2 1 1 12
1 2
12Z
Zk k k p p
k k k pkp p
bpθ θ ′
′ ′(6.34)
where bkk
= 1
1′. Such a complicated kinetics is being followed by
reaction between CO2 and H2 on platinum.(iii) When one reactant is very strongly adsorbed, we have,
θ θ22 1 2
1 2 11 =
k k pk k p
′′ (from equation (c))
Rate of reaction = Zθ1θ2.If A is adsorbed strongly, θ1 will be almost unity and, therefore
Rate of reaction = = = ( = 1)22 1 2
1 2 11
2 1
1 2
2
11Z
k k pk k p
Zk kk k
pp
θ θ θ′′ ′
′′
= 2
1k
pp
(6.35)
Hence, the rate would be reduced at higher pressure p1. The reaction of COand O2 on platinum follows such a kinetics.
It is important to note that adsorption does not necessarily lead to acatalytic reaction but the surface catalyzed reactions always occur throughadsorption. In their catalytic action, the surfaces are specific in nature. Niand Cu surfaces are very good catalysts for hydrogenation processes. Thephysical nature of a surface also influences its catalytic efficiency. Thoseatoms, which are at the peaks, edges etc. have high residual fields and arelikely to have greater adsorption capacity. Taylor (1925) postulated that theadsorption and subsequent reaction takes place preferentially on certain partsof the surface, which are called active centers. The active center may constitutea small portion only of the total surface. Moreover, all active centers whereadsorption occurs are not always catalytically effective.
6.9 Micellar CatalysisThe kinetics of organic reactions occurring at miceller surfaces formed fromrelatively simple surfactants have focused the attention of chemists becausethe reaction kinetics at micellar surfaces is an “interface” between physical

160 Chemical Kinetics and Reaction Dynamics
and organic chemistry on one hand, and biochemistry and physiology on theother.
There are a number of structurally distinct classes of amphipathic molecules,which have various kinds of structures. The simplest amphipathic moleculeshave a straight chain of carbon atoms, usually 8-18 in number, to which isattached a polar group that may be anionic, cationic, zwitterionic or nonionic.For example
CH (CH ) —OSO3 2 3–
n AnionicCH3(CH2)n—N+ (CH3)3 Cationic
CH (CH ) —N (CH ) —CH CH CH —OSO3 2+
3 2 2 2 2 3–
n Zwitter-ionicCH3(CH2)n O—(CH2CH2O)m—H Nonionic
A wide structural variation is possible within each class of moleculesbecause both the length of the hydrophobic portion and the nature of thehydrophilic head group, as well as its position along the backbone, may bevaried. The properties of the aggregates formed from these surfactants andthe conditions under which they are formed depends on all these parameters.As the concentration of the surfactant in an aqueous solution is increased,many of the chemical and physical properties of the solution change ratherabruptly (but continuously) over a concentration range known as the criticalmicelle concentration (CMC).
CMC is a characteristic narrow range of concentration at which micellesfirst become detectable. The value of CMC is dependent upon a large numberof parameters like the total chain length, number of carbon-carbon doublebonds, chain branching, various types of additives (polar, non-polar andelectrolytes), temperature and pressure. An increase in hydrocarbon chainlength and addition of strong electrolyte to ionic surfactant tends to decreasethe CMC, while addition of C=C bonds and chain branching tends to increaseCMC. A large number of experimental techniques have been utilized todetermine the CMC value of the surfactants.
Over the narrow concentration range centering about the CMC, individualsurfactant molecules form aggregates, usually containing 20-100 individualmolecules. These aggregates are usually spherical, organized spherically sothat the hydrophobic chains are hidden within the structure and thus isolatedfrom the aqueous environment. The hydrophilic head groups are exposed onthe micellar surface (Fig. 6.9).
The core of the micelle is composed of the hydrophobic chains of thesurfactant molecules. Surrounding the core is the stern layer, or palisadelayer, which is occupied by the regularly spaced charged head groups of themicelle together with a certain number of counter ions. The remainder counterions are less tightly associated with the micelle and form a Gouy-Chapmanlayer, several hundred angstroms in thickness (Fig. 6.10).
The rate of various reactions is found to be influenced by the micelles

Kinetics of Catalyzed Reactions 161
formed from the surfactants. Fendler and Fendler (1975) have provided acomprehensive review of effort in this field. The micelle forming surfactantscan be grouped into two classes. The first includes those cases in which thesurfactant provides a medium for the reaction but does not participate directlyin it. The second class includes those reactions in which the surfactant doesparticipate directly in the reaction, either as a substrate or as a catalyst. In theformer case, the surfactant is itself the substrate and is consumed in thecourse of the reaction; in the later case, the surfactant is transiently modifiedthrough interaction with substrate but is subsequently regenerated.
There are a number of bimolecular reactions for which the rate-surfactantprofiles have been interpreted in terms of the distribution of surfactantsbetween the aqueous and micellar pseudophase.
6.9.1 Models for Micellar CatalysisFrom time to time various models have been developed to explain the micellareffect on the rate of reaction. Each model has its own strength and weakness.
at CMC and above
Hydrophilic groupHydrophobic hydrocarbon tail
Fig. 6.9
Fig. 6.10 Spherical cross-section of an idealized anionic: (a) normal micelleand (b) reverse micelle; (●) polar head group; (�) counter ion;(q ) the hydrocarbon chain.
Water pool
(b)(a)
Organicbulkphase
Aqueousbulkphase
CoreStern layerGouyChapmandoublelayer

162 Chemical Kinetics and Reaction Dynamics
The extent of solubilization of the substrate to the micelle can be related withthe association constant or the binding constant. Some of the importantmodels developed to explain the micellar effect are described briefly asfollows:
(a) Menger and Portnoy’s ModelIn Menger and Portnoy’s model, the variation of the rate constant withsurfactant concentration has been treated on the basis of assumption thatsubstrate ‘S’ is distributed between aqueous and micellar pseudo-phase givenas follows:
Products
kmkw
Ks SDnS + Dn
This model leads to the following relationship for micellar catalysis:
1( – )
= 1( – )
+ 1( – ){[D] – CMC}w m w s m wk k k k K k kψ
(6.36)
where kw and km are rate constants in aqueous phase and micellar medium,respectively, kψ is observed rate constant and Ks the binding constant ofsubstrate with surfactant.
The linearity of the plot between 1/(kψ – kw) and 1/{[D] – CMC} suggeststhe applicability of the model.
(b) Sepulveda ModelThe binding constants for the association of the solute with the micelle canbe evaluated with the help of model developed by Sepulveda and coworkers.According to the model, solute binds to micelles with following equilibrium:
S + D Sa m m
s[K
for which equilibrium constant called binding constant is given as
Ksm
a m =
[S ][S ][D ] (6.37)
where [Sa] and [Sm] are the substrate concentration expressed as molaritiesin terms of solution in the aqueous and micellar pseudophase, respectively,and [Dm] is the total concentration of surfactant in micellar form, i.e. totalconcentration minus CMC.
The total substrate concentration [St] and the total detergent concentration[Dt] would be {[Sa]+[Sm]} and {[Sm]+[Dm]+[CMC]}, respectively. The fractionof the substrate bounded to the micelle can be defined as

Kinetics of Catalyzed Reactions 163
f = [S ][S ]
m
t(6.38)
with the help of equations (6.37) and (6.38) and the total concentration ofsolutes, we get
ff
K f K1 –
= ([D ] – [S ] ) – [CMC]s t t s (6.39)
In general, [St] << [Dt] and, therefore, equation (6.39) reduces to
ff
K K1 –
= [D ] – [CMC]s t s (3.40)
On plotting f
f1 – versus [Dt], a straight line is obtained with a slope equal
to Ks (binding constant) and an intercept equal to Ks[CMC]. Experimentally,f can be determined from the equation
fI I
I I =
––
w
m w(6.41)
where I, Iw and Im are the absorbance in surfactant, water and when the
solute is bonded to the micelle completely. Linearity of the plot f
f1 –versus [Dt] suggests the applicability of the model.
(c) Berezin ModelAccording to Berezin and coworkers, the observed rate constant kψ for thereaction under investigation may be made of two parts, i.e. kw and km, whichare due to partition of reactants in the aqueous phase and micellar pseudo-phase, respectively, as follows:
KRKS
kw Product(S)w + (R)w
km Product(S)M + (R)M
The apparent rate constant is given by the equation
kk k K K C
K K Cψ = +
(1 + C)(1 + )w m S R
S R(6.42)
where KS and KR are the binding constants for the substrate and the reactant,respectively and C the concentration of surfactant.
Assuming kw << km·KR, KsC, kw can be neglected compared to the secondterm in the numerator of the equation and on rearranging, we get

164 Chemical Kinetics and Reaction Dynamics
1 = 1 + ( + )
+ m S R
S R
m S R mk k K K CK Kk K K
Ckψ
(6.43)
According to this equation, the plot of 1/kψ as function of C would show aminimum and the plot beyond Cmin would be linear with a positive slope andpositive intercept. However, at the optimum surfactant concentrationcorresponding to the maximum in the plot of kψ against [Surfactant], thefollowing relationship is obtained.
Copt = (KSKR)–1/2 (6.44)
The linearity of the plot of (1/kψ) against ([C]-CMC) showed the validity ofthe model. With the help of slope and intercept of the plot, the values of KR,KS and km can be computed.
(d) Piszkiewicz Co-operativity ModelA model analogous to the Hill model (for enzymatic reactions), which describesa more accurate dependence of the observed rate constants on surfactantconcentration, was developed by Piszkiewicz. This model is applicableespecially at low surfactant concentration and the data may be treated withoutreference to CMC. According to this model, a substrate (S) and n number ofdetergent molecules (D), aggregate to form critical micelle (DnS), whichmay react to yield the product
nK
nD + S D S==D
Dnk
S Product m⎯→⎯
S Productwk→
where KD is the dissociation constant of micelle back to its free componentand km the rate constant of reaction within the micelle.
According to the model, the observed rate constant has been expressed asa function of concentration of detergent as
kk k K
K
n
nψ = [D] +
+ [D]m w D
D(6.45)
where kψ is the observed rate constant and [D] the concentration of detergent.Equation (6.45) may be rearranged in the form
log––
= log [D] – logw
mD
k kk k
n Kψ
ψ
⎧⎨⎩
⎫⎬⎭
(6.46)
According to equation (6.46), a plot of log {(kψ – kw)/(km – kψ)} versus log[D] should be linear. The slope of the plot gives the value of n, which is also

Kinetics of Catalyzed Reactions 165
known as co-operativity index. At log {(kψ – kw)/(km – kψ)} = 0, the value ofn log [D] becomes equal to log KD. Also at log{(kψ – kw)/(km – kψ)} = 0,catalysis by detergent shows one half of its maximum effect on rate constant.The value of log [D] at this point is known as log [D]50. With the help of theabove linear plot we can calculate the values of co-operativity index n.
(e) Raghvan and Srinivasan’s ModelRaghvan and Srinivasan developed a model, for bimolecular micellar catalysedreactions, which also predict constancy in kobs values at high detergentconcentration and may be used for evaluating the binding constants of reactants.They proposed the distribution of both reactant and nucleophile in aqueousand micellar phases. The product formation is assumed to result fromdecomposition of ternary complex involving substrate, nucleophile and micelle.After analyzing the data on the basis of this model, they concluded thatalmost all the nucleophile is present in the bulk phase.
nk
nD + S D S1
[
D S + N D S N2
n
k
n[
D SN productsm
n
k
[
S + N productsw
[k
where D, S and N are the detergent monomer, substrate and the nucleophile,respectively, while DnS and DnSN are the binary and ternary complexes,respectively. According to this model the observed rate constant in presenceof surfactant is given as
kk k K K
K K
n
nψ = + [D]
1 + [D] {1 + [S] }w m 1 2
1 2 T(6.47)
Equation (6.47) may be rearranged in the form
k kk
K Kkk
K Kn
ψ
ψ ψ
– 1[D]
= ( ) – {1 + [S] }w
1 2m
1 2 T⎛⎝⎜
⎞⎠⎟
⎛⎝⎜
⎞⎠⎟ (6.48)
Equation (6.48) predicts a linear relationship between {(kψ – kw)/kψ) (1/[D]n)}and (km/kψ). The values of K1 and K2 (binding constants) can be evaluated withthe help of intercept and slope of the linear plot of {(kψ – kw)/kψ) (1/[D]n)}versus (km/kψ).
6.10 Phase Transfer CatalysisThe reactions between two substances which exist in two mutually insoluble

166 Chemical Kinetics and Reaction Dynamics
phase are normally too slow to be of much practical importance. This ismainly because of the intrinsically low mutual solubility of the reactants inthe opposite phases. A very effective and economical way of enhancing therate of such reactions is to add a small catalytic quantity of another substancewhich can transport the reactant across the phase boundary in a form that hasgreater solubility in the target phase. This process is known as phase transfercatalysis. The phase transfer catalysis is similar to micellar catalysis.
The phase transfer catalysis not only promotes the reactions between thereagents which are mutually insoluble in immiscible phases, but also offersa number of process advantages such as, increase in rate of reactions, increasein product specificity, lowering of energy requirement, use of inexpensivesolvents and catalysts, extraction of cations or even neutral molecules fromone phase to another etc.
Onium salts, crown ethers, alkali metal salts or similar chelated salts,quaternary ammonium and phosphonium are some of the salts which havebeen widely used as phase transfer catalysts (PTC). The choice of phase transfercatalysts depends on a number of process factors, such as reaction system,solvent, temperature, removal and recovery of catalyst, base strength etc.
6.10.1 General MechanismIn general, there are two immiscible phases in reaction mixture, viz. anaqueous phase which contains a salt (a base or nucleophile) and the other anorganic phase containing the substrate which is expected to react with thesalt. When a phase transfer catalyst (usually contains a lipophilic cation) isadded to the reaction mixture, the lipophilic cation (which has solubility inboth aqueous and organic phases), exchanges anions with the excess ofanions in the salt solution.
Q X + M Nu Q Nu M X+(aq)–
(quaternary salt, PTC)
+(aq)– +
(aq)– +
(aq) + [
Then a phase transfer equilibrium exists as
Q Nu Q Nu+(aq)– +
(org)–[
Once nucleophile or base comes in nonpolar (organic) media, thedisplacement or deprotonation can take place with the product formation.The overall mechanism can be represented as follows:
Organic phase Q+ Nu– (org) + R – X → R – Nu + Q+ (org) X
Interface
Aqueous phase Q+ Nu– (aq) + M+ X M+ Nu– + Q+ (aq) X–
Stark’s phase transfer catalytic cycle
In principle, a suitable PTC could transfer ions, free radicals and molecules

Kinetics of Catalyzed Reactions 167
from aqueous to organic phase. The anion transfer systems have beenextensively investigated.
The rate of phase transfer catalyzed reaction depends on the following:
(a) Nature and rate of reaction in organic phase.(b) Nature and solubility of phase transfer catalyst.(c) Process of transfer of anion from aqueous to organic phase.
When [X–] and [Nu–] are constant in the aqueous phase by keeping theaqueous phase saturated with M+X– and M+Nu–, the Q+Nu– and Q+X– inorganic phase will be in constant proportion.
Let
[Q+Nu–]org/[Q+X–]org = θ (6.49)
Again the total concentration of the catalyst in organic phase is
[Q]Total = [Q+X–]org + [Q+Nu–]org
or [Q] /[Q X ] = 1 + [Q Nu ]
[Q X ]Total+ –
org
+ –org
+ –org
= 1 + θ (6.50)
With the help of equations (6.49) and (6.50), we obtain
[Q u ] = [Q]
1 + + –
orgTotalΝ θ
θ (6.51)
Now the rate of reaction in the organic phase is given by
–[RX]
= [RX][Q u ]+ –org
ddt
k Ν =[RX][Q]
1 + Totalk
θθ (6.52)
where k is second order rate constant. The value of pseudo-first order rateconstant may be obtained by integrating above equation as follows:
ln[RX][RX]
= [Q]
1 + = –t
o
Total1
kt k t
⋅θθ (6.53)
Thus the value of pseudo-first order rate constant is k [Q]Total θ/(1 + θ).The value of θ may be independently determined by analyzing organic phasefor X– and Nu– ions.
From the values of θ, first order rate constant k1 and (Q)Total, we can alsoevaluate k.
6.10.2 Difference between Micellar and PhaseTransfer-Catalyzed Reactions
The phase transfer catalysts are generally not surfactants. But the surfactants(small as well as large) are good phase transfer catalysts. The good phasetransfer catalysts are partitioned into the organic phase of a two phase mixture
168 Chemical Kinetics and Reaction Dynamics
and form emulsions or micelle dispersions in the aqueous phase. The rate ofphase transfer catalysed reactions are directly proportional to [Catalyst] whilein micellar catalysed reaction, the rates are generally low below the CMC ofthe surfactant and strongly dependent on [surfactant] at above its CMC. Insome cases, rates may be also leveled off or even decrease after attaining amaximum value. There are some cases where a particular quaternary ammoniumsalt may behave as both a surfactant and a phase transfer catalyst or as eitherone depending on conditions of the reaction. The phase transfer catalyzedreactions are highly useful in synthetic applications while it is difficult to usemicellar catalyzed reaction in synthetic application because of the difficultyin handling emulsions.
6.11 Kinetics of InhibitionCertain constituents when added to the reaction mixture, slow down the rateof reaction. This phenomena is called inhibition and constituent called inhibitor.Such an effect is similar to the negative catalysis. But the constituent usuallyundergoes chemical change, inhibition is the preferred term. Inhibition mayoccur in chain reactions, enzyme catalysed reactions, surface reactions ormany reversible or irreversible reactions. A trace amount of an inhibitor maycause a marked decrease in the rate of reaction. The inhibitor sometimescombines with a catalyst and prevents it from catalyzing the reaction.
6.11.1 Chain ReactionsIn chain reactions, the inhibitor In interacts with free radical Fº and makes itunavailable for the propagation of chain, thus providing an extra terminationstep
F + I Inactive speciesn ° →′kt
The total rate of termination will be sum of rate of normal termination andrate of termination due to inhibitor.
Let us consider a general scheme
A Fik n→ ° (i) (initiation)
F + M M + L p° ⎯→⎯ °k (ii) (propagation)
F + X Inactive species t° →k (iii) (normal terminator)
F + I Inactive speciesn t° →′k (iv) (terminator due to inhibitor)
The rate of propagation is given as
Rate = kp [F°] [M] (6.54)
With the help of steady-state approximation, [F°] can be obtained as

Kinetics of Catalyzed Reactions 169
[F ] = [A]
[X] + [I ]i
t t n° ′
nkk k
Therefore,
Rate of propagation = [A][M]
[X] + [I ]i p
t t n
nk kk k ′ (6.55)
Rate law (6.55) clearly indicates the retardation of rate on increasing theconcentration of inhibitor.
6.11.2 Enzyme Catalyzed ReactionsIn enzyme catalyzed reactions the inhibitor may interact in various wayseither reversibly or irreversibly. In irreversible inhibition, the inhibitor associateswith enzyme and block the active site of the enzyme or form a unstablecomplex with enzyme and thus retards the rate of reaction.
In reversible inhibition, the inhibitor may bind or associate to enzyme orenzyme-substrate complex. Depending on the binding/combination inhibitor,the reversible inhibition may be of three types.
(a) Competitive InhibitionWhen the inhibitor and substrate are structurally similar, the inhibitor formsa complex or associate with enzyme and decrease the rate of enzyme catalyzedreaction by reducing the proportion of enzyme-substrate complex as follows:
E + S ES1
1[′k
k
(i)
E + I EIn n
I
[k
(ii)
ES E + Product2[
k(iii)
The total concentration of enzyme [E]T may be given as
[E]T = [E] + [ES] + [EIn]
where [ES] = [E][S] +
1
1 2
kk k′ (from steady-state condition with respect to ES) and
[EIn] = KI [E] [In] (from equilibration) (iv)
Thus [E] at any time, in terms of [E]T may be obtained as
[E] = [E] [ + ]
( + ) + [S] + ( + )[I ]T 1 2
1 2 1 I 1 2 n
′′ ′ ′
k kk k k K k k

170 Chemical Kinetics and Reaction Dynamics
Now
Rate of reaction = k2 [ES] =[S][E]
( + ){1 + [I ]} + [S]1 2 T
1 2 I n 1
k kk k k k′
or Rate = [S][E]
(1 + [I ]) + [S]2 T
m I n
kk k (6.56)
where kk k
km1 2
1 =
+ =
′ Michaelis-Menten constant.
Equation (2) in form of Lineweaver-Burk plot can be written as
1Rate
= 1[E]
+ (1 + [I ])
[E]1
[S]2 T
m I n
2 Tkk k
k (6.57)
or 1Rate
= 1[E]
+ [E]
1[S]2 T
m
2 Tkk
k′
where k k′m m = (1 + KI[In]), i.e. Michaelis-Menten constant in presence ofinhibitor. From equation (6.57) it is clear that rate law is same as that forsimple enzyme catalysed reaction, except that value of km is increased by afactor (1 + KI [In]). With the help of slope and intercept of the plot of(1/Rate) versus 1/[S], the values of k2 and km′ can be determined. Knowingthe value of km (in absence of inhibitor) the value of kI can also be evaluated.
(b) Uncompetitive InhibitionIn uncompetitive inhibition, the inhibitor combines with enzyme-substratecomplex to form an uncreative complex (InES) as follows:
E + S ES1
1[
′k
k(i)
E + I I ESn n
I[K
(ii)
ES E + Products2k→ (iii)
By applying the steady state approximation with respect to ES, we get
[ES] = [E][S] +
1
1 2
kk k′
and also
[InES] = KI[ES][In] from equilibrium (ii)
Therefore, the total concentration of E may be given as
[E]T = [E] + [ES] + [InES] = [E] 1 + [S]
( + ) +
[S][I ] +
1
1 2
1 1 n
1 2
kk k
k Kk k′ ′
⎧⎨⎩
⎫⎬⎭

Kinetics of Catalyzed Reactions 171
or [E] = [E] ( + )
( + ) + [S] + [S][I ]T 1 2
1 2 1 1 1 n
′′
k kk k k k K
and
[ES] = [S][E]
( + ) + [S] + [S][I ]1 T
1 2 1 1 1 n
kk k k k K′
Therefore, the rate of reaction is given as
Rate = k2 [ES]
Rate = [S][E]
+ [S]{1 + [I ]}2 T
m I n
kk K (6.58)
where km = (k1 + k2)/k1.The above equation in the form of Lineweaver-Burk plot may be written
as
1Rate
= [S][E]
+ {1 + [I ]
[E]m
2 T
I n
2 T
kk
Kk
or 1Rate
= 1]
+ [E]
1[S]2 T
m
2 Tkk
k[Ε′ (6.59)
where kkk′mm
1 n =
{1 + [I ].
The values of k2 and km′ can be determined with the help of slope andintercept of the plot.
(c) Noncompetitive InhibitionIn noncompetitive inhibition the inhibitor combines with the free enzyme orwith {enzyme-substrate} complex. The inhibitor combines at different activesites of the enzyme and does not compete with the substrate for the sameactive site
E + S ` ES==1
1
′k
k
(i)
E + I ` I En n==IK
(ii)
ES + I ` I ESn n==I′K
(iii)
ES E + Products2k→ (iv)

172 Chemical Kinetics and Reaction Dynamics
In such a case, the enzyme molecule is deformed to such an extent thateither the formation of complex (ES) does not take place at its normal rateor if it is formed, complex does not decompose at its normal rate. At a fixedconcentration of the inhibitor, the extent of inhibition may be minimized byan increase in [S].
The rate law for the above mechanism may be obtained as
Rate = [S][E]
(1 + [I ]) + [S](1 + [I ]2
m I n I n
kk K K ′ (6.60)
It can be observed that when InES is not at all formed, the above rate lawreduces as equation (6.56), while if InE is not formed at all, the rate lawreduces to that for uncompetitive inhibition as equation (6.58).
6.11.3 Inhibition in Surface ReactionsWhen a substance other than the reactants is adsorbed on the concernedsurface, the inhibition occurs. This is due to the fact that on adsorption of thesubstance, the effective surface area is reduced and therefore, the rate is alsoreduced.
Let us consider a unimolecular reaction on the surface. Let that at anytime, surface covered by reactant (A) is θ and surface covered by substance(inhibitor) is θI. Then
θ = 1 + + I I
KPKP K P
(6.61)
where P and PI are partial pressures of the reactant and inhibitor, respectively,and K and KI represent their adsorption constants.
Since, rate is proportional to θ, we have
Rate = 1 + + I I
′K KPKP K P (6.62)
where K′ is a proportionality constant.At low pressure of the reactant, KP << (1 + KIPI), the above equation
reduces to
Rate = 1 + I I
′K KPK P (6.63)
Further, if inhibitor is strongly adsorbed
KIPI >> 1
then
Rate = = I I I
′ ′′K KPK P
K PP
(6.64)
where ′′ ′K K KK
= I
.

Kinetics of Catalyzed Reactions 173
Thus, rate of reaction is directly proportional to reactant pressure and inverselyproportional to inhibitor pressure.
Similarly, the inhibition equation can also be derived for a bimolecularsurface reaction. Let us consider a reaction between two reactants A and Band inhibition by a inhibitor (I). If P1, P2 and PI are the respective partialpressures of A, B and I, then the fractions of the surface covered by A and Bare given as
θ11 1
1 1 2 2 I I =
1 + + + K P
K P K P K P
θ22 2
1 1 2 2 I I =
1 + + + K P
K P K P K P
Now, the rate of reaction is proportional to θ1θ2, i.e.
Rate of reaction = Kθ1θ2
where K is proportionality constant. Thus, rate of reaction is given as
Rate = (1 + + + )
1 2 1 2
1 1 2 2 I I2
KK K P PK P K P K P (6.65)
However, if the inhibitor is a diatomic molecule and adsorbed atomically,the rate becomes
Rate = (1 + + + )
1 2 1 2
1 1 2 2 I1/2
I1/2 2
KK K P P
K P K P K P (6.66)
At low pressures of A and B and strong adsorption of inhibitor, i.e. when
K P K P K P11/2
I1/2
1 1 2 2 >> (1 + + )
The rate can be written as
Rate = 1 2 1 2
I I
KK K P PK P
(6.67)
Therefore, the rate is inversely proportional to partial presence of inhibitor.
EXERCISES
1. For enzyme catalyzed reaction
S + E X (fast)2
1
[k
k
X P + E (slow) 2k→derive the rate law and answer the following:

174 Chemical Kinetics and Reaction Dynamics
(a) What is meant by Michaelis-Menten constant km?(b) Prove that order of reaction in substrate changes from unity to zero at higher
[S].(c) What is the rate and value of km, if k2 >> k1.(d) Draw the potential energy diagram for enzyme catalyzed reaction.
2. What is Lineweaver-Burk plot? The intercept and slope of Lineweaver-Burk plotwere obtained as 5.0 × 10⁻³ and 1.5 × 10⁻⁵, respectively. Calculate the value ofkm and maximum rate.
3. Discuss the effect of pH in an enzyme catalyzed reaction.4. Discuss the acid-base catalysis and suggest an overall rate expression for the
acid-base catalysis.From the overall rate expression obtain the following:(a) Convert the equation as a function of single variable [H+] or [OH–].(b) Discuss Skrabal diagram.(c) What will be the value of rate constant for H+ catalysis and for OH– catalysis.
5. Discuss the mechanism of the following:(a) Catalysis by acid.(b) Catalysis by base.
6. Prove that for a unimolecular surface reaction, the order of reaction with respectto reactant decreases from unity to zero as adsorption of the reactant increasesfrom slight adsorption to strong adsorption.
7. Discuss the various steps involved in heterogeneous catalysis. Derive an expressionfor the rate constant and discuss limiting cases of rate equation.
8. What is meant by CMC of a surfactant? How it can be determined?9. Discuss the general mechanism of micellar catalyzed reaction and compare it
with enzyme catalyzed reactions.10. What is phase transfer catalysis? How it is useful? Discuss the general mechanism
of phase transfer catalysis.11. Discuss and explain the kinetics of inhibition for the following:
(i) Reversible reaction(ii) Surface reaction(iii) Enzyme catalysis(iv) Chain reactions
12. Differentiate between phase transfer catalyst and surfactant.

7Fast Reactions
7.1 IntroductionOne of the important recent developments in chemical kinetics has been agreat interest in the study of very fast reactions which complete in less thanabout 1 sec. With special laser techniques it is now possible to study thereactions occurring in a few pico seconds (≈10–12sec). The techniques, whichhave been designed to monitor concentrations and to measure the ratecoefficients, include flash photolysis, relaxation methods and flow techniques.The other techniques including shock tubes and molecular beams have beenused to explore the dependence of reaction rate on the state of rotational/vibrational excitation of molecules or on the energy with which moleculescolloid and the rate (state-to-state cross sections and rates) at which theenergy is changed from one form into another.
Table 7.1 Ranges of rate constants amenable to different techniques
Technique Range of rate constant
Conventional methods 10–7 s–1 to 1 s–1; 10–7 mol–1dm3s–1
to 1mol–1dm3s–1
Rapid reaction methods 1 s–1 to 109 s–1; 1 mol–1dm3s–1
to 1011 mol–1dm3s–1
(i) Flow methodsContinuous flow method 102-108 mol–1dm3s–1
Accelerated flow method 102-107 mol–1dm3s–1
Stopped flow method 102-108 mol–1dm3s–1
(ii) Relaxation methodTemperature jump 102-1011 mol–1dm3s–1
Pressure jump 102-103 mol–1dm3s–1
Electric impulse 102-1011 mol–1dm3s–1
Ultrasonic 104-1011 mol–1dm3s–1
(iii) Initiating of the reaction byradiation flash photolysis 102-1010
(iv) Magnetic resonance spectroscopyElectron spin resonance 105-1011
Nuclear magnetic resonance 102-1011

176 Chemical Kinetics and Reaction Dynamics
7.2 Flow TechniquesThe flow systems are generally of two types, viz. (i) plug flow (Fig. 7.1), inwhich there is no stirring in the reactor and (ii) stirred flow, in which thereis stirring in the reactor to effect complete mixing within the reactor.
(a) Plug FlowThis is illustrated schematically as,Let us consider a reaction of nth order with respect to reactant A as follows:
n kA P →
Then the rate of disappearance of substance is given by
Rate of disappearance = – dc/dt = kcn (7.1)
where c is the concentration of reactant at time t.Let dv be an element of volume in the reactor. Then,
Rate of disappearance of reactant in a volume dv = kcndv
After the system operates for a sufficient period of time, a steady state isestablished and three processes contribute to steady state as follows:
(i) The molecules entering in reactor in time dt, i.e. ucdt, where u is thevolume of rate of flow of reaction mixture passed through the reactor(liter per sec).
(ii) The molecules leaving the reactor in time dt, i.e. u(c + dc)dt.(iii) The molecules disappearing by chemical reaction in time dt (–dn). Also
– dn = kcndv dt (7.2)
The steady-state equation is obtained as follows:Rate of entry of reactant = Rate of exit of reactant + Amount reacted
i.e ucdt = u(c + dc)dt + kcndvdt (7.3)
or – = dcc
ku
dn v (7.4)
If ci and cf are initial and final concentrations of reactant, then
– = i
f
0c
cdcc
ku
d∫ ∫v
v
where v is volume of the reactant.
Direction of flow
dx
dv
Fig. 7.1 Plug flow.

Fast Reactions 177
On integrating the above equation for n = 1, we get
ln = f
i0
cc
ku
V
or c c e kV uf i
– / = 0 (7.5)
This equation may be compared by general first order equation, C = C0 e–kt
and the quantity V0 /u replaced by time, is known as contact time for thereaction. The contact time may be reduced by using high flow rate and smallvolume. The equation may be tested by varying V0 /u, i.e. either by varyingvolume of reactor or the flow rate.
Equation (7.5) can be written for nth order as
1( – 1)
1 – 1 = f
–1i
–10
n c ckVun n
⎛⎝⎜
⎞⎠⎟ (7.6)
The above equations are valid only when there is no volume change duringthe course of reaction.
(b) Stirred FlowThe complete mixing in a stirred flow reactor has been discussed by Denbigh.In stirred flow, the composition becomes uniform throughout the entire volumeof the reactor as a result of efficient stirring.
Rate of flow of reactants into the reactor = uci
Rate of flow of reactants out of the reactor = ucf
Rate of reaction in the reactor = uci – ucf
Also, Rate of reaction in the reactor = r · V, where r is the rate per unitvolume and V the volume.Therefore,
r · V = uci – ucf
or r = u (ci – cf)/V (7.7)
Thus, the measurement of ci and cf at a given flow rate u allows thereaction rate to be calculated from equation (7.7). The order of reaction andrate constant can be determined by carrying out experiments at differentconcentrations of reactants and rates of flow.
7.2.1 Continuous Flow MethodIn this method (Fig. 7.2), the reactants are forced into a mixing chamber andallowed to flow through a tube called observation tube. The analysis ofreaction mixture is made at different points along the observation tube andthus the progress of the reaction at different times can be obtained.
The analysis can be made in situ using an optical, thermal, electrical orother method. The average time, during which the reaction proceeds beforean element of volume and reaches a distance d along the reaction tube, isd/v, where v is the linear velocity. From the measurements made at various

178 Chemical Kinetics and Reaction Dynamics
distances, a concentration time plot can be obtained from which the rateconstant can be determined. Since the velocity of flow of the magnitude of10 × 103 cm sec–1 can be achieved, the shortest time interval for reaction thatis accessible is of the order of 10–3sec.
7.2.2 Accelerated Flow MethodThis method is similar to continuous flow method except that the rate offlow is continuously varied and the analysis is made at a fixed point alongthe observation tube. Since the rate of flow changes with time, the reactionmixtures arriving at observation point have different time. In the acceleratedflow method the output from a photo electric colorimeter is fed to a cathode-ray oscilloscope, which sweeps out a complete time-concentration recordwhich may be photographed. The method is useful for very rapid enzymereactions and requires only small quantities of reactants.
7.2.3 Stopped Flow MethodIn this method (Fig. 7.3), the rapidly mixed reactants emerge through an
To photo electric coil
Reaction vessel
Outlet
Quarter cell
Light beam
Syringe
Reactantsmixing
chamber
Fig. 7.3 Stopped flow technique.
Reactants
Observation tube
Mixing chamber
Fig. 7.2 Schematic diagram for continuous flow method.

Fast Reactions 179
observation tube as in continuous flow method. But the flow is suddenlystopped and comes to rest within 10–3sec. Progress of reaction is monitoredby using a method that has a rapid response. By oscilloscopic methods theconcentration can again be studied as a function of time after the flowceases. As the time progresses, the reaction mixture present at the point ofobservation continues to react. This method is very economical and takesadvantage of rapid mixing of reagents. The stopped flow method has followingadvantages over continuous flow method:
(i) The method is not affected by rate and character of flow, provided themixing is proper.
(ii) A permanent record of the progress of reaction covering a wide rangecan be obtained.
(iii) A very small quantity of the reactants is required.
7.3 Relaxation MethodThe flow techniques are not suitable for the study of reactions whose half-lives are smaller than about a few msec. Many reactions occur with higherrates than the time required for mixing of the reactants in flow techniques.One of the techniques used for study of such reaction is relaxation method.
In this method, the reaction is first allowed to attain equilibrium which isthen disturbed in some way. The system approaches to attain a new equilibrium.The speed with which the system approaches its new equilibrium is followedusing some special techniques. Let us consider a simple system
A B==1
1
′k
k
The reaction is first order in both the directions. Suppose the system is inequilibrium and a is the initial concentration of A and x the concentration ofB at any time t. Then
dxdt
k a x k x = ( – ) – 1 1′ (7.8)
At equilibrium, dx/dt = 0 and let x = xe. Therefore,
k a x k x1 e 1 e( – ) = ′ (7.9)
Now system is disturbed so that it is no longer at equilibrium.The deviation from equilibrium, ∆x may be considered as
∆x = x – xe
and its derivative with time is given as
d xdt
dxdt
k a x k x∆
= = ( – ) – 1 1′

180 Chemical Kinetics and Reaction Dynamics
= – ( + )1 1 1k a k k x′
= – ( + )( + )1 1 1 ek a k k x x′ ∆ (7.10)
From equations (7.9) and (7.10), d∆x/dt may be written as
d xdt
k k x∆ ∆ = – ( + )1 1′ (7.11)
The quantity ∆x thus varies with time in the same manner as does theconcentration of a reactant in a first order reaction. Integrating equation(7.11), we get
ln( )
= ( + )01 1
∆∆xx
k k t′ (7.12)
where ∆ x = (∆ x)0.When t = 0 has been taken as boundary conditions, equation (7.12) gives
tk k
xx
e*
1 1
0 = 1( + )
when ( )
= ′∆∆
or ln( )
= 10∆∆xx
where t* is known as relaxation time and may be defined as the time atwhich the distance from equilibrium is 1/e of the initial distance. We candetermine ( + )1 1k k ′ knowing t*. Obtaining the ratio k k1 1/ ′ from equilibriumconstant, the individual rate constants k1 and ′k1 can be calculated.
The relation between relaxation time and rate constants for some simplesystems are given in Table 7.2.
Table 7.2 Relationship between relaxation time and rate constantfor some simple reactions
Reaction Relaxation time
A X1
1
[′k
k
1/{ + }1 1k k ′
2A X1
1
[′k
k1/{4 [A] + }1 e 1k k ′
A + B X1
1
[′k
k
1/{ ([A] + [B] ) + }1 e e 1k k ′
A X + Y1
1
[′k
k
1/{ + ([ ] + [ ] )}1 1 e ek k x y′
A 2X1
1
[′k
k
1/{ + 2 [ ] }12 1 1 ek k x′
A + B X + Y1
1
[′k
k
1/{ ([A] + [B] ) + ([ ] + [ ] )}1 e e e ek k x y′

Fast Reactions 181
In order to use relaxation method, it should be ensured that the perturbationfrom equilibrium must be accomplished in a time (~10–6 to 10–7 sec forfastest reactions) that is much less than the relaxation time. The techniques,which are used for perturbation from equilibrium, include pressure jump ortemperature jump methods in which pressure or temperature changes arebrought about rapidly. For more shorter perturbation times, high electricfields are also used to bring about perturbation. Ultrasonic vibrations can beused to produce oscillating temperatures. Perturbations may be in the formof step functions, highly damped oscillations or continuous oscillations. Thespectrophotometric methods have frequently been used for obtaining therelaxation time.
Problem 7.1 Calculate the relaxation time for the reaction
A + B AB(aqu)+
(aqu)–
(aqu)==2
1
k
k
for a temperature jump experiment to a final temperature 400 K. The solutionwas initially prepared by adding 0.02 moles of AB to water maintaining totalvolume of 1 liter. Both forward and backward reactions are first order, k1 andk2 are 8.0 × 10¹⁰ and 5.0 × 10⁶ s–1 at 400 K, respectively.
Solution
Relaxation time = 1([A ] + [B ]) + 1 e e 2k k
Kkkc
1
2
10
64 = = 8.0 10
5.0 10 = 1.6 10×
××
Let x be the concentration dissociate. Then
K a xx x
xxc 2 = – = 0.02 –
1.6 × 104 x2 = 0.02 – x. Therefore, x = 7.6 × 10⁻⁴
Thus [Ae] = [Be] = 7.6 × 10⁻⁴
Hence,
Relaxation time = 1(8.0 10 )(2 7.6 10 )+5.0 1010 –4 6× × × ×
= 1126.6 106×
= 8.22 × 10⁻⁹ sec
7.4 Shock TubesA number of fast gaseous reactions have been investigated using shock

182 Chemical Kinetics and Reaction Dynamics
tubes. The reaction system is taken in a long metal tube, through which ashock wave is passed. As the shock wave traverses an element of gas, thetemperature of gas rises sharply and reaction occurs in and behind the shockfront. The course of reaction and temperature may be determined by variousmethods. Various designs of shock tubes have been employed and one suchis shown schematically in Fig. 7.4.
Observation position
To vacuum
Diaphragm
High pressure
To pump
Fig. 7.4 Shock tube.
The tube is divided into two parts, viz. a high pressure and low pressureend, separated by a thin diaphragm made of a metal foil or other material.
The reaction system is kept in the low pressure compartment while thegas is kept in a high pressure compartment. The diaphragm is burst either bymechanical means or by increasing the pressure. When the diaphragm bursts,a plane shock wave moves along the tube. At start, wave is not sharp becauseof initial turbulence. After traveling a short distance, the wave becomes atrue shock wave in which there is a very sharp boundary between high andlow-pressure region. As the wave travels, the gas is rapidly raised to a veryhigh temperature and the reaction takes place which can be studied by makingrapid observations at various points along the tube. The sharp change intemperature, pressure, density or electrical conductivity etc. may be used astool for the detection of the arrival of the shock front. In some cases, a time-of-flight mass spectrophotometer has also been used to follow theconcentrations of species produced by the shock waves. The shock wavetechnique has successfully been applied to study the vibrational and rotationalenergy transfers between gaseous molecules.
7.5 Flash PhotolysisVary fast reactions, both in gaseous and liquid phases, can be studied by thismethod. In flash photolysis technique, a light flash of very high intensity andvery short duration (~ 10–6 sec) is produced in the neighborhood of thereaction vessel. This produces atoms, free radicals and excited species in thereaction system. These species undergo further reactions which can be followedby spectroscopic means. The method is also known as kinetic spectroscopy.The first order rate constant as large as 105 sec–1 and second order rateconstants as large as 1011 mol–1dm3sec–1 can be measured by this technique.

Fast Reactions 183
7.6 ESR Spectroscopic TechniqueThere are large number of fast reactions which proceed by radical mechanismand the radicals formed are very reactive. The radicals of life time of about0.01 sec have been characterized by electron spin resonance (ESR) studies.Thus, if other parameters are kept constant, the ESR spectroscopy can beused to measure the concentration of the free radical formed. For this, a rapidflow system is usually employed and a special cell is designed to mix thereactants together and subsequently flow through the observation tube. Theintegrated area of the absorption bands of ESR signals are compared tocalculate the concentrations. The progress of reaction can be followed bymeasuring the areas of absorption bands at different times. The change inshape of the absorption signal with time has been used to investigate the lifetime of free radicals.
In the reactions which are not extremely fast, rate of reaction can bestudied by following the signal intensity of a paramagnetic reactant or productas a function of time. Very rapid electron exchange reaction, for example,exchange of electron between naphthalene and naphthalene radical anion,can also be studied by ESR spectroscopy. When electron exchange occurs, abroadening of the hyperfine component of the ESR spectrum may be observed.The rate constant for electron exchange reaction can be calculated by makinguse of this broadening as function of time.
7.7 NMR Spectroscopic TechniquesThe substance like 1H, 14N, 19F, 13C, 17O, 31P contain nuclei with a spin andthus exhibit nuclear magnetic resonance (NMR) like ESR. In NMR also theshapes of line or signal are used for obtaining the information on kinetics ofthe reaction.
Let us consider a simple proton exchange reaction
AH + BH′ [ AH′ + BH
when equimolecular mixture of AH and BH′ is taken and if, there is nointeraction, the NMR spectrum will show two separate peaks representingthe characteristic chemical shifts of two compounds, i.e. AH and BH′. However,if there is a proton exchange, as in the above reaction, and if the rate of thisexchange is enhanced by raising temperature, the two lines first broaden andapproach to each other and then become a single broad line.
The broadening of each line is due to the shortening of the mean life timeof two molecules.
Shortening of the life time due to reaction leads to an increase in linewidth. The increase in line width will not continue indefinitely. As the rateof exchange of protons rises, two protons in two different environments donot behave as independent and, therefore, the lines broaden and finally merge.If average time spent by a given proton is t0 and if two lines are separated by∆νAB, then at the point where the lines coalesce

184 Chemical Kinetics and Reaction Dynamics
t0 = 2 /( )π ∆ν×
From this value, and by known concentrations, the rate constant of the processcan be evaluated.
EXERCISES
1. Give a brief account of flow methods for studying the fast reactions.2. What is relaxation time? How it is related with rate constants in the following
reactions?
(i) A B1
1[′k
k
(ii) A + B B + C1
1[′k
k
(iii) A B + C1
1[′k
k
(iv) A + B C + D1
1[′k
k
3. In an experiment for the reaction
A B + C1
1[′k
k
the relaxation time has been observed as 25 sec. Calculate the values of k1 and
′k1 , where the equilibrium constant for reaction is 10–14.4. How a fast reaction can be initiated and studied by flash photolysis?5. Describe in brief the techniques which can be used to study the kinetics of fast
reactions.
8Reactions in Solutions
8.1 IntroductionWhen a reaction follows the same mechanism in solution and in the gaseousstate, the kinetics remain same in both. However, because of the increasedinteractions in condensed media, the mechanism is frequently changed andalso the kinetics correspondingly. When a chemical reaction takes place insolution, the solvent is usually in so much excess that its concentration doesnot change appreciably as the reaction proceeds and is, therefore, not involvedin the rate expression. However, if solvent enters into chemical change anddoes not regenerate at the end of the process, the solvent would be said toexert a chemical effect on the reaction and will thus be involved in the rateexpression.
The reaction in solution can be considered to take place in three steps, viz.
(i) Diffusion of reactant molecules towards each other.(ii) Chemical transformation.
(iii) Diffusion of products away from each other.
The rates of many chemical reactions does not appear to depend on thesolvent. This is because the activation energy for the process of diffusion ina liquid is nearly 20 kJ mol–1 whereas for chemical reactions it is quite large.Thus, step (i) is usually not rate determining step in reactions in solutions.When the reaction takes place in solution, it is step (ii) that determines therate of a bimolecular reaction. This conclusion is supported by the fact thatthe rates of these reactions do not depend upon the viscosity of the solvent.The rate should be effected by the solvent if diffusion of reactant is the ratedetermining step.
There are some processes occurring in solutions, e.g. quenching of thefluorescence in solution, certain heterogeneous reactions etc., in which thediffusion is the rate controlling. These reactions occur very rapidly, e.g. ionicrecombinations.
8.2 Theory of Absolute Reaction RateIn reactions between gas molecules, the rate constant can be determined in

186 Chemical Kinetics and Reaction Dynamics
terms of partition functions of reactants and activated complex. The evaluationof partition functions is very difficult due to greater uncertainty about thesein solution, and therefore, the rate of reaction in solution is related to that ingas phase by incorporating activity coefficients
Activity = Concentration × Activity coefficient
Activity coefficient → 1 when solution → ideal solution, i.e. very dilutesolution.
Let us consider the reaction
A + B Products#
#[K
X →
Considering the gaseous reactants to be in their standard states, the rateconstant kg in gas phase can be written as
( ) = g 0b
g#k
k Th
K (8.1)
When solution is infinitely dilute, i.e. in the ideal state, rate constant insolution (ks)0 will be given by
( ) = s 0b
s#k
k Th
K (8.2)
K # is equilibrium constant. If we consider the reference standard state to begaseous, K Kg
#s# = because the activity and fugacity coefficients are unity in
very dilute solution and ideal gas, respectively. Then (kg)0 and (ks)0 will bethe same.
In a nonideal solution,
Ka
as# x
#
A B =
a(8.3)
where a’s represent respective activities. Or
KC f
C f fC
C Cf
f fs# x
#x#
A A B B
x#
A B
x#
A B =
C =
where C is the concentration and f the activity coefficient. Therefore, the rateconstant may be written as
( ) = sb
s# A B
x#k
k Th
Kf ff
or k kf ffs gA B
x# = (8.4)
Equation (8.4) can be used for relating the rate constant in solution with thatin gas phase.

Reactions in Solutions 187
If rates in solution and in gas phase are to be equal, the activity coefficient
factor, i.e. fA fB/fx# must be equal to unity. For unimolecular reactions, where
the reactant and activated complex have similar structures and fA and fx# do
not differ widely, the rate of reaction in solution will be quite similar to thatin the gas phase.
8.3 Influence of Internal PressureFor regular solutions, the influence of the solvent is determined by molarvolumes and internal pressure terms. Since the molar volumes do not varygreatly, the internal pressure factor is more important. If the internal pressuresof solvent, reactants and activated complex are similar, the solvent will havelittle effect on the rate of reaction as compared to a solvent in which reactionbehaves ideally. If the internal pressure of the solvent is close to that ofreactants but appreciably different from that of the activated complex, therate of reaction in this solvent will be low. On the other hand, if solvent hasan internal pressure similar to that of activated complex, but different fromone or both the reactants, rate of reaction in this solvent will be high. Sincethe activated complex has properties which approach the properties of theproduct, it may be concluded, in general, that the reaction in which theproducts are of higher internal pressure than the reactants, it is acceleratedby solvent of high internal pressure.
8.4 Influence of SolvationThe degree of solvation of the reactants and activated complex affect the rateof reaction. When the activated complex is solvated to a greater extent incomparison to reactants, the rate of reaction will be greater than that in a nonsolvating solvent. This is because the activity coefficient of the complex issmaller than it is in a solvent that does not solvate it. This lowers the potentialenergy of activated complex or causes a decrease in the activation energy ofthe reaction.
On the other hand, if one or both the reactants are solvated, while theactivated complex is not, the necessary energy of activation is increased andconsequently the rate of reaction is diminished. In case the reactant andactivated complex are both solvated, the overall effect on both the activationenergy and rate of reaction may be small.
8.5 Reactions between IonsThe reactions between the ions are generally very rapid. In ionic reactions,where two ions simply combine, the rate of reaction is governed by thediffusion of ions towards each other and activation energy for the combinationis very small. However, there are many reactions between ions which may beas slow as reactions between neutral molecules. Thus, reactions involve themaking and breaking of covalent bonds or electron transfer.
The effect of electrostatic attraction and repulsion are important in ionic

188 Chemical Kinetics and Reaction Dynamics
reactions. If the ions of opposite signs are involved in the reaction, thefrequency of collisions will be increased by attractive forces. The frequencyfactors for such reactions has been observed to be much higher than normal(~1010 lit mol–1 sec–1). On the other hand, if the reaction involves ions ofsame sign, the number of collisions will be smaller and consequently frequencyfactors will be abnormally low.
A very simple model for reaction between two ions in solution is shown
∞ZAe
ZBe
ZAe
ZBedAB
Reactant Activated complex
Fig. 8.1 Model for reaction between ions.
in Fig. 8.1. This model is referred asdouble sphere model. ZA and ZB
indicate the number of positive ornegative charges on the ions. Initiallythe ions are at infinite distance fromeach other and in activated state theyare considered to be intact and theyare dAB distance apart.
When the ions are at distance x apart, the force f acting on them is
fZ Z e
Dx = A B
2
2
where D is dielectric constant of the medium. The work that will be done inmoving the ions from an initial distance of infinity to a final distance of dAB
is given by
WZ Z e
Dxdx
Z Z eDd
d
= – = AB
A B2
2A B
2
AB∞∫ (8.5)
where negative sign shows that x decreases by dx when the ions move toeach other by a distance dx. This work is equal to the electrostatic contributionto the free energy increase when the ions are moved up to each other. Therefore,the free energy of activation per molecule may be given as
∆ ∆GN
GN
Z Z eDd
#0#
A B2
AB = +
∆G0# is free energy for non electrostatic term. Therefore, the rate constant
for a reaction between ions
kk T
he eG RT Z Z e
Dd RT = b – / –0# A B
2
AB∆
or ln = ln – – Zb 0
#A B
2
ABk
k Th
GRT
Z eDd RT
∆(8.6)
which is again simplified as

Reactions in Solutions 189
ln = ln – 0A B
2
ABk k
Z Z eDd RT
(8.7)
where k0 is the rate constant in a medium of infinite dielectric constant, i.e.k0 = k when there is no electrostatic forces.
According to equation (8.7), ln k of a reaction between ions should varylinearly with 1/D. This has been tested for various reactions. The slope of theplot of ln k versus 1/D gives the value of ZAZBe2/dABRT and the value of dAB
can be obtained from slope. The equation predicts a linear plot of ln k against1/D with a negative slope if the charges of the ions are same, and a positiveslope if the charges are opposite. This treatment has also been extended togive an interpretation of the magnitudes of the frequency factors of reactions.
8.6 Entropy ChangeThe electrostatic contribution to the free energy of activation per mole isgiven as
∆GN Z Z e
Dd# A B
2
AB(e.s.) = (8.8)
while the entropy S is related with ∆G as
SGT
= –p
∂∂
⎡⎣⎢
⎤⎦⎥
because only D in equation (8.8) is temperature dependent.Therefore, electrostatic contribution to the entropy is given by
∆SNZ Z e
D dDT
NZ Z eDd
DT
# A B2
2AB p
A B2
AB p
(e.s.) = = ln ∂
∂⎡⎣⎢
⎤⎦⎥
∂∂
⎡⎣⎢
⎤⎦⎥ (8.9)
In aqueous solution, D is 80 and (∂ ln D/∂T)p remains constant (–0.0046)over a considerable range. If dAB is 2.0 × 10⁻⁸ cm, equation (8.9) gives
∆S #(e.s.) = – 10 ZAZB (8.10)
or ∆S � 40 ZAZB JK–1 mol–1
which indicates that the entropy of activation in aqueous solution shoulddecrease by about 10 units for each unit of ZAZB.
Further, since frequency factor is proportional to e S R∆ #/ or 10#∆S /2.303R,
the frequency factor should decrease by a factor of 1010/4.57, i.e. by aboutone hundred fold for each unit of ZAZB.
When the ions are of same charge, the activated complex bears morecharge, the solvent molecules in the neighborhood of ion are acted upon bystrong electrostatic forces, which restrict their freedom of motion. This effect
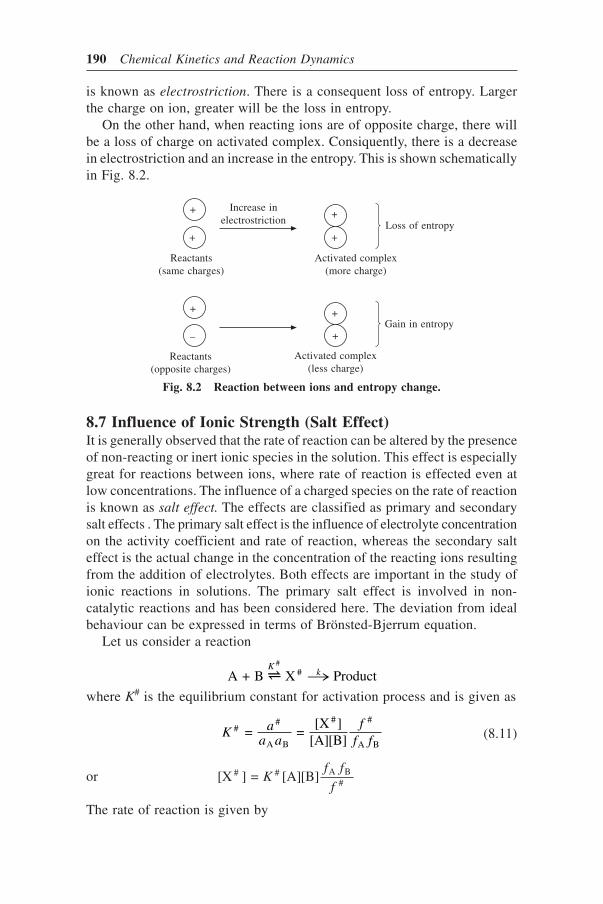
190 Chemical Kinetics and Reaction Dynamics
is known as electrostriction. There is a consequent loss of entropy. Largerthe charge on ion, greater will be the loss in entropy.
On the other hand, when reacting ions are of opposite charge, there willbe a loss of charge on activated complex. Consiquently, there is a decreasein electrostriction and an increase in the entropy. This is shown schematicallyin Fig. 8.2.
Loss of entropy
+
+ +
+Increase in
electrostriction
Reactants(same charges)
Activated complex(more charge)
Gain in entropy
+ +
+–
Reactants(opposite charges)
Activated complex(less charge)
Fig. 8.2 Reaction between ions and entropy change.
8.7 Influence of Ionic Strength (Salt Effect)It is generally observed that the rate of reaction can be altered by the presenceof non-reacting or inert ionic species in the solution. This effect is especiallygreat for reactions between ions, where rate of reaction is effected even atlow concentrations. The influence of a charged species on the rate of reactionis known as salt effect. The effects are classified as primary and secondarysalt effects . The primary salt effect is the influence of electrolyte concentrationon the activity coefficient and rate of reaction, whereas the secondary salteffect is the actual change in the concentration of the reacting ions resultingfrom the addition of electrolytes. Both effects are important in the study ofionic reactions in solutions. The primary salt effect is involved in non-catalytic reactions and has been considered here. The deviation from idealbehaviour can be expressed in terms of Brönsted-Bjerrum equation.
Let us consider a reaction
A + B X Product#
# [K
k→where K# is the equilibrium constant for activation process and is given as
K aa a
ff f
##
A B
# #
A B = =
[X ][A][B] (8.11)
or [X ] = [A][B]# # A B#K
f f
f
The rate of reaction is given by

Reactions in Solutions 191
Rate = [X ]# bk Th
(8.12)
or Rate = [A][B]b # A B#
k Th
Kf ff (8.13)
Experimentally, the rate of reaction is given as
Rate = k[A] [B] (8.14)
From equations (8.13) and (8.14), the rate constant k for reaction is obtainedas
kk T
hK
f ff
= b # A B# (8.15)
or k kf ff
= 0A B
# (8.16)
where k0 is the rate constant when all activity coefficient are unity.Equation (8.16) may be written as
or log k = log k0 + log fA + log fB – log f # (8.17)
Activity coefficient vary with the concentration especially in the presenceof added electrolyte. Lewis and Randall introduced the quantity called ionicstrength which is a measure of the intensity of the electric field due to theions in a solution. It is defined as the sum of the terms obtained by multiplyingthe molarity (concentration) of each ion present in solution by the square ofits valence
µ = 12
or 12i i
2i i
2Σ Σm Z C Z
According to Deybe-Huckel limiting law, the activity coefficient f of an ionis related to the ionic strength as
log = – 2f QZ µ
where Q is a constant given by
N e
Dk T
2 3 1/2
b3/2 1/2
(2 )2.303( ) (1000)
π
Since the charge on activated complex = (ZA + ZB), equation (8.17) can bewritten as
log = log – [ + – ( + ) ]10 0 A2
B2
A B2k k Q Z Z Z Z√
= log + 20 A Bk QZ Z µ (8.18)

192 Chemical Kinetics and Reaction Dynamics
where the value of Q is approximately 0.51 for aqueous solution at 25°C.Equation (8.18), therefore, can be written as
log k = log k0 + 1.02 ZAZB µ (8.19)
Equation (8.19) has been tested for a considerable number of times. A plotof log k versus µ will give a straight line with slope equal to 1.02 ZAZB
(Fig. 8.3) Sign of ZAZB determines the direction of slope. If one of thereactant is a neutral molecule, ZAZB is zero and rate constant is expected tobe independent of ionic strength. If the reactions involve similarly chargedions, ZAZB will be positive and slope of straight line will be positive, i.e. rateof reaction will increase on addition of electrolyte. On the other hand, if thereaction involves oppositely charged species in rate determining step, ZAZB
will be negative and the rate of reaction will decrease on increasing µ, i.e. onadding salt in reaction mixture.
For reactions
(a) S O + I ;2 82– – ZAZB = 2
(b) CH3COOC2H5 + OH–; ZAZB = 0(c) CO(NH3)5Br2+ + OH–; ZAZB = –2
8.8 Secondary Salt EffectIn primary salt effect, addition of an electrolyte (salt) or variation of ionicstrength affects the activity coefficients and hence the rate of reaction. However,in a reaction where H+ or OH– ions produced from a weak acid or weak baseact as catalyting agent, the addition of salt influences the concentration of H+
or OH– ions. Since the rate of reaction depends upon the concentration of H+
or OH–, it will be affected by the salt concentration. This phenomenon isknown as secondary salt effect.
Let us consider a reaction which is catalyzed by H+ produced by weakacid HA. The dissociation constant of acid is given as
log
k
ZA Z
B = –ve
Z AZB
= +ve
Reaction between oppositelycharged species
ZAZB = 0 (when at least onereactant in neutral)
Reaction between similarlycharged species
Fig. 8.3 Plot of log k versus
� .
µ

Reactions in Solutions 193
HA [ H+ + A–
Kf f
fa
+ –H A
HA =
[H ][A ][HA]
+ –
or [H ] = [HA][A ]
+a –
HA
A H– +K
ff f (8.20)
or [H ] = + HA
A H– +K
ff f (8.21)
where K = Constant = Ka [HA]/[A–]; because [HA]/[A–] will remain constantfor a given acid salt mixture.
Since the rate depends on [H+], the rate constant for a given acid salt ratiomay be given as
k kf
f f = 0
HA
H A+ –(8.22)
where k0 is the rate constant in absence of secondary salt effect and includesthe primary salt effect. Equation (8.22) at 25°C, may be given as
log = log + 1.0180k k µ (8.23)
When µ is increased, the concentration of H+ increases, and therefore, rate ofacid catalysed reaction will also increase. Similar results are obtained forreactions catalysed by hydroxyl ions. The ionic strength must be kept constantwhen we examine a general acid/base catalysed reaction because, if ionicstrength is not kept constant the rate constant will change in accordance withequation (8.18).
The oxidation of ascorbic acid AH2 by Ag(I) involves the rate determiningstep as
AH– + Ag+ → AH0 + Ag
This mechanism suggested by Mushran and coworkers is likely to givenegative primary and positive secondary salt effect. At low ionic strength,both the salt effects will be a function of charge alone and thus will correspondto no net salt effect. At high ionic strength, the charge independent terminvolving direct proportionality to ionic strength will become more significant,resulting in negative salt effect. This observation has been found to be inexcellent agreement with experimental results.
8.9 Reactions between the DipolesA theory for the influence of the dielectric constant of the medium on thefree energy of a polar molecule has been given by Kirkwood. According to

194 Chemical Kinetics and Reaction Dynamics
the theory, the free energy transfer of a polar molecule, having dipole momentµ and radius r; from a medium of dielectric constant unity to another (havingdielectric constant D) is given by
∆ µG
D
r D = –
( – 1)(2 + 1)
2
3 (8.24)
Applying this theory to the transition state theory for the reaction
A + B [ X# → Products
where A, B and X# are polar species, and taking
k RTNh
e G RT = – /#∆
we can derive the rate constant in the form of equation
ln = ln – ( – 1)(2 + 1)
+ – 0A2
A3
B2
B3
#2
#2k kN D
RT D r r r
µ µ µ⎛⎝⎜
⎞⎠⎟
(8.25)
where k is rate constant in medium of dielectric constant D, k0 is rate constantin a condensed medium of dielectric constant unity when the non-electrostaticforces are the same for activated complex as for the reactants, µA, µB and µ#
are dipole moment of A, B and X#, respectively, and rA, rB and r# are thecorresponding radii. If the activated complex is more polar than the reactants,µ# > µA or µB, a plot of ln k versus (D – 1)/(2D + 1) will be linear with apositive slope. In such cases, k increases as the dielectric constant of themedium increases. This has been verified by reactions in mixture of twosolvents of different dielectric constants in variable proportions so that Dvaries. The equation is not reliable, in general, if the reaction rates in differentsolvents of various dielectric constants are compared, especially if the activatedcomplex is more polar than the reactants (since r# varies from one solvent toanother). On expending (D – 1)/(2D + 1), we get
DD D D D – 1
2 + 1 = 1
2 – 3
4 + 3
8 – 3
16 + . . . .2 3
Neglecting higher terms, we obtain
DD D – 1
2 + 1 = 1
2 – 3
4(8.26)
and therefore, a plot of ln k versus 1/D can be plotted in place of ln k versus{(D – 1)/(2D + 1)}.
The influence of the dielectric constant on the rate of reaction does not seemsto be very useful in distinguishing the reaction between ion-ion, ion-dipoleor dipole-dipole reactions. Generally, if rate constant decreases as the dielectricconstant is decreased, an interaction of ion-dipole type reaction is indicated.

Reactions in Solutions 195
8.10 Kinetic Isotope EffectThe bond energy of a compound will be affected by change in masses ofatoms that are bonded. When an element in a compound is replaced by anisotope of the element, the rate of reaction of that compound is altered andthe extent of alteration depends on the closeness of bond to the reactiontaking place. The effect on the rate will be more when the bond involved inthe substitution itself is cleaved in the reaction. The extent to which the rateis affected will depend on the extent to which the bond strength is affectedand this in turn will depend on the relative differences in masses of theelement and its isotope.
Let us consider that a C—H bond cleavages in the mechanism of reaction.Now, if deuterium is substituted for hydrogen, the rate is reduced.
Further, if tritium is substituted for hydrogen in C—H bond, a morereduction of rate is observed. This is because the mass ratio is highest forhydrogen isotopes. Since the isotope substitution affect the reduced massand according to collision theory, Z is proportional to (1/µ)1/2, the rate willalso be affected. The ratio of rate constants kH/kD and kH/kT are 7 and 16,respectively, when deuterium and tritium is substituted in place of hydrogenin the bond cleaved in the mechanism. This is called the primary kineticisotope effect. The change in rate constant due to presence of a heavierisotope in a molecule at a position not directly involved in the bondtransformation is called secondary kinetic isotope effect. However, whenmolecules are heavy, isotopic substitution will not alter the masses to anyconsiderable extend and hence the isotope effect will be insignificant.
The isotope effect is generally used to:
(a) observe that a particular bond is broken in the rate limiting step of areaction or not. For example, if C—H bond is breaking in the ratedetermining step, the substitution of deuterium (D) will slow downthe rate by about 7 fold.
(b) solve some of the mechanistic problems that are known. For example,let us consider the Cannizzaro reaction
Ph—C||O
—H + Ph—C||O
—H Ph—C||O
—O + Ph— C|H*
|OH
—H H O
—OH2⎯ →⎯
to observe that in
Ph— C|H*
|OH
—H
H* came from water molecule or from second molecule of benzaldehyde.The reaction when carried out in D2O medium, no

196 Chemical Kinetics and Reaction Dynamics
Ph—C|D
|OH
—H
was formed. This clearly indicates that H* comes from second molecule ofbenzaldehyde.
The rate constant k by collision theory is
k = pZe–E/RT (a)
where p, Z and E are steric factor, collision number and energy of activation,respectively.
Again, Z is proportional to (1/µ)1/2, where µ is the reduced mass. Therefore,when isotope is substituted, the rate constant will change. Let
k pZ e E RTI I
– / = I (b)
where kI, ZI and EI are the rate constant, collision number and activationenergy, respectively, in case of isotope substitution.
From equations (a) and (b), we get
k k Z Z eE E
RT/ = ( / )I I–
– I
(c)
or k k eE E
RT/ = II
1/2–
– Iµµ
⎛⎝
⎞⎠ (d)
where µI is the reduced mass of isotope-substituted system.When molecules are heavy, isotope substitution will not alter the masses
to any considerable extent and (µI/µ)1/2 will tend to unity.In order to consider the energy factor, let us consider the energy in ground
state. The vibrational energy of molecule in ground state is given as
E0 = 12 hν0 (e)
where ν π µ0 f f = 12
/ ( being force constant).k k
For isotopic substitution, the ground state energy and frequency of vibrationwill be given as
E h0I
0I = 1
2ν (f)
where ν π µ0I
f I = 12
/k .
From equations (e) and (f ), we get
ν ν µ µ0I
0 I1/2 = ( / )

Reactions in Solutions 197
and ∆ ν νE E E h = – = 12
( – )0 0I
0 0I
or ∆ ν ν µ µE h0 0 0 I1/2 = 1
2{ – ( / ) }
= 12
{1 – ( / ) } = {1 – ( / ) }0 I1/2
0 I1/2hv Eµ µ µ µ (g)
The replacement of the light element with heavy isotope lowers theenergy by ∆E0, which is given by equation (g). For ground state of hydrogenν0 = 4405 cm–1 and (µH/µD)1/2 = 0.70. Thus, the value of ∆E0 is obtained as7.74 kJ mol–1.
The replacement of light isotope with heavy isotope in activated state alsolowers the energy. Let the lowering in energy in activation state be represented
as ∆E0# . It has been observed that ∆E0
# is less than ∆E0 and, therefore, ratioof k/kI > 1. When the bond involving the isotope element in activated complexis completely broken ∆E0
# and k/kI will be maximum. However, when thebonds in activated complex is stronger than in the initial molecule, i.e.∆E0
# > ∆E0, the value of k/kI will be less than unity. This is called reverseisotope effect.
8.11 Solvent Isotope EffectThe rate of a chemical reaction may change on changing the isotopiccomposition of the solvent, e.g. changing solvent from H2O to D2O. If H ofwater or of an alcoholic solvent is replaced by D, there may be a change inthe rate of reaction.
The solvent isotope effect has widely been used in distinguishing betweenwhether proton transfer occurs prior to or in the rate-determining step. Whenproton transfer is the rate determining step, the rate in D2O will be less thanin H2O. This is a normal primary kinetic isotope effect. However, if there isa fast reversible proton transfer prior to the rate determining step, the reactionsoccur more rapidly in D2O than in H2O.
Let us consider the reaction
S + H O SH + H O3+ +
2[K
SH Product+ k→ (slow, rate determining)
Rate = = [SH ] = [S][H O ]+3
+dPdt
k kK
When H2O is replaced by D2O, since D3O+ is a stronger acid than H3O+, the
concentration of SD+ in D2O will be greater than that of SH+ in H2O and,therefore, the reaction will be faster in D2O. Similarly, in base catalysedreactions, DO– being a stronger base than HO–, an increase in the rate in D2Ocompared to that in water is expected.

198 Chemical Kinetics and Reaction Dynamics
8.12 Hemmett EquationThe introduction of a substituent in an organic compound may affect itsreactivity in a given reaction. A number of quantitative relationships havebeen suggested in connection with the effect of substituents on the rateconstant of the reaction. Such structure-reactivity co-relations are helpful inpredicting the reactivity of organic compounds in various reactions and alsoin verifying the reaction mechanism. One such useful relationship was proposedby Hemmett, which relates the equilibrium and rate constants for the reactionof meta and para substituted benzene derivatives.
log k = log k0 + σρ
or log K = log K0 + σρ (8.27)
where k and k0 are rate constants for substituted and parent compoundrespectively and K and K0 are equilibrium constants for reaction in case ofsubstituted and parent compound, respectively. The parameter σ (substituentconstant) depends only on the substituent, while ρ is a parameter known asreaction constant that varies with the reaction and external conditions.
Reaction constant ρ has been chosen as unity for the ionization equilibriumconstant for benzoic acid in aqueous solution and for the substituted benzoicacids defined as
ρ = log Ionization constant of a substituted benzoic acidIonization constant of benzoic acid
⎛⎝
⎞⎠ (8.28)
By determining the ρ, the values of ρ for other reaction can thus be obtained.Hemmett equation has been applied quite accurately to a large number ofreactions.
The substituent constant σ is a measure of polar effect (relative to hydrogenof the meta or para position). σ is positive when K > K0. A positive value ofσ has been found in electron withdrawing substituents like —NO 2,—Cl etc.These electron withdrawing substituents stabilize the anion of the acid andincreases the strength of substituted acid. For electron donating substituents,σ is negative. The value of σ lies between 0 and ±1.0. In general, σ is notdependent on solvent and temperature. It has been observed that for substituentswhich can interact with the solvent, viz. —OH, the value changes withsolvent composition.
The reaction constant ρ depends on nature of reaction, solvent andtemperature. It is a measure of the susceptibility of the reaction to polareffect. A positive value of ρ for a reaction shows that the reaction is acceleratedby electron withdrawing substituents (σ = + 1.0). Thus a positive value of ρindicates the reaction center has higher electron density in the transition statethan in the starting material. While negative value of ρ indicates that thereaction center has a lower electron density in the transition state than in thestarting material and the reaction is accelerated by electron donating

Reactions in Solutions 199
substituents. In general, the value of ρ has been found to be between –5 and+5. A small value of ρ has been observed in reaction involving free radicalintermediates or a cyclic transition state. The values of σ and ρ for somecases are given in Table 8.1.
Table 8.1 Substituent constants and reaction constants
Substituent constants Reaction constants
Group Meta Para Reaction Value of constants
CH3 – 0.07 – 0.17 Benzoic acid ionization in water 1.00C2H5 – 0.04 – 0.15 Ionization of phenol in water 2.11OH 0.00 – 0.46 Alkaline hydrolysis of methyl 2.46
benzoate in 60% ethanolCl 0.37 0.23 Acid hydrolysis of ethyl benzoate 0.144NO2 0.71 0.75 in 60% ethanol –
8.13 Linear Free Energy RelationshipThere is a linear relationship between the free energies of activation for onehomologous series of reactions and those of another. The Hemmett relationshipare equivalent to the existence of linear relationship between the free energiesfor different series. The rate constant of a reaction is related with the freeenergy of activation by the equation
kk T
he G RT = b – /#∆ (8.29)
The logarithm of rate constant is given by
log = log – 2.303
b#
kk T
hG
RT∆
(8.30)
Similarly
log = log – 2.3030
b 0#
kk T
hG
RT∆
(8.31)
Substituting the values of log k and log k0 in the Hemmett equation, i.e.log k = log k0 + σρ, we get
∆ ∆ σρG G RT#0# = – 2.303
or∆
ρ∆
ρ σG GRT
#0#
= – 2.303 (8.32)
This equation, with a particular value of reaction constant ρ may apply toany reaction involving a reactant having a series of substituents. For a second

200 Chemical Kinetics and Reaction Dynamics
series of homologous reactions having reaction constant ρ′, a similar equationcan be written as
∆ ∆ σρ′ ′ ′G G RT#0
# = – 2.303
or∆
ρ∆
ρ σ′′
′′
G GRT
#0
#
= – 2.303 (8.33)
Subtracting equation (8.33) from (8.32), we get
∆ρ
∆ρ
∆ρ
∆ρ
G G G G# #0#
0#
– = – ′′
′′ (8.34)
Which can also be written as
∆ρρ ∆G G# # – = Constant′ ′ (8.35)
This is a linear relationship between the free energy of activation forhomologous series of reaction. An equivalent relationship
∆ρρ ∆G G – = Constant′ ′ (8.36)
applies for free energies of overall reaction.
∆G′
∆G
Fig. 8.4 Plot of ∆∆∆∆∆G and ∆∆∆∆∆G′′′′′.
Thus, a plot of ∆G and ∆G′ is linearas shown in Fig. 8.4.
The linear free energy relationshiphas been observed in large numberof cases. The applicability of therelationship is quite poor for ortho-substituents because these substituentsexert not only electron-attracting orelectron repelling effect but also asteric effect which usually leads to a decrease in the rate of reaction.
8.14 The Taft EquationThe Hemmett equation is not applicable well to the reactions of aliphaticcompounds partly due to some steric interference between the substituentsand reaction site. For aliphatic compounds, Taft has proposed the followingequation
log k = log k0 + σ*ρ* (8.37)
where k is rate constant for a particular member of reaction series and k0 therate constant for the parent compound (usually the methyl compound).
Polar substituent constant σ* is defined as

Reactions in Solutions 201
σ* = 12.5
[log ( / ) – log( / ) ]0 basic 0 acidick k k k (8.38)
where k0 is rate constant for an ester and k the rate constant for ester havingthe substituent alpha to carbonyl group. The rate constants have been comparedfor acidic and basic hydrolysis of ester. An arbitrary factor 2.5 has beenintroduced to bring σ* values on approximately same scale as the Hemmettσ values. The term log (k/k0)acidic is a measure of the contribution of stericeffect to the free energy of activation while log (k/k0)basic is a measure of thecontribution of both, i.e. steric effect and inductive effect to the free energyof activation. The difference of the two terms is thus a measure of theinductive effect alone. Thus, the polar substituent constant σ* is a measureof the electron attracting ability of the substituent. ρ* is the reaction constant,analogous to Hemmett’s equation. A positive ρ* value indicates that thereaction is facilitated by electron withdrawal as in the Hemmett equation.
In terms of equilibrium constant, the Taft equation is written as
log K = log K0 + σ* ρ* (8.39)
Some values of Taft σ* and ρ* are given in Table 8.2.
Table 8.2 Values of Taft σσσσσ* and ρρρρρ*
Group σ* Reaction ρ*
CH3 0.00 RCOOH + H2O [ RCOO– + H3O+ 1.72
C2H5 – 0.10 RCH2OH + H2SO4 [ RCH2OSO3H + H2O 4.60
H 0.49
C6H5 0.60 C6H5COCHR2 + BrOH– → C6H5COCR2Br + Br–
CH3CO 1.65
Cl3C 2.65
8.15 Compensation EffectIt has frequently been observed that for a given reaction investigated in a
Fig. 8.5 The compensation effect, a plotbetween T∆∆∆∆∆S# against ∆∆∆∆∆H #.
∆H # (kJ mol–1)
T∆S
# (kJ
mol
–1)
series of solvent and also for thehomologous reactions in whichsubstituents are introduced into areactant, a plot of T∆S # against ∆ H #
was a straight line with approximatelyunit slope as shown in Fig. 8.5.
Since ∆G# = ∆H # – T∆S and ifthere is exact relationship between∆H # and T∆S # with unit slope, therewill be no variation in ∆G #.
A similar compensation effect has

202 Chemical Kinetics and Reaction Dynamics
also been observed between ∆H and T∆S for overall process in solution.Therefore, the compensation effect between ∆H # and T∆S # cannot be explainedin terms of purely kinetic effect and it should be explained in terms ofsolvent-solute interactions. The application of more exact theories whichinvolve the binding between solute-solvent molecules, that might change thefreedom of vibration and rotation of solvent molecules etc. can explain thecompensation between ∆H and T∆S.
EXERCISES
1. With the help of transition state theory, compare the rate constant for reaction
A + B s X#
in gaseous state and solution phase.2. Describe an equation giving the effect of dielectric constant of the medium on
rate constant and discuss the salient features of the equation.3. Entropy decreases when reacting ions are of opposite sign, while it increases
when reacting ions are of same sign. Explain?4. What is primary salt effect? What will be the effect of ionic strength on the rate
of reaction if
(a) rate determining step involves similar charged species.(b) rate determining step involves oppositely charged species.
5. Predict the effect of: (a) increasing dielectric constant and (b) increasing ionicstrength on the rates of following reactions:
(i) S O + 2I 2SO + I2 8–2 –
42–
2→(ii) Br + (CH )C (CH ) CBr–
3+
3 3→(iii) CH Br + 2H O CH OH + H O + Br3 2 3 3
+ –→(iv) [CO(NH ) Br] + Hg Products3 5
2+ z+ →
6. Describe briefly the following:
(a) Kinetic isotope effect(b) Hammet equation(c) Taft equation(d) Linear free energy reactions
7. The rate constant for the hydrolysis of a m-chloro substituted and p-methoxysubstituted organic substance are 0.50 and 0.015 at 25 °C, respectively. The σvalues of m-Cl and p-OMe are +0.37 and – 0.27, respectively. Calculate thereaction constant ρ and rate constant for hydrolysis of unsubsituted substanceand p-nitro (σ = + 0.75) substituted substance.
8. Following observations were made on the effect of ionic strength µ on the rateconstant k of the reaction A + B→ Product (rds):

Reactions in Solutions 203
µ × 103 10 × k(mol dm–3) (mol–3 dm3 m–1)
2.4 6.303.6 6.724.4 6.966.4 7.088.4 7.56
Find the value of ZA ZB. If charge on A is –1, what will be charge on B?

9Reaction Dynamics
9.1 Molecular Reaction DynamicsReaction dynamics deals with the intra- and intermolecular motions thatcharacterize the elementary act of a chemical reaction. It also deals with thequantum states of the reactants and product. Since the dynamic study isconcerned with the microscopic level and dynamic behaviour of reactingmolecules, therefore, the term molecular dynamics is employed.
From a study of overall rate constant k(T ) for a reaction in the bulk andits dependence on concentrations of reactants, catalyst/inhibitor, temperatureetc., the kinetics come up with a mechanism by putting together a lot ofdirect and indirect evidences. The determination of the overall rate constantk(T ) using transition state theory was a more sophisticated approach. But themacroscopic theories such as transition state theory in different versions aresplit to some extent in some cases, e.g. for very fast reactions. The experimentaland theoretical studies in reaction dynamics have given the indications underwhich it becomes less satisfactory and further work in this direction maycontribute much more to solve this problem.
It is now possible to design the experiments using molecular beams andlaser techniques such that the initial vibrational, rotational, translational orelectronic states of the reagent are selected or final states of products arespecified. In contrast to the measurement of overall rate constants in a bulkkinetics experiment, state-to-state differential and integral cross sections canbe measured for different initial states of reactants and final states of productsin these sophisticated experiments. Molecular beam studies have becomemore common, lasers have been used to excite the reagent molecules and ithas become possible to detect the product molecules by ‘laser-inducedfluorescence’. These experimental studies have put forward a dramatic changein experimental study of chemical reactions at the molecular level and hasculminated in what is now called state-to-state chemistry.
Another development in molecular reaction dynamics or state-to-statechemistry is the theory, which has developed the same way. With the help ofelectronic computers, it has been possible to study theoretically the molecularcollisions underlying the abovementioned experiments and obtain a detailed

Reaction Dynamics 205
understanding of the molecular interactions. Corresponding theoretical studiesare leading to a better understanding of molecular dynamic behavior ofreacting systems.
9.2 Microscopic-Macroscopic RelationA connection between microscopic quantities such as state-to-state crosssections, state-to-state rate constant and macroscopic quantities such as overallrate constant k(T ) is summarized in Flow Chart 1.
Various states in computing overall rate constant k (T ), startingfrom the Schrödinger equation for the system
Flow Chart 1
Transition statetheory
Hψ = Eψ
Born-Oppenheimerapproximation
Potential energysurface
Classical quantummechanics
State-to-state crosssection
Maxwell-Boltzmanndistribution
State-to-state rateconstant
k(T )Overall rate constant
Boltzmann distribution
Traditional bulkkinetic
experiment
Bulk experiment(initial state
selection andspecification)
Molecular beamexperiment(initial state
selection and finalstate specification)
A simplified approach is statistical rate theory (transition state theory)with the help of which the overall rate constant k(T) may be obtained frompotential energy surface (PES) in a single jump averaging out all of theintermediate details. It is generally not possible to extract microscopic detailssuch as energy-dependent cross sections from conventional kineticsexperiments. The preferable approach is to calculate microscopic quantitiesfrom some model and then perform the downward averaging for comparisonwith measured quantities.

206 Chemical Kinetics and Reaction Dynamics
A knowledge of interaction potential is essential for the study of molecularcollision. Therefore, to obtain a potential energy surface (PES) is the firststep for any calculation of cross sections and reaction probabilities. Theadiabatic PES of reacting system is obtained by solving the time-independentSchrödinger equation within the Born-Oppenheimer approximation. Thenuclear motion of PES is followed by using either classical or quantummechanics. In classical mechanics, the classical equations of motion on PESare solved using Newtonian mechanics and a classical trajectory describingthe motion of constituent atoms in space is obtained. A diagram or mathematicaldescription that describes the motion of reaction system over a potentialenergy surface is known as a trajectory. These trajectories can then be analyzedto determine the likelihood of a reactive encounter, which transforms reactantsinto products. In quantum mechanics, the phenomenon at atomic level arerecognized as intrinsically quantum-mechanical. The time dependentSchrödinger equation is solved using the PES as the potential function in theHamiltonian operator and probability of product molecules appearing in thecollision is determined. In either case, the objective is same, i.e. to establishconnections between the microscopic properties and macroscopic phenomenawhich is also one of the basic goals of chemical kinetics and dynamics.
The state-to-state differential and integral cross sections, rate constantdata and the effect of reagent vibration, rotation and translation thereupon,are becoming available for large number of reactive and nonreactive systems.With the current state of art in experimental techniques, e.g. using combinationsof molecular-beam and laser techniques, the measurements of state-to-staterate coefficients and of angle- and velocity-dependent cross sections arepossible. The measurements of reactive velocity, scattering angles and productand reactant states may all be simultaneously determined with the help ofthese experimental techniques.
The studies of molecular dynamics is now not only limited to the systemsof atom and small molecules in dilute gas phase, the intense current interestis occurring in the condensed phase, i.e. in liquid solutions and in the solidstate.
When the molecular collisions occur, we may expect the followingelementary processes:
A + BC Elastic scattering (no transfer of energy amongdifferent degrees of freedom)
A + BC(i )Inelastic scattering (there is transfer of energy
oramong degrees of freedom but no chemical reaction)
A + BC → A + BC( j,v)AB + Cor Reactive scattering (there is a chemical change)AC + BA + B + C Collision induced dissociation
⎧
⎨
⎪⎪⎪
⎩
⎪⎪⎪
⎫⎬⎭
⎫⎬⎭

Reaction Dynamics 207
9.3 Reaction Rate and Rate ConstantLet us consider a simple bimolecular collision
A(i) + B( j ) → C(l) + D(n)
where i, j, l and n are internal states (collectively electronic, vibrational androtational states) of the reactants, (A, B) and products (C, D), respectively.Let reactants approach each other with velocity
rvA and
rvB. Now a beam of
A(i) with a relative velocity v v v – A Br r
is allowed to interact with moleculeB( j) in scattering zone of volume V and the product C(l) is detected at asolid angle with respect to incoming A(i) as shown in Fig. 9.1.
A(i)
V
B( j )
θ
C(l)
Fig. 9.1
Then rate of reaction may be defined as
d NCdt
injl( ) ( ), =
No. of molcules of A arriving atthe scattering zone per unit time per unit area
θv
⎛
⎝⎜
⎞
⎠⎟
× (No. of molcules of B in scattering zone of volume )V
×⎛
⎝
⎜⎜
⎞
⎠
⎟⎟
Probability of reaction producingproduct at an angle in the range to + , while ( ) in produced
simultaneously
( )Cd D n
l
θ θ θ
= {ηA(i)v}{ηB( j)V}σ(ln/ij, v, θ)dθ (9.1)
where ηA(i) and ηB( j ) are number of molecules per unit volume of A and Brespectively. σ is a measure of reaction probability and called state-to-statedifferential cross section. When the measurements are averaged over all theangles, σ(ln/ij, v, θ)dθ can be integrated over θ
σ σ θ θ( / , ) = ( / , , )ln ij ln ij dv v∫σ(ln/ij, v) is called state-to-state integral cross section with units of area.Equation (9.1), therefore, becomes
dNdt
ijn n V ln ijC l
i j( )
A( ) B( ), = ( / , )v v v⋅ σ (9.2)
When velocity is not selected, an average over the relative velocity yields

208 Chemical Kinetics and Reaction Dynamics
dNdt
ijn f n n V ln ij dl
i jC ( )
A( ) B( ) = ( ) ( / ; )v v v vσ (9.3)
where f (v) is the fraction of molecular pairs having relative velocity in therange v and v + dv. At thermal equilibrium, f (v) corresponds to Maxwell-Boltzmann distribution. Equation (9.3) can be rearranged as
1 = ( ) ( / ; )C( )
A( ) B( )VdN
dtijn f ln ij d n n
li j∫⎛
⎝⎞⎠v v v vσ (9.4)
Equation (9.4) in terms of rate constant can be written as
k T f ln ij dijln ( ) = ( ) ( / , )∫⎛
⎝⎞⎠v v v vσ (9.5)
where k Tijln ( ) is called state-to-state rate constant and equation (9.5) resembles
with traditional rate equation.In traditional bulk kinetic experiments, the internal states are also not
selected and we measure the overall rate. The overall rate constant may bewritten as
1 = 1 = ( ) = ( )C (l)
A( ) B( ) A BVdNcdt V
dNdt
ijn k T n n k T n ni jln i jln ij
lni jΣ Σ (9.6)
and k T k T X Xijln ij
lni j( ) = ( ) A( ) B( )Σ (9.7)
where Xnn
Xnni
ij
jA( )
A( )
AB( )
B( )
B = and = .
At thermal equilibrium
X g e Qi iE k Ti
A( )– /
A = /B
where gi is the degeneracy of i th internal state and QA is the partition functionfor A. Similar expression holds for B( j) also.
Thus, we see that overall rate constant that is determined from traditionalbulk kinetics experiments for an elementary reaction is an average ofmicroscopic observables, which are dependent on internal states of the reactantsand products, the relative translational energy of reactants and the productscattering angle. Their relation may be summarised as follows:
A(i) + B( j ) → C(l ) + D(n)
σ(ln/ij, vθ) State-to-state differential reaction cross section
∫ dθ
σ(ln/ij, v) State-to-state integral cross section
⎯→
⎯ ⎯→
⎯

Reaction Dynamics 209
( )∫ v vf dθ
k Tijln ( ) State-to-state rate constant
Σijln
k(T) Overall rate constant
9.4 Distribution of Velocities of MoleculesUnder ordinary conditions, the molecules of a gas have speed which are notuniform but distributed over a range. In general, the distribution of velocities ofmolecules A and B, by Maxwell law is given as
f dm
k Te di i
ii
m
k Ti( ) =
2 1/2
B
3/22
–2
i i2
Bv v v vv
π⎛⎝
⎞⎠
⎛⎝
⎞⎠ (9.8)
where f (vi)dvi at given temperature T is the fraction of the molecules of type iwhich have velocity in the range vi to vi + dvi, mi is the mass of molecule and kB
the Boltzmann constant.When we consider the collision between the molecules, each pair of colliding
molecules may be described either by the positions (rA, rB) and velocities(vA, vB) of the two particles or by the position rG and velocity vG of centre ofmass of two particles together with the position r and velocity v of the particlesrelative to the other.
The fraction of the number of A, B pairs whose relative speed is in the rangev + dv is given by
f dk T
e dk T( ) = 4 2 B
3/2– 2
2
2 Bv v v vv
π µπ
µ⎛⎝
⎞⎠ (9.9)
where µ is the reduced mass, i.e. µ = +
A B
A B
m mm m
. Now f (v)dv represents fraction
of pair of particles A and B rather than of individual particle.
9.5 Rate of Reaction for Collisions with a Distribution ofRelative Speeds
If we consider only the chemical identity and kinemetic velocity of each specieswithout considering the internal states, the overall rate constant from equation(9.5) may be written as
k T f d( ) = ( ) ( )v v v vσ∫ (9.10)
Using the Maxwell-Boltzmann distribution, i.e. equation (9.9), we get
k Tk T
e dk T( ) = 2
( ) 4B
3/2
0
–2 2
2
Bµ
π σ πµ
⎛⎝
⎞⎠
∞
∫ v v v vv
(9.11)
⎯→
⎯⎯
→⎯
⎯→
⎯⎯
→⎯

210 Chemical Kinetics and Reaction Dynamics
Again, we can replace the velocity v, by the relative kinetic energy using
the relation E = 12
2µv . Substituting the relation in equation (9.11), we get
k Tk T k T
E E e dED E
k T( ) = 1 8 ( )B B
1/2
0
–B
πµ σ⎛⎝
⎞⎠ ∫ (9.12)
9.6 Collision Cross SectionsA cross section for any specific event, such as a chemical reaction, is aproportionality factor which measures the likelihood of the event when reactantsapproach in a specified way.
9.6.1 Cross Section for Hard Sphere ModelLet us consider b as the impact parameter, i.e. distance between the centremass of B and relative velocity vector as shown in Fig. 9.2. The contributionof impact parameter from b to b + db to the collision cross section is
dσ(v) = 2πbP (b)db
The total collision cross section,therefore, is
σ π( ) = 2 ( )0
max
vb
bP b db∫ (9.13)
A
B
b
Fig. 9.2
where bmax corresponds to θ (scattering angle) = 0, (bmin) to θ = π andbmin = 0 (because hard spheres on collision produce a 180° deflection).
In hard sphere model, bmax is equal to collision diameter d and is the sumof the radii of A and B, i.e. bmax = rA + rB.
The collision cross section σ becomes equal to π(rA + rB)2 if every collision(defined by physical contact of the spheres A and B) leads to reaction, that is
P(b) = 1, 0 ≤ b ≤ bmax
P(b) = 0, b > bmax
Now, for hard sphere model the rate constant is given by
k f d r rk T k T
d = ( ) = ( + )8
= 8
A B2 B
1/2B
1/22σ π πµ
πµ∫ ⎧
⎨⎩
⎫⎬⎭
⎧⎨⎩
⎫⎬⎭
v v v (9.14)
where kB is Boltzmann’s constant and µ is reduced mass of A and B, i.e.
µ = + A B
A B
m mm m
. Thus, the rate constant is equal to the collision frequency for
two hard spheres A and B. The energy dependence of cross section for hardsphere model is shown in Fig. 9.3.

Reaction Dynamics 211
9.6.2 Collision between Reactive Hard SpheresLet us consider a collision between hard sphere molecules A and B with
relative velocity v and kinetic energy E = 12
2µv⎛⎝
⎞⎠ in centre of mass
coordinate system. The minimum approach distance between two hard spheres
dr r
= + 2
A B . The impact parameter b is given by the perpendicular distance
between parallel lines drawn in the direction of v through the centers ofmolecules A and B.
The relative velocity v can be resolved into v1 and v2, i.e. along the linesof centers and its perpendicular as shown in Fig. 9.4. The kinetic energy Emay be given as
E = 12
+ 121
222µ µv v (9.15)
where 12 1
2µv represents energy which is tangential to the surfaces of theinteracting spheres and 1
2 22µv , denoted by Ec, represents the energy directed
along the lines of centers Ec and effective in bringing out the reaction.
E0 E
σ(R)
π (rA + rB)2
Fig. 9.3
b
v
v2
v1
B
A
d
Fig. 9.4
The energy along the line of center may be given as

212 Chemical Kinetics and Reaction Dynamics
EE
br r
b r r E E br r
c2
A B2 A B c
2
A B2 = 1 –
( + ) when ( + ) or = 1–
( + )≤ ⎡
⎣⎢⎤⎦⎥
and EE
b r rcA B = 0 when > ( + ) .
The energy dependent reaction probability
P(Ec) = 0 when Ec < E*
P(Ec) = 1 when Ec ≥ E*
where E* is minimum energy threshold for the reaction to occur.The reaction cross section is given as
σ π( ) = ( )20
E P E bdb∞
∫Therefore, the expression for reaction cross section is obtained as
σ π π( ) = ( , )2 = 0 when < *
( + ) 1– *0 A B
2
c
E P E b b dbE E
r r EE
∞
∫ ⎧⎨⎩
⎫⎬⎭
⎧⎨⎩
⎫⎬⎭
⎧⎨⎪
⎩⎪(9.16)
The energy dependence of cross section for reactive hard sphere model isshown in Fig. 9.5.
Now the thermal rate coefficient is given by
k Tk T k T
E E e dEE
k T( ) = 1 8 ( )B B
1/2
0
–B
πµ σ⎛⎝
⎞⎠
∞
∫ (9.17)
Using equation (9.16), equation (9.17) can be written as
E* Eσ(E)
π (rA + rB)2
Fig. 9.5 Energy dependence of reactive cross section for reactive hard sphere model.
y2
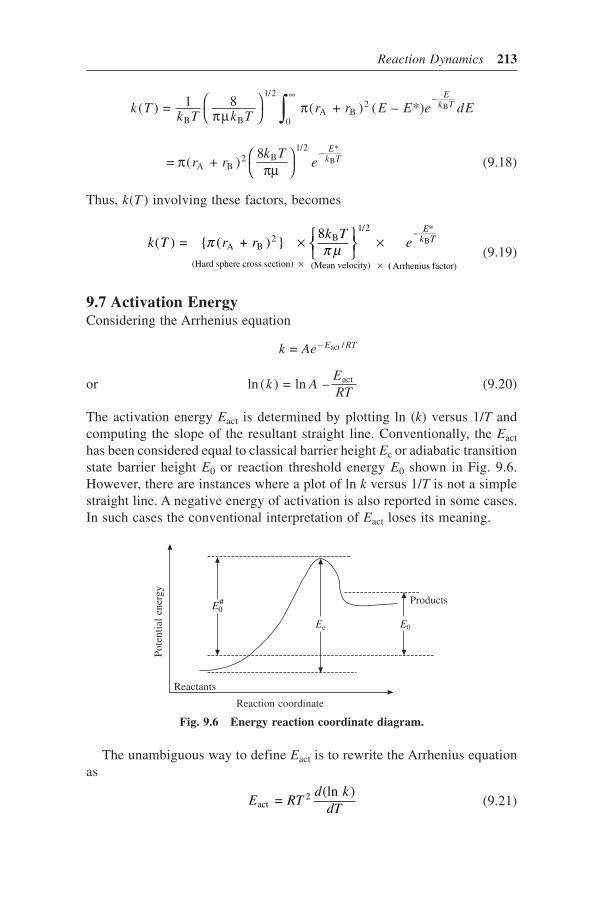
Reaction Dynamics 213
k Tk T k T
r r E E e dEE
k T( ) = 1 8 ( + ) ( – *)B B
1/2
0A B
2–
B
πµ π⎛⎝
⎞⎠
∞
∫= ( + )
8A B
2 B1/2
– *Bπ πµr r
k Te
Ek T⎛
⎝⎞⎠ (9.18)
Thus, k(T ) involving these factors, becomes
k T r rk T
eE
k T( ) = { ( + ) } 8
A B2
(Hard sphere cross section)
B1/2
(Mean velocity)
– *
Arrhenius factor)
Bπ π µ× ⎧⎨⎩
⎫⎬⎭
×× × (
(9.19)
9.7 Activation EnergyConsidering the Arrhenius equation
k Ae E RT = – /act
or ln ( ) = ln – actk AERT
(9.20)
The activation energy Eact is determined by plotting ln (k) versus 1/T andcomputing the slope of the resultant straight line. Conventionally, the Eact
has been considered equal to classical barrier height Ec or adiabatic transitionstate barrier height E0 or reaction threshold energy E0 shown in Fig. 9.6.However, there are instances where a plot of ln k versus 1/T is not a simplestraight line. A negative energy of activation is also reported in some cases.In such cases the conventional interpretation of Eact loses its meaning.
The unambiguous way to define Eact is to rewrite the Arrhenius equationas
E RTd k
dTact2 =
(ln )(9.21)
Fig. 9.6 Energy reaction coordinate diagram.
E0#
Ee E0
Products
Reactants
Reaction coordinate
Pot
enti
al e
nerg
y

214 Chemical Kinetics and Reaction Dynamics
A generalized relationship between the activation energy and the energyof colliding systems can be obtained from the derivative of ln k with respectto T.
Again, we have
k T k T X Xijln
ijln
j( ) = ( ) A (i) B( )Σ (9.22)
where X g ei iE k Ti
A( )– / = /QAB
X g ei iE k Ti
B( )– / = /QBB
and k T f ln i j di jln ( ) = ( ) ( / ; )∫ v v vσ
Therefore,
d kdT
ddT
g ge f ln ij d
i j E k Ti j(ln ) = ln
Q Q( ) ( / ; )
A B
– / BΣ⎡⎣⎢
⎤⎦⎥ ∫ v v v vσ (9.23)
On solving the above equations, we get
d kdT
E E E Ek T
(ln ) =
{( + ) – ( + }tran int reactive collision tran int all collision
B2
⟨ ⟩ ⟨ ⟩(9.24)
where Etrans and Eint refer to the relative translational and internal energies of(A, B) pair and ⟨ ⟩ shows the appropriate averages. Such an interpretationallows for variation of Eact with temperature and therefore a plot of ln kversus 1/T shows a curvature.
For the hard sphere model, when energy collision leads to reaction, therate constant is given by
k dk T
= 82 B
1/2
π πµ⎛⎝
⎞⎠ (9.25)
Therefore, Eact = 12
RT, which shows that even when threshold energy E0 iszero, the Eact has a non-zero value. In case of line of center model, a collisionis reactive only if the component of the relative translational energy alongthe line joining the centre of mass of the two molecules exceeds E0. In caseof line of centers of model, the rate constant is given by
k dk T
e E k T = 82 B
1/2– /0 Bπ πµ
⎛⎝
⎞⎠ (9.26)
Hence,
E E k Tact 0 B = + 12
(9.27)

Reaction Dynamics 215
In general, the activation energy for a given elementary reaction is differentfrom the threshold energy. Experimentally it has also been verified in somereactions, e.g. E0 and Eact for the reaction NO + O3 → NO2 + O2 have beenobtained as 3.0 ± 0.45 kcals mol–1 and 4.2 ± 0.3 kcals mol–1, respectively.
Molecular beam experiments and also computed dynamical theories forsome reactions have shown that cross section σ varies with Etrans as shownin Fig. 9.7.
The variation of σ with Etrans is known as excitation function. It is zero forEtrans < E threshold, then rises to a maximum and then decreases. At roomtemperature (Fig. 9.8) it is the rising portion of the excitation function thatis sampled and, therefore, ⟨ ⟩Etrans reactive is greater than ⟨ ⟩Etrans all collision andthus the positive Eact is obtained. At very high temperature it is possible thathigh energy tail of the Maxwell Boltzmann distribution contributes lessresulting in the less average energy for reactive collisions than the overallaverage energy. Under such conditions, a simple bimolecular exchange reactionwill have a negative activation energy.
f(Et)
Etrans
⟨Etrans⟩reactive
⟨Etrans⟩all collision
Fig. 9.8 The positive Eact energy.
σ
π d 2
Ethreshold Etrans
Fig. 9.7 Variation of σσσσσ with Etrans for a bimolecular exchange.
π dE
E2 threshold
trans1 – ⎛
⎝⎜⎞⎠⎟

216 Chemical Kinetics and Reaction Dynamics
It is also clear that Eact can be a function of temperature and can bedifferent for different initial states of the reactants.
9.8 Potential Energy SurfaceA dynamical study of molecular collisions requires construction of theHamiltonian H = T + V, where T and V are kinetic energy (KE) and potentialenergy (PE), respectively. A knowledge of the interaction potential, therefore,is essential for the study of molecular dynamics.
The potential energy of a diatomic molecule depends on only the distancebetween two bonded atoms. The potential energy of a diatomic molecule canbe plotted in two dimensions by plotting PE as a function of the bond length.The curve is known as potential energy curve (Fig. 9.9).
PE
r
Fig. 9.9 Potential energy curve for a diatomic molecule.
When potential energy depends on more than one geometric parameter,i.e. internuclear distances, the word surface is used in place of curve, and theplot is known as potential energy surface (PES).
For a nonlinear molecule consisting of N atoms, the potential energysurface depends on 3N – 6 independent coordinates and depicts how the PEchanges as relative coordinates of the atomic nuclei involved in the chemicalreaction are varied. For example, consider the water molecule (Fig. 9.10).
Fig. 9.10
HA HBθ
r1 r2
V V r r = ( 1, 2, )θ
The potential energy of water molecule is a function of three parameters,i.e. r1, r2 and angle θ. A plot of the complete potential energy surface of awater molecule, therefore, will be four dimensional. Since we are limited tothree dimensions for plotting functions, we cannot draw the entire potential

Reaction Dynamics 217
energy surface of a water molecule in a single plot. However, we can drawparts of PES. Let if one geometric parameter, say θ, has been fixed, thenpotential energy will be a function of r1 and r2 at constant θ, and the plot willbe a three dimensional. Such a plot is a cross sectional cut of the full potentialsurface. A cross sectional plot shows how the PE of molecule changes onvariation of the some geometric variables while holding the other constant.
Potential energy surface for a chemical reaction can be obtained usingelectronic structure techniques or by solving Schrödinger equation withinBorn-Oppenheimer approximation. For each geometry, there is a PE value ofthe system.
Let us take a simple exchange reaction
A + BC AB + C(Atom) (Diatomic
molecule)(Diatomicmolecule)
(Atom)→
There are three internuclear distances rAB, rBC and rAC and a plot of thePE as a function of three independent variables requires four dimensionalspace. Therefore, we can consider that three atoms lie along a straight line.A plot of PE as a function or rAB and rBC results in a PES as shown inFig. 9.11.
V
r AB
rBC
A + BC AB + C
Endo
Exo
Neutral
Fig. 9.11 PES for a collinear system A + BC →→→→→ AB + C.
As rAB → ∞, A is separated from BC and V = VBC. As rBC → ∞, C isseparated from AB and V = VBC. As the reaction proceeds, the potentialenergy changes from BC to AB. As the reactants approach each other, thereis some repulsion leading to a maximum barrier when the three atoms aresimultaneously closed to each other. Subsequently, there is a drop in thepotential leading to the separation of the products. The maximum point iscalled the saddle point.
For an easier understanding, we can plot the PE contours in rAB and rBC

218 Chemical Kinetics and Reaction Dynamics
space as shown in Fig. 9.12. The distance rBC (as rAB → ∞) is minimumalong rBC and similarly rAB is the minimum along rAB (as rBC → ∞). If wefollow from one minimum various stages along the reaction, and mark allthe minimum, we obtain the minimum energy path. The dashed line inFig. 9.12 represents the minimum energy path. When we plot the PE valuesalong the minimum energy path (MEP) against the distance along the MEP, weobtain the plot shown in Fig. 9.13. This is called the potential energy profile.
Fig. 9.12 PE contours for A + BC →→→→→ AB + C reaction.
rABrAB0
VBC entryA + BC
rBC
rBC0
AB + CVAB exit
The top of the profile is maximum (saddle point) and is referred as thetransition state in the conventional transition state theory. It is called a saddlepoint because it is maximum along the orthogonal direction (MEP) while itis minimum along diagonal direction of Fig. 9.12. The minimum energy pathcan be located by starting at the saddle point and mapping out the path of thedeepest descent towards the reactants and products. This is called the reactionpath or intrinsic reaction coordinate.
PE
Reaction coordinate
A – B – C
A – B + CA + B – C
Fig. 9.13 PE profile.

Reaction Dynamics 219
Other type of potential energy surface has a potential energy well (minimum).Fig. 9.14 shows the contour map for this type of potential energy surface.The corresponding potential energy profile is given in Fig. 9.15. Some specialreactions may have both, minimum and potential energy barrier, i.e. saddlepoint.
rAB
rBC
VBC
VAB
Well8 6
Fig. 9.14 PE contours for a reaction having PE well.
9.8.1 Features of Potential Energy SurfaceThe potential energy profile and also the location of saddle point appearsdifferent for exo- and endothermic reactions. In general, the saddle point islocated in the entry channel for an exothermic reaction as shown in Fig. 9.16.For example, reaction F + H2 → FH + H. The shift in location of the saddlepoint from symmetric position has also been related to the magnitude of theexo (endo) thermicity.
In an exothermic reaction there are two possibilities of releasing the energy.In one, the energy is released as the reagents approach and in other, it isreleased as the products separate. In the former case, the potential energy
PE
Reaction coordinate
A – B – C
A – B + C
A + B – C
Fig. 9.15 Potential energy profile for PES shown in Fig. 14.

220 Chemical Kinetics and Reaction Dynamics
surface is called attractive or early down hill surface while in latter it iscalled repulsive or late-down hill surface. The potential energy profiles foran attractive and repulsive surface of an exothermic reaction are shown inFig. 9.17.
Potential energy
Repulsive
AB + C
AttractiveA + BC
Reactants Reaction coordinate Products
Fig. 9.17 PE profiles for attractive and repulsive surfaces of an exothermic reaction.
In attractive PES, the barrier occurs in the early state of the reaction path,i.e. activated state is reached before there is much extension of BC bond.After the activated state is reached, the system proceeds down the exit valley,with the liberation of energy. In repulsive or late-down hill surface, theenergy is released when there is increasing separation of the products. Thus,in attractive surface the energy is released as the reagent approaches while inrepulsive surface the energy is released as the product separates. It can alsobe seen that a considerable amount of released energy passes into vibrationenergy of the product, i.e. A—B in case of attractive surface. In repulsivesurface, most of the energy released goes into translational energy of theproducts (Fig. 9.18). However, dynamical calculations have shown that forsome mass combinations a substantial amount of energy may also go intoproduct vibration.
Similarly, for an endothermic reaction, in which saddle point lies in exitchannel, we can envisage two different PES known as sudden surface andgradual surface shown in Fig. 9.19. On the sudden surface, the rise inpotential is sudden while on the gradual surface, it is gradual. The corresponding
×
rFH
r H–H
F + H2 entry channel
FH + H exit channel
Fig. 9.16 PE contours for an exothermic reaction.
Saddle point

Reaction Dynamics 221
potential energy profile for these surfaces is shown in Fig. 9.20. Thesesurfaces would be complementary to the attractive and repulsive surfaces inthe exothermic reaction.
Attractive surface Repulsive surface
A B C
C
C
B
B
A
A
C
C
C
C
A B
B
B
B
A
A
A
Fig. 9.18 Release of energy in exothermic reaction.
Fig. 9.19 PE contours for sudden and gradual surfaces.
rBC
rAB rAB
×
A + BC
Sudden
AB + C AB + C
Gradual
A + BC
×
PE
AB + C
A + BC
Potential energy
Gradual
Reactants Products
Sudd
en
Fig. 9.20 PE profiles for gradual and sudden surfaces.
Saddlepoint

222 Chemical Kinetics and Reaction Dynamics
9.8.2 Ab initio Calculation of Potential Energy SurfaceTaking the Born-Oppenheimer approximation into consideration, the molecularwave function may be written as
ψ = ψe(r, R) ψn(r, R) (9.28)
where ψe is the electronic wave function that depends on electron coordinater and nuclear coordinate R and ψn is the nuclear wave function. The electronicSchrödinger equation for the molecule is written as
(T + VR + VA)ψe = Ee(R)ψ (9.29)
where T is the electron kinetic energy, VR the electron-electron repulsionenergy, VA electron-nuclear attraction energy. The solution of above equationat a particular nuclear configuration R gives the electronic energy Ee forconfiguration. The sum of Ee and nuclear-nuclear repulsion energy VR, i.e.Ee + VR, is the total energy in which the nuclei move with kinetic energy T.Thus, at different nuclear configurations, the total energy can be determinedand complete potential energy surface may be obtained.
(a) London-Heitler MethodLondon (1928) was first to apply this idea to a chemical reaction. Londonand Heitler developed a simple quantum mechanical treatment of hydrogenmolecule, according to which, the allowed energies for H2 molecules are thesum and differences of two integrals as
E = A ± α (9.30)
where integral A is coulombic energy and integral α represents the exchangeenergy. The coulombic energy is roughly equivalent to the classical energyof the system. The exchange energy appears in quantum mechanics andrepresents the energy due to exchange of electrons. A and α are negative atordinary internuclear distances and E represent the energy relative to separatedatoms. The lowest energy of most stable state is, therefore, obtained whenthe positive sign is taken. For a triatomic system (X-Y-Z), which might beinvolved in a simple displacement reaction, viz.
X + YZ → XY + Z
The energy E is obtained as
E A B C = + + – 12
( – ) + ( – ) + ( – )2 2 21/2
α β β γ γ α{ }[ ] (9.31)
where A, B and C are coulombic energies and α, β and γ are ‘exchange’energies as shown in Fig. 9.21.
Equation (9.31) is known as London equation and has been used byEyring and Polanyi (1931) in their semiempirical calculation of a PES forH-H-H system and then used by many workers for a variety of reactions. The

Reaction Dynamics 223
semiempirical treatments, although based on quantum mechanical theory,make use of experimental results and adjustments have been made to obtainmore satisfactory results.
(b) London-Eyring-Polanyi (LEP) MethodOn the basis of London equation (9.31), Eyring and Polanyi calculated thepotential energy surface, which is known as London-Eyring-Polanyi (LEP)surface. In this treatment, the coulombic energy A and exchange energy α fora diatomic molecule have been assumed to be the constant fractions of thetotal energy E for all internuclear distances. The Morse equation (9.32) usedin relating the potential energy to the inter-nuclear distance r is
E D e er r r r = [ – 2 ]–2 ( – ) – ( – )0 0β β (9.32)
where r0 is the equilibrium internuclear distance, D the classical dissociationenergy and β a constant.
The total energy E, thus, can be obtained readily as a function of internucleardistance r from analysis of spectroscopic data and Morse equation. Eyring
and Polanyi concluded that the fraction P PA
A where =
+ α⎛⎝
⎞⎠ is roughly
constant at 10-15% over a range of interatomic distance. Therefore, for anytriatomic configuration it is possible to evaluate the coulombic and exchangeenergies for each pair of atoms on the basis of spectroscopic value of totalenergy. Thus, the values of A, B, C, α, β and γ can be determined and puttingthese values in London equation, the required energy of triatomic speciesmay be evaluated.
Fig. 9.21 A triatomic complex XYZ. Energy of diatomic molecule YZ with X isinvolved in A + ααααα, where A is coulombic energy and ααααα the exchangeenergy. The energy of other diatomic molecules may be representedaccordingly.
X
Y
Z
A + α
B + β
C + γ

224 Chemical Kinetics and Reaction Dynamics
(c) London-Eyring-Polanyi-Sato MethodSome unsatisfactory feature, viz. potential energy basins appeared when theassumption of constant coulombic and exchange fractions, was made by Eryingand Polanyi. Sato proposed an alternative method by considering ρ (fractionconstant) as a function of internuclear distance r. He also modified the Morseequation by changing the sign between two exponential terms from minus toplus and dividing the expression by two and used the following relations:
ER = A – α (9.33)
where ER is energy for repulsive state of diatomic molecule BC and modifiedMorse equation
E D e er r r rR
–2 ( – ) – ( – ) = 2
[ + 2 ]0 0β β (9.34)
Thus, the energy value obtained by equation (9.34) can be set equal to A – α.In ground state the energy obtained by equation (9.34) is equal to A + α.Therefore, the values of A and α can be evaluated for various internuclearseparations without assuming a constant ratio ρ. For the triatomic systemA-B-C, Sato used the following equation:
ES
= 11 +
A + B + C 12
[( – ) + ( – ) + ( – ) ]22 2 2
1/2
± ⎧⎨⎩
⎫⎬⎭
⎛⎝⎜
⎞⎠⎟
α β β γ γ α (9.35)
where S is an overlap integral.For different systems, various values of S have been used by Sato. The
Sato method leads to surfaces free from basins and preferable to LEP method.
(d) Bond-Energy-Bond-Order (BEBO) MethodJohnson and Parr proposed a bond-energy-bond-order approach for determiningthe PES for hydrogen transfer reactions. The method is based on the assumptionsthat: (a) the amount of chemical bonding, as reflected in the individual bondorders nb and nf (where nb and nf are the order of the bonds being broken andformed), is a constant, e.g. nb + nf = 1 along the reaction coordinates, (b) thetotal interaction potential can be expressed as a sum of three diatomic potentialand (c) empirical relations like Pauling’s rule and Badger’s rule can be usedto calculate bond energies etc. from structural and spectral data.
One such relation given by Pauling is
R = R0 – 0.26 ln n (9.36)
where R0 is single bond length for a bond connecting two particular atoms.Bond D can be related to single bond energy D0 as
D = S0nρ (9.37)
where ρ is a constant and is known as bond index.

Reaction Dynamics 225
9.8.3 Fitting of ab initio Potential Energy SurfacesA dynamical study of molecular collision requires a detailed knowledge ofthe interaction potential as an input. Ab initio potential energy (PE) valuesfor a chemical reaction for different geometries are usually reported in theform of table of numbers resulting from sophisticated electronic structurecalculations. However, for use in dynamical calculations, the PES must beknown in some convenient analytical or numerically interpolated form, whichis capable of generating potential and its derivatives accurately and efficientlyat any arbitrary geometry.
The various analytic functions and numerical interpolations depending onnumber of independent variables have been used for fitting the potentialenergy surfaces.
In earlier years, the simple empirical functions with a minimum numberof parameters were used to represent PE curves. Some of the simple functionsare follows.
(a) Lennard-Jones FunctionIn this function
V Dr r
= 4 – 12 6
σ σ⎛⎝
⎞⎠
⎛⎝
⎞⎠
⎡
⎣⎢
⎤
⎦⎥ (9.38)
where D is the well depth and σ the value of r at which potential energy Vbecomes zero. However, in this function there are not enough parameters toadequately reproduce an exact potential. Also there is not much flexibility inthe function form except to treat power (12 and 6) as variable parameterdone by Varshni as
v = – 2e2
eDrr
rr
m m⎛⎝
⎞⎠
⎛⎝
⎞⎠
⎡
⎣⎢
⎤
⎦⎥ (9.39)
(b) Buckingham FunctionIn Buckingham function
V = Ae–αr – Br–n (9.40)
where commonly n = 6.At short range, a plot of ln V versus r will be a straight line with a slope
(equal to α) and an intercept (equal to A) and thus the value of A and α forBuckingham potential can be determined. The point where the potential Vbecomes zero would fix the value of B (when n = 6 or any other fixed value).The function can be made more flexible by modifying as
V = Ae–αr – Br–6 – Cr–8 – Dr–10 (9.41)
The different r–n terms in the modified function are not linearly independentand, therefore, inclusion of additional terms does not guarantee the improvementin the fit. Buckingham function also suffers from the fact that as r → 0,

226 Chemical Kinetics and Reaction Dynamics
V → –∞. This is clearly unphysical except in the united atom limit. However,generally it does not affect the result of interest to the chemists.
(c) Morse FunctionIn this function, we have
V D e er r r r = [ – 2 ]–2 ( – ) – ( – )e eβ β (9.42)
The three parameters in the Morse function D, B, re are positive and areusually chosen to fit the bond dissociation energy, the harmonic vibrationalfrequency and the equilibrium bond length. At r = re, the Morse functionV = 0. As r → D, V approaches D. For r << re, V is large and positive,corresponding to short range repulsion. Although the Morse function hasbeen used extensively, its representation of the potential away from re is notsatisfactory. Several modifications have been proposed in Morse function.
(d) Extended Rydberg (ER) FunctionMurrell and Sorbie have proposed an extended Rydberg function as
V D e = – [1 + + + . . .]1 22 –( )1α ρ α ρ α ρ (9.43)
where ρ = r – re.It is better than Morse function, because multiplying the exponential term,
bypolynomial convergence can be checked by adding more terms bypolynomial. This function can be linearised. A plot of ln V versus r will givethe value of D and α1.
Various other PE functions have been proposed. However, they are morecomplicated and require large amount of ab intio data. Most of the functionsare not easily extendable to higher dimensions.
9.8.4 Potential Energy Surfaces for Triatomic SystemsAlthough ab initio PESs are available for a few exchange reactions of typeA + BC → AB + C, surfaces at different levels of accuracy have beenreported for a variety of systems. Some of the functional forms are discussedas follows.
(a) London-Eyring-Polanyi-Sato (LEPS)The PE function was proposed by London for H + H2 → H2 + H, collinearsystem and subsequently was modified by Eyring, Polanyi and Sato. Onewidely used form of the LEPS function is given by
( , , ) = 1 +
+ 1 +
+ 1 + AB AC BC
AB
AB
BC
BC
AC
ACVr r r
QS
QS
QS
– 12 1 +
– 1 +
+1 +
– 1 +
AB
AB
BC
AB
2BC
BC
AC
AC
2JS
JS
JS
JS
⎛⎝
⎞⎠
⎛⎝
⎞⎠
⎡
⎣⎢
⎧⎨⎪
⎩⎪

Reaction Dynamics 227
+1 +
– 1 +
AC
AC
AB
AB
21/2
JS
JS
⎛⎝
⎞⎠
⎤
⎦⎥⎫⎬⎪
⎭⎪(9.44)
where Q, J and S are referred to as coulomb, exchange and overlap integrals,Q and J are determined from Morse and anti-Morse function, respectively, asfollows:
Q J D e er r r re e
i i i–2 ( – – ( – + = { –2 }i i i i i iβ β) ) (9.45a)
Q J D e er r i r re e
i i i–2 ( – ) – – ) – = 1
2{ + 2 }i i i i iβ β (
(9.45b)
The original LEPS forms of Sato has SAB = SBC = SAC. In this extendedform these S parameters are allowed to differ to give more flexibility in thefunction. It was also observed that changing the sign between two exponentialterms of the Morse potential equation (9.45b) from minus to plus and dividingthe resulting expression by 2, gives a function which reasonably fits therepulsive potential curve of the first excited state of H2. The LEPS equationhas been applied to a large number of systems for which spectroscopic dataare available. It has limited flexibility and does not correctly represent surfacesfor a number of AB+C reactions.
(b) DIM (Diatomic-in-Molecules) ApproachA function, which is similar to the London equation and based on the diatomic-in-molecules approach was first used by Kuntz to fit the ab initio surface forcollinear reaction
He + H HeH + H2+ +→
and is expressed as
V Q Q Q J J J(r r ,r ) 1 2 3 1 32
22 1/2
1, 2 3 = + + – [( – ) + ]
Q r E r E ri i12
1i
2i( ) = [ ( ) – ( )] (9.46)
J r E r E ri i12
1i
2i( ) = [ ( ) + ( )]
E r pD e per r r–r( ) = [ {2 + }]– ( – ) – ( )0 0β β
where p = ± 1 for repulsive and attractive interactions, respectively.The DIM function has the advantage that it provides reasonable PE values
at geometries for which there are no ab initio data available. The DIMfunction has also a provision for describing the nonlinear geometries evenwhen no ab initio input was available for such configurations.

228 Chemical Kinetics and Reaction Dynamics
(c) Sorbie-Murrell (SM) FunctionSorbie and Murrell have developed a function for triatomic systems based ona many body expansion of PE. It has been applied to repulsive potentials aswell and has become an attractive option for fitting ab initio PES. It hassufficient flexibility and extendable to higher polyatomic systems and totwo-valued surfaces. The potential for triatomic system is decomposed intoone-, two- and three-body terms. The potential is given as
V(r1, r2, r3) = VA + VB + VC + VAB(r1) + VBC(r2)
+ VCA(r3) + VABC(r1, r2, r3) (9.47)
The monoatomic terms are constant and can be taken as zero in theirground states. For diatomic terms extended Rydberg (ER) can be used. Thethree-body term is expressed as a polynomial multiplied by a product ofswitching functions
V r r r s s s SiABC 1 2 3 1 2 3 =1
3
i i( , , ) = ( , , ) 1 – tanh 12
ρ γΠ ⎛⎝
⎞⎠ (9.48)
where S r ri i i0 = – is the displacement in bond length from a reference
configuration, ρ a polynomial usually contains up to quartic terms in
S S S i j k ui j k1 2 3 , ( + + )≤ 1 – tanh
2i iγ S⎛
⎝⎞⎠ is switching function goes to zero
for large S i and γ i is the coefficient in the polynomial P to be determined.The switching function has the advantage that for large negative S, itremains finite while for large positive, it becomes zero and proper diatomiclimits of the potential are obtained.
(d) Blais and Bunker FunctionBlais and Bunker developed an analytic function for A + BC → AB + Creactions by using Morse function and a switching function.
V D e D er r r r = {1 – } + {1 – }AB– ( – ) 2
BC– ( 2AB AB AB
0BC BC BC
0β β –
+ [1 – tanh( )] + BC AB+C– ( )
AB– ( )BC BC BC
0AC AC AC
0D ar e D er r r rβ β– – (9.49)
The first two terms are Morse potentials for A-B and B-C bonds. The thirdterm attenuates the alteration between B and C as A approaches by means ofswitching function. The last term supplies a repulsive interaction between Aand C. The switching function tends from 0 to unity as rAB varies from largeto smaller value.
A number of other analytic potential functions such as Rotated-Morse-Curve-Spline (RMCS), Bond-Energy-Bond-Order (BEBO) have been usedfor fitting of ab initio surfaces.

Reaction Dynamics 229
(e) Numerical FunctionsIt has been observed that a numerical function seems to be better than variousanalytic functions because the former can be applied to almost any system aslong as the dimensionality of the PES is accounted for the dimensionality ofthe function or of the interpolation technique. Further, if more ab initio databecomes available, for the same system, the numerical interpolation can berevised readily while in case of an analytic function, the parameters have tobe determined all over again. The parameters determined already do notnecessarily lead to a quick convergence with the addition of more ab initioPE values and, therefore, sometimes the topological features may change. Anumerical function has been better suited in all such cases. The methods forinterpolation data can be global or local. In global methods the value ofinterpolation function depends on all the data while in local method thevalue of interpolating function depends only on the data at nearly points.Commonly used numerical interpolation scheme is the ‘cubic spline’ providedby McLaughlin and Thompson who used spline functions to represent the
potential of HeH+ + H2 → He + H3+ .
The utility of spline functions to molecular dynamic studies has beentested by Sathyamurthy and Raff by carrying out quassiclassical trajectoryand quantum mechanical calculations for various surfaces. However, theaccuracy of spline interpolation deteriorated with an increase in dimensionfrom 1 to 2 to 3. Various other numerical interpolation methods, such asAkima’s interpolation in filling ab initio PES for reactive systems, have beenused.
9.9 Classical Trajectory CalculationsThe evaluation of the reaction cross sections as a function of the initialstate of the reactants and final state of the products has been described byKarplus, Porter and Sharma (1965), and Greene and Kuppermann (1968)using classical equations of motions for interacting species. For a givenpotential V(r1, r2, r3), a set of initial coordinates and momenta for the particlesdetermine uniquely the collision trajectory and the occurrence of reaction.The method is described as follows.
For a three-body system such as A + BC → AB + C, there are 3 × 3 = 9degrees of freedom in the problem. However, three degrees of freedom canbe eliminated by considering the centre of mass coordinates. If we consider
(a) (q1, q2, q3) the cartesian coordinates of particle C with respect to Bas origin.
(b) (q4, q5, q6) the cartesian coordinates of particle A with respect tocentre of mass of the pair (B, C) as origin.
(c) (q7, q8, q9) the cartesian coordinates of centre of mass of the entirethree particle system.
(d) (p1, p2,. . ., p9) momenta conjugate to the coordinates (q1, q2, …., q9).

230 Chemical Kinetics and Reaction Dynamics
The full Hamiltonian for three body problem is given as
H p p p p p p V q q q = 12
[ + + ] + 12
[ + + ] + ( ,. . . )BC
12
22
32
A,BC42
52
62
1 2 6µ µ(9.50)
where 1 = 1 + 1 and 1 = 1 + 1BC B C A,BC A Cµ µm m m m
Although the derivative of the potential energy with respect to qi (i = 1,2, …, 6) are required in equation (9.50), the potential energy as an explicitfunction of internuclear distances, i.e. V(rAB, rBC,, rAC), where rAB, rBC andrAC are A-B, B-C and A-C internuclear distances, respectively, can be usedby introducing the relations between rAB, rBC, rAC and qi (i = 1, 2, . . . , 6).
The potential energy functions are expressed in terms of qi (i = 1, 2, …, 6),which explicitly exhibits its independence of the coordinates of the centerof mass. Again, since the momenta conjugate to coordinates (q7, q8, q9),i.e. p7, p8 and p9 remains constants of motion during the entire collision, theterm containing them in the Hamiltonian has been subtracted.
The Hamilton’s equations for three-body system described by the generaldynamical coordinates qipi are
dqdt
qHp
dpdt
pHq q
ii
i
ii
i i = = ; = = – = –
∂∂
∂∂
∂∂
v(9.51)
Thus, for determination of time variation of qi and pi, the integration of 12simultaneous differential equations are required. Further, reduction in numberof dynamical equations by use of conservation of energy or total angularmomentum is not worthwhile since the remaining equations become morecomplicated to solve.
9.9.1 Initial State PropertiesTo specify and define the initial state of collision, z-axis may be selected asthe direction of the initial asymptotic relative velocity vector vR as shown inFig. 9.22.
The coordinate system may be oriented so that the atom A and centre ofmass BC lie in the Y-Z plane. This gives the simple forms
p40 = 0 q4
0 = 0
p50 = 0 q5
0 = 0 (9.52)
p60
A,BC R = µ v q r b6
0 2 2 1/2 = –( – )
where r is initial distance between A and center of mass BC, b is impactparameter, r should be greater than or equal to r0, i.e. reaction shell radius r0

Reaction Dynamics 231
For the determination of the initial state of the molecule, the values of sixvariables qi, pi (i = 1, 2, 3) have to be selected. These can be written byconsidering the orientation of the molecule BC and specifying by the polarcoordinates R, θ and φ. Thus
q R10 = sin cos θ φ p1
0 =–ρ (sin φ cos η + cos φ cos θ sin η)
q R20 = sin cos θ φ p2
0 =ρ(cos φ sin η – sin φ cos θ sin η) (9.53)
q R30 = cos θ p3
0 = sin sin ρ θ η
where R is initial BC distance, ρ22
2 = (1 + 1)J h
R is proportional to square of
rotational angular momentum of BC and η is the angle between the vector(RBC × Z) and the rotational angular of BC.
The reactant molecule BC is specified to be in an initial vibrational v androtational state J, which determines ρ and allows R to be set to the maximumbond extension compatible with total vibrational energy. The initial relativevelocity vR may be varied systematically or it may be chosen at random fromBoltzmann distribution function. The orientation angle, which specify rotationalphase and impact parameter b are selected at random.
The vibrational phase v is characterised by selecting r0 at random fromthe interval between r0 and r0 R
0 + v τ, where τ is the vibrational period ofBC.
Thus, the initial trajectory is determined by variables vR, b, r (or q6), v, J,R, θ, φ and η. Depending upon the reaction attributed under consideration,different procedures may be used for specifying the initial variables.
Monte-Carlo method has widely been used for random sampling for manyof the initial conditions in these calculations.
Z
Y
X
Abv0
r0
Cθ
φB
R
Fig. 9.22
should be chosen so that the interaction potential between A and BC isinitially zero and trajectory in integrated forward unit r (t) is sufficientlylarge so that the interaction potential is once again zero.

232 Chemical Kinetics and Reaction Dynamics
9.9.2 Final State PropertiesAfter defining the initial values of the dynamical variables, we can definethe final state of collision trajectory as the state in which system leaves thereaction shell, i.e. by inspecting when the distance between any one of theatoms and center of mass of the other two atoms is equal to r0. This willreflect which atom is bound to which other atom.
When the reaction is complete, let the final molecule be AB. The finalenergies, the components of velocity of atom C relative to that of the moleculeAB, final angular momentum of AB etc. can be determined by calculatingclassical expectation values over a few cycles of motion. If molecule AC isformed in the reaction, the corresponding expressions can be desired.
9.9.3 Calculation of Reaction Cross SectionLet us consider a collinear reaction
A + BC → AB + C
Let rAB, rBC and rAC be the internuclear distances for the pairs AB, BC andAC, respectively. As the reaction proceeds, these distances change withtime. Before the reactants have approached each other, rAB and rAC are largecompared to rBC. After the collision, if collision is non-reactive, rAB and rAC
again become large compared to rBC as the collision partners move awayfrom each other. However, if the collision is reactive, initially rAB and rAC
are large compared to rBC and after the collision, when the products moveaway from each other, rAC and rBC are large compared to rAB, as shown inFigs. 9.23 and 9.24. Thus, by knowing rAB, rBC and rAC as functions of time,we can know whether the reaction is reactive or non-reactive.
Fig. 9.23 Schematic diagram showing a collinear reaction A + BC →→→→→ AB + C.
Reactive collision
Non-reactive collision
Time
Center of mass
Center of mass
A
A
A
BC
CB
BC
A
BC
A
BC
AB
C
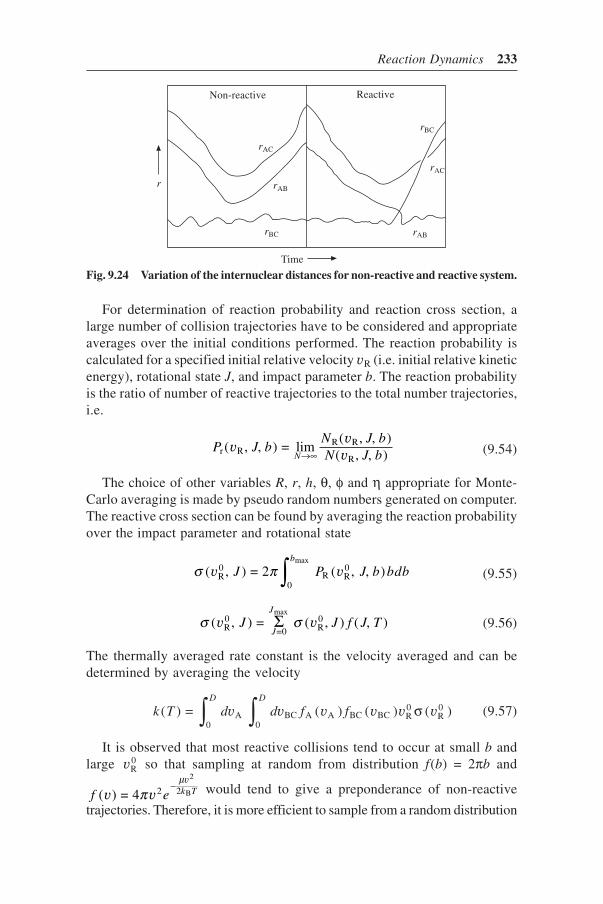
Reaction Dynamics 233
For determination of reaction probability and reaction cross section, alarge number of collision trajectories have to be considered and appropriateaverages over the initial conditions performed. The reaction probability iscalculated for a specified initial relative velocity vR (i.e. initial relative kineticenergy), rotational state J, and impact parameter b. The reaction probabilityis the ratio of number of reactive trajectories to the total number trajectories,i.e.
P J bN J bN J bNr R
R R
R( , , ) = lim
( , , )( , , )
vvv→∞ (9.54)
The choice of other variables R, r, h, θ, φ and η appropriate for Monte-Carlo averaging is made by pseudo random numbers generated on computer.The reactive cross section can be found by averaging the reaction probabilityover the impact parameter and rotational state
σ π( , ) = 2 ( , , )R0
0R R
0max
v vJ P J b bdbb
∫ (9.55)
σ σ( , ) = ( , ) ( , )R0
=0 R0
max
v vJ J f J TJ
J
Σ (9.56)
The thermally averaged rate constant is the velocity averaged and can bedetermined by averaging the velocity
k T d d f fD D
( ) = ) ( ) ( )0
A0
BC A A BC BC R0
R0∫ ∫v v v v v v( σ (9.57)
It is observed that most reactive collisions tend to occur at small b andlarge vR
0 so that sampling at random from distribution f(b) = 2πb and
f e k T( ) = 4 2–
2
2
Bv vv
πµ
would tend to give a preponderance of non-reactive
trajectories. Therefore, it is more efficient to sample from a random distribution
Fig. 9.24 Variation of the internuclear distances for non-reactive and reactive system.
r
Time
Non-reactive Reactive
rABrBC
rAB
rAC
rBC
rAC

234 Chemical Kinetics and Reaction Dynamics
of impact parameters and initial relative velocities and then account of ensembleaverages by weighting with proper distribution function.
9.10 Potential Energy Surface and Classical DynamicsThe classical description is quite different from the quantum. In classicaldynamics we describe the coordinates and momenta simultaneously as afunction of time and can follow the path of the system as it goes fromreactants to products during the collision. These paths, called trajectories,provide a ‘motion picture’ of collision process. The results of any real collisioncan be represented by computing a large number of trajectories to obtaindistribution of post-collisions properties of interest (e.g. energy or angulardistribution). In fact, the trajectory calculation means the transformation ofone distribution function (reagent distribution, pre-collision) into another(product distribution, post-collision), which is determined by PE function.
If we want to study the implications of various features of potential energysurface to dynamical results we have to carry out the dynamics. From apractical point of view, we can use classical mechanics. One numericallysolves Hamilton’s equations
pHq
qp
i Nii
ii
= – ; = , = 1, . . . , 3∂∂
∂∂
µ(9.58)
Apm
V q Ni
i
i =
2 + ( , . . . , 3 )
2
1Σ
At given V and a set of {pi, qi}, the time evolution of the system can befollowed:
q qHpi i
i+1 t = + ∆ ∂
∂ (9.59)
q qHpi i
i+1 t = – ∆ ∂
∂
The motion on the PES corresponds to an interchange of potential andkinetic energies and asymptotically rearrangement of particles in a reactivecollision. For a given {pi} we can plot the time variation of the coordinateson the top of the PE contours as shown in Fig. 9.25. These are called thetrajectories and their behavior would tell as about molecular collisions.
Eyring and Polanyi, and Eyring and Hershfeld tried to calculate therepresentative trajectories on PES for the H + H2 → H2 + H reaction butcould not succeed due to lack of computational facility at that time. In theearly sixties, three different research groups led by Bunker, Karplus andPolanyi developed the quassi-classical trajectory (QCT) approach, whichhas been proven successful except under circumstances where the quantummechanical effects like tunneling and resonance are important.
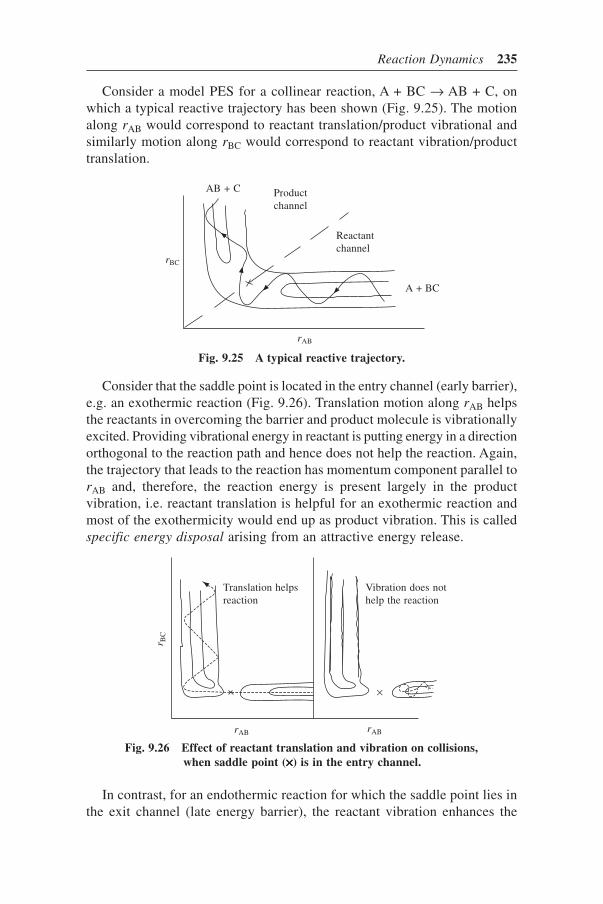
Reaction Dynamics 235
Consider that the saddle point is located in the entry channel (early barrier),e.g. an exothermic reaction (Fig. 9.26). Translation motion along rAB helpsthe reactants in overcoming the barrier and product molecule is vibrationallyexcited. Providing vibrational energy in reactant is putting energy in a directionorthogonal to the reaction path and hence does not help the reaction. Again,the trajectory that leads to the reaction has momentum component parallel torAB and, therefore, the reaction energy is present largely in the productvibration, i.e. reactant translation is helpful for an exothermic reaction andmost of the exothermicity would end up as product vibration. This is calledspecific energy disposal arising from an attractive energy release.
rAB
rBC
A + BC
Reactantchannel
AB + C Productchannel
Fig. 9.25 A typical reactive trajectory.
rAB rAB
×
Vibration does nothelp the reaction
Translation helpsreaction
r BC
Fig. 9.26 Effect of reactant translation and vibration on collisions,when saddle point (×××××) is in the entry channel.
Consider a model PES for a collinear reaction, A + BC → AB + C, onwhich a typical reactive trajectory has been shown (Fig. 9.25). The motionalong rAB would correspond to reactant translation/product vibrational andsimilarly motion along rBC would correspond to reactant vibration/producttranslation.
In contrast, for an endothermic reaction for which the saddle point lies inthe exit channel (late energy barrier), the reactant vibration enhances the
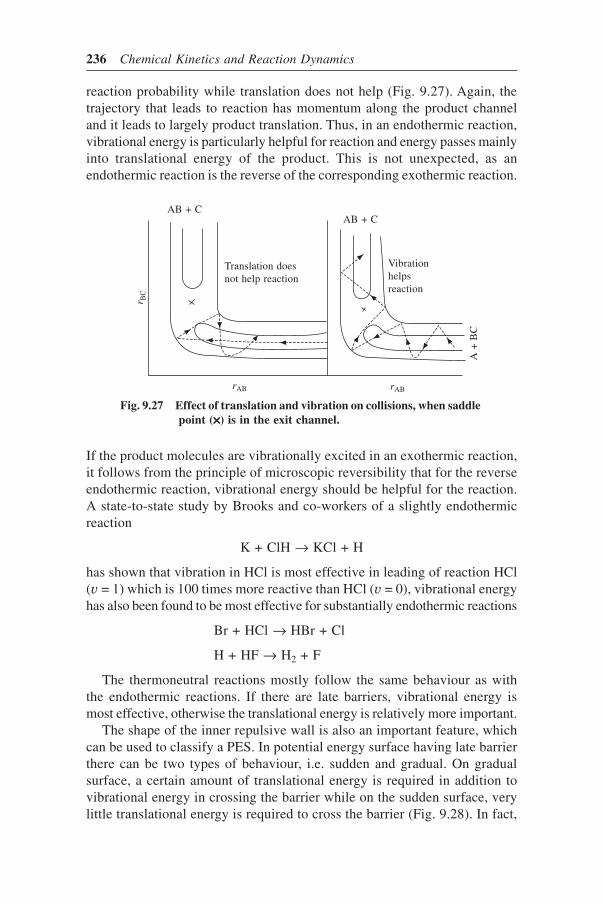
236 Chemical Kinetics and Reaction Dynamics
reaction probability while translation does not help (Fig. 9.27). Again, thetrajectory that leads to reaction has momentum along the product channeland it leads to largely product translation. Thus, in an endothermic reaction,vibrational energy is particularly helpful for reaction and energy passes mainlyinto translational energy of the product. This is not unexpected, as anendothermic reaction is the reverse of the corresponding exothermic reaction.
If the product molecules are vibrationally excited in an exothermic reaction,it follows from the principle of microscopic reversibility that for the reverseendothermic reaction, vibrational energy should be helpful for the reaction.A state-to-state study by Brooks and co-workers of a slightly endothermicreaction
K + ClH → KCl + H
has shown that vibration in HCl is most effective in leading of reaction HCl(v = 1) which is 100 times more reactive than HCl (v = 0), vibrational energyhas also been found to be most effective for substantially endothermic reactions
Br + HCl → HBr + Cl
H + HF → H2 + F
The thermoneutral reactions mostly follow the same behaviour as withthe endothermic reactions. If there are late barriers, vibrational energy ismost effective, otherwise the translational energy is relatively more important.
The shape of the inner repulsive wall is also an important feature, whichcan be used to classify a PES. In potential energy surface having late barrierthere can be two types of behaviour, i.e. sudden and gradual. On gradualsurface, a certain amount of translational energy is required in addition tovibrational energy in crossing the barrier while on the sudden surface, verylittle translational energy is required to cross the barrier (Fig. 9.28). In fact,
rABrAB
r BC
AB + CAB + C
Vibrationhelpsreaction
Translation doesnot help reaction
Fig. 9.27 Effect of translation and vibration on collisions, when saddlepoint (×××××) is in the exit channel.
A +
BC

Reaction Dynamics 237
The fraction of released energy that passes into translational and vibrationalenergies of product depends to a quite significant extent on the masscombination of reactant atoms. This mass effect is referred as kinematiceffect. In order to understand mass effect, at least for a collinear reaction, wecan transform the motion of the three particles on PES to that of a single
particle of a fictitious mass µ = ( + ) + +
A B C
A B C
m m mm m m
moving on the PES plotted
in the coordinates called scaled and skewed coordinates.The transformations used are
x = rAB + y tan θ
y = (rBC / C) cos θ (9.60)
where µ = ( + )( +
A B C
C A B
1/2m m mm m m
⎡⎣⎢
⎤⎦⎥
is called the sealing factor and
θ = sin( + )( + )
–1 A C
A B B C
m mm m m m
⎡⎣⎢
⎤⎦⎥
the skewing angle. The transformed
coordinates are shown in Fig. 9.29.For a collinear reaction
A + BC → AB + C
the system kinetic energy is diagonalized in x and y. If we use thesetransformations and, therefore, instead of solving for the motion of a threeparticle system governed by a potential, we should solve the motion of a
Fig. 9.28 Effect of vibration and translation on sudden and gradual surfaces.rABrAB
r BC
×
A +
BC
AB + CAB + C
Sudden surfacemost vibration
Gradual surfacetranslation
+Vibration
on a sudden surface, the requirement for reactant vibration is so stringentthat a vibrational threshold is expected. If we observe a vibrational thresholdfor an endothermic reaction which is a good indication that PES for reactionbelongs to the sudden category.

238 Chemical Kinetics and Reaction Dynamics
single particle of a mass µ in (x, y) coordinates. Depending on the masses ofA, B and C the scaling factor and skewing angle change. Without doing anycalculations, we can see the effect of different mass combination by examiningthe PE contours. The PE contours in scaled and skewed coordinates forH + H2 → H2 + H reaction are shown in Fig. 9.30.
Fig. 9.29 Scaled and skewed coordinates.
x
r2
r2/Cy θ
The PE contours for various mass combinations are shown in Fig. 9.31. Forreaction, heavy + heavy-light → heavy-heavy + light, the reactant channel isvery narrow and product channel very broad (Fig. 9.31a) and therefore almostevery collision leads to product (e.g. Na + ClH → NaCl + H). For reaction,light + heavy-heavy → light-heavy + heavy (e.g. H + Cl2 → HCl + Cl2), theentry channel is much wider than exit channel (Fig. 9.31b) and thereforemost of the trajectories get reflected back into entry channel and reactionprobability is small. For the mass combination, heavy + light-heavy → heavy-light + heavy (e.g. Cl + HO → ClH + O), the skewing angle is so large that
y
rH–H
× H + H2
H2 + H
rH–H/C
Fig. 9.30 PE contour diagram for H + H2 →→→→→ H2 + H in scaled andskewed coordinates.
x

Reaction Dynamics 239
the product channel is bent over the reactant channel (Fig. 9.31c) and everycollision leading to the product has a good chance of returning to reactantsand vice-versa. Therefore, the atom and the diatom collide with each otherrepeatedly with a nearly statistical outcome for the reaction.
Fig. 9.31 PE contours scaled and skewed coordinates for three differentmass combinations. L: light atom; H: heavy atom.
rAB
(a)
rAB
(b)
rAB
(c)
HH + L
H + HL
×
rBC/C
LH + H
L + HH
rBC/C
×
H + LH
×
rBC/C HL + H
The mass effect can also explain the reactivity of two ends of molecule inits reaction. For example, in reaction
F + HD → FH + D (a)
F + HD → FD + H (b)
It has been found that under identical conditions, FD formation is favoured.This has been observed that the PES plot on scale and skewed axis gavewider product channel in case of reaction (b), which explained the preferenceof formation of FD when compared to FH.
9.11 Disposal of Excess EnergyThe matter of special interest that arises, especially in relation to state-to-

240 Chemical Kinetics and Reaction Dynamics
state studies, is “what happens to energy that is in excess of that required tocross the barrier”.
It appears, for all types of reactions, that there is a tendency for excess oftranslational energy to appear as translational energy in the product and forexcess of vibrational energy to appear as vibrational energy in the products.This effect has been referred to as adiabaticity. Such a vibrational adiabaticitycan be understood in terms of collinear model. Increasing vibrational energyin reactant results in the trajectory traversing through additional regions ofthe PES and in particular ‘cutting the corner’ and thereby increasing vibrationalenergy in the product. The excess energy causes the trajectory in region ofthe activated state to correspond to a more extended A·····B·····C configurationthat would otherwise be the case. The system thus ‘cut the corner’ on PES asillustrated in Fig. 9.32.
rAB
rAB
Fig. 9.32 A trajectory showing cutting the corner.
9.12 Influence of Rotational EnergyThe rotational energy is expected to play a less important role in chemicalreactions due to the following two factors:
(i) The amount of rotational energy residing in a molecule in usuallymuch less compared with the vibrational and transactional energy.
(ii) The rotation in a molecule is dissipated so rapidly that it is not easyto maintain the molecule in a specified rotational state.
However, the experimental studies for some reactions have shown that reactantrotation is also crucial in deciding the collisional outcome. For example, forreaction
K + ClH → KCl + H
an increase in rotational quantum number ( j from 1 to 4) at a fixed vibrationalquantum number (v = 1) resulted in a steady decrease in the reaction rate.

Reaction Dynamics 241
For higher j, rate of reaction increases with further increase in j. The initialdecline in the rate has been explained on the basis that as the rotational speedincreases, the preferred orientation of the reaction decreases causing a decreasein reaction probability. A subsequent increase in rotation results in preferredorientations again during the approach of the reactants and this can give riseto enhanced rates at higher j. The influence of reactant rotation on variousreaction attributes has been reviewed by Sathyamurthy.
9.13 Experimental Chemical Dynamics
9.13.1 Molecular Beam TechniqueOne of the first approaches to study the microscopic kinetics i.e. state-to-state cross sections and reaction probabilities of a chemical reaction was thecrossed molecular beam experiments. The principle of the method consistsof intersecting two beams of the reactant molecules in a well-defined scatteringvolume and catching the product molecules in a suitable detector (Fig. 9.33).
Fig. 9.33 Molecular beam-scattering apparatus.
ReactantA
B
C
VReactant
Product
The beams of reactant molecules A and B intersect in a small scatteringvolume V. The product molecule C is collected in the detector. The detectorcan be rotated around the scattering centre. Various devices may be insertedin the beam path, i.e. between reactants and scattering volume and betweenscattering volume and product species to measure velocity or other properties.The angular distribution of the scattered product can be measured by rotatingthe detector in the plane defined by two molecular beams. The massspectrophotometer can also be set to measure a specific molecular mass sothat the individual product molecules are detected.
Supersonic molecular beams are used to produce velocities of the moleculesin the reactant beams. For generating the supersonic molecular beam, the

242 Chemical Kinetics and Reaction Dynamics
dilute mixture of reactant molecule with an inert gas (commonly He and Ne)is taken at high pressure. The mixture is allowed to pass through a smallnozzle into vacuum chamber. A skimmer (a small pinhole) is used so that acollimated beam of reactant molecule is directed towards the collision regionas shown in Fig. 9.34.
Skimmer Collimeter
Dilute reactant+
Inert-gas mixtureat high pressure
Fig. 9.34
The supersonic molecular beam generates a collection of molecules witha high translational energy but a very small spread (a narrow, non-equilibriumvelocity distribution). In addition to this, the molecules can be prepared withlow rotational and vibrational energies. The reactive velocity of reactants isspecified in crossed molecular beam experiments. The relative velocity orcollision energy of the reactants may be changed by varying the conditionsunder which the molecular beams are generated. By measuring the productas a function of collision energy, the energy dependent reaction cross section,i.e. σ(E ) can be determined. The product molecules formed moves awayfrom collision region. The motion of product is determined by following thelaws of conservation of mass, linear momentum and energy.
Counting the number of molecules of a particular product arriving at thedetector as a function of time after collision, the velocity distribution of theproduct molecules can be resolved. and by knowing the total number ofproduct molecules as a function of the scattering angles, angular distributionof the product molecule can be determined. Measuring the velocity distributionor angular distribution of the product molecules many of the moleculardetails of gas-phase reactive collision can be determined.
For measuring inelastic quantum transition in scattering between thereactants, the state change method may also be applied in which the moleculesare prepared in a definite state before scattering and are then analysed fortheir final quantum state after scattering by an appropriate state filter whichpermit only molecules at the desired state to arrive at the detector. Theresolving power is usually very high and largely independent to beam velocities.
The first bimolecular reaction studied in crossed molecular beams wasbetween Cs and CCl4, which was studied by Bull and Moon in 1954. Taylorand Datz and later Greene, Robert and Ross investigated
K + MBr → KBr + H

Reaction Dynamics 243
reaction in detail and obtained information about collision yield and activationenergy. Thereafter, a large number of reactions have been studied usingcrossed molecular beams and results are contributed greatly in understandingelementary chemical reactions.
Sometimes the atoms (or molecules) in molecular beams are put intoselected electronic, vibrational and rotational states. The initial state selectioncan be made with lasers. A laser beam of appropriate frequency is shinedonto a molecular beam and the molecule goes onto an appropriate excitedstate. The efficiency of selection depends upon the absorption coefficient. Wecan attain sufficient absorption to get highly vibrationally excited molecule withthe laser. A spin forbidden transition can also be achieved by using a laser.
9.13.2 Stripping and Rebound MechanismsThe reactions of the alkali-metal atoms with halogens such as
K + Br2 → KBr + Br
Cs + I2 → CsI + I
were found to have very high cross sections of over 100 Å2 and occur whenthe reactants are fairly apart (~5 Å). Molecular beam experimental studies ofthese reactions showed that the products in these reactions, are scatteredforward with respect to centre of mass of the system as shown in Fig. 9.35.
Fig. 9.35 Direction of motion of reactants and products relativeto centre of mass (stripping mechanism).
Centre of mass
BCAB
CA
θ
A and BC approach to the centre of mass, A strips off B and then A andC continue to move almost undisturbed in their original direction. Thesetype of reactions are said to occur by a stripping mechanism when PES areattractive.
In contrast, certain reaction such as
K + CH3I → KI + CH3
have lower cross section (~10 Å2) exhibit backward scattering as shown inFig. 3.6.

244 Chemical Kinetics and Reaction Dynamics
A and BC approach to centre of mass, A strips off B and then AB and Creturn roughly in the direction from which they came. These reactions aresaid to occur by a rebound mechanism and generally occur when the surfaceare repulsive. In such reactions the life-time of activated complex, i.e. (A···B···C)must be short and reaction is said to be direct or impulsive. If life-time ismuch, rotation may occur and the products may separate in random directions.For many such reactions, the life-time of complexes has been observed lessthen 5 × 10–13sec. J.C. Polanyi discussed the relationship of these reactionswith shapes of PES with special attention to mass effects.
Fig. 9.36 Direction of motion of reactants and products relativeto centre of mass (rebound mechanism).
Centre of mass
ABA
C BC
9.13.3 State-to-State KineticsVarious reactions in which the reactants are in particular vibrational androtational states have been investigated and state-to-state kinetics have beenstudied. Two procedures have been used in these investigations. Brooks andcoworkers first employed the molecular beam method for studying the state-to-state kinetics. The reactants molecules are put into desired vibrational androtational states by laser excitation and identified the states by their fluorescence.In molecular beam experiments, it is possible to control the translationalenergy and mutual orientation of the reactants and to determine the degree ofpolarization of the rotational angular momentum of the product.
Polanyi and co-workers used the technique, which involved the experimentsin bulk. The reactants are put into desired vibrational and rotational states byproducing them in an exothermic pre-reaction. For example, OH radical invibrational excited states can be formed by the reactions
H + NO2 → OH (v = 1 to 3) + NO
H + O3 → OH (v = 6 to 9) + O2
The course of reactions was followed either by determining productconcentrations by monitoring their infrared chemiluminescence or by

Reaction Dynamics 245
luminescence, i.e. by following the decrease in the luminescence of thereactant molecules, which had been excited vibrationally and rotationally.
The molecular beam method has an advantage as compared to bulk methodbecause translational energy can be controlled in the molecular beam method.However, in bulk method the reactant molecules can be formed in muchwider range of vibrational and rotational states.
Brook and co-workers were able to excite the HCl molecules to v = 1 stateusing a chemical laser and showed that HCl (v = 1) was 100 times morereactive than HCl (v = 0) on collision with K atom. In a velocity selectedbeam experiment it was also observed that for the same amount of energyreagent, vibration was ten times more effective than translational in bringingout the reaction
K + ClH → KCl + H
Dispert and coworkers were able to prepare HCl molecules in not only aspecific vibrational state (v = 1) but also in a specific rotational state ( j = 1,2, 3, 4) and showed that the rotational excitation was hindering the reaction.Polanyi and co-workers studied the endothermic reaction
Br + HCl(v) → HBr + Cl
by preparing HCl molecules into various vibrational states (v = 1, 2, 3, 4)and determined the rate constants by the use of luminescence depletionmethod. It is observed that excitation to the v = 1 and v = 2 states givesconsiderable increased rate as compared with v = 0. At v = 2, the reactionbecomes exothermic and further excitation has a smaller effect.

Suggested Readings
1. Alexander, G. Volkov. Interfacial Catalysis, Marcel Dekker (2003).2. Amdur, I. and Hammes, G.G. Chemical Kinetics; Principles and Selected Topics,
McGraw-Hill, New York (1966).3. Amis, E.S. Solvent Effects on Reaction Rates and Mechanism, Academic Press,
New York (1966).4. Antoni, Lagana and Gyorgly, Lenduay. Theory of Chemical Reaction Dynamics,
Springer (2003).5. Ashmore, P.G. Catalysis and Inhibition of Chemical Reactions, Butterworths,
London (1966).6. Atkin, P.W. Physical Chemistry, 2nd Edition, Oxford University Press, Oxford
(1982).7. Bala Krishnan, R. Raghvan, P.S. and Srinivashan, V.S. Indian J. Chem., 21B, 423
(1982); Proc. Indian. Acad. Sci. (Chem. Sci.), 92, 283 (1983).8. Bamford, C.H. and Tipper, C.F.H. (eds), Comprehensive Chemical Kinetics,
Elsevier, Amsterdam, Vol 1-18 (1969-1974).9. Bender, M.L., Bergeron, R.J. and Komiyama, M. The Bio Organic Chemistry of
Enzymatic Catalysis, John Wiley, New York (1984).10. Berezin, I.V., Martinek, K. and Yatsimirsky, A.K. Russ. Chem. Rev., 42, 787
(1973).11. Bernstein, R.B. (ed) (a) Chemical Dynamics via Molecular Beam and Laser
Techniques, Clarendon Press, Oxford, New York (1982). (b) Atom-MoleculeCollision Theory: A guide to experimentalist, Plenum Press, New York (1979).
12. Billmeyer, F.W. Text Book of Polymer Science, Wiley Interscience (1984).13. Blais, N.C. and Bunker, D.L. J. Chem. Phys., 37, 2713 (1962).14. Brain, Heaton Mechanism in Homogeneous Catalysis, John Wiley & Sons Ltd.
(2005).15. (a) Brooks, P.R. and Coworkers Phys. Rev. Lett., 44, 687 (1980); 50, 1918
(1983); J. Chem. Phys., 85, 844 (1986); Phys. Rev., A34, 4418 (1986). (b) Dispert,H.H., Geis, M.W. and Brooks, P.R., J. Chem. Phys., 70, 5317 (1979).
16. Caldin, F.F. Fast Reactions in Solutions, Blackwell, Oxford (1964).17. Capellos, C. and Bielski. Kinetic System, Wiley Interscience, New York (1972).18. Connor, J.N.L. Comp. Phys. Commu., 17, 117 (1978).19. Donald, A.M. and Simon, John D. Physical Chemistry, A Molecular Approach,
Viva Books Private Ltd., New Delhi (1998).20. Eberson, L. Electron Transfer Reactions in Organic Chemistry, Adv. Phys. Org.
Chem., 18, 79 (1982).21. Engel, V. and Coworkers. J. Chem. Phys., 82, 4844 (1985); Chem. Phys. Lett.,
122, 103 (1985).22. Espenson, J.H. Chemical Kinetics and Reaction Mechanism, McGraw-Hill., New
York (1981).

248 Suggested Readings
23. Fendler, J.H. and Fendler, F.J. Catalysis in Micellar and Macromolecular Systems,Academic Press, New York (1975).
24. Frost, A.A. and Pearson, R.G. Kinetics and Mechanism, 2nd Ed., Wiley EasternPrivate Ltd., New Delhi (Reprint 1970).
25. Gardiner, W.G. Rates and Mechanism of Chemical Reactions, Benzamin Cummings,Menlo Park, California (1969).
26. Glasstone, S. Text Book of Physical Chemistry, McMillan and Co. Ltd., LittleEssex. Street London 2nd Edition (1968).
27. Glasstone, S., Eyring, H. and Laidler, K.J. The Theory of Rate Processes, McGraw-Hill, New York (1945).
28. Greene, E.F. and Kuppermann, J. Chemical Education, 45, 361 (1968).29. Hammond, G.S. J. Am. Chem. Soc., 77, 334 (1955).30. Hill, A.V. J. Physiol (London), 40 (1910).31. Hinshelwood, C.N. Proc. Roy. Soc., London, A113, 230 (1927).32. Hirschfelder, J.O., Curtiss C.F. and Bird, R.B. Molecular Theory of Gases and
Liquids, John Wiley, New York (1964).33. Johnston, H.S. and Parr, C.A. J. Am. Chem. Soc., 85, 2544 (1963).34. Jordan, P.C. Chemical Kinetics and Transport, Plenum, New York (1979).35. Kassel, L.S. J. Phy. Chem., 32, 225 (1928).36. Karplus, M., Porter, R.N. and Sharma, R.D. J. Chem. Phys., 43(9), 3259 (1965).37. Kuntz, P.J. Chem. Phys. Lett., 16, 581 (1972).38. Laidler, K.J. Chemical Kinetics, 3rd Ed., Harper & Row Publishers, New York
(1987).39. Lee, S.Y., Powlard, W.T. and Mathies, R.A. Chem. Phys. Lett., 160, 531 (1989).40. Lennard-Jones Proc. Roy. Soc., A 106, 463 (1924).41. Leu, M.T. and De More, W.B. J. Phy. Chem., 82, 2049 (1978).42. Lewis, G.N. and Smith, D.F. J. Am. Chem. Soc., 47, 1508 (1925).43. Lindemann, F.A. Trans. Faraday Soc., 17, 598 (1922).44. London, F.Z. Electrochem., 35, 552 (1929).45. Masters, C. Homogeneous Transition-Metal Catalysis, Chapman and Hall, New
York (1981).46. (a) Marcus, R.A. J. Chem. Phys., 20, 359 (1952). (b) Marcus, R.A. and Rice,
O.K. J. Phy. Colloid Chem., 55, 894 (1951).47. McLaughlin, D.R. and Thompson, D.L. J.Chem. Phys., 59, 4393 (1973).48. Meites, L. Polarographic Techniques, 2nd Edition, Interscience Publishers, New
York (1965).49. Menger, F.M. and Portnoy, C.E. J. Am. Chem. Soc., 89, 4698 (1967); 92, 5965
(1971).50. Miller, W.H. (ed.) Dynamics of Molecular Collision, Part A and B, Plenum, New
York (1976).51. Morse, P.M. Phys. Rev., 34, 57 (1929).52. Moore, W.J. Basic Physical Chemistry, Prentice Hall of India Pvt. Ltd., New
Delhi (1986).53. Morre, W.J. and Pearson, R.G. Kinetics and Mechanism, IIIrd Ed., New York
(1981).54. Murrell, J.N. and Sorbie, K.S. J. Chem. Soc. (Fara. Trans. 2), 70, 1552 (1974).55. Mushran, S.P., Agrawal, M.C., Mehrotra, R.M. and Sanehi, R.J. Chem. Soc.
(Dalton), 1460 (1974).56. Noyes, R.M. and Field, R.J. Acc. Chem. Res. 10, 214 and 273 (1977); J. Chem.
Educ. 49, 308 (1972); Ann. Rev. Phys. Chem. 25, 95 (1974).

Suggested Readings 249
57. Odian, George Principles of Polymerisation, 3rd Edition, John Wiley & Sons Inc.,New York (1991).
58. Perry, D.S., Polanyi, J.C. and Wooddrow, Wilson. J. Chem. Phys., 3, 317 (1974).59. Piszkiewicz, S. J. Am. Chem. Soc., 99, 1550 (1977).60. Polanyi, J.C. J. Quant. Spectro. Radiant. Transfer, 3, 471 (1963); Accounts of
Chem. Res., 5 (5) (1972).61. Polanyi, J.C. and Schreiber, J.L. In: Physical Chemistry and Advance Treatise,
Vol. VIA; Kinetics of Gas Reactions, edited by H. Eyring, W. Jost and D. Henderson,Academic Press, New York (1974).
62. Polanyi, J.C. and Wolf, R.J. Chem. Phys., 75, 5951 (1981).63. Polayni, J.C. and Coworkers J. Chem. Phys. 73, 5895 (1980); 79, 283 (1983).64. Porter, R.N. and Raff, L.M. In: Dynamics of Molecular Collision, Part B, edited
W.H. Miller (ed.) Plenum Press, New York, Chapter I (1976).65. Raja Ram, J. and Kuriacose, J.C. Kinetics and Mechanism of Chemical
Transformations, 1st Edition, McMillan India Ltd., New Delhi (1993).66. Rakshit, P.C. Physical Chemistry, 5th Edition, Sadhana Press, Calcutta (1988).67. Raphael, D. Levine, Molecular Reaction Dynamics, Cambridge University Press
(2005).68. Rao, C.N.R. Solid State Chemistry, Marcel Dekker Inc., New York (1974).69. Rice, O.K. and Ramsperger, H.C. J. Am. Chem. Soc., 49, 1617 (1972); 50, 617
(1928).70. Sathyamurthy, N. (ed.) (a) Reaction Dynamics: Recent Advances, Narosa Publishing
House, New Delhi (1991); (b) Computer Phys. Reports, 3 (1), Sept. (1985), (c)Chem. Rev., 83, 601 (1983); (d) Chem. Phys. Lett., 92, 631 (1982); (e) CurrentScience, 50, 743, (1981);(f) Indian J. of Chem. Edu., 6(2), 1 (1979).
71. Sathyamurthy, N. and Raff, L.M. J. Chem. Phys., 63, 464 (1973).72. Sepulveda, L. J. Colloid and Interface Sci., 46, 372 (1974); J. Phy. Chem., 85,
272, 1429 and 3689 (1981).73. Slater, N.B. Proc. Leeds. Phil. Soc., 4, 259 (1955).74. Starks, C.M. Phase Transfer Catalysis, Fundamentals, Applications and Industrial
Prospective, Chapman & Hall (1994).75. Starks, C.M. and Charles Jiotta. Phase Transfer Catalysis, Academic Press, New
York, London (1978).76. Swinbourne, E.S. Analysis of Kinetic Data, Thomas, London (1971).77. Taqui Khan, M.M. and Martell, A.E. Homogenous Catalysis by Metal Complexes,
Vol. I, Academic Press, New York (1974).78. Taylor, E.H. and Datz, S. J. Chem. Phys., 23, 1711 (1955).79. Thomas, J.M. and Thomas, W.J. Introduction to the Principles of Heterogeneous
Catalysis, Academic Press, New York (1967).80. Thompson, D.L. Acc. of Chemical Res., 9, 338 (1976).81. Truhlar, D.G. (ed.) Potential Energy Surface and Dynamic Calculations, Plenum,
New York (1981).82. Varshni, Y.P. Rev. Mod. Phys., 29, 664 (1957); 31, 839 (1959).83. Willing C. Sharke and Beaudet, R.A. Acc. Chem. Res., 21, 341 (1988).84. Zewail, A.H. and Coworkers J. Chem. Phys., 87, 1451 (1987); 87, 2395 (1987);
88, 6672 (1988); 89, 6113 (1988); Chem. Phys. Lett., 146, 175 (1988); Science,241, 1200 (1988).

Index
Absolute reaction rate 89, 185Absorption coefficient 243Accelerated flow method 175, 178Acid
base catalysis 150, 174catalysed polycondensation reaction
126catalysed reaction 147, 193
Activated complex 47, 48, 50, 52, 53,79, 82–84, 89–95, 146, 186–191, 194,197, 243
Activation energy 48, 49, 51, 52, 54,75, 104, 111, 114, 149, 185, 187, 196,213–215, 243
Activity coefficient 186, 187, 190–192Addition polymerization 125Adiabaticity 240Adsorption theory 145Aggregate 160, 164Akima’s interpolation 229Alternating copolymer 132Angular distribution 234, 241, 242Anionic polymerization 127, 130, 131,
141Anti-Morse function 227Arrhenius
complex 148–150equation 46, 48, 54, 88, 92, 93, 95–
97, 138, 213factor 47, 48, 53, 54, 65, 88, 96, 98,
114, 213Attractive surface 220, 221Auto catalysis 143Autocatalytic reaction 26, 27, 44, 143Average life 18, 19, 130
Base catalysis 147, 150, 174Beer-Lambert’s law 43Belousov
reaction 124-Zhabotinskii reaction 122
Berezin model 163Bimolecular surface reaction 173Binding constant 162–166Blais and Bunker function 228Block copolymer 132Boltzmann’s factor 86Bond-energy-bond-order (BEBO) method
224Born-Oppenheimer approximation 206,
222Branching chain explosions 70Brönsted-Bjerrum 190Buckingham function 225
Cannizzaro reaction 195Catalysis 142–147, 150–152, 156, 159,
162, 165, 166, 168, 174Catalytic
coefficient 149constants 151poisoning 141reactions 146, 147
Cationic polymerization 127, 130, 141Chain
branching 71, 160growth polymerization 125, 127initiation 67, 71length 70, 75, 78, 124, 128, 130–
132, 141, 160propagation 70, 71, 73reactions 67, 68, 70–72, 75, 88, 116,
118, 168, 174transfer reactions 70
Chemicaldynamics 241equilibrium 80kinetics 1, 39, 175, 206
Classicalmechanics 206, 234trajectory 113, 206, 229, 234
Collimeter 242

252 Index
Collisioncross sections 210frequency 84, 86–88, 94, 210number 88, 196theory 83, 87–89, 93–95, 99, 100,
102, 104, 114, 195, 196Compensation effect 201, 202Competitive inhibition 169Complex reactions 55, 66, 67, 95Composition drift 135Concentration-time relation 64Condensation
polymerization 124polymers 125
Conductometric method 39, 40Consecutive reactions 59, 63Contact time 177Continuous flow method 175, 177–179Contour diagram 51, 238Co-operativity index 165Co-polymerization 132Coulombic energy 222, 223Critical micelle concentration (CMC)
160Cut the corner 240
D2O medium 195Decay constant 19Decomposition
of a solid 136, 138, 141of ethane 73, 74
Degreeof polymerization 124of solvation 187
Degrees of freedom 80, 81, 83, 86, 89,94, 96, 103, 105, 107, 206, 229
Determination of rate 1, 2, 59, 69, 129,156
Diatomic-in-molecules (DIM) approach227
Dielectric constant 188, 189, 193, 194,202
Differentialmethod 35rate 6–8, 28–31, 35, 61rate equation 6, 28–30, 35rate expression 7
Dipole moment 194Dipoles 193Distribution
function 105, 231, 234
of energy 86, 103of relative speeds 209
Double sphere model 188
Earlybarrier 235down hill surfaces 220
Effective collision 87, 89Einstein law of photochemical
equivalence 115Elastic scattering 206Electric impulse 175Electron
exchange reaction 183spin resonance (ESR) 175, 183transfer reaction 139, 141
Electrostatic forces 189, 194Electrostriction 189, 190Endothermic reaction 51–53, 111, 219–
221, 235–237, 245Energy
barrier 90, 106, 219, 236factor 84, 86, 88, 196of activation 47, 48, 51–53, 65, 66,
75, 82, 83, 90, 92, 99, 119, 135,187–189, 196, 199–201, 213
profile 109, 218–221scheme 103, 108-reaction coordinate 52, 83, 84, 213
Enthalpy 89, 91Entropy 89, 91, 94, 97, 114, 189, 190,
202Enzyme 147, 152, 154, 155, 168–170,
172, 174,178
Equilibriumconcentration 56constant 44, 47, 57, 58, 79, 81–83,
89, 91, 147, 148, 162, 180, 184,186, 190, 198, 201
Excess energy 117, 239, 240Exchange energy 107, 222, 223Excitation function 215Exothermic reaction 52, 53, 70, 111,
219, 220, 235, 236Extended Rydberg (ER) function 226,
228
Fast reactions 36, 175, 182–184, 204Femtochemistry 112, 113Final state properties 232

Index 253
First orderrate coefficient 101, 102rate constant 15, 16, 102, 103, 105,
129, 147, 151, 168, 182reaction 5, 12, 13, 15, 16, 25, 38,
44, 45, 53, 101, 120, 180Flash photolysis 175, 182, 184Flow
method 175, 177–179, 184technique 175, 176, 178, 179
Freeenergy 89, 91, 114, 121, 146, 188,
189, 194, 199–202radical 48, 67, 68, 70–73, 125, 127–
129, 133, 141, 167, 168, 182, 183,199
Frequencyfactor 47, 76, 88, 94, 188, 189of vibration 91, 196
Gibb’s Helmoltz relation 91Gouy-Chapman layer 160Gradual surface 220, 221, 236, 237Graft copolymer 133Graphical method 34, 44Grotthuss-Draper law 115
H2 and Cl2 reaction 119H2-Br2 reaction 118Half-life 8, 10, 12, 16, 17, 19, 21, 22,
27, 28, 34, 36-39, 44, 45, 53Hamilton’s equations 230, 234Hammond’s postulate 110, 111Hard sphere model 210, 212, 214Hemmett equation 198–201Heterogeneous catalysis 142, 144–146,
156, 174Hinshelwood’s treatment 103, 104Homogeneous catalysis 142, 156Hood’s equation 46, 47Hydrolysis of ester 5, 13, 22, 150, 201
Impact parameter 210, 211, 230, 231,233, 234
Inductive effect 201Inelastic scattering 206Influence
of pH 154of rotational energy 240of solvation 187
Infrared chemiluminescence 244
Inhibition 68, 121, 168–170, 172–174Inhibitor 121, 143, 168–170, 172–174,
204Initial state
properties 230selection 205, 243
Initiation 37, 55, 67, 68, 70, 71, 73–76,78, 119, 127–132, 169
Inner sphere mechanism 139–141Instantaneous rate 3, 6Integral
cross sections 204, 206equations 6, 7
Integration method 30Intermediate compound formation theory
145Internal pressure 187Intrinsic reaction coordinate 218Inversion of cane sugar 5, 13Inversions of sucrose 150Ionic
reactions 187, 190strength 154, 190–193, 202
Isotopeeffect 195, 197, 202substitution 195, 196
Kinematic effect 237Kinetic
and thermodynamic control 109energy 86, 87, 89, 118, 210, 211,
216, 222, 233, 237spectroscopy 182
Kinetics of polymerization 124
Langmuir adsorption isotherm 156Laser techniques 175, 204, 206Late-down hill surface 220Lennard-Jones function 225Lindemann’s
mechanism 100theory 102, 103, 107
Linear free energy relationship 199, 200Lineweaver-Burk plot 170, 171, 174London
and Heitler 222-Eyring-Polanyi-Sato (LEPS) 113,
224, 226, 227Lotka’s model 121
Magnetic resonance spectroscopy 175

254 Index
Marcus treatment 106Mass effects 234Maxwell-Boltzmann distribution 4, 209Mechanism of catalysis 147Menger and Portnoy’s model 162Micellar catalysis 159, 162, 166Michaelis Menten constant 153, 170,
174Microscopic
reversibility 236-macroscopic relation 205
Minimum energy path 51, 218Models for micellar catalysis 162Molecular
beam 112, 113, 175, 204, 206, 215,241–244
reaction dynamics 204Molecularity 1, 4, 5, 44Monte-Carlo
averaging 233method 231
Morseequation 223, 224function 226–228
Negative catalysis 143, 168Noncompetitive inhibition 172Nonideal solution 186Non-reactive
collision 232systems 206
Nuclear magnetic resonance (NMR)175, 183
Number of effective collisions 84Numerical functions 229
Opticaldensity 43, 44methods 42
Optimum pH 154, 155Order of reaction 4–6, 15, 30, 34, 36–
38, 44, 74, 77, 139, 157, 174, 177Oregonator model 120, 122Orientation
factor 84, 87of molecules 84
Oscillatory reactions 120Ostwald isolation method 35Outer sphere mechanism 139, 141Overall rate constant 204, 205, 208,
209
Oxidation of ascorbic acid 193
Parallel reaction 59, 61, 65, 66Partition function 80–83, 93–96, 106,
109, 186, 208Pauling’s rule 224Phase transfer
catalysed reaction 167, 168catalysts (PTC) 166–168equilibrium 167
Photochemical reaction 115, 116, 119,141
Piszkiewicz co-operativity model 164Plug flow 176Poison 144, 145Polar
effect 198substituent constant 200, 201
Polarogram 40Polarographic technique 40Polyatomic molecules 94–96Polycondensation reactions 125Positive catalysis 142Potential energy
curve 117, 216profile 218–221surface (PES) 50, 51, 205, 206, 216,
217, 219–225, 228, 229, 234–237,239, 240, 243
Potentiometric method 41Predissociation 118Pre-exponential factor 96, 104, 109, 114Pressure jump 175, 181Primary
kinetic isotope effect 195, 197salt effect 190, 192, 193, 202
Probability factors 87Promoters 144Propagation 67, 68, 70, 71, 73, 74, 76,
78, 127–133, 135, 168, 169Proton
exchange reaction 183transfer 197
Pseudo-order reactions 5
Quantumefficiency 116, 119, 141mechanics 205, 206, 222yield 116, 119, 141
Quassi classical trajectory 113, 229,234

Index 255
Radioactivedecay 17disintegration constant 17equilibrium 18, 19
Radiolytic reactions 115Raghvan and Srinivasan’s model 165Random copolymer 132, 135Rate
coefficient 4, 30, 101, 102, 175, 206,208, 212
constants 30, 31, 46, 48, 49, 53, 54,59–61, 65–67, 72, 76, 129, 133,147, 162, 164, 175, 180, 182, 184,195, 198, 201, 204, 241
determination 68, 146equation 6–8, 10, 20, 23, 28–31, 35,
49, 127, 155, 156, 174, 177, 208of initiation 68, 70, 75, 128–132of propagation 68, 70, 71, 78, 128–
132, 169of termination 68, 128, 129, 131,
132, 169-surfactant profiles 161
Reactionconstant 198–202cross section 208, 212, 229, 232,
233, 242in solution 185–187path 51, 218, 220, 235probability 207, 212, 233, 236, 238,
241rate 1, 8, 36, 46, 55, 66, 70, 71, 79,
83, 88, 90, 143, 157, 175, 177,185, 194, 207, 240
threshold energy 213Reactive
collision 214, 215, 232–234, 242scattering 206system 206, 229, 233trajectory 235
Rebound mechanism 243, 244Reduction of order 244Refractometry 42Relative
translational and internal energies214
velocity 205, 207, 208, 210, 211,230, 231, 233, 242
Relaxationmethod 175, 179, 181time 180, 181, 184
Repulsive surface 220, 221Reverse
isotope effect 197Reversible
inhibition 169reaction 53, 55, 57, 61, 125, 174
Rice and Ramsperger, and Kassel (RRK)treatment 105
Rice-Ramsperger-Kassel-Marcus(RRKM) 106–108
Rotated-Morse-Curve-Spline (RMCS)228
Rotationalangular momentum 231, 244degree of freedom 82energy 80, 81, 87, 182, 240excitation 245partition function 81
Saddle point 51, 217–220, 235, 236Salt effect 190, 192, 193, 202Scaled and skewed coordinates 237–239Schrödinger equation 205, 206, 217Second order
rate constant 114, 126, 147, 168, 182reaction 20–27, 37, 44, 45, 60, 100
Secondarykinetic isotope effect 195salt effect 190, 192, 193
Sepulveda model 162Shock tubes 175, 181, 182Skewing angle 237–239Skimmer 242Skrabal diagram 152, 174Solid
state reaction 135, 136, 141-solid reaction 137
Solvent isotope effect 197Sorbie-Murrell (SM) function 228Specific
energy disposal 235hydrogen ion catalysed 150hydroxyl-ion catalysed 150rate 4, 23, 44
Spectrophotometry 43Spline functions 229Standard free energy change 91Stark’s phase transfer catalytic cycle
167State-to-state
chemistry 113, 204

256 Index
cross section 175, 205differential cross section 207integral cross section 207, 208kinetics 244rate coefficients 206rate constant 205, 208, 209studies 239
Steady stateapproximation 68, 69, 77, 169, 171conditions 39, 72, 74, 100, 118, 129,
131, 132, 148treatment 66, 67, 73, 119, 120, 128,
148, 155, 156Step growth polymerization 125Steric
effect 200, 201factor 94–96, 114, 196
Stirred flow 176, 177Stoichiometric coefficient 2, 4Stopped flow
method 175, 178, 179Stripping mechanism 243, 244Substituent constant 198–201Sudden surface 220, 221, 236, 237Supersonic molecular beams 242Surface
catalysed reactions 159catalysis 147reactions 168, 172–174
Surfactant 159–165, 168, 174Switching function 228
Taft equation 200–202Temperature
coefficient 46, 53jump 175, 181
Termination 67, 68, 70, 72–74, 76, 78,119, 120, 127–132, 168, 169
Theories of catalysis 145
Thermaldecomposition 73, 75, 76, 138rate coefficient 208, 212
Thermoneutral reactions 236Third order reaction 6, 28Topochemical reactions 136Trajectories 113, 206, 233, 234, 238Transition state (TS) 84, 90, 93, 94, 96–
98, 108, 110–114, 140, 194, 198, 199,202, 204, 205, 213, 218
Translation 80, 108, 206, 235–237Translational
degree of freedom 82energy 86, 89, 208, 214, 220, 236,
240, 242, 244Triatomic systems 228
Ultrasonic 175, 181Uncompetitive inhibition 170, 172Unimolecular reaction 93, 100–103,
105, 112, 172, 187
Van’t Hoffcomplex 148, 150intermediate 149
Van’t Hoff’sdifferential method 35relation 47
Van’t Hoft isochore 92Velocities of molecules 209Velocity constant 3Vibration energy 220Vibrational
degree of freedom 83, 90energy 81, 87, 108, 196, 231, 235,
236, 240motion 81
Zero-order reaction 10, 11