chemical name: malathion - united states environmental web view · 2015-12-04the average...
TRANSCRIPT

APPENDIX 2-3. Open Literature Review Summaries for Malathion
Included in this appendix are the open literature review summaries for studies that were reviewed for the effects characterization for malathion. It is noted that some of these studies were reviewed for previous risk assessments (e.g., California red-legged frog endangered-species risk assessment). Below in Table B 2-3.1 are the ECOTOX numbers associated with the available reviews.
Table B 2-3.1. ECOTOX numbers associated with the available open Literature reviews. 628 103059995 1041825074 1045607026 1110577856 11429611521 11829215472 11838216371 11926617860 11926725359 12075929591 12090035348 12110038642 15889939997 15890350842 15902952962 16004354278 16104961878 16118263276 16240965789 16235865887 1624756842272010751278204785816868588900689273892889062490644906599070692183
B3 (EC) - 1

100430
B3 (EC) - 2

Chemical Name: Malathion
CAS NO: 121-75-5
ECOTOX Record Number and Citation: 000628Eisler, R. 1970. Acute Toxicities of Organochlorine and Organophosporous Insecticides to Estuarine Fishes. Report No. 46. Technical Papers of the Bureau of Sports Fisheries and Wildlife. Washington, DC. 12 pp. MRID 422222-21 and 422222-23.
Purpose of Review: Litigation
Date of Assessment: April 12, 2010
Brief Summary of Study Findings:
IntroductionThis paper reported results of static 96-hr acute toxicity studies with estuarine fish conducted by the Bureau of Sports Fisheries and Wildlife. Studies determined the acute toxicity of 12 common insecticides to seven species of fish: American eel (Anguilla rostrata), mummichog (Fundulus heteroclitus), striped killifish (Fundulus majalis), bluehead wrasse (Thalassoma bifasciatum), striped mullet (Mugil cephalus), Atlantic silverside (Menidia menidia), and northern puffer (Sphaeroides maculatus). Studies were conducted at the Sandy Hook Marine Laboratory in Highland, New Jersey between April 1964 and June 1966. This review evaluates the results that were reported for the tests with malathion.
MethodsThe tests were conducted using brackish groundwater obtained from a well. The water had a salinity of 24 ± 1 parts per thousand and a pH of 8.0 ± 0.1. Static tests were conducted in 20-liter test vessels filled with 19 liters of solution. The test solutions were aerated during the studies via 3-mm glass tubing. Dissolved oxygen levels ranged from 7.1 to 7.7 mg/L.
Solutions were prepared from reference standards obtained from the Entomological Society of America. Acetone was used as a solvent at a concentration of 0.05 ml/L in the test solutions. All tests were conducted with a minimum of 5 test concentrations. Tests with the Atlantic silverside and American eel were done with 10 fish per concentration. Tests with the bluehead wrasse had only 5 fish per concentration. Tests with the other species have between 6 and ten fish per concentration (see Table 1). The size and weight of the fish are given in Table 1.
B3 (EC) - 3

Table 1. Number and size of fish used in 96-hr acute toxicity tests of malathion.Species Number per level Mean length (cm) Mean weight (g)Atlantic silverside 10 5.0 0.8Bluehead wrasse 5 8.0 5.4Striped killifish 8-10 8.4 6.5Striped mullet 6-10 4.8 0.78American eel 10 5.7 0.16Mummighog (test 1) 7-10 5.6 2.5Mummighog (test 2) 7-10 5.5 1.8Northern puffer 6-10 18.3 126
Bluehead wrasses were obtained from a commercial fish collector in Florida. Eels were obtained from the outlet of Shadow Lake in New Jersey. All other fish were collected from the Sandy Hook Bay. All fish were juveniles except the northern puffer, which, based on reported body weights, were assumed to be adults. All fish were held for an acclimation period of 10 to 14 days at conditions that were the same as the test. Only actively feeding fish were used in the tests. During the 96-hr test period, no food was offered and dead fish were removed every 24 hours. A control was used, and results were only reported for studies in which control mortality did not exceed 10%. However, the paper did not state if the controls were negative controls or solvent (acetone) controls.
Study authors followed methods in the American Public Health Association (1960) to calculate LC50’s. No further details of statistical methods were provided.
Results
The 24-, 48-, and 96-h LC50 values obtained for tests with malathion are given in Table 2. Mortality data for individual test chambers were not provided.
Table 2. Results of acute LC50 tests of seven fish species with malathion.
Species LC50 (µg/L)
Classification24 h 48 h 96 h
Atlantic silverside 315 315 125 QuantitativeBluehead wrasse 33 27 27 InvalidStriped killifish 280 250 250 QuantitativeStriped mullet >360 550 550 QualitativeAmerican eel 82 82 82 QualitativeMummichog (test 1) 130 80 80 QuantitativeMummichog (test 2) 810 440 400 QuantitativeNorthern puffer (adults) 9,000 6,000 3,250 Qualitative
Description of Use in Document: QUANTITATIVE for Atlantic silverside, striped killifish, and
B3 (EC) - 4

mummichog; QUALITATIVE for American eel, striped mullet and northern puffer; and INVALID for bluehead wrasse.
Rationale for Use: Bluehead wrasse: Invalid.The test with the bluehead wrasse is invalid because the source was certain, because only five fish were tested per concentration, and because this marine fish might have been stressed by being kept in brackish water with a salinity of 24 parts per thousand.
American eel: Qualitative. The test with the American eel is qualitative because the fish were collected from a location with unknown salinity. Based on the description of the location, it appears to have been a nearly freshwater habitat, and thus testing the eels at a salinity of 24 parts per thousand could have caused them stress. In addition, being an unusual test species, it is uncertain how well this species performs in laboratory test species and how sensitive it is to pesticides.
Striped mullet and northern puffer: Qualitative.The tests with the striped mullet and northern puffer are qualitative because they may have been performed with fewer than seven fish per concentration. In addition, the northern puffers tested were adults.
Atlantic silverside, striped killifish, and mummichog: Quantitative.The Atlantic silverside, striped killifish, and mummichog are preferred test species for marine/estuarine fish testing, and test methodologies used in tests with these species were generally consistent with the EPA test guidelines.
Limitations of Study: 1. The test species used were not recommended species based on the OPPTS 850.1075 guideline.
The American eel, bluehead wrasse, and northern puffer are not typical species used in laboratory toxicity testing. All of the fish were wild-caught. It is thus uncertain how well these species of fish perform as laboratory test species, how sensitive they are to pesticides, and how well the wild caught fish adjusted to being maintained in laboratory conditions. Of particular concern is the bluehead wrasse which is a strictly marine species, but was being maintained in the laboratory in water with a salinity of only 24 parts-per-thousand, which is considerably less than seawater. Likewise, the eels were collected from a location that likely had low salinity, but were tested at a salinity of 24 parts-per-thousand. While the fish were maintained for 10 to 14 days prior to the test, the health and mortality of the fish during this period were not reported. It is therefore not known if they were stressed.
2. The percent purities of the malathion test material were not reported. It was obtained from the Entomological Society of America and was only described as “ESA reference standard.”
3. The bluehead wrasse and the American eel are not very good test species for assessing risk of pesticides to marine/estuarine fish. The bluehead wrasse is a tropical marine fish that inhabits coral reefs in the Caribbean Sea. It is thus uncertain how well it represents estuarine fish that are likely exposed to higher pesticides concentrations. The juveniles of the American eel migrate from the sea into freshwater tributaries. It is therefore not a preferred test species to represent typical saltwater fish.
B3 (EC) - 5

4. The bluehead wrasses were purchased from a commercial fish collector in Florida. Their source is thus unknown.
5. OPP guidelines state that juvenile fish weighing between 0.5 and 5.0 grams should be used. The blue wrasse and striped killifish slightly exceeded the maximum weight limit. The northern puffers were much larger than recommended and appeared to have been adults.
6. The guideline for this test states that a minimum of 7 fish must be tested per test level. The test with the bluehead wrasse used only five fish per concentrations. The number of fish per concentration used in the tests with striped mullets and northern puffers were reported as “6-10,” and thus it is uncertain if at least 7 fish per concentrations were used in the tests of malathion.
Reviewer: Nicholas Mastrota, Biologist, ERB1
Secondary Reviewer: Christine Hartless, Wildlife Biologist, ERB1
Additional remarks: Studies classified as Quantitative and Qualitative in this review are considered Quantitative for SSDs for the endangered species assessment for malathion. Amy Blankinship, Chemist, ERB6
B3 (EC) - 6
Chemical Name: Malathion
CAS NO: 121-75-5
ECOTOX Record Number and Citation: 995
Hermanutz, R.O. 1978. Endrin and malathion toxicity to flagfish (Jordanella floridae). Arch. Environm. Contam. Toxicol. 7(2):159-168. MRID 48078002.
Purpose of Review: Litigation
Date of Assessment: March 16, 2010
Brief Summary of Study Findings:
Introduction
The toxicity of endrin and malathion was tested with the flagfish using a flow-through system. A life-cycle study was performed to determine chronic effects on survival, growth, and reproduction. An acute toxicity studies was also conducted to determine the 96-hr LC50 values of young fish.
Methods
Acute fish toxicity tests were conducted with a flow-through system using sterilized Lake Superior water. A flow rate of 8 chamber volumes per 24 hr was split between two replicate test chambers. Test chambers consisted of a spawning chamber containing 54 L of solution, and contained within these spawning chambers were two larvae chambers containing 6.3 L of solution. Spawning chamber water was gently aerated to maintain DO concentrations above 80% saturation. Water temperatures in both systems ranged from 23.1° and 26.6° C. A constant 16-hr photoperiod was maintained.
Dilution solutions were made using technical grade insecticides (96.1% AI for endrin and 95% AI for malathion) and acetone as the solvent. Maximum acetone concentration in the malathion study was 1.4 mg/L. No acetone was added to the control. Test solutions were sampled and analyzed on a weekly basis. The recovery for malathion was 95%, and reported malathion concentrations values were adjusted according to this recovery. Water characteristics were determined weekly and found to be as follows:
pH, 7.3-7.6 alkalinity, 39-44 mg/L as CaCO2
total hardness, 41-46 mg/L
Acute Toxicity Study: Study was conducted with 33-day-old flag fish. Forty-five fish were placed in each test chamber, each containing 54L of water. There was one test chamber used per concentration, and one used as a control. Based on means of daily concentration measurements, the malathion concentrations tested were 516, 374, 294, 233, 170, and 116 µg/L. Daily water temperatures ranged from 24.4 to 25.2° C. DO ranged from 95% to 102% saturation. Flow rates were 10 volumnes/24 hr.
B3 (EC) - 7
Fish were exposed and monitored for survival at 96 hr and 216 hr (9 days). Acute LC50 were determined by probit analysis.
Life-Cycle Study: Forty 1- to 2-day old larvae, produced by laboratory culture, were randomly placed into each of two larvae chamber within each spawning chamber. There were two replicated spawning chambers, and thus four larval chambers, per concentration. After 30 days of exposure, growth and survival were determined by a photographic method. Random samples of 15 fish were then transferred to their respective spawning chambers, for a total of 30 fish per test concentration. Survival was determined during 30- to 65-day and 65- to 110-day exposure periods. During the 6th week, the numbers of fish were reduced to two males and five females by random sampling. Two spawning substrates composed of yarn covered steel screen were placed in each spawning chamber. Substrates were available for spawning for 54 days. Embryos were collected from substrates every 24 hr, and the samples were incubated in oscillating cups in the test water to determine viability and to provide larvae for the second-generation studies.
Four to seven groups of twenty 1-day-old second-generation larvae were reared for 30 days in each concentration to determine survival and growth. Total lengths and weights of each surviving fish were recorded. All fish were fed three times a day.
Lengths, weights, and man number of eggs per females were transformed to logarithms and percent survivals were transformed with the arcsine transformation. Statistical differences were determined by one-way analysis.
The life-cycle study with malathion was conducted using a negative control and 7 test nominal concentrations ranging from 6.4 to 36.0 µg/L. See Table 1 for the nominal and mean measured concentration at each level.
Results
Acute Toxicity Study: Mortality data for test chambers were not reported. It was noted, however, that at the termination of the study (216 hr), 10% of the fish at 116 µg/L (the lowest concentration) were dead, and few fish were surviving at the 374 and 516 µg/L test levels. The 96-hr LC50 was 349 µg/L with a 95% confidence interval of 321 to 383 µg/L. The 216-hr LC50 and 95% confidence interval was 235 ± 22 µg/L.
No signs of toxicity were observed in the surviving fish at 116 µg/L or in the control. With increasing concentrations, increasing incidents and severity of scoliosis was observed, along with decreased activity. At the 374 and 516 µg/L levels, all of the surviving fish were inactive and had extreme scoliosis.
Life-Cycle Study: Results from the life cycle study with malathion are shown in Table 1. First generation mean length was significantly reduced (P = 0.05) during the first 30 days at the test levels of 10.9 µg/L and above. Survival during the same period was reduced at 24.7 and 31.5 µg/L. None of the seven test concentrations resulted in a reduction of number of eggs spawned, or in the percent survival or mean length of fish in the second generation. No evidence of spinal deformities was observed in the life-cycle study. This study established the chronic NOAEC at 8.6 µg/L, and the chronic LOAEC at 10.9 µg/L.
B3 (EC) - 8

Table 1. Results of a life-cycle study of the effects of chronic exposure of malathion to the flagfish (Jordanella floridae).Nominal Conc. (µg/L)
Mean Measured Conc. (µg/L)
1st Gen % Survival
Mean length(mm)
Eggs per female
2nd Gen Survival
Mean length(mm)
36.0 31.5 65* 13.2* 501 60 20.665* 13.1* 838 22 24.0
27.0 24.7 58* 14.6* 702 62 19.875* 13.0* 463 100 21.7
20.3 19.3 88 14.2 439 88 20.280 14.1 974 90 21.2
15.2 15.0 90 13.9* 790 20 22.590 14.3* 714 83 21.2
11.5 10.9 95 14.3* 1,091 73 21.695 14.4* 668 88 22.5
8.5 8.6 98 15.1 899 80 21.985 15.2 210 98 22.7
6.4 5.8 100 15.3 720 98 22.395 14.3 959 100 20.5
Control 0 100 16.0 772 93 20.793 16.1 787 68 22.4
Description of Use in Document: Quantitative for the acute toxicity and life-cycle studies.
Rationale for Use: Acute Toxicity Study: The acute LC50 study was conducted with methods that generally conform to EPA test guideline 850.1075. The use of 6 test concentrations and 40 fish per test concentration should have produced an accurate estimate of the LC50.
Life-Cycle Study: This study deviated in many ways from the Agency’s guideline for freshwater fish life-cycle testing. Several endpoints were not measured, such as hatching success, time to hatch, and growth and survival of second generation fish at 8 weeks after hatch. In addition, highly variable survival rates of second-generation fish appeared to have caused very low statistical power in the analysis of this endpoint. Therefore, it should be noted that a more complete life-cycle study done according to the Agency’s test guidelines may yield a lower effects threshold. Nevertheless, the chronic effects threshold established in this study based on the growth of first-generation fish is valid and may be used as a chronic endpoint in quantitative risk assessment.
Limitations of Study: Acute Toxicity Study:
B3 (EC) - 9
1. The flagfish is not a recommended test species.2. Temperature of the test water was 24.4 to 25.2° C, whereas the Agency’s guidance recommends
17° or 22° C.3. Raw mortality data were not reported.4. The confidence interval for the 216-hr LC50 was reported as a plus-or-minus value. This creates
doubt about its accuracy because confidence intervals around LD50 estimates calculated with probit analysis are normally unsymmetrical.
Life-Cycle Study: 1. Larvae at the beginning of the study were 1 to 2 days old, whereas the OPP 72-5 test guideline
states they should be 2 to 24 hours old.2. The study was conducted with 40 embryos per larval chamber, whereas the 72-5 test guideline
states that 50 embryos should be used.3. Only survival of embryos was recorded. Hatching success and time to hatch were not recorded.4. Length measurements were made at 30, 65, and 110 days (4.3, 9.3, and 15.7 weeks), whereas
the guideline states it should be done at 4 and 8 weeks.5. Spawning was measured using 2 males and 5 females per chamber, whereas the guideline
recommends 4 males and 4 females.6. Four to seven groups of 20 second-generation larvae were reared for 30 days in each
concentration to determine survival and growth. The guideline states that two groups of 25 larvae should be reared in each concentration for 8 wks (56 days). Therefore, growth and survival were only measured at 30 days (slightly more than 4 weeks) but not again at 8 weeks as specified in the guideline.
7. Water in the test chambers was aerated. The test guideline states that only the dilution water should be aerated.
8. Survival of the second generation was only 68% in one of the control replicates. Survival was also highly variable between replicates in treatment groups. The combination of these two factors made the power of the statistical analysis of this endpoint very low. The mean survival at the highest treatment level (31.5 µg/L) was only 41%, yet the statistical analysis failed to identify this as a significant reduction from the control.
Reviewer: Nicholas Mastrota, Biologist, ERB1
B3 (EC) - 10

Chemical Name: MalathionCAS NO: 121-75-5ECOTOX Record Number and Citation: 92183Sweilum, M.A. 2006. Effect of sublethal toxicity of some pesticides on growth parameters, maematological properties and total production of Nile tilapia (Oreochromis niloticus L..) and water quality of ponds. Aquaculture Research. 37:1079-89.
Purpose of Review: Endangered Species AssessmentDate of Assessment: 2/19/15Brief Summary of Study Findings: This study examined both malathion and dimethoate, but this review focuses on the results of malathion.MethodsNile tilapia (initial size of 12 cm and 40 g) were exposed to malathion (purity not reported) at concentrations of 0.5, 1.0, and 2.0 mg/L (malathion) in freshwater at a rate of 60 fish per tank; a control was also used. There were two replicates per concentration (fiberglass tanks, 3 m2), and water was exchanged weekly, continuously aerated and detritus (and feces) removed daily. Fish were fed a pellet diet six days a week at a rate of 3% average fish weight. The study was conducted for 24 weeks. Water temperature and dissolved oxygen were measured twice daily and total alkalinity, ammonia, nitrate and phosphate were measured monthly. Phytoplankton and zooplankton abundance was measure biweekly from 100L of test water (phytoplankton measured by 20 µm net, counted with a Sedwick Rafter Counting Cell and microscope; zooplankton by 50 µm net and Tray Counting Cell and microscope). Total length and body weight of the fish were measured biweekly. Specific growth rate (SGR) and normalized biomass index (NBI) were calculated along with total fish consumed, feed conversion ratio and protein efficiency ratio. Blood was collected from 15 fish per tank and the following parameters were measured: erythrocyte count, haematocrit percent, hemoglobin content, serum glucose, serum lipid, serum protein. Additional measurements included protein, lipid and glycogen content in muscles, and pesticide residues in liver, gills and muscles. Total fish production (wt x number of fish) and economic performance were also evaluated. Student's t-test were used to compare control and treatments. ResultsAfter 24 weeks, significant changes in water quality were observed at all test concentrations. (↓ dissolved oxygen; ↑ alkalinity, ammonia, nitrate and phosphate). Significant reductions in both phyto- and zooplankton were also observed (27, 33, 42% for phytoplankton and 25, 30 and 37% for zooplankton at 500, 1,000 and 2,000 µg/L, respectively). Survival rate in fish after 24 weeks was 87, 57, 50 and 47% for the control, 500, 1,000 and 2,000 µg/L, respectively. Also, effects on tilapia growth were observed at all concentrations including reductions in specific growth rate (17-27%) and normalized biomass index (6-12%). Furthermore, reductions in blood parameters (i.e., erythrocytes, haematocrit, glucose) and muscle protein and lipid levels were reported at all concentrations. Malathion was not detected in control tissues but was measured in a dose-responsive manner in the treatment groups and ranged from 5.85-11.15, 4.40-10.85 and 3.65-9.35 (mg/kg-wet weight), in the liver, gill and muscle tissue, respectively. Table 1. Phytoplankton and Zooplankton after 24 weeks Spp. (cell m-3) (mean of 12 samples plus SE)Phytoplankton control 2.0
mg/L1.0 0.5
B3 (EC) - 11

Chryophyta 360 (10) 210 (7) 241 (8) 286 (8)Chlorophyta 545 (22) 300 (9) 345 (9) 374 (9)Cyanophyta 220 (7) 155(5) 173 (4) 182 (5)Total 1125 655 759 824
zooplanktoncontrol 2 1 0.5
ciliophora 152 (4) 110 (2) 121 (2) 130 (3)rotifera 85 (2) 42 (1) 48 (1) 54 (1)cladocera 104 (3) 64 (2) 69 (1) 73 (2)copepoda 55 (1) 33 (1) 38 (1) 41 (1)Total 396 249 276 298
Table 2. Tilapia growth parametersspecific growth rate (SE)
control 2 1 0.51.33 (0.10) 0.97 (0.05) 1.03 (0.04) 1.1 (0.05)
Normalized biomass indexcontrol 2 1 0.533.99 (1.98) 30.06 (3.85) 31.25 (3.59) 31.89
(3.42)
Description of Use in Document: QualRationale for Use: Data from this study are useful for effects characterization of multiple taxa exposed concurrently to malathion, but is not for use as a direct effects threshold, in large part because of the potential for both direct and indirect effects to each taxon.Limitations of Study: 1) The purity of the malathion is not reported and is unknown if it was technical grade or a formulation; 2) test concentrations were not measured; 4) the source of the test organism were not reported, therefore, prior exposure to potential contaminants is not known.
Reviewer: Amy Blankinship, ERB6
B3 (EC) - 12
Chemical Name: Malathion
CAS NO: 121-75-5
ECOTOX Record Number and Citation: 11521
Khangarot, B.S., A. Sehgal, and M.K. Bhasin. 1985. Man and Biosphere – Studies on the Sikkim Himalayas. Part 6: Toxicity of Selected Pesticides to Frog Tadpole Rana hexadactyla (Lesson). Acta Hydrochim Hydrobiol. 13(3):391-394.
Purpose of Review: Litigation
Date of Assessment: 2/23/2009
Brief Summary of Study Findings:
The study was conducted to determine the 96-hour acute toxicity of malathion (and B.H.C. Bavistin, Calaxin, Carbaryl, Furadon, Endrin, Lebacid, Rogor, and Sodium Pentachlorophenate) to frog tadpole (Rana hexadactyla LESSON). The focus of this open literature review is on malathion, although other pesticides were tested. The reported 96-hour LC50 for malathion was 0.59 µg/L (with 95% CI = 0.43-0.78 µg/L).
Methods
Frog tadpoles were collected from a natural breeding ground and acclimated to laboratory conditions prior to exposure, although the specific location of the breeding ground and acclimation time were not provided. It is assumed that tadpoles were wild-caught; however, the potential for previous exposure to pesticides is unknown. The test specimens averaged 20 mm (15 to 25 mm) in length and 500 mg (350 to 800 mg) in weight. Tadpoles were fed only “water plants” and no artificial food during the unspecified acclimation period. Tests were conducted under static-renewal conditions with the overlying water renewed every 24 hours. The test substance was commercial grade malathion 50 EC formulation (0.0-dimethyl-phophoredithionate of diethyl mercapto succinate) and obtained from Bharat Petroleum Cooperation Ltd., Bombay, 400038; however, the % ai in the formulation is not specified. Acetone was used as the solvent; however, the concentration of solvent in each of the treatment concentrations and control was not specified. In addition, it appears that no negative control was tested concurrently with the solvent control. Three replicates of ten tadpoles were tested at each pesticide concentration including the control. According to the study authors, seven to 10 test concentrations were selected based on the results of preliminary bioassays; however the nominal exposure concentrations were not provided. In addition, no information was provided on the size or composition of the test containers.
The following mean physico-chemical data for test water were provided: air temperature = 16oC (14-19oC); water temperature = 14 oC (12-17oC); pH = 6.2 (6.0-6.4); acidity = 20 CaCO3 (16-28 CaCO3); alkalinity = 25 CaCO3 (20-40 CaCO3); total hardness = 20 CaCO3 (15-35 CaCO3); dissolved oxygen = 6.5 (5.5-8.0).
B3 (EC) - 13
Dead specimens were recorded and removed; and LC50 values including 95% confidence limits were calculated. The cumulative percentage mortality was plotted on a log-probit scale.
Results
According to the study authors, no mortality was observed in the control experimental jars. Abnormal behaviors including surfacing, erratic body movements, and loss of equilibrium before death were observed after introducing the tadpoles to the test solutions. The following LC50 values (and 95% CIs) were reported for malathion: 12-h LC50 = 3.54 µg/L (2.91-4.30 µg/L); 24-h LC50 = 0.846 µg/L (0.798-0.94 µg/L); 48 and 72-h LC50 = 0.613 µg/L (0.55-0.69 µg/L); 96-h LC50 = 0.59 µg/L (0.43-0.78 µg/L).
Description of Use in Document: Qualitative
Rationale for Use: Data from this study are useful for qualitative characterization of acute endpoints for underrepresented aquatic-phase amphibians. The endpoint from this study is lower than the most sensitive acute freshwater fish endpoint; however, it is not used quantitatively to derive RQs given the limitations discussed below.
Limitations of Study: Limitations of the study that preclude its quantitative use in risk assessment include the following: 1) previous pesticide exposure history and location of wild-caught test species are not provided; 2) a negative control was not tested concurrently with the solvent control; 3) the concentration of solvent in the solvent control and treatment groups is not provided; 4) malathion exposure concentrations are not provided; 5) % a.i. of formulated product not specified; 6) duration of acclimation period is unspecified; and 7) no information is provided on the size and composition of test containers.
Reviewer: Anita Pease, Senior Biologist, ERB4
B3 (EC) - 14

Chemical Name: Malathion
CAS NO: 121-75-5
ECOTOX Record Number and Citation: 54278Sinha, S., U.N. Rai, and P. Chandra. 1995. Modulation of cadmium uptake and toxicity in Spirodela polyrrhiza (L.) Schleiden due to malathion. Environmental Monitoring and Assessment 38:67-73.
Purpose of Review: Litigation
Date of Assessment: April 22, 2010
Brief Summary of Study Findings:
Introduction
This paper reports on a study was undertaken to investigate the toxicity of malathion and cadmium to duckweed, and the effects malathion exposure to cadmium uptake. Aquatic plant toxicity studies were conducted with Spirodela polyrrhiza, or duckmeat, a vascular floating aquatic plant in the duckweed family (Lemnacea). The results on the phytotoxic effects of malathion without the presence of cadmium provide useful data for ecological risk assessment.
MethodsMature fronds of S. polyrrhiza were collected from an unpolluted water body and grown in a laboratory in 10% Hoagland’s nutrient solution. The percent active ingredient of the malathion was 96.26%.Two malathion treatment solutions were prepared with 10% Hoagland’s solution at concentrations of 10.0 and 25.0 mg/L. The nutrient solution without pesticides was used as a control. The experiment was conducted with three replicates at each test level. The pH was 7.5. Light was provided on a 14/10 L/D cycle at an intensity of 115 µ mole/m2 s. Temperature was 26±2 °C.
The phytotoxicity tests were initiated with the transfer of 32 fronds into vessels containing 100 ml of test solution. Tests were conducted for 7 days. Measured results included number of fronds, biomass (fresh weight), total chlorophyll content, and protein content. Results were obtained for plants after 24, 72, and 168 h.
Results
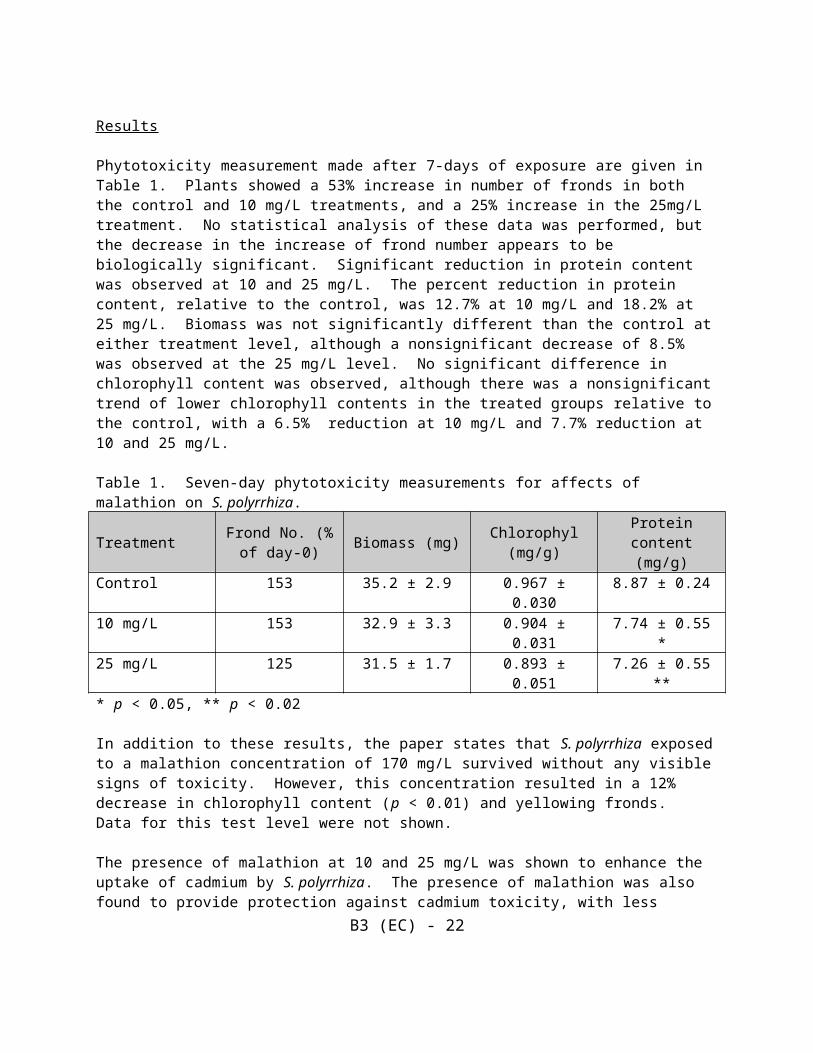
Phytotoxicity measurement made after 7-days of exposure are given in Table 1. Plants showed a 53% increase in number of fronds in both the control and 10 mg/L treatments, and a 25% increase in the 25mg/L treatment. No statistical analysis of these data was performed, but the decrease in the increase of frond number appears to be biologically significant. Significant reduction in protein content was observed at 10 and 25 mg/L. The percent reduction in protein content, relative to the control, was 12.7% at 10 mg/L and 18.2% at 25 mg/L. Biomass was not significantly different than the control at either treatment level, although a nonsignificant decrease of 8.5% was observed at the 25 mg/L level. No significant difference in chlorophyll content was observed, although there was a nonsignificant trend
B3 (EC) - 15

of lower chlorophyll contents in the treated groups relative to the control, with a 6.5% reduction at 10 mg/L and 7.7% reduction at 10 and 25 mg/L.
Table 1. Seven-day phytotoxicity measurements for affects of malathion on S. polyrrhiza.
Treatment Frond No. (% of day-0) Biomass (mg) Chlorophyl (mg/g) Protein content
(mg/g)Control 153 35.2 ± 2.9 0.967 ± 0.030 8.87 ± 0.2410 mg/L 153 32.9 ± 3.3 0.904 ± 0.031 7.74 ± 0.55 * 25 mg/L 125 31.5 ± 1.7 0.893 ± 0.051 7.26 ± 0.55 *** p < 0.05, ** p < 0.02
In addition to these results, the paper states that S. polyrrhiza exposed to a malathion concentration of 170 mg/L survived without any visible signs of toxicity. However, this concentration resulted in a 12% decrease in chlorophyll content (p < 0.01) and yellowing fronds. Data for this test level were not shown.
The presence of malathion at 10 and 25 mg/L was shown to enhance the uptake of cadmium by S. polyrrhiza. The presence of malathion was also found to provide protection against cadmium toxicity, with less toxicity being observed with higher concentrations of malathion.
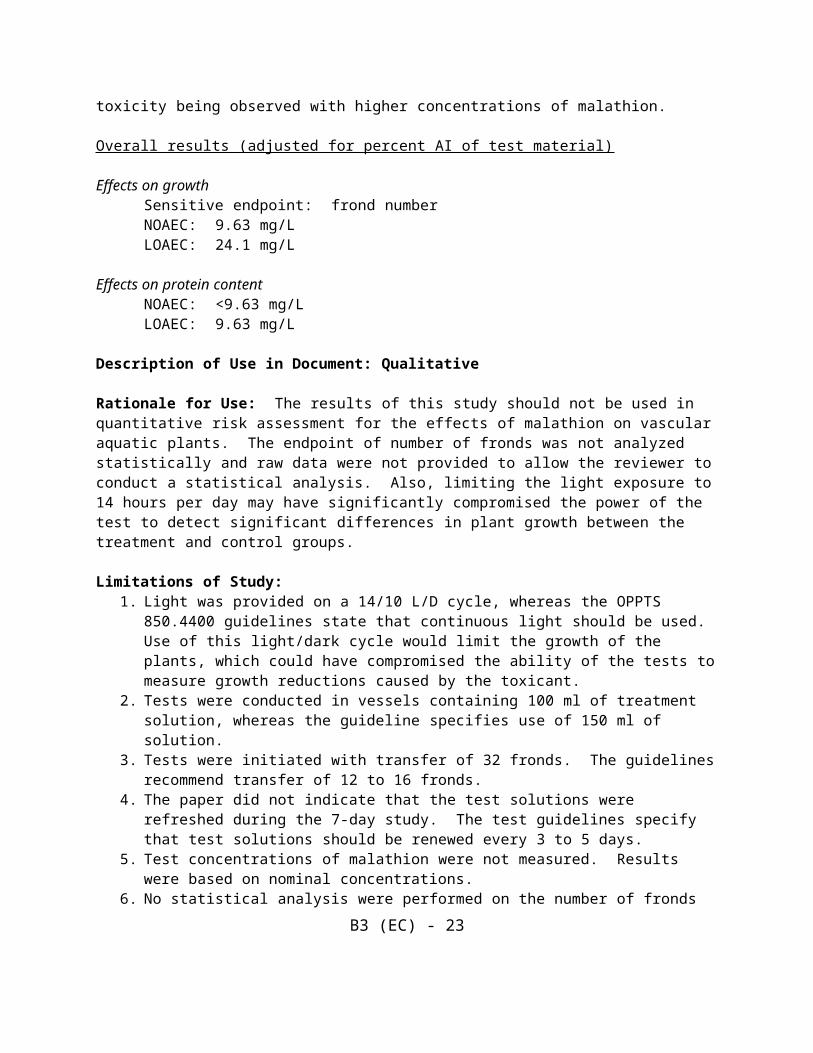
Overall results (adjusted for percent AI of test material)
Effects on growth Sensitive endpoint: frond numberNOAEC: 9.63 mg/LLOAEC: 24.1 mg/L
Effects on protein content NOAEC: <9.63 mg/LLOAEC: 9.63 mg/L
Description of Use in Document: Qualitative
Rationale for Use: The results of this study should not be used in quantitative risk assessment for the effects of malathion on vascular aquatic plants. The endpoint of number of fronds was not analyzed statistically and raw data were not provided to allow the reviewer to conduct a statistical analysis. Also, limiting the light exposure to 14 hours per day may have significantly compromised the power of the test to detect significant differences in plant growth between the treatment and control groups.
Limitations of Study: 1. Light was provided on a 14/10 L/D cycle, whereas the OPPTS 850.4400 guidelines state that
continuous light should be used. Use of this light/dark cycle would limit the growth of the plants, which could have compromised the ability of the tests to measure growth reductions caused by the toxicant.
2. Tests were conducted in vessels containing 100 ml of treatment solution, whereas the guideline specifies use of 150 ml of solution.
B3 (EC) - 16

3. Tests were initiated with transfer of 32 fronds. The guidelines recommend transfer of 12 to 16 fronds.
4. The paper did not indicate that the test solutions were refreshed during the 7-day study. The test guidelines specify that test solutions should be renewed every 3 to 5 days.
5. Test concentrations of malathion were not measured. Results were based on nominal concentrations.
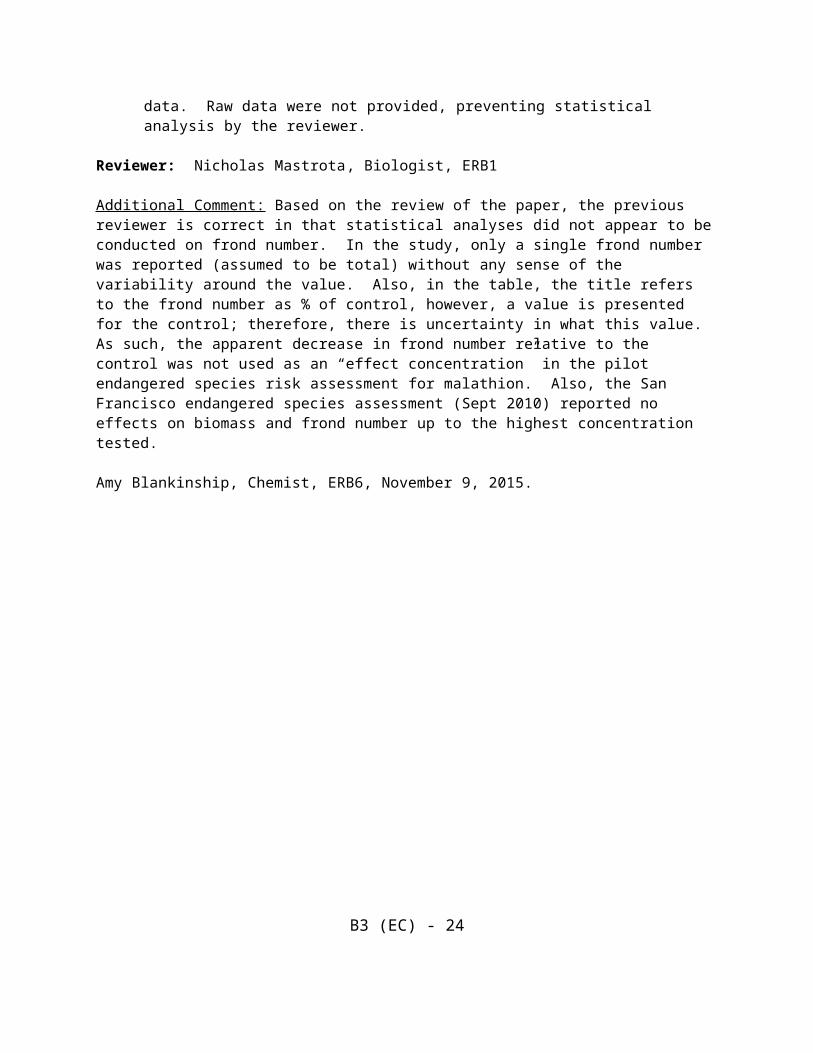
6. No statistical analysis were performed on the number of fronds data. Raw data were not provided, preventing statistical analysis by the reviewer.
Reviewer: Nicholas Mastrota, Biologist, ERB1
Additional Comment: Based on the review of the paper, the previous reviewer is correct in that statistical analyses did not appear to be conducted on frond number. In the study, only a single frond number was reported (assumed to be total) without any sense of the variability around the value. Also, in the table, the title refers to the frond number as % of control, however, a value is presented for the control; therefore, there is uncertainty in what this value. As such, the apparent decrease in frond number relative to the control was not used as an “effect concentration” in the pilot endangered species risk assessment for malathion. Also, the San Francisco endangered species assessment (Sept 2010) reported no effects on biomass and frond number up to the highest concentration tested.
Amy Blankinship, Chemist, ERB6, November 9, 2015.
B3 (EC) - 17

Chemical Name: Malathion
CAS NO: 121-75-5
ECOTOX Record Number and Citation: 85816
Yeh, H.J. and C. Y. Chen. 2006. Toxicity assessment of pesticides to Pseudokirchneriella subcapitata under air-tight environment. Journal of Hazardous Materials A131:6-12. MRID 48078001
Purpose of Review: Litigation
Date of Assessment: April 14, 2010
Brief Summary of Study Findings:
IntroductionThis paper evaluates a novel method of algal toxicity testing using closed-system apparatus that creates an air-tight environment for the algal growth medium, thereby eliminating lose of test material through volatilization. Seven pesticides were testes: atrazine, dichlorvos, fenthion, malathion, MCPA, parathion, and pentachlorophenol. The test species was the green alga Pseudokirchneriella sucapitata. Two response variables, algal cell density and dissolved oxygen, were measured. This review evaluates the data obtained in this study for the toxicity of malathion.
MethodsThe test was conducted in 300-ml BOD-bottles that were completely filled with growth medium and toxicant. Stock solutions were prepared using reagent grade chemicals, and the toxicant concentration of stock solutions were confirmed using a HPLC analyzer. For the test of malathion, nominal test concentrations were 0.5, 1.2, 2, 4, and 6 mg/L. A control was also used. The initial cell density was 15,000 cells/ml. During the 48 hours of the test, the bottles were placed in an orbital shaker at 100 rpm and placed under light with intensity of 65 µE/m2s ± 10%. The test was performed at a temperature of 24 ± 1 °C. The initial pH was 7.5. These environmental conditions agree with recommended parameters of the OPPTS test guideline.
The test was terminated after 48 hours. Initial and final dissolved oxygen levels were measured in each test bottle. Final cell density was also measured. Based on change of dissolved oxygen and change of cell density, 48-h EC50 values were estimated based on ratios of the change in cDO and cell density using the probit model. Inhibition rates (treatment value divided by the control value) was used to calculate the EC50’s. The reviewer recalculated the EC50 based on the final cell density values using the Nuthatch program, a program that utilizes the Bruce and Versteeg nonlinear regression method for estimating ECx values for continuous endpoints. NOEC values were calculated using the one-tailed Dunnett’s procedure.
Results
B3 (EC) - 18

The raw toxicity data for the test with malathion are given in Table 1. Based on the inhibition ratio of the change in dissolved oxygen, the authors calculated an EC50 of 2.04 mg/L and determined the NOEC to be 0.5 mg/L. Based on the inhibition ratio of the change in cell density, the authors calculated an EC50 of 2.04 mg/L and determined the NOEC to be 0.5 mg/L.
Table 1. Raw toxicity data for the test of the effects of malathion on green algae.Concentration(mg ai/L)
Initial DO (mg/L) Final DO (mg/L) Final cell count (cells/ml)
Control 2.70 8.85 294,4676 3.38 3.50 32,3334 2.85 3.82 43,9672 2.45 5.79 185,4671.2 2.29 7.05 283,2330.5 2.62 8.41 300,333
Based on the inhibition ratio of the change in dissolved oxygen, the authors calculated an EC50 of 2.04 mg/L (95% C.I. 1.24 – 4.86 mg/L) and determined the NOAEC to be 0.5 mg/L. Based on the inhibition ratio of the change in cell density, the authors calculated an EC50 of 2.32 mg/L (95% C.I. 1.47 – 1.94 mg/L) and determined the NOAEC to be 0.5 mg/L. These results were recalculated by the reviewer using the standard endpoint (final cell density) and the standard statistical method (Bruce and Versteeg method of nonlinear regression for continuous endpoints, Nuthach program). These verified results are given below.
48-hour EC50: 2.4 mg/L 95% C.I.: 1.5 to 3.6 mg/LSlope: 3.58 Standard error of slope: 0.637
Description of Use in Document: Quantitative
Rationale for Use: The algal toxicity tests performed appeared to be scientifically sound and in general agreement with OPPTS test guidelines. They may be used quantitatively in ecological risk assessments, although consideration should be made for the results being for 48 h exposure rather than the 96 h exposure period that conducted for fulfilling test guideline 850.5400.
Limitations of Study: 1. The test was conducted for 48 hours, whereas the OPPTS test guideline calls for a test duration
of 96 hours.2. An initial cell density of 15,000 cells/ml was used, whereas the test OPPTS test guideline
recommends approximately 10,000 cells/ml.3. The ratios of each dose to the next lower dose varied between 1.5 and 2.0. The guideline
recommends using a geometric series with a consistent dose ratio. However, the doses appeared to be well placed for defining the dose-response curve.
4. The pH was measured only at the beginning of the test, but not at the end.5. Although all tests were conducted with three replicates, only a single value (presumably the
B3 (EC) - 19

mean) was presented for each test concentration. Therefore, the statistical determination of the NOAEC could not be verified.
Reviewer: Nicholas Mastrota, Biologist, ERB1
------------------------------------------------------------------------Program: Nuthatch Date: 4/14/10------------------------------------------------------------------------Toxicity measurement for continuous endpoints, using weighted nonlinearregression, weighting proportional to predicted means.
Reference--------- R.D. Bruce and D.J. Versteeg. 1992. A statistical procedure for modeling continuous toxicity data. Env. Tox. and Chem. 11:1485-1494.------------------------------------------------------------------------Input file: MALALGAL.TXT
Raw data: ------------------------------------------------------------------------
Malathion green alga6111111Control2944670.53003331.22832332.01854674.0439676.032333 ------------------------------------------------------------------------
In C:\DOCUME~1\GUEST\MYDOCU~1\NUTHATCH\MALALGAL.TXT : `Control`
B3 (EC) - 20

Interpreted as Dose = 0
B3 (EC) - 21
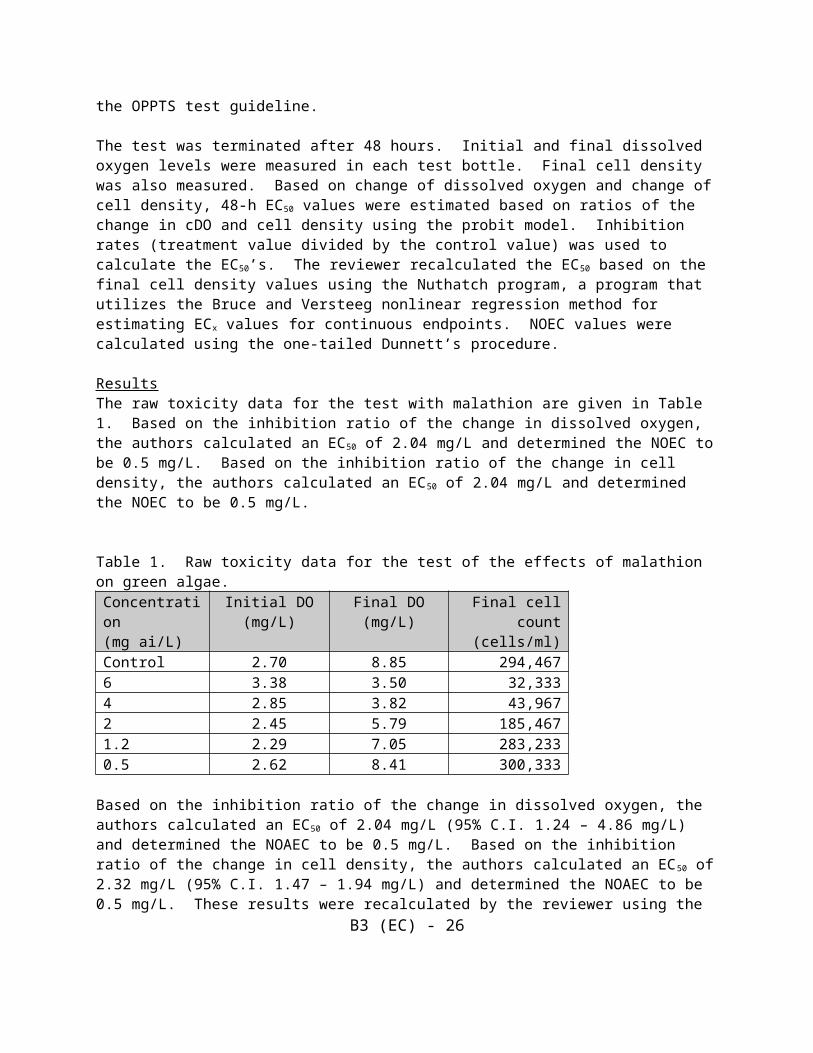
MALALGAL.TXT : Malathion green alga------------------------------------------------------------------------Estimates of EC% ------------------------------------------------------------------------Parameter Estimate 95% Bounds Std.Err. Lower Bound Lower Upper /EstimateEC5 0.82 0.32 2.1 0.13 0.39EC10 1.0 0.45 2.4 0.11 0.44EC25 1.5 0.82 2.9 0.085 0.53EC50 2.4 1.5 3.6 0.058 0.65
Slope = 3.58 Std.Err. = 0.637
------------------------------------------------------------------------MALALGAL.TXT : Malathion green alga------------------------------------------------------------------------Observed vs. Predicted Treatment Group Means ------------------------------------------------------------------------ Dose #Reps. Obs. Pred. Obs. Pred. %Change Mean Mean -Pred. %Control
0.00 1.00 2.94e+05 3.06e+05 -1.16e+04 100. 0.00 0.500 1.00 3.00e+05 3.04e+05 -3.34e+03 99.2 0.791 1.20 1.00 2.83e+05 2.61e+05 2.21e+04 85.3 14.7 2.00 1.00 1.85e+05 1.84e+05 1.59e+03 60.1 39.9 4.00 1.00 4.40e+04 6.28e+04 -1.88e+04 20.5 79.5 6.00 1.00 3.23e+04 2.23e+04 1.00e+04 7.28 92.7
Chemical Name: MalathionCAS NO: 121-75-5
ECOTOX Record Number and Citation: 119266
Wendel, C.M. and D.L. Smee. 2009. Ambient malathion concentrations modify behavior and increase mortality in blue crabs. Mar. Ecol. Prog. Series. 392: 157-165.
Purpose of Review: Endangered Species Assessment
Date of Assessment: 2/16/15
Brief Summary of Study Findings:
Methods
Two life-stages of blue crabs (Callinectes sapidus) were tested: adults (90-193 mm carapace width) and juveniles (8-35 mm carapace width) and were acclimated for two days prior to exposure. Crabs were collected from either the upper Laguna Madre, Corpus Christi Bay and Nueces Bay, Texas (adults) or Corpus Christi Bay (juveniles). Adult and juvenile crabs were tested at two salinity ranges (17-21 or 36-40 ppt). Adult crabs were individually held (glass aquaria) in 15L of aerated artificial seawater (tap water treated with Top Fin®dechlorinator and Instant Ocean™) and juvenile crabs were held individually in 0.125L (plastic containers). Adult and juvenile crabs were exposed to test concentrations of 0.32, 1.0 and 11.2 ppb (not adjusted for malathion (50% formulation), personal communication C. Wendel Jan. 2015); a control group was also used. Malathion solutions were prepared by pipetting the 50% malathion solution into the dilution water and swirling to mix; test solutions were not analyzed. Crabs were randomly assigned to treatments; equal numbers of male and female crabs were used in each treatment. In the juvenile mortality study, there were at least 21 juvenile crabs in each treatment (sample sizes of 46, 43, 46 and 44 for control, low, mid and high, respectively) and 12 adult crabs in each treatment. Mortality (death determined by lack of movement after gentle prodding) of adult and juvenile crabs were measured in 12 hour increments over a total of five days. Two-way analysis of variance (ANOVA) was used to compare the effect of salinity and pesticide concentrations on survival time (salinity and test concentration were fixed). The percentage of time periods with alive crabs were also analyzed (ANOVA). Malathion had a significant effect on mortality, but salinity did not, nor was the interaction significant. Tukey-Kramer post hoc tests were used to evaluate pesticide concentration and mortality.
Behavioral studies were conducted on adult crabs using the same methods as described above. Righting time behavior was measured (time it takes for a crab to right itself after being placed on its back). Righting time was measured to the nearest tenth of a second from placing the crab on its back to when the crab reached the half-way point. This righting time was measured after the 2 day acclimation period (prior to exposure) and one hour after malathion exposure. The overall righting time was calculated by subtracting the time measured prior to exposure from time after exposure. ANOVA analyses similar to ones described above were used.
Results
2
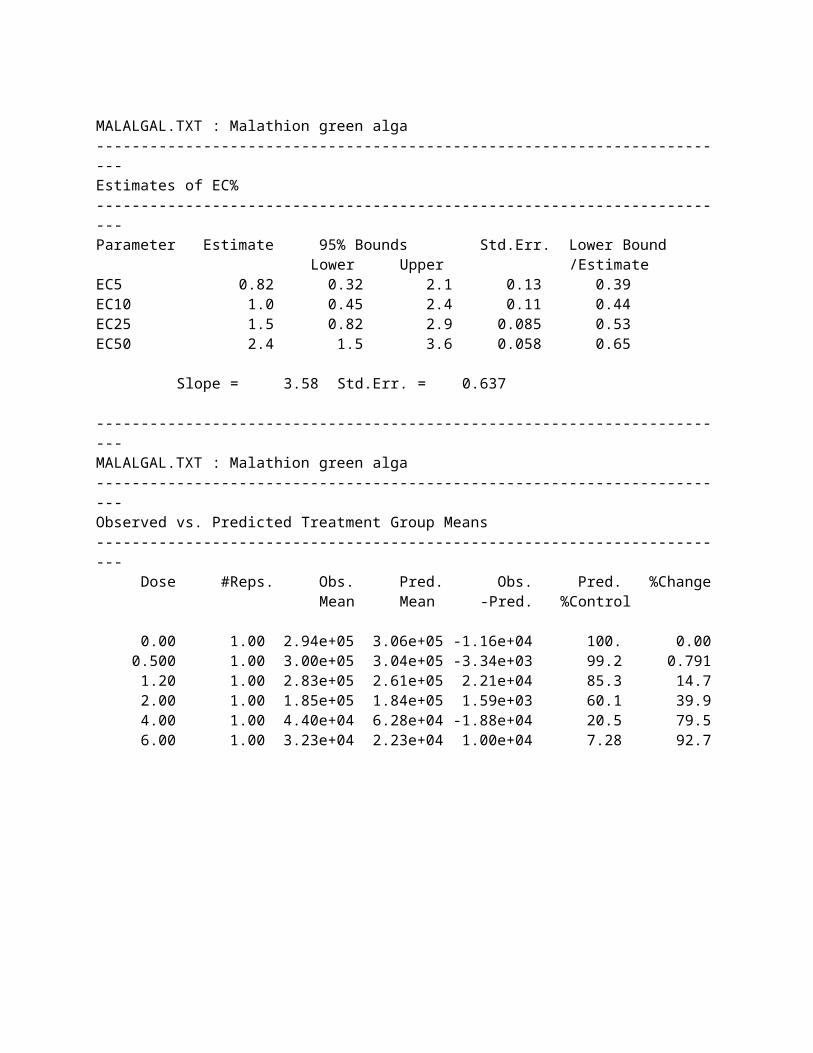
Juvenile mortality was significantly increased in the mid (30%; 14 out of 46) and high (90%; 40 out of 44) treatments compared to the control (4%; 2 out of 46); based on the mortality numbers in the study (61 total died in malathion treatments), this means 7 died in the low treatment (61-54=7). In the adult crab survival assay, mortality was significantly increased in the high (25%) treatment compared to control (4%). While not significant, 17% of the adult crabs in the mid treatment also died (Figure 3 in study; shown below).
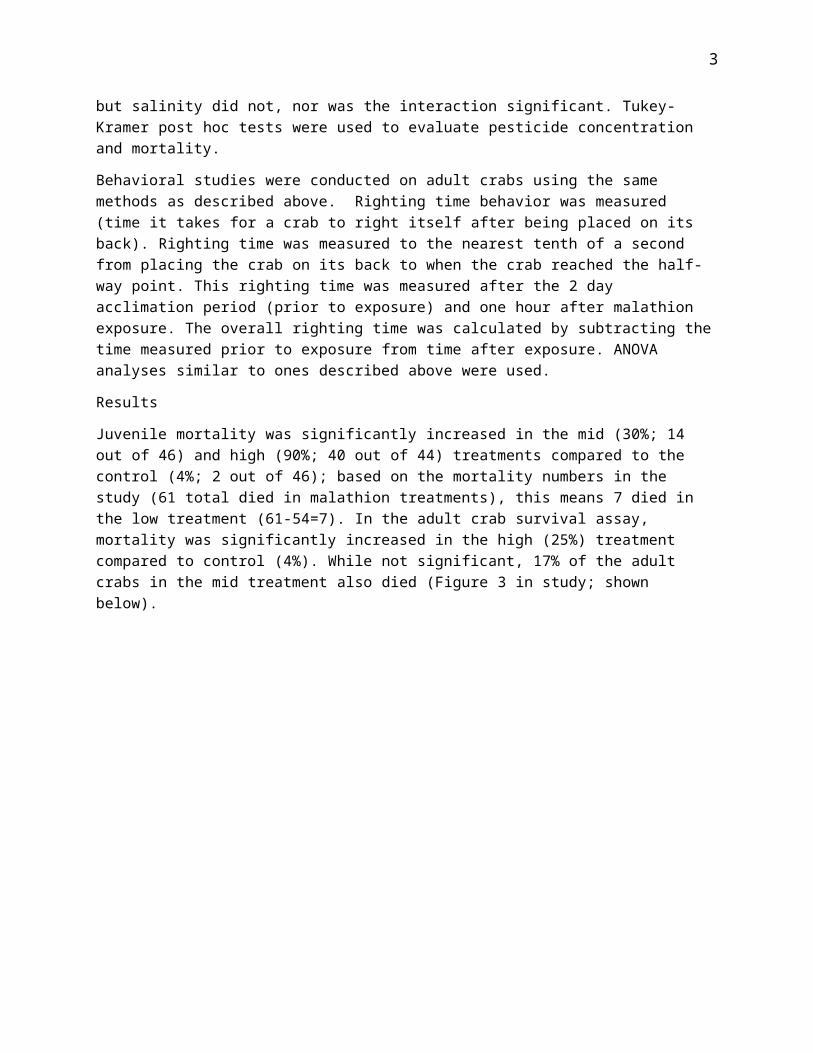
For the righting time experiment, crabs in the high treatment group took significantly longer to right themselves than the control (approximately 40 seconds longer based on Figure 4 in paper; shown below).
3

Description of Use in Document: Qualitative, may be used as an endpoint for refinement for estuarine/marine invertebrates for mortality and sublethal threshold.
Rationale for Use: Data from this study are useful as a refinement for a threshold value for both acute mortality and sublethal effects for E/M invertebrates.
Limitations of Study: 1) due to some mortality in juvenile crabs, unequal number of organisms were used in the mortality experiment, this may have had the biggest impact on the low treatment group. However since an equal number was used in the mid treatment compared to the control and while two less were exposed in the high treatment, high mortality was also observed in this treatment ; 2) test concentrations were not measured in the static study, therefore, exposure over the duration of the study in unknown; 3) as test organisms were collected from field, prior exposure to potential contaminants is not known.
Reviewer Comment: As the test concentrations were not adjusted for purity in the paper, the reviewer adjusted the test concentrations for purity (50%). The test concentrations used in the assessment (and as reported in ECOTOX) are: 0.16, 0.5, and 5.6 ppb (referred to as µg/L).
Reviewer: Amy Blankinship, ERB6
4
Chemical Name: Malathion
PC Code: 057701
ECOTOX Record Citation:
Caldwell RS. 1977. Biological Effects of Pesticides on the Dungeness Crab. EPA-600/3-77-131, U.S.EPA, Gulf Breeze, FL : 143 p. E6793
Purpose of Review: Endangered Species Assessment
Date of Review:
March 1, 2015
Summary of Study Findings:
MethodsAcute 96-hr toxicity tests were conducted with first instar zoeae and adult Metacarcinus magister formerly Cancer magister (Dungeness crab). For the zoeae, both 96-hr EC50 (inhibition of swimming) and 96-hr LC50 values were determined and 96-hr LC50 values for adults. Larvae were collected from two female crabs (females held in laboratory 5-12 days prior to collection; collected in ocean off of Newport by commercial fisherman). Adults crabs were field collected (Yaquina Bay, OR) and acclimated 5 days at 13 ± 1°C and 25±0.5‰ (natural seawater). The assays were conducted in 250mL glass beakers w/200mL test solution for zoeae and 12L glass jars with 10L test solution for adults. Twenty and 10 organisms were test per concentration in the zoeae and adult study, respectively. Tests were conducted at 13 ± 1°C and 25±0.5‰ with photoperiods of 9:15 L:D for the zoeae and 12:12 for adults. Technical grade malathion (95%, source, American Cyanamid, lot # not specified) was dissolved in acetone and solvent concentration was 100 µL/L. Negative and solvent control groups were used. Test concentrations were 0.00090-0.90 µg/L in the study with zoeae, and were 33-3300 µg/L for the adult assay. Test solutions were renewed daily, and pH and dissolved oxygen were measured daily. Aeration was added in the adult test. Organisms were not fed during study. Additional studies were conducted with included evaluating early developmental stages (egg hatching success, development of prezoeae into first stage zoeae and zoeal motility) after 24-hr exposure to malathion. Chronic studies (70 day studies) were also conducted on zoeal and adults.
Results
Acute Toxicity – EC50 and LC50
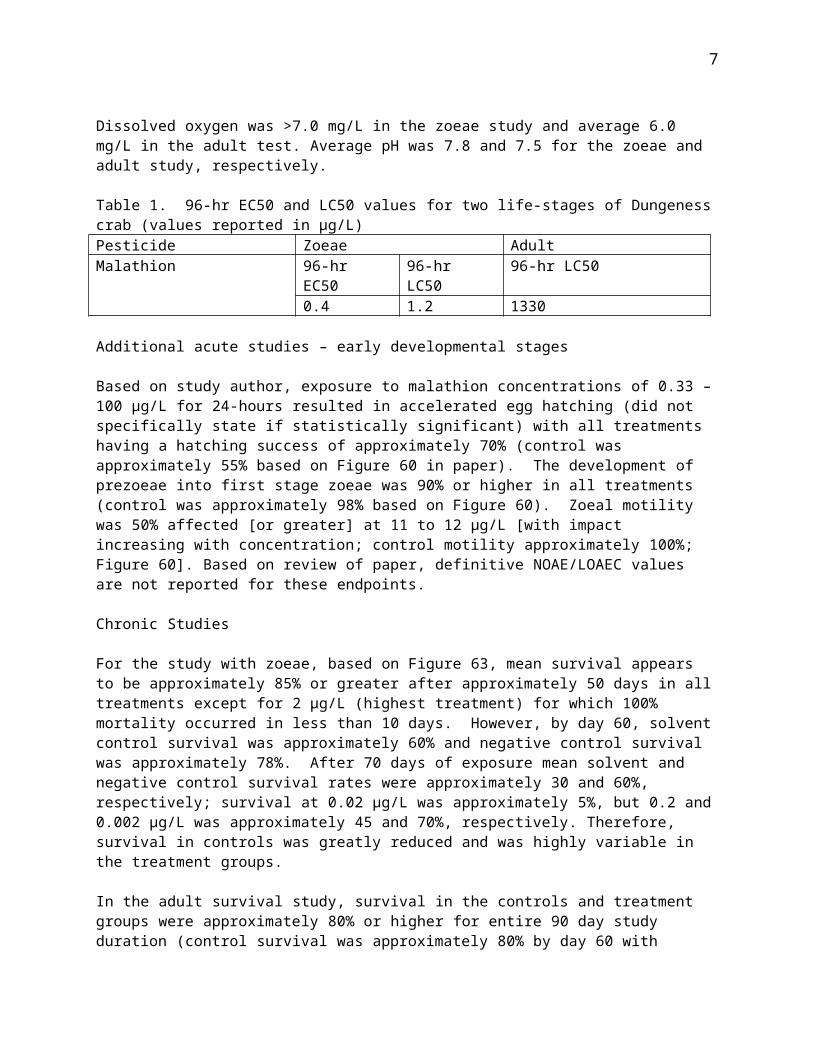
Dissolved oxygen was >7.0 mg/L in the zoeae study and average 6.0 mg/L in the adult test. Average pH was 7.8 and 7.5 for the zoeae and adult study, respectively.
Table 1. 96-hr EC50 and LC50 values for two life-stages of Dungeness crab (values reported in µg/L)Pesticide Zoeae AdultMalathion 96-hr EC50 96-hr LC50 96-hr LC50
0.4 1.2 1330
Additional acute studies – early developmental stages
Based on study author, exposure to malathion concentrations of 0.33 – 100 µg/L for 24-hours resulted in
5

accelerated egg hatching (did not specifically state if statistically significant) with all treatments having a hatching success of approximately 70% (control was approximately 55% based on Figure 60 in paper). The development of prezoeae into first stage zoeae was 90% or higher in all treatments (control was approximately 98% based on Figure 60). Zoeal motility was 50% affected [or greater] at 11 to 12 µg/L [with impact increasing with concentration; control motility approximately 100%; Figure 60]. Based on review of paper, definitive NOAE/LOAEC values are not reported for these endpoints.
Chronic Studies
For the study with zoeae, based on Figure 63, mean survival appears to be approximately 85% or greater after approximately 50 days in all treatments except for 2 µg/L (highest treatment) for which 100% mortality occurred in less than 10 days. However, by day 60, solvent control survival was approximately 60% and negative control survival was approximately 78%. After 70 days of exposure mean solvent and negative control survival rates were approximately 30 and 60%, respectively; survival at 0.02 µg/L was approximately 5%, but 0.2 and 0.002 µg/L was approximately 45 and 70%, respectively. Therefore, survival in controls was greatly reduced and was highly variable in the treatment groups.
In the adult survival study, survival in the controls and treatment groups were approximately 80% or higher for entire 90 day study duration (control survival was approximately 80% by day 60 with treatment group survival similar or higher), except for 1,500 µg/L (nominal; measured was 2400 µg/L) where 100% mortality was observed by approximately day 11 (Figure 69). Measured test concentrations in the adult assay were: 2400±1600, 180±40, 15±5, and 1.2±0.5 µg/L.
Description of Use in Document (QUAL, QUAN, INV): Qual.Rationale for Use: Data from this study are useful for characterization of acute mortality to estuarine/marine invertebrates (currently SSD used to establish thresholds). Other endpoints may also be used qualitatively, and are higher than threshold values.Limitations of Study:Main reasons:
1. Control mortality (negative and solvent) were not reported for the acute LC/EC50 studies with first instar zoeae and adults.
2. Test concentrations were not measured in the chronic malathion test with zoeae and were variable for the adult chronic assay. Test solutions did not appear to be measured in the acute assays either.
Other limitations:3. Animals were field collected, therefore, prior exposure history to potential contaminants is
unknown.4. Variability (e..g, 95% confidence intervals) were not reported for the LC or EC50 values.
Primary Reviewer:Amy Blankinship, ERB6Secondary Reviewer
6

Chemical Name: Malathion PC Code: 057701ECOTOX Record Citation:Wong, C.K., K.H. Chu, and F.F. Shum. 1995. Acute and chronic toxicity of malathion to the freshwater cladoceran Moina macrocopa. Water, Air and Soil Poll. 84(3/4): 399-405.Purpose of Review: Endangered Species AssessmentDate of Review:March 1, 2015Summary of Study Findings:MethodsEffects of malathion to Moina macrocopa after acute and chronic exposures were evaluated. M.macrocopa (7 replicates of 10 animals each) were exposed to malathion (Imperial Chemicals, Inc., United Kingdom commercial formulation of 81 % purity) at 6 concentrations ranging from 0.01 μg/L to 50 μg/L(as active ingredient) in acute studies, and 3 replicates with 10 animals/replicate were exposed to4 concentrations ranging from 0.01to10 μg/L in chronic studies. 75mL beaker containing 50mL of test solution were used and algal cells were added to each beaker as a food source (Chlorella pyrenoidosa). Xylene was used as a solvent, and a solvent control (10 µg/L) was included in the test design (unsure if solvent part of formulation or added by study authors; solvent use may have only been for the chronic study). The study was a static renewal design. The temperature was kept at 25°C. Mortality was evaluated by examining animals under a microscope for presence of a heartbeat. Endpoints evaluated included mortality and reproduction (number of live young produced). Calculation of LC50 values was not made by probit analysis as the regression lines did not provide adequate fit to that model. Instead these values were manually interpreted from the fitted curves. In the chronic study, survival was analyzed using the Mann-Whitney test, with day of death as ranked observation.
Results
In the acute 72-hr study, mortality was somewhat elevated at all test levels by 72 hours; control mortality not reported. Mortality rates increased to >50% between 5 μg/L and 10 μg/L. The results of this investigation demonstrated that the 24, 48, and 72 hour LC50 values for malathion were between 5 and and 10.00 μg/L (actual acute LC50 values not reported).
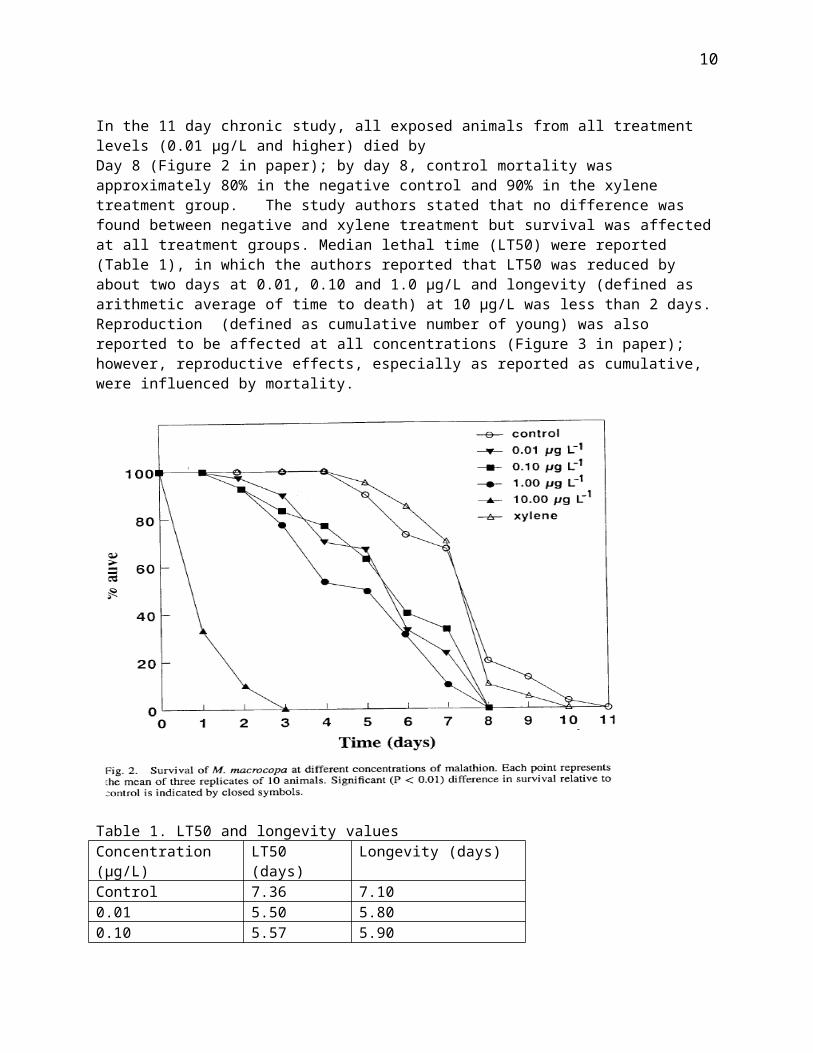
In the 11 day chronic study, all exposed animals from all treatment levels (0.01 μg/L and higher) died byDay 8 (Figure 2 in paper); by day 8, control mortality was approximately 80% in the negative control and 90% in the xylene treatment group. The study authors stated that no difference was found between negative and xylene treatment but survival was affected at all treatment groups. Median lethal time (LT50) were reported (Table 1), in which the authors reported that LT50 was reduced by about two days at 0.01, 0.10 and 1.0 µg/L and longevity (defined as arithmetic average of time to death) at 10 µg/L was less than 2 days. Reproduction (defined as cumulative number of young) was also reported to be affected at all concentrations (Figure 3 in paper); however, reproductive effects, especially as reported as cumulative, were influenced by mortality.
7

Table 1. LT50 and longevity valuesConcentration (µg/L) LT50 (days) Longevity (days)Control 7.36 7.100.01 5.50 5.800.10 5.57 5.901.0 5.00 5.1010 0.75 1.43xylene 7.50 7.65
8
Description of Use in Document (QUAL, QUAN, INV): Qual.Rationale for Use: Data from this study may be used to characterize mortality and reproduction to aquatic invertebrates, there are limitations with this study that limit its use. Limitations of Study:Main reasons:
1. Variability around the mean endpoint values are not reported. While the study authors state that survival and reproduction the treatment groups were significantly different than the control, there is uncertainty in the time component of this. In Figure 2, the study authors state that differences between the treatments and control are indicated by closed circles for which each measured value at each time point for all treatments are closed circles. In looking at the figure, while there does appear to be a visual decrease in mean survival and reproduction at the test concentration compared to the controls over time (variability around the mean value not provided), it appears that at least for some of the days (at beginning of study), the treatments do not appear to be different from the control. The lack of understanding variability around the mean value adds to this uncertainty. Also for survival, control mortality was approximately 20% by day 8 which is far below recommended (OCSPP 850 and ASTM) control survival rates.
2. For the acute mortality rates, definitive LC50 values were not reported, only the range in which the LC50 was estimated to be between.
Other limitations:5. Water chemistry parameters were not reported.6. Test concentrations were not measured.7. Xylene was added as a treatment group. There is uncertainty in whether this was added due
9

to xylene being present in the formulation or xylene was used to solubilize the test material (a formulation). It is also unclear whether this treatment group was added for both the acute and chronic or only chronic.
8. Mortality rates were not reported for the control group in the acute study.Primary Reviewer:Amy Blankinship, ERB6Secondary Reviewer
10
Chemical Name: Malathion PC Code: 057701ECOTOX Record Citation:Cothran, R. D., R.L. Greco and R.A. Relyea. 2009. Environ. Toxicol. 25(3): 310-314. No Evidence that a Common Pesticide Impairs Female Mate Choice in a Freshwater Amphipod. E120900Purpose of Review: Endangered Species AssessmentDate of Review:March 1, 2015Summary of Study Findings:MethodsHyalella spp. were field collected (from Lake Le Boueuf, Erie County PA near shore habitats to try to ensure the same species (B clade spp. collected)) and maintained in 90L wading pools with a 60% shade cloth. Studies conducted indoors at 22.7±0.9°C on a 12:12 light cycle, and amphipods were not fed during acute mortality studies. Seven malathion treatments each with five replicates (99.1%, Chem Service Lot No. 396-71B) were used for each study. Three different amphipod classes were evaluated: females, small males and large males. Well water and solvent control (1% ethanol) were also included, and test solutions were renewed daily (96 hr exposure). Several test concentrations were measured: nominal concentrations of 10.0, 5.0, 1.0, 0.05, and 0.01 µg/L; actual concentrations 10.4, 1.52, 0.16, 0.05, and none detected (ND; LOD 0.05 µg/L) µg/L. Petri dishes (100 mm x 20mm) were filled with 40mL of test solution and a Nitex screen (2cm2) was added for substrate. Ten organisms were added to each dish. Males were visually assigned to size class and confirmed based on measurement of head length on a subset of organisms. Mortality was recorded daily. 96-hr LC50 values were calculated using probit regression analysis. Additionally, repeated measures ANOVA and Tukey tests were used to test for effect of malathion concentration on survival. The authors stated that the goal of the acute mortality test was to derive sublethal concentrations to examine potential effects on female mate choice. In the sublethal test, experimental units were the same as the acute study except that the amphipods were fed during the study (Tetramin and spirulina). Pairing patterns (females with either small or large males) were observed for three malathion concentrations (0.55, 0.38 and 0.05 µg/L) four times daily. There were 20 replicates per treatment level. A replicate was excluded if a pairing was missed (presence of embryos; 25% of cases) or an individual died (28% of cases). Pearson X2 test used to evaluate pairing patterns and malathion treatments.
Results
There were no significant differential sensitivity in acute exposure among the groups. Control mortality was 6.22-12.22% in females, 2-20% in small males and 34-38% in large males. The 96-hr LC50 values are reported below (study contained figures for each test group presenting cumulative mortality at 24 hr intervals). Given the higher mortality rate in the large males, the study authors emphasized caution in the large male toxicity values. There were no effects reported for female mate choice.
Test Group 96-hr LC50 µg/L 95% CIFemales 0.06 0.02-0.16Small males 0.19 0.07-0.49Large males 0.08 0.03-0.21
11
Description of Use in Document (QUAL, QUAN, INV): Quantative for SSD for acute LC50 values for females and small males. Invalid for large males.Rationale for Use: Data from this study are useful for characterization of acute mortality to freshwater invertebrates (currently SSD used to establish thresholds). Limitations of Study:Main reasons:
3. Control mortality for large males was high (34-38%) and therefore, the acute LC50 values were not considered reliable.
Other limitations:9. Animals (tadpole eggs and zooplankton) and algae were field collected, therefore, prior
exposure history to potential contaminants is unknown.10. Additionally, it was acknowledged that different species of Hyalella may have been present
in the assays (although measures to limit this were reported during collection). In the female mate choice, examination of potential influence of different species was reported and no impact was observed.
11. The lowest treatment group in the acute studies was below the limit of detection and since the measured concentration in the other treatments were not always at/near nominal, there is uncertainty in what the actual concentration was in this treatment as well as how it was reported in the LC50 calculations.
Primary Reviewer:Amy Blankinship, ERB6Secondary Reviewer
12

Chemical Name: MalathionCAS NO: 121-75-5ECOTOX Record Number and Citation: 103059McCarthy ID and Fuiman LA. 2008. Growth and Protein Metabolism in Red Drum (Sciaenops ocellatus) Larvae Exposed to Environmental Levels of Atrazine and Malathion. Aquat. Toxicol. 88: 220-229
Purpose of Review: Endangered Species Assessment
Date of Assessment: 2/19/15
Brief Summary of Study Findings:
MethodsRed drum larvae (Sciaenops ocellatus; 7-8 mm length and 17-21 days post-hatch) from laboratory cultures were exposed to malathion (98%) and atrazine (98%) which was dissolved in acetone. The solvent concentration did not exceed 10 µL/L in the exposure tanks (50L fiberglass tanks). Two replicates were used for each treatment group: 40 and 80 µg/L for atrazine and 1 and 10 µg/L for malathion; a solvent control was also used. Test solution samples were collected 5 minutes and 96 hours after exposure. 500 larvae were used in each experiment. Based on the study, it appears that the assay was repeated four times for each chemical using a different spawn for each assay. Results are presented as means across the repeat studies (spawns). Distilled water was added daily to account for evaporation (renewal of test solutions was not reported), and water temperature and salinity were maintained at 26.1±0.1 ◦C and 28.9±0.1PSU. Larvae were fed daily brine shrimp (Artemia salina) nauplii and maintained on a 12:12 L:D cycle. For each spawn/replicate, total length, wet weight and protein content were measured on days 0, 1, 2, 4 and 8. Protein synthesis measurements were conducted on day 2, 4, and 8. An average value was calculated for the duplicate tanks within each treatment. For growth 20 larvae were sampled from the culture on day 0 and from each treatment tank on days 1, 2, 4 and 8 approximately 24 hours after feeding. Total length was measured photographically. Protein synthesis was measured using the flooding dose method of Garlick et al 1980, modified by Houlihan et al 1995. The analysis was conducted using a sample of fish weighing 100 mg (wet weight) and the number of fish necessary (to reach 100 mg) was calculated using a set of equations based on total length. Growth rates were analyzed using analysis of covariance and protein synthesis rates were analyzed using two-way analysis of variance. Post-hoc pair-wise comparisons were conducted using least squares difference test.Results.Measured test concentrations are presented in Table 1. Neither atrazine nor malathion was detected in control. It was also reported that an average of 17±10% atrazine had degraded to desethyl-atrazine after 4 days. No other degradation products were detected.Table 1. Measured Test Concentrations (reprint from Table 1 in paper)Treatment (Nominal test concentration µg/L)
0 hr 96 hr
AtrazineLow (40) 37.43±5.71 33.33±0.8High (80) 80.51±1.21 58.71±10.99MalathionLow (1) 0.73±0.12 Trace
13

High (10) 7.42±0.32 1.33±0.15
AtrazineThere were no significant differences in growth rate based on length. The study author reported depressions in growth rates based on wet weight (p=0.05) and protein content (p=0.06), with a significant decreasing trend in growth rate for wet weight (p=0.01) (trend for protein content p value was 0.08). Data is presented in Figure 1 (based on Figure 1 in paper). Rates of protein synthesis were significantly increased at 40 µg/L on day 4 and 8 and at 80 µg/L on day 8 (shown as Table 2 below).
MalathionThere was no significant difference in growth rate based on length or protein content. The study author reported a significant depression in average growth rate based on wet weight (p=0.03) in fish exposed to malathion. While not significant, the trend for growth rates based on protein content was similar to wet weight. Data is presented in Figure 2, based on Figure 2 in paper. Rates of protein synthesis were reported to be significantly increased at 10 µg/L on day 2 only (Table 2 below did not indicate
14
significance for this day, treatment, review assumes it was an oversight).
15

Reviewer Comment: In an additional study from the same laboratory (E96028, Del Carmen Alvarez and Fuiman, 2006) that reported a similar test design and the same exact test concentrations, there were no significant effects (p=0.30) on growth rate (as dry weight), or effects on routine or escape behavior, or resting metabolic rate for malathion.
Description of Use in Document: QualRationale for Use: This information may be used in the effects characterization, but due to the lack of both a negative control, is not used quantitatively. As a negative control was not use, any potential effects from the use of a solvent could not be identified. A separate experiment was used to assess potential effects of the vehicle on mortality, but not on growth or behavioral endpoints. Also, based on the information provided, it is unclear whether a specific malathion treatment group was significantly different from control for growth rate (as wet weight). While significant decreasing trends in growth rates, based on wet weight or protein content, were reported, it appears that the pair-wise comparisons did not indicate any statistically significance between a specific treatment group and the control. and as such, a definable NOAEC or LOAEC could not be determined.Other Limitations of Study: 1) Data from four replicates (spawns) were available for days 0, 1, 2 and 4, however, data from only 3 replicates (spawns) were available for day 8. The reason for the loss of one replicate on day 8 is not clear; 2) while the test duration was 8 days, chemical analysis was only conducted on day 0 and 4; 3) Distilled water was added daily to account for evaporation, but the amount(s) added were not reported nor the impact of this evaporation/addition had on test solutions (homogeneity of solutions); 4) while it was stated that the solvent concentrations used was previously shown to not impact survival of larvae, any information on mortality/survival rates in this study in the control or treatment groups were not provided.
Reviewer: Amy Blankinship, ERB6
16

Chemical Name: MalathionCAS NO: 121-75-5ECOTOX Record Number and Citation: 118292Relyea, R.A. and N. Diecks. 2008. An unforeseen chain of events: lethal effects of pesticides on frogs at sublethal concentrations. Ecolog. App. 18(7): 1728-1742.Purpose of Review: Endangered Species AssessmentDate of Assessment: 2/19/15Brief Summary of Study Findings:
MethodsTwo amphibian species, wood frogs (Rana sylvatica) and leopard frogs (Rana pipiens) were exposed to malathion along with peri- and phytoplankton and zooplankton at two different amphibian larvae densities (high and low) in aquatic mesocoms (approx. 1000L well water). Malathion (Malathion Plus (50%)) was applied to the mesocosms at a concentration of either 50 or 250 µg/L malathion applied either at the start of the study or four weeks after study initiation. A weekly application (from day 1 to 43) of 10 µg/L malathion was also included as a treatment group; a control group was also included. Chemical analysis of samples collected 1 hour after application and measured concentrations were 9.5 (weekly), 40 and 32 (50 µg/L, initial and later, respectively) and 300 and 190 µg/L (initial and later, respectively). The treatments were replicated four times for a total of 48 experimental units. A pond-drying component was added to the test design (removal of approx. 60L of water starting on day 62) in that tadpoles that had not completed metamorphosis by day 79 were considered dead due to the effects of the pond drying. Amphibians eggs were collected (source not reported) and allowed to hatch on-site. Pond water was collected and tadpoles and invertebrate predators were removed and aliquots were added to each mesocoms along with 300 g dry leaves (primarily Quercus spp.) and 25 g of rabbit chow. Algae and zooplankton communities were in the cosms 18 days prior to addition of amphibians or malathion treatment. Twenty or 40 amphibian tadpoles (wood and leopard frogs, respectively) were added to each mesocoms (initial mass ± SE: wood frog = 68 ± 4 mg, leopard frogs = 91 ± 7 mg). On test day 15, temperature, pH, dissolved oxygen. The rate of sunlight decay with depth was measured on days 23 and 45. On day 8, 22 and 43, zooplankton was collected (0.2L tube sampler at 5 different locations in mesocosms, pooled, and screened) and total abundance was calculated in terms of cladocerans or copepods. Phytoplankton and periphyton abundance were measured on day 22 and 43 or 44 (phytoplankton: 500mL water, filtered and chlorophyll a concentrations measured; periphyton: removed from tiles, filtered and dry weight measured). Beginning on day 27 (first observance of a metamorph (wood frog)) until day 79, cosms checked daily for metamorphs (removed tail was <3 cm). The removed frogs were placed in 1L tubs with moss until complete tail resorption (GS 46). The study was terminated on day 79 and any remaining amphibians that had one emerged forelimb were allowed to complete metamorphosis; all others remaining were considered nonsurvivors. For the amphibians, survival, time to metamorphosis and body mass were analyzed. Multivariate analysis of variance (MANOVA) was used to evaluated control and treatment groups to test for effects of malathion, amphibian density as well as zooplankton and algae.
ResultsBased on the study authors, there was a reduction in zooplankton in all treatments which affected the other organisms (increase in phytoplankton and then decline in periphyton). For the wood frog, the study authors stated that the pesticide treatments did not affect the frogs compared to the control (possibly due to their short time to metamorphosis). However, for the leopard frogs, reductions in growth (18-22%, weekly and 250 µg/L treatments) and delayed development were observed, which led
17
to subsequent mortality (43% decrease in survival in weekly treatment) as the mesocosms dried up.The three treatments groups that had initial applications of malathion had significantly higher pH and dissolved oxygen values compared to the control. For zooplankton, on the first and second sample date, the weekly and initial treatments had significantly reduced abundance of cladocerans (approx. reduced to 0%) compared to control; however, by the third sampling date, the treatments that received a weekly or later application had significantly reduced abundance (reduced to approx. 0%) whereas the treatments treated initially had recovered to values similar to the control (Figure 1). For the copopods, abundance in the treatment groups with the initial 50 or 250 µg/L dose was significantly reduced compared to the control (abundance approx. 0%) on the first sample date, but there were no differences on the second sample date and by the third sample date, copepod abundance in malathion treatments (all doses) were greater compared to control (Figure 1).For phytoplankton, at the first sample date, the weekly and initial treatments had significantly greater abundance (approx. 50% increase) compared to control (Figure 2). On the second sample date, the treatments with either the initial or later applications of 50 or initial application of 250 µg/L had significantly less phytoplankton (reduced approx. 30-70%) compared to control. The weekly application treatment group had significantly greater rates of light decay compared to control. For periphyton, on the first sample date, only the treatment with the initial dose of 50 µg/L had significantly reduced periphyton (Figure 3). At the second sample date, under high tadpole density, the treatments with the initial dose of malathion (50 or 250 µg/L) and weekly dose had 44–79% less periphyton compared to control.Wood frog survival, time to metamorphosis or mass was not affected by pesticide exposure. For leopard frogs, there was a reported 43% decrease in survival at the high density in the weekly applications (Figure 4). However, when combining the number of metamorphs and the number remaining tadpoles at end of study there is no difference. Therefore, the lower value is considered to be due to delayed development resulting in nonsurvivor status once the ponds were considered dry. Increased density of leopard frogs caused a 20% (10d) delay in metamorphosis. While time to metamorphosis was not significantly different between the malathion treatments and control, the study authors stated that had the tanks not undergone drying (thereby halting completion of metamorphosis), the mean time to metamorphosis in the weekly treatment would have been longer. In regards to mass, averaged across density treatments, weekly applications and initial and later applications of 250 µg/L had a significant 18–22% reduction compared to control (Figure 4).
18

Figure 1 (from Figure 3 in paper). Effects on zooplankton
19

Figure 2 (from Figure 4 in paper). Effects on phytoplankton
20
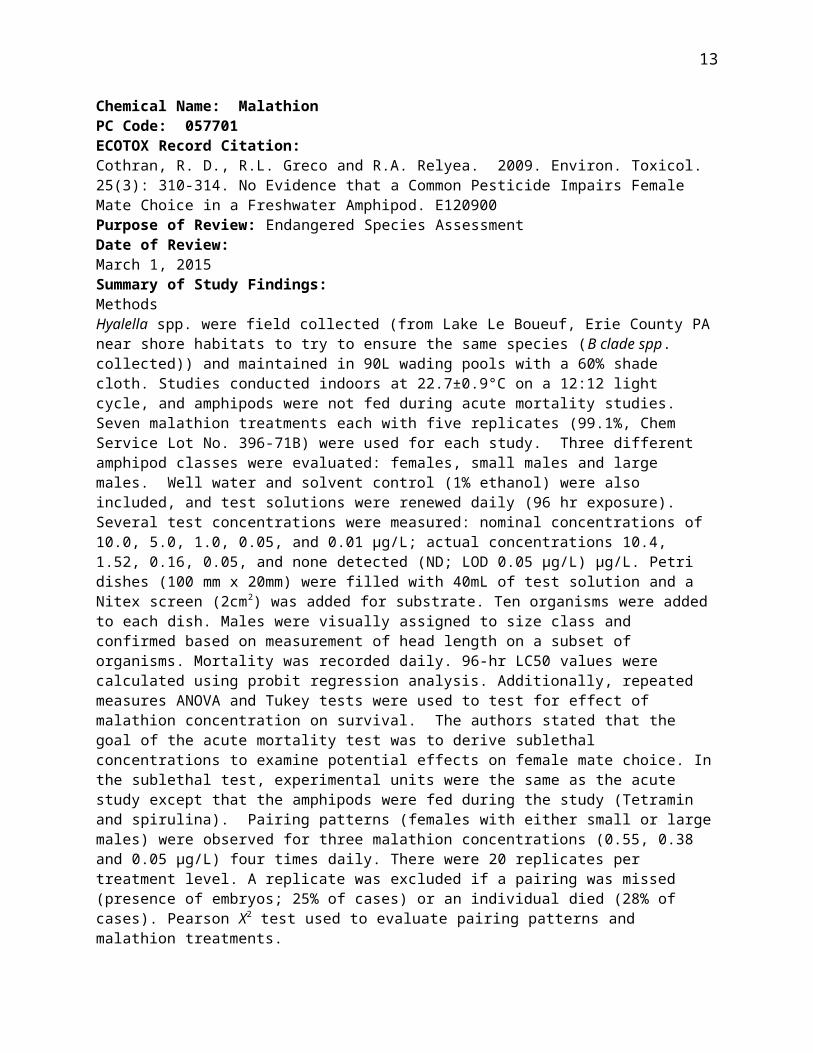
Figure 3 (from Figure 5 in paper). Effects on Periphyton
21

Figure 4 (from Figure 6 in paper). Effects on Amphibians
Description of Use in Document: QualRationale for Use: Data from this study are useful for effects characterization of multiple taxa exposed concurrently to malathion, but is not for use as a threshold, in large part because of the potential for both direct and indirect effects to each taxon.
Limitations of Study: Main Reasons:
1. Given the multiple potential interactions in this study that could contribute to either a direct or
22

indirect effect, this study was not considered sufficient for use as a threshold value.2. It is unclear if populations of zooplankton and algae were consistent between treatments when
added to tanks
Other Reasons: 1. the source of the test organism were not reported, prior exposure to potential contaminants is not known; 2) Based on paper, it appears that some of the frogs collected prior to the pond drying were not completely metamorphosed, but had at least one forelimb, were retained until they did complete metamorphosis. It is unclear how many frogs were retained in this manner and the potential effect this secondary container may have had on mass and time to metamorphosis.
Reviewer: Amy Blankinship, ERB6
23

Chemical Name: MalathionCAS NO: 121-75-5
ECOTOX Record Number and Citation: 161049Hua, J. and R.A. Relyea. 2012. East Coast vs West Coast: effects of an insecticide in communities containing different amphibian assemblages. Freshwater Sci. 31 (3): 787-799.
Purpose of Review: Endangered Species Assessment
Date of Assessment: 2/19/15
Brief Summary of Study Findings:
MethodsTwo geographically distinct amphibian assemblages, Rana sylvatica (PA) or Rana cascadae (OR) were exposed to malathion along with peri- and phytoplankton and zooplankton in the presence or absence of a zooplankton predator (larval salamanders, Ambystoma gracile (PA) and Ambystoma laterale (OR)) in aquatic mesocoms (approx. 545L well water). Amphibians and salamanders eggs were collected from natural ponds and wetlands and allowed to hatch on-site. Pond water was collected and invertebrate predators were removed and equal aliquots were added to each mesocoms along with 200 g dry leaves (primarily Quercus spp.). Algae and zooplankton communities were in the cosms 15 days prior to addition of aphmibians or malathion treatment. Twenty amphibian larvae and 10 salamders were added to each mesocoms (initial mass ± SE: wood frog = 208 ± 11 mg, Cascades frogs = 194 ± 12 mg; spotted salamander = 103 ± 8 mg; northwestern salamanders = 101 ± 9 mg. ) Malathion (Malathion Plus (50%)) was applied to the mesocosms at a concentration of either 1 or 10 µg/L malathion; a control group was also included. However, after analysis, the measured concentration of the 10 µg/L group was 1 µg/L (the sample for the nominal treatment group of 1 µg/L was lost transit). Additionally, the zooplankton in this treatment did not appear affected, therefore, on day 10, malathion was re-applied to the cosms at 5 and 50 µg/L. Chemical analysis of samples collected 3 hours after application indicated measured concentrations of 6 and 40 µg/L, respectively. Malathion was not detected in the well water used in previous tests. On test day 22, temperature, pH, dissolved oxygen and light attenuation were measured. Also on day 22, zooplankton was collected (0.2L tube sampler at 5 different locations in mesocosms, pooled, and screened) and total abundance was calculated in terms of cladocerans or copepods. Phytoplankton and periphyton abundance were measured on day 22 (phytoplankton: 500mL water, filtered and chlorophyll a concentrations measured; periphyton: removed from tiles, filtered and dry weight measured). Beginning on day 16 (first observance of a metamorph) until day 40, cosms checked daily for metamorphs (removed when both forelimbs had emerged and tail was <3 cm). The removed frogs were planced in 1L tubs with moss until complete tail resorption (GS 46). The study was terminated on day 40 and any remaining amphibians that had forelimbs were allowed to complete metamorphosis. For the amphibians, survival, time to metamorphosis and body mass were analyzed. Only two salamanders had completed metamorphosis by day 40 and therefore body mass only was measured. Multivariate analysis of variance (MANOVA) was used to evaluated control and treatment groups to test for effects of malathion, amphibian assemblage and presence/absence of salamanders. ResultsLight attenuation was increased at the 40 µg/L treatments compared to control. Results for biotic variables are presented below in Figure 1 and 2 (Figure 3 and 4 in paper), and magnitude effects in this review are approximations based on Figure 3 in paper. After 22 days, copepod abundance was greater
24

(approx. 60-70%) in the 6 µg/L treatment group compared to controls, and cladoceran abundance was lower (abundance approx. 0%) in both malathion treatment groups compared to control. Additionally, periphyton biomass was significantly lower (approx. 20-70%) at 40 µg/L compared to control, and phytoplankton biomass was greater (>100%) in both malathion treatments. Amphibian survival was high across the treatments: 97.1% in wood frogs and 99.4% in Cascades frogs. Amphibian metamorphs’ mass was significantly greater (approx. 30%) in both species compared to control, but time to metamorphosis was not affected. Salamander mass was also significantly lower in both treatments (approx. 30-70%).
Figure 1 (as presented as Figure 3 in paper). Effects on Zooplankton, Periphyton and Phytoplankton.
25

Figure 2 (Figure 4 in paper). Effects on Amphibians and SalamandersDescription of Use in Document: QualRationale for Use: Data from this study are useful for effects characterization of multiple taxa exposed concurrently to malathion, but is not for use as a threshold, in large part because of the potential for both direct and indirect effects to each taxon.
Limitations of Study: Main Reasons:
1. Given the multiple potential interactions in this study that could contribute to either a direct or indirect effect, this study was not considered sufficient for use as a threshold value.
2. It is unclear if populations of zooplankton and algae were consistent between treatments when added to tanks
Other Reasons:1) Based on paper, it appears that some of the frogs collected prior to the pond drying were not completely metamorphosed, and were then retained in 1L plastic containers until they did complete metamorphosis. It is unclear how many frogs were retained in this manner and the potential effect this secondary container may have had on mass and time to metamorphosis; 2) The concentration of malathion was increased in the study on Day 10 due to the low recovery of the first application and the lack of response in zooplankton. It is not known how this first application may have impact the other endpoints/taxa in the study; 3) as organisms were field collected, prior exposure to potential contaminants is not known.
26

Reviewer: Amy Blankinship, ERB6Chemical Name: Malathion PC Code: 057701ECOTOX Record Citation: 5074Hansen, D., and P. Parrish. 1977. Suitability of sheepshead minnows (Cyprinodon variegatus) for life-cycle toxicity tests In: F. Mayer and J. Hamelink (Eds.), Aquatic Toxicology and Hazard Evaluation, 1st Symposium, ASTM STP 634, Philadelphia, PA 117-126. E5074Purpose of Review: Endangered Species AssessmentDate of Review:January 15, 2015Summary of Study Findings:The information contained in Hansen and Parrish (1977) contains limited summary data. Additional information (e.g., test concentration summary data) is reported in the citation below and was used in preparing this review:
Parrish, P., E. Dyar, M. Lindberg, C. Shanika, and J. Enos. 1977. Chronic toxicity of methoxychlor, malathion, and carbofuran to sheepshead minnows (Cyprinodon variegatus). Ecological Research Series, U.S. EPA, 600/3-77-059 36 p.
While results of testing several chemicals were reported in both documents, this review focuses on malathion.
Methods
Acute and chronic (life-cycle or partial life-cycle) test were conducted using the estuarine/marine fish, sheepshead minnow (Cyprinodon variegatus). Acute (96-hr) and chronic (20-week; partial life-cycle) studies were conducted for malathion (95%). Fish were obtained from local populations (from Big Lagoon) and were acclimated for 14 days prior to testing and were fed brine shrimp (concentrations of chlorinated hydrocarbon pesticides and polychlorinated biphenyls were less than <0.1µg/g). Fish used in the malathion studies were 0.8-1.8 cm (standard length) in the acute assay and 1.0-1.8 cm and 0.11 g (mean wet weight) in the chronic study. Dilution water was filtered natural seawater (Big Lagoon) which was not altered for salinity but was maintained at 30±1°C. The average salinity in the chronic study was 18 ppt (range 4 to 29) for methoxychlor and malathion, salinity was 20 ppt in the acute study. Stock solutions of malathion were prepared in acetone and the maximum solvent concentration was 29 µL/L. Nominal test concentrations in the acute test ranged from 22-125 µg/L. Nominal test concentrations in the chronic study were 4, 8, 15, 30, and 60 µg/L. Test solutions were analyzed in the studies. Studies were conducted using intermittent-flow diluter systems and a proportional diluter (75% dilution ratio for acute and 50% for chronic) and the number of turnovers was one per day. Test chambers were glass aquaria containing 28L of test solution with twenty fish per aquaria. In the chronic assay, 2 replicates were used each with 20 fish which were fed daily with a commercial flake food. Salinity and dissolved oxygen were measured daily and the photoperiod was 16L:8D. Survival was visual inspected daily and growth was monitored bi-weekly using photographic methods (length) or weighting each group of fish (in water) monthly. Spawning activity was evaluated starting on test day 87 and spawning groups consisted of two male and three female fish. There were two groups per treatment and each group was evaluated for 10 days for spawning activity. Eggs were collected daily and counted. Groups of 50 eggs were evaluated for hatching success. Forty newly-hatch fry per replicate (except where mortality prohibited evaluation of fry) were exposed for 28 days and evaluated for survival and growth. Malathion
27
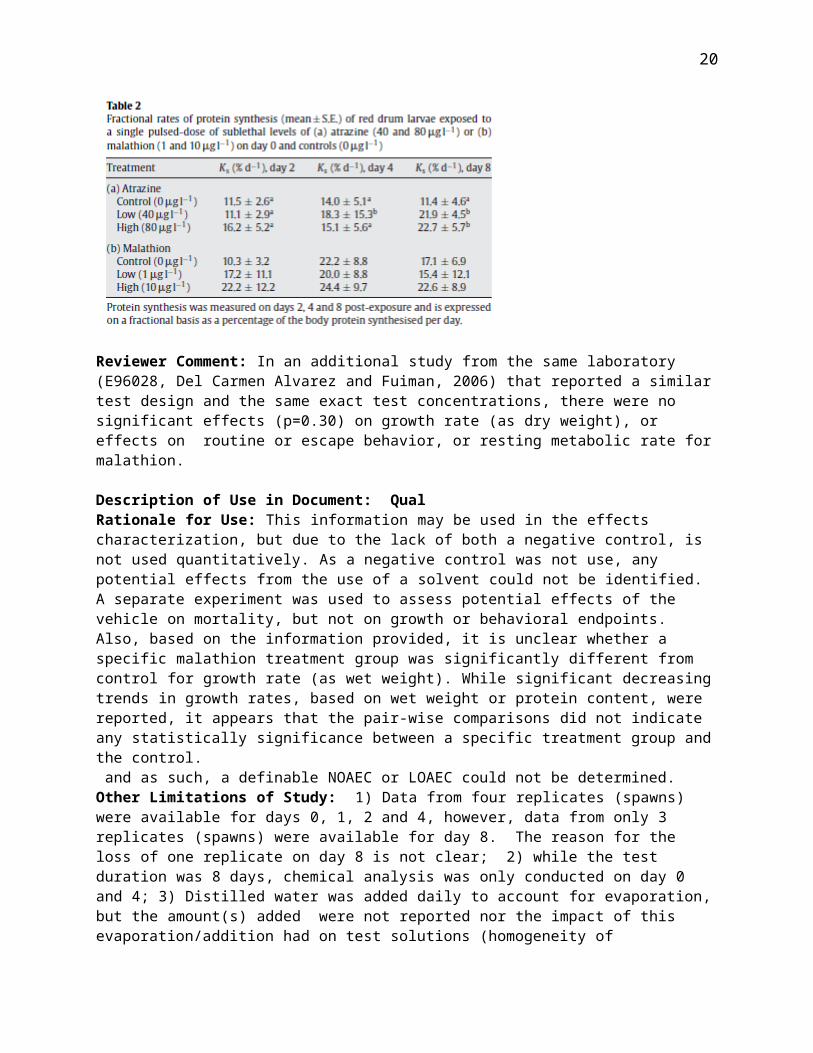
residues were measured in adults, fry, and egg tissues. Acute LC50 values were calculated using linear regression after probit transformation and in the chronic tests, differences between treatments were determined using chi-square and analysis of variance (p<0.05). Post-hoc tests on treatment means conducted using Student-Newman-Keuls range test. ResultsIn the acute study, the mean measured test concentrations were 72-95% of nominal and were 100-143% of nominal in the chronic study. The 96-hr acute LC50 value was 51 µg/L (95% CI 41-63) at a salinity of 20 ppt and 29°C.In the chronic study, survival of the F0 generation was significantly decreased at ≥18 µg/L (mean measured) after 140 days of exposure, with 50% mortality at 18 µg/L and 100% mortality at 37 and 86 µg/L (mean measured). Control mortality was 2% and 0% in the negative and solvent control. Length and weight of the F0 generation was not significantly affected during the study. Additionally, the number of eggs spawned, number of eggs/day/female, and hatching success was unaffected. However, survival of fry after 28 days was significantly reduced at 9 and 18 µg/L (14 and 15%, respectively), but length and weight were not affected. Malathion was not detected (<0.1 µg/L) in fish sampled in the study (after 140 days). Description of Use in Document (QUAL, QUAN, INV): The study may be used as a threshold endpoint in the weight of evidence analysis for the endangered species assessment of malathion.Rationale for Use: The study is of sufficient quality to warrant use as a threshold. Limitations of Study:
1. While the size of the parental fish used in the acute and chronic assay were reported, specific age class were not.
2. The range in salinity was quite variable, and since the reported average and range were for two chemicals, it is uncertain in the specific range for malathion.
Primary Reviewer:Amy Blankinship, ERB6Secondary Reviewer
28

Chemical Name: Malathion PC Code: 057701ECOTOX Record Citation:Webb CM and D.A. Crain. 2006. Effects of Ecologically Relevant Doses of Malathion on Developing Xenopus laevis Tadpoles. Bios 77(1): 1. E118382.
Purpose of Review: Endangered Species Assessment
Date of Review:January 29, 2015
Summary of Study Findings:From the abstract:“Two-week-old Xenopus laevis tadpoles were divided into four experimental groups, each with a sample size of ten tadpoles: control (water), 1.0 ng/L malathion, 1.0 μg/L malathion, and 1.0 mg/L malathion. During their 30-day exposure to malathion, tadpoles in the 1.0 mg/L malathion displayed bent tails (p<0.001), unusual swimming behavior, and a higher mortality rate (p<0.001) when compared to the control group.”
Description of Use in Document (QUAL, QUAN, INV):Qual Rationale for Use: Given the wide spacing in the test concentrations (1000X), the study was not considered sufficient for use as a threshold. However, it still will be considered in the effects data array.
Limitations of Study:1. The test concentrations chosen are too far apart to be able to discern a reasonable dose-
response relationship for the endpoints evaluated.
Primary Reviewer:Amy Blankinship, ERB6Secondary Reviewer
29
Chemical Name: Malathion PC Code: 057701ECOTOX Record Citation:Groner, M. L. and R.A. Relyea. 2011. A tale of two pesticides: how common insecticides affect aquatic communities. Freshwater Biol. 56: 2391-2404. E159029
Purpose of Review: Endangered Species Assessment
Date of Review:February 2, 2015
Summary of Study Findings:While results for both malathion and carbaryl chemicals were reported, this review focuses on malathion.
Methods
Malathion (Malathion Plus (50% active ingredient); amount added ranged from 52.75 to 5275 µL of formulation) and carbaryl (GardenTech Sevin Ready-to-Spray Bug Killer (22.5%)) were added to 1200L mesocoms (filled with c. 1055L of well water) at three different rates: a 25 µg/L applied weekly (5 total applications; referred to as weekly low concentration), 250 (single medium) or 2500 (single high) µg/L applied once. A negative control group was also included. Each concentration had four replicates. The mesocoms were covered with a 60% shade cloth and oak leaf litter, rabbit chow, and water aliquots from several local ponds (screened for predators) were added to provide either nutrients, substratum and/or a natural source of algae and zooplankton. Unglazed clay tiles were also added as periphyton samplers. Leopard frog eggs from a single egg mass (Rana pipiens Schreber) were field collected (NW PA) and hatched in covered wading pools. 40 tadpoles (initial mass 59.3±2.4 mg) were added to each mesocosm and were maintained in tanks for one week prior to pesticide exposure. Pooled water samples for chemical analysis were collected 4 hours after addition to tanks (pesticides mixed using 0.5L cup for several minutes). Dissolved oxygen, temperature, pH and light extinction were measured during the study. Periphyton (as dry weight), phytoplankton (as chlorophyll a) and zooplankton abundance (identified to level of cladocerans and copepods) were sampled on days 7 and 21. Starting on day 31 (day of first metamorphosis), daily counts of metamorphs (Gosner stage 42) were conducted and animals collected and weighed. To evaluate response to pond drying, water (225L) was removed every third day beginning on day 88 and was completed on day 97. Tadpoles that did not metamorphosed by day 97 were collected, preserved and considered as a mortality, unless they had at least one emerged forelimb in which they were considered to be survivors and held until complete metamorphosis. The data were analyzed using one-way analyses of variance (ANOVA) and multivariate ANOVAs. The study authors reported they were interested in both direct and indirect effects of pesticide treatment on amphibians.ResultsThe measured malathion concentrations were 12-15% of nominal for the weekly low and single high treatments (the single medium samples were destroyed during shipment) resulting in reported malathion concentrations of 3.1, 35 and 384 µg/L. Water quality was reported to be significantly affected by pesticide treatment on day 7 and 21. The weekly low concentration did not differ from the control for any water quality parameter but the single medium and high treatment water quality was significantly different from control. For the cladocerans, the weekly low was not significantly different from control,
30
but the single medium and high concentrations were reduced by 93 and 97% by day 7. However, by day 21, all three malathion concentrations had reduced cladocerans (86-99%) compared to control. Copepod abundance was significantly increased 235-288% in the malathion treatments (an increase of 216% in the single high had p value of 0.079) by day 21. Periphyton biomass was significantly increased 20% in the single high malathion treatment on day 7, but was reduced 70% by day 21 in the single medium concentration. Phytoplankton was increased 320-790% by day 21. For the leopard frog, survival was significantly 8% lower in weekly low and single medium and 22% in single high; and few tadpoles remained when ponds were dried. Mean time to metamorphosis in the weekly low malathion treatment was 17 days longer than control; however, there were no differences between the single medium and high concentrations compared to control. The mass of the frogs was 15 lower in the weekly low treatment at metamorphosis and was 13-15% higher in the single concentrations compared to the control.
Description of Use in Document (QUAL, QUAN, INV): Qual.
Rationale for Use: Data from this study are useful for effects characterization of multiple taxa exposed concurrently to malathion, but is not for use as a threshold, in large part because of the potential for both direct and indirect effects to each taxon. However, it is not used as a threshold value given the limitations discussed below.
Limitations of Study:Main reasons:
4. Given the multiple potential interactions in this study that could contribute to either a direct or indirect effect, this study was not considered sufficient for use as a threshold value.
5. The measured concentration of malathion was 12-15% of nominal. The study authors reported that deviations from nominal could be due to a variety of reasons (e.g, precipitation, binding, degradation of stored samples). However, they did not provide a specific reason in this case but did not necessarily believe that the lower measured concentrations were reflective of error in application. Given this lack of specific reasoning, there is uncertainty in the actual exposure concentration.
6. It is unclear if populations of zooplankton and algae were consistent between treatments when added to tanks
Other limitations:12. Animals (tadpole eggs and zooplankton) and algae were field collected, therefore, prior
exposure history to potential contaminants is unknown.13. Based on paper, it appears that some of the frogs collected prior to the pond drying were
not completely metamorphosed, and were then retained in 1L plastic containers until they did complete metamorphosis. It is unclear how many frogs were retained in this manner and the potential effect this secondary container may have had on mass and time to metamorphosis.
Primary Reviewer:Amy Blankinship, ERB6Secondary Reviewer
31

Chemical Name: Malathion PC Code: 057701
ECOTOX Record Citation:Calleja, M. C. and G. Persoone. 1993. The influence of solvents on the acute toxicity of some lipophilic chemicals to aquatic invertebrates. Chemosphere. 26(11): 2007-2022. E7026.
Purpose of Review: Endangered Species Assessment
Date of Review:December 4, 2014
Summary of Study Findings:MethodsToxicity testing was conducted with three crustaceans (Artemia salina, Streptocephalus proboscideus, and Daphnia magna), two rotifers (Brachionus plicatilis and Brachionus calyciflorus) and the bacteria Photobacterium phosphoreum. Diazepam (pharmaceutical drug), digoxin (pharmaceutical drug), malathion were tested alone as well as with the co-solvents, dimethylsulfoxide (DMSO), ethanol, methanol or acetone. It was reported that the test chemicals and solvents used were of the highest purity grade. The conduct of the acute toxicity tests were reported to follow the SOPs of the Artoxkit M, Rotoxkit F and M, Streptoxkit F cyst with modifications on hatching conditions, dilution media and test containers as described in other publications. Acute toxicity tests with Daphnia magna were conducted according to OECD TG 202. Testing with malathion was only conducted with Daphnia magna and so this review will focus on that study. Malathion was dissolved in either acetone or DMSO (3,027 µM) and the highest solvent concentration was 1% v/v. It was reported that the tests were replicated four times. Trimmed Spearman-Karber method was used to calculate the 24-hr EC50 values. Solvent controls were used in studies that used a co-solvent.ResultsMean 24-hr EC50 values were reported, and the results indicated that the addition of the solvents reduced the toxicity value by 10 to 11 orders of magnitude as opposed to testing malathion alone. The results are presented in Table 1 below (taken from Table 2 in the study).Study Mean 24-hr EC50 (95% CI) (µM)
[mean 24-hr EC50 value in mg/L]Malathion alone 8.04 x 10⁻¹⁵ (±7.80 x 10⁻¹⁵) [2.65 x 10⁻¹⁵]Malathion with DMSO 1.45 x 10-04 (±2.16 x 10-05) [4.79 x 10-05]Malathion with acetone 5.38 x 10-05 (±2.0 x 10-05) [1.78 x 10-05]
Description of Use in Document (QUAL, QUAN, INV):InvalidThe study is of insufficient quality to warrant consideration in the risk assessment, and the limitations are stated below. Rationale for Use: NALimitations of Study:
1. Even though the authors reported using OECD 202 as a protocol for study conduct which does outline appropriate environmental conditions, in the actual studies, these conditions such as dissolved oxygen that may have influenced the toxicity were not reported.
32

2. While it was reported that a control(s) was used, control mortality was not reported.3. Analysis of test concentrations was not reported and results appear to be based on nominal.4. The toxicity values are reported as a mean of four assays, and therefore, the toxicity values of
the individual studies are not available for comparison. 5. It is the experience of the reviewer that the addition of either DMSO or acetone to a test system
with Daphnia magna is not expected to mitigate the toxicity of a pesticide to the degree reported in this study. The reviewer is questioning the results obtained with testing malathion alone. Submitted 48-hr toxicity data for Daphnia magna with a formulation is 0.0022 mg a.i./L (MRID 41029701) with another toxicity value for another water flea, Simocephalus serrulatus, reported as 0.00059 mg a.i./L (MRID 40098001; Mayer and Ellersick 1986). Other reported acute toxicity values for Daphnia magna in the ECOTOX database range from 1.78 x 10-05 to 1 mg a.i./L. Given the great uncertainty in the reported results from the testing with malathion alone, there is also uncertainty in the other reported toxicity values although it is noted that they are more in line with other reported toxicity values for waterfleas.
Primary Reviewer:Amy Blankinship, ERB6Secondary Reviewer
33

Chemical Name: Malathion PC Code: 057701ECOTOX Record Citation:Tessier, L., J.L. Boisvert, L. B.-M.Vought, and J. O. Lacoursiere. 2000. Anomalies on capture nets of Hydropsyche slossonae larvae (Trichoptera; Hydropsychidae), a potential indicator of chronic toxicity of malathion (organophosphate insecticide). Aquatic Tox. 50:125-139. E65789.
Purpose of Review: Endangered Species Assessment
Date of Review:December 5, 2014
Summary of Study Findings:MethodsCaddisfly larvae (Hydropsyche slossonae; 4th instar) were field collected (Becanour river in southern Quebec). Authors stated that while the river is known to be contaminated with metals, the collection area had not exceeded water quality criteria. It was also reported that they intentionally wanted to select specimens tolerant to a stressed environment to allow for prolonged exposure to malathion. Additionally, 36 capture nets were collected from the same site as well as 20 nets from a contamination-free area to evaluate background anomaly rates. Test chambers were 40L glass aquaria containing reconstituted water (with a maintained water current of 10-20 cm/s) with microscope glass slides fixed to Plexiglass for larvae to reside and spin webs. Larvae (n=70) were placed into chambers and allowed to acclimate for 2 weeks, after which all nets were removed and malathion (96.7%) added. Larvae were exposed for 20 days to malathion concentrations ranging from 0.01-1.0 µg/L (5 concentrations), in which the water was exchanged every 4 hours during the first 24 hours and every day thereafter. All exposure tests were duplicated. Larvae were fed twice a week (1.0g frozen Artemia sp.) and maintained at 15±1°C with a 16:8 L:D cycle. Temperature, pH, conductivity and dissolved oxygen were measured every 2 days. The study was based on nominal concentrations. On day 0, 5, 10, 15 and 20, all nets were removed (fine tweezers) stored in deionized water at 4°C and either evaluated for anomalies using a microscope (fixed and mounted) or protein analyses. Additionally, two replicates of six larvae [although later on it is reported as 6 replicates of two larvae] were collected at same timepoints for AChE analysis (analyzed head capsules using colorimetric method). It was noted in the study that larvae drift was observed in which some larvae drifted into the water current and to the underside of the Plexiglass and attached themselves to the bottom of the aquaria, thereby out of reach. During the acclimation and beginning of the test, it was reported that 24% of the larvae drifted, but this occurrence was only occasional after day 5 as organisms acclimated to the system. Frequency of anomalies evaluated using Chi-Square and EC50 values calculated using log-probit method using Abbott’s correction. ANOVA was used to determine if mean symmetries of nets were similar over time as well as for analyzing mean AChE values. ResultsTemperature was 15.6±0.2°C, pH was 7.0±0.2, DO was 98±1.8%, and conductivity was 124.2±12.3 µS/cm. Control mortality was 6% and 9% mortality was observed in the treatment groups. Two major net anomalies were observed: 1) distortion of the midline and separation of the meshed by additional strands; 2) departure from net-symmetry structure. Control midline distortion rates ranged between 6-17%; in the contaminated reference site the rate was 20% and was 0% in the contamination-free reference. At malathion concentrations of ≥0.1 µg/L, the frequency of midline anomalies were significantly increased in a dose-dependent manner by day 10 with frequency rates ranging from 43 to 100% (variability not reported) between day 10 and test termination (day 20). A significant increase
34

[estimated 58% from Figure 4 in study] for the same endpoint was observed at 0.05 µg/L at day 20 with an overall NOAEC of 0.01 µg/L. The 20-day EC50 value was 0.11 µg/L. A significant decrease in symmetry was observed at 0.5 and 1.0 µg/L. Head capsule AChE activity was significantly inhibited at ≥0.1 µg/L with a 58% inhibition by day 5 at 1.0 µg/L and a marked inhibition of 41 and 50% at day 10 at 0.5 and 0.1 µg/L, respectively, with an overall NOAEC of 0.05 µg/L. The increase in net anomalies was correlated with a decrease in AChE activity (r2=0.98 or 0.90). There was no effect on silk protein at any test concentrationEndpoint NOAEC (µg/L) LOAEC (µg/L)Mortality 1.0 (observed) NAFrequency of midline anomalies 0.01 0.05Decrease in symmetry 0.1 0.5Head capsule AChE 0.05 0.1Net protein 1.0 NA
*endpoints in ECOTOX were adjusted for percent purity of malathion (96.7%).Description of Use in Document (QUAL, QUAN, INV):Qual for net anomalies/symmetry endpoint but Quant for AChe endpoint (NOAEC 0.05)The study is of sufficient quality to warrant consideration in the risk assessment, however, there are a number of limitations, as stated below, which preclude its use quantitatively for the net anomalies/symmetry endpoint in of itself. However, the test concentration where there were observed decreases in AChE along with the net abnormality behavior may be used as a threshold. This endpoint is very similar to NOAEC value for effects on reproduction for Daphnia magna from registrant-submitted study (NOAEC = 0.06; MIRD 41718401). Rationale for Use: Limitations of Study:
1. While an impact on net anomalies were observed, it is unknown how this may impact actual capture success as this was not examined. Additionally, the relevancy of this endpoint to extrapolate to other taxa is unknown, and therefore do not consider the endpoint appropriate for a threshold value in of itself.
2. There is some uncertainty in the sample size for the AChE analysis as in the experimental design section, it is reported as two replicates of six larvae and in the AChE analysis section it is reported as six replicates each with two pooled larvae. The experimental design section reported that all exposure tests were duplicated and the reviewer assumed that this indicated two replicates per treatment.
3. The test concentrations were not measured, however, test solutions were exchanged daily. Primary Reviewer:Amy Blankinship, ERB6Secondary Reviewer
35

Chemical Name: Malathion PC Code: 057701ECOTOX Record Citation: 161182Lumor, S.E, F. Diez-Gonzalez, and T.P. Labuza. 2011. Detection of warfare agents in liquid foods using the brine shrimp lethality assay. J. Food Sci. 76(1): T16-T19.
Purpose of Review: Endangered Species Assessment
Date of Review:December 5, 2014
Summary of Study Findings:MethodsThe chemicals T-2 toxin, trimethylsilyl cyanide, dichlorvos, diazinon, dursban, malathion, and parathion were tested in brine shrimp (sp. Artemia) acute toxicity assays. The brine shrimp lethality assay (BSLA) was used. The chemicals were dissolved in DMSO and then added to whole milk or orange juice into vials containing 10, 48-hr old brine shrimp nauplii in seawater. The vials were maintained 28 ◦C for 24 h, after which mortality was determined. Mortality was converted to probits and the LC50 was determined (results presented in the table below taken from Table 1 and 2 in the study).
Chemical LC50 (µg/mL) in whole milk LC50 (µg/mL) in orange juiceDichlorvos 790 1.43 x 10-02
Diazinon 660 <7.28 x 10⁻¹¹
Dursban 251 7.28 x 10⁻¹¹
Malathion 13801 <7.28 x 10⁻¹¹
Parathion 724 114
Description of Use in Document (QUAL, QUAN, INV):InvalidThe study is of insufficient quality to warrant consideration in the risk assessment, and the limitations are stated below.
Rationale for Use: NA
Limitations of Study:1. Given that the exposure media in these studies was whole milk or orange juice, these findings
are not appropriate for use in the risk assessment.
Primary Reviewer:Amy Blankinship, ERB6Secondary Reviewer
36
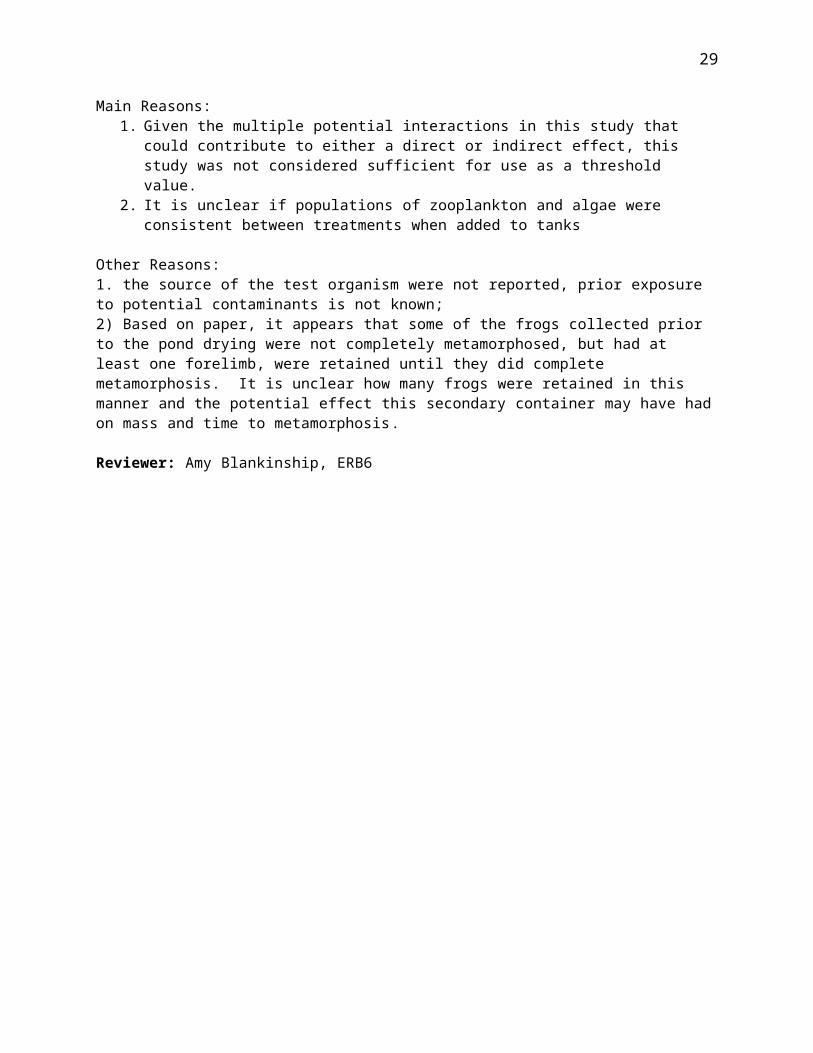
Open Literature Review Summary
Chemical Name: Spectracide Malathion®, Spectrum Brand IP Inc., Brantford, ON
CAS No: Not reported
PC Code: 057701
ECOTOX Record Number and Citation: 162409. Nain, S., A. Bour, C. Chalmers, and J.E.G. Smits. 2011. Immunotoxicity and disease resistance in Japanese quail (Coturnix coturnix japonica) exposed to malathion. Ecotoxicology. 20: p 892-900.
Purpose of Review (DP Barcode required for Quantitative studies): Malathion ESA pilot (Registration Review)
Date of Review: January 8, 2015
Summary of Study Findings:54 three week old male Japanese quail were exposed to malathion at nominal concentrations of 0, 1, and 10 ppm via drinking water for eight weeks. Water consumption was measured in each pen, and the study authors used the water consumption data to calculate estimated daily malathion intake rates in the 1 and 10 ppm exposure groups to be 0.2 and 2.1 mg/kg bodyweight, respectively. Following the sixth week of exposure, a strain of E. coli was injected subcutaneously (doses were selected according to a separate challenge study with quail). No frank effects associated with organophosphate toxicity were observed in any of the treated birds. An innate immunity test evaluating phagocyte activity (determined via chemoluminescence assay of whole blood) in the malathion treatments and control and skin thickness changes following phyohemagglution injection did not reveal significant differences in response between birds exposed to malathion and those of the control. Total white blood cell and lymphocyte counts were significantly lower (p< 0.05) in the 10 ppm treatment than the control. Total granulocyte count was lower in the malathion treatments than the control, but not significantly so. However, mean thrombocyte counts were not reduced in the malathion treatments compared to the control. Secondary antibody response to the administered dinitro-phenol-keyhole limpet hemocyanin (DNP-KLH) vaccine, as determined through an ELISA, was significantly reduced (p< 0.05) in the 10 ppm treatment compared to the control. Primary immune response, also measured via ELISA, was reduced in the 10 ppm treatment compared to the control, but not significantly so. According to the study authors, histopathology of bursa of Fabricius of treated birds identified direct immunotoxic effects of malathion. In both malathion treatments, lymphocyte density in bursa of Fabricius was significantly reduced (p< 0.05) compared to the control density. Increasing epithelial thickness in the bursa of Fabricius correlated with decreasing lymphocyte density, with epithelial thickness significantly greater (p< 0.05) in the 10 ppm treatment compared to the control.“Spleens were assessed based on the percentage of red pulp and white pulp, T-cell density around periarteriolar lymphoid sheaths (PALS), granulocyte count in spleen, relative percentage of white pulp, number of germinal center, and spleen size (Table 7). T-cell density in the PALS areas was higher (p<0.05) in quail treated with malathion at 10 ppm (Fig. 2). Granulocyte counts in splenic red pulp revealed a dose-dependent increase with exposure to malathion (r2 = 0.98), with a significant difference between the control and 10 ppm groups (p< 0.05). There were no significant differences between groups
37

in spleen size, number of germinal centers, or relative percentage of white pulp in the spleen.”The ability of the malathion-treated quail to successfully overcome the bacterial challenge was reduced compared to control, albeit not statistically significantly. The 50% mortality in the 10ppm treatment following the bacterial challenge compared to 22% mortality in the control was considered biologically significant by the study authors, and 10 ppm is considered the LOAEC.
Description of Use in Document: Qualitative
Rationale for Use:Supplemental malathion toxicity data to be used in the Risk Description section to characterize the potential risk of direct, sublethal adverse effects to birds.
Limitations of Study:Given that birds were exposed to a subcutaneous injection of bacteria, it is uncertain whether the exposure route assessed is environmentally relevant. Further information on E. coli burdens in Japanese quail is necessary to evaluate dose selection. Also, it is uncertain how the immunological responses observed in the study relate to individual fitness. In addition to the major limitations discussed above, the following were noted: The malathion product used in the study was poorly described, listed only as “Spectracide Malathion®, Spectrum Brand IP Inc., Brantford, ON”. The percent active ingredient of the formulation was not provided; neither was a US or Canadian product registration number provided that could be used to definitively identify the test substance. An internet search for the product was conducted and no exact product match was found. A broken weblink prevented access to product details for Spectracide® Malathion Insect Spray Concentrate, which may have been the product used in the study (http://reviews.spectracide.com/7545-en_us/071121109002/spectracide-spectracide-malathion-insect-spray-concentrate-reviews/reviews.htm?sort=helpfulness). Also note that the study authors used “ppm” as the units to describe the concentration of malathion in the spiked drinking water. Only two malathion treatment concentrations were tested, so no dose response relationship can be constructed from the data. Further, the study authors do not state how frequently the 1 and 10 ppm exposure concentrations were prepared/renewed. The malathion exposure phase of this study lasted eight weeks and malathion has a short half-life.
Primary Reviewer: Nathan MillerSecondary Reviewer:
38

Open Literature Review Summary
Chemical Name: Malathion (95% solution; Technical Grade Cythion ULV from American Cyanamid Company)CAS No: Not reportedPC Code: 057701ECOTOX Record Number and Citation: 63276.
Day, B.L., M.M. Walser, J.M. Sharma, and D.E. Andersen. 1995. Immunopathology of 8-week-old ring-necked pheasants (Phasianus colchicus) exposed to malathion. Environmental Toxicology and Chemistry. 14 (10), pp. 1719-1726.
Purpose of Review (DP Barcode required for Quantitative studies): Malathion ESA pilot (Registration Review)
Date of Review: January 16, 2015
Summary of Study Findings:Eight week old ring-necked pheasants were exposed to malathion at doses of 0 (negative control; 2.5 ml of corn oil; n= 10), 87.4 (40% of the observed LD50 value; n= 10), and 218.5 (the observed LD50 value; n= 20) mg/kg-bw. Dose selection, exposure route, and age of test organism were selected to correlate with potential field conditions (i.e., young birds feeding exclusively on insects). Seven birds in the high dose group died within 4 hours of exposure. Brains were harvested from these birds and frozen at -80°C. Surviving birds had blood drawn 3 days after dosing prior to being euthanized. Body weight and lymphoid organ (bursa of Fabricius [BOF], thymus and spleen) weights were measured; histomorphometric and histopathological evaluations were conducted on lymphoid organs; and brain AChE levels were measured. The study also ran a concurrent test on immunosuppressed birds, which suggests toxic effects of malathion are aggravated.
Tables 1-4 provide summary results from the study. Body and organ weights and histomorphometric measures of birds exposed to the low dose (92 mg/kg-bw; 87.4 mg a.i./kg-bw) were not statistically different from the controls. However, histopathological changes in the thymus (i.e., the number of cortical macrophages per field and the number of cortical lymphocyte necrosis per field) were observed in birds exposed to the low dose and brain AChE levels were significantly reduced. For the 13 birds that survived exposure to the high dose (230 mg/kg-bw; 218.5 mg a.i./kg-bw), effects were observed on absolute and relative organ weights (thymus and spleen); all histomorphometric measures for the BOF, thymus and spleen; all histopathological measures for the BOF, thymus and spleen; and brain AChE levels were significantly reduced.
Table 1. Lymphoid organ and body weights and ratios in 8-week-old ring-necked pheasants 3 d following a single oral dose of malathionGroup N Body wt
(g ± SD)BOF wt.(g ± SD)
BOF:bw(x10-4 ± SD)
Thymus wt.(g ± SD)
Thymus:bw(x10-4 ± SD)
Spleen wt.(g ± SD)
Spleen:bw(x10-4 ± SD)
Control 10 429 ± 88 0.62 ± 0.32 14.0 ± 5.5 1.45 ± 0.54 33.3 ± 8.5 0.48 ± 0.21 10.8 ± 3.187.4 mg 10 402 ± 50 0.50 ± 0.17 12.4 ± 2.8 1.37 ± 0.61 33.2 ± 11.2 0.48 ± 0.20 11.8 ± 4.9
39
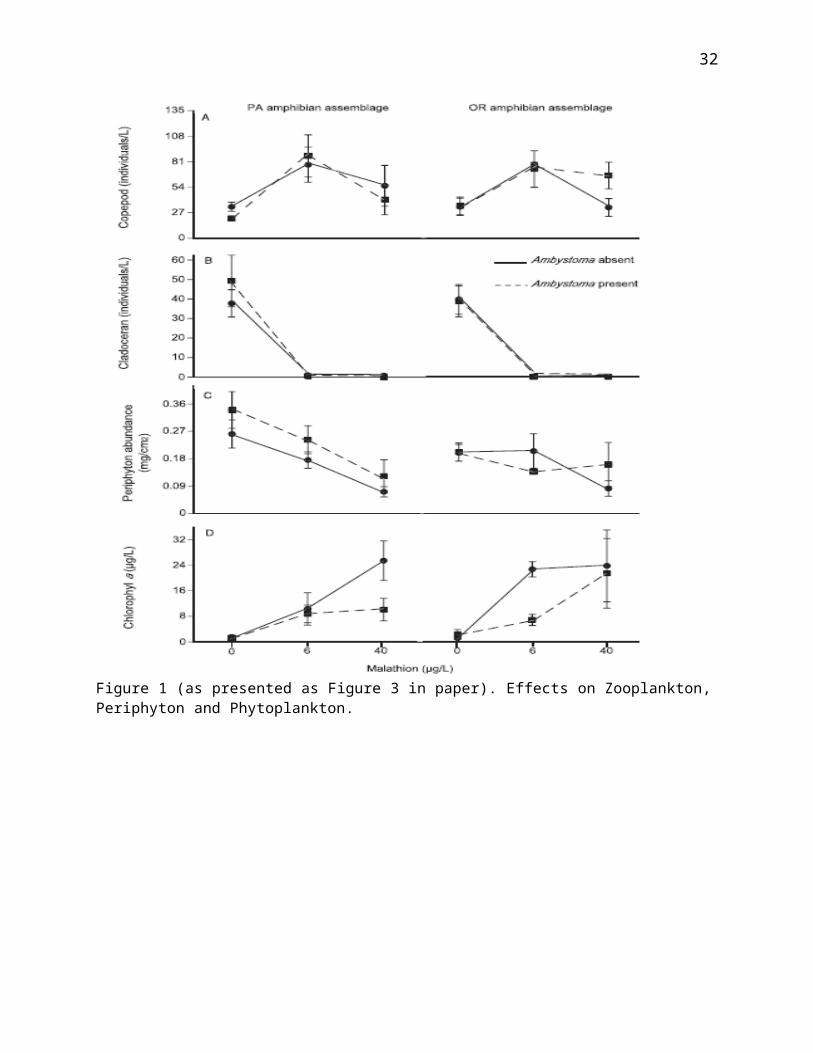
a.i./kg –bw218.5 mg a.i./kg-bw
13 405 ± 82 0.48 ± 0.16 11.7 ± 2.6 0.95 ± 0.38*
22.9 ± 8.6* 0.31 ± 0.11*
7.7 ± 2.5*
*Significantly different from the control group (p < 0.05).
Table 2. Histomorphometric changes in lymphoid organs of 8-week-old ring-necked pheasants 3 d following a single oral dose of malathionGroup N BOF clear
space(% ± SD)
Thymic cortex(% ± SD)
Thymic medulla(% ± SD)
Splenic ellipsoid(% ± SD)
Splenic red pulp(% ± SD)
Control 10 3.0 ± 1.5 56.4 ± 6.7 38.2 ± 6.7 15.3 ± 3.5 32.4 ± 4.887.4 mg a.i./kg –bw
10 2.6 ± 1.3 54.4 ± 4.2 37.6 ± 3.8 18.6 ± 2.7 30.6 ± 2.7
218.5 mg a.i./kg-bw
13 5.7 ± 2.7* 44.0 ± 6.2* 44.9 ± 4.2* 28.9 ± 7.6* 24.1 ± 9.9*
*Significantly different from the control group (p < 0.05).
Table 3. Histopathology of lymphoid organs of 8-week-old ring-necked pheasants 3 d following a single oral dose of malathionGroup N BOF Thymus Spleen
Medullary reticular epithelial cell vacuolation(deg. Scale ± SD)
Cortical lymphocyte necrosis(avg. no/ field ± SD)
Cortical reticular epithelial cell vacuolation(deg. Scale ± SD)
Cortical macrophages(avg. no/ field ± SD)
Cortical lymphocyte necrosis(avg. no/ field ± SD)
Ellipsoid-associated cell vacuolation(deg. Scale ± SD)
Control
10 1.8 ± 0.79 3.5 ± 1.3 0.80 ± 0.79 0.71 ± 0.42 0.75 ± 0.49 1.0 ± 1.0
87.4 mg a.i./kg –bw
10 2.6 ± 1.2 4.0 ± 1.3 1.7 ± 1.1 2.5 ± 0.99* 2.4 ± 0.94* 1.9 ± 1.5
218.5 mg a.i./kg-bw
13 3.1 ± 0.95* 5.5 ± 1.8* 3.6 ± 1.5* 5.6 ± 1.8* 4.3 ± 1.5* 2.9 ± 1.4*
*Significantly different from the control group (p < 0.05).
Table 4. Activity of brain AChE in 8-week-old ring-necked pheasants 3 d after a single oral dose of malathion. Group N Average µmol
acetylthiocholine SD
40

hydrolyzed/min/ g wet tissue
Control 10 18.40 1.6287.4 mg a.i./kg –bw 10 15.56* 1.99218.5 mg a.i./kg-bw 13 13.54* 1.95
Results of this study demonstrate that malathion can induce significant morphometric and histologic changes in lymphoid organs; however, the study authors did not determine the degree to which these changes are associated with functional impairment of the immune system. In addition, study authors state that varying degrees of immunopathological changes were also observed in the control birds, likely as a result of the test design (confinement, handling, bleeding and euthanasia).
Description of Use in Document: Quantitative for AChE results/ Qualitative for Immunotoxicity results
Rationale for Use:This study provides useful information for characterization of the effects of malathion on ring-necked pheasants. AChE inhibition can be used as a threshold and may be linked to the mortalities observed in the high dose group.
Limitations of Study:While this study provides useful information for characterization of the potential immunopathological effects of malathion at doses that are and are not acutely toxic, it does not determine whether these effects result in functional impairment of the immune system (i.e., it cannot be linked to an apical endpoint).
Primary Reviewer: Elizabeth DonovanSecondary Reviewer (required if study results are used quantitatively):
41

Open Literature Review Summary
Chemical Name: Malathion (Technical grade; 97.2%)
CAS No: Not reported
PC Code: 057701
ECOTOX Record Number and Citation: 90624. Goyal, B.S., S.K. Garg, and B.D. Garg. 1986. Malathion-induced hyper-adrenal activity in WLH chicks. Current Science. 55 (11), pp. 526-528.
Purpose of Review (DP Barcode required for Quantitative studies): Malathion ESA pilot (Registration Review)
Date of Review: April 28, 2015
Summary of Study Findings:6-10 week old WLH chicks were acclimatized for 3-4 days prior to the study. Chicks were fed and watered ad libitum. Technical malathion (97.2%) was dissolved in arachis oil and administered orally to the birds in the treatment groups. Groups I and IV served as the controls and received arachis oil for 30 or 15 consecutive days, respectively. Group II and III birds received 75 mg/kg and 150 mg/kg malathion, respectively, in arachis oil for 30 consecutive days. Group V and VI birds received 75 mg/kg and 150 mg/kg malathion, respectively, in arachis oil for 15 consecutive days. Birds were sacrificed by decapitation on the 31st day for Group I, II, and III birds and on the 16th day for Group IV, V, and VI birds. Adrenal glands were removed to estimate ascorbic acid, cholesterol, corticosterone, and catecholamines. Data were analyzed with paired t-test.
Malathion exposure for 15 days did not result in significant effects on any of the parameters studied for either the 75 mg/kg or 150 mg/kg dose. Results for the 30 day exposure are provided in Table 1.
42
A decrease in ascorbic acid and adrenal cholesterol combined with an increase in corticosterone, as observed in this study, indicates that prolonged administration of malathion resulted in hypercortical activity. The decrease in adrenaline and noradrenaline observed in the study is evidence of adrenal medulla activity. The study authors suggest that prolonged exposure to malathion effects the adrenal medulla as well as adrenal cortex, which may impact the way the birds adapt to stressful situations.
Description of Use in Document: Qualitative
Rationale for Use: The data provide useful information for characterization of effects of chronic exposure to malathion on white leg-horned chicks, including a potential impact on the mechanism of stress adaptation.
Limitations of Study:While the data provide useful information for characterization of the potential effects of malathion exposure on the adrenal gland and its associated components, it is unclear how they impact survival or reproduction of the whole organism.
Primary Reviewer: Elizabeth DonovanSecondary Reviewer (required if study results are used quantitatively):
43
Open Literature Review Summary
Chemical Name: Malathion
CAS No: Not reported
PC Code: 057701
ECOTOX Record Number and Citation: 90659. Rishi, S. and B.D. Garg. 1993. Effect of malathion on immune response to T-dependent and T-independent antigen in chicken. Indian Journal of Poultry Science. 28 (3), pp. 208-216.
Purpose of Review (DP Barcode required for Quantitative studies): Malathion ESA pilot (Registration Review)
Date of Review: April 27, 2015
Summary of Study Findings:6-8 week old white leg-horned chicken were randomly divided into four groups containing 40-45 birds. Group I birds received 22.6 mg/kg malathion; Group II birds received 45.2 mg/kg malathion; and Group III birds received 90.4 mg/kg malathion. Doses were given daily in groundnut oil for 10 or 20 days. Control birds (Group C) were given 1 mg groundnut oil per bird for 10 or 20 days. After 10 days of treatment, 6-8 birds from each group were given 1 ml of 1% SRBC i.v. as T-dependent antigen and 6-8 birds from each group were given 1 ml of 1% LPS in complete Freund’s adjuvant as T-independent antigen. After 8 days of antigen administration blood was collected from each bird daily up to day 14. Blood samples were also taken 20 days after pesticide administration. The total antibody titre to SRBC antigen was determined. The ME-resistant (IgG) and ME-sensitive (IgM) antibodies titres were also determined. In addition, the effect of malathion on cell-mediated immunity was determined using h ypersensitivity reaction assay to 2,4-dinitrochlorobenzene (DNCB) and phytohemagglutinin-P (PHA-P). 7 days after antigen administration 4 birds from each group were injected in one wing web with 0.1 ml of 1 mg/ml of PHA-P in PBS solution or 0.1 ml of 1% DBCB solution in acetone water (4:1) was applied. The opposite wing web, which served as a solvent control. The difference in wing thickness was measured.
Treatment % Difference in SRBC antibody
% Difference in IgG
% Difference in IgM
Wing Thickness
22.6 mg/kg 10 days
↑28* ↑17.67 ↑37.5* ↑
22.6 mg/kg 20 days
↑68.8* ↑33.3* ↑66.6* ↑
45.2 mg/kg 10 days
↑31.5* ↑17.6 ↑31.25* ↑
45.2 mg/kg 20 days
↑8.33* ↑15.78* ↓5.56 ↑
90.4 mg/kg 10 days
↓28* ↓11.76 ↓30* ↓
90.4 mg/kg 20 days
↓36.6* ↓20 ↓44.7* ↓
44

Based on the results of this study, the authors suggest that malathion has an immunostimulatory effect at lower does and immunosuppressive effect at higher doses.
Description of Use in Document: Qualitative
Rationale for Use: The data provide useful information for characterization of effects of chronic exposure to malathion on white leg-horned chicks.
Limitations of Study:While the data provide useful information for characterization of the potential immune effects of malathion exposure it is unclear how they impact survival or reproduction of the whole organism. For the antibody portion of the test, data from the study is only presented in figures and as a % difference from the control. Raw data is not available to confirm statistical differences. For the wing response portion of the test data is only presented as an increase or decrease from the control. The form of the test material (formulation product vs. technical; source; purity) is not described.
Primary Reviewer: Elizabeth DonovanSecondary Reviewer (required if study results are used quantitatively):
45

Open Literature Review Summary
Chemical Name: Malathion (purity or form not reported)
CAS No: Not reported
PC Code: 057701
ECOTOX Record Number and Citation: 104560. Sodhi, S., A. Sharma, A.P.S. Brar, R.S. Brar. 2008. Effect of α tocopherol and selenium on antioxidant status, lipid peroxidation and hepatopathy induced by malathion in chicks. Pesticide Biochemistry and Physiology. 90 (2008), pp. 82-86.
Purpose of Review (DP Barcode required for Quantitative studies): Malathion ESA pilot (Registration Review)
Date of Review: April 21, 2015
Summary of Study Findings:Day old broiler chicks (n=45) were acclimatized for 7 days, vaccinated against New Castle disease and an infections bursal disease. They were supplied with food and water ad libitum. At one week of age chicks were divided randomly into three groups of 15 chicks each. The chicks in group I were given 10 mg/kg bw of malathion orally each day for 60 days. The chicks in group II were given the same dose of malathion plus α tocopherol and selenium combination (α tocopherol 150 IU/kg feed and selenium 0.1 mg/kg feed), daily for 60 days. The chicks in group III were the controls. Blood samples were collected from 5 chicks in each group by cardiac puncture at 20 day intervals. Various biochemical measures, including plasma lipid peroxidation (table 1), erythrocytic glutathione peroxidase activity (table 2) and plasma vitamin E concentration (table 3), were measured. At the end of the study, five chicks from each group were sacrificed and liver was collected for histopathological studies.
Table 1. Progressive chances (means ± SD) in lipid peroxidation of erythrocytes (n mol MDA produced/g Hb) in chicksDPA Group I Group II Group III1 62.60 ± 1.32 58.77 ± 2.69 61.90 ± 4.2320 152.56 ± 3.64* 63.53 ± 4.51 60.13 ± 3.6040 179.35 ± 5.12* 68.69 ± 3.68 62.34 ± 3.7260 231.43 ± 5.70* 65.32 ± 4.62 59.29 ± 4.79
Table 2. Progressive chances (means ± SD) in erythrocytic glutathione peroxidase activity (U/mg Hb) in chicksDPA Group I Group II Group III1 14.91 ± 0.39 14.83 ± 0.35 14.96 ± 0.4920 10.37 ± 0.42* 15.16 ± 0.57 14.72 ± 0.3840 9.32 ± 0.32* 15.36 ± 0.52 14.86 ± 0.4260 9.10 ± 0.50* 16.64 ± 0.61 14.98 ± 0.32
46

Table 3. Progressive chances (means ± SD) in plasma α tocopherol concentration (ug/L) in chicksDPA Group I Group II Group III1 4.36 ± 0.06 4.28 ± 0.03 4.39 ± 0.0120 3.98 ± 0.09* 4.43 ± 0.04 4.26 ± 0.0540 3.67 ± 0.04* 4.52 ± 0.05 4.31 ± 0.0260 3.10 ± 0.05* 4.61 ± 0.05 4.38 ± 0.06
Histopathological findings: Moderate to severe degenerative and necrotic changes, bile duct proliferation and congestion of hepatic sinusoids with infiltration of lymphomononuclear cells were observed in Group I chicks. The number and severity of histopathological changers in the liver was decreased in Group II chicks.
The study authors conclude that the increased lipid peroxidation observed in Group I chicks is indicative of an increase in reactive oxidative species, a major source of oxidative stress that can damage every major cellular component. This suggests that lipid peroxidation is a mechanism of action for chronic toxicity of malathion in broiler chicks. In addition the decrease in vitamin E concentration and GPX activity in chicks exposed to chronic doses of malathion suggest that decreased antioxidant protection contributes to oxidative damage.
Description of Use in Document: Qualitative
Rationale for Use:This study provides useful information for characterization of the effects of chronic exposure to malathion on broiler chicks, including information that may support an additional toxic mode of action.
Limitations of Study: While the biochemical and histopathological data provide useful information for
characterization of the potential cellular effects of chronic malathion exposure it is unclear how they impact survival or reproduction of the whole organism. The raw information supporting the histophathological findings, including the number of chicks with moderate to severe cellular damage in the Group I chicks and the number of, are not available. Without this information it is not possible to compare the effects observed in the treatment and control groups or fully understand the scope of the damage.
Additionally, the purity or form (e.g., technical grade or formulation) of the malathion used were not reported.
Primary Reviewer: Elizabeth DonovanSecondary Reviewer (required if study results are used quantitatively):
47

Open Literature Review Summary
Chemical Name: Malathion (from GL. Industries (E) Ltd., Guwahati, India)
CAS No: Not reported
PC Code: 057701
ECOTOX Record Number and Citation: 120759. Giri, S., G.D., Sharma, A. Giri, and S.B. Prasad. 2002. Genotoxic effects of malathion in chick in vivo micronucleus assay. Cytologia. 67, pp. 53-59.
Purpose of Review (DP Barcode required for Quantitative studies): Malathion ESA pilot (Registration Review)
Date of Review: April 27, 2015
Summary of Study Findings:5-7 day old chicks (Gallus domesticus) were obtained from Arambagh Hatcheries Ltd, Guwahati, India and housed in wooden cages. Birds were provided food and water ad libitum. Healthy animals were randomly assigned to one of the following study groups:
- Group 1 (n=4) served as the control. Two birds were exposed to saline via an intraperitoneal injection (i.p) and two birds were exposed via post oral gavage (p.o).
- Group 2 (n= 6) received 2.0 mg/kg mitomycin C via i.p. - Group 3 (n= 3) received 2.0 mg/kgmitomycin C via o.p.- Group 4 (n=6) received 2.5 mg/kg malathion via i.p.- Group 5 (n= 6) received 5 mg/kg malathion via i.p.- Group 6 (n= 6) received 10 mg/kg malathion via i.p. - Group 7 (n=3) received 2 mg/kg malathion via i.p. for 5 consecutive days at 24 h intervals- Group 8 (n= 3) received 2 mg/kg malathion via p.o. for 5 consecutive days at 24 h intervals. - Group 9 (n=3) received 2.5 mg/kg malathion via o.p.- Group 10 (n= 6) received 5 mg/kg malathion via o.p.- Group 11 (n= 6) received 10 mg/kg malathion via o.p.
After 24 and 48 hours of the various treatments animals were sacrificed to make bone marrow and peripheral blood smears to look for the frequency of micronuclei (MN) as an indicator of cytotoxicity.
Results: Acute exposure to malathion via intraperitoneal injection and post oral gavage significantly increased the frequency of MN in bone marrow cells (Table 1). Chronic exposure did not result in increased MN in these cells for either route of exposure.
48

In peripheral blood cells, acute exposure to malathion significantly increased the incidence of MN for the intraperitoneal injection exposure route only. Chicks exposed via post oral gavage were not significantly different from controls.
The study authors suggest that the results of this study indicate that malathion is Genotoxic to chicks.
Description of Use in Document: Qualitative for post oral exposure route
49
Rationale for Use:The data from the post oral gavage portion of the test provide useful information for characterization of the effects of acute exposure to malathion on broiler chicks, including information that may support an additional toxic mode of action. The data from the intraperitoneal portion of the test does not represent a relevant route of exposure.
Limitations of Study:While the data provide useful information for characterization of the potential cellular effects of malathion exposure it is unclear how they impact survival or reproduction of the whole organism. In addition, data from the control chicks was pooled across the two exposure routes represented in the study without an indication of whether or not they were tested for statistical difference.
Primary Reviewer: Elizabeth DonovanSecondary Reviewer (required if study results are used quantitatively):
50

Data Evaluation Record
MALATHION and DIMETHOATEPC Codes: 057701 and 035001
EPA Contract No. EP10H001452Task Assignment No. E4-17-2014
Study Type: Non-Guideline
Citation: El-Gawad, E.A.A., et al. (2011). Impact of Some Organophosphorus Insecticides on Growth Performance, Fecundity and Semen Characteristics in Nile Tilapia (Oreochromis niloticus). Lucrări Ştiinţifice Med. Vet. 54(1): 150-160. ECOTOX # 160043
Prepared forEnvironmental Fate and Effects DivisionOffice of Pesticide ProgramsU.S. Environmental Protection AgencyOne Potomac Yard 2777 S. Crystal DriveArlington, VA 22202
Prepared byDynamac Corporation1910 Sedwick Road, Building 100, Suite BDurham, NC 27713
Primary Reviewer:Rebecca L. Bryan, B.S. Signature:
Date: 3/28/2014Secondary Reviewer:David A. McEwen, B.S. Signature:
Date: 4/3/2014Program Manager:Jack D. Early, M.S. Signature:
Date: 4/14/2014
Disclaimer
This Data Evaluation Record may have been altered by the Environmental Fate and Effects Division subsequent to signing by Dynamac Corporation personnel. EPA Primary Reviewer: Amy Blankinship Date: __5/15___________EPA Secondary Reviewer: Date: _____________
51

Data Evaluation Record
ECOTOX CODE: 160043
STUDY TYPE: Non-guideline
DP BARCODE: Not provided
PC CODES: 057701 (Malathion); 035001 (Dimethoate)
CAS NO.: 121-75-5 (Malathion); 60-51-5 (Dimethoate)
MRID NO.: Not available
TEST MATERIAL (% purity): Malathion and Dimethoate (purity not provided)
CITATION: El-Gawad, E.A.A., Kandiel, M.M.M., Abbass, A.A., and Shaheen, A.A. (2011). Impact of Some Organophosphorus Insecticides on Growth Performance, Fecundity and Semen Characteristics in Nile Tilapia (Oreochromis niloticus). Lucrări Ştiinţifice Med. Vet. 54(1): 150-160.
SPONSOR: Not applicable (open literature review)
EXECUTIVE SUMMARY: The purpose of this study is to determine endocrine disrupting effects of the organophosphorus compounds, malathion and dimethoate, in Nile Tilapia (Oreochromis niloticus). The 1.6 mg/kg dimethoate and 0.17 mg/kg malathion test concentrations were prepared in the dry fish food. The treatment effects investigated included reproductive (GSI, semen quality, and plasma sex steroids testosterone and 17β-estradiol), growth performance (condition K factor), and gonadal morphology. Malathion and dimethoate are EDSP List 1 chemicals.
Methods: The Nile Tilapia (Oreochromis niloticus) used in the study were obtained from a private fish hatchery in Kafer El-Sheikh, Egypt. The fish mean body weights were 29.93 g for females and 33.56 g for males, and the fish mean body lengths were 12.8 cm for females and 13.33 cm for males. The fish were acclimated to laboratory conditions at 27 ± 1°C for 7 days in fiberglass tanks (110x90x40 cm). The control and treated fish were fed diet daily at a rate of 3% of body weight. About 50% of the tank water was exchanged daily. The malathion and dimethoate (purities not reported) were purchased from Sigma Aldrich Chemical (USA). The test chemicals were dissolved in cod liver oil to form stock test solutions. The 1.6 mg/kg dimethoate and 0.17 mg/kg malathion test concentrations were prepared by mixing one mL of test solutions into 3600 g of dry food. The treated feed was packed in clean plastic jars and stored refrigerated at 4°C until use. The 120-day test included an untreated control, 1.6 mg/kg dimethoate, and 0.17 mg/kg malathion treatment groups. Each treatment group contained one replicate tank with 100 fish.
At test termination, blood samples were collected from 6 male and 6 female fish. The total length and weight of fish were measured at test termination. Absolute fecundity, the total number of ripened eggs in the ovaries per female, was determined by counting immediately after dissection by the gravimetric
52
method. Relative fecundity was calculated based on the number of eggs per length (cm) or body weight (g).
Semen quality was determined from testes samples collected at test termination from 6 male fish per treatment group. Semen was collected from testes and transferred to a clean Eppendorf tube for analysis. The semen evaluations included pH, motility, viability, sperm cell concentration, and sperm cell morphology. The pH was determined using pH indicator papers. The sperm were counted as motile if they exhibited progressive movement or spontaneous flagellar beating, and the percentage motility was calculated by grading the percentage motile cells. Based on 5% eosin and 10% nigrosin staining, the percentages of live spermatozoa were counted by differential coloration using a microscope (100x). Sperm counts (cells/mL) were determined using a hemocytometer. The percentage of abnormal spermatozoa was counted, and morphological abnormalities were reported as a percentage of the total number of all counted spermatozoa.
For gonadosomatic indexes (GSI) determination, the gonads from male and female euthanized fish were excised and weighed. The growth performance was calculated based on the condition (K) factor.
For the sex hormonal assay, blood samples collected from the heart were assayed for estradiol 17β (E2) and total testosterone (T) using radioimmunoassay (RIA) kits.
The gonad tissue sections were collected from treated fish at test termination. The gonad samples were fixed in 10% buffered formalin, dehydrated in alcohol, cleared by xylene, embedded in paraffin, sectioned, stained with Hematoxylin and eosin, and analyzed under a light microscope.
For statistical analyses, the data results were expressed as mean ± SEM. The data were analyzed by one-way analysis of variance (ANOVA) and Duncan’s multiple range tests to determined significant differences between groups. The analyses were conducted using Statistical Package for the Social Sciences (SPSS) software (version 16.0). Statistical significance was determine at p<0.05.
Results (EDSP List 1 chemicals): The 1.6 mg/kg dimethoate and 0.17 mg/kg malathion treatments significantly decreased ovarian activity and lowered the reproductivity of female O. niloticus compared to the control (Table 1, copied without alteration from El-Gawad et al. 2011). Absolute fecundity was significantly decreased in the 1.6 mg/kg dimethoate and 0.17 mg/kg malathion treatment groups. The relative fecundity in relation to total length and bodyweight were significantly decreased in the 1.6 mg/kg dimethoate and 0.17 mg/kg malathion treatment groups.
53

Significant differences (p<0.05) in semen quality were observed in response to the 1.6 mg/kg dimethoate and 0.17 mg/kg malathion treatments (Table 2, copied without alteration from El-Gawad et al. 2011). The sperm cell concentrations were lower in the dimethoate (6.16 x 10⁹ cells/mL) and malathion (5.66 x 10⁹ cells/mL) treatment groups compared to the control (15.84 x 10⁹ cells/mL). The sperm progressive motility was decreased in the dimethoate (24.17%) and malathion (21.67%) treatment groups compared to the control (60.83%). The live sperm percentage was reduced in the dimethoate (50.07%) and malathion (43.32%) treatment groups compared to the control (73.48%). Based on sperm morphological observations, increased tail deformity was observed in the dimethoate (57.93%) and malathion (48.6%) treatment groups compared to the control (28.81%). No effects on semen pH or percentage of head deformities were observed for either treatment group.
54

The effect of 1.6 mg/kg dimethoate and 0.17 mg/kg malathion treatments on gonadosomatic index (GSI) and growth performance condition (K) are presented in Figure 1 (copied without alteration from El-Gawad et al. 2011). The female GSI was significantly decreased (p<0.05) in the dimethoate treatment (0.44) compared to the control (2.15). No effect on female GSI was observed for the malathion treatment (1.11). For the male GSI, a significant decrease was observed in the dimethoate (0.34) and malathion (0.41) treatment groups compared to the control (1.03). For the K factor, no significant differences were observed for either treatment group.
55

For the plasma sex steroid determinations, the males in the dimethoate treatment group showed high levels of T and E2 compared to the control (data not provided). Lower plasma levels of T and E2 were observed for males in the malathion treatment group. For females, lower plasma levels of T and E2 were observed in the dimethoate and malathion treatment groups.
For the histological examination of testes, the dimethoate treatment group exhibited necrosis and degeneration of seminiferous tubules with complete absence of the line germ cells, and pyknosis of spermatocytes nucleus. For the malathion treatment group, the male histological observations included degenerative changes in seminiferous tubules and pyknosis of spermatocytes nucleus. For the histological examination of ovaries, observations in both the dimethoate and malathion treatment groups included multiple atretic oocytes with oocyte necrosis embedded in ovarian interstitial tissues and decrease of vitellogenic oocytes.
Conclusions: The study authors concluded that dimethoate at 1.6 mg/kg and malathion at 0.17 mg/kg caused reproductive and endocrine function effects in O. niloticus after 120 days exposure in fish food. The observed effects on fecundity and sperm quality are possibly caused by the low estradiol and testosterone levels detected, and the degenerative changes in gonads which lead to decreased GSI.
The study was conducted at Benha University in Egypt. The Good Laboratory Practices status of this research is unknown.
Given that the purity of the test compounds were not reported, this study was not included in the EDSP WoE analysis. For use in other risk assessments, the study may be used qualitatively.
56

The following study limitations are: Only one replicate was used, and so it appears the endpoints are based on psuedoreplication
(fish all from same test vessel). Only one treatment group was used per chemical, therefore an understanding of dose-response
was not possible. The purity of the test compounds was not reported. Test compounds were dissolved in cod liver oil, and it is unknown if there were potential
contaminants in this carrier. No individual quantitative data were provided for the reproductive, sperm quality, or GSI and K
parameters (means presented). No quantitative data were provided for the plasma sex steroid (T and E2) determinations.
57

Open Literature Review Summary
Chemical Name: Chloryprifos PC Code: 059101ECOTOX Record Number and Citation: 61878Abbasi, S. A. and Soni, R. (1991). Evaluation of Water Quality Criteria for Four Common Pesticides on the Basis of Computer-Aided Studies. Indian J.Environ.Health 33: 22-24.
Purpose of Review (DP Barcode or Litigation):Previous review was for RLF. Updated 7/25/15 for ESA PilotDate of Review: 8/4/09 and update (7/25/15)
Summary of Study Findings:Authors conducted 144 h toxicity tests on tadpoles of Rana tigrina, using four pesticides, chlorpyrifos, endosulfan, malathion, and phosalone. Acute toxicity of respective pesticides was in the order of endosulphan>chlorpyrifos>phosalone>malathion. Endosulphan was over 100 times more toxic than malathion. Authors also looked at stress to tadpoles evidenced by sluggish and imbalanced movements and reduced food intake compared to controls. Tadpoles were selected by size rather than age (average size 1.1 cm, average weight 57 mg). Acclimation and experimental procedures were included by reference and for the ESA Pilot, the referenced article: Abassi S.A. and Soni, R. (1984). Toxicity of Lower than Permissible Levels of Chromium (VI) to the Freshwater Teleost, (Nuria denricus) Environ Poll. A (36)75-82 was reviewed to gain information on the methods.
For chlorpyrifos, the 96 h LC50 was 19 ug/L and the 144 h LC50 was 10 ug/L. For malathion, the 96 h LC50 was 1410 ug/L and the 144 h LC50 was 170 ug/L.
Description of Use in Document (QUAL, QUAN, INV):ESA: QUAL -This study is classified as QUAL and will not be used quantitatively in the ESA pilot assessment because it lacks critical information regarding the methods ( after reference review) and test substance formulation.
Note: RLF-considered INV and used fish surrogate as proxy
Rationale for Use/ Limitations of Study: Test material not stated to be TGAI or TEP Methods were only referenced. After reviewing the reference article the methods were still unclear.
o Age of test organisms not given.o Purity of test substance not given.o Solvent use unknowno Test concentrations not confirmed o Temperature not reported. o Adequate replication not stated –when reviewing the referenced methods paper, it seems
the replication was sufficient if same method used.o Dilution water not confirmed to be appropriate and uncontaminated –the reference
indicates some water quality parameters were tested but source was well water and it is unclear if pesticide/contaminant free.
58

o Acclimation period (with little mortality) not stated-the reference indicates acclimation mortality was monitored but uncertain for current study.
Primary Reviewer:Katherine Stebbins, Biologist, ERB3
59

Chemical Name: MalathionCAS NO: 121-75-5ECOTOX Record Number and Citation: 7856Dowden, B.F. 1966. Effects of Five Insecticides on the Oxygen Consumption of the Bluegill Sunfish, Lepomis macrochirus. Ph.D.Thesis, Louisiana State Univ., Baton Rouge, LA,Ph.D.Thesis, Louisiana State University, Baton Rouge, LA : 104 p.Purpose of Review: Endangered Species AssessmentDate of Assessment: 1/26/15Brief Summary of Study Findings: Method:Several pesticides were tested in this study (chlordane, parathion, DDT, malathion and lindane), however, this reviews focuses on malathion results.Juvenile bluegill sunfish (Lepomis macrochirus) were exposed to malathion (99.2%) at concentrations of 0.1, 1.0 and 5.0 µg/L and oxygen consumption was measured. Fish were shipped from the Louisiana Wild Life and Fisheries Commission or collected from farm ponds and the Mississippi river when temperatures prohibited shipping of fish; fish were held in reconstituted fresh water. The respirometer used in the study was based on designs by Betz (personal communication) and Welsh and Smith (1960) whereas it appears that portions of the devise were dedicated to either testing control or malathion-exposed fish. Test solutions were prepared in acetone. Two groups of three randomly chosen fish were placed into two exposure chambers and weighted to nearest 0.1g (placed on balance without water), and there was an attempt to keep the weight consistent as possible between test groups (between 15-20g). Tests were conducted at 21±1°C. Fish were acclimated to the exposure chambers for no less than 8 hours and test initiation times were randomly chosen. Tests were conducted for 50 hours (to ensure a 48-hr measurement period) or until a fish died at which point that study was terminated. Oxygen consumption rates were calculated (mL Oyxgen/gm/hr). Comparison between the control and treatment groups was conducted using factorial analysis of variance methods (F tests). Given that mortality was observed in the test groups, the data used in the statistical comparison for the treatments appeared to be for a 10 hour period (longest period before a death in a replicate (reviewer unsure for which chemical) was observed). Data from the controls was for the 48-hour period.ResultsSignificant decreases in oxygen consumption was reported at all malathion treatments (values in ECOTOX were adjusted for purity, 99.2%). Fish were noted to produce excess mucus when exposed to malathion compared to the control, however, correlation of mucus production with oxygen consumption was not possible. The oxygen consumption rates for the test chemicals are shown below (reprinted from Figure IV in the document).
60

Description of Use in Document: QualitativeRationale for Use: Data from this study are useful for qualitative characterization of sublethal endpoints for freshwater fish. However, it is not used as a threshold value given the limitations discussed below.
Limitations of Study: Limitations of the study that preclude the endpoints for quantitative use (threshold) in risk assessment include the following: 1) data used for statistical comparison between the controls and treatments were not comparable as it appears that data from the controls was over a 48 hour duration and was only 10 hours for the test treatments; 2) it is uncertain in how this reported decrease in oxygen consumption is quantitatively linked to the endpoints of survival, growth or reproduction.Other limitations of the study included: 1) only mean values were reported without any understanding of the variability (e.g., 95% confidence intervals, standard deviations) around that value; 2) acetone was used to prepare the test concentrations, however, it is unknown if the control contained acetone or was a dilution water control only; 3) test concentrations were not measured; 4) given that fish died in the experiment (although unsure of how many fish and in what treatments), there is uncertainty in how this may have affected measurements as fish were likely stressed prior to death.Reviewer: Amy Blankinship, ERB6
61
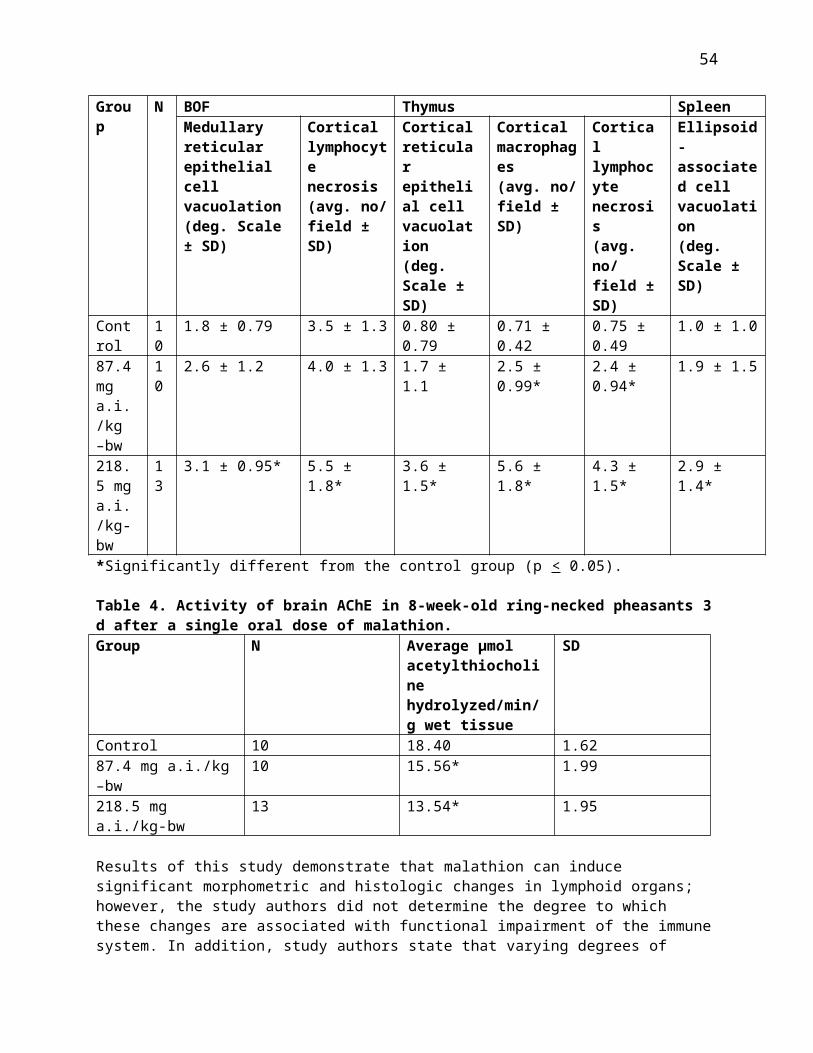
Chemical Name: MalathionCAS NO: 121-75-5
ECOTOX Record Number and Citation: 86858Drummond RA and Olson GF. 1974. Cough Response of Brook Trout (Salvelinus fontinalis) Exposed to Four Metals and Four Pesticides. Draft Manuscript from A. Jarvinen files, U.S.EPA, Duluth, MN : 10 p.
Purpose of Review: Endangered Species Assessment
Date of Assessment: 1/26/15
Brief Summary of Study Findings: Yearling brook trout (Salvelinus fontinalis) were exposed to metallic and pesticide compounds and cough response was measured. The abstract reported that the lowest concentration of each compound to cause a significant increase in cough frequency was compared to available data regarding long-term effects.
Description of Use in Document: Invalid
Rationale for Use: Data from this study are invalid use in the risk assessment. This document is a draft manuscript and contains hand-written peer-review comments (many of which are hard to read to due to copy quality).
Limitations of Study: Appears to be an unfinished document. Reviewer did conduct an internet search in an attempt to locate a finalized document. While the reviewer did observe a published paper by the author regarding a cough response after exposure to metals (i.e, mercury), they were unable to locate a published document for the pesticides cited in this draft manuscript.Reviewer: Amy Blankinship, ERB6
62

Chemical Name: MalathionCAS NO: 121-75-5
ECOTOX Record Number and Citation: 119267Kundu, C.R. and S. Roychoudhury. 2009. Malathion-induced sublethal toxicity on the hematology of cricket frog (Fejervarya limnocharis). J. Environ. Sci. Health Part B. 44:673-680.
Purpose of Review: Endangered Species Assessment
Date of Assessment: 2/3/15
Brief Summary of Study Findings: Method:Cricket frogs, Fejervarya limnocharis, (6.5-6.6 g) were collected from a paddy field (India), acclimated for 10 days, and were exposed to 0.006 ppm malathion (50EC) for 240 hours and hematological parameters were evaluated. While specific testing details were not provided for the definitive test, details on the preliminary experiment were provided and the reviewer assumes these conditions applied to the definitive test as well. Test solutions were renewed every day and the test material was dissolved in acetone. A single test concentration (0.006 ppm malathion 50EC) and a control were used. Ten animals were placed into each replicate (glass jars with 5-L capacity) with three replicates per treatment. Temperature, pH and dissolved oxygen were measured. Blood samples were collected (from dorsal aorta) from 6 individuals at 24, 48, 72, 96 and 240 hours. Erythrocytes and leucocytes were counted (using Neubauer’s improved haemocytometer) and differential leucocyte count was also performed (using Wright’s stain). The length and breadth of erythrocytes were measured using ocular and stage micrometer. Haemoglobin and packed cell volume (mg/100mL) were also measured. Statistical analyses completed using Student’s t-test and Scheffe’s test.ResultsTotal erythrocyte counts were significantly lower and total leucocyte counts were significantly greater at all time points in the malathion treatment compared to control (Table 1 and 2 below, copied from paper). Additionally, neutrophil counts were significantly lower and eosinophil and lymphocyte counts were significantly greater at all time points for the malathion treatment compared to control. The length, width and surface area of erythrocytes were reduced compared to the control at 72 and 96 hours; surface area was still significantly reduced at 240 hours. Hemoglobin and packed cell volume/content (mg/100mL) were significantly lower at all time points. Other morphological changes in erythrocytes and leukocytes were also observed in the blood films (e.g., dissolution of nuclear material in erthyrocytes, leucocyte degeneration) of the malathion-treated animals.Table 1. Total Erythrocyte Counts (million/mL)
Time (hrs)Control Malathion treatmentMean S.D. Mean S.D.
24 2.57a ±0.01 2.46b ±0.0148 2.53a ±0.01 2.02b ±0.0172 2.45 A ±0.01 1.43B ±0.0196 2.35a ±0.03 1.02b ±0.01240 2.45 A ±0.01 1.41B ±0.01Means with different letters are significantly different (p<0.001)
63
Table 2. Total Leucocyte Counts (1000/mL)
Time (hrs)Control Malathion treatmentMean S.D. Mean S.D.
24 4.05A ±0.07 5.18B ±0.0648 4.37a ±0.05 6.55b ±0.0772 4.70 a ±0.07 7.09b ±0.0896 5.03A ±0.05 7.62B ±0.13240 4.43 a ±0.08 6.47b ±0.07Means with different letters are significantly different (p<0.001)
Description of Use in Document: QualitativeRationale for Use: Data from this study are useful for qualitative characterization of sublethal endpoints for amphibians. However, it is not used as a threshold value given the limitations discussed below.
Limitations of Study: Limitations of the study that preclude the endpoints for use as a threshold in risk assessment include the following: 1) it is uncertain in how these reported decreases/increases in hematological parameters are sufficiently linked to the endpoints of survival, growth or reproduction; 2) Only one concentration was tested, therefore, a dose-response relationship could not be evaluated/established.
Other limitations of the study included: acetone was used to prepare the test concentrations, however, it is unknown if the control
contained acetone or was a dilution water control only. Solvent amount used in the test solutions were not reported, and since only one control was used, it is not known if the solvent may have influenced the measured endpoints;
test concentrations were not measured; it was not definitively stated that the conditions reported in the preliminary test were the same
in the definitive test; animals collected from a paddy field, and therefore, prior exposure to potential contaminants is
unknown; life-stage of the animals were not reported; the reviewer is uncertain if the reported test concentrations were adjusted for purity (ECOTOX
assumes they were); as the formulation product name is not given, the reviewer is uncertain if the test material is
reflective of formulations in the United States.
Reviewer: Amy Blankinship, ERB6
64
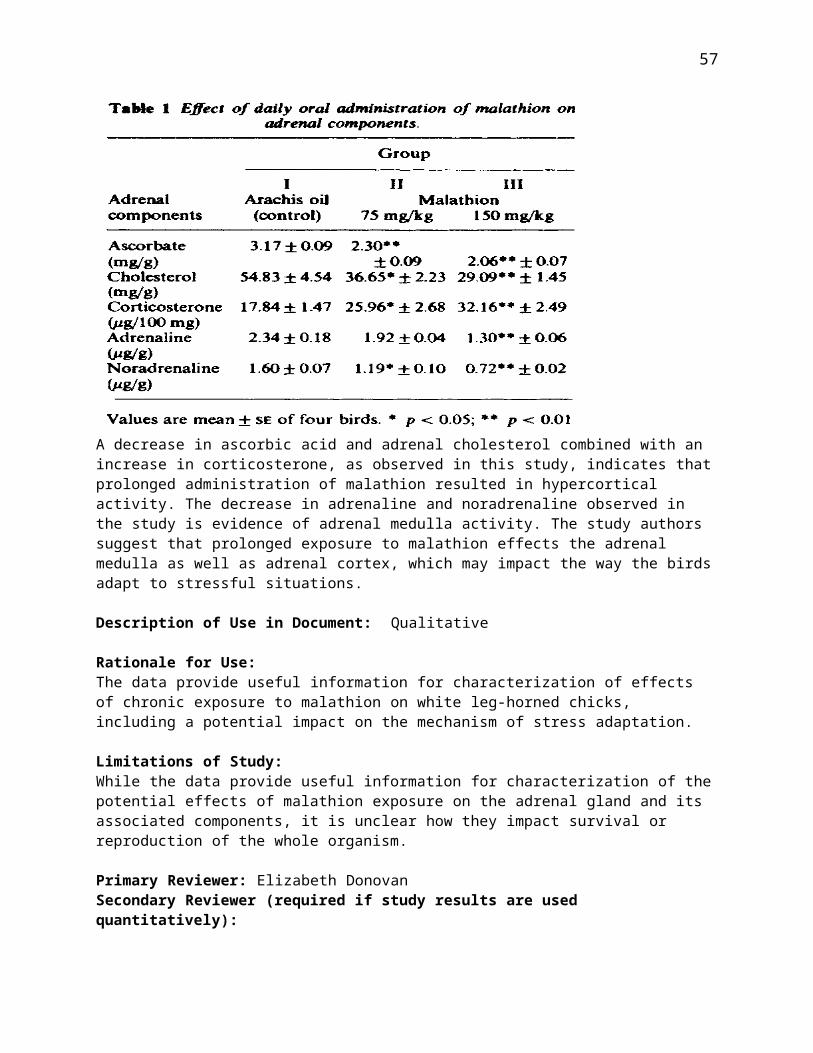
Chemical Name: MalathionCAS NO: 121-75-5
ECOTOX Record Number and Citation: 158903Patil, V.K., and M. David. 2010. Behavioral and morphological endpoints: as an early response to sublethal malathion intoxication in the freshwater fish, Labeo rohita. Drug Chem. Toxicol. 33(2): 160-165.
Purpose of Review: Endangered Species Assessment
Date of Assessment: 1/8/15
Brief Summary of Study Findings: Method:Carp, Labeo rohita, fingerlings collected from India State Fisheries department were acclimated in laboratory for 30 days in cement tanks and then acclimated for 20 days at 24±1˚C in glass aquaria. Fish (5 ± 1g, 7.5±0.25cm) were held in dechlorinated tap water with the following water characteristics: temperature, 24 ± 2°C; pH, 8 ± 0.2 at 24°C; dissolved oxygen, 9.6 ± 0.8 mg/L; carbon dioxide, 6.3 ± 0.4 mg/L; total hardness, 23.4 ± 3.4 mg as CaCO3/L; phosphate, 0.39 ± 0.002 μg/L; specific gravity, 1.001; and conductivity less than 10 μS/cm, and a 12–12-hour photoperiod. Fish were fed dry feed pellets (Nova; Aquatic Feed Pvt. Ltd) up to 2 days before initiation of the acute toxicity test. Toxicity tests were conducted with malathion (50% EC a.i. 50g/100mL; purchased from local market in India). In the acute toxicity test, solutions were renewed daily and mortality was monitored for 96 hours. Rangefinding was reported as using batches of 10 fish in 20L of solution. The test concentrations in the definitive acute test were reported to be between concentrations resulting in 0% and 100% mortality (actual test concentrations not reported). An additional test was conducted at 1/10th the calculated acute LC50 value (0.45 µg/L) where fish were exposed for 1, 5 or 15 days and then placed in dilution water for 15 days. Fish were fed and were observed for behavioral responses and morphological deformities. Brain and muscle acetylcholinesterase (AChE) were measured (using method by Ellman et al. 1961; spectrophotometer). A control was reported to have been used in both tests. All reported concentrations are as nominal and it was not clear if concentrations and results were adjusted to account for percent malathion (50%).ResultsThe reported 96-hr LC50 value was 4.5 µg/L (2.25 µg/L when adjusted for 50% malathion; mortality data not provided). No mortality was observed in the sublethal test. The control fish in the sublethal test were reported to have been behaving normally (actively feeding, alert to disturbances) and did not vary throughout the exposure period. In the malathion treatment (0.45 µg/L; 0.225 µg/L when adjusted for purity), fish were reported to display shoaling behavior (by the first day of exposure), erratic swimming, staying near bottom of tank, spread out (2x the area occupied in tank as compared to control), and loss of coordination. The study reported that fish became lethargic, restless, and secreted excess mucus over their body. A behavior reported as being easy to catch was reported on the first day of exposure and reported to continue during the non-exposure period. Caudal bending was also observed in the exposure and non-exposure periods. Feeding preferences and food consumption were also reported to be affected even in the non-exposure period. AChE activity was reported to be reduced during the exposure period (Figure 1 in paper).
65
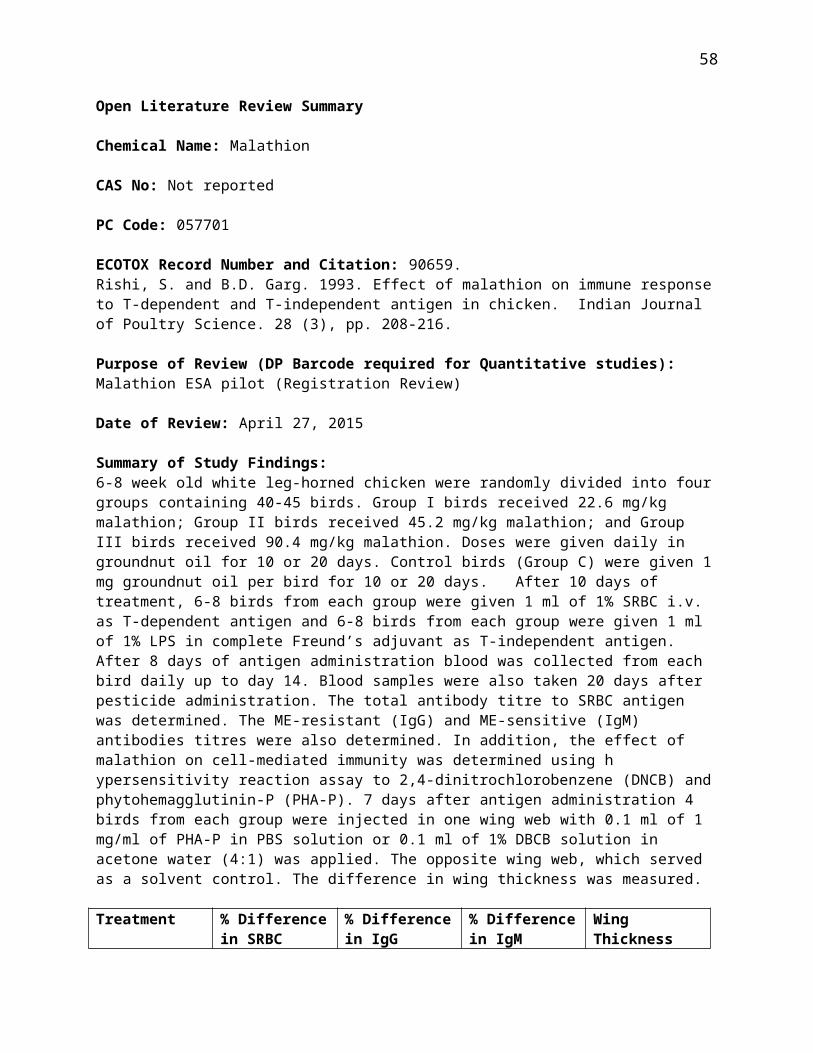
Reviewer Comments:Several papers similar to this study have been published by the authors. In looking at these additional papers, there is uncertainty in the reported test concentrations in this paper. The additional information in the other publications that lend support to this uncertainty are:ECOTOX CITATION DATA Comment118295 Patil VK;David M. 2008. Behaviour and
Respiratory Dysfunction as an Index of Malathion Toxicity in the Freshwater Fish, Labeo rohita (Hamilton). Turk. J. Fish. Aquat. Sci. 8(2): 233-237
96-hr LC50 = 9 µL/L; 0.9 µL/L used as sublethal dose; Conducted 4 or 15 day study at lethal (LC50) or sublethal dose, respectively; abnormal swimming & behavior (qualitative narrative); ↑ oxygen consumption (lethal and sublethal)
Tested 50%EC; Fish (5 ± 2g, 7.5±0.23 cm); used 6 replicates/conc each with 10 fish; LC50 value reported as moderately toxic
118200 Patil VK;David M. 2008. Behavioral and Respiratory Dysfunction in the Freshwater Fish, Labeo rohita (Hamilton) Under Malathion Intoxication. J. Basic Clin. Physiol. Pharmacol. 19(2): 167-175
96-hr LC50 = 9 µL/L; 0.9 µL/L used as sublethal dose; Conducted 4 or 15 day study at lethal (LC50) or sublethal dose, respectively; abnormal swimming & behavior (qualitative narrative); ↑ oxygen consumption (lethal and sublethal)
Tested 50%EC; Fish (5 ± 2g, 7.5 cm); used 6 replicates/conc each with 10 fish; LC50 value reported as moderately toxic
117888 Patil VK;David M.2009. Hepatotoxic 96-hr LC50 = 9 µL/L; 0.9 Tested 50% EC; fish
66

Potential of Malathion in the Freshwater Teleost, Labeo rohita (Hamilton). Vet. Arh. (Tisak) 79(2): 179-188
µL/L used as sublethal dose (duration 25 d); ↓ in liver proteins and AChE and ↑ free amino acids, protease activity and ACh at 5 & 15 days; all levels near control by day 25.
(3±0.5 g, 5 cm);
NA Patil VK;David M. 2013. Oxidative stress in freshwater fish, Labeo rohita, as a biomarker of malathion exposure. Environ. Monit. Assess 185:10191-10199
Test concentrations reported as 4.5 and 0.45 µg/L in abstract only (only referred to as lethal and sublethal in paper); Conducted 4 or 15 day study at lethal (LC50) or sublethal dose, respectively; ↑ catalase & protease activity, H2O2, free amino acids, malondialdehyde, protein carbonyls in gill, liver and kidney
Tested 50%EC; Fish (5 ± 1g, 7.5±0.25 cm); used 10 fish per conc in RF
Three of these studies report the test concentrations in terms of µL/L. Density is not reported in any of these three studies. However, a density is reported in this paper and is 50 g/100mL (500 g/L). While the paper does not specify whether the density is for the active ingredient (malathion) or the formulation, it is common to report the density in terms of the a.i. on a commercial label. While the test concentrations in the fourth study are the same as this study, the test concentrations in that paper were only reported in the abstract and were only referenced as a lethal and sublethal concentration in the actual paper.If the assumption that the reported density in this paper represents the active ingredient (a.i.), the acute LC50 value of 9 µL/L would be 4500 µg a.i./L (or 4.5 mg a.i./L) based on mass/volume [9 µL x 500 g/L x 10-6 µg/g x L/10-6 µL= 4500 µg/L]. In E118295 and E118200, the study authors categorize the LC50 value as moderately toxic, and if they used the same system as USEPA/EFED, this would mean an acute toxicity value in the range of 1 to 10 mg/L. Therefore, the reviewer believes that the test concentrations reported in this paper and again in 2013 are actually in mg a.i./L, not µg/L. In other papers using Labeo rohita, the reported 4-d LC50 value were 0.75 ppm (Alam, Lakshmi, and Mishra, 2010; E154643; 4-5.5 cm fingerlings; purity not reported), and 4.98 mg/L (Arora, Shrivastava and Seth, 1971; E9277; 2.5-6cm fingerlings; 50% EC, but values reported as a.i.). A 2-day LC50 value for the same species was reported as 7.89 mg/L (Nair, Nair, and Mercy, 2007; E119072; 4.8 cm; 50% EC).
Description of Use in Document: Qualitative
Rationale for Use: Data from this study are useful for qualitative characterization of acute and sub-chronic endpoints for freshwater fish. However, it is not used as a threshold value given the limitations
67
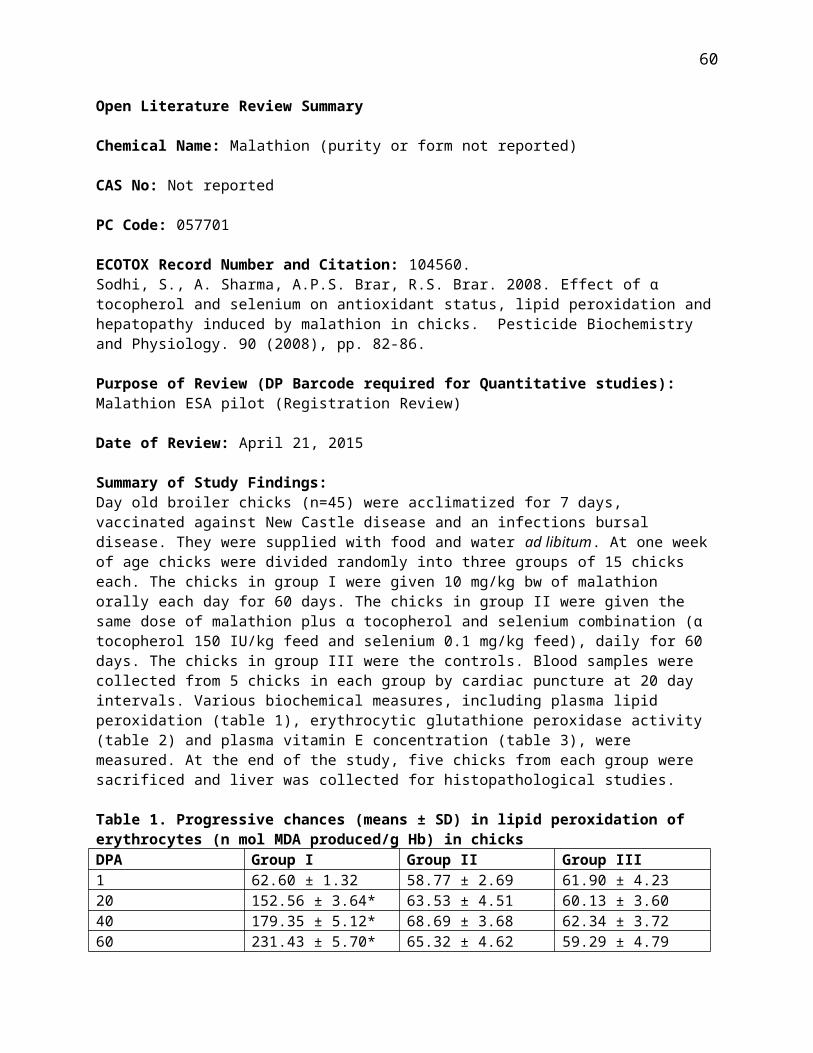
discussed below.
Limitations of Study: Limitations of the study that preclude the subchronic endpoints for quantitative use (threshold) in risk assessment include the following: 1) while sublethal behavioral effects were observed, the number of fish exhibiting these effects at each time point were not reported; 2) Figure 1 reports percent change in AChE activity levels in brain and muscle but the report does not indicate what the change is compared to (e.g., the controls, Day 0 levels), if it was statistically different from controls, or the variability around the mean value. Other limitations of the study included: 1) the test concentration nor the mortality data for the acute LC50 value were provided, thereby, verification of the LC50 or control performance could not be completed (since no mortality reported in subchronic study, control mortality in acute study may have been acceptable (≤10%); 2) for the acute study only an LC50 value was reported without any understanding of the variability (e.g., 95% confidence intervals) around that value; 3) test concentrations were not measured 4) it was not definitively stated how many fish were exposed or replicates used in the definitive acute or sublethal test but it could be assumed that it was similar to the rangefinder design (10 fish in 20L solution) and 6 replicates as stated in another citation; 5) the composition of the test vessels were not reported; 6) given that the study was conducted in India, it is unknown if the formulation used is representative of current registrations in the United States.
Reviewer: Amy Blankinship, ERB6
68
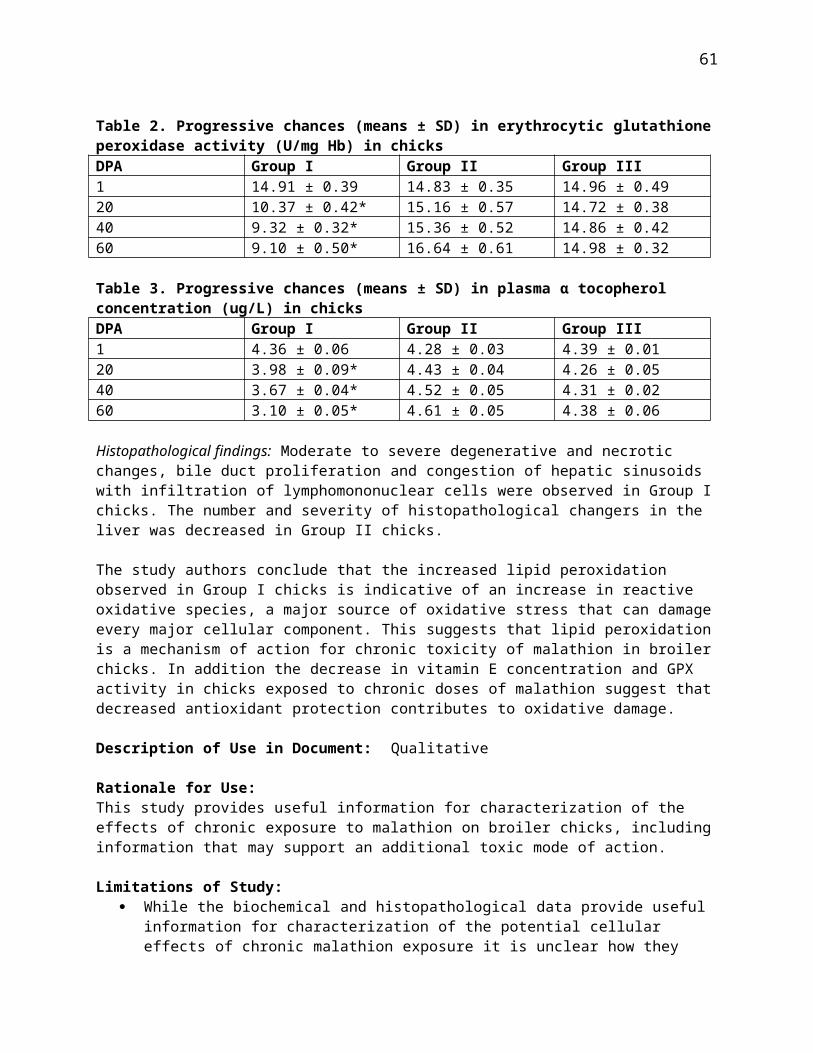
Open Literature Review Summary
Chemical Name: Malathion (99.3%, American Cyanamid Co., Wayne, NJ)PC Code: 057701
ECOTOX Record Number and Citation: 35348 (MRID 45046301). Mendoza CE.1976. Toxicity and Effects of Malathion on Esterases of Suckling Albino Rats. Toxicol. Appl. Pharmacol. 35: 229-238.Purpose of Review (DP Barcode required for Quantitative studies): Endangered Species AssessmentDate of Review: March 31, 2015Summary of Study Findings:Method
Wistar rat pups (Day 1, 6, 12, and 17-day old) were orally administered malathion (intubation with malathion dissolved in corn oil (Mazola) and maintained for 24 hours. Four concentrations were used per test group (pup age) and a control group was added (corn oil only). The number of pups per litter was adjusted to 8 or 10 and were not separated by sex. After dosing, pups were returned to mothers and monitored for 5 hours. After 24 hours, surviving pups were sacrificed and dissected. Tests were repeated three to four times using 8-10 pups per dam. Excised organs (brain, liver, kidney, spleen, heart) were processed and frozen. Enzyme activity (acetylthiocholine iodide (ASChI), butyrylthiocholine iodide (BSChI) and indophenyl acetate (IPA)) and protein concentrations were measured. LD50 values determined using Weil method.
Results
Mean 24-hour LD50 values (confidence intervals not reported) ranged from 209-1806 depending on pup age (Table 1, from results presented in Table 4 of paper).
Pup age (days) Mean LD50 (mg/kg) Range of LD50s (mg/kg)
1 209 177-2506 707 --6 469 (tested using purity of 98.9%) --12 1085 841-141517 1806 1415-2003
In regards to the esterase activities as different age groups (results reported for 28, 42, and 84 days old rats in addition to the 1, 6, 12, and 17 described above; details for these additional ages not reported; reviewer believes these discussions are in reference to a control or untreated group of rats). The study author reported that liver enzymes hydrolyzing BSChI and ASChI increased in activity during the first 7 days after birth and then remained constant IPA hydrolysis was greater than BSChI or ASChI and increased 28 days after birth. Protein concentrations generally remained constant over 84 day period. The study also reported that brain esterase activity for BSChI increased after 7 days after birth and then remained relatively constant. Brain activity towards ASChI also increased during first 7 days than then increased further with age, and IPA hydrolysis rate increased during first 7 days but then declined from Day 13 on. There was a decrease in brain protein concentration during the first week after birth. For kidney, esterase activity towards BSChI and ASChI increased during the first 7 days and then decreased by Day 28 and remained constant. IPA gradually increased during first 3 weeks, declined and stabilized.
69
Protein concentration in kidney gradually increased and then remained constant from day 13 to 84. 1-day old pups exposed to malathion exhibited inhibition of esterases catalyzing the hydrolysis of ASChI, BSChI in liver, brain and kidney with inhibition increasing with dose (Figure 2 in paper presents decreases relative to control but statistical analyses relative to control were not reported). IPA hydrolysis was inhibited in liver but not in brain or kidney. In 8 day old pups, based on hydrolysis of IPA, liver esterases were inhibited from 0.5 to 24 hours after dosing and brain cholinesterases were also inhibited within 0.5 hr but showed signs of recovery 3 hours after dosing. For 18-day old pups, ASChI hydrolysis was reduced 70-80% in brain (at 4000 and 8000 mg/kg), and in the liver hydrolysis of ASChI, BSChI, and IPA were decreased by 70% (at 4000 mg/kg) and 8000 mg/kg decreased liver catalyzed ASChI hydrolysis by 95%.
Description of Use in Document: LD50 values may be used as an acute mortality thresholds. Results for esterase activity are qualitative.
Rationale for Use:LD50 values may be used as acute mortality value for mammals. Given the lack of details on statistical analyses for esterase activity, this data is used qualitatively.
Limitations of Study:1. Control performance in the LD50 studies or the esterase activity studies were not reported.2. Confidence intervals were not reported for LD50 values3. Based on the paper, it is unclear if the values in the treated pups were/would be statistically
different from control. Primary Reviewer: Amy BlankinshipSecondary Reviewer (required if study results are used quantitatively):
70

Open Literature Review Summary
Chemical Name: Malathion (formulation, 50% malathion, Cyanamid Company, India)PC Code: 057701
ECOTOX Record Number and Citation: 75127. Hoda Q; Azfer MA; Sinha SP. 1993. Modificatory Effect of Vitamin C and Vitamin B-Complex on Meiotic Inhibition Induced by Organophosphorus Pesticide in Mice Mus musculus. Int. J. Vitam. Nutr. Res. 63(1): 48-51.
Purpose of Review (DP Barcode required for Quantitative studies): Endangered Species Assessment
Date of Review: March 31, 2015
Summary of Study Findings:Method
Eight week old mice (Mus musculus) were orally exposed to malathion and dimethoate (Rogor, Rallis Tata India, 30%) at a dose of 0.2 µg/kg-bw/day for 10 days. Treatment groups consisted of: 1) control group (received only diet (Gulmohar, Hindustan Lever Ltd)); 2) mice given supplementary dose of either vitamin C or B-complexes; 3) mice exposed to malathion or dimethoate alone; and 4) mice exposed to pesticide and vitamin C or B-complex concurrently. Ten mice were used in each treatment group and the average weight was approximately 25 grams. Vitamins were injected daily intraperitoneally (0.25 mL of 1% ascorbic acid and 0.3 mL of 1% vitamin B-complex). Treatment was 10 days after which mice were sacrificed. In the testis, the total number of spermatocytes and their different dividing phases were counted (using 5 random foci in each slide). Statistical tests used to compare control and treatment groups not reported. ResultsThe meiotic index (%) for malathion was significantly reduced compared to the control (60.77% control vs. 54.9% malathion (↓9.6%). Additionally, the phase frequency % of prophase 1 was significantly reduced (58.64% control vs. 50.98% malathion (↓13%)) and diakinesis metaphase 1 was significantly increased (1.27% control vs. 3.13% malathion (↑146%)) for malathion compared to the control; ana-telophase 1 was not significantly different. There were no significant differences between the control and vitamin alone treatment groups. While they were still statistically significant compared to the control (p<0.05), the malathion plus vitamin treatment groups had an increase in meiotic-index (%) compared to the control.
Description of Use in Document: Qualitative
Rationale for Use:There is uncertainty in whether an approximate 10% decrease in meiotic-index would translate into a marked effect on reproduction. While the administration of vitamin C was by injection which is not anticipated to be an environmentally relevant route, this research suggests that the addition of vitamins (which may be present in the animal’s diet naturally) could lessen the degree of effect.
Limitations of Study:1. Statistical analyses used were not reported.2. Environmental conditions (temperature, lighting) were not reported.
71
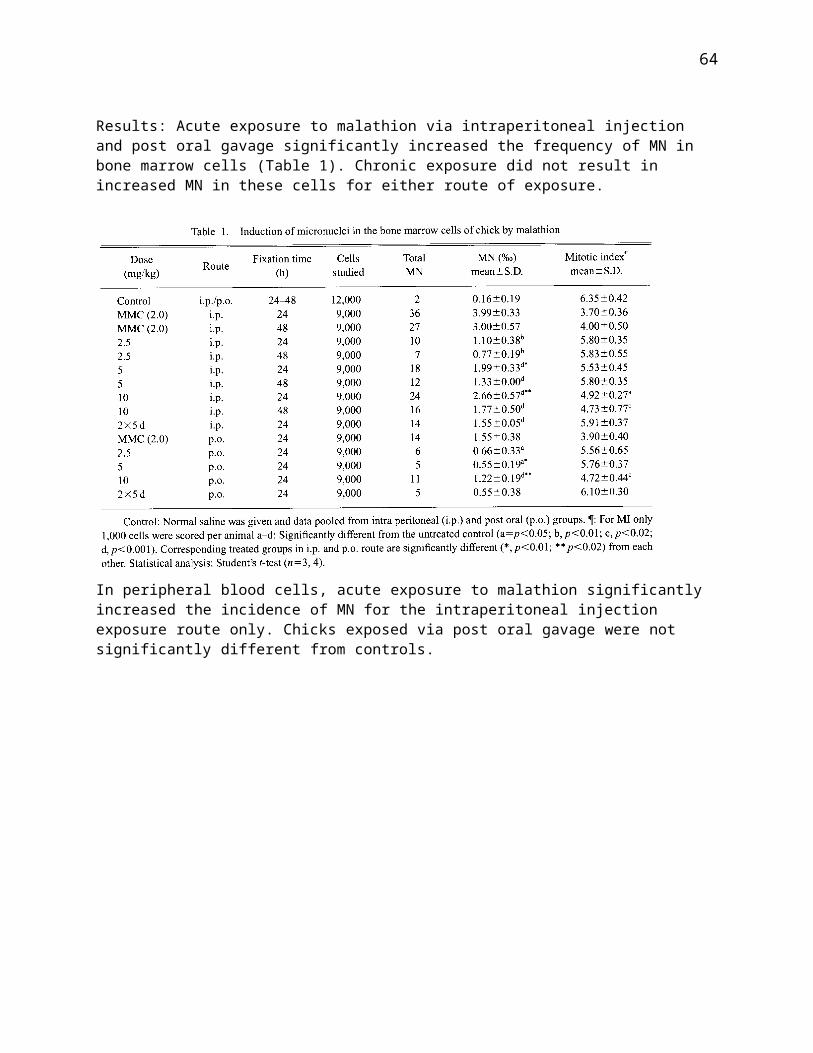
Primary Reviewer: Amy BlankinshipSecondary Reviewer (required if study results are used quantitatively):
72
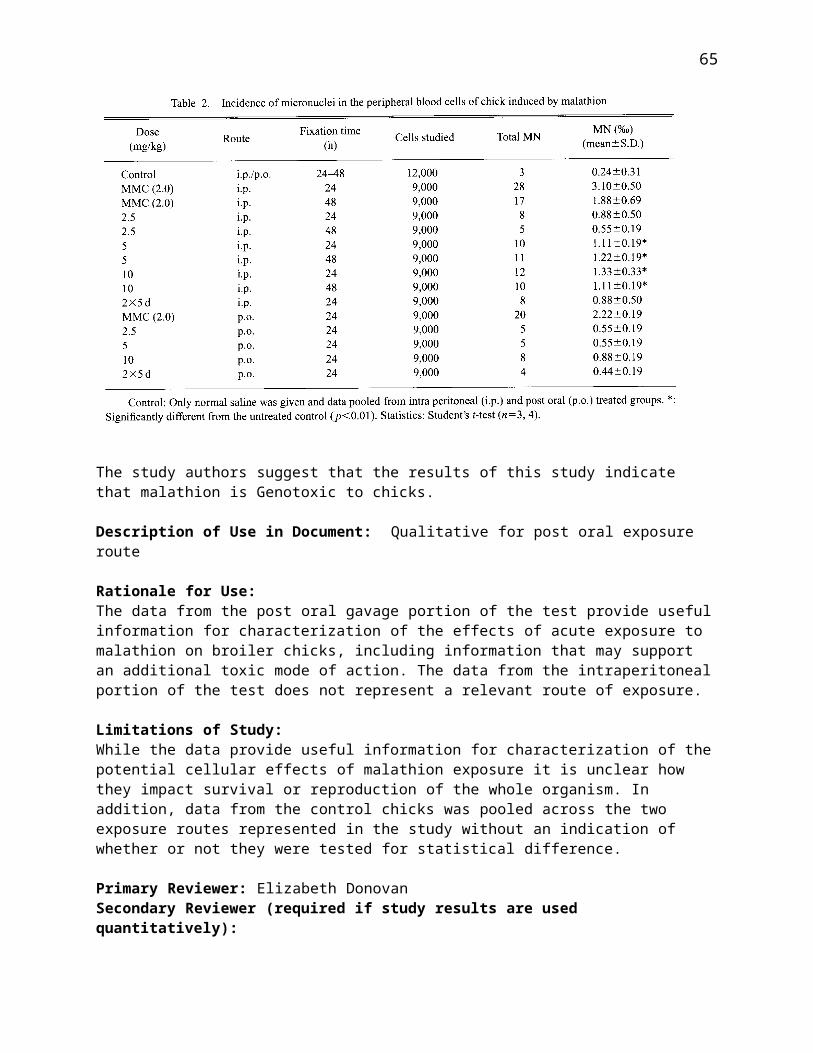
Open Literature Review Summary
Chemical Name: Malasun 50 EC (active ingredient: malathion)
CAS No: Not reported
PC Code: 057701
ECOTOX Record Number and Citation: 50842. Kaskhedikar, P., T.A. Kaskhedikar, and G.N. Johri. 1994. Effect of malathion on the worm burden of the mice experimentally infected with an oxyuridae nematode, Syphacia obvelata. Journal of Environmental Biology. 17 (4), p 349-351.
Purpose of Review (DP Barcode required for Quantitative studies): Registration Review
Date of Review: January 2, 2015
Summary of Study Findings:In a dietary exposure study with the model Mus musculus albinus, test animals were exposed to challenge doses of 0.0078125, 0.03125, 0.125, and 0.5 ml malathion per kg body weight daily for 5, 10, and 15 days and subsequently exposed to parasitic worms. Each treatment group consisted of 20 animals. All treated mice were intubated with a single dose of 500 viable nematode eggs and the parasitic worm burden was evaluated 21 days after exposure. A control group fed untreated diet was also intubated with a single dose of 500 nematode eggs.Table 1: Effect of malathion upon worm burden of mice exposed to 500 eggs of Syphacia obvelataDose of malathion (ml/kg body weight)
Duration of Malathion Exposure (Days)5 10 15Worm Burden
% Worm burden
Worm Burden
% Worm burden
Worm Burden
% Worm burden
0.0078125 70 14 91* 18.2 102* 20.40.03125 85* 19 108* 21.6 122** 24.40.125 102* 20.4 130** 26 148** 29.60.500 122** 24.4 142** 28.4 160** 32Control worm burden = 65 (13%)* P < 0.05** P < 0.01
Worm burden was positively correlated with increasing malathion concentrations and duration of exposure, although the study authors acknowledge that “the mechanism by which malathion exerts its influence on the development and retention of worms in the host is obscure.” The LOAEC is 0.0078125 ml/kg body weight. The NOAEC is less than the lowest concentration tested.
Review note: the doses are reported as mg/kg/bw in ECOTOX, not ml/kg bw, and were adjusted for 50% malathion.
Description of Use in Document: Qualitative
Rationale for Use:
73
Supplemental malathion toxicity data to be used in the Risk Description section to characterize the potential risk of direct, sublethal adverse effects to mammals.
Limitations of Study:Given that mice were exposed to a bolus dose of parasitic worms, it is uncertain whether the exposure route assessed is environmentally relevant. Further information on parasitic worm burdens in mice is necessary to evaluate dose selection. In addition, while the ECOTOX database reports units in terms of mg/kg-bw the study authors report units in terms of ml/kg-bw and does not provide the information necessary for conversion. According to the OPP open literature review guidance1, the report should state which methods of statistical comparison (e.g., t-test, ANOVA, chi square) were used and the presumed nature or the data (parametric versus nonparametric); however, only a summary table of treatment level results was included and the statistical analyses employed by the study authors were not described. Analytical confirmation of the concentration of malathion in the four spiked diets was not described and it is further unclear whether the nominal concentrations reflect the volume of formulated product added to the diets or the purity-adjusted volume of malathion.
Primary Reviewer: Nathan MillerSecondary Reviewer (required if study results are used quantitatively):
1 http://www.epa.gov/pesticides/science/efed/policy_guidance/team_authors/endangered_species_reregistration_workgroup/esa_evaluation_open_literature.htm#att_6
74
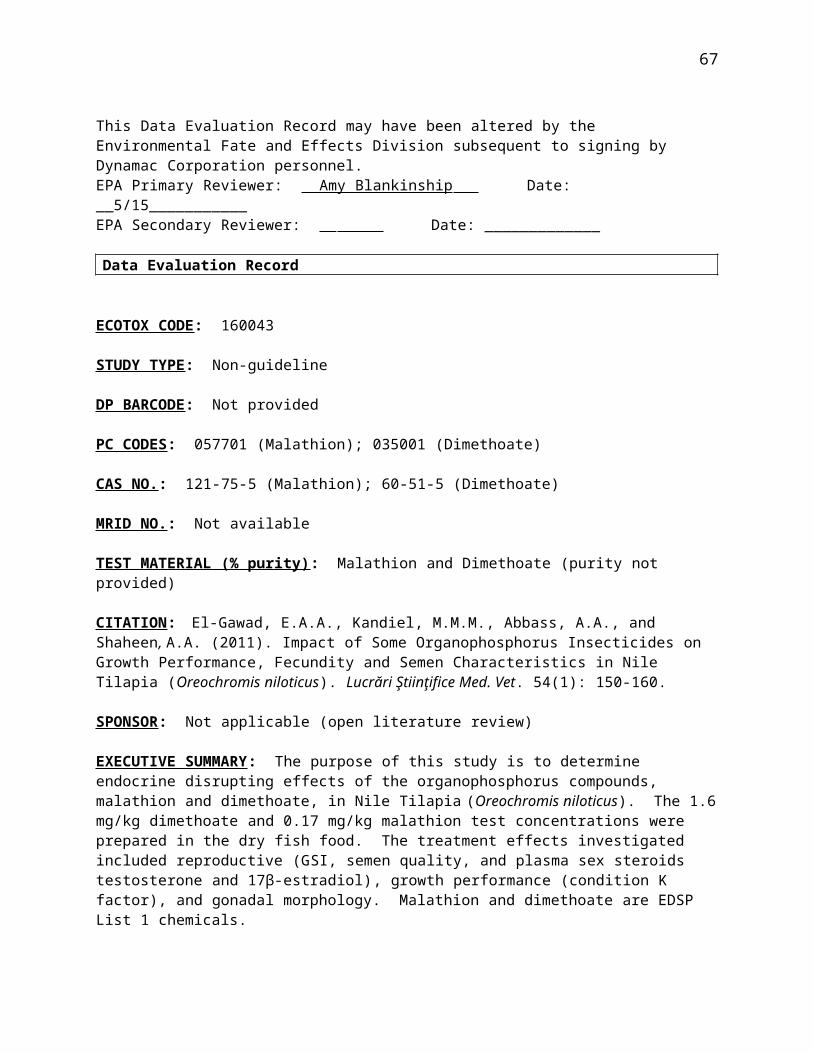
Open Literature Review Summary
Chemical Name: Malathion (14-C malathion (radiochemical purity 99%, International Isotopes, Munich, Germany; non-labelled malathion (purity not reported, Research Institute for Plant Protection, Chemical and Equipment in Ankara Turkey); additionally, authors reported malathion and malaoxon obtained from Greyhound Chromatography and Allied Chemicals, U.K)
PC Code: 057701
ECOTOX Record Number and Citation: 89273. Akay MT;Elcuman A;Nurcan M;Kolankaya D;Yilmazoglu G. 1992. Bioavailability and Toxicological Potential of Lentil-Bound Residues of Malathion in Rats. In: Meet.on Bound Pesticide Residue in Grain: Bioavailability and Biological Activity, May 13-17, 1991, Slough, England, U.K., J.Environ.Sci.Health Part B 27(4): 325-340
Purpose of Review (DP Barcode required for Quantitative studies): Endangered Species Assessment
Date of Review: March 31, 2015
Summary of Study Findings:Method
Lentil grains (Lens culinaris L. variety winter Pul 21) were treated with radio-labelled and non-labeled malathion. Lentils were stored for 12 months (at 20°C), during which residues (surface, extractable, and 14-C bound) were measured (0, 0.5, 1, 2, 3, 6, 9, and 12 months). Bioavailability of malathion in rats exposed to treated lentil grains (male Swiss albino rats; 180-200g) was examined. Soxhlet-extracted lentil grains (containing bound 14C malathion) were fed to three rats for three days; controls fed extracted, pesticide-free grains. Rats were fed regular rat chow for two days following lentil exposure, after which rats were sacrificed and selected tissues removed. Feces and urine were extracted for determination of residues (extractable and bound). Solutions used for trapping 14CO2 (expired air) were directly measured for residues. A biological activity study was conducted in which 15 male and female Swiss albino rats (145-161g) were exposed to lentil grains containing malathion bound residues. The rats were fed for 3 months one of two concentrations: group one- lentils dosed at 10 ppm, bound residues of the grain 0.95 pm; group two- lentils dosed at 50 ppm, bound residues of the grain 6.51 ppm). A control group was included. At the end of exposure, rats were sacrificed and organs excised and weighed. Cholinesterase activity was measured in brain, red blood cells and plasma. Blood biochemistries were also measured including: serum enzyme activities (amylase, alkaline phosphatase, creatine kinase, GPT and GOT), blood urea nitrogen, uric acid, total protein, albumin, as well as other hematological parameters including white and red blood cells.
ResultsAfter 12 months of storage, bound residues were 0.95 ppm and 6.51 ppm for lentils dosed with 10 and 50 ppm, respectively. Analysis of the extracted lentil material indicated the presence of about 0.2 ppm malathion ( 21% of the total bound residues) and other 14C material which was not identified. In regards to bioavailabilty and metabolism, about 35% of administered dose was in the urine and 45% in feces. Expired air contained about 1.5% and 9% was in the tissues. In the biological activity study, there were no significant effects on body weight, organ weight, water or
75

food consumption compared to control. Additionally, none of the rats exhibited any signs of toxicity during the 3 month exposure. Significant decreases in serum AP (↓31.5%) and GPT (↓27.5%) were reported at 6.51 ppm. Urea nitrogen levels were significantly increased 14.9 and 18.6% at 0.95 and 6.51 ppm, respectively. White blood cells were also significantly increased at both doses (44 and 41% at 0.95 and 6.51 ppm, respectively), and lymphocytes were also increased (49%) at the high concentration; there were no other significant effects for hematology endpoints. Serum ChE activity was significantly reduced 34% at the high dose; no significant difference at low dose (10% reduction). There were no significant difference in brain or RBC ChE activity.
Description of Use in Document: QUAL
Rationale for Use:Exposure was based on media that was stored for 12 months and then extracted and then fed to animals. There is uncertainty in the environmental-relevance of exposure to this type of diet.
Limitations of Study:
1. Statistical tests used in the analysis were not described. 2. Purity of the non-labelled malathion was not reported.3. It appears that the rats were fed lentils that were stored for 12 months and then extracted,
resulting in exposure to bound residues. From the paper, it appears that not all of the bound residues was malathion, and the composition/identity of the bound residues is not known.
Primary Reviewer: Amy BlankinshipSecondary Reviewer (required if study results are used quantitatively):
76

Open Literature Review Summary
Chemical Name: Malathion (purity and form not reported in this paper, in E751272, it was reported that test material was formulation, 50% malathion, Cyanamid Company, India)
PC Code: 057701
ECOTOX Record Number and Citation: 121100. Hoda Q;Sinha SP. 1991. Minimization of Cytogenetic Toxicity of Malathion by Vitamin C. J. Nutr. Sci. Vitaminol. 37(4): 329-339
Purpose of Review (DP Barcode required for Quantitative studies): Endangered Species Assessment
Date of Review: March 31, 2015
Summary of Study Findings:Method
Effects of malathion were explored for onion root-tip cells, mice (Mus musculus) and the fly, Drosophila melanogaster. Onion root-tip cells were exposed to malathion (bulbs grown on water solution and exposed when young roots were about 1 cm) at five test concentrations from 50-800 ppm. There were five bulbs per group. Treatment groups for this study included: a control; vitamin C only; malathion only; malathion plus vitamin C; and malathion where bulbs were exposed to vitamin C for 24 hours prior to malathion exposure. Exposure durations were 24 hours, after which three roots per bulb were cut, fixed and preserved. Slides were prepared and the number of dividing cells and any abnormalities were enumerated using the method by Bhalla et al. Seven to eight week old inbred Swiss albino mice were orally exposed to malathion at a dose of 0.2 µg/kg-bw/day for 10 days. Treatment groups consisted of: 1) control group (received only diet (Gulmohar, Hindustan Lever Ltd)); 2) mice given supplementary dose of vitamin C; 3) mice exposed to malathion alone; 4) mice exposed to pesticide and vitamin C concurrently; and 5) mice exposed to vitamin-supplemented food prior to malathion exposure. Ten mice were used in each treatment group. Vitamin C was injected intraperitoneally (0.25 mL of 1% ascorbic acid). Treatment was 10 days after which mice were sacrificed. Bone marrow was extracted and processed. Chromosomal abnormalities were examined using scoring protocol suggested by Preston et. Meiotic-index in testes cells were also examined. Statistical tests used to compare control and treatment groups not reported.
Male Drosophila melanogaster (inbred Oregon-R strain) flies (36±12-h old) were exposed to malathion at a 0.006% concentration. Treatment groups consisted of: 1) control group; 2) flies given supplementary dose of vitamin C; 3) flies exposed to malathion alone; 4) flies exposed to pesticide and vitamin C concurrently; and 5) flies exposed to vitamin-supplemented food for 5 days prior to malathion exposure; other male flies were maintained on control diet for this 5 day period. Malathion was mixed with food medium. Ratios of 1 male: 2 virgin females were placed in a vial for 48 hours for mating and egg laying, after which the same flies were transferred to a clean vial for another 48 hours. M1 generation was obtained in five 2 day egg-laying periods. The total number of eggs in each brood and hatched larvae were enumerated. Egg loss (larvae that could not come out after 48 hours of being laid)
2 E75127. Hoda Q; Azfer MA; Sinha SP. 1993. Modificatory Effect of Vitamin C and Vitamin B-Complex on Meiotic Inhibition Induced by Organophosphorus Pesticide in Mice Mus musculus. Int. J. Vitam. Nutr. Res. 63(1): 48-51
77
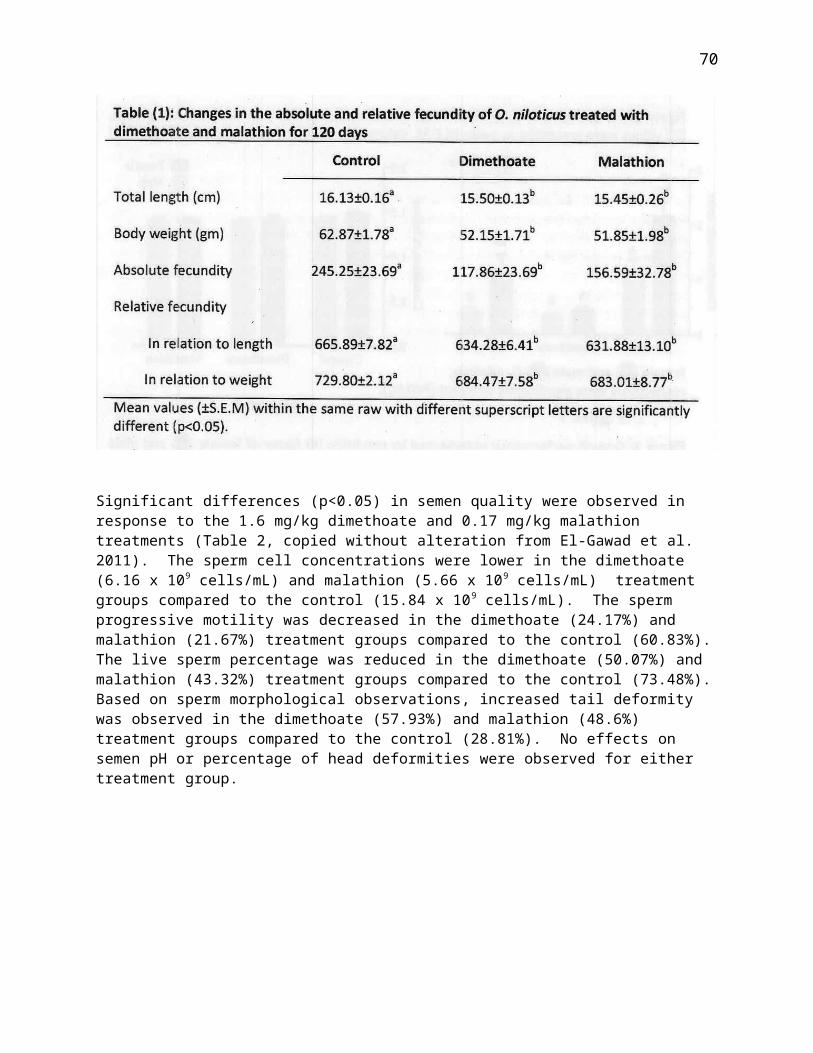
was deemed to be due to the incidence of dominant lethal mutation in the zygote/developing embryo. Relative mortality rates (RMR) were calculated. Muller-5 method was used for detection of recessive lethal mutations in the X-chromosome of males.ResultsOnion root-tipThe study author reported that significant decreases in mitotic-index were observed in pesticide treated bulbs and mitosis was completely halted at 800 ppm. Abnormalities were placed into two broad categories: chromosome/chromatid breaks and their subsequent rearrangement and mitosis-disrupting types. Abnormality rate was reported as nil in the control, 2% at 50 ppm, 5.5% at 100 ppm and non-dose dependent increases at 200 and 400 ppm (approximately 5.5-6% based on Figure 1 in paper). When vitamin C was added, significant effects were observed but to a lesser degree. There were no significant effects from the vitamin treatment alone compared to control.MiceThe rate (%) of chromosome/chromatid abnormalities (in bone marrow) were significantly increased compared to the control (5.33% in control vs. 26.0 % in malathion treatment). There were also significant increases in rate (%) of abnormal metaphases, and individual and mitosis disrupting abnormality types. When vitamin C was added, significant effects were observed but to a lesser degree; the effects were lessen to a greater extend when vitamin C was added concurrently as oppose to pre-treatment. There were no significant effects from the vitamin treatment alone compared to control. Meiotic-index in primary spermatocytes were significantly reduced (same results as presented in Hoda et al. 1993; E75127).DrosophilaThe RMR was decreased in the malathion treatments for eggs laid during the 5th to 8th day, but increased during the last brood (9-10th day) compared to control. There was no significant change in hatching rate for the first 4 days. Figure 2 in the paper demonstrates RMR (%) for five broods with the change for the first two broods <-5% compared to the control and approximately -12% and -8% in the third and fourth brood, respectively; a +12% increase was observed in the final, 5th brood. The percent of X-chromosome-linked recessive lethal mutations was significantly increased in the malathion treatment compared to control (0.87% in control vs. 2.89% in malathion). When vitamin C was added, significant effects were observed but to a lesser degree; the effects were lessen to a greater extend when vitamin C was added concurrently as oppose to pre-treatment. There were no significant effects from the vitamin treatment alone compared to control, and the effects of malathion were lessened when exposure was supplemented with vitamin C.
Description of Use in Document: Qualitative
Rationale for Use:For the onion tip, exposure was in a water solution, and there is difficulty in relating this exposure to an environmentally relevant concentration (particularly for terrestrial modeling). This is a similar situation for Drosophila in where the exposure was reported as % and the paper did not specify the purity or form of the malathion tested. There is uncertainty in whether an approximate 20% and 2% increase in chromosome abnormalities in mice and Drosphila, respectively, is sufficient to result in an adverse effect on reproduction or survival. While the administration of vitamin C was by injection which is not anticipated to be an environmentally relevant route (except for Drosophila which was directly added to food), this research suggests that the addition of vitamins (which may be present in the animal’s diet naturally) could lessen the degree of effect.
78
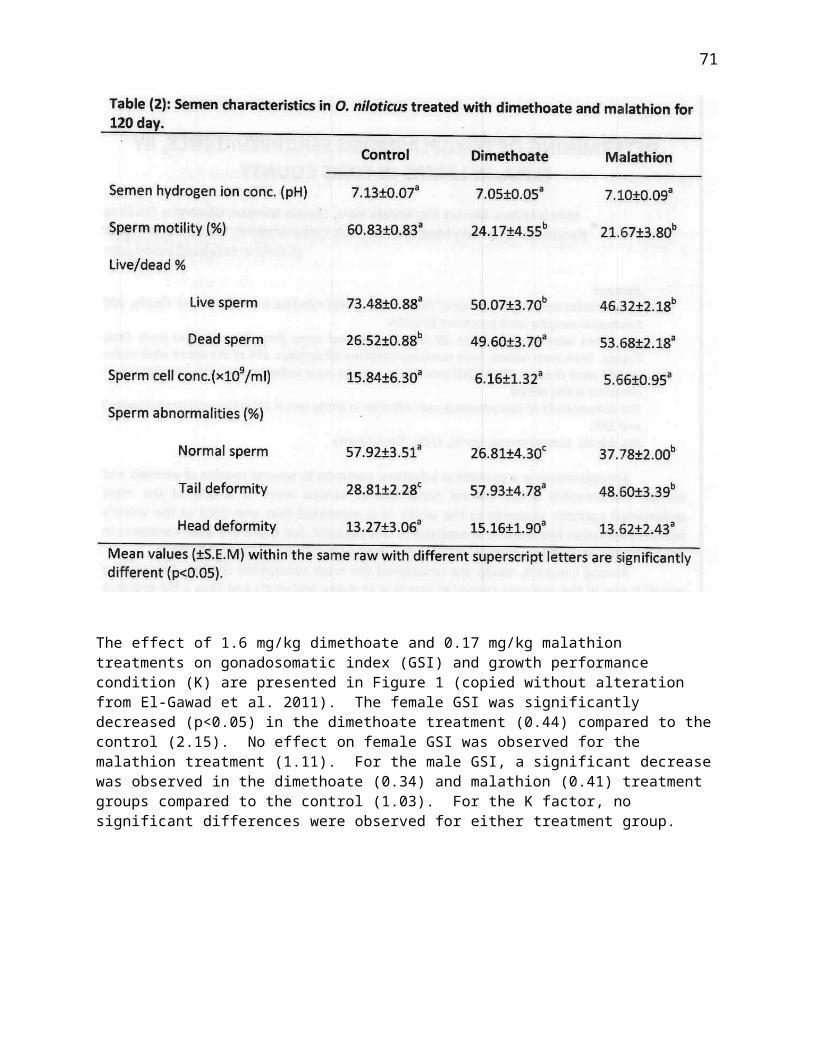
Limitations of Study:1. Statistical analyses used were not reported.2. Environmental conditions (temperature, lighting) were not reported.
Primary Reviewer: Amy BlankinshipSecondary Reviewer (required if study results are used quantitatively):
79

Open Literature Review Summary
Chemical Name: Malathion (formulation, Fyfanon 50EC 500g/L, Cheminova, Denmark)PC Code: 057701ECOTOX Record Number and Citation: 162358. Hackenberger BK;Jaric D;Hackenberger D;Stepic S. Effects of Chronic Dietary Exposure to a Low-Dose of Malathion, Aroclor-1254 and 3-Methylcholanthrene on Three Biomarkers in Male Mice. Acta Biol. Hung. 61(4): 423-433
Purpose of Review (DP Barcode required for Quantitative studies): Endangered Species AssessmentDate of Review: March 31, 2015Summary of Study Findings:Method
Malathion, aroclor 1254 and 3-methylcholanthrene were tested in this study, however, this review focuses on malathion.
Male (CBA strain, obtained from Division of Biology in Zagreb) mice were fed ad libitum wheat grains (obtained from Agricultural Institute, Osijek) treated with malathion at a concentration of 5 x 10⁻⁶ mg/kg (0.55 ppb bw/day); malathion was dissolved in corn oil. Mice were 6±1 week old and 2±g. Mice were maintained at 23±1°C, 50-60% relative humidity, and a 12:12 L:D light cycle. There were 6 replicates each with 10 mice for each treatment; control was included. Twelve mice were sacrificed every 3 months for one year. At 12 months, due to mortality only 11 mice were available for malathion; no mortality occurred in the control. Livers were removed, processed and enzyme analyses were conducted. 7-ethoxyresorufin-O-deethylase (EROD; CYP1A1), glutathione (GSH), Cholinesterase activity (ChE), protein content were measured. Data was analyzed using ANOVA with Tukey’s HSD and Dunnet’s two-sided t-test. ResultsNo significant difference in body weight was observed during the study. For EROD, the study authors state there were no significant difference for malathion compared to control (Figure 1 indicates significance at 9 months). The study authors state that GSH was significantly reduced (27.58%) at 3 months; (Figure 1 also indicate significantly increased at 12 months). The study authors remarked that AChE activity was unexpectedly significantly increased (18% of initial value) at 9 months. AChE was then was significantly decreased at 12 months compared to control (approximately 10% based on Figure 1).
80
Description of Use in Document: Qualitative
Rationale for Use:There is uncertainty in how to interpret the results of this study in the context of an adverse effect given the relative increase in AChE (approximate 18% increase) and then 10% decrease in AChE, respectively, over a relatively long study duration (1 year). Additionally, the inconsistencies in the reporting between text and figures/tables increases uncertainty in the reliability of results.
Limitations of Study:
1. There are inconsistencies in the reporting of significance between the text and corresponding tables/figures.
2. While there were no effects on body weight and only one mortality observed for malathion, the study did not report if other sublethal effects (e.g., behavior) were observed.
81

3. Study was conducted with formulation. Reviewer assumed reported doses were adjusted for purity, but this is not certain. Also, as formulation was obtained outside of U.S., uncertain how it may be reflective of formulations in United States.
Primary Reviewer: Amy BlankinshipSecondary Reviewer (required if study results are used quantitatively):
82

Open Literature Review Summary
Chemical Name: Chlorpyrifos and Malathion
CAS No: 2921-88-2
PC Code: 059101, 057701
ECOTOX Record Number and Citation:
E068422Ahrens, W.H. 1990. Enhancement of soybean (Glycine max) injury and weed control by thifensulfuron-insecticide mixtures. Weed Technology, 4(3): 524 – 528.
Purpose of Review (Note: DP Barcode required for Quantitative studies): Chlorpyrifos ESA pilot (Registration Review)
Date of Review: 01/07/15
Summary of Study Findings: Soybeans (Glycine max) were exposed to single chemicals (thifensulfuron, carbaryl, chlorpyrifos, malathion, and methomyl) and combinations of these insecticides with thifensulfuron (an herbicide). Pesticidal combinations were also tested with kochia and yellow foxtail (species not specified). Commercial pesticide formulations were used, but the formulations or percent a.i. were not specified. A nonionic surfactant [X-77; 0.25% (v/v)] was added to all treatments. Treatments were applied using a moving nozzle pot sprayer. Exposure to single chemicals were at concentrations of 0 (control), 140, 280, and 560 g/ha (0, 0.125, 0.25, and 0.5 lb a.i./acre, respectively). There were three plants per 0.5-L plastic pots. Soybeans were treated at the unifoliolate stage and were harvested 17 days after treatment. At harvest, injury was estimated visually (0% = no injury to 100% = complete necrosis). Fresh weight of shoots was determined after removal at soil level. The experiments were conducted in greenhouses from January to April. Temperatures during the test ranged from 22o to 26o C. Experiments were arranged as a randomized complete block design having four of five replicates and each experiment was repeated. Differences between means were determined using the least significant difference (0.05).
Results (for Chlorpyrifos and Malathion only):
Exposure to Single Chemicals:
For chlorpyrifos and malathion, there were no statistically significant differences from control in percent injury at any concentration tested (see Table 1). For chlorpyrifos, there was a 7, 8, and 9% reduction in weight at the 0.125, 0.25. and 0.5 lb/acre concentrations, respectively. The differences were statistically significant from controls at the 0.25 and 0.5 lb/acre concentrations, resulting in NOAEC and LOAEC values of 0.125 lb/acre and 0.25 lb/acre, respectively, based on a reduction in weight.
For malathion, there was a 5, 5, and 12% reduction in weight at the 0.125, 0.25. and 0.5 lb/acre concentrations, respectively. The difference was statistically significant from controls at the 0.5 lb/acre concentration, resulting in NOAEC and LOAEC values of 0.25 lb/acre and 0.5 lb/acre, respectively, based
83
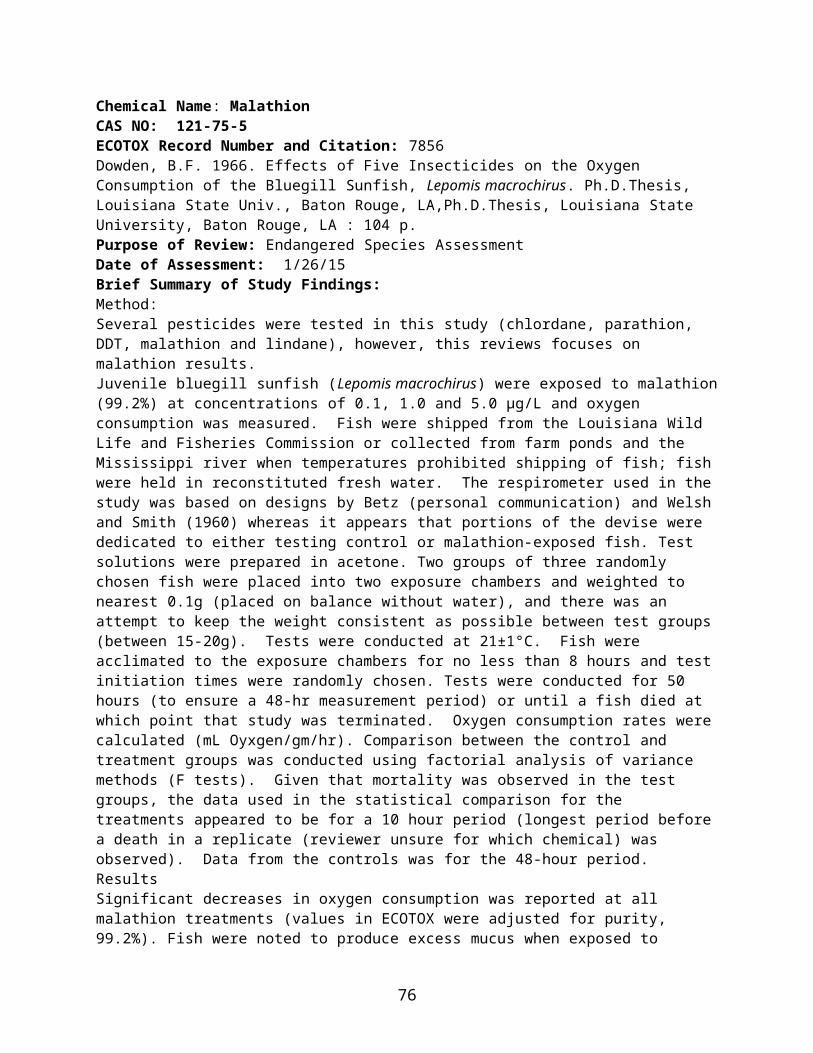
on a reduction in weight.
Table 1. Effects to Soybeans from Exposure to Chlorpyrifos and Malathion.
CHEMICAL RATE % INJURY
% FRESH WEIGHT REDUCTION
Chlorpyrifos
140 g/ha (0.125 lb/acre) 3 7280 g/ha (0.25 lb/acre) 4 8*560 g/ha (0.5 lb/acre) 6 9*
Malathion140 g/ha (0.125 lb/acre) 1 5280 g/ha (0.25 lb/acre) 2 5560 g/ha (0.5 lb/acre) 4 12*
* Statistically significantly different from the control
Exposure to Mixtures:
When the herbicide, thifensulfuron, was applied with chlorpyrifos or malathion to soybeans, kochia and yellow foxtail (at varying concentrations), chlorpyrifos and malathion showed signs of synergism with soybeans and yellow foxtail (based on injury and %weight reduction) when the actual results were compared to expected results (no synergy). Potential synergistic effects were not noted for kochia and these chemical mixtures.
Description of Use in Document (QUAL, QUAN, INV): Results for single chemical (chlorpyrifos and malathion) and single test species = QUAN; results for mixtures = QUAL
Rationale for Use: This review was conducted because the reported chlorpyrifos NOAEC value of 0.125 mg a.i./L for reduction in weight currently represents the most sensitive NOAEC value for terrestrial plants and chlorpyrifos.
Limitations of Study: The purity of the chemicals used in the study were not reported. Raw data were not provided; therefore, the statistics could not be verified.
Primary Reviewer: Melissa Panger, Ph.D.
Secondary Reviewer (required if study results are used quantitatively): Elizabeth Donovan, M.S
84

Open Literature Review Summary
Chemical Name: Malathion, obtained from Cyanamid India Ltd, Bombay
CAS No: Not reported
PC Code: 057701
ECOTOX Record Number and Citation: 025359. Chakraborti, S., N. Sarkar, P. K. Sengupta, and S.K. Banerjee. 1982. Biochemical Studies of Some Membrane Bound Hydrolases in Malathion Treated Germinating Seeds of Vigna sinensis (L): Effect of Plant Growth Hormone Supplementation. Indian Journal of Experimental Biology. 20: p 850-855.
Purpose of Review (DP Barcode required for Quantitative studies): Malathion ESA pilot (Registration Review)
Date of Review: February 5, 2015
Summary of Study Findings: Cowpea (Vigna sinensis) seeds were surface sterilized in 0.1% mercuric chloride followed by soaking in deionized water for six hours. Seed coats were removed and dehulled seeds were added to petri dishes containing malathion (purity not specified) at concentrations of 0, 50, 100, 200, and 400 ppm. Additional petri dishes spiked with one of three plant hormones [indole-3-acetic acid (IAA), gibberellic acid (GA3), or Kinetin] were included in the study design at each malathion exposure concentration, plus plant hormone controls. A total of 20 different petri dish treatments were included in the study design, although it appears that these different treatments were not replicated; however, the experiment was repeated six times and the reported data are means ± SD of these trials. Seeds in the experimental plates were allowed to germinate for 72 hours at 25 oC. After 72 hours, the roots from each plate were removed and ground using a mortar and pestle. The homogenate was processed and the plasma membrane fraction of the roots was isolated. Seedling growth and respiration in the different treatments were graphed, although the underlying growth and respiration data for the plots were not reported. From the graph (Figure 2 on page 852), growth appears to have been inhibited by 12, 25, and 50% at the 100, 200, and 400 ppm treatments, respectively. In the same graph, respiration appears to have been inhibited by 22, 48, and 78% at the 100, 200, and 400 ppm treatments, respectively. Data tables for treatment responses were only provided for seven plasma membrane analyses (acid phosphatase, acid pyrophosphatase, alkaline pyrophosphatase, IDPase, ATPase, mg phospholipid, and mg sterol). Response data for the 100, 200, and 400 ppm treatments for each of the seven plasma membrane parameters evaluated were found to be statistically significant (statistical methods not described; see limitations section). The study authors discuss the association of alkaline inorganic pyrophosphatase with anabolic processes and acid inorganic pyrophosphatase with catabolic processes, leading the study authors to conclude that the significant, dose-dependent increase in acid inorganic pyrophosphatase in the 100, 200, and 400 ppm treatments compared to the control is a marker of reduced seedling growth.Figure 2. Effect of malathion and/or plant hormones on seedling growth and respiration.
85
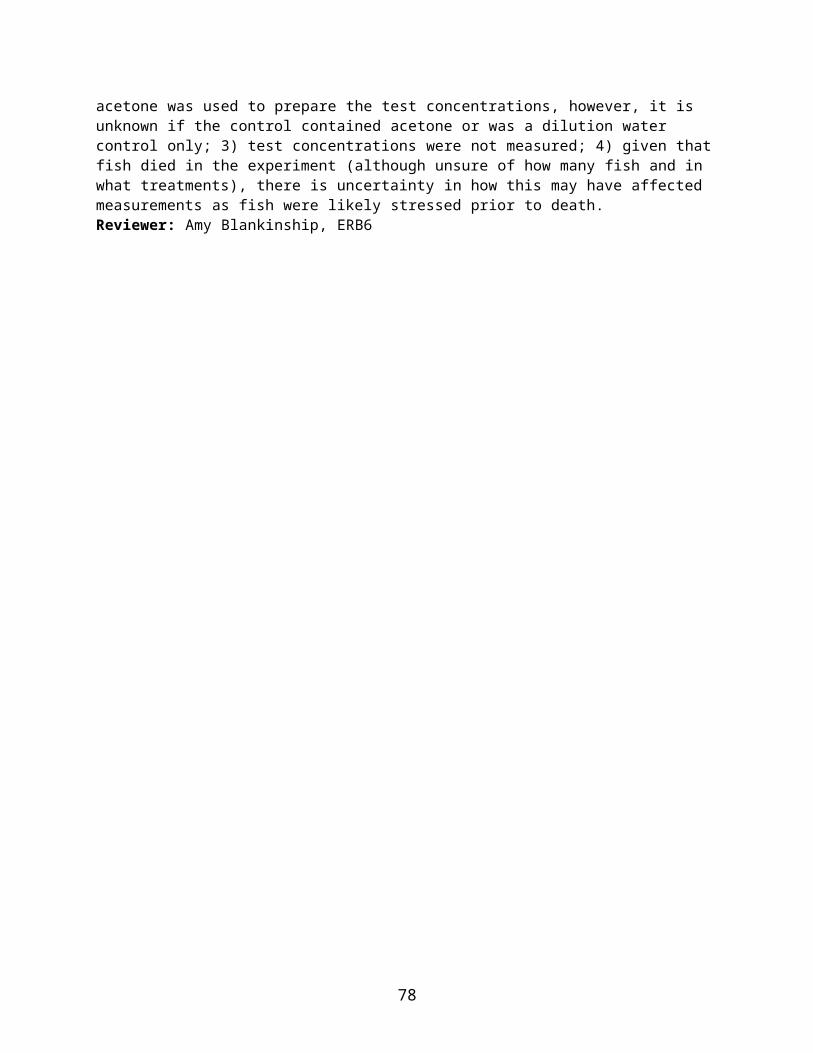
Description of Use in Document: Qualitative, not to be used as a threshold
Rationale for Use:Given that the units, exposure route, were in ppm, the units could not be converted to environmentally-relevant units of lb a.i./A. Additionally, the seed coats were removed prior to exposure, and there is uncertainty in the environmental relevance of this exposure.
Limitations of Study:The malathion product used in the study was poorly described, listed only as “Malathion, obtained from Cyanamid India Ltd, Bombay”. The percent active ingredient of the formulation was not provided; neither was a registration number provided that could be used to definitively identify the test substance. Also note that the study authors used “ppm” as the units to describe the concentration of malathion in the different treatments. It appears that the different treatments were not replicated; instead, the experiment was repeated six times and the reported data are means ± SD of the different trials.Growth and respiration data were not reported, although percent reductions (compared to the control) were plotted.Only a summary table of treatment level results was included and the statistical analyses employed by the study authors were not described (e.g., t-test, ANOVA, chi square). Analytical confirmation of the concentration of malathion in the treatments was not described.
Primary Reviewer: Nathan MillerSecondary Reviewer (required if study results are used quantitatively):
Open Literature Review Summary
86

Chemical Name: Malathion 5% dust
CAS No: Not reported
PC Code: 057701
ECOTOX Record Number and Citation: 089329. Ramzan, M., and B.S. Chahal. 1989. Effect of Grain Protectants on Viability of Wheat Seeds. Seed Research. 17 (1): p 47-54.
Purpose of Review (DP Barcode required for Quantitative studies): Malathion ESA pilot (Registration Review)
Date of Review: February 5, 2015
Summary of Study Findings: The effect of applications of malathion to wheat seed subjected to storage at 10 and 15% moisture content for one year under air-tight and non air-tight conditions was evaluated. Malathion (5% dust) treatment was applied after spraying water over the wheat seeds to obtain the desired moisture content (10% or 15%). Malathion dust was applied at three different concentrations: 50, 125, and 250 ppm. After a week of moisture stabilization, the wheat seeds were transferred to 48 (20 cm X 15 cm) polythene bags of 400 gauge thickness, filled to 500g each. The study report states: “There were 4 replication.” It is unclear whether this means that each malathion treatment was replicated four times. 24 bags were sealed by machine to be airtight and 24 bags were loosely tied with rubber bands to provide non airtight conditions. Seeds of an untreated control were stored under both conditions.During the 1979-80 experiment, the germination of seeds treated with malathion at all concentrations except 50 ppm was significantly lower than the control. During the 1980-81 experiment, the germination of seeds treated with malathion at all concentrations except 50 ppm was significantly lower than the control. Based on the statistical significance reported by the study authors, the LOAEC for malathion effects to wheat seed germination is 125 ppm. Statistical methods were not described beyond a footnote to the results table which states: “The data were analyzed after angular transformation of percentage values; the back transformation values of transformed data are given.”Table 1. Effect of malathion used as a grain protectant on the viability of wheat seedTreatment Year Dosage
(ppm) 6 months* after storage 12 months* after storage
10% MC 15% MC Mean 10% MC 15% MC MeanMalathion 1979-
198050 95.4 89.6 92.8 92.7 83.0 88.3125 94.3 89.7 92.4 92.4 82.5 87.9250 93.7 88.5 91.3 92.2 81.1 87.1
1980-1981
50 97.0 95.1 96.1 92.3 90.4 91.4125 96.7 94.0 95.5 92.2 90.7 91.4250 96.9 93.2 95.2 91.9 91.0 91.0
Control 1979-1980
0 95.4 90.6 93.2 93.0 89.5 91.3
1980-1981
0 98.4 94.3 97.0 92.4 90.2 91.3
87

*The data were analyzed after angular transformation of percentage values; the back transformation values of transformed data are givenMC- Moisture content
Description of Use in Document: Qualitative
Rationale for Use:This review was conducted because no guideline terrestrial phytotoxicity studies have been submitted and no acceptable terrestrial plant toxicity studies are available for malathion. As described in the 2007 California Red Legged Frog assessment, malathion terrestrial plant toxicity studies in the open literature are of limited utility because the selected exposure route(s) are of questionable environmental relevance. This study is no exception; the dusting of seeds followed by storage under discreet moisture conditions for six to twelve months prior to germination is not environmentally relevant.
Limitations of Study:The malathion product used in the study was poorly described, listed only as “Malathion 5% dust”. It is unclear whether the percent active ingredient of the formulation was in fact 5%, or some other value. Also note that the study authors used “ppm” as the units to describe the concentration of malathion in the different treatments. According to the OPP open literature review guidance3, the report should state which methods of statistical comparison (e.g., t-test, ANOVA, chi square) were used and the presumed nature of the data (parametric versus nonparametric); however, only a summary table of treatment level results was included and the statistical analyses employed by the study authors were not described.
Primary Reviewer: Nathan MillerSecondary Reviewer (required if study results are used quantitatively):
3 http://www.epa.gov/pesticides/science/efed/policy_guidance/team_authors/endangered_species_reregistration_workgroup/esa_evaluation_open_literature.htm#att_6
88
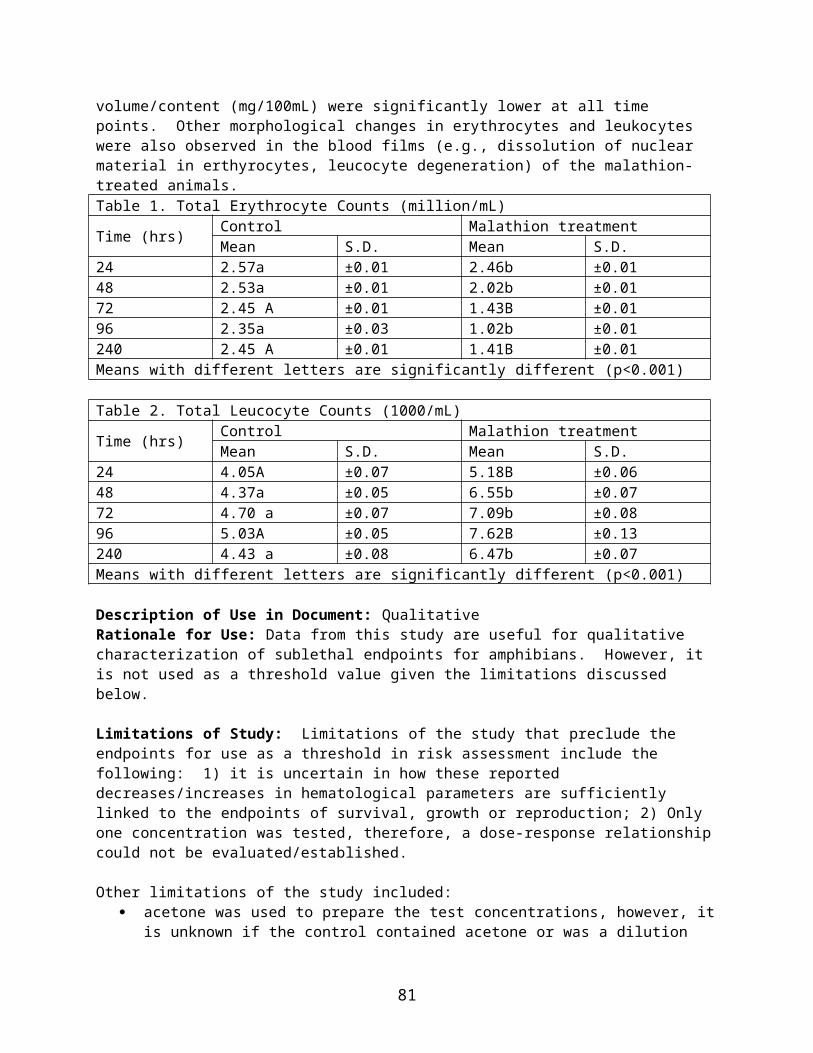
Open Literature Review Summary
Chemical Name: Malathion
CAS No: Not reported
PC Code: 057701
ECOTOX Record Number and Citation: 090706. Lloyd, R.W., and D.R. Krieg. 1987. Cotton Development and Yield as Affected by Insecticides. Journal of Economic Entomology. 80: p 854-858.
Purpose of Review (DP Barcode required for Quantitative studies): Malathion ESA pilot (Registration Review)
Date of Review: February 6, 2015
Summary of Study Findings: The effect of malathion applied to cotton plants (cultivar TAMCOT SP37) at a rate of 0.65 kg ai/ha (0.58 lb ai/A) in greenhouse plots (four applications, reapplication interval of 10 days) and field plots (five applications, reapplication interval of 10 days) was evaluated. Treatment was initiated when the first floral bud was observed. Physiological responses (e.g. gas exchange rates) of the cotton plants were measured 24 and 48 hours after application. Complete growth analyses were conducted 30 and 60 days after the initial application (DAIA). Growth measurements included height, number of nodes per plant, total number of leaves, leaf area, and floral bud and fruit numbers from all plants per square meter of ground area per plot. Yield was evaluated as a function of the number of bolls per 10 square meters ground area and boll weights (grams per 100 bolls). All data were subjected to analysis of variance with Duncan’s multiple range test and least significant difference used to separate means at the P = 0.05 level. Malathion treatment resulted in no significant effect on carbon assimilation rate, stomatal conductance, or the efficiency of the gas exchange process as indicated by intercellular CO2 concentration. Malathion treatment was associated with a greater number of floral buds at 60 DAIA compared to the control. Malathion also increased fruit numbers per plant at 30 DAIA; by 60 DAIA, this increase was significant compared to the control. No significant interactions were observed for any of the yield components. Based on the significant increase in the number of bolls per cotton plant observed in the malathion treated plots at 60 DAIA in comparison to the control, the lowest observed effect level (LOEL )is associated with five applications of 0.58 lb ai/A and a 10-day retreatment interval.
Description of Use in Document: Qualitative
Rationale for Use:The effects described in this paper are increases in number of bolls/fruit and would not be characterized as adverse as it pertains to the risk assessment.
Limitations of Study:The malathion test substance used in the study was poorly described, listed only as “malathion.” No EPA registration number was provided to facilitate identification of the tested product. The percent active ingredient of the malathion test substance used was not provided.
Primary Reviewer: Nathan Miller
89
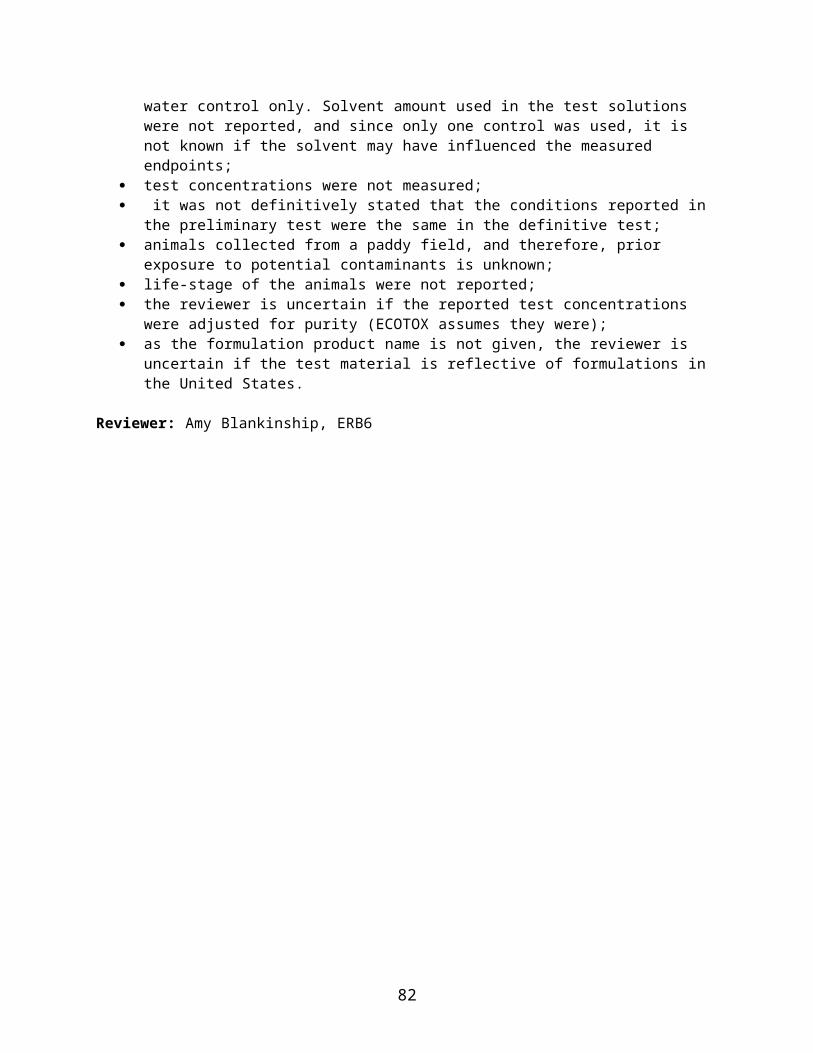
Secondary Reviewer (required if study results are used quantitatively):
Open Literature Review Summary
Primary Reviewer: Elizabeth DonovanSecondary Reviewer (required if study results are used quantitatively):
Chemical Name: Malathion (Technical grade and Pure; purity not reported)
CAS No: Not reported
PC Code: 057701
ECOTOX Record Number and Citation: 162475. Jennings, D.E., A.M. Congelosi and J.R. Rohr. 2012. Insecticides reduce survival and the expression of traits associated with carnivory of carnivorous plants. Ecotoxicology. 21: 569-575.
Purpose of Review (DP Barcode required for Quantitative studies): Malathion ESA pilot (Registration Review)
Date of Review: November 17, 2015
Summary of Study Findings:This study, using a combination of lab- and field-based experiments, tested the effects of technical grade and formulated malathion (Spectracide, 50% a.i.) on the survival of pink sundews (Drosera capillaris) and Venus flytraps (Dionaea muscipula). It also evaluated the effects of technical grade and formulated malathion on the expression of carnivorous traits (e.g., the number of mucilage-producing leaves in pink sundews or the number of traps in Venus flytraps). Only results on survival are discussed in this review.
Experiment I: Seventy-two pink sundews (mean diameter 2.28 ± 0.59 cm) were planted in individual 9 cm diameter plastic cups filled to 5 cm with sand, as often they are locally found in extremely sandy soils. Treatments consisted of a de-ionized (DI) water control and a commercial grade of malathion with 18 replicates. At the start of the experiment, 5 ml of the insecticide was applied directly to the sundews using a spray bottle and following the recommended application instructions on each product. This resulted in a nominal application rate of 5.19 kg/ha for malathion. The rates of insecticide application used for this experiment represented an overspray scenario for mosquito control, but were comparable to the rates used for control of agricultural pests.
Experiment II: Technical malathion was applied to five randomly chosen sundews at concentrations of 51.9 (0.03%), 5.19 (0.003%), 0.519 (0.0003%), 0.0519 (0.00003%) kg of a.i./ha (based on serial dilutions of the highest concentration). The rates of insecticide application used in this experiment represented a range of scenarios. Additionally, there were five replicates of both DI water and acetone (10%, solvent used to get chemicals in solution) controls. Sundews were planted in individual 9 cm diameter plastic cups filled to 5 cm with sand, and at the start of the experiment, 5 ml of the appropriate insecticide was applied directly to the sundews using pipettes. Pipettes were used in this experiment for logistical purposes, and we are confident that similar amounts of insecticides reached both the plants and the
90
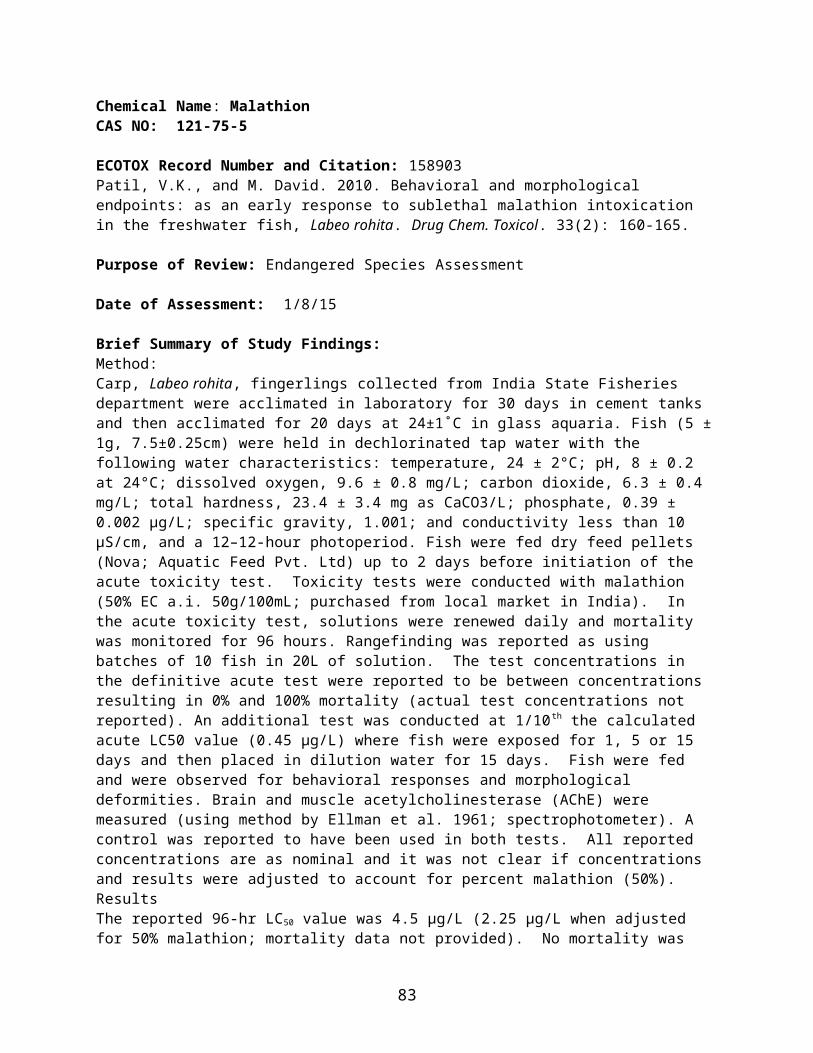
substrate compared to the spray bottles in the other experiments.
Experiment III: To determine the ecological relevance of Experiments i and ii, field experiments were conducted. There were 32 10- X 10-cm plots at the ERA, with each plot containing three sundews (mean diameter 5.07 ± 1.38 cm). To each of four randomly chosen plots was applied one of the following treatments: DI water, acetone (10%), or commercial or technical forms malathion. At the start of the experiment 5 ml of the appropriate insecticide was applied directly to the sundews using spray bottles, and there were two subsequent applications after 10 and 20 days (within the range of recommended application frequency). The field plots were slightly larger in area than the plastic cups used in the lab, and the field rates of application for insecticide a.i./plot were 3.3 kg/ha for malathion. The rates of insecticide application used for this experiment represented an overspray scenario for mosquito control, but were comparable to the rates used for control of agricultural pests.
Experiment IV: Eight 2-year old Venus flytraps (mean fresh-weight 1.03 ± 0.41 g) were planted in individual 9 cm diameter plastic cups filled to 5 cm with a mixture of 2/3 peat moss and 1/3 perlite. Plants of the same age and similar fresh-weight to minimize variation in trap size. To each plant the following treatments were applied using spray bottles: DI water, acetone (10%), or commercial or technical forms of malathion, using the same concentrations as in Experiment i. There were two subsequent applications of each treatment after 10 and 20 days (within the range of recommended application frequency).
The study authors found that pink sundews are more sensitive to malathion exposure than Venus flytraps under field conditions and that the formulated malathion is more toxic than the technical grade under both lab and field conditions. Table 1 presents the results of the study for malathion.
Table 1. Effects of malathion on pink sundew and Venus flytrap survival. Experiment Test Species Test Material Lab or
FieldNOAEC LOAEC
I Pink Sundew Formulated product
Lab -- 4.63 lb a.i./A
II Pink Sundew TGAI Lab 46.3 lb a.i./A >46.3 lb a.i./A
III Pink Sundew
Formulated product
Field -- 2.94 lb a.i./A
TGAI Field 2.94 lb a.i./A > 2.94 lb a.i./A
IV Venus Flytrap
Formulated product
Field 4.63 lb a.i./A > 4.63 lb a.i./A
TGAI Lab 4.63 lb a.i./A > 4.63 lb a.i./A
Description of Use in Document: Quantitative
Rationale for Use: This endpoint is discussed in the effects characterization for the malathion ESA pilot and may be used as part of the weight of evidence discussion in the effects determinations.
91
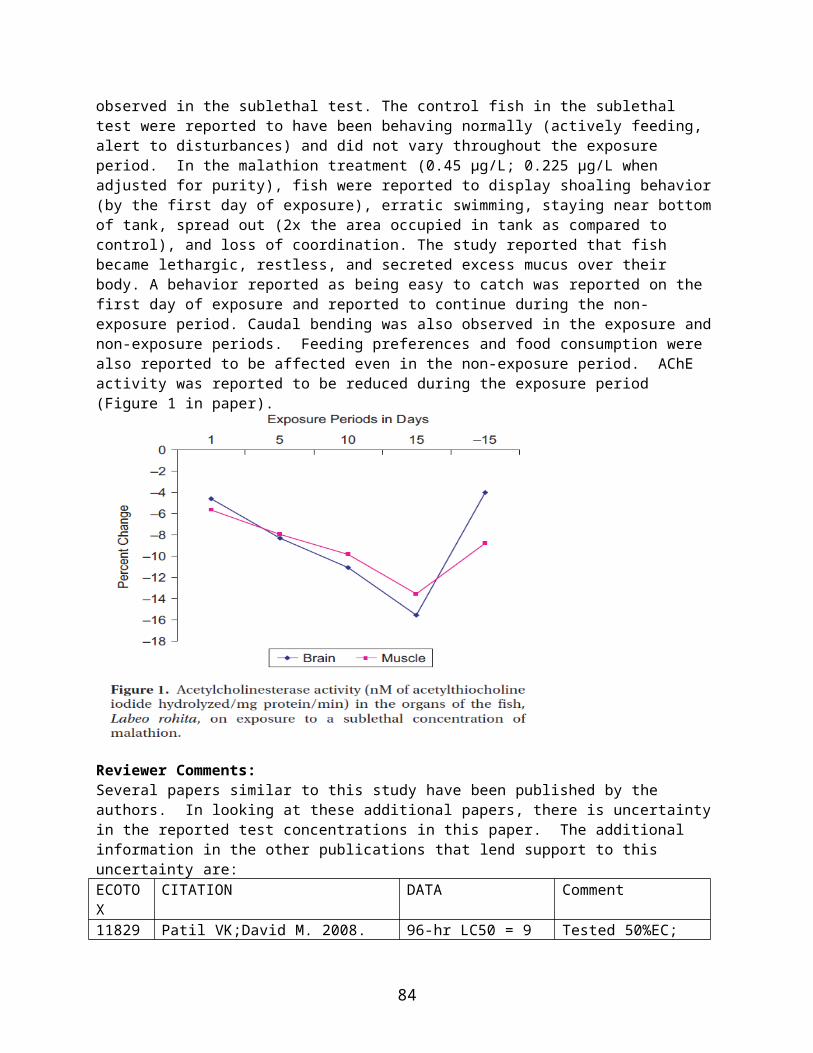
Limitations of Study:Raw data were not provided so statistics could not be repeated.
92

Open Literature Review Summary
Chemical Name: Malathion (Malathion 500 EC, Monsanto Canada Inc. Misissauga, Ont; 50% malathion)
PC Code: 057701
ECOTOX Record Number and Citation: 90644. Johnson VJ;Rosenberg AM;Lee K;Blakley BR. 2002. Increased T-Lymphocyte Dependent Antibody Production in Female SJL/J Mice Following Exposure to Commercial Grade Malathion. Toxicology 170(1-2): 119-129.
Purpose of Review (DP Barcode required for Quantitative studies): Endangered Species Assessment
Date of Review: March 31, 2015
Summary of Study Findings:Method
Female mice (SJL/J, disease free, Jackson Laboratory, Bar Harbor, MA, 5-6 wks old, 16-20 g) were dosed via oral gavage with malathion formulation (corn oil used as vehicle) at 0.018, 7.2 and 180 mg/kg on alternate days for 28 days. A control group was added. Mice were housed 5 per cage (polycarbonate shoebox-style cages lined with woodchip bedding), and were fed roden chow (Prolab, PMI Feeds Inc.) and water ad libitum. Temperature was maintained at 21°C with a 12:12 L:D light cylce. Body weight and water and food consumption were monitored during study. On day 25, mice were immunized with 0.2mL of 10% sheep red blood cell (SRBC) suspension via intraperitoneal injection. One mouse per treatment was immunized with sterile phosphate buffered saline (PBS) as a negative assay control animal. On day 30 (2 days after last malathion administration), mice were sacrificied, and spleen, liver, kidneys and brains removed and weighed. Brain acetylcholinesterase activity was measured. Spleens were used to determine effects of malathion on anti-SRBC humoral immune response, mitogen-induced splenic lymphocyte proliferation, and splenic cell phagocytosis. Treatment effects were analyzed using ANOVA and Dunnett’s t-test. ResultsAccording to the study authors, there were no clinical evidence of organophosphate poisoning in treatment groups, and there were no effects on brain acetylcholinesterase. There were also no effects on body weight or food and water consumption. At the high dose, 180 mg/kg, relative liver and kidney weights were significantly increased 10 and 6% compared to control; study authors noted that increase in kidney weight was not likely physiologically relevant. Splenic cellularity and viability of splenocytes was not affected. Additionally, it was reported that there was no significant differences for lymphocyte blastogenesis, and malathion exposure did not alter conA- or PHA-P-induced T-lymphocyte proliferation or LPS-induced B-lymphocyte proliferation (when expressed as CPM or SI). Malathion exposure also did not affect the phagocytic function of splenic macrophages. However, the study authors reported a significant increase in the numbers of plaques per 106 cells compared to the control (50, 48, and 33% increase in 0.018, 7.2, and 180 mg/kg groups, respectively). Additionally, the numbers of plaques per spleen were also increased 47, 48 and 43% in the 0.018, 7.2 and 180 mg/kg groups, respectively (Figure 2 in paper).
93
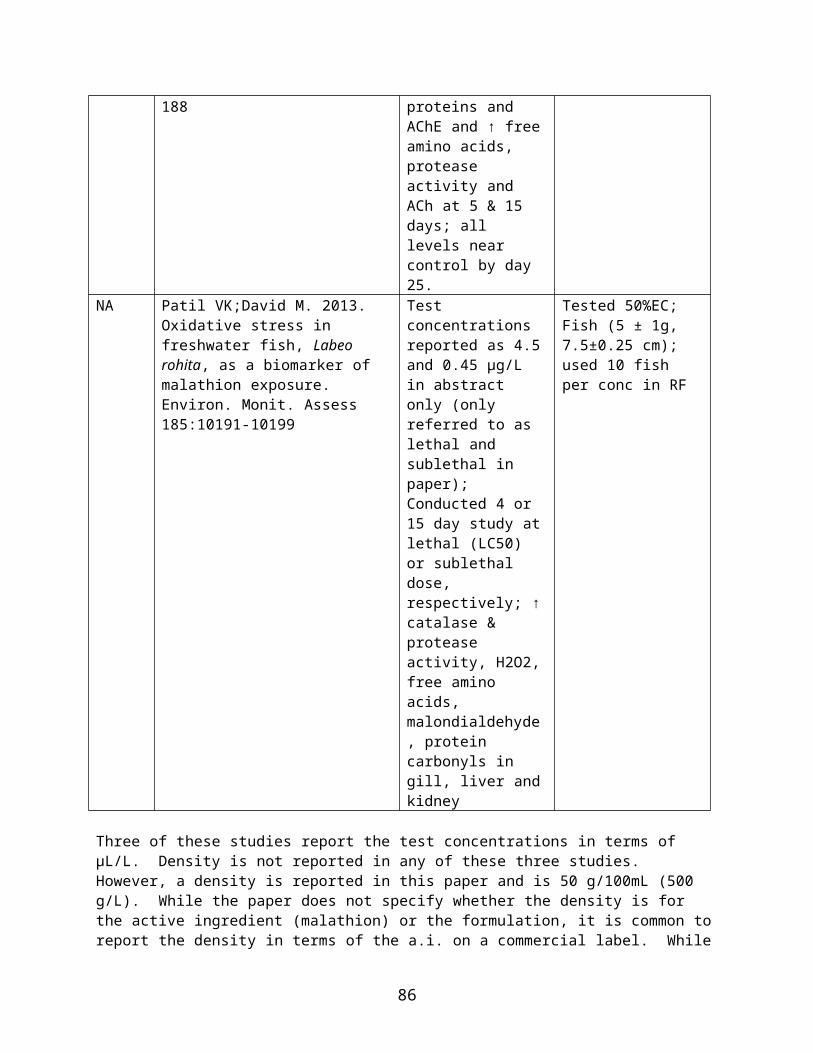
Reviewer note: it is noted that the % increase in number of plaques (per cells and spleen relative to control) are relatively consistent (monotonic; SEMs overlap) across a 10,000 fold range in test dose (i.e., same relative level of response at 0.018, 7.2 and 180 mg/kg). Also, the reviewer assumes that the reported doses have been adjusted for % malathion (50%).
Description of Use in Document: Qualitative
Rationale for Use:There is uncertainty in whether an approximate 33-50% increase in plaque formation (increase appears to be consistent over a 10,000 fold range in test dose), respectively, is sufficient to result in an adverse effect on reproduction or survival, as there were no effects on other immune responses, AChE, weight, water or food consumption, or signs of toxicity.
Limitations of Study:
1. The study was conducted with a formulation purchased in Canada. There is uncertainty in if the formulation is representative of a formulation in the United States.
Primary Reviewer: Amy BlankinshipSecondary Reviewer (required if study results are used quantitatively):
94

Open Literature Review Summary
Chemical Name: 1-[(4-chlorophenyl)methylsulfanyl]-N,N-diethyl-formamide CAS No: 28249-77-6 PC Code: (Thiobencarb 108401)
ECOTOX Record Number and Citation: 015472Fujimura, R., B. Finlayson, and G. Chapman. 1991. Evaluation of acute and chronic toxicity tests with larval striped bass. Aquatic Toxicology and Risk Assessment: Fourteenth Volume, ASTM STP 1124, M. A. Mayes and M. G. Barron, Eds., American Society for Testing and Materials, Philadelphia: 193-211.
Purpose of Review (DP Barcode or Litigation): Litigation
Date of Review: August 21, 2009
Summary of Study Findings: Acute (96-hr) and chronic (embryo-to-fry and. larvae-to-fry) toxicity of copper sulfate, technical malathion, Ordram 8EC (molinate), Bolero 8EC (thiobencarb), technical endosulfan, and technical carbofuran to Striped bass (Morone saxatilis) and Chinook salmon (Oncorhynchus tshawytscha) were examined. This report examines toxicity tests of thiobencarb. The lowest 96-hr median lethal concentration (LC50) value that can be used quantitatively for Bolero 8EC was 440 µg/L4 (95% confidence interval 400-500; moving average method with angle (arcsin) transformation or mortality and log 10 transformation of concentration, measured concentration). The lowest early life-stage chronic toxicity No-Observable Adverse Effect Concentration (NOAEC) for the effect of survival was a mean value of 21 µg/L (Lowest Observable Adverse Effect Concentration (LOAEC) = 36 µg/L, measured). This test was performed by ATL in 1989 on 1-hour prehatch striped bass and can be used quantitatively with the note that it will likely underestimates risk because hatchability was not examined in the test and effects on dry weight were observed at all treatment levels so a true NOAEC for the test could not be determined. The Chinook salmon NOAEC for growth was 28 µg thiobencarb/L (testing material Bolero 8EC). This endpoint may underestimate risk because hatching success was not measured. The chronic endpoints may not be used to fulfill test guidelines because the did not measure hatching success in the tests.
Acute Testing
Summary: For acute testing, the mortality of 6 to 45-day post hatch Striped bass (Morone saxatilis) was evaluated when exposed to varying concentrations of Bolero 8EC (85.2% thiobencarb) for 96 hours under flow-through conditions. Toxicity tests were performed at two different laboratories (Aquatic Toxicology Laboratory in Elk Grove, CA and at the Environmental Protection Agency Laboratory in Newport, OR). The American Society for Testing and Materials (ASTM) E 729-89 “Standard Guide for Conducting Acute Toxicity Tests on Test Materials with Fishes, Macroinvertebrates, and Amphibians” were followed. The lowest 96-hr LC50 value that can be used quantitatively for Bolero 8EC was 440 µg thiobencarb/L (95% confidence interval 400-500; moving average method with angle (arcsin) transformation or mortality and log 10 transformation of concentration, measured concentration). This value is lower than the lowest 96-hr LC50 currently available from registrant submitted studies. The study report indicated that the sensitivity of Striped bass to the chemicals tested did not vary by age over the age range of 6-45 days post hatch. The reported tests are summarized in Table 1.
4 All reported concentrations are on an active ingredient basis.
95

Methods for Acute Test:For acute testing, the mortality of 6 to 45-day post hatch Striped bass (Morone saxatilis) was evaluated when exposed to varying concentrations of Bolero 8EC (85.2% thiobencarb) for 96 hours under flow through conditions. There were five concentrations for the test substance and two replicates for each test concentration and negative control. Solvents were not needed to prepare solutions with the formulation and there was no solvent control. Observations on mortality were made every 24 hours and the dead test subjects were counted and removed.
The experimental test chambers were 3.8-L glass jars with the outsides coated with black, opaque fiberglass, or painted and suspended in 25-L chambers held at constant room temperature. The test compartments held 2.5 L of solution. The water sources included groundwater and reconstituted deionized tap water. Each compartment contained 20 to 25 striped bass, 6 to 45-day post hatch. The photoperiod was not described. Different diluters were used in different laboratories. The diluters supplied one or two liters per concentration per cycle and the cycle periods were 10 or 90 minutes. The replacement of test solution in jars was 6 or 30 volume changes per day depending on the laboratory. The experiments evaluated in this review used a freshwater environment (salinity 2-3%). Larvae were fed brine shrimp nauplii 2-3 times daily at a density of 2000/L. Dissolved oxygen and temperature were recorded daily. Water samples to determine thiobencarb concentrations in water were collected at 24 and 72 hour intervals in each test. The detection limit was 1 µg/L. The Striped bass used for the acute testing originated from the Department of Fish and Game Central Valleys Hatchery, Elk Grove, California as 24 to 48-hour prehatch embryos.
Statistical analyses were performed using a moving average analysis for the LC50 values with arcsin transformation of mortality and log 10 transformation of concentration. Fieller’s Theorem was used to calculate the 95% confidence intervals.
Acute Testing Results: Several acute toxicity tests examining the toxicity of Bolero 8EC to Striped bass were completed at two different laboratories. Results are summarized in Table. 1. Test No. 34. had unacceptable control mortality (11-20%) and cannot be used in the risk assessment. All other endpoints reported in Table 1 are considered acceptable and can be used quantitatively in risk assessments. The lowest 96-hour LC50 was 440 µg/L with a confidence interval ranging from 400-500 µg/L (moving average method, measured concentration). The study report includes discussion of interlaboratory comparisons. Additionally, the study reported that larvae 6, 14, and 45 day posthatch were equally sensitive to thiobencarb.
Table 1. Acute toxicity tests examining toxicity of Bolero 8EC to Striped Bassa Test Number
Year Test Performe
dAge (Days Posthatch)
Cohort No.
96-hr LC50 Value (µg/L)
95% Confidence
Interval Study Status8 1987 15 3 920 830-1000 Acceptable, Quantitative10 1987 12 5 910 830-1000 Acceptable, Quantitative
96
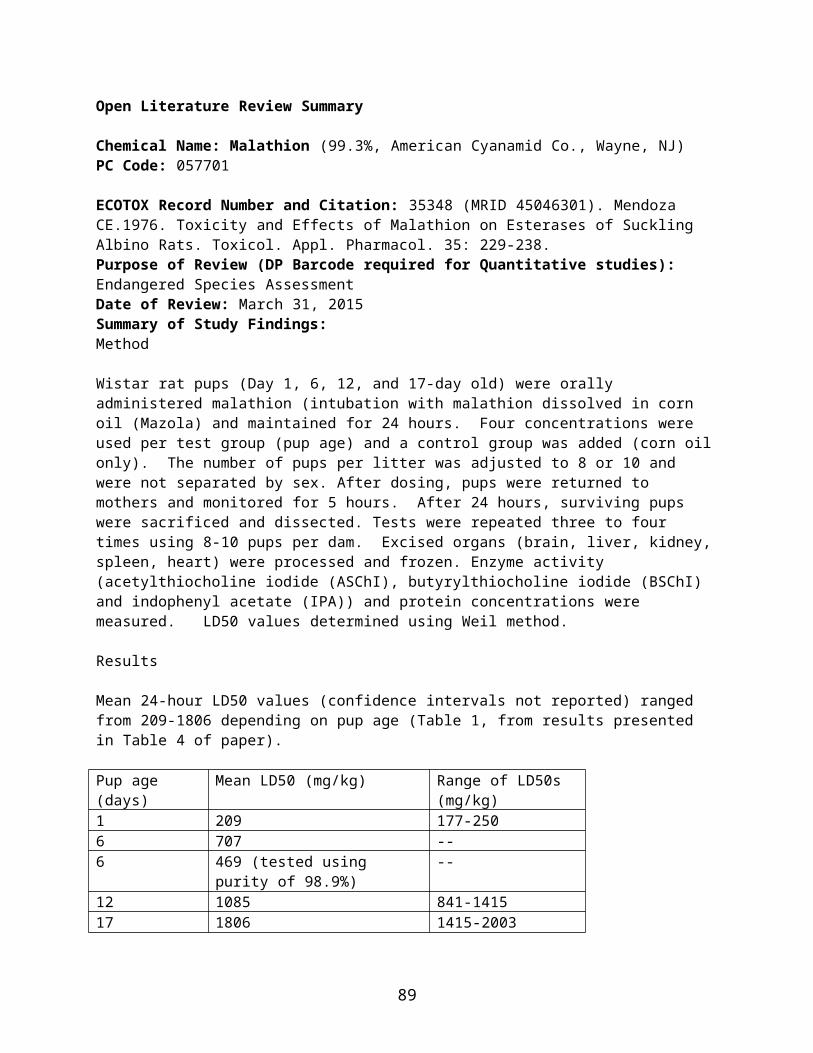
Test Number
Year Test Performe
dAge (Days Posthatch)
Cohort No.
96-hr LC50 Value (µg/L)
95% Confidence
Interval Study Status13 1987 10 6 480 440-530 Acceptable, Quantitative16 1987 7 7 570 500-650 Acceptable, Quantitative16 1987 7 7 720 660-780 Acceptable, Quantitative19 1987 14 7 550 400-740 Acceptable, Quantitative19 1987 14 7 1000 960-1100 Acceptable, Quantitative28 1987 9 11 440 400-500 Acceptable, Quantitative29 1987 9 11 840 740-950 Acceptable, Quantitative35 1987 43 7 880 830-940 Acceptable, Quantitative15 1988 6 20 1000 870-1300 Acceptable, Quantitative25 1988 13 31 830 730-940 Acceptable, Quantitative63 1988 39 38 760 650-900 Acceptable, Quantitative22 1989 13 43 640 540-760 Acceptable, Quantitative45 1989 45 52 770 590-940 Acceptable, Quantitative46 1989 45 52 690 520-820 Acceptable, Quantitative Mean 750 Median 765 SD 177 34 1987 41 11 430 390-470 Invalidb
a This table was reproduced from Table 3 of the study report.b Control mortality was between 11-20%,
Chronic Testing
Methods for Striped Bass: Embryo to fry and larvae to fry testing was performed with Striped bass, Morone saxatilis exposed to Bolero 8EC (85.2% thiobencarb) using ASTM Standard Guide for Conducting Early Life-Stage Toxicity Tests with Fishes (E 1241-88). Tests were terminated at 45-52 day posthatch when most fish should have metamorphosed into juveniles. The same equipment used in acute tests were used for chronic tests. There were five test concentrations and two replicates per treatment and a negative control. Daily observations included dead fish as well as abnormal or lethargic fish. Daily removal of dead fish took place as well. Water samples were collected twice a week to determine thiobencarb concentrations in water. Upon test completion, study authors recorded wet and dry weight. Hatching success was not measured.
The density of embryos was 100 per compartment which was thinned to 30 per compartment (60 per treatment) when the prolarvae were 9-days posthatch. Larvae and fish were fed. Compartments were cleaned daily to prevent buildup of waist. Test subjects were also obtained from the Department of Fish and Game Central Valleys Hatchery.
Chronic test feeding included Artemia sp. nauplii at a density of 10/ml twice per day after two days post hatch. The feeding increased after 21-day post hatch to commercial mesh foods. Excessive amounts were offered to prevent cannibalism and food remnants were cleaned out each day. Flow through conditions replaced water ten times an hour. After hatching, the rate was reduced to one volume every 45 minutes to 1 hour (depending on the lab) to avoid damaging the fragile larvae. Chambers were also
97
aerated at this time to keep embryos suspended. After eight days post hatch, the rate was increased to six times per hour until study completion. Larvae were transferred to 25-L glass chambers after 21 days post hatch.
Methods for Chinook Salmon: Embryo to fry tests were conducted on Chinook salmon using the methods described in ASTM E1241-88 and Finlayson and Verrue (Finlayson and Verrue, 1985). The test chamber was a 15-L glass aquarium separated into 1-L test chambers using polypropylene mesh screens. This design does not have true replication. The stocking density was 30 per compartment with two compartments per treatment and control. Yolk-sac fry were thinned randomly to 30 individuals per chamber two weeks post hatch. Fish were fed commercial fish food at 28-58 days post hatch. Fish were starved for two days prior to the study termination. The fish were 60-days post hatch at the test termination and loading never exceeded 0.8 g/L/d based on flow rates in chambers.
Statistical Analysis for Chronic Tests:Survival data were analyzed using a binomial chi-square test. Length and weight data were analyzed using the Kruskal-Wallis test and the Dunn multiple-comparison test was used to compare treatment means. Statistical significance for NOAEC determination for both striped bass and Chinook salmon was p < 0.05.
Results for Chronic Testing of Striped BassChronic test results for striped bass exposed to thiobencarb are reported in Table 5 of the test report. The lowest early life-stage chronic toxicity NOAEC for survival was a mean value of 21 µg/L (LOAEC = 36 µg/L, measured). This test was performed by ATL in 1989 on 1-hour prehatch striped bass and can be used quantitatively with the note that it likely underestimates risk. In the test performed on 9-day post hatch bass, significant effects on survival were observed in all treatments and a NOAEC could not be determined (NOAEC/LOAEC = 21/ 36 µg/L). For the test beginning with 8-day post hatch bass the NOAEC and LOAEC were 58 and 91µg/L, respectively. Effects on dry weight were statistically different from controls at all treatment levels and a NOAEC could not be determined. All endpoints could underestimate risk because hatchability was not evaluated and a NOAEC could not be determined. However, the results can be used quantitatively as the available results are lower than values in registrant submitted studies. This test may not be used to fulfill test guidelines.
Results for Chronic Testing of Chinook SalmonThe Chronic NOAEC for Chinook salmon was 28 µg/L for growth (wet weight and standard length) and 140 µg/L for survival. The Chinook salmon NOAEC is not lower than the registrant submitted endpoint. These endpoints may be used quantitatively; however, it should be noted that they may underestimate risk because hatching success was not measured in the study. Therefore, these results may not be used to fulfill guideline requirements. Description of Use in Document:
Acceptable, quantitative: Striped Bass 96-hr LC50 = 440 µg thiobencarb/L (testing material was Bolero 8EC)
Acceptable, quantitative: Striped Bass NOAEC for survival = 21 µg thiobencarb/L (testing material was Bolero 8EC), endpoint underestimates risk as effects on growth were seen at all treatment levels
98

Acceptable, quantitative: Chinook salmon NOAEC for growth = 28 µg thiobencarb/L (testing material Bolero 8EC), endpoint may underestimate risk because hatching success was not measured
Invalid: Striped Bass 96-hr LC50 = 430 µg thiobencarb/L (testing material was Bolero 8EC)
Rationale for Use:This acute, 96-hour freshwater fish toxicity study (Test No. 9) has a lower LC50 than the registrant submitted study. The lower LC50 value was 440 ug/l and may reveal increased risk in the analysis of the ecological risk assessment. The chronic striped bass study is not a complete early-life stage study, but is a scientifically sound methodology. The chronic endpoints may be useful quantitatively in a risk assessment with the note that risk may be underestimated due to the test not examining hatching success and the lack of a NOAEC for growth. The chronic Chinook salmon study is not lower than registrant submitted endpoints, but may be valuable in establishing a species-specific acute to chronic ratio.
Limitations of Study: The following additional limitations were observed in the study design and reporting of data. No raw data were provided. Environmental parameters during the study were not specifically described, such as pH, dissolved
oxygen, and nominal versus measured thiobencarb concentration. The photoperiod was not described. It may be assumed that the photoperiod was consistent with those required by the ASTM method cited.
Primary Reviewer: Benjamin Carr
Secondary Reviewer (required if study results are used quantitatively): Katrina White
Finlayson, B. J., & Verrue, K. 1985. Toxicities of butoxyethanol ester and propylene glycol butyl ether ester formulations of 2,4-Dichlorophenoxy Acetic acid (2,4-D), to juvenile salmonids. Archives of Environmental Contamination and Toxicology, 14, 153-160.
Addendum to OLRS for malathion (PC 057701)
Reason for review: Pilot chemical for Endangered Species Risk Assessment
Chemical purity: 94.25 (American Cyanamid)
Table 1. Acute toxicity tests examining toxicity of Technical Malathion to Striped Bassa Test Number
Year Test Performe
dAge (Days Posthatch)
Cohort No.
96-hr LC50 Value (µg/L)
95% Confidence
Interval Study Status58 1988 45 38 25 19-34 Quantitative for SSD60 1988 39 38 12 11-14 Quantitative for SSD32 1989 13 47 64 55-77 Quantitative for SSD52 1989 45 52 100 87-150 Quantitative for SSD56 1989 45 53 66 58-74 Quantitative for SSD
99

Test Number
Year Test Performe
dAge (Days Posthatch)
Cohort No.
96-hr LC50 Value (µg/L)
95% Confidence
Interval Study Status21 1988 11 20 16 13-19 Invalidb
a This table was reproduced from Table 3 of the study report.b Control mortality was between 11-20%,
Classification: Quantitative for use in SSD, except for test number 21
Primary Reviewer: Amy Blankinship, ERB6
100
Open Literature Review Summary
Chemical Name: Malathion
CAS No: Not reported
PC Code: 057701
ECOTOX Record Number and Citation: 89006. Effects of endosulfan and malathion on the ovarian steroidogenesis and brain acetylcholinesterase activity of the catfish, Clarias batrachus (Linnaeus). 1993. Veterinarski Arhiv. 63 (2) 75-83.
Purpose of Review (DP Barcode required for Quantitative studies): Malathion ESA pilot (Registration Review). This study was reviewed for inclusion of the acute LC50 value in the SSD.
Date of Review: November 16, 2015
Summary of Study Findings:
Adult female fish (80-90g body weight and 170-205mm length) were collected from the Bhubaneswar fish market. They were acclimated in the laboratory for two weeks and fed minced goat liver every other day. Technical malathion (purity not reported, Pest Chem. India) was used and stock solutions were prepared in acetone. The 96-hr LC50 for malathion was reported to be 448 ppm.
Description of Use in Document: Qualitative
Rationale for Use:
Given that 448 mg/L is above the water solubility of malathion, and there is Insufficient information available in study regarding measured concentrations, the results were not used in the SSD. The focus on the study was using a sublethal concentration of malathion to examine gonadal and brain effects. The acute LC50 value was calculated in effort to set the sublethal concentrations.
Limitations of Study:
1. Solvent concentrations were not reported 2. Test concentrations were not reported to be measured in this study3. Unknown if control used and if there was any control mortality.4. Fish obtained from local fish market, so previous exposure to potential contaminants unknown.
This is also true for food source (minced goat liver).
Primary Reviewer: Amy Blankinship
Secondary Reviewer (required if study results are used quantitatively):
101
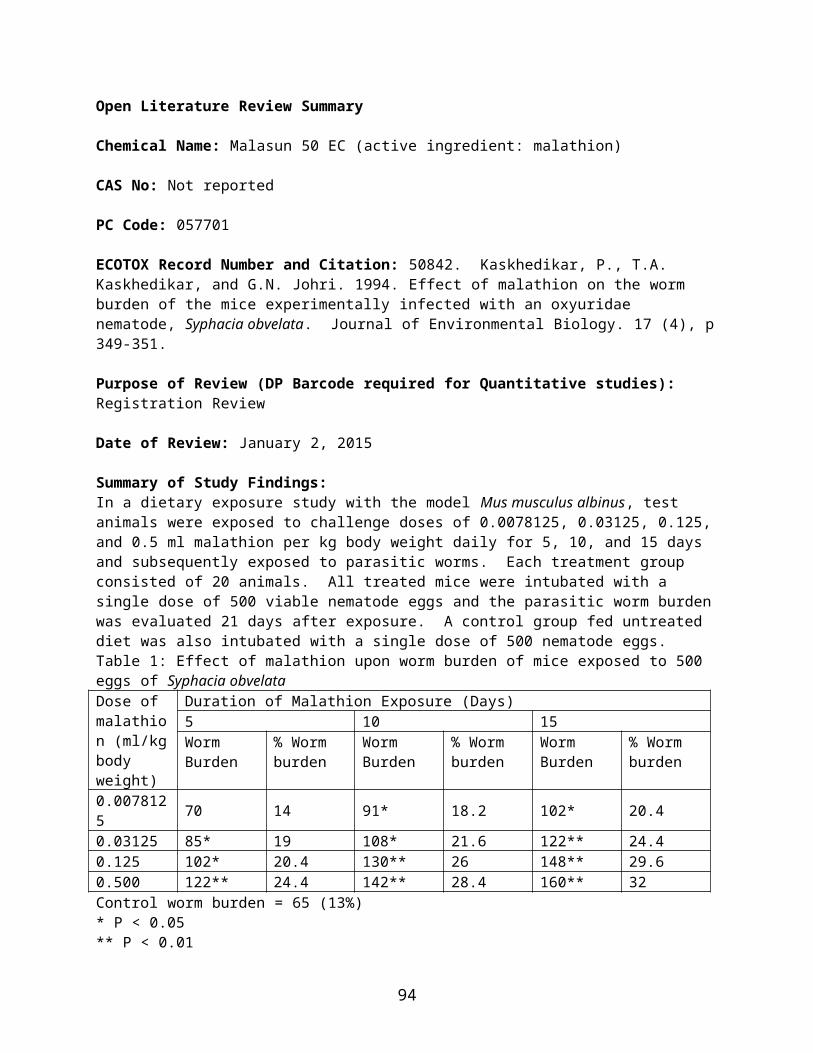
Open Literature Review Summary
Chemical Name: MalathionCAS No: Not reportedPC Code: 057701ECOTOX Record Number and Citation: 17860. Keller, A.E. and D. S. Ruessler. 1997. The toxicity of malathion to unionid mussels: relationship to expected environmental concentrations. Environ. Toxicol. Chem. 16(5): 1028-1033.Purpose of Review (DP Barcode required for Quantitative studies): Malathion ESA pilot (Registration Review)Date of Review: October 28, 2015Summary of Study Findings: MethodsThe acute toxicity of malathion to glochidia, juvenile, and adult freshwater mussels was determined at pH 7.5 in soft water and at pH 7.9 in moderately hard reconstituted fresh water at 25°C and 32°C. Nine species were tested in one or more life stage. Species tested included: Villosa lienosa, V. villosa, Utterbackia imbecillis, Megalonaias nervosa, Lampsilis teres, L. siloquoidea, L. straminea claibornensis, L. subangulata, and Elliptio icterina. Glochidia tests were conducted for 4, 24, or 48 h, while juvenile and adult exposures lasted 96 h. The purity of malathion was 96% and was dissolved in analytical grade acetone. Solvent controls were added to test design in addition to a dilution water control. Dilution water was prepared by adding appropriate salts to deionized water (following EPA methods) or by diluting well water. The quality of the dilution water was measured several times during its use. Water was filtered (0.2 um) and aerated prior to use. Tests were conducted under a 12:12 L:D photoperiod. Test solutions were measured and showed little dissipation 24 and 96 hours after preparation at 25°C. LC50 values were calculated using probit analysis and were based on initial malathion concentrations.Mature glochidia (0.2-0.4 mm diameter) were collected from two or three adult female mussels and pooled and placed into well polystyrene dishes. Two sets of three or four replicates (each containing 50 to 100 glochidia) were used. Five test concentrations were tested (same for adult mussel testing). Mortality was observed at either 24 or 48 hours for all species except, for Lampsilis teres which were only observed for 4 hours. Control mortality of 20% was used as a maximum allowable threshold (10% allowable for other studies). Juvenile organisms used in testing were collected from infecting host fish in laboratory. Juveniles were randomly distributed to glass petri dishes, with 2-4 replicates per concentration and 10-20 juveniles, dependent on availability, and observed for 96 hours under static conditions. LC50 values calculated using probit analysis. For the adult mussel tests, two to four test concentrations were used with 5-10 mussels per concentration, and were observed for 96 hours.
ResultsFor the glochidia tests, control mortality often exceeded 20% in tests conducted at 32°C. LC50 results for glochidia tested under different water pHs and temperatures are presented in Table 1 (from Table 2 in study report).Table 1. LC50 values for glochidia (mg/L) (reported test termination values)Species Water pH Time LC50 (95% CIs)25°CU. imbecillis 7.5 48 324 (343-310)V. lienosa 7.9 24 54 (58-50)L. teres 7.5 4 28 (32-25)
102

L. siliquoidea 7.5 48 59 (69-50)7.9 48 7 (7.4-6.2)
M. nervosa 7.5 24 22 (24-19)32°CU. imbecillis 7.5 24 374 (390-358)V. villosa 7.9 48 119 (128-110)
Results for juvenile mussels in moderately hard water and soft water are presented in Table 2 and 3, respectively (presented in Table 3 and 4 in study report).Table 2. LC50 values for juvenile mussels (mg/L) (reported test termination values) in moderately hard waterSpecies Water pH Time LC50 (95% CIs)25°CU. imbecillis NA 96 219 (229-210)V. villosa NA 96 142 (152-132)32°CU. imbecillis NA 96 74 (83-65)V. lienosa NA 96 109 (116-102)
Table 3. LC50 values for juvenile mussels (mg/L) (reported test termination values) in soft waterSpecies Water pH Time LC50 (95% CIs)25°CU. imbecillis NA 96 215 (228-202)E. icterina NA 96 32 (34-30)L. s. claibornensis NA 96 24 (26-22)V. lienosa NA 96 111 (116-105)32°CU. imbecillis NA 96 40 (46-34)V. lienosa NA 96 74 (82-66)V. villosa NA 96 180 (189-171)
For the adult mussel toxicity studies, 50% mortality was not observed for V. lienosa, U. imbecillis, or E. icterina up to 350 mg/L after 96 hours. However, sublethal effects were observed in these studies including slower or no shell closure and large amounts of mucus at concentrations of 150 mg/L and greater.
Description of Use in Document: Quantitative for SSD (used 96 hour values for juveniles and 48 hr results for glochidia)Rationale for Use:Sufficient information available in study and results for use in SSD..Limitations of Study:
1. Solvent concentrations were not reported (test solutions prepared by serial dilution)2. While examination of test solution recovery (concentration over time) were examined in
previous work, concentrations were not measured at test termination in these studies. This is of potential greater uncertainty in studies conducted at 32°C since pre-work was at 25°C.
103

Primary Reviewer: Amy BlankinshipSecondary Reviewer (required if study results are used quantitatively):
104
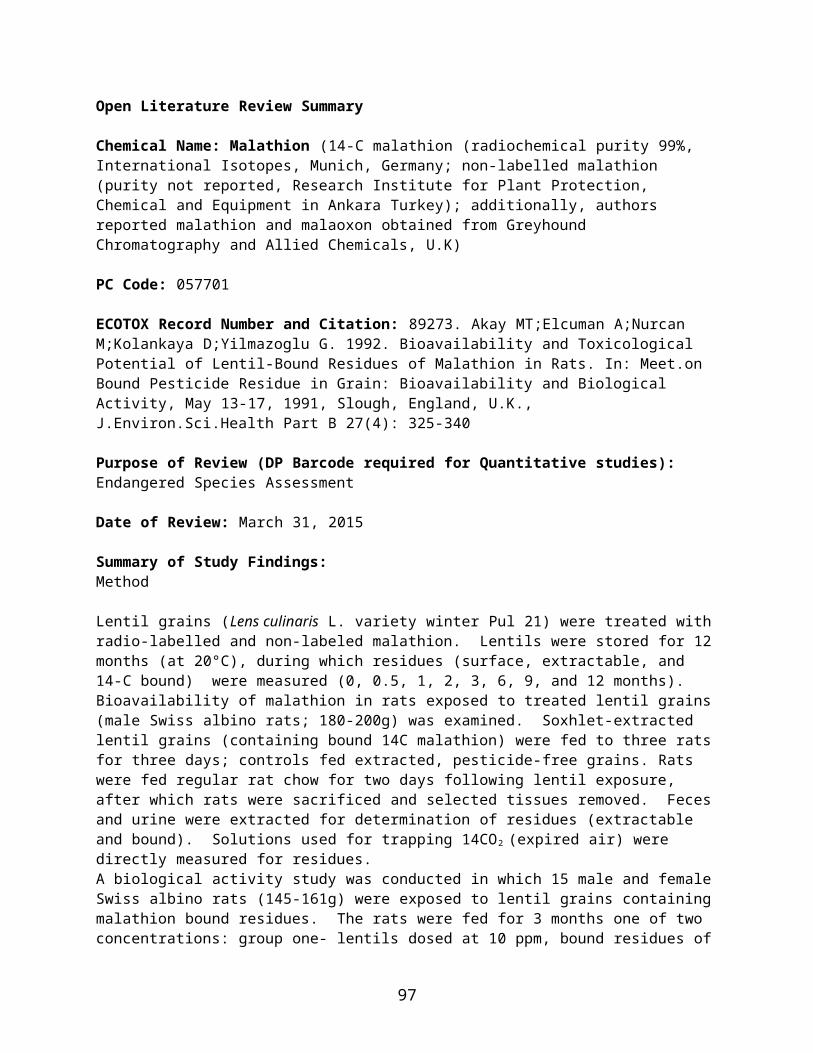
Open Literature Review Summary
Chemical Name: MalathionCAS No: 121-75-5PC Code: 057701
ECOTOX Record Number and Citation:
E052962Panda S.; Sahu S.K. (1999). Effects of Malathion on the Growth and Reproduction of Drawida willsi (Oligochaeta) Under Laboratory Conditions. Soil Biol. Biochem. 31: 363-366.
Purpose of Review: Malathion ESA pilot (Registration Review)Date of Review: 03/04/15
Summary of Study Findings:This study conducted toxicity tests (mortality) and sublethal tests (growth and reproduction) on earthworms, Drawida willsi, to malathion.
Prior to the preparations for the study of growth and reproduction of earthworm, 96-hr bioassays of juvenile, immature, and adult D. willsi earthworms were conducted first to determine the appropriate doses for the sublethal (growth and reproduction) test. The test concentrations were 0.0 (control), 2.2, 4.4, 6.6, 8.8, 11.0, 13.2, 15.4, 17.6, 19.8 and 22.0 mg/kg dry soil of Cythion 50% EC (trade name of malathion; source: Alkali and Chemical Corporation of India, New Delhi) in dilutions of acetone. Controls were treated with acetone alone. Test solutions or acetone alone were sprayed on the soil surface after which the solvent was allowed to evaporate. The treated soil was then mixed. Test materials contained of soil (laterite type, sandy loam texture, pH 6.8, organic matter of 2.7 mg/g, nitrogen at 2.2 mg/g and a C-to-N ratio of 12.27) and earthworms (acclimated as designed by Senapati and Dash (1979)) from an untreated upland non-irrigated paddy field. Three ages classes on the basis of size and presence/absence of genital papilla and clitellum: juveniles (<2 cm), immatures (≥2 to <4 cm) and adults (≥ 4 cm). Four 1 liter glass beakers filled with 500 g of treated soil, 10 healthy gut-cleaned earthworms per beaker; maintained at 200 mg/g soil moisture and 25±2°C soil temperature. Mortality was recorded after 96 hours.
For the preparations of the sublethal test based on the results of the bioassays, five juvenile gut-cleaned D. willsi earthworms were inoculated into 2 kg of soil with 0.0 (control), 2.2 and 4.4 mg/kg soil. 28 replicates per level out of which 4 replicates were taken at 15d intervals for up to 105 days maintained at 200 mg/g soil moisture and 25±2°C soil temperature were used. Worms and cocoons were collected by a hand sorting and wet sieving method (Sahu et al., 1988), and were grouped into their age class; then gut-cleaned and weighed alive. Dry mass was determined after drying the earthworms at 100°C for 48 hours. Growth was calculated in terms of change in weight as a percent of starting weight. The rate of reproduction was calculated as the total number of cocoons produced per adult worm according to Sahu and Senapati (1988). Each period the sublethal effects were analyzed by one-way ANOVA for any significant differences between treatments (Snedecor and Cochran, 1967).
Results:Results of the 96-hr toxicity test are shown in Table 1.
105
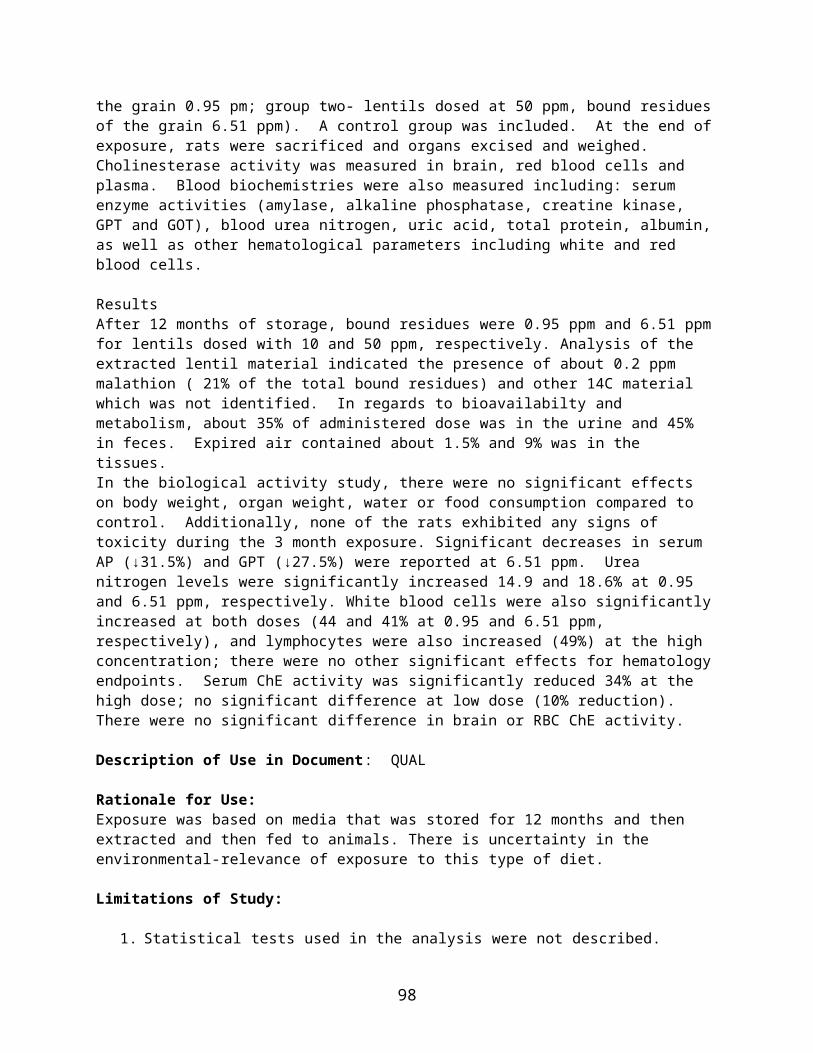
Table 1. 96-hr mortality of malathion (50% EC) to earthworms.*
Insecticide Juvenile (mg/kg soil) Immature (mg/kg soil) Adult (mg/kg soil)LC50 95% C.L. LC50 95% C.L. LC50 95% C.L.
Malathion 15.07 12.50-18.34 17.38 14.02-21.16 18.81 15.16-22.72* Values not corrected to 100% a.i.
In regards to the chronic study, a significant decrease in growth was reported after 15 days which continued until day 60, after which no significant difference was observed from 75 days until test termination (105 days). It was reported that increased growth in the controls was 84% versus an increase of 27 and 4% at 2.2 and 4.4 mg/kg, respectively, after 15 days of exposure. It the chronic study, control worms reached the immature and adult stage after 15 and 45 days, respectively, whereas, in the 2.2 and 4.4 mg/kg, the immature and adult life stage was not reached until day 30 and 60 or 45 and 75, respectively. Significant differences in the rate of reproduction were reported between the control and experimental set at 75 and 90 days, but not at 105 days. The rate of reproduction in the controls at 75 and 90 days was 2.1 and 2.0 cocoons/adult (average of 5 earthworms), and was 1.9 and 2.0 cocoons/adult in the 2.2 mg/kg and was 1.4 and 1.6 cocoons/adult in the 4.4 mg/kg.
Description of Use in Document (QUAL, QUAN, INV):QUAN – LC50 INV – Chronic study
Rationale for Use:This review was conducted because the reported malathion LC50 value of 7.54 mg/kg soil (corrected to 100% a.i.) for juvenile mortality currently represents the most sensitive endpoint for terrestrial invertebrates exposed to malathion.
Limitations of Study:
Major limitation of the chronic study: Variability in the treatment means were not reported (e.g., standard error, standard deviation or
confidence limits); The ANOVA tests indicated that there were significant differences between the treatment
groups, but it in itself won’t tell which groups are different. Based on the description of the statistical analysis and reported results, it is unclear if additional statistical tests were performed (e.g., a pair-wise test). Based on the reported values, it is plausible that growth was significantly affected in both concentrations and reproduction in the high treatment, but this cannot be confirmed.
Other limitations in the acute and chronic studies:
Raw data were not available to confirm calculations and statistics. It is uncertain whether data was corrected for percent technical (in the absence of additional
information, the reviewer corrected for % a.i.); Control mortality in the acute LC50 studies were not reported; While the solvent was reported to allow to evaporate, a no-solvent control was not added to
evaluate for possible solvent interferences in test results.
106

References:Sahu, S.K., Senapati, B.K., 1988. Alternative proposals for quantification of reproduction in a tropical earthworm. Tropical Ecology 29, 6-14. Sahu, S.K., Mishra, S.K., Senapati, B.K., 1988. Population biology and reproductive strategy of Dichogaster bolaui (Oligochaeta: Octochaetidae) in two tropical agroecosystems. Proceedings Indian Academy of Sciences (Animal Science) 97, 239-250. Senapati, B.K., Dash, M.C., 1979. Laboratory observation on the rate of cocoon production of Drawida willsi (Oligochaeta). Journal of Comparative Physiology and Ecology 4, 110-112.Snedecor, G.W., Cochran, W.G., 1967. Statistical Methods. Iowa State University Press, Ames.
Primary Reviewer: Stephen Carey, Biologist, US EPA, Office of Pesticide ProgramsSecondary Review: Amy Blankinship, Chemist, US EPA, Office of Pesticide Programs
107

Open Literature Review Summary
Chemical Name: MalathionCAS No: 121-75-5PC Code: 057701ECOTOX Record Number and Citation:
E72010Caron, D.M. (1979). Effects of Some ULV Mosquito Abatement Insecticides on Honey Bees. J. Econ. Entomol. 72: 148-151.
Purpose of Review: Malathion ESA pilot (Registration Review)Date of Review: 04/14/15
Summary of Study Findings:This paper from University of Maryland reports results of field toxicity tests of malathion, pyrethrum, and naled formulations to caged honeybees (Apis mellifera L.) and as bee colonies that were conducted at measured distances from the spray site receiving both ULV and diluted sprays.
For this open literature summary, only the toxicity tests of malathion to honeybees are reported here.
The formulations tested were: malathion 57% EC applied by mist sprayer at 0.134 g a.i./ha (0.00012 lb a.i./A) and malathion 95% ULV at 0.426 g a.i./ha (0.00038 lb a.i./A). Honeybees were caged and placed at 15, 30, 60, and 90 m from the application site; caged at varying distances up to 300 m from spray truck routes in 5 different communities; and 4 standard bee colonies were moved into 3 communities with mosquito abatement programs. Four control cages and colonies were maintained outside the spray communities. A dead bee trap was used to record mortality.
Adult honey bees of random age were collected from randomly selected University colonies within 3 hours of each test and 75 bees were confined to each cage. 70 cm diameter x 150 cm length cylindrical 18-mesh hardware cloth cage and honey-soaked towel for bee nourishment were used in the experiment. Cages were suspended 1 meter above the ground on support rods 10-60 minutes before spraying and remained for 15 minutes following application. Mortality was counted 24 hours after exposure. For the controlled distance test, cages were placed downwind of spray route at the 4 different distances and a spray route of 90 m was run perpendicular from cages.
For the study examining mortality in bee colonies in three mosquito abatement areas; in one of the areas, both ULV pyrethrum and 57% EC malathion were applied in the same area throughout the summer (June-September). In the other area, 57% EC malathion and ULV malathion were used. No data were available for the third area.
Results:Results showed that bee mortality decreased rapidly with increased distance. Percent mortality of caged bees at measured distances is shown in Table 1; while mortality of caged bees at varying distances up to 300 m in the 4 communities is shown in Table 2. It was noted by the study authors, that the results of
108

the field (varying distance up to 300 m) study were similar to the results at 30 and 60 m in the controlled distance study.
Table 1. % Mortality of Caged Bees at Measured Distances.Distance from site (m)
Malathion
ULV 57% EC
15 68.3% 100%30 39.0% 65.5%60 0.6% 43.0%90 2.3% 15.5%
Table 2. Mortality of Caged Bees in Field Tests in 4 Communities.
Compound No. Cages % Mortality
Control 8 1.5%d
ULV malathion 16 31%b
EC 57% malathion 16 42.5%a
Treatments not followed by same letter are significantly different (p<0.05, Duncan’s multiple tests)
In the bee community study where colonies were placed into communities receiving mosquito abatement sprays, the study authors noted that after the 5 applications of ULV pyrethrum, mortality of bees were averaging less than 100 bees/day (normal losses), however, mortality after malathion (57% EC) greatly increased (maximum mortality of approximately 1000 bees based on Figure 1 in paper). In the other colony study, malathion was applied both during the day and night. Mortality after the nighttime applications were low (both considered typical daily loss), and mortality after daytime applications were greater (maximum mortality of approximately 1500 bees based on Figure 2 in paper).
109
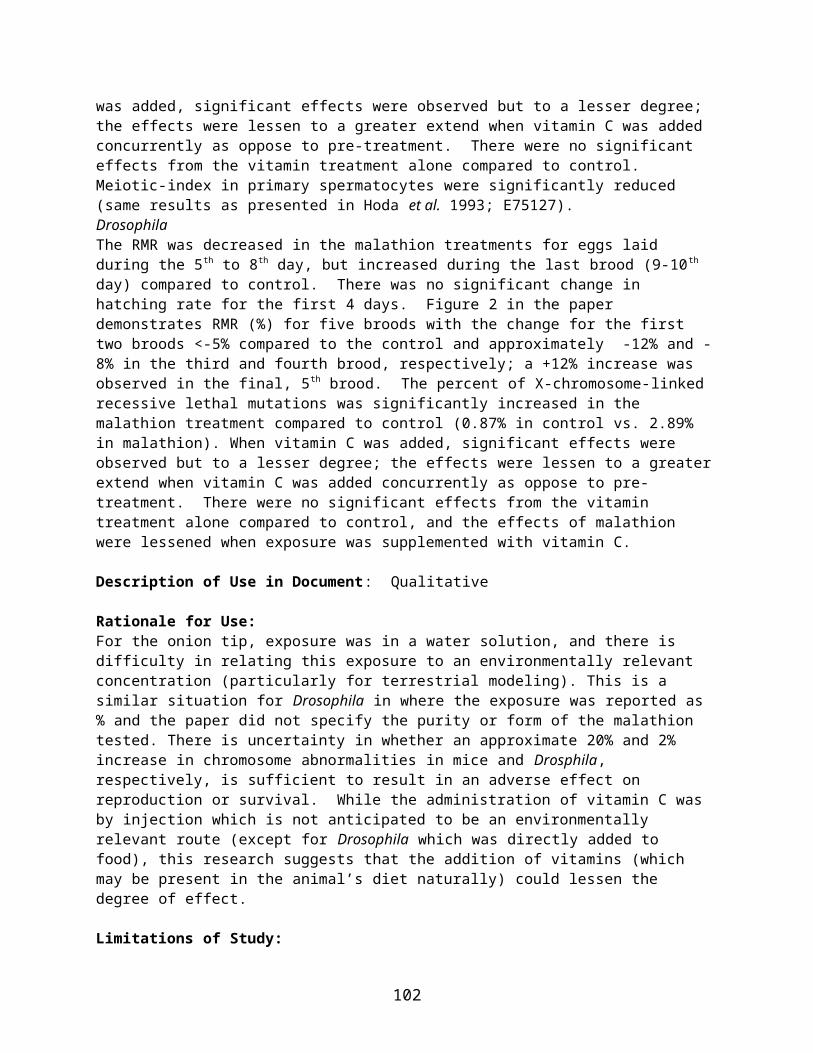
110

Description of Use in Document (QUAL, QUAN, INV):QUAL
Rationale for Use:This review was conducted because the reported malathion toxicity value of 0.134 g a.i./ha (reviewer-converted to 0.00012 lb a.i./A) for mortality currently represents the most sensitive endpoint for terrestrial invertebrates exposed to malathion based on lb a.i./A. This study demonstrates that honeybees downwind of a malathion application could be affected and is useful for the effects characterization.
Limitations of Study: For the controlled distance study (Table 1 results) and the colony studies (Figures 1 and 2), while
the mortality rates for the bees exposed to malathion drift are high, information about control mortality is not reported, therefore, making comparisons to an untreated population could not be conducted.
A description of the application was described for the controlled distance study but was not described for the study with varying distances or colony study. For the colony studies, it is not known what other potential sources of toxicants the bees may have encountered during their normal activity.
In the field (varying distance) study, only the percent mortality is presented (variability among cages or location distances not reported). It is not known if this is an average of the 8 or 16 cages or the percent based on total number of dead bees from the total number exposed (presumably at varying distances). It is unclear what the unit was for statistical analysis (cage, location site).
The concentration of malathion at the location sites of the honeybees is not known rather that is it assumed that the cages (and therefore honeybees) intercepted the drift from the malathion application; the actual exposure concentration is likely less than the application rate as distance from the site of application increases. The study used distances in the controlled distance study, rather than concentrations, to observe how many bees died at specific distances from the spray site.
Data are not available for the 3rd mosquito abatement area and the fifth community with caged bees placed at varying distances (Table 2 title states data from four communities not five); it is unclear why the author excluded it from data reporting.
Other LimitationsRaw data were not available to confirm calculations.
References:None
Primary Reviewer:Stephen Carey, Biologist, US EPA, Office of Pesticide Programs
Secondary Review: Amy Blankinship, Chemist, USEPA, OPP
111

Open Literature Review Summary
Chemical Name: Malathion
CAS No: 121-75-5
PC Code: 057701
ECOTOX Record Number and Citation:
E082047Poopathi, S.; Arunachalam, N.; Gopalan, N.; Baskaran, G.; Mani, T.R. (2001). Resistance to Malathion in Culex quinquefasciatus Say (Diptera: Culicidae) from Madurai, South India. Insect Sci. Appl. 21(3): 251-255.
Purpose of Review: Malathion ESA pilot (Registration Review)
Date of Review: 03/06/15
Summary of Study Findings:The focus of the study was the evaluation of Culex quinquefascatus (mosquito) resistance against malathion. The technical grade (95% a.i.) from M/S Cynamide India LTD was tested. Only the results of the bioassays are reported here. In the test, larvae were collected from major mosquito breeding sites in South India villages of K.K. Nagar, Malaipatti, Makkalakottai, and Kuthiparai. Additionally, a susceptible C. quinquefasciatus population collected from Madurai and reared for several generations at the Centre for Research in Medical Entomology was used too. The larvae were acclimated in the laboratory at ambient conditions (29-31°C, 80% relative humidity) in enamel trays and fed yeast and dog biscuits as described by Poopathi et al (1999). Newly emerged fourth instars were used in the larval bioassays. For adult bioassays, pupae were allowed to emerge in cages and sexed; newly emerged mated female mosquitoes were fed blood meal from a live chicken; then the fully blood fed mosquitoes were used in the bioassays. Stock solutions were titrated in the appropriate volume of double distilled water to produce concentrations ranging from 0.02 to 1 mg/L as described by WHO (1992). The treatment solution for the larval bioassay was added into polythene disposable cups containing 150 ml of double distilled water. For the adult contact bioassay as described by Poopathi and Raghunatha Rao (1995), the solution was impregnated on Whatman No. 1 filter papers. Three replicates of 25 early fourth instars of C. quinquefasciatus larvae were added to each treatment level and water alone, fed, and after 24 h mortality was recorded; while 3 replicates of 25 adults were added to treated papers with different concentrations and untreated filter papers and were exposed for 1 hour, then removed and transferred to observation cages, then after 1 hour mortality was recorded. Any moribund larvae were considered dead. ASSAY, a dosage mortality regression analysis, was used to determine the LC50, LC90, and LC95 values. The Abbott’s formula (1925) was used to correct the data if control mortality exceeded 5 to 20%.Results:
For malathion, the laboratory strain LC50 value is reported as 0.047 mg/L; the most sensitive field-collected strain (K.K. Nagar) LC50 value is reported as 0.1 mg/L. Adult mosquitoes were more sensitive than larval mosquitoes (see Table 1).
112

Table 1. Dosage-Mortality Data for Larvae and Adult Mosquitoes Treated with Malathion.
DATUM Strains (Collection Site)Madurai1 K.K. Nagar Malaipatti Nakkalakottai Kuthiparai
Adult mosquitoes (Contact exposure)LD50 0.047 mg/L 0.1 mg/L 0.689 mg/L 0.413 mg/L 1.63 mg/LLD90 0.488 mg/L 0.545 mg/L 1.6 mg/L 2.66 mg/L 7.15 mg/LLD95 0.95 mg/L 0.879 mg/L 2.04 mg/L 4.51 mg/L 10.87 mg/LLarvae mosquitoes (Aquatic exposure)LD50 0.126 mg/L 0.31 mg/L 0.21 mg/L 0.18 mg/L 0.19 mg/LLD90 0.718 mg/L 2.09 mg/L 0.96 mg/L 0.74 mg/L 0.96 mg/LLD95 1.175 mg/L 3.61 mg/L 1.48 mg/L 1.11 mg/L 1.52 mg/L1 susceptible, laboratory strain.
Description of Use in Document (QUAL, QUAN, INV):QUAN - LDx data
Rationale for Use:This review was conducted because the reported malathion LD50 value of 0.047 mg/L for mortality currently represents the most sensitive endpoint for terrestrial invertebrates exposed to malathion.
Limitations of Study: Raw data were not available to confirm calculations and statistics. As such, control mortality
rates were unknown. It is uncertain whether data was corrected for percent technical (in the absence of additional
information, it was assumed that the author corrected for % a.i., and given the purity (95%), the impact of this assumption is minimal).
As organisms were field collected, potential exposure to contaminants in unknown. Also, potential contaminants in the dog biscuit feed were not reported.
Primary Reviewer: Stephen Carey, Biologist, US EPA, Office of Pesticide ProgramsSecondary Reviewer: Amy Blankinship, US EPA, Office of Pesticide Programs
113

Open Literature Review Summary
Chemical Name: MalathionCAS No: 121-75-5PC Code: 057701
ECOTOX Record Number and Citation:
E089288Robertson, J.L., Lyon, R.L., Page, M. (1975). Toxicity of Selected Insecticides Applied to Two Defoliators of Western Hemlock. J. Econ. Entomol. 68(2): 193-196.
Purpose of Review: Malathion ESA pilot (Registration Review)Date of Review: 03/05/15
Summary of Study Findings:This paper discussed the thirteen insecticides tested in a laboratory spray chamber on 4th and 5th instar hemlock sawfly, Neodriprion tsugae Middleton. Only the results on the toxicity of malathion to the hemlock sawfly species are reported here. Technical grade malathion was dissolved in Dowanol TPM (tripropyleneglycol monomethyl ether). Serial dilutions were made from stock solutions prepared on the basis of weight-volume concentration of the active ingredient. Each test was replicated at least three times and a control group was included in each trial. Controls were treated with Dowanol TPM alone. Test organisms were 4th and 5th instars (collected from McKenzie Inlet, Alaska and fed western hemlock foliage) in groups of 10 into 9 cm diameter paper lids, held in a laboratory spray chamber. Identification by using the head capsule measurements of Beal (1993), and treated as described by Robertson (1972). Spray was introduced into the chamber for 10 seconds and the insects were exposed to the spray for 1 minute. Dosage was measured in the spray chamber as µg/cm2 AI by weighing deposits on 9 cm diameter filter paper; then converted to oz./acre by the formula -- µg/cm2 divided by 0.7 = oz./acre. After treatment, sawflies were transferred to sterile 100x20 mm petri dishes lined with filter paper and fed western hemlock foliage. Numbers of dead and moribund insects were recorded after 72 hours. Probit was used to determine the LD50 and LD90, fiducial limits, and slope.
Results: Results of the probit analysis is shown in Table 1.
Table 1. 72-hr mortality of technical grade malathion to hemlock sawflies.*Insecticide No. of Insects SlopeSE LD50 95% F.L. LD90 95% F.L.
Malathion180A 5.36±0.74 0.15 0.12-0.17 0.25 0.21-0.36258B 5.60±0.68 0.14 0.12-0.16 0.24 0.21-0.32
* oz./acreFL = fiducial limitsA Fourth instars onlyB Fourth and fifth instars combined
Description of Use in Document (QUAL, QUAN, INV):QUAN – LDx data
Rationale for Use:
114

This review was conducted because the reported malathion LD50 value of 0.00875 lb/A (reviewer adjusted reported values of oz/acre to lb a.i./A) for mortality currently represents the most sensitive endpoint for terrestrial invertebrates exposed to malathion.
Limitations of Study: Raw data were not available to confirm calculations and statistics. As such, control mortality
rates were unknown; It is uncertain whether data was corrected for percent technical (in the absence of additional
information, it was assumed that the author corrected for % a.i.); While a list of companies that supplied the insecticides were reported, it is uncertain which
company supplied malathion; As organisms were field collected, potential exposure to contaminants in unknown. Also,
potential contaminants in the feed (western hemlock) were not reported.
References:Beal, J. A. 1933. Further studies on the hemlock looper in southwestern Washington. U. S. Bur. Entomol. Rep. 41 pp.Robertson, J. L. 1972. Toxicity of Zectran aerosol to the California oakworm, a primary parasite, and a hyperparasite. Environ. Entomol. 1: 116-7. Primary Reviewer: Stephen Carey, Biologist, US EPA, Office of Pesticide ProgramsSecondary Review: Amy Blankinship, Chemist, US EPA, Office of Pesticide Programs
115
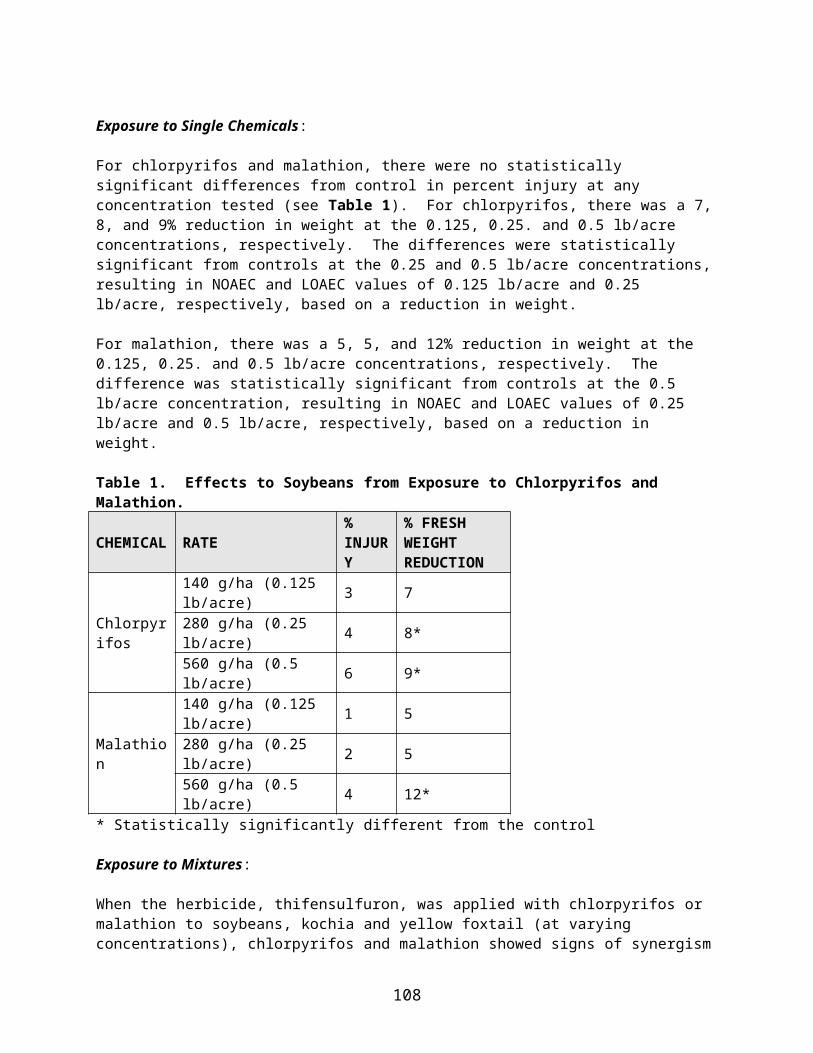
Open Literature Review Summary
Chemical Name: Malathion; DiazinonCAS No: 121-75-5; 333-41-5PC Code: 057701; 057801ECOTOX Record Number and Citation:
E100430Leonova I.N.; Slynko N.M. (2004). Life Stage Variations in Insecticidal Susceptibility and Detoxification Capacity of the Beet Webworm, Pyrausta sticticalis L. (Lep., Pyralidae). J. Appl. Entomol. 128(6): 419-425
Purpose of Review: ESA risk assessment method development – case studyDate of Review: 05/15/15
Summary of Study Findings:This study was conducted to assess the mechanisms of selective sensitivity of larvae and moths of the beet webworm (Pyrausta sticticalis L.) to various chemical classes of insecticides by the use of biochemical and toxicological methods. Only the bioassays of malathion and diazinon to larvae and adult beet webworms are reported here. Results are reported for assays with and without a synergist which acts as an inhibitor of hydrolytic esterases (S,S,S,-tributyl phosphotrithioate, TBPT; Chemagro, Kansas City, MO). Adult moths were collected from untreated fields of Novosibirsk region, West Siberia, Russia. Larvae were reared on an artificial diet designed by Burton (1970). Adult moths were fed on a solution of honey (70 g in 1 liter of tap water). Adult moths of mixed ages and sexes were used. A solution of radiolabelled-pesticide of technical grade in acetone (1 µl) was applied topically to the thorax of adult moths and the dorsal abdominal surface of fifth instars. Malathion was obtained from Amersham from London, UK. The diazinon source was not reported. All test chemicals reported as being technical grade with purity from 92-100%. Controls were treated with acetone alone. Three replicates with 10 insects/replicate per dose and at least four treatment levels, giving >10 and <90% mortality were used. Mortality was recorded after 24 hours. Abbot’s formula was used to correct mortality when control mortality of adults was 10-20%. Probit was used to determine the LD50, slope, and fiducial limits. Additional assays were performed using a synergist (TBPT) in which the TBPT was topically applied 1 hour prior to insecticide treatment. Metabolism of malathion in adult moths and fifth instar was examined in organisms topically treated with malathion (100 ng/larva and 17 ng/adult) by examining the amount recovered after rinsing the organisms (external rinse) as well as tissue and excreta concentrations. Metabolism of diazinon was not evaluated.
Results:Results of the probit analysis for malathion and diazinon are shown in Table 1. Adults were more susceptible than larvae to malathion and diazinon, with and without a synergist. The synergist increased the toxicity to larvae by a factor of approximately ten (diazinon) to 100 (malathion) and increased the toxicity to adults by a factor of almost five (malathion; not tested with diazinon).
Table 1. Contact toxicity of technical grade malathion and diazinon to larvae and adult beet webworms, alone and with a synergist.
Insecticide Larvae (µg/g bw) Adult (µg/g bw)n LD50 95% FL Slope ± SEM n LD50 95% FL Slope ± SEM
116
Malathion 250 2320 2080-2570 2.25 ± 0.29 160 2.39 1.91-3.05 3.01 ± 0.28Malathion + TBPT 140 21.0 12.1-30.4 0.94 ± 0.09 120 0.48 0.38-0.65 2.77 ± 0.37
Diazinon 150 464 327-671 1.76 ± 0.23 140 0.15 0.13-0.17 4.87 ± 0.26Diazinon + TBPT 140 47.9 38.0-53.1 3.31 ± 0.36 NA NA NA NA
For the metabolism studies, after 24 hours, for larvae, 5% of the applied dose was measured in the tissue while 79% of the dose was recovered in the excreta; 7.6% was measured in the external rinse. For adults, after 24 hours, 44.8% of the dose was recovered in the tissue and 10.2% in the excreta; 37.4% was measured in the external rinse.
Description of Use in Document (QUAL, QUAN, INV):QUAN
Rationale for Use:This review was conducted because the reported 24-hour LD50 values of 2.39 µg/g bw (malathion) and 0.15 µg/g bw (diazinon) in adult beet webworms currently represent the most sensitive acute mortality endpoints for terrestrial invertebrates exposed to malathion and diazinon, respectively. The 24-hour LD50 values for malathion and diazinon may be included in data arrays or species sensitivity distributions and may be used as the source of threshold values or other risk estimates for these active ingredients.
Limitations of Study:Raw data were not available to confirm calculations and statistics. It is uncertain whether data was corrected for percent technical (in the absence of additional information, it was assumed that the author corrected for % a.i.). It was not reported if there were potential contaminants in the honey food source.
References:Burton, R. L., 1970: A low cost diet for the corn earworm. J. Econ. Entomol. 63, 1969–1970.
Primary Reviewer: Stephen Carey, Biologist, US EPA, Office of Pesticide ProgramsSecondary Review: Amy Blankinship, Chemist, US EPA, Office of Pesticide ProgramsSecondary Review: Catherine Aubee, Biologist, US EPA, Office of Pesticide Programs
117

Open Literature Review Summary
Chemical Name: MalathionCAS No: 121-75-5PC Code: 057701ECOTOX Record Number and Citation: E111057
Kawada, H., Shono, Y. Ito, T., and Abe, Y. (1993). Laboratory Evaluation of Insect Growth Regulators Against Several Species of Anopheline Mosquitoes. Eisei Dobutsu 44(4): 349-353.
Purpose of Review: Malathion ESA pilot (Registration Review)Date of Review: 03/02/15
Summary of Study Findings:This study was conducted to evaluate the larvicidal and adulticidal efficacy of conventional insecticides against several species of adult and larval Anopheline mosquitoes (A. stephensi, A. gambiae, A. albimanus, and A. farauti) in laboratory bioassays.
For this open literature summary, only the bioassays of malathion to larval and adult Anopheline mosquitoes with the exception of A. farauti species are reported here.
St. Marianna University provided colonies of susceptible A. stephensi mosquitoes (collection site was not reported); and the London University provided colonies of malathion-resistant A. stephensi mosquitoes (collected from Pakistan), susceptible (collected from Tanzania), dieldrin-resistant (collected from Burkina fuso), DDT-resistant (collected from Africa) A. gambiae mosquitoes, and susceptible (collection site was not reported) and organophosphate and carbamate-resistant (collected from El Salvador) A. albimanus mosquitoes. Insects were reared at 25°C and 60% relative humidity, under a 16:8 (light:dark) photoperiodic regime. 2-3 days old female adults and fourth instar larvae were used. Adults were fed with 3% sugar solution.
A 0.3 µl acetone solution of the emulsifiable concentrate of malathion (5% a.i.; source: not reported) was applied topically to the dorsal mesothorax of adult mosquitoes; while the larvae (n=30) were released into 150 ml of the malathion formulation diluted with deionized water at appropriate concentrations. The number of treatment levels and replicates were not reported. Also not reported was whether acetone was used in the control groups. Mortality was recorded after 24 hours. The mortality of adults and % of emergence were corrected to of the control. Bliss’s probit (1934) was used to determine the LD50 values.
Results: Results of the probit analysis are shown in Table 1.
Table 1. Toxicity of malathion (5% EC) to larval and adult Anopheline mosquitoes.Species Adult LD50 (µg/female) Larvae LD50 (ppm)A. stephensi 0.017 0.35A. gambiae 0.018 0.19
118

A. albimanus 0.0075 0.12
Description of Use in Document (QUAL, QUAN, INV):QUAN- LD50 data
Rational for Use:This review was conducted because the reported malathion LD50 value of 0.000375 µg/female [organism] (corrected to 100% a.i.) for mortality currently represents the most sensitive endpoint for terrestrial invertebrates exposed to malathion.
Limitations of Study:Raw data were not available to confirm calculations and statistics. It is uncertain whether data was corrected for % technical (in the absence of additional information, the reviewer corrected for % a.i.). Control mortality was not reported, only that treatment mortality was corrected for control mortality. While test results for the larval studies were reported in ppm and there is uncertainty in whether that refers to mass/volume or volume/volume as the test material was a liquid, given that the adult LD50 values were in mass, it is assumed the larvae results were also in mass/volume.
Reference:Bliss, C.I. (1934): The method of probits. Science, 79: 38-39.
Primary Reviewer: Stephen Carey, Biologist, US EPA, Office of Pesticide ProgramsSecondary Reviewer: Amy Blankinship, Chemist, US EPA, Office of Pesticide Programs
119
Open Literature Review Summary
Chemical Name: Chlorpyrifos; Malathion; Diazinon
CAS No: 2921-88-2; 121-75-5; 333-41-5
PC Code: 059101; 057701; 057801
ECOTOX Record Number and Citation:
E039997Bayoun, I.M., Plapp, F.W., F.E., Gilstrap, and G. Michels. (1995). Toxicity of Selected Insecticides to Diuraphis noxia (Homoptera: Aphididae) and Its Natural Enemies. Ecotoxicology, 88(5): 1177-1185.
Purpose of Review: Malathion ESA pilot (Registration Review)
Date of Review: 02/11/15
Summary of Study Findings:The article conducted laboratory bioassays to identify insecticides with differential toxicity to Russian wheat aphid, Diuraphis noxia, and associated parasites and predators. 14 insecticides of various modes of action were tested against adults of 3 species of parasites (Lysiphlebus testaceipes, Aphelinus varipes, and Diaeretiella rapae) and against 3rd instars of four species of coccinellids (Hippodamia convergens, H. sinuata, H. variegata, and Coccinella septempunctata). 10 insecticides were tested for contact and systemic toxicity against D. noxia adults. Objectives of the study were to select an effective insecticidal exclusion agent and identify a control agent for D. noxia that had minimum effect on parasite and predator populations. Only the results for technical grade of chlorpyrifos, malathion, and diazinon (all >90% purity) for the parasite and predator tests, and formulations of chlorpyrifos (Dursban 6, % a.i. not reported) and malathion (Malathion 50, % a.i. not reported) for the contact and systemic toxicity tests against D. noxia are reported here. Diazinon was not used in the contact and systemic toxicity tests. After the toxicity tests, LC50 data from the tests were used to calculate the selectivity of the insecticides to D. noxia and its natural enemies. The selectivity ratios were then used to evaluate how high or less selective the insecticides were to D. noxia and its natural enemies for use in insecticidal exclusion studies.
20 ml screw-cap glass vials (Plapp and Vinson, 1977) for the parasite and predator tests; and dip-cages (2.5 cm long by 3 cm diameter plastic cylinders) adapted from the Food and Agricultural Organization dip-test (1979) for the contact and systemic toxicity tests were used. 1-3 days old parasites, 3rd-instar predators (several hours to 1 day old after molting), and adult to 4th-instar D. noxia were used in the experiments. L. testaceipes, and A. varpes parasites were collected from parasitized greenbugs, Schizaphis graminum, in College Station, TX and D. rapae were reared from D. noxia and cornleaf aphids, Rhopalosiphum maidis, collected in Prosser, WA. H. convergens, H. sinuate, and C. septempuctata predators were collected from wheat fields at the Texas Agricultural Experiment Station at Bushland, TX, in the spring of 1991. The H. variegate predator consisted of 4 strains imported from Morocco, Canada, Khirgizia, and Moldova, and were supplied by the USDA Biological Control Laboratory at Niles, MI. D. noxia aphids were provided by the USDA-APHIS-PPQ Mission Biological Control Laboratory in Texas.
120

For the parasite/predator tests, 0.5 ml of Insecticide solution diluted in acetone was pipetted into each vial; vials were then rotated manually and horizontally until the liquid evaporated. Acetone was pipetted in the control vials. Five parasites per species were transferred via a mouth aspirator, while a camel’s hair brush was used to transfer 1 predator of each species into treated vials; then treated vials were plugged with a piece of cotton moistened with 40% honey-water solution to sustain the parasites/predators. For the contact toxicity tests, 20 ml of insecticide solution was pipetted over the aphids; then aphids were transferred via a camel’s hair brush onto caged wheat seedlings held in a hydroponic cage apparatus (Summer et al., 1983). For the systemic toxicity tests, the same procedure as the contact toxicity test was used; however, plant roots instead of aphids were immersed in a solution of a specific insecticide concentration. Concentrations used in the parasite/predator and contact/systemic toxicity tests ranged 0.005-5000 µg/vial and 0.001-1000 µg/ml, respectively. The number of treatment levels and replicates were not reported; however, the number of individuals used in the tests ranged 43-590 for malathion, chlorpyrifos, and diazinion (See Tables 1 thru 3 for specifics). The number of dead individuals was recorded at the end of the experiments.
The reported control mortality was 0%, 0%, 20%, and 15% in the 2-hr parasite, 48-hr predatory, and 48-hr D. noxia contact and systemic toxicity tests, respectively. The authors used Abbott’s formula (1925) to correct for % mortality and probit analysis to determine LCX and slope. The authors present the parasite/predatory LC50s in terms of µg/vial and D. noxia LC50s in terms of µg/ml of solution in which aphids were dipped or in which roots of plant were immersed.
Results:
Parasite and predator LC50s data are presented in Table 1 and Table 2. Contact and systemic LC50s are presented in Table 3. Data comparing the selectivity of insecticides to D. noxia and its natural enemies for insecticides tested both against D. noxia and natural enemies are presented in Tables 4 and 5. Table 4 presents the contact selectivity ratios, while Table 5 presents the systemic selectivity ratios. Values presented in Table 4 are derived from data in Tables 1 and 2 and the contact LC50 values in Table 3. Values presented in Table 5 are derived from data in Tables 1 and 2 and the systemic LC50 values in Table 3. Tables 4 and 5 show ratios of contact/systemic toxicity of insecticides to D. noxia over the toxicity of these insecticides to parasites and predators. Insecticides selective against natural enemies are high for both contact and systemic selectivity ratios; and against D. noxia result in low contact selectivity ratios, and preferably (but not necessarily) low systemic selectivity ratios. The authors do not cite a specific source for these data.
In the contact/systemic toxicity tests with malathion, the most sensitive LC50 value (and 95% CL) is the contact toxicity test with the D. noxia and is reported as 100.27 µg/ml (28.7-276), see Table 3. The selectivity ratios indicated malathion was highly selective against all natural enemies except D. rapae; however, systemic selectivity ratios were high for malathion (Table 5), indicating more selectivity against natural enemies. In contrast, malathion showed very low systemic and contact toxicity to D. noxia; thus, malathion is an excellent candidate for selectively removing all natural enemies in insecticidal exclusion studies.
Contact/systemic test results for chlorpyrifos indicated the most sensitive LC50 value (and 95% CL) was 5.82 (4.92-6-88) µg/ml from the contact toxicity test. Chlorpyrifos was selectively toxic to D. noxia due to low contact selectivity ratios (Table 4); however, systemic selectivity ratios were very high, making it less
121

selective against D. noxia. Contact and systemic LC50 values were not reported for diazinon; thus, the selectivity ratios could not be calculated.
Exposure to malathion in the parasite/predatory toxicity tests using vials (Tables 1 and 2), the most sensitive LC50 value is 0.05 µg/vial. The most sensitive species is C. septempunctata. For chlorpyrifos and diazinon, the most sensitive LC50 value is reported as 0.05 (H. varigata) and 0.02 (D. rapae, L. testaceipes, and C. septempunctata) µg/vial, respectively.
Table 1. Toxicity of technical grade chlorpyrifos, malathion, and diazinon to adults of 3 species of parasites.*
InsecticidesD. rapae A. varipes L. testaceipes
N1 Slope ± SEM
LC50 and [95% CL] N Slope
± SEMLC50 and [95% CL] N Slope ±
SEMLC50 and [95% CL]
Diazinon 54 3.68 ± 0.63
0.02[--] 75 2.71 ±
0.75
0.43 [0.25-0.72]
53 4.11 ± 0.41
0.02[0.01-0.02]
Chlorpyrifos 82 2.71 ±
0.27
1.07[0.23-3.44]
71 3.42 ± 0.56
0.59[0.44-0.92]
53 4.11 ± 0.41
0.16[0.13-0.2]
Malathion 55 4.11 ± 0.41
15.6[12.8-19.2
58 2.43 ± 0.24
0.07[0.05-0.1] 51 4.13 ±
0.410.17
[0.13-0.2]
* µg/vial1 Number of individuals
122

Table 2. Toxicity of technical grade chlorpyrifos, malathion, and diazinon to 3rd instars of 4 coccinellid species.
Insecticides
H. convergens H. varigata H. sinuata C. septempunctata
N1 Slope ± SEM
LC50 and [95% CL] N Slope
± SEMLC50 and [95% CL] N
Slope ±
SEM
LC50 and [95% CL] N Slope
± SEMLC50 and [95% CL]
Diazinon 80
2.66 ± 0.25
0.97[0.74-1.26]
90 2.02 ± 0.19
0.18 [0.09-0.34]
652.75
± 0.27
0.03 [0.02-0.04]
78 2.00 ± 0.19
0.02 [0.01-0.02]
Chlorpyrifos
65
2.84 ± 0.28
2.62 [1.99-3.44]
73 4.11 ± 0.41
0.05 [0.04-0.06]
564.11
± 0.41
0.16 [0.13-0.19]
43 4.11 ± 0.41
0.16 [0.13-0.19]
Malathion 83
1.55 ± 0.14
4.01 [1.78-8.48]
60 1.98 ± 0.26
0.13 [0.06-0.26]
692.80
± 0.27
0.27 [0.21-0.36]
82 2.09 ± 0.2
0.05 [0.04-0.07]
* µg/vial1 Number of individuals
Table 3. Contact and systemic toxicities of chlorpyrifos and malathion formulations to adult and 4 th-instar D. noxia.*
InsecticidesContact toxicity Systemic toxicity
N1 Slope ± SEM LC50 and [95% CL] N Slope ±
SEM LC50 and [95% CL]
Chlorpyrifos 351 2.06 ± 0.15 5.82 [4.92-6.88] 590 1.31 ±
0.15 32,716 [-]
Malathion 320 1.62 ± 0.12 100.27 [28.7-276] 350 1.73 ±
0.13 1,430 [829-2452]
* µg/ml of water.1 Number of individuals
123

Table 4. Contact selectivity ratios of chlorpyrifos and malathion formulations against D. noxia and its natural enemies.*
Insecticides
Contact Selectivity RatiosD. noxia/Parasites D. noxia/Predators
D. rapae
A. varipes
L. testaceipe
s
H. convergen
s
H. varigata
H. sinuata
C. septempunctat
aChlorpyrifo
s5.44 9.86 36.4 2.22 116 36.4 36.4
Malathion 6.41 1432 590 25 771 371 2005* Data are ratios of contact toxicities of insecticides to D. noxia divided by toxicity of the natural enemies at LC50. High ratios represent insecticides selectively toxic to the natural enemy. Low ratios represent insecticides selectively toxic to D. noxia.
Table 5. Systemic selectivity ratios of chlorpyrifos and malathion against D. noxia and its natural enemies.*
Insecticides
Systemic Selectivity RatiosD. noxia/Parasites D. noxia/Predators
D. rapae
A. varipes
L. testaceipe
s
H. convergen
s
H. varigata
H. sinuata
C. septempunctat
aChlorpyrifo
s30576 55451 204475 12487 654320 204475 204475
Malathion 91.4 20429 5412 357 11000 5296 28601* Data are ratios of systemic toxicities of insecticides to D. noxia divided by toxicity of the natural enemies at LC50. High ratios represent insecticides selectively toxic to the natural enemy. Low ratios represent insecticides selectively toxic to D. noxia.
Description of Use in Document (QUAL, QUAN, INV):QUAN - LCx data in terms of µg/ml of waterQUAL – RatiosQUAL – LCx data in terms of µg/vial
Rationale for Use:This review was conducted because the reported malathion LC50 value of 100.27 µg/ml for mortality currently represents the most sensitive endpoint for terrestrial invertebrates exposed to malathion.
Limitations of Study:Raw data were not available to confirm calculations and statistics. It is uncertain whether data was corrected for percent technical (in the absence of additional information, it was assumed that the author corrected for % a.i.). The ‘Ratios’ and ‘ug/vial’ portions of the study are classified as ‘QUAL’ – they are scientifically valid, however, the endpoints from these portions of the study are not relatable to environmental exposures and cannot be used for modeling purposes.
References:

Plapp, F.W., and B. Vinson. 1977. Comparative toxicity of some insecticides to the tobacco budworm and its ichneumonid wasp, Campoletis sonorensis. Environ. Entomol. 6: 381-184.Food and Agricultural Organization (FAO). 1979. Recommended methods for the detection and measurement of resistance of agricultural pests to pesticides. Method for adult aphid—FAO method no. 17. FAO Plant Prot. Bull. 27: 29-32.
Summer, L.C., et al. 1983. Response of Schizaphis gramineum (Homoptera: Aphididae) to drought-stressed wheat, using polyethylene glycol as a matricum. Environ. Entomol. 12: 919-
922.
Primary Reviewer:Stephen Carey, Biologist, US EPA, Office of Pesticide Programs
Secondary Reviewer: Melissa Panger, Senior Scientist, US EPA, Office of Pesticide Programs
2
2
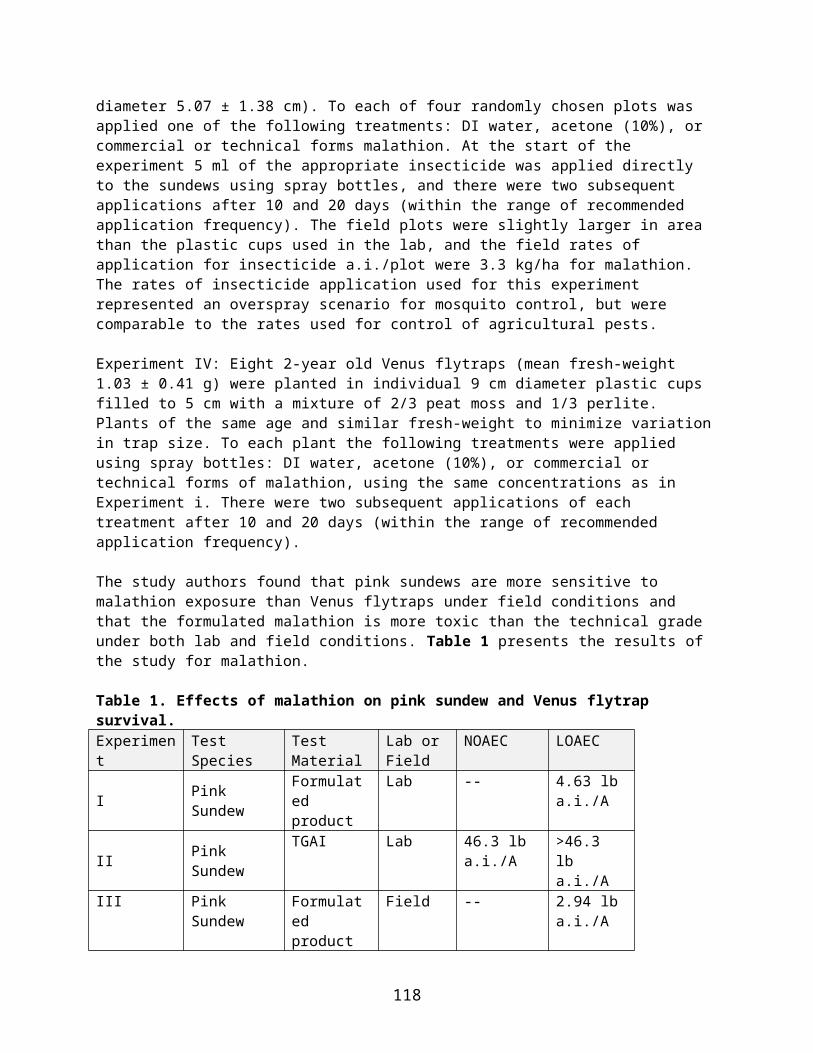
Open Literature Review Summary
Primary Reviewer: Elizabeth DonovanSecondary Reviewer (required if study results are used quantitatively):
Chemical Name: Malathion (Technical grade and Pure; purity not reported)
CAS No: Not reported
PC Code: 057701
ECOTOX Record Number and Citation: 29591. Ram and M.P. Gupta. 1975. Effect of Systemic Granular Insecticides on the Germination of Seeds of Forage Crops. Indian Journal of Entomology. 37 (4): 413-415.
Purpose of Review (DP Barcode required for Quantitative studies): Malathion ESA pilot (Registration Review)
Date of Review: November 17, 2015
Summary of Study Findings:This study explored the effects of granular insecticides, including a malathion formulation, on seed germination of forage crops (E29591; Ram 1975). Cowpea (Vigna sp.), alfalfa (Medicago sativa), and sorghum (Sorghum sp.) were exposed to a 5% granular formulation of malathion in field plots. The malathion was incorporated 2.5 cm into the soil prior to sowing the seeds. Germination counts were recorded seven days after sowing. The study authors report decreased germination of cowpea and alfalfa seeds at 1.78 lbs malathion/A, while there was no effect observed on sorghum germination.
Description of Use in Document: Qualitative
Rationale for Use: This endpoint is discussed in the effects characterization for the malathion ESA pilot.
Limitations of Study:There are no current registrations for a granular formulation of malathion; therefore, this endpoint is of limited value in the current assessment.
3
3

Open Literature Review Summary
Chemical Name: Malathion (PC Code 057701)CAS No: 121-75-5MRID: Not assignedECOTOX Record Number and Citation: 104182Boone, M.D. 2008. Examining the single and interactive effects of three insecticides on amphibian metamorphosis. Environmental Toxicology and Chemistry 27 (7): 1561-1568.
Purpose of Review (DP Barcode or Litigation): N/A
Date of Review: 1 June 2010
Summary of Study Findings:In two mesocosm experiments, the author examined the individual and synergistic effects of three insecticides, including carbaryl, malathion, and permethrin, on survival, growth, and development (considering metamorphosis) in the American toad (Bufo americanus) and in the green frog (Rana clamitans). Concurrent effects on periphyton abundance in the mesocosms were also evaluated. This review focuses on the individual effects of malathion on the reported endpoints.
Eggs were collected from natural populations in Ohio. Forty mesocosms were prepared two-to-four weeks prior to addition of specimens with 1,000 L water, 1 kg leaf litter, and plankton from unidentified natural ponds. Mesh screens were used to exclude predators and colonists. Tadpoles were reared in the laboratory under unspecified conditions at 23-25C and were added to the mesocosms when they were free-swimming (Gosner development stage 25). Prior to pesticide treatment, American toad tadpoles were acclimated for 6 days, and green frog tadpoles were acclimated for 9 days.
Each treatment consisted of five replicates (i.e., mesocosms) with either 60 American toad tadpoles (experiment 1) or 20 green frog tadpoles (experiment 2) per replicate. Negative controls were run concurrently with the study, but solvent controls were not included. Carbaryl (Sevin®, 22.5% a.i., liquid) was added at nominal treatment levels of 0 and 1.75 mg a.i./L by pouring a mixture of 7.8 g formulation/5 L pond water evenly across the mesocosm surface. Additional treatments included malathion (50% a.i., liquid) at nominal concentrations of 0 and 3 mg a.i./L, permethrin (experiment 1: Cutter’s Bug Free Back Yard, 2.5% a.i., liquid; experiment 2: technical, 98% a.i., dissolved in acetone) at nominal concentrations of 0 and 9 µg a.i./L, and combinations of the pesticides using the same individual concentrations. The final concentration of acetone in treatments containing permethrin (experiment 2 only) was 0.0001%.
Concentrations were analytically confirmed in a pooled sample (n=3) for each individual pesticide treatment collected at 1 hour, 24 hours, 48 hours, and 96 hours after treatment in experiment 1 and at 16 hours after treatment in experiment 2. Initial (1-hour) recoveries in experiment 1 were 120% (2.10 mg a.i./L) for carbaryl, 72% (2.16 mg a.i./L) for malathion, and 30% (2.67 µg a.i./L) for permethrin. Recoveries (16-hour) in experiment 2 were 38% (0.66 mg a.i./L) for carbaryl, 70% (2.1 mg a.i./L) for malathion, and 39% (3.5 µg a.i./L) for permethrin. The author calculated a half-life for carbaryl in experiment 1 of 89 hours; 96-hour recovery was approximately 50% of nominal. Dissolved oxygen, pH, and temperature were recorded in mesocosoms at the time that analytical samples were collected.
4
4

Raw data were not provided. Statistical analysis consisted of multivariate analysis of covariance (MANCOVA) using survival as a covariate to control for density-dependent effects. Experiment 1 analyzed mass at and time to metamorphosis, and experiment 2 analyzed Gosner development stage and mass at study termination. Survival to metamorphosis was analyzed independently using ANOVA in experiment 1. Periphyton abundance was analyzed using repeated-measures ANOVA. Data were transformed prior to analysis. The author apparently combined response variables, including time to metamorphosis (experiment 1 only), Gosner development stage, and mass at metamorphosis\study termination, into a single variable termed “metamorphic response.” This review addresses the constituent variables independently.
Malathion exposure at 3 mg a.i./L (nominal) did not significantly affect American toad survival to metamorphosis; however, the larval period (i.e., time to metamorphosis) was longer in American toad tadpoles exposed to malathion. Mass at metamorphosis was significantly (p<0.05) reduced in American toads exposed to both carbaryl (1.75 mg a.i./L, nominal) and malathion, but not in toads exposed only to malathion. Effects of malathion exposure on periphyton abundance in experiment 1 were not reported; however, carbaryl and malathion together had no effect on periphyton abundance.
Malathion exposure at 3 mg a.i./L (nominal) had no significant effects on survival, mass, or Gosner development stage in green frog tadpoles at study termination (day 74). However, statistically significant interactions of carbaryl (1.75 mg a.i./L, nominal) and malathion and of carbaryl, malathion, and permethrin (9 µg a.i./L, nominal) were detected and associated with an increase in development stage at study termination. Periphyton abundance increased significantly (p = 0.0199) in the presence of malathion but not with other treatments.
Description of Use in Document (QUAL, QUAN, INV):Qualitative (QUAL)
Rationale for Use:This study presents useful information for ecological risk assessments regarding the potential effects of malathion on amphibian larvae and community effects on periphyton at environmentally relevant concentrations. Malathion exposure at 3 mg a.i./L (nominal) slightly (approximately 1 day) but statistically significantly increased time to metamorphosis in American toad tadpoles; such an effect is biologically relevant because American toads utilize shallow, ephemeral pools that may dry rapidly (Wilbur 1987), resulting in mortality of unmetamorphosed tadpoles. Malathion exposure alone had no significant effects on growth and development of green frog tadpoles; however, periphyton abundance in experiment 2 was greater in treatments exposed to malathion. Limitations of Study:Nominal concentrations are presented in this review because mean-measured concentrations for experiment 2 cannot be calculated and because the data are insufficient for quantitative use in risk estimation. Confidence in the toxicity values derived from this study is limited because pesticide recoveries were highly variable; it is unclear whether this was a result of degradation and partitioning processes, uneven mixing within the mesocosms, analytical limitations, or inaccurate dosing. No solvent or surfactant controls were included. Raw data were not provided. Experiment 2 was not carried out long enough to assess potential effects of pesticide exposure on metamorphosis; green frog tadpoles may undergo a two-season (i.e., two-year) larval period and the test specimens did not begin to
5
5
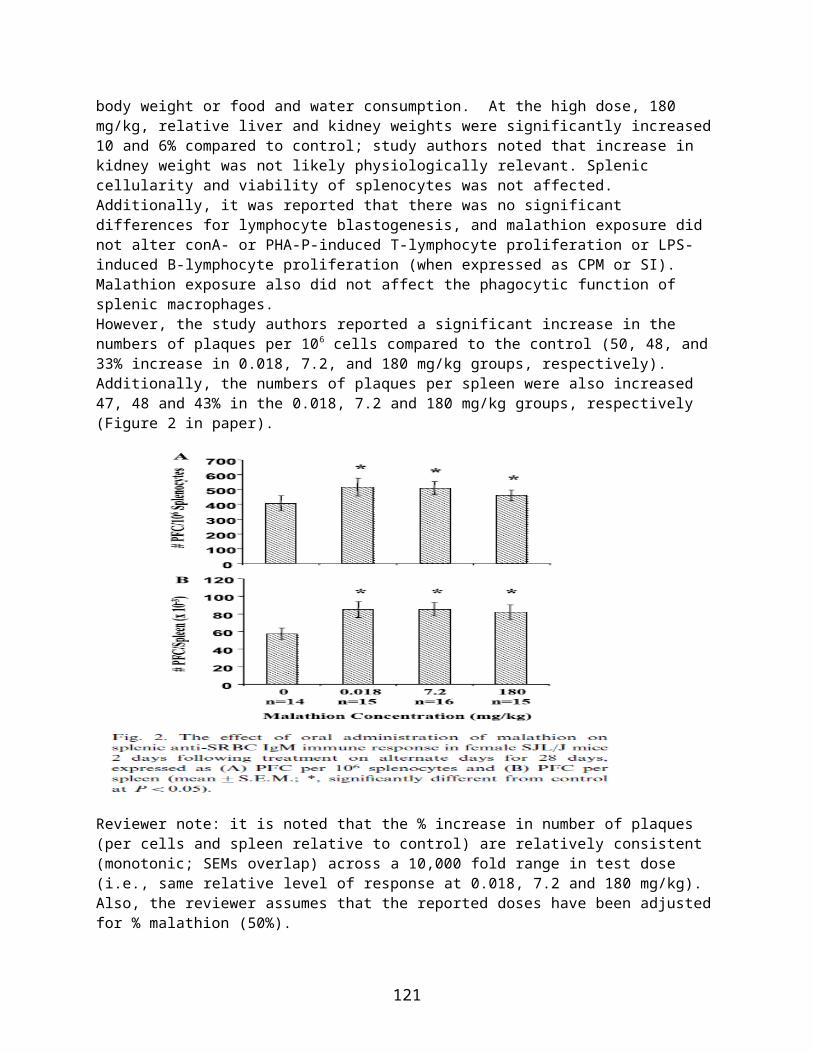
metamorphose by October 9 in the first season. The source waters were not analyzed for chemical contaminants; therefore, it is unknown whether the specimens were pre-exposed to the pesticides used in the treatments. Analytical determinations for the untreated mesocosm water were not reported.
References:Wilbur, H.M. 1987. Regulation of structure in complex systems: Experimental temporary pond communities. Ecology 68: 1437-1452.
Primary Reviewer: Catherine Aubee
6
6
Open Literature Review Summary
Chemical Name: Malathion, chlorpyrifos, and diazinonPC Code: 057701(malathion), 059101 (chlorpyrifos), 057801 (diazinon)ECOTOX Record Number and Citation:Relyea, R. A. 2009. A cocktail of contaminants: how mixtures of pesticides at low concentrations affect aquatic communities. Oecologia 159(2): 363-376. (MRID 48261129). E114296.Purpose of Review:Endangered Species Assessment. Determine potential effects of malathion on an aquatic community. Date of Review:Original review: October 15, 2009; addendum for malathion specific results: February 2, 2015. Diazinon and chlorpyrifos results added November 19, 2015.
Purpose of Study:This study examines the effect of five insecticides (malathion, carbaryl, chlorpyrifos, diazinon, and endosulfan) and five herbicides (glyphosate, atrazine, acetochlor, metolachlor and 2,4-D) at low concentrations on outdoor mesocosms composed of zooplankton, phytoplankton, periphyton, and larval amphibians (gray tree frogs, Hyla versicolor and leopard frogs, Rana pipiens). The pesticides were studied alone, as a mixture of the five herbicides, as a mixture of the five insecticides, and as a mixture of all ten herbicides and insecticides.
Summary of Study Findings:A previous review of this study was conducted with atrazine and is attached to this review for malathion. Below are the malathion and diazinon-specific results.
Table 1 presents the measured concentrations taken one hour after application for each chemical tested. All nominal concentrations were 10 ppb.
Table 1. Measured Concentrations for Each PesticidePesticide Purity Measured concentration
(reported as ppb)Carbaryl 99.5 6.9Malathion 99 5.8Chlorpyrifos 99.5 3.2Diazinon 99.5 2.1Endosulfan 99.3 6.4Acetochlor 98.0 10.0Metolachlor 97.1 7.4Glyphosate 98 6.92,4-D 99 16.0Atrazine 98.8 6.4
There were no effects on survival, mass at metamorphosis, or time to metamorphosis for either species of frog when exposed to malathion or chlorpyrifos only. Malathion alone also did not affect the abundance of phytoplankton, periphyton or zooplankton species: L minutus, S. oregonensis or D. pulex,
7
7
but did significantly reduce abundance of Ceriodaphnia sp. For chlorpyrifos, zooplankton, D. pulex and C. sp. abundance and periphyton biomass were significantly reduced compared to control. For either chemical, there were no significant differences in dissolved oxygen or pH compared to the control. For diazinon, survival and mass at metamorphosis were significantly reduced in leopard frog tadpoles compared to the control; survival was 76% for diazinon compared to 96% in control. No significant differences were observed for gray tree frog tadpoles. When the survival of metamorphs plus all remaining tadpoles that failed to metamorphose whenthe tanks dried were combined (to assess whether the treatments caused the leopard frogs to die during the experiment or simply caused slower growth and development that prevented some of the animals from metamorphosing prior to tank drying), the diazinon treatment was no longer significant compared to the control (p=0.247). Zooplankton, D. pulex and C. sp. abundance and periphyton biomass were significantly reduced compared to control. Dissolved oxygen and pH were also significantly increased on Day 35 compared to the control.
When exposed to the mixture of the five insecticides and all pesticides (10 total), survival of the leopard tadpoles was significantly reduce (99% mortality). For the gray tree frog, there were no significant effects on survival or time to metamorphosis when exposed to the mixture of the five insecticides and all pesticides, but mass at metamorphosis was significantly increased at both treatments. The abundance of all zooplankton species were significantly reduced in the five insecticide and 10 pesticide mixture and S. oregonensis was significantly reduced in the five herbicide mixture. Phytoplankton were not significantly affected when exposed to either the five insecticide or 10 pesticide mixture, but was significantly decreased in the five herbicide mixture on Day 16, but not Day 35. Periphyton was not affect when exposed to the 10 pesticide mixture or on day 35 in the five herbicide mixture, but was significantly decreased on day 16 in the five insecticide mixture treatment (but not on day 35).
Description of Use in Document: Qualitative
Rationale for Use: The study contributes to the weight of evidence regarding the potential for effects of malathion on aquatic communities.
Limitations of Study: The results have good applicability to mesocosms or natural aquatic systems because the experimental mesocosms were outdoors during testing and contained phytoplankton, periphyton, zooplankton, and two species of amphibians. Actual pesticide concentrations were not monitored throughout the experiment, although an initial measured value was reported. Control tanks were not analyzed for malathion and the other nine pesticides tested. Additionally, it is unclear how much ethanol was added to malathion-only treatment tanks.
Primary Reviewer: Amy Blankinship, Chemist, EBR6
8
8
Open Literature Review Summary
Chemical Name: AtrazineCAS No: 1912-24-9
ECOTOX Record Number and Citation:Relyea, R. A. 2009. A cocktail of contaminants: how mixtures of pesticides at low concentrations affect aquatic communities. Oecologia 159(2): 363-376. (MRID 48261129)
Purpose of Review:Determine potential effects of atrazine on an aquatic community. Endpoints from this study contribute to the weight-of-evidence regarding effects of atrazine on aquatic plant communities and associated determination of a Level of Concern (LOC).
Date of Review:October 15, 2009
Purpose of Study:This study examines the effect of five insecticides (malathion, carbaryl, chlorpyrifos, diazinon, and endosulfan) and five herbicides (glyphosate, atrazine, acetochlor, metolachlor and 2,4-D) at low concentrations on outdoor mesocosms composed of zooplankton, phytoplankton, periphyton, and larval amphibians (gray tree frogs, Hyla versicolor and leopard frogs, Rana pipiens). The pesticides were studied alone, as a mixture of the five herbicides, as a mixture of the five insecticides, and as a mixture of all ten herbicides and insecticides.
Summary of Study Findings:The focus of the summary is on the mesocosms treated with atrazine alone.
Methods: The experiment was conducted at the University of Pittsburgh’s Pymatuning Laboratory of Ecology in northwestern Pennsylvania (USA). The experiment used a completely randomized design consisting of 15 treatments with 4 replicates each for a total of 59 experimental tanks (the solvent control consisted of only 3 replicates). The treatments were as follows: a negative control (water), a vehicle control (ethanol), each of the five insecticides applied separately (malathion, carbaryl, chlorpyrifos, diazinon, and endosulfan), each of the five herbicides applied separately (glyphosate, atrazine, acetochlor, metolachlor, and 2,4-D), a mixture of all five herbicides, a mixture of all five insecticides, and a mixture of all ten pesticides.The mesocosms were 1,300-L cattle watering tanks. The tanks were filled (on May 15-19, 2006) with about 1000 L of well water (pH 8). On June 7th, the tanks were supplemented with a mixture of water from nearby ponds which contained zooplankton, phytoplankton, and periphyton. The following day, each tank was further supplemented with 300 g of leaf litter (primarily Quercus spp.) and 25 g of commercial rabbit chow (source of algal nutrients and additional surface for algal growth). On June 16 th, the periphyton samplers were added to each tank in the form of two unglazed clay tiles (10 × 10 cm, oriented vertically). After 18 days (June 25th), the tadpoles were added. The tadpoles were collected for the experiment as newly oviposited egg masses and hatched in 200-L wading pools where they were fed rabbit chow ad libitum until use in the experiment. The time at which each species was oviposited differed (ten masses of leopard frogs, collected on March 31st; 23 masses of gray tree frogs, collected on
9
9
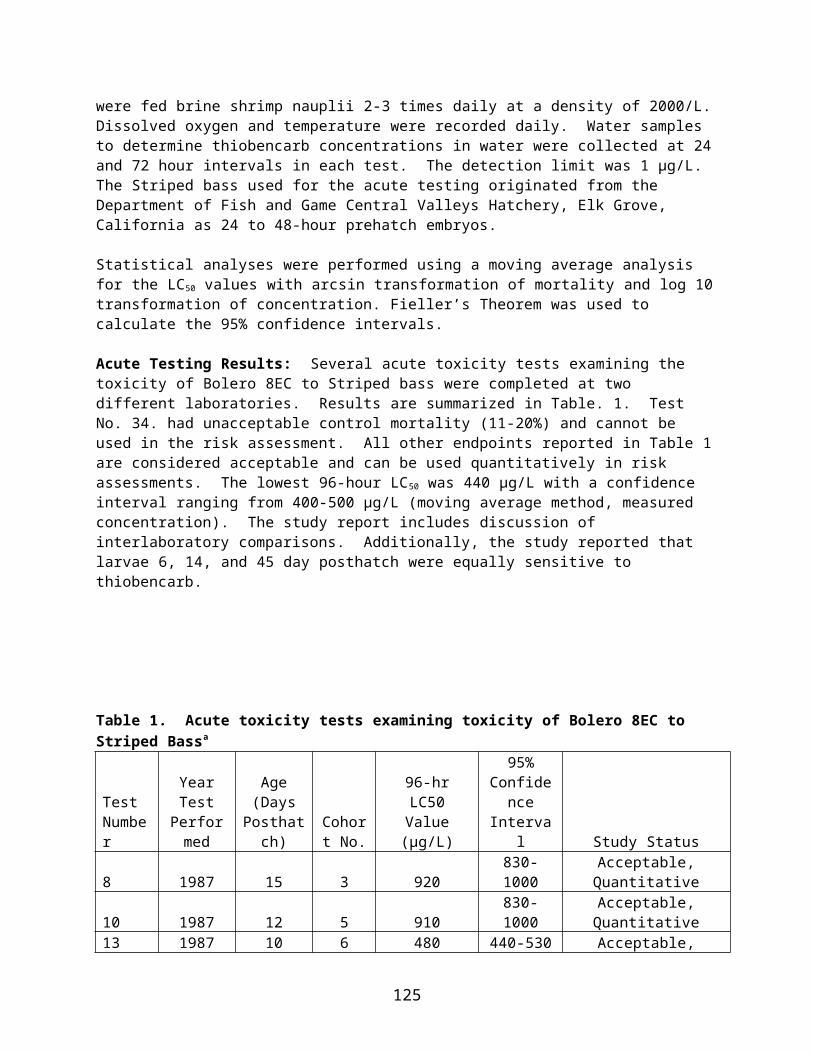
May 14th and 17th), thus the two species were of different ages when added to the experiment. Added to each tank were 20 tadpoles of each species (H. versicolor, and R. pipiens) chosen from a mixture of all egg masses (initial mass ± SE: gray tree frogs, 77 ± 4 mg; leopard frog, 134 ± 12 mg). The density of tadpoles in the experimental tanks was 9/m2 for each species, which was within natural densities for the two species.
Two days after tadpole addition, the tanks were exposed to atrazine (and other treatments) via a single dose of technical grade chemical (chemical purity, 98.1%) at a nominal concentration of 10 µg/L (p.p.b.) using ethanol as the vehicle. Ethanol concentration was 0.003% in the solvent control tanks and the tanks receiving a mixture of all ten pesticides (ethanol concentration in the atrazine-only treatment was not stated). Control tanks without ethanol were also included. Atrazine was added to the tanks and the surface water was mixed with a 500-mL container. One hour later, water samples were collected midway in the water column; samples from the four replicate tanks were pooled and analyzed for atrazine by HPLC. The measured concentration of atrazine was 6.4 µg/L (p.p.b.). The control tanks were not analyzed for any of the ten pesticides. The author states that the well water used for filling the tanks did not have detectable concentrations of any of the pesticides. However, it was not stated if the pond water (biota source) added to the tanks was analyzed for any of the pesticides.
The temperature, pH, and dissolved oxygen in each tank were measured using a digital water meter on days 10 and 35 of the experiment.
On days 16 and 36, the zooplankton was sampled midway in the water column at the four cardinal directions and the center of the tank using a 0.2-L tube sampler. The five samples from each tank were combined, filtered (62-µm Nitex screen), and then preserved in 70% ethanol. The zooplankton was classified to species. Twelve taxonomic groups of cladocerans and copepods were detected. The assemblage was dominated (91%) by four species: two species of cladocerans (Daphnia pulex and Ceriodaphnia sp.) and two species of copepods (Skistodiaptomus oregonensis and Leptodiaptomus minutus). On days 16 and 35, phytoplankton was sampled via collecting 500 mL from the middle of the water column in each tank. The samples were vacuum filtered through a Whatman GF/C filter. Chlorophyll a concentrations were determined by fluorometry after the filtered samples were prepared following the protocols of Arar and Collins 1997 (including acidification).
On days 25 and 36, the periphyton was sampled via scrubbing one side of the unglazed clay tile into a tub of filtered water. After filtration of the slurry (Whatman GF/C filters, pre-dried at 80°C and weighed) the filters were dried (80°C for 24 hours) and reweighed again to determine the biomass of the periphyton.
Metamorphs were removed from the tanks when they had at least one emerged forelimb (stage 42); the gray tree frogs emerged first due to their inherently shorter time to metamorphosis. Daily searches of each tank were conducted starting day 21 (July 17) of the experiment when the first metamorph was observed through day 57 (August 22nd, last day of experiment). After removal, the metamorphs were held in one liter laboratory tubs containing moist sphagnum moss until tail resorption was complete (stage 46). The number of days from the beginning of the experiment to stage 46 was defined as time to metamorphosis. Each animal was euthanized in 2% MS-222, preserved, and weighed. The response variables for the amphibians were percent survival, mean time to metamorphosis, and mean mass at metamorphosis.
10
10

After most of the metamorphs of both species had emerged (determined later to be 97.3% of all live tadpoles), approximately 120 L of water was removed from each tank daily from day 50 to and including day 57 in order to simulate pond drying (and accelerate metamorphosis). On day 57, the tanks were classified as “dry ponds”. The remaining amphibians were classified as dead, non-emergent (due to slow growth and development), or a successful metamorph (possessing at least one emerged forelimb; these were treated as described above).
The response variables were analyzed using multivariate ANOVA (MANOVA). The MANOVA was composed of the second measurements of all abiotic conditions, cladoceran and copepod abundance, phytoplankton abundance (chlorophyll a), periphyton biomass, the survival of gray tree frogs and leopard frogs, and size at and time to metamorphosis of gray tree frogs. The metamorphosis data could not be collect for the leopard frogs in two of the pesticide treatments due to nearly 100% mortality, so the leopard frog history responses were analyzed in a separate MANOVA. Each univariate response variable was examined using either an ANOVA (for responses that were measured at the end of the experiment: tree frog mass, tree frog time to metamorphosis, tree frog survival and leopard frog survival) or a repeated-measures ANOVA ( for responses measured twice during the experiment: temperature, dissolved oxygen, pH, the abundance of cladocerans (D. pulex and Ceriodaphnia sp.), the abundance of copepods (S. oregonesis and L. minutus), phytoplankton (chlorophyll a) and periphyton biomass. The data was log-transformed when necessary. The zooplankton data was ranked prior to analysis since it had heteroscedastic errors. The multivariate analyses controlled the experiment-wise error rate at α = 0.05. To maximize the power of the analyses, post hoc comparisons were conducted using Fisher’s LSD test which preserves the comparison-wise error rate at α = 0.05.
Results: The MANOVA on all final response variables (excluding the two life history traits of leopard frogs) revealed a significant effect of the treatments (Wilks’ λ, F182,313 = 2.5, P < 0.001); therefore, the ANOVA analyses were conduct for each response. These analyses were not specific to atrazine-only treatments and will not be discussed further.
AmphibiansFor leopard frog tadpoles (R. pipiens), there was not a significant difference (P > 0.05 using Fisher’s LSD test) between the atrazine treatment and the no-pesticide treatments (i.e. negative and ethanol control tanks) regarding survival to metamorphosis, mass at metamorphosis, and time to metamorphosis (Figure 1). For gray tree frog tadpoles (H. versicolor), there was not a significant difference between the atrazine treatment and the no-pesticide treatments (P > 0.05 using Fisher’s LSD test) regarding survival to metamorphosis and time to metamorphosis (Figure 2). However, for mass at metamorphosis, gray tree frogs were larger in tanks treated with atrazine compared to those in the negative and ethanol control tanks (P = 0.045).
11
11

Figure 1. Changes in the (a) survival, (b) mass at metamorphosis, and (c) time to metamorphosis of leopard frog tadpoles (Rana pipiens) in outdoor mesocosms exposed to no pesticides (control), solvent only (ethanol), five separate insecticides (I) (carbaryl, malathion, chlorpyrifos, diazinon, and endosulfan), five separate herbicides (H) (acetochlor, metolachlor, glyphosate, 2,4-D, and atrazine), a mixture of the five insecticides, a mixture of the five herbicides, and a mixture of all ten pesticides. In two of the treatments, there were no life history data (ND) due to a lack of surviving animals. Data are mean ± 1 SE. Asterisks indicate treatments that are significantly different from the no-pesticide treatment (P < 0.05 using Fisher’s LSD test). Figure 1 from Relyea 2009.
12
12

Figure 2. Changes in the (a) survival, (b) mass at metamorphosis, and (c) time to metamorphosis of gray tree frog tadpoles (Hyla versicolor) in outdoor mesocosms exposed to no pesticides (control), solvent only (ethanol), five separate insecticides, five separate herbicides, and a mixture of all ten pesticides. Data are mean ± 1 SE. Asterisks indicate treatments that are significantly different from the no-pesticide treatment (P < 0.05 using Fisher’s LSD test). For abbreviations, see Figure 1. Figure 2 from Relyea 2009.
ZooplanktonThe abundance of the four species which dominated (91%) the zooplankton was quantified: two species of cladocerans (D. pulex and Ceriodaphnia sp.) and two species of copepods (S. oregonensis and L. minutus). There was no effect from the atrazine treatment (P > 0.05 using Fisher’s LSD test) relative to the control regarding the abundance of these species (Figure 3).
13
13

Figure 3. Changes in the abundance of copepods [(a) Leptodiaptomus minutus and (b) Skistodiaptomus oregonensis] and cladocerans [(c) Ceriodaphnia sp. and (d) Daphnia pulex] in outdoor mesocosms exposed to no pesticides (control), solvent only (ethanol), five separate insecticides, five separate herbicides, and a mixture of all ten pesticides. Data are mean ± 1 SE, averaged over two sample periods (day 16 and 36), on a log scale. Asterisks indicate treatments that are significantly different from the no-pesticide treatment (P < 0.05 using Fisher’s LSD test). For abbreviations, see Figure 1. Figure 3 from Relyea 2009.
Phytoplankton and PeriphytonFor chlorophyll a (phytoplankton) measured on days 16 and 35, there was not a significant difference between the atrazine treatment and the no-pesticide treatments (P > 0.05 using Fisher’s LSD test). For periphyton biomass measured on days 25 and 36, there was not a significant difference between the atrazine treatment and the no-pesticide treatment (P > 0.05 using Fisher’s LSD test). Phytoplankton and periphyton results are illustrated in Figure 4.
14
14

Figure 4. The abundance of (a) phytoplankton (measured as chlorophyll a concentration) and (b) periphyton (measured as dry biomass on a clay tile) over time in outdoor mesocosms exposed to no pesticides (control), solvent only (ethanol), five separate insecticides, five separate herbicides, and a mixture of all ten pesticides. Data are mean ± 1 SE on a log scale. Within each sample date, asterisks indicate treatments that are significantly different from the no-pesticide treatment (P < 0.05 using Fisher’s LSD test). For abbreviations, see Figure 1. Figure 4 from Relyea 2009.
Abiotic EffectsTank water pH and dissolved oxygen were measured on days 10 and 35. There was not a significant difference between the atrazine treatment and the negative control (P > 0.05 using Fisher’s LSD test) for either pH or dissolved oxygen on either date (Figure 5). The ethanol control differed from the negative control on day 10 for both pH and dissolved oxygen but was similar to the negative control on day 35.
15
15

Figure 5. Changes in (a) pH and (b) dissolved oxygen over time in outdoor mesocosms exposed to no pesticides (control), solvent only (ethanol), five separate insecticides, five separate herbicides, and a mixture of all ten pesticides. Data are mean ± 1 SE. Within each sample date, asterisks indicate treatments that are significantly different from the no-pesticide treatment (P < 0.05 using Fisher’s LSD test). For abbreviations, see Figure 1. Figure 5 from Relyea 2009.
Overall Results Overall, based on the results of the study, the study author concluded that atrazine had no significant effect (P > 0.05 using Fisher’s LSD test) on the biomass of any of the trophic groups monitored in this outdoor mesocosm experiment. The only significant effect of atrazine treatment which was observed was the increase in mass at metamorphosis for gray tree frog tadpoles (P = 0.045). The study author reported that the mechanism for this effect was unclear. The overall effects of the controls and atrazine treatments on biomass of trophic groups in the food web are qualitatively illustrated in Figure 6.
16
16

Figure 6. Changes in biomass of trophic groups in the food web as a result of exposure to (a) no pesticide (control), (b) solvent control (ethanol) and (i) atrazine. The size of the circle and font for each trophic group indicates the qualitative change in the biomass of that trophic group. R Basal resources for the two types of algae. Figure 6 from Relyea 2009.
17
17

Data Summary Table:
EffectMagnitude of Effect relative to controls
Nominal Atrazine Concen-tration (µg/L)1
Day of Study Effect Occurred
Time Weighted Average Atrazine Concentration from Day 0 to When Effect Occurred
Did Recovery Occur – if so, when?
Comments
Chlorophyll a – phytoplankton No effect 6.4 µg/L Days 16 and
35Not applicable
Not applicable P > 0.05
Biomass – periphyton No effect 6.4 µg/L Days 25 and
36Not applicable
Not applicable P > 0.05
Dissolved oxygen No effect 6.4 µg/L Days 10 and
35Not applicable
Not applicable P > 0.05
Survival to metamorphosis – R. pipiens
No effect 6.4 µg/L
Varied, depending on tadpole emergence
Not applicable
Not applicable P > 0.05
Mass at metamorphosis – R. pipiens
No effect 6.4 µg/L
Varied, depending on tadpole emergence
Not applicable
Not applicable P > 0.05
Time to metamorphosis – R. pipiens
No effect 6.4 µg/L
Varied, depending on tadpole emergence
Not applicable
Not applicable P > 0.05
Survival to metamorphosis – H. versicolor
No effect 6.4 µg/L
Varied, depending on tadpole emergence
Not applicable
Not applicable P > 0.05
Mass at metamorphosis – H. versicolor
~23% increase 6.4 µg/L
Varied, depending on tadpole emergence
Could not be determined.
Could not be determined.
P = 0.045
Time to metamorphosis – H. versicolor
No effect 6.4 µg/L
Varied, depending on tadpole emergence
Not applicable
Not applicable P > 0.05
L. minutus abundance No effect 6.4 µg/L Days 16 and
362Not applicable
Not applicable P > 0.05
S. oregonensis abundance No effect 6.4 µg/L Days 16 and
362Not applicable
Not applicable P > 0.05
Ceriodaphnia sp. abundance No effect 6.4 µg/L Days 16 and
362Not applicable
Not applicable P > 0.05
D. pulex No effect 6.4 µg/L Days 16 and Not Not P > 0.05
18
18
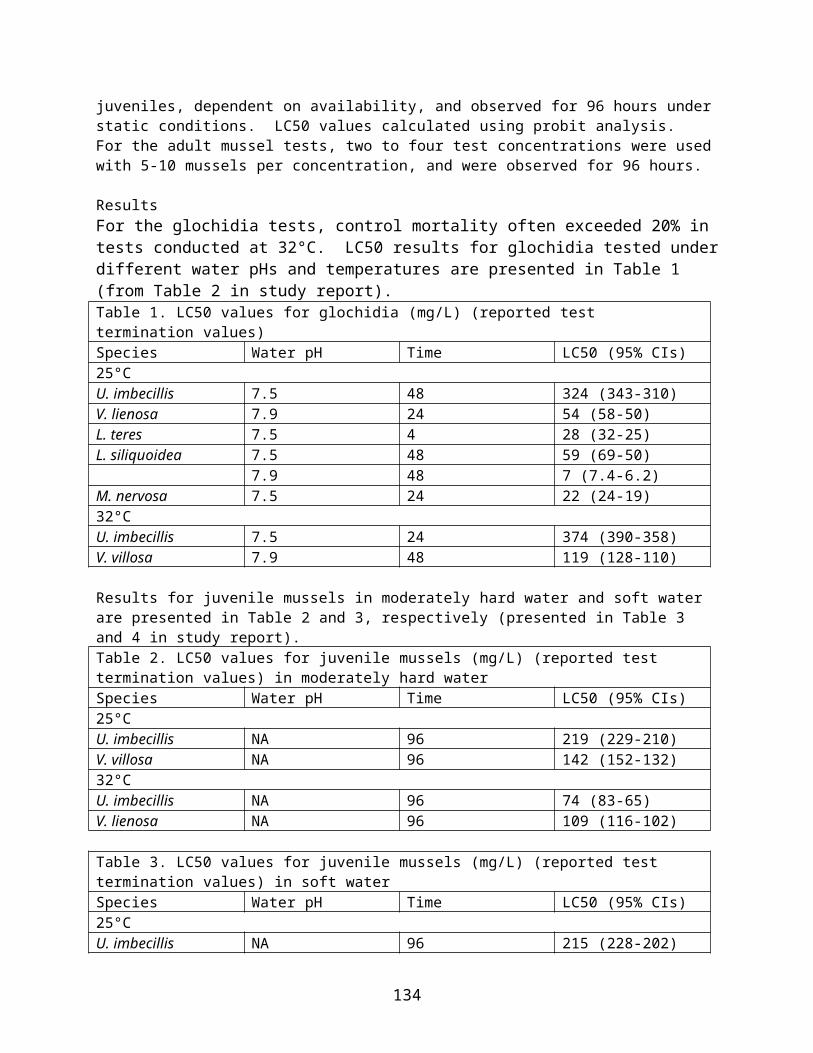
EffectMagnitude of Effect relative to controls
Nominal Atrazine Concen-tration (µg/L)1
Day of Study Effect Occurred
Time Weighted Average Atrazine Concentration from Day 0 to When Effect Occurred
Did Recovery Occur – if so, when?
Comments
abundance 362 applicable applicable1 Nominal concentration was 10 µg/L. Actual concentration (6.4 µg/L) was measured 1 hour after application.2 Data analyzed was the average zooplankton abundance over two sampling dates (days 16 and 36).
Reviewer Comments: No measurements were made to determine if atrazine and the other nine pesticides were present in the control tanks. The author states that the well water used for filling the tanks did not have detectable concentrations of any of the pesticides used in the study, although the data or time at which it was analyzed was not reported. In addition, it was not stated if there was chemical analysis for any of the pesticides in the pond water which was added to the tanks as the source of the planktonic biota.
The author reports that the concentration of ethanol was 0.003% in the solvent control tanks and the tanks receiving a mixture of all ten pesticides but does not report if the concentration of ethanol in the atrazine-only treatment was also 0.003%.
Description of Use in Document: Qualitative
Rationale for Use: The study contributes to the weight of evidence regarding the potential for effects of atrazine on aquatic plant communities.
Limitations of Study: The results have good applicability to mesocosms or natural aquatic systems because the experimental mesocosms were outdoors during testing and contained phytoplankton, periphyton, zooplankton, and two species of amphibians. Actual pesticide (atrazine) concentrations were not monitored throughout the experiment, although an initial measured value was reported. Control tanks were not analyzed for atrazine and the other nine pesticides tested. Additionally, it is unclear how much ethanol was added to atrazine-only treatment tanks.
Primary Reviewer: Lisa Muto, M.S., Staff Scientist, Cambridge Environmental Inc
Secondary Reviewer: Michael Lowit, Ph.D., Ecologist, EPA
Tertiary Reviewer: Anita Pease, M.S., Senior Biologist, EPA
19
19

Data Evaluation Record
MALATHION; CYPERMETHRINPC Codes 057701; 109704
EPA Contract No. EP10H001452Task Assignment No. 4-14-2014
Study Type: Non-Guideline
Citation: Nataraj, M.B. and Krishnamurthy, S.V. (2012). Effects of Combinations of Malathion and Cypermethrin on Survivability and Time of Metamorphosis of Tadpoles of Indian Cricket Frog (Fejervarya limnocharis). Journal of Environmental Science and Health. 47:67-73.
Prepared forEnvironmental Fate and Effects DivisionOffice of Pesticide ProgramsU.S. Environmental Protection AgencyOne Potomac Yard 2777 S. Crystal DriveArlington, VA 22202
Prepared byDynamac Corporation1910 Sedwick Road, Building 100, Suite BDurham, NC 27713
Primary ReviewerRebecca L. Bryan, B.S. Signature:
Date: 1/23/2014Secondary ReviewerDavid A. McEwen, B.S. Signature:
Date: 1/27/2014Program Manager:Jack D. Early, M.S. Signature:
Date: 2/4/2014
Disclaimer
This Data Evaluation Record may have been altered by the Environmental Fate and Effects Division subsequent to signing by Dynamac Corporation personnel. EPA Primary Reviewer: Amy Blankinship Date: ___5/15__________EPA Secondary Reviewer: Date: _____________
20
20

Data Evaluation Record
ECOTOX Code: E158899
STUDY TYPE: Non-Guideline
DP BARCODE: NA
PC CODES: 057701; 109704
CAS NOs.: 121-75-5; 52315-07-8
MRID NO.: NA
TEST MATERIAL (% purity): Malathion (50% ai) and Cypermethrin (25% ai)
CITATION: Nataraj, M.B. and Krishnamurthy, S.V. (2012). Effects of Combinations of Malathion and Cypermethrin on Survivability and Time of Metamorphosis of Tadpoles of Indian Cricket Frog (Fejervarya limnocharis). Journal of Environmental Science and Health. 47:67-73.
SPONSOR: NA
EXECUTIVE SUMMARY: The study examined the influence of malathion and cypermethrin on the survivability and time of metamorphosis of tadpoles of the common paddy field frog, Fejervarya limnocharis. The test concentrations were environmentally realistic for use in rice paddy fields. The test was conducted under laboratory conditions that simulated the natural habitat of F. limnocharis.
Methods: The test animals, F. limnocharis, were collected from paddy fields as several egg masses (>25 spawns) from different individual frogs, and the eggs were about to hatch. The paddy fields were located in Belandur village, Sringeri Taluk, Karnataka State, India (13°25’43” to 13°25’46” N, 75°14’26” to 75°14’30” E; altitude: 648 m asl). The egg masses were transported to laboratory in polythene containers, and then incubated in aged tap water at 20-23°C until hatch. The tadpoles were maintained in same tub until they reached Stage 25 and later for use in testing. Tadpoles from different egg masses were pooled randomly for use in the test. The fully 3x3 factorial tests were conducted with 0, 25, and 50 µg/L concentrations of cypermethrin and 0, 250, and 500 µg/L concentrations of malathion. The test solutions were renewed once every 6 days during the test. Based on 20 randomly selected tadpoles at test start, the mean total length was 13.8 ± 1.36 mm, and the mean body weight was 0.028 ± 0.006 g. Each treatment group used two simultaneous replicates each that contained 20 tadpoles. The inert circular polythene test containers (18 cm height, 24 cm radius) were filled with 10 L of water. For each 10 L of aged tap water, 250 mL of plankton concentration from 20 L of habitat water was inoculated as food and provided every 6 days during the study. The test was conducted at 12 hours light:12 hours dark photoperiod. Commercial grade malathion AI 50% from Insecticides Limited (Rajasthan, India) and cypermethrin AI 25% from Pioneer Pesticide Private Limited, J&K (India) were used for testing.
Mortality was recorded daily until the hind limbs appeared in surviving tadpoles. The time required for the emergence of surviving tadpoles as metamorph was recorded until Day 145.
21
21

Statistical analyses were performed on replicate means with significance determined at p<0.05. Data were examined for conformity with the assumption of parametric tests prior to analyses. Analyses of variance (ANOVA) was used to analyze the differences among treatment groups for survivorship and time of emergence data. The median emergence periods for the froglets in each treatment group are presented using box plots. All statistical analyses were conducted using SPSS version 16 software.
Results (EDSP List 1 Chemicals): The 56-day survivability for tadpoles treated with malathion and cypermethrin are presented in Fig 1 and Fig 2 (copied without alteration from Nataraj et al. 2012). For malathion, the differences in average survivability over the 56 days were marginally significant (p = 0.076) for the two treatment groups (95.94-96.25%) compared to the control (98.75%) [however, it does not appears that a pair-wise comparison between control and each treatment to determine which, if any, specific test treatment was statistically different was conducted (same for cypermethrin)].
For cypermethrin, average survivability was 69.38 and 53.44% in the 25 and 50 µg/L groups, respectively. The average survivability reductions for both cypermethrin treatment groups were highly significant (p < 0.001) compared to the control.
22
22
The survivability effects on tadpoles treated with combinations of malathion and cypermethrin are presented in Fig. 3 (copied without alteration from Nataraj et al. 2012). The survivability from the four combination treatments was reduced compared to the malathion only treatments. Based on combination treatments, a statistically significant reduction in survivability of 19.89% was observed at the constant 25 µg/L cypermethrin concentration with increasing malathion concentrations. For combinations using 50 µg/L cypermethrin and increasing malathion concentrations, the survivability reduction was significant at 71.33%.
23
23

On Day 145, the test was terminated when >80% of tadpoles in the controls had metamorphosed into froglets. The percent of survival, proportion of un-emerged tadpoles, and proportion of froglets emerged are presented in Table 1 (copied without alteration from Nataraj et al. 2012). The median time of emergence of tadpoles is presented as boxplot in Fig 4. (copied without alteration from Nataraj et al. 2012). For all treated groups excluding the 250 µg/L malathion, the metamorphosis of tadpoles into froglets was delayed and extended up to 130th day and only 20-45% of the surviving tadpoles emerged as froglets.
24
24

Conclusions (EDSP List 1 Chemicals): The study author concluded the sublethal and environmentally realistic concentrations of malathion and cypermethrin reduces survivability and prolongs metamorphosis of surviving tadpoles. This can result in long term consequences on frog populations.
Classification (EDSP List 1 Chemicals): Given that the test compounds were formulations, they were not used in the Weight of Evidence for either chemical.
Other Risk Assessments:
The study is of sufficient quality to include qualitatively in the risk assessment. The test methods and statistical analyses were described adequately for this article to be used descriptively in the risk assessment. However, the following study limitations prevent the article from being classified quantitatively:
The individual raw data for test endpoints were not provided. No contaminant testing information was provided for the rice paddies where animals were
collected for testing or for the test water.
25
25

Open Literature Review Summary
Chemical Name (CAS #): diazinon (333-41-5), malathion (121-75-5)
ECOTOX Record Number: 38642Citation: Sauter, E.A. and Steele, E.E. 1972. The effect of low level pesticide feeding on the fertility and hatchability of chicken eggs. Poult. Sci. 51, p. 71-75.
Purpose of Review: Pilot risk assessments for interim endangered species risk assessment method
Date of Review: 2/2/15
Summary of Study Findings:Female white leghorn chickens were exposed to diazinon via the diet at concentrations of 0.1, 1.0 and 10.0 ppm. Separate birds were also exposed to malathion at the same test concentrations.Feed was prepared using wettable powders (containing either 4% diazinon or 5% malathion). Each test concentration included 8 individuals. Hens were exposed for a period of 10 weeks. During that time, they were kept in individual laying cages housed within a building with ventilation (temperature 18-31oC). Hens were fed a commercial breeder ration that did not contain detectable residues of pesticides (specific pesticides included in analysis were not identified). Hens were artificially inseminated by semen pooled from 10 unexposed males twice per week. Prior to exposure, eggs from two hatches were collected to determine fertility and hatchability. Endpoints included egg production, fertility, hatchability, number of chicks hatched per hen (referred to by study authors as “reproductive efficiency”), embryonic mortality and shell thickness. The study author’s results for diazinon, malathion and the controls (during the pesticide exposure period) are provided in the tables below.
Table 1. Endpoints reported by study authors for diazinon exposure. Endpoint Control 0.1 ppm 1.0 ppm 10.0 ppm% fertile eggs 94.1 87.1* 86.4* 84.1*# chicks hatched/hen 100 79.1* 72.3* 70.9*Embryo mortality (% of fertile eggs) 3.8 7.8 7.9 9.5Shell thickness (mm) 0.34 0.34 0.33 0.33% egg production 79.8 67.8* 68.0* 65.8*
*Based on study author results, value is statistically significant compared to control.
Table 2. Endpoints reported by study authors for malathion exposure. Endpoint Control 0.1 ppm 1.0 ppm 10.0 ppm% fertile eggs 94.1 93.6 85.4* 81.6*# chicks hatched/hen 100 96.5 75.8* 73.4*Embryo mortality (% of fertile eggs) 3.8 3.7 9.5 12.6*Shell thickness (mm) 0.34 0.35 0.34 0.34% egg production 79.8 70.7* 70.7* 67.1*
*Based on study author results, value is statistically significant compared to control.
For diazinon, the study authors reported statistically significant effects to all test concentrations for percent hatchability of fertilized eggs, number of chicks hatched per hen and percent egg production.
26
26

Therefore the LOAEC is 0.1 ppm. No NOAEC was established. For malathion, statistically significant declines in percent egg production were reported at all test concentrations, resulting in a LOAEC of 0.1 ppm. Again, no NOAEC was established.
Description of Use in Document (QUAL, QUAN, INV): Qualitative
Rationale for Use: This study is considered scientifically valid; however, the results have considerable uncertainties due to the limitations provided below. The results of this study may be used in a weight of evidence approach, however, this study should not be used to derive chronic thresholds or risk quotients.
Limitations of Study:Major limitations that impacted study classification:
1) There is uncertainty associated with the nature of the test material due to a limited description. The study indicates that wettable powders containing 4% diazinon and 5% malathion were used; however, the specific formulations were not identified. It is unknown whether or not these formulations are representative of current formulations or would be expected to have an increased toxicity relative to the technical grade active ingredients.
2) The control and treatment birds were maintained separate buildings. This calls into question whether the controls were adequate, since they may have been exposed to different conditions compared to the treatments.
3) Only 8 replicates were used, which limits the certainty associated with the study results. A higher number of replicates is desired in order to improve the power of the test. For instance, standard avian reproduction studies typically include 16 replicates.
4) Because the study authors reported statistically significant effects for all test concentrations, a NOAEC could not be established for diazinon or malathion.
5) The statistical method used to determine significance of results was not included in the article.
6) The reported results are presented as mean values. The variability associated with the results is not included.
Other limitations of note:1) Only female adult chickens were exposed to pesticides. Impacts of the test material on
males and resulting effects to reproduction are not captured in the study design. 2) There is uncertainty associated with how representative domesticated chickens are for
wild birds. Standard toxicity studies are required for phenotypically wild species; which does not apply to chickens.
3) No mention was made of randomization of test birds. 4) Since raw data were not provided and variability was not included, reviewer could not
confirm study author’s statistical analysis.
Reviewer comments:The reviewer assumed that each treatment included 8 birds. This is based on the study author’s statement that the study included 96 birds to study effects of diazinon, DDT, lindane or malathion. Since each chemical had three separate exposure concentrations, an equal distribution of birds among the treatment groups would result in 8 birds per treatment. The study authors do not indicate how many birds were included in the control.
27
27

This review does not consider the reported results for DDT or lindane.
The reviewer assumes that the units reported as “ppm” are equivalent to mg a.i./kg-food.
Primary Reviewer: Kristina Garber, Senior Science Advisor, ERB1
Secondary Reviewer: Elizabeth Donovan, Biologist, ERB6
28
28

Open Literature Review Summary
Chemical Name: Malathion,
PC Code: 057701(malathion)
ECOTOX Record Number and Citation:65887. Behavioral dysfunctions correlate to altered physiology in rainbow trout (Oncorynchus mykiss) exposed to cholinesterase-inhibiting chemicals. 2001. Arch. Environ. Contam. Toxicol. 40, 70-76.
Purpose of Review:Endangered Species Assessment.
Date of Review:November 19, 2015.
Summary of Study Findings:
Both malathion and diazinon were tested in this study. This review focuses on malathion.
Methods
Fingerling rainbow trout (O. mykiss) were exposed to two concentrations of malathion (20 and 40 µg/L; ≥98% purity) under static-renewal conditions (partial renewal daily) for either 24 or 96 hours. Fish were obtained as embryos from U.S. Fish and Wildlife Service (Ennis, MT) and maintained in the lab at 10 or 18°C and acclimated to 15°C before testing. An acetone control group (<1%) was added. Thirty fish were added per replicate (15L test solution in 80L glass aquaria), and three replicates were used per concentration. Water quality parameters such as dissolved oxygen, conductivity, hardness, pH and alkalinity were measured and were found to be within acceptable ranges (per USEPA 1975, ASTM 1994). After 24 and 96 hours, 10 fish were removed for behavior and biochemistry evaluation. The remaining 10 fish were placed into clean water for a 48-hr recovery period and then sampled. Behavioral evaluations were conducted using aquaria fitted with a 20-cm PVC circular chamber with blue vinyl outside of the tank for contrast. Fish were allowed to acclimate for 30 minutes and then videotaped for 2 minutes. After swimming fish were euthanized and brain cholinesterase was measured. Behavioral endpoints measured included: total distance swam, average instantaneous speed, rate of turning and tortuosity of path, and movements were analyzed using computer-assisted digital image analysis.
Results
There were no mortality observed in the control, and mortality less than 12% per treatment were observed for malathion. After 24-hours there were significant (using unprotected LSD test) decreases in swimming speed and distance. However, after 48 hour recovery, there were no differences in either treatment group compared to control (fish at 40 µg/L were also showing signs of recovery after 96 hours of exposure) (Figure 2 in paper (figure titles 1 and 2, inadvertently switched in paper)). Turning rate was marginally significant at both concentrations (p=0.06 for 20 and p=0.07 for 40 µg/L), and tortuosity at 24 hours was significant at both concentrations. However, at 96 hours and after 48 hours recovery, there was no difference. A high correlation was observed between brain ChE and swimming speed and
29
29

distance. There was also a negative correlation between brain ChE and turning rate and the correlation was weakest for tortuosity.
Description of Use in Document: Quantitative for behavioral line of evidence in ESA risk assessment.
30
30
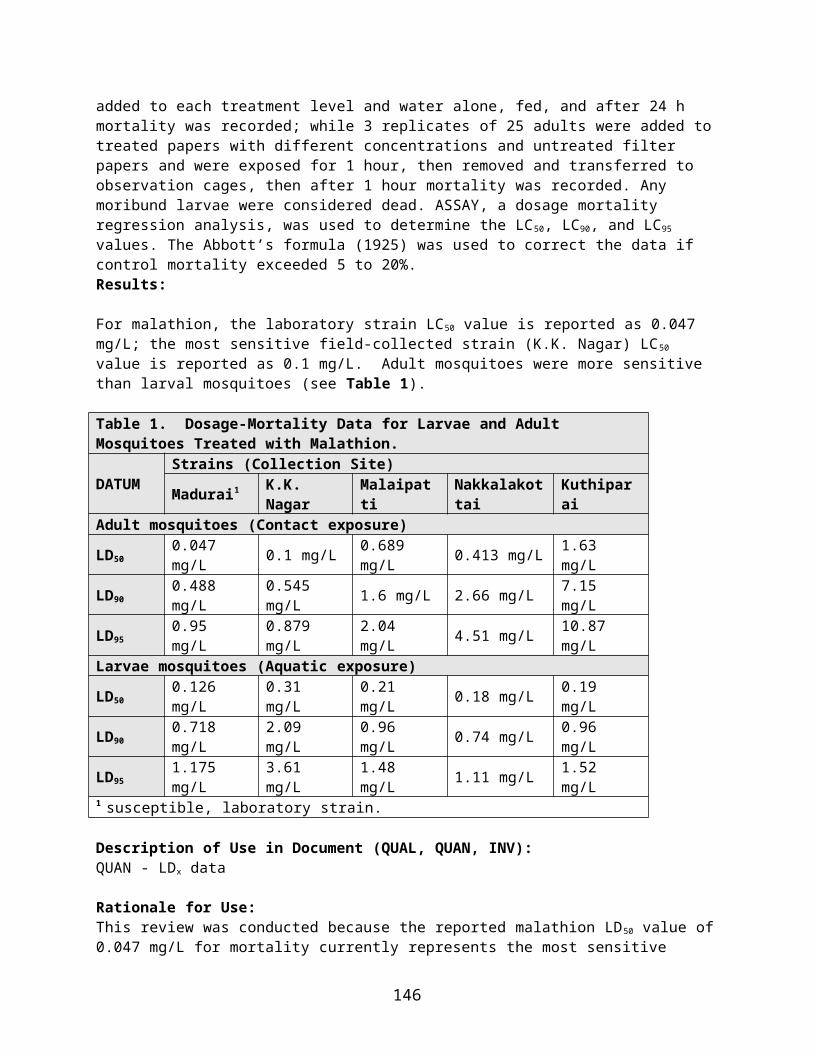
Rationale for Use: Study appears to be of sufficient quality to characterize behavioral effects (swimming) after exposure to malathion.
Limitations of Study:
A negative control group was not used, with the test only containing a solvent control. Test solutions were not measured, nominal concentrations were used. It is noted that the behavioral responses regarding recovery did not exhibit a concentration
response as the fish in the lower concentration took longer to show signs of recovery compared to the higher treatment.
Primary Reviewer: Amy Blankinship, Chemist, EBR6
31
31