chemical, spectral and morphological …
TRANSCRIPT
CHEMISTRY & CHEMICAL TECHNOLOGY
Chem. Chem. Technol., 2020, Chemical
Vol. 14, No. 3, pp. 353–361 Technology
CHEMICAL, SPECTRAL AND MORPHOLOGICAL CHARACTERIZATION OF HUMIC ACIDS EXTRACTED
AND MEMBRANE PURIFIED FROM LIGNITE
Ehsan Sarlaki1, *, Ali Sharif Paghaleh1, Mohammad Hossein Kianmehr1, Keyvan Asefpour Vakilian1
https://doi.org/10.23939/chcht14.03.353 Abstract.1 In this study, humic substances were extracted from lignite of Zarand coalfields, Kerman, Iran, using a stirred batch reactor. A membrane ultrafiltration system was used to purify humic acids (HAs) from lignite-derived alkaline extracts obtained from the reactor. Gravimetric analysis along with several analytical methods including CHNOS, UV-Vis, FT-IR, ICP-OES and SEM were utilized to investigate the characteristics of the purified HAs. Gravimetric analysis showed that the purity of HA purified from membrane concentrated humates was higher than 95 %. CHNOS elemental analysis indicated the higher stability and condensation degree of the purified HA compared to the commercially available HAs. The ratios of E4/E6, E2/E3, and ΔlogK obtained from UV-Visible spectroscopy revealed that a purified HA had a higher molecular weight, aromaticity, and humification degree in comparison with commercial HAs. Furthermore, the peaks observed in the FT-IR analysis showed that HA had an aromatic structure. The very low concentrations of heavy metals and inorganic element contaminants observed by ICP-OES spectrometry showed a proper performance of the HA membrane purification. These results along with the results of SEM analysis showed the acceptable characteristics of purified HA from the lignite coal for agricultural and industrial applications.
Keywords: ICP-OES, humic acid, lignite, membrane, FT-IR, SEM.
1. Introduction
Humic acids (HAs) are biopolymer, amorphous, colloidal and polydispersed aromatic macromolecules which contain complex structures resulting from chemical and biological degradation and transformation 1 Department of Agrotechnology, College of Abouraihan, University of Tehran, Tehran, Iran * [email protected] Sarlaki E., Sharif Paghaleh A., Kianmehr M. H., Asefpour Vakilian K., 2020
of plants, animal residues and microbial cells [1-2]. HA is the predominant fraction of humic substances (HSs) and is soluble in alkaline medium and insoluble in acidic solutions (pH < 2). They are characterized by high molecular weight compounds ranging from 5 to 500 kDa. HA is a valuable source for a wide variety of products which have potential use in various appli-cations such as agriculture, pharmaceutical/biomedi-cine, chemistry/electrochemistry and so on [3-5]. HAs can be found in various resources such as soils, natural waters, sapropels, rivers and lakes sediments, peat, composts and low rank coals. Low rank coals such as lignite, brown coal and leonardite, are known as the rich resources of HAs.
Studies have shown that low rank coals have reasonable concentrations of HAs(70% (w.t.)) which can be effectively utilized as organic inputs or biostimulants to improve agricultural production [6-7]. It has been reported that the percentage of HAs in low rank coals, peat, sapropel peat, brown coal, compost and sludge is approximately 40–85, 10–40, 10–20, 10–30, 2–5, and 1–5 %, respectively [8-11]. Moreover, the origin, rank and source of HAs are the main parameters to obtain high yield and pure HAs [12]. Iranian coal reserves are estimated to be about 7–10 Gt. Most of the coal deposits occur in two main basins in Iran, one in the northern Alborz basin and another in the central Kerman basin. The coal in central Kerman basin is estimated to be around 1.3 Gt [13]. The quality of the Kerman coalfields may be categorized as lignite to bituminous and sub-bituminous ranks. Extracting and utilizing HAs from low rank coals is a challenging task [14-15]. Alkaline extraction of HAs from low rank coals is widely used in industrial scale due to its significant extraction yield. NaOH and KOH are commonly used as alkaline solvents in the alkaline extraction process [16].Characterization of HAs requires several analytical methods. CHNOS elemental analysis is one of the necessary analytical experiments in quality determination of HAs. The O/C, H/C and C/N atomic ratios can be used to indicate the organic matter (OM) source, the degree of condensation,
Chemical, Spectral and Morphological Characterization of Humic Acids Extracted and Membrane…
354
and the environmental conditions under which HSs have been generated [9]. UV-Visible (UV-Vis) spectroscopy can provide useful information about the composition and origin of HAs. The (E4/E6) ratio and the ΔlogK coefficient have proven to be useful to evaluate the degree of humification of HAs extracted from different sources [17-19]. Fourier transform infrared (FT-IR) spectroscopy provides useful insight into the nature, reactivity and structural arrangement of oxygen-containing functional groups in HAs [20]. Scanning electron microscopy (SEM) has been widely used to investigate the microstructure of HAs, and their associations with inorganic material [10].
The objectives of this study are: (i) extraction of humic alkaline extracts from lignite coals of Zarand coalfields, Kerman, Iran, using a batch stirred tank reactor; (ii) purification of reactor obtained products using across-flow membrane ultrafiltration system; and (iii) to investigate the characteristics of the purified HA from membrane concentrated humates using CHNOS, UV-Vis, FT-IR, SEM, and inductively coupled plasma-optical emission spectrometry (ICP-OES) analysis.
2. Experimental
2.1. Chemicals and Origin of Coals
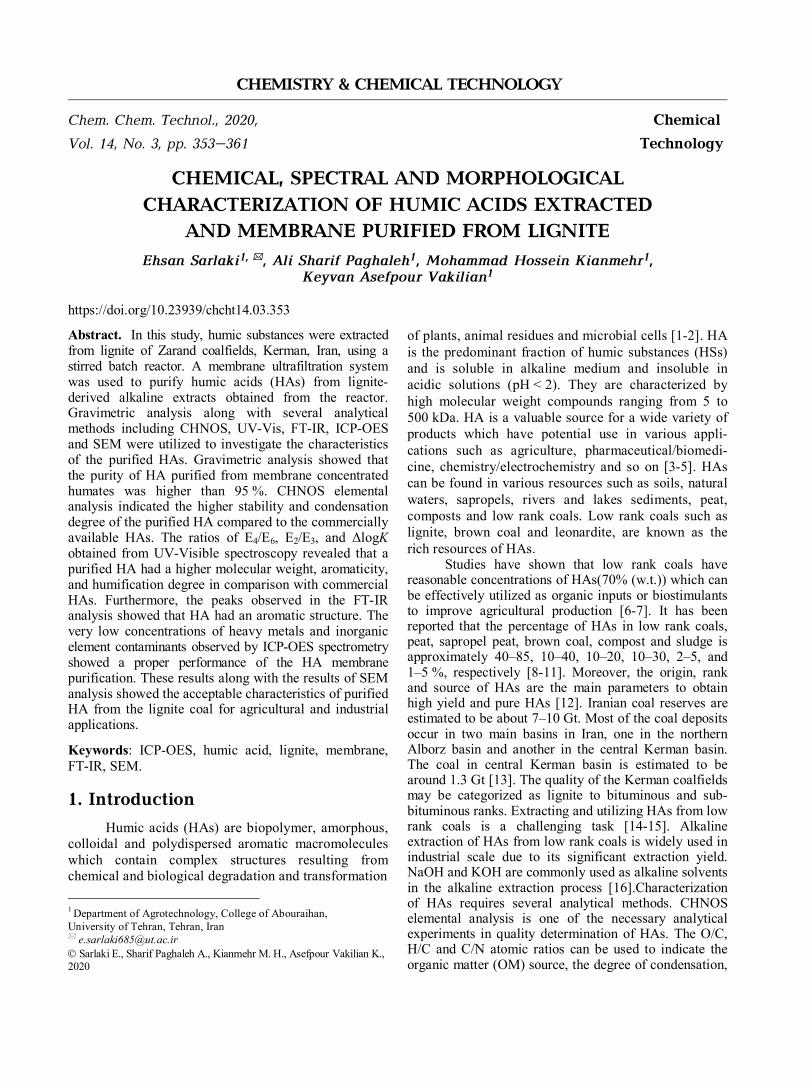
Sodium hydroxide (NaOH), hydrochloric acid (HCl), and hydrofluoric acid (HF) were commercially purchased and were of analytical grade. The coal samples were collected from the Zarand coalfields, Kerman, Iran(56°–56°20'E, 40°30'–40°31'N, Fig. 1). At first, the coal samples were air-dried and then, crushed to less than 100 μm particles. Commercially available HA was purchased from Sigma-Aldrich and was used as a standard HA sample (HAstd).
Fig. 1. The location of Zarand coalfields in regional geological map of Iran
2.2. Extraction of Humic Alkaline Products
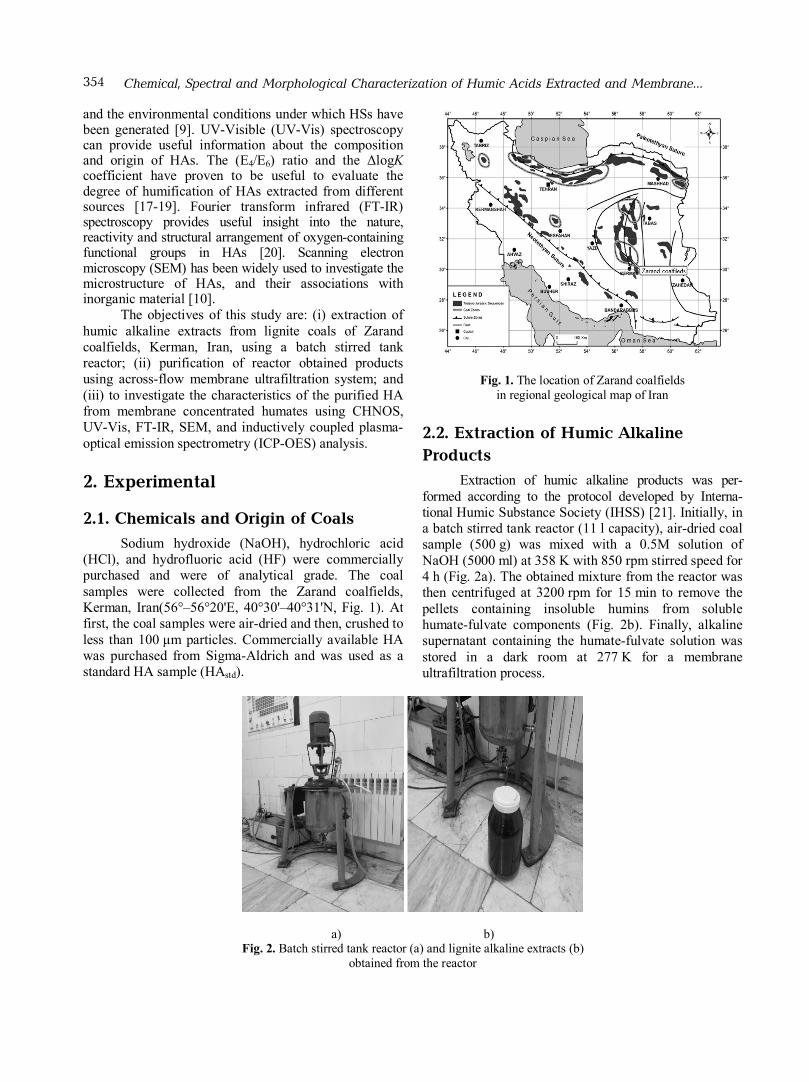
Extraction of humic alkaline products was per-formed according to the protocol developed by Interna-tional Humic Substance Society (IHSS) [21]. Initially, in a batch stirred tank reactor (11 l capacity), air-dried coal sample (500 g) was mixed with a 0.5M solution of NaOH (5000 ml) at 358 K with 850 rpm stirred speed for 4 h (Fig. 2a). The obtained mixture from the reactor was then centrifuged at 3200 rpm for 15 min to remove the pellets containing insoluble humins from soluble humate-fulvate components (Fig. 2b). Finally, alkaline supernatant containing the humate-fulvate solution was stored in a dark room at 277 K for a membrane ultrafiltration process.
a) b) Fig. 2. Batch stirred tank reactor (a) and lignite alkaline extracts (b)
obtained from the reactor

Ehsan Sarlaki et al. 355
Fig. 3. A real and schematic view of membrane purification system: feed tank (1); water bath (2); pump (3); inverter (4); transmitter (5); pressure meter (6); feed setting valve (7); plate and frame membrane unit (8); permeate tank (9) and balance (10)
2.3. Membrane Purification of Lignite-Derived Alkaline Extracts
For separation and concentration of humate solutions from lignite-derived alkaline extracts obtained from the reactor, a cross-flow membrane unit with a flat sheet module was used in batch mode (Fig. 3). A hydrophilic Polysulfone flat membrane with a molecular weight cut-off of 5 kDa and a total effective filtration area of 0.0078 m2 was used. Feed temperature was controlled at 318 K using a two-layer jacket tank and a water bath. An inverter (LS, Model sv015ic5-1f, Cheongju, South Korea) coupled with a transmitter (WIKA, type ECO-1, Klingenberg, Germany) was used to keep the constant pressure of the rotary vane pump (PROCON, Series 2, Milano, Italy) at the required level of feed flow rates. Two pressure meters (WIKA, model 2 13.53.06 3, Klingenberg, Germany) were used to measure pressure at the feed and retentate sides. The pressure and flow rate of the feed were fixed at 0.3 MPa and 35 ml·s-1, respectively. Fulvate compounds as a permeate were collected in a tank and weighed to measure a permeate flux. Concentrated humate as the retentate was recycled into the feed tank. Finally, the membrane concentrated humate was maintained for further analysis.
2.4. Gravimetric Analysis
Gravimetric analysis was used to determine the amount of HA in the solid and liquid samples. In this method, the amount of final material is measured relative to the primary material and the final composition percentage is given in weight/weight. The gravimetric analysis was performed as follows [22]:
Firstly, some of oven dried concentrated humates obtained from the membrane process was weighed. Then, the weighed sample was mixed with 0.1M sodium hydroxide and diluted with distilled water. Sample was then stirred for 16–18 h. After stirring, the sample was centrifuged to separate any insoluble compounds (sediments) from HA and FA (soluble) dissolved in the alkaline extract. Insoluble compounds were then separated and the solution of alkaline extract containing HA and FA was transferred to a clean 1 l Erlenmeyer flask. Afterwards, to remove HA from FA, 6M HCL was added so that pH of the solution reached to 1. The pH valueof the solution was controlled by the addition of HCl or NaOH. The solution was then kept for 1 h to precipitate HA. When HA was completely separated from the solution, the solution containing FA was poured into a clean Erlenmeyer flask. The container of HA was placed in a vacuum oven at 338 K to reach a constant weight. Container was then reweighed to measure the HA dry matter as the difference of sample dry weight and the final weight of the sample. The purity of HA (w/w %) was calculated using Eq. (1) [22-23].
100⋅=humatesedconcentratofweightDried
HAedprecipitatofweightDriedpurityHA (1)
2.5. Characterization of Humic Acid
2.5.1. CHNOS elemental analysis
The elemental composition of the purified HA was determined using a CHNOS elemental analyzer and Eager 300, EA1112 series at the Organization of Geology and Exploration of Minerals (Tehran, Iran). Relative quantities of C, H, N, and S were measured directly with the analyzer and the data were recalculated
Chemical, Spectral and Morphological Characterization of Humic Acids Extracted and Membrane…
356
on an ash-free basis. Contribution of O was calculated using Eq. (2).
S)NH(C100O +++−= (2)
2.5.2. UV-Vis, FT-IR and ICP-OES analysis
UV-Vis spectroscopy analysis of purified HA was carried out using a Shimadzu, UV-2600 Series with a medium in the range of 200–800 nm. The HA sample was dissolved in 100mM solution of NaOH and the absorbance was measured at 250, 365, 400, 465, 600, and 665 nm. The ratios of E4/E6 (Abs465/Abs665), E2/E3(Abs250/Abs365) and ΔlogK (log(Abs400)-log(Abs600)) were calculated for characterization of HA according to [9]. The FT-IR spectra of the samples were obtained using Perkin-Elmer system 2000 (TENSOR 27-Brucker model) apparatus using KBr pellets. The infrared spectra were recorded at a resolution of 4 cm-1 from 450 to 5000 cm-1. ICP-OES analysis was used for concentration determination of the major and trace elements including Al, Ca, Cd, Co, Cu, Fe, K, Mg, Mn, Mo, Na, Ni, Pb, V, Zn and other inorganic elements in the coal and the obtained HA. The determinations were carried out by Perkin-Elmer ICP-OES, varian735 model, after digestion (humid) under microwave irradiation in a closed system using a concentrated HNO3.
2.5.3. SEM analysis
The scanning electron microscopic (SEM) analysis was used for the morphological and micro-structural characterization of the lignite coal and the
purified HA. The analysis was carried out using a KYKY, EM3200 series with accelerating voltages equal to 1–26 kV with 1 kV step.
3. Results and Discussion
3.1. HA Purity Analysis
The properties, quality and purity of HAs, which depend directly on the source and their extraction methods, define their application in agriculture and industry. In former studies, HAs with purities from 13 to 95 % have been obtained from different types of coal using several methods including alkaline extraction, multi-step filtration, filter press system, ultrasound and dialysis of semi-permeable membrane (Table 1). In [24] the researchers showed that the purity of HA extracted from lignite coals using an alkaline extraction and filter press system based on polypropylene filter (PP) was 24 %. The results of this study showed that HAs with high purities more than 95 % can be obtained using the alkaline extraction and membrane purification due to the separation of fulvate and inorganic impurities from lignite-derived alkaline extracts. According to literature, membrane filtration reduces the content of HA ash on the one hand and reduces the molecular weight of the products on the other hand. The results of this study, compared with the results of previous studies (Table 1), are acceptable in the production of HA with high purity from lignite coals.
Table 1
The purity of HAs extracted from lignite coals in this study and other sources Coal type Region HA purity, % HA extraction method Reference
Lignite coal Pakistan 13–29 Alkaline extraction [11] Lignite coal Zarand, Iran 24 Alkaline extraction and filter-press system [24] Brown coal Russia 40, 70, and 90 Alkaline extraction by ultrasonic and multi-step filtration [25] Lignite coal Zarand, Iran > 95 Alkaline extraction and membrane ultrafiltration This study
Table 2
Elemental composition and atomic ratios of lignite coal, HA and HAstd Main component, % Atomic ratio Sample C H N O S C/N H/C O/C
Lignite coal 53.57 5.0752 1.9537 35.9454 0.4552 31.97 1.1200 0.5453 HA 58.69 3.1914 1.0992 37.0193 0.0000 62.26 0.6479 0.4731
HAstd 56.19 3.4289 1.8780 38.5030 0.0000 34.89 0.7271 0.5140
3.2. CHNOS Elemental Analysis
Results of elemental analysis and atomic ratios (H/C, O/C and C/N) of the lignite coal, HA, and HAstd samples are shown in Table 2. The lignite coal and
purified HA mainly consist of carbon and oxygen. The lignite coal sample had approximately 54 % of carbon and 36 % of oxygen. In general, coals with high carbon and low oxygen compositions contain lower amounts of HA and are suitable for fuel applications. With increasing

Ehsan Sarlaki et al. 357
the age and rank of the coals, their carbon content increases while the amount of hydrogen, nitrogen and oxygen decreases [26-27]. The obtained elemental composition of HA in this study was, in general, within the ranges reported in the literature [4, 10, 12, 26]. Due to its complexity, elemental composition of HA is not very informative. Instead, atomic ratios represent quality factors such as degree of humification and condensation of the samples. The C/N ratio is considered as an indicator of the origin of HA. Aquatic sources of HA have lower C/N ratios (typically between 2 and 10), whereas terrestrial sources of HA, which contain cellulose, lignin and tannins, have ratios of 20 and higher [9]. High C/N ratios of HA suggest a high stability, condensation degree and humification degree of the organic matter in the soils from which HA is originated. C/N ratio of the obtained HA (C/N = 62.26) was higher than that of HAstd (C/N = = 34.89) which indicates that produced HA had higher stability, humification and condensation degree than HAstd. A higher H/C value is a sign of greater quantity of aliphatic components; it means that there are less humified materials in the structures of HA [9]. The H/C ratio of the produced HA in this study (0.6479) was lower than of HAstd (0.7271) which indicates a more aromatic structure, a higher degree of humification and a lower aliphatic structure of HA. The O/C ratio of HA (0.4731) was slightly lower than HAstd (0.514). This similarity in O/C ratios and according to the similar carbon contents in the two samples, shows that HA contained almost the same amount of O-containing groups as HAstd. In total, HA extracted from Zarand coalfields of Kerman has the aromatic structure and high stability, humification and condensation degrees compared with HAstd and as a result, it can be used in agricultural and industrial applications.
3.3. UV-Vis Spectroscopy Analysis
The UV-Vis spectra of HA and HAstd are shown in Fig. 4. In agreement with previously published data [10, 28], the spectra are rather featureless and have a peak from 250 to 350 nm. According to [9], this is due to an overlapping absorbance of a large number of chromophores in the humic core. In general, the chromophores responsible for the absorption in the UV range are principally phenolic arenes, benzoic acids, aniline derivatives, polyenes, and polycyclic aromatic hydrocarbons with two or more rings. The absorbance in the visible range, on the other hand, is more complicated to distinguish. However, several researchers have suggested that it could be related to extended conjugation in aliphatic or polyaromatic structures, quinoide structures and keto-enol systems, as well as to the presence of metal complexes and/or inter-, or intramolecular donor–acceptor complexes. Moreover, the spectra which appear at 250–350 nm are due to the excitation of π-electrons
(π→π*) of the aromatic groups [10, 28] and lignin-type compounds. Table 3 shows the spectral data of lignite coal, HA and HAstd. The results of this study are compared with the results obtained from other research studies in Table 3. E2/E3 is the ratio of absorbance at 250 and 365 nm and it is often used as an indicator of humification degree and molecular weight of HS [4]. The lower amount of E2/E3 ratio for HA may be indicative of the presence of structures with higher molecular weight, aromaticity, and humification degree. By comparing E2/E3 ratio of isolated HA from coal (E2/E3 = 2.04) with HAstd (E2/E3 = 2.18), it can be figured out that the produced HA had higher molecular weight, aromaticity, and humification degree.
Fig. 4. UV-Vis spectra of HA and HAstd E4/E6 is the ratio of absorbance at 465 and 665 nm.
E4/E6 ratio, which is called index of humification, correlates with the average molecular weight and the oxygen content of humic materials [4] and decreases with an increase in the degree of condensation [9].This ratio has been widely used in HS studies as an indicator of humification. The ratios of E4/E6 shown in Table 3 indicate that HA isolated in this study, similar to HAstd, had higher degree of condensation than other HAs with compost and brown soil sources. Degree of condensation of HA increases with decreasing ΔlogK values. Furthermore, ΔlogK coefficient can be used to classify the HA samples. In general, HA can be classified in four classes: A, B, Rp and P. Type A has absorption peaks at 250–350 nm and the ΔlogK values for this type are lower than 0.60. Type B has a weak absorption at 250–350 nm and their ΔlogK values vary between 0.60 and 0.80. Type Rp has similar absorption spectra as type B, but with higher ΔlogK values (between 0.80 and 1.10). Finally, HA with absorption peaks in the visible range at 450, 570, and 615 nm are considered as type P. The isolated HA in this study and HAstd are of type A which have ΔlogK values lower than 0.60.
Chemical, Spectral and Morphological Characterization of Humic Acids Extracted and Membrane…
358
Table 3
UV-Visible spectral data of lignite coal, HA, and HAstd
Sample E2/E3 E4/E6 ΔlogK Class of HA Recourses of HA Reference HA 2.04 1.04 0.03 A Lignite coal This study
HAstd 2.18 1.04 0.02 A Lignite coal This study HA - 7.80 0.77 B Lakes sediments [9] HA - 3.20 0.42 A Lignite coal [10] HA 2.33 6.46 0.85 Rp Compost [4] HA 2.80 6.75 0.94 Rp Brown soil [4]
3.4. FT-IR Spectral Analysis
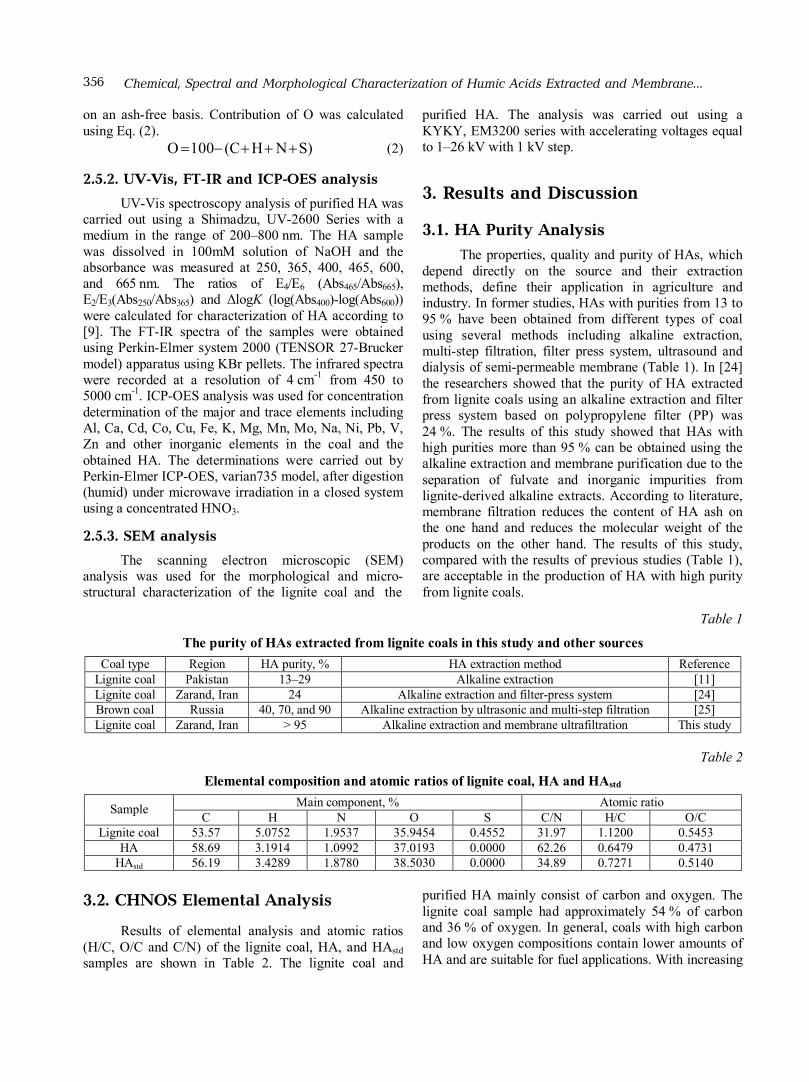
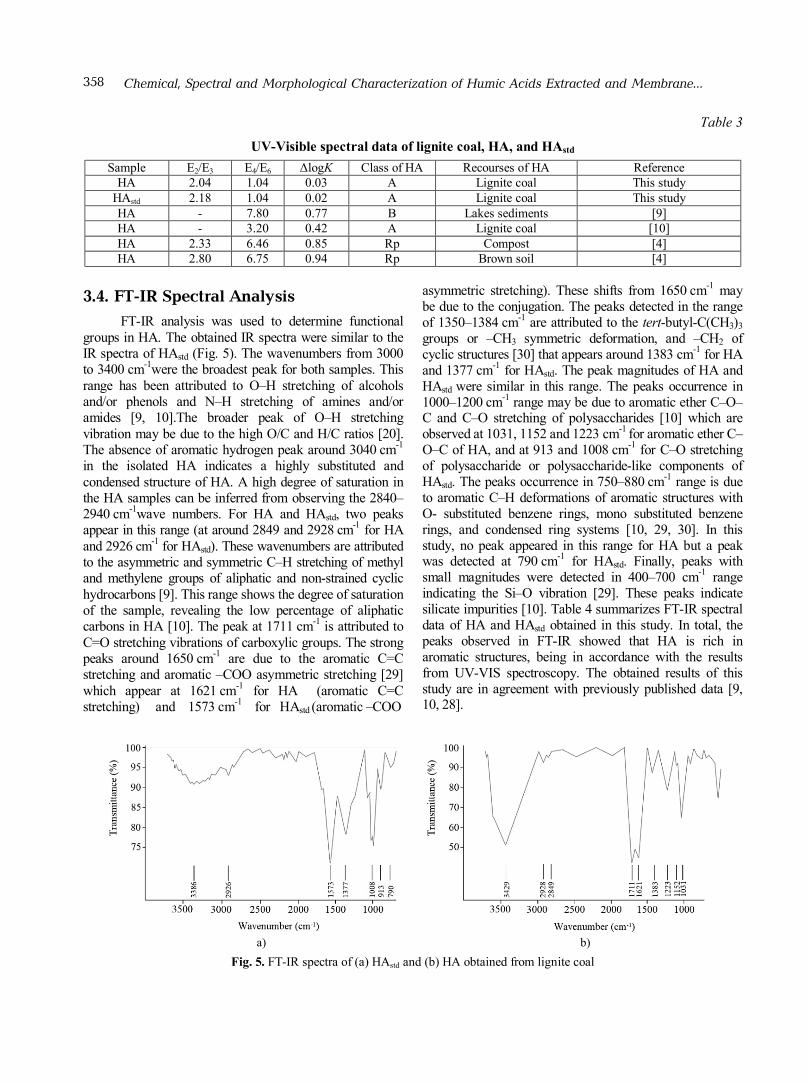
FT-IR analysis was used to determine functional groups in HA. The obtained IR spectra were similar to the IR spectra of HAstd (Fig. 5). The wavenumbers from 3000 to 3400 cm-1were the broadest peak for both samples. This range has been attributed to O–H stretching of alcohols and/or phenols and N–H stretching of amines and/or amides [9, 10].The broader peak of O–H stretching vibration may be due to the high O/C and H/C ratios [20]. The absence of aromatic hydrogen peak around 3040 cm-1 in the isolated HA indicates a highly substituted and condensed structure of HA. A high degree of saturation in the HA samples can be inferred from observing the 2840–2940 cm-1wave numbers. For HA and HAstd, two peaks appear in this range (at around 2849 and 2928 cm-1 for HA and 2926 cm-1 for HAstd). These wavenumbers are attributed to the asymmetric and symmetric C–H stretching of methyl and methylene groups of aliphatic and non-strained cyclic hydrocarbons [9]. This range shows the degree of saturation of the sample, revealing the low percentage of aliphatic carbons in HA [10]. The peak at 1711 cm-1 is attributed to C=O stretching vibrations of carboxylic groups. The strong peaks around 1650 cm-1 are due to the aromatic C=C stretching and aromatic –COO asymmetric stretching [29] which appear at 1621 cm-1 for HA (aromatic C=C stretching) and 1573 cm-1 for HAstd (aromatic –COO
asymmetric stretching). These shifts from 1650 cm-1 may be due to the conjugation. The peaks detected in the range of 1350–1384 cm-1 are attributed to the tert-butyl-C(CH3)3 groups or –CH3 symmetric deformation, and –CH2 of cyclic structures [30] that appears around 1383 cm-1 for HA and 1377 cm-1 for HAstd. The peak magnitudes of HA and HAstd were similar in this range. The peaks occurrence in 1000–1200 cm-1 range may be due to aromatic ether C–O–C and C–O stretching of polysaccharides [10] which are observed at 1031, 1152 and 1223 cm-1 for aromatic ether C–O–C of HA, and at 913 and 1008 cm-1 for C–O stretching of polysaccharide or polysaccharide-like components of HAstd. The peaks occurrence in 750–880 cm-1 range is due to aromatic C–H deformations of aromatic structures with O- substituted benzene rings, mono substituted benzene rings, and condensed ring systems [10, 29, 30]. In this study, no peak appeared in this range for HA but a peak was detected at 790 cm-1 for HAstd. Finally, peaks with small magnitudes were detected in 400–700 cm-1 range indicating the Si–O vibration [29]. These peaks indicate silicate impurities [10]. Table 4 summarizes FT-IR spectral data of HA and HAstd obtained in this study. In total, the peaks observed in FT-IR showed that HA is rich in aromatic structures, being in accordance with the results from UV-VIS spectroscopy. The obtained results of this study are in agreement with previously published data [9, 10, 28].
а) b)
Fig. 5. FT-IR spectra of (a) HAstd and (b) HA obtained from lignite coal
Ehsan Sarlaki et al. 359
Table 4
FT-IR spectral data of HA and HAstd
Assignments Wavenumbers in HA, cm-1
Wavenumbers in HAstd, cm-1
O–H Stretching of alcohols and/or phenols and N–H stretching of amines and/or amides 3429 3386
Asymmetric and symmetric C-H stretching of methyl and methylene groups of aliphatic and nonstrained cyclic hydrocarbons 2849, 2928 2926
C=O stretching vibrations due to carboxylic groups 1711 – Aromatic C=C stretching and –COO aromatic asymmetric stretching 1621 1573
tert-Butyl-C(CH3)3 groups or –CH3 symmetric deformation, and –CH2 in a cyclic structure 1383 1377
Aromatic ether C–O–C and C–O stretching of polysaccharide 1031, 1152, 1223 913–1008 Aromatic C–H – 790
Si–O Vibration due to silicate impurities 400–600 630–690
3.5. Analysis of Heavy Metals and Inorganic Elements
Results of ICP-OES analysis of lignite coal and HA are given in Table 5. For HA isolated from lignite coal, it has been found that heavy metal concentrations are significantly lower than the source coal. The amounts of heavy metals in HA samples purified from concentrated humates using the membrane ultrafiltration system, significantly decreased Pb, Cr, As, Zn, Cd, Cu, Co, and Ni by a factor of 160, 320, 158, 9.5, 3.8, 740, 20, and
50, respectively, which may be due to the absorption of these metals by the membrane and formation of a metal cake layer on its surface. The Council Directive 86/278/EEC has established limits equal to 1–3 ppm for Cd, 50–140 ppm for Cu, 30–75 ppm for Ni, 50–300 ppm for Pb, and 150–300 ppm for Zn in the soil, when the sewage sludge is used in agriculture [34]. The measured heavy metal contents in the lignite coal of Zarand coalfields are below the recommended levels and are lower than the reported concentrations in the literature [10, 31-33].
Table 5
Concentration of heavy metals (in ppm) in lignite coal and HA. Results are compared to the ranges for Leonardite coal and HA adapted according to [31]
Sample As Cd Co Cr Cu Ni Pb Zn Reference DL 0.5 0.1 1 1 1 1 1 1 –
Lignite Coal 9.5 0.19 <1 16 37 15 8 21 This study Leonardite 12.95 0.54 2.83 67.38 71.22 11.94 12.23 24.88 [31]
HA 0.06 0.05 < 0.05 < 0.05 < 0.05 0.3 < 0.05 2.2 This study HA 7.13 0.44 2.09 49.45 18.79 10.84 8.29 20.50 [31] Note: DL is a detection limit
Table 6
Concentration of micro and macronutrient elements (in ppm) in lignite coal and membrane purified HA Element Al Ca Fe Na Mg Mn P K S Si
DL 100 100 100 100 100 5 5 5 50 100 Lignitecoal 9722 5730 7744 2120 1379 39 222 325 2204 6010
HA 310.2 8.8 447 9950 3.8 8.1 29.1 71.6 533 155 Element Ag La Ce Li Yb Y Th Sb Sc V
DL 0.1 1 1 1 0.2 0.5 0.5 0.5 0.5 1 Lignitecoal 0.22 4 3 5 0.3 6 6.2 1.16 5.5 12
HA < 0.05 < 0.05 < 0.01 < 0.05 < 0.05 < 0.05 < 0.05 < 0.05 < 0.05 < 0.05 Note: DL is a detection limit
Chemical, Spectral and Morphological Characterization of Humic Acids Extracted and Membrane…
360
The results of ICP-OES analysis for concentration of the micro and macronutrient elements such as Al, Ca, Fe, Na, Mg, Mn, P, K, S, Si and other elements are shown in Table 6. Results showed low concentrations of all investigated elements while sodium had the highest concentration in the purified HA (9950 ppm, approximately 0.99 %) which may be because of the alkaline extraction of HA with NaOH. Subsequently, S, Fe, Al and Si with 533, 447, 310 and 150 ppm concentrations, respectively had the higher concentration among all the elements, which may be attributed to the origin of the lignite. The low concentrations of micro and macronutrient elements observed by ICP-OES reveal appropriate performance of membrane purification of HA which was carried out after the extraction of HA from the concentrated humate. The detected heavy metal element in the purified HA can be due to the ability of HA in forming complexes with heavy metal ions.
3.6. Microstructural and Morphological Analysis
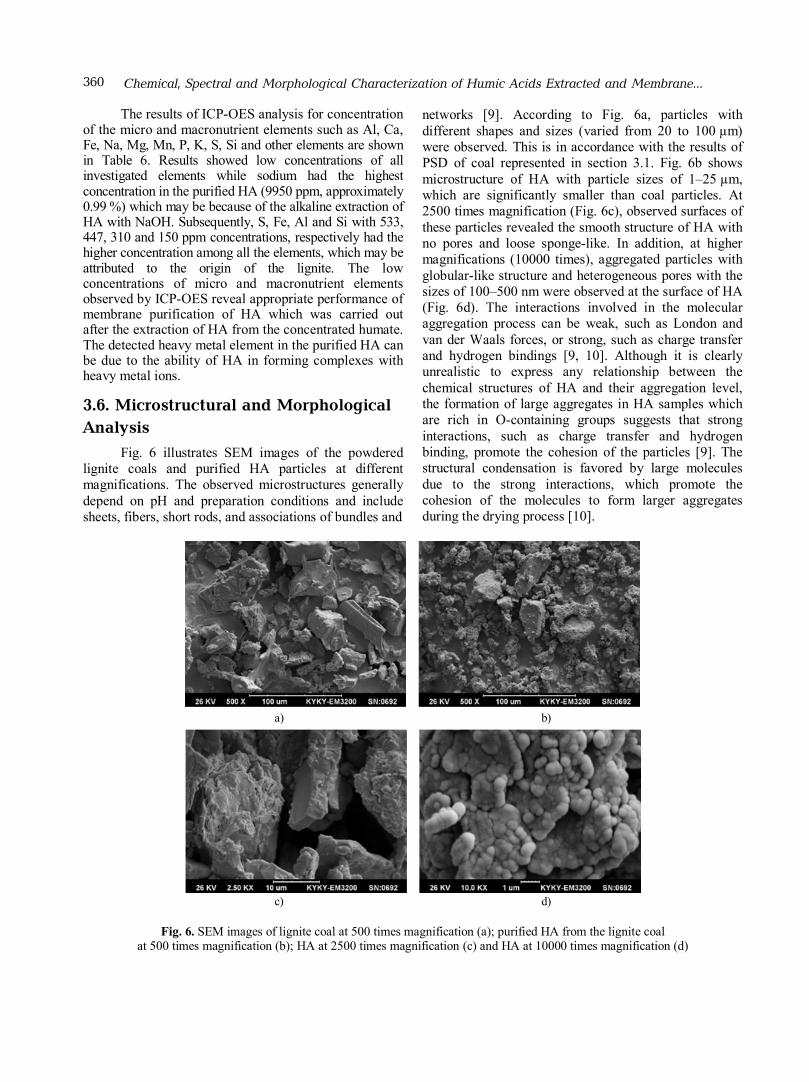
Fig. 6 illustrates SEM images of the powdered lignite coals and purified HA particles at different magnifications. The observed microstructures generally depend on pH and preparation conditions and include sheets, fibers, short rods, and associations of bundles and
networks [9]. According to Fig. 6a, particles with different shapes and sizes (varied from 20 to 100 µm) were observed. This is in accordance with the results of PSD of coal represented in section 3.1. Fig. 6b shows microstructure of HA with particle sizes of 1–25 µm, which are significantly smaller than coal particles. At 2500 times magnification (Fig. 6c), observed surfaces of these particles revealed the smooth structure of HA with no pores and loose sponge-like. In addition, at higher magnifications (10000 times), aggregated particles with globular-like structure and heterogeneous pores with the sizes of 100–500 nm were observed at the surface of HA (Fig. 6d). The interactions involved in the molecular aggregation process can be weak, such as London and van der Waals forces, or strong, such as charge transfer and hydrogen bindings [9, 10]. Although it is clearly unrealistic to express any relationship between the chemical structures of HA and their aggregation level, the formation of large aggregates in HA samples which are rich in O-containing groups suggests that strong interactions, such as charge transfer and hydrogen binding, promote the cohesion of the particles [9]. The structural condensation is favored by large molecules due to the strong interactions, which promote the cohesion of the molecules to form larger aggregates during the drying process [10].
а) b)
c) d)
Fig. 6. SEM images of lignite coal at 500 times magnification (a); purified HA from the lignite coal
at 500 times magnification (b); HA at 2500 times magnification (c) and HA at 10000 times magnification (d)
Ehsan Sarlaki et al. 361
4. Conclusions
Characterization of alkaline extracted and membrane purified HA from lignite coals of Zarand coalfields using UV-Vis spectral parameters (E2/E3, E4/E6 ratio and ΔlogK coefficient), FT-IR and SEM showed an aromatic structure with rich carboxylic and phenolic functional groups and high degree of humification and condensation which is considered to be type A for HA. Furthermore, according to the results of ICP-OES analysis, the obtained environmental friendly HA with very low concentrations of heavy metals makes it possible to be used in agriculture and industry. CHNOS analysis confirmed the quality of the lignite coal used for HA extraction and showed that the characteristics of the produced HA was better than the features of commercially available HA. In conclusion, the use of membrane ultrafiltration processes for purification of HA from lignite-derived alkaline extracts is a suitable technique to increase safety and purity of HA.
References
[1] Canellas L., Oliveras F., Aguiar N. et al.: Sci. Hortic., 2015, 196, 15. https://doi.org/10.1016/j.scienta.2015.09.013 [2] Savel’eva A., Mal’tseva E.,Yudina N.: Solid Fuel Chem., 2017, 51, 51. https://doi.org/10.3103/S0361521917010098 [3] De Melo B., Motta F., Santana M.: Mat. Sci. Eng. C, 2016, 62, 967. https://doi.org/10.1016/j.msec.2015.12.001 [4] Enev V., Pospisilova L., Klucakova M. et al.: Soil Water Res., 2014, 9, 9. https://doi.org/10.17221/39/2013-SWR [5] Pena-Mendez E., Havel J., Patocka J.: J. Appl. Biomed., 2005, 3, 13. https://doi.org/10.32725/jab.2005.002 [6] Giannouli A., Kalaitzidis S., Siavalas G. et al.: Int. J. Coal Geol., 2009, 77, 383. https://doi.org/10.1016/j.coal.2008.07.008 [7] Peuravuori J., Zbankova P., Pihlaja K.: Fuel Process. Technol., 2006, 87, 829. https://doi.org/10.1016/j.fuproc.2006.05.003 [8] Das T., Saikia B., Bourah B., Das D.: J. Geol. Soc. India, 2015, 86, 468. https://doi.org/10.1007/s12594-015-0334-0 [9] Giovanela M., Crespo J., Antunes M. et al.: J. Mol. Struct., 2010, 981, 111. https://doi.org/10.1016/j.molstruc.2010.07.038 [10] Martins J., Xavier D., Silva A. et al.: Int. J. Agric. Sci., 2012, 4, 238. https://doi.org/10.9735/0975-3710.4.5.238-242 [11] Zara M., Ahmad Z., Akhtar J. et al.: Energ. Source A., 2017, 39, 1159. https://doi.org/10.1080/15567036.2017.1307886 [12] Kurkova M., Klika Z., Klikova C., Havel J.: Chemosphere, 2004, 54, 1237. https://doi.org/10.1016/j.chemosphere.2003.10.020 [13] Moosavi Rad S.: Geochemical Studies of Pabedana Coal Mine Tailings, South East of Iran and Their Effect on Environment Using GIS Techniques. Ph.D. thesis, University of Mysore, Manasagangotri, India, 2010. [14] Ozkan S., Ozkan S.: Int. J. Coal Prep. Util., 2016, 37, 285. https://doi.org/10.1080/19392699.2016.1171761 [15] Canieren O., Karaguzel C., Aydin A.: Physicochem. Probl. Miner. Process., 2017, 53, 502. https://doi.org/10.5277/ppmp170139 [16] Saito B., Seckler M.: Braz. J. Chem. Eng., 2014, 31, 675. https://doi.org/10.1590/0104-6632.20140313s00002512 [17] Pospisilova L., Fasurova N., Barancikova G., Liptaj T.: Petrol. Coal, 2008, 50, 30. [18] Pospisilova L., Fasurova N.: Soil Water Res., 2011, 6, 147. https://doi.org/10.17221/21/2010-SWR
[19] Pospisilova L., Fasurova N.: J. Cent. Europ. Agr., 2010, 11, 351. https://doi.org/10.5513/jcea.v11i3.842 [20] Georgakopoulos A., Iordanidis A., Kapina V.: Energ. Source., 2003, 25, 995. [21] http://www.humicsubstances.org/ [22] Lamar R., Talbot K.: Commun. Soil Sci. Plan., 2009, 40, 2309. https://doi.org/10.1080/00103620903111251 [23] Lamar R., Olk D., Mayhew L., Bloom P.: J. AOAC Int., 2014, 97, 721. https://doi.org/10.5740/jaoacint.13-393 [24] Shakiba N.: Investigation of the effective parameters on separation and purification of humic acid from the Leonardite humate using a proper filter. M.Sc. thesis, University of Tehran, Iran, 2016. [25] Prosyolkov N., Glukhovtsev V., Kapkin N. et al.: Pat. RU 2473527, Publ. Jan. 27, 2013. [26] Dick D., Mangrichb A., Menezesc S., Pereira B.: J. Brazil. Chem. Soc., 2002, 13, 177. https://doi.org/10.1590/S0103-50532002000200008 [27] Fong S., Lau I., Chong W. et al.: J. Brazil. Chem. Soc., 2006, 17, 582. https://doi.org/10.1590/S0103-50532006000300023 [28] Das T., Saikia B., Baruah B.: J. Indian Chem. Soc., 2013, 90, 2007. [29] Saikia B., Baruah R., Gogoi P.: J. Earth Syst. Sci., 2007, 116, 575. https://doi.org/10.1007/s12040-007-0052-0 [30] Saikia B., Sahu O., Boruah R.: J. Geol. Soc. India, 2007, 70, 917. [31] Olivella M., Sole M., Gorchs R. et al.: Arch. Min. Sci., 2011, 56, 789. [32] Ketris M., Yudovich Y.: Int. J. Coal Geol., 2009, 78, 135. https://doi.org/10.1016/j.coal.2009.01.002 [33] Novak J., Kozler J., Janoš P.: React. Funct. Polym., 2001, 47, 101. https://doi.org/10.1016/S1381-5148(00)00076-6 [34] https://eur-lex.europa.eu/legal-content/EN/TXT/?uri=CELEX%3A31986L0278
Received: November 26, 2018 / Revised: December 17, 2018 / Accepted: April 15, 2019
ХІМІЧНА, СПЕКТРАЛЬНА І МОРФОЛОГІЧНА ХАРАКТЕРИСТИКА МЕМБРАННО-ОЧИЩЕНИХ ГУМІНОВИХ КИСЛОТ, ЕКСТРАГОВАНИХ
З ЛІГНІТУ Анотація. З використанням реактора періодичної дії з
перемішуванням одержані гумінові речовини з лігніту вугільних родовищ Заранда (Керман, Іран). Для очищення гумінових кислот (ГК) від лужних екстрактів, отриманих з реактора, засто-совано систему мембранної ультрафільтрації. За допомогою гравіметричного, елементного аналізів, а також УФ-спектро-скопії, Фур‘є-спектроскопії, спектроскопії з індуктивно-зв‘яза-ною плазмою (СІЗП) та скануючої електронної мікроскопії досліджено характеристики очищених ГК. Гравіметричним аналізом встановлено, що чистота очищеної ГК була більше 95 %. Результатами УФ-спектроскопії доведено, що очищена ГК має більш високу молекулярну масу, ароматичність і ступінь гуміфікації порівняно з промисловою ГК. За допомогою Фур‘є-спектроскопії показано, що ГК має ароматичну структуру. Дуже низькі концентрації важких металів та забруднень неорганічного походження, визначені за допомогою СІЗП, показали належну ефективність мембранного очищення ГК. Одержані результати демонструють прийнятні характерис-тики очищеної ГК з лігніту для сільськогосподарського та промислового застосування.
Ключові слова: спектроскопія з індуктивно-зв‘язаною
плазмою, гумінова кислота, лігніт, мембрана, Фур‘є-спектро-скопія, скануюча електронна мікроскопія.