chemistry 161 intro lab monique wilhelm. never miss lab!!!!! one hour lecture remaining time in...
Post on 19-Dec-2015
214 views
TRANSCRIPT

Chemistry 161Intro Lab
Monique Wilhelm

NEVER MISS LAB!!!!! One hour lecture Remaining time in lab 1credit class = at least 3 hours spent outside of
class on class preparation Classroom Environment
Lecture-open discussion style I EXPECT you to talk, too Help answer questions, etc. Do not be turned off if I answer a question with another question; my
job is to show you how to problem-solve
What will we learn?
Methods and equipment used in chem labs How to make decisions about experimentation What types of things are important to be aware of
during experimentation How to draw conclusions about data obtained How to communicate your findings

Safety Overview Remember: Everything in Chemistry Lab has the
potential to be harmful Goggles Gloves Absolutely No Eating or Drinking in Any Lab 5 Senses Attire
Long Hair Tied Back Always wear long pants Never wear loose fitting long sleeved shirts NO sandals, closed shoes
Safety Continued Remember: Everything in Chemistry Lab has the
potential to be harmful Labels Contact Excess Chemicals Material Safety Data Sheets (MSDSs)
Explain the hazards associated w/ substances ALL chemicals have the POTENTIAL to be
harmful

Your Grade
Expectations Follow Directions Be Prepared Only one late
assignment allowed NO make ups
Types of Grading Notebooks
-Observations & Data hand-written Lab Reports- TYPED Computer assignments Quizzes – 2 types Final Project Possible Extra Credit

Today’s ExperimentHow to Use a Balance
&
Comparison of Data to Standards
Difference Between Balance & Scale
Scale Measures weight
Balance Measures mass
Relationship?
Weight = mass*gravity
Difference Between Precision & Accuracy
Precision Multiple readings
giving same measurement
Accuracy How close to real
number
A balance is a relatively precise instrument
In this lab, you are interested in accuracy
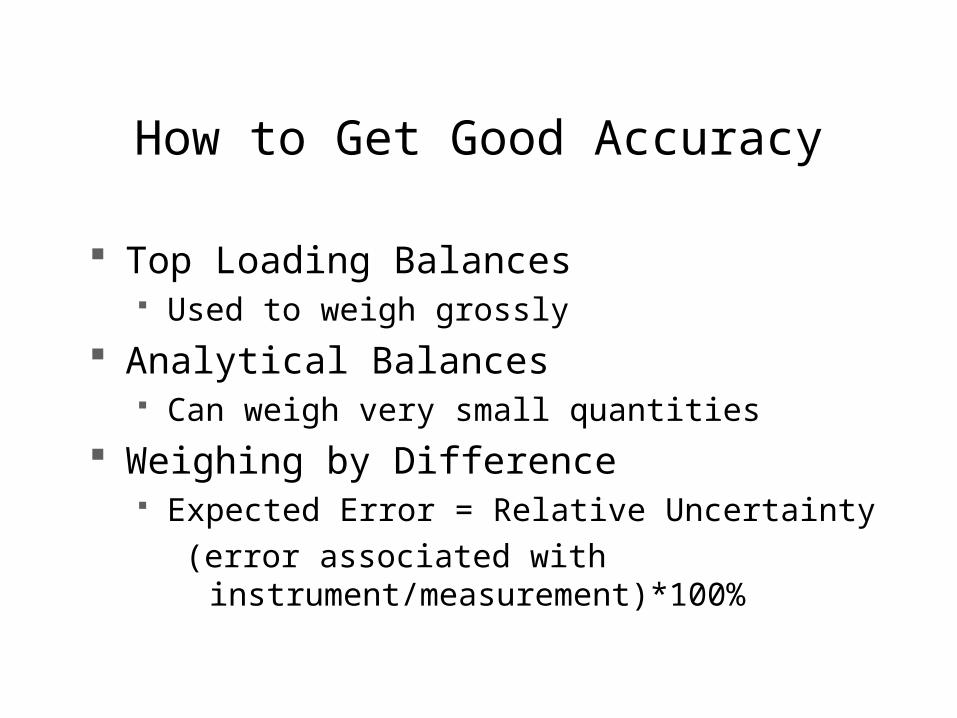
How to Get Good Accuracy
Top Loading Balances Used to weigh grossly
Analytical Balances Can weigh very small quantities
Weighing by Difference Expected Error = Relative Uncertainty
(error associated with instrument/measurement)*100%

Two Types of Balances
Top Loading Balance Measures Grossly Picture From
http://www.hitechtrader.com/imagepage.cfm?pic=45246.jpg
Analytical Balance Measures Accurately Picture From
http://www.chem.vt.edu/RVGS/ACT/lab/Analytical_Balance.html
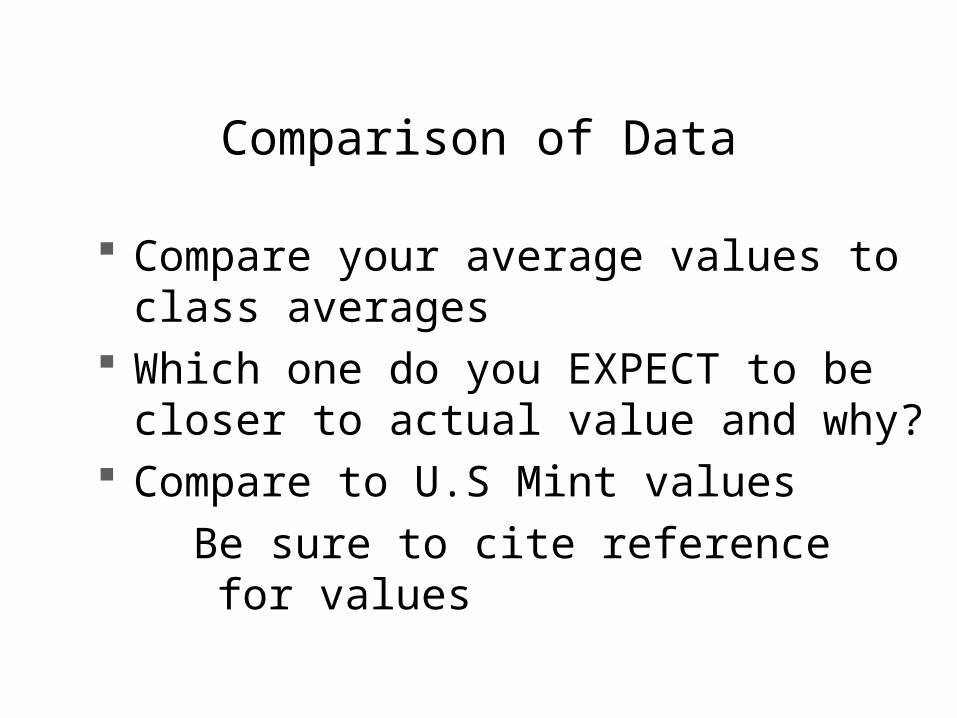
Comparison of Data
Compare your average values to class averages
Which one do you EXPECT to be closer to actual value and why?
Compare to U.S Mint values
Be sure to cite reference for values
Coin Demo
I will demonstrate the use of balances in lab
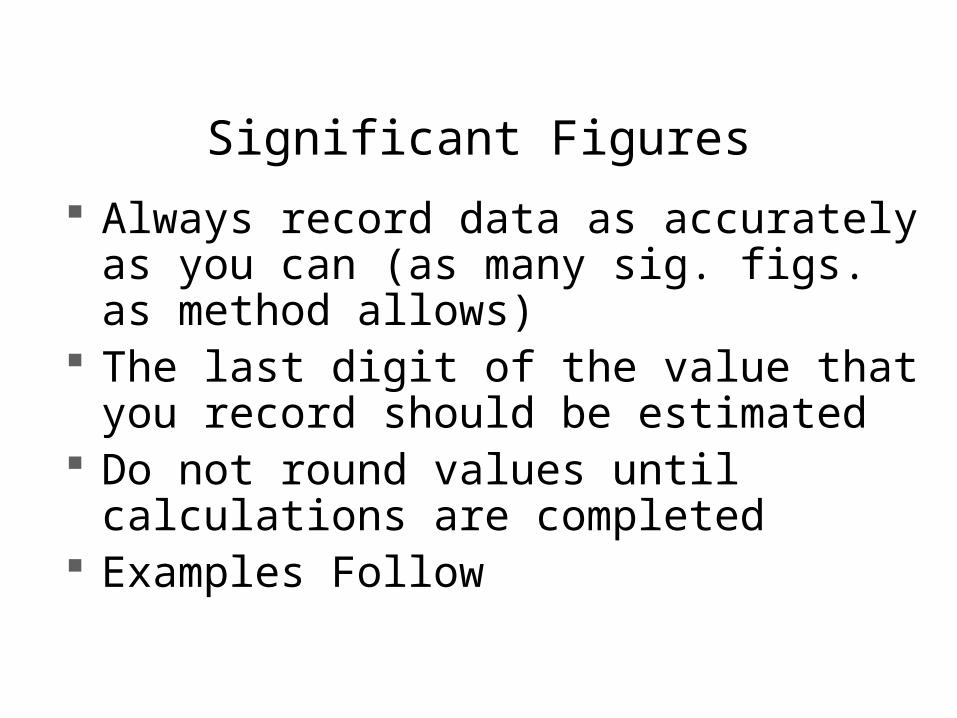
Significant Figures
Always record data as accurately as you can (as many sig. figs. as method allows)
The last digit of the value that you record should be estimated
Do not round values until calculations are completed
Examples Follow
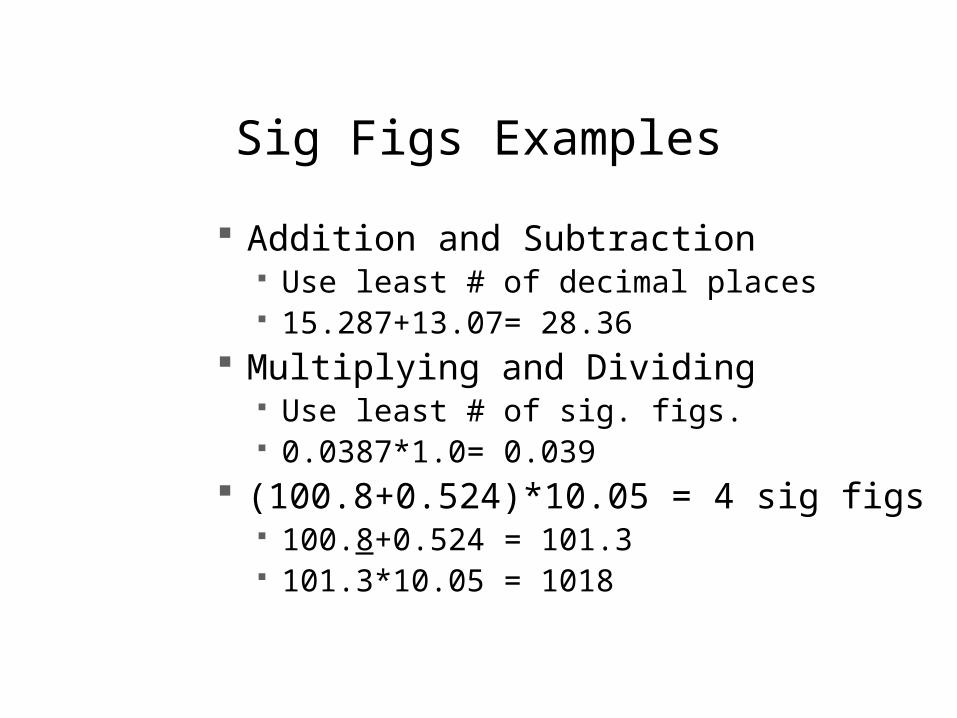
Sig Figs Examples
Addition and Subtraction Use least # of decimal places 15.287+13.07= 28.36
Multiplying and Dividing Use least # of sig. figs. 0.0387*1.0= 0.039
(100.8+0.524)*10.05 = 4 sig figs 100.8+0.524 = 101.3 101.3*10.05 = 1018

Relative & Absolute %Error Precision Determination
How far are values off from each other Standard Deviation OR Relative % Error = (largest – smallest)*100%/average
Accuracy Determination How far off from real value? Absolute %Error = (|experimental value – real value|)*100%/real value
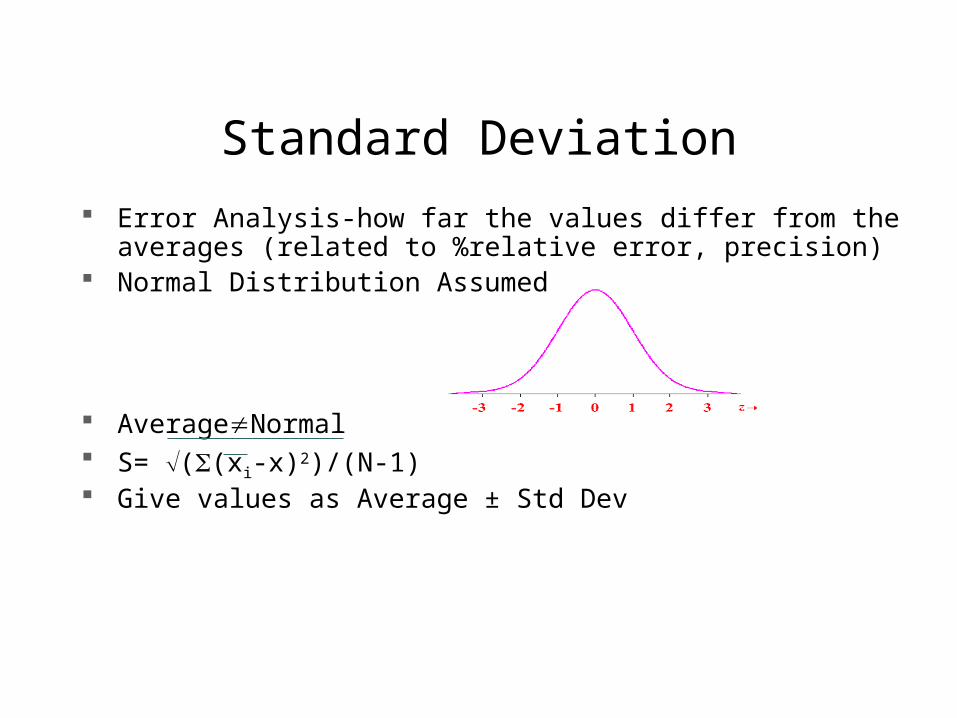
Standard Deviation Error Analysis-how far the values differ from the averages (related to
%relative error, precision) Normal Distribution Assumed
AverageNormal S= ((xi-x)2)/(N-1) Give values as Average ± Std Dev
Using Excel for Data Analysis in CHM 161
What is Excel?
Computer program by Microsoft Spreadsheet program used to present data and
produce graphs Can also be used to perform calculations
using function “programming” Available on all campus computers
Why use Excel?
Makes for better presentation of results Cleaner, more accurate graphing
Ability to calculate more accurate values from graphs
Lesson 1 Making Tables
X values (independent variables) to the left of Y values (dependent variables)
Use top row to indicate which values you will have in which columns
Be sure to add units to labels Click on cell (rectangle) and type (word or
value)
Lesson 2: Performing Calculations
Click on cell that you would like to have the value for the calculation placed
Type “=“ to let program know that you want it to perform calculation
Select “Insert” on toolbar Scroll down to “Function” and click
Lesson 2: Performing Calculations cont’d
Click on categories to find function desired For this class, most common will be SUM and
AVERAGE Double click on function to select Click on red-white-blue box to select values that you
want program to use for calculation Use cursor to highlight boxes with desired values Click red-white-blue box to accept values Click OK to complete
Lesson 3: Making Graphs
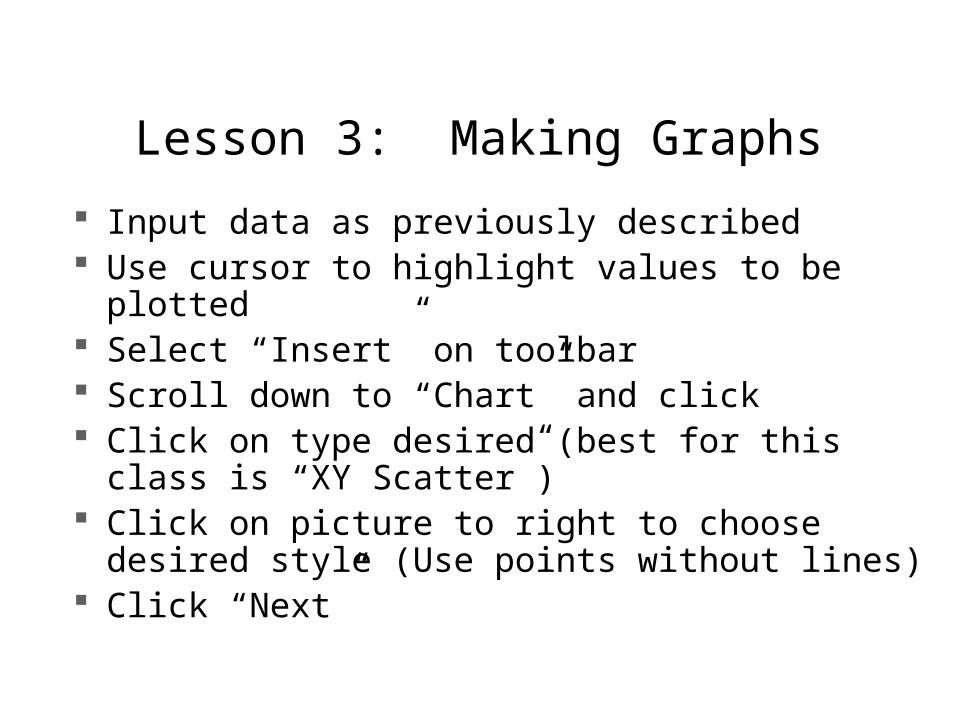
Input data as previously described Use cursor to highlight values to be plotted Select “Insert” on toolbar Scroll down to “Chart” and click Click on type desired (best for this class is “XY
Scatter”) Click on picture to right to choose desired style (Use
points without lines) Click “Next”
Lesson 3: Making Graphs Cont’d
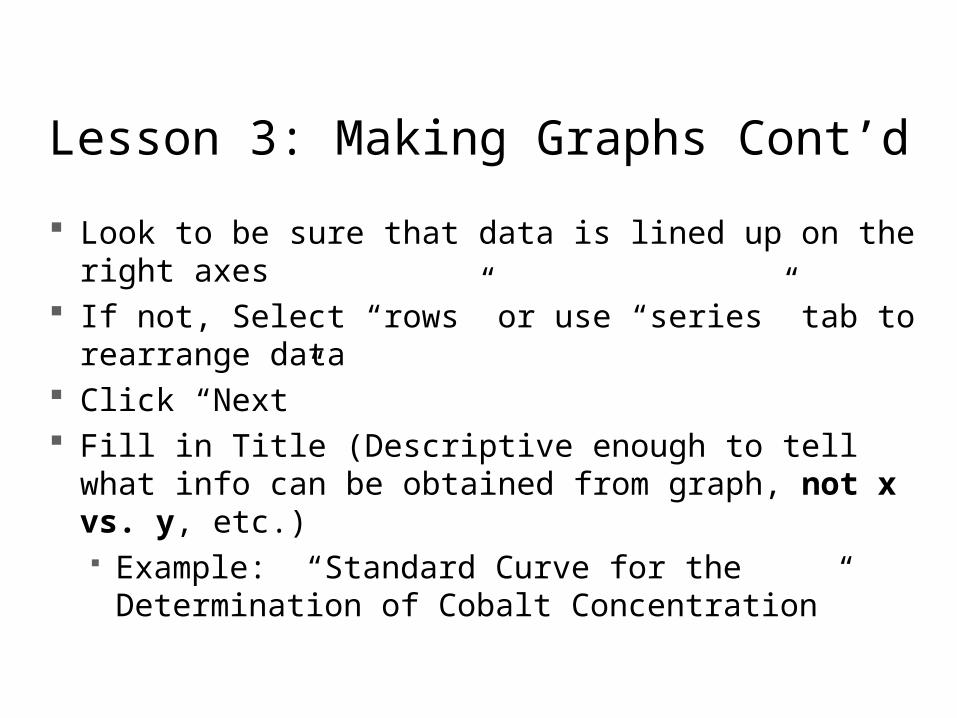
Look to be sure that data is lined up on the right axes If not, Select “rows” or use “series” tab to rearrange data Click “Next” Fill in Title (Descriptive enough to tell what info can be
obtained from graph, not x vs. y, etc.) Example: “Standard Curve for the Determination of
Cobalt Concentration”
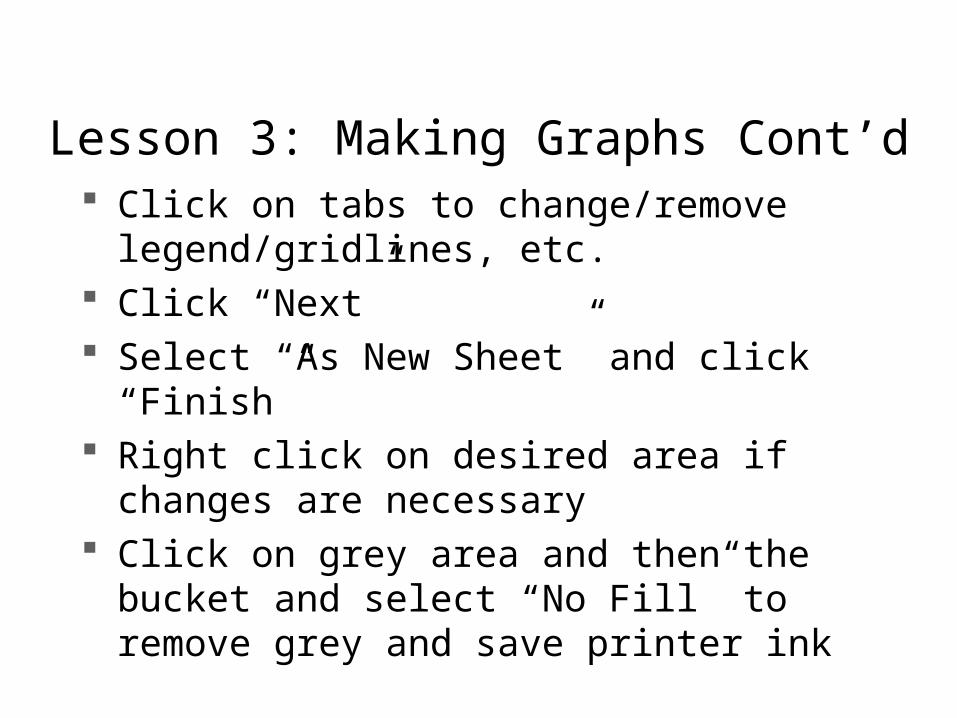
Lesson 3: Making Graphs Cont’d Click on tabs to change/remove legend/gridlines,
etc. Click “Next” Select “As New Sheet” and click “Finish” Right click on desired area if changes are
necessary Click on grey area and then the bucket and select
“No Fill” to remove grey and save printer ink
Lesson 4: Best Fit Lines
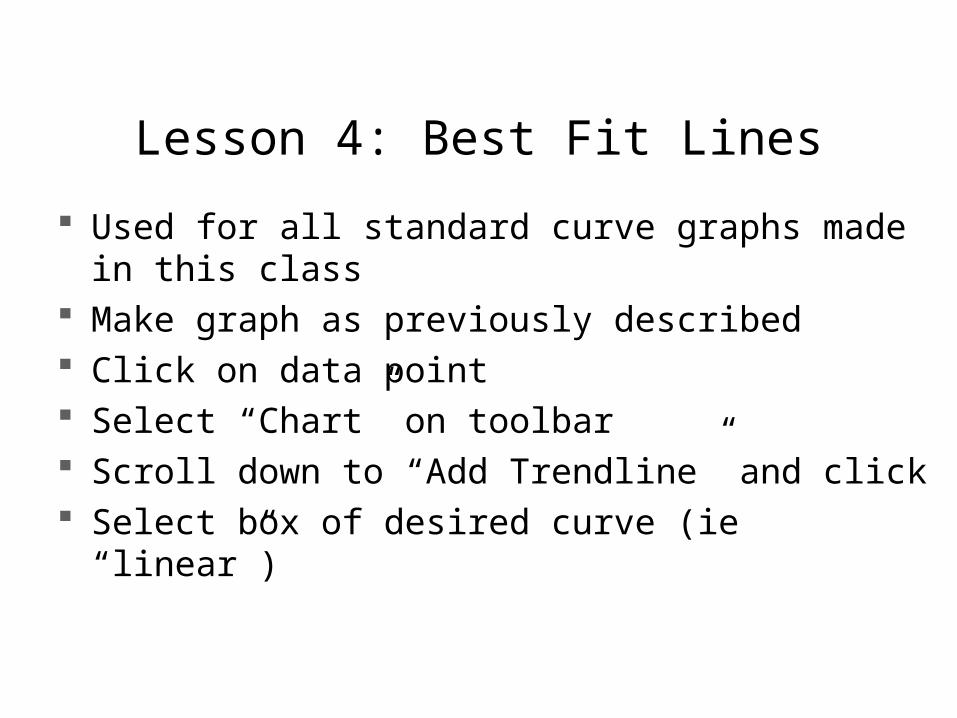
Used for all standard curve graphs made in this class Make graph as previously described Click on data point Select “Chart” on toolbar Scroll down to “Add Trendline” and click Select box of desired curve (ie “linear”)
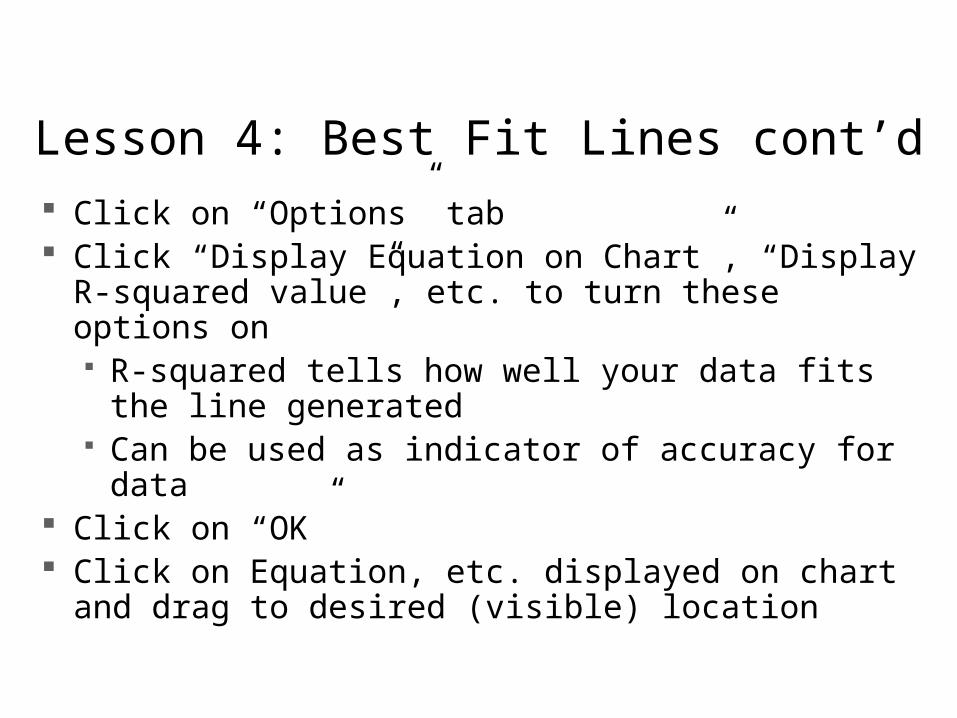
Lesson 4: Best Fit Lines cont’d Click on “Options” tab Click “Display Equation on Chart”, “Display R-squared
value”, etc. to turn these options on R-squared tells how well your data fits the line
generated Can be used as indicator of accuracy for data
Click on “OK” Click on Equation, etc. displayed on chart and drag to
desired (visible) location
Adding to Notebook
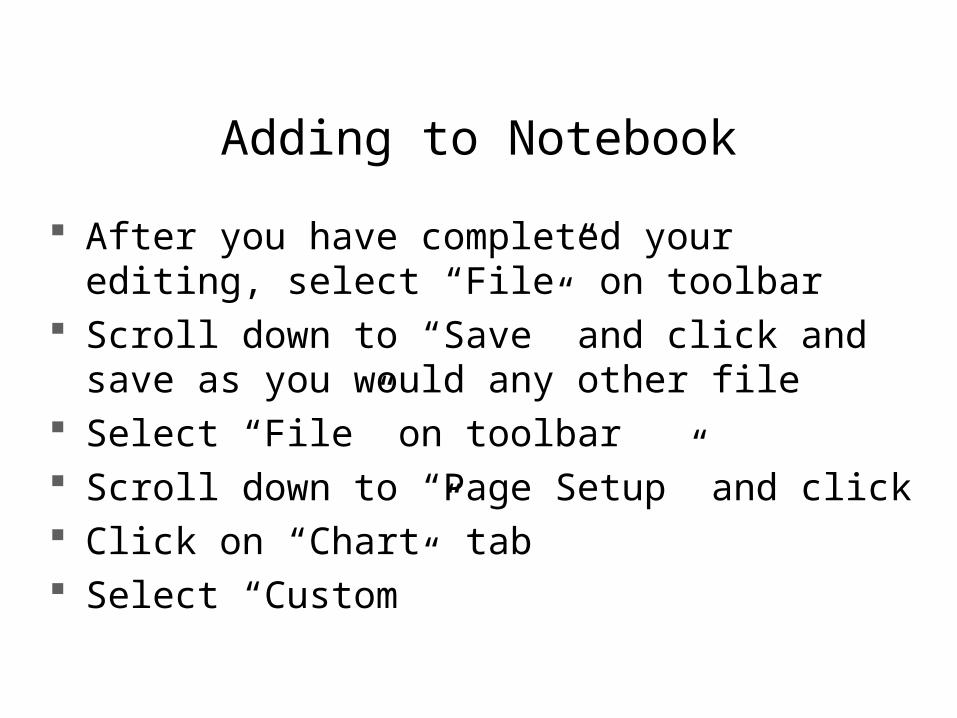
After you have completed your editing, select “File” on toolbar
Scroll down to “Save” and click and save as you would any other file
Select “File” on toolbar Scroll down to “Page Setup” and click Click on “Chart” tab Select “Custom”
Adding to Notebook cont’d.
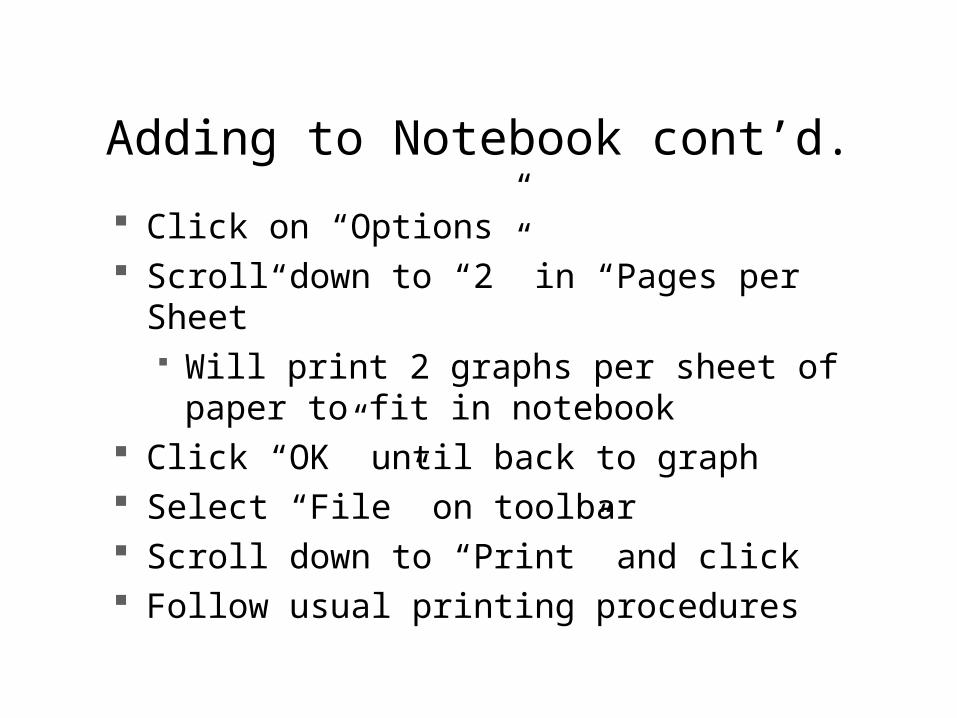
Click on “Options” Scroll down to “2” in “Pages per Sheet”
Will print 2 graphs per sheet of paper to fit in notebook
Click “OK” until back to graph Select “File” on toolbar Scroll down to “Print” and click Follow usual printing procedures
Adding to Papers
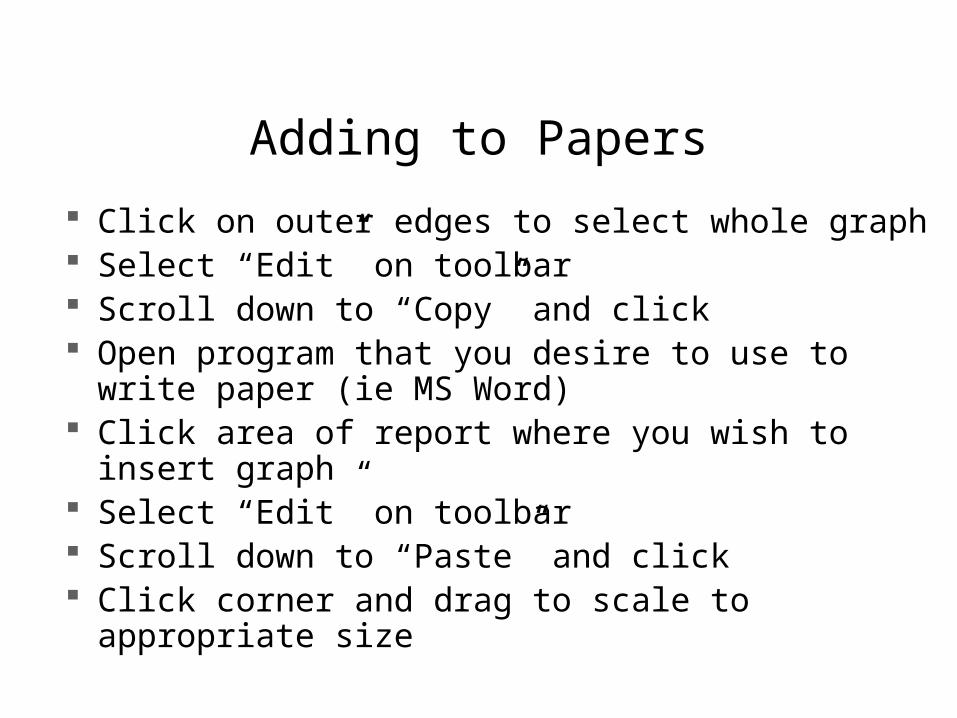
Click on outer edges to select whole graph Select “Edit” on toolbar Scroll down to “Copy” and click Open program that you desire to use to write paper (ie
MS Word) Click area of report where you wish to insert graph Select “Edit” on toolbar Scroll down to “Paste” and click Click corner and drag to scale to appropriate size