chemistry 2008 mechanism of gliadin-glutenin cross … · 22 the gluten proteins gliadin and...
TRANSCRIPT
1
This is the final draft post-refereeing. 1
The publisher’s version can be found at 2
http://dx.doi.org/10.1016/j.foodchem.2007.08.082 3
Please cite this article as: Lagrain, B., Thewissen, B.G., Brijs, K., Delcour J.A. 4
Mechanism of gliadin-glutenin cross-linking during hydrothermal treatment, Food 5
Chemistry 2008, 107, 753-760. 6
7
Mechanism of gliadin-glutenin cross-linking during hydrothermal treatment 8
9
Bert Lagrain*, Bert G. Thewissen, Kristof Brijs and Jan A. Delcour 10
Laboratory of Food Chemistry and Biochemistry, Katholieke Universiteit Leuven 11
Kasteelpark Arenberg 20, B-3001 Leuven, Belgium 12
13
*Corresponding author: 14
Bert Lagrain 15
Tel: + 32 (0) 16321634 16
Fax: + 32 (0) 16321997 17
E-mail address: [email protected] 18
19
20

2
Abstract 21
The gluten proteins gliadin and glutenin are important for wheat flour functionality and 22
they undergo changes during heat treatment involving sulfhydryl (SH) groups. To change 23
the level of SH-groups during hydrothermal treatment, the oxidant potassium iodate (2.1 24
µmol/g protein) and the reducing agent dithiothreitol (DTT, 6.1 µmol/g protein) were added 25
to 20% (w/w) gluten-in-water suspensions at room temperature, at 90 °C and after 15 min 26
at 95°C and the viscosity was measured by the Rapid Visco Analyser (RVA). Protein 27
extractabilities after hydrothermal treatment were determined with size-exclusion and 28
reversed-phase HPLC. DTT decreased maximal RVA viscosity and the levels of extractable 29
α- and γ-gliadin and this decrease was independent of the time of addition during 30
hydrothermal treatment. In contrast, potassium iodate increased the levels of extractable α- 31
and γ-gliadin. Its impact was less when added at later times during RVA analysis. A SH-32
blocking agent (N-ethylmaleimide, 8.0 µmol/g protein) added at room temperature to the 33
gluten suspension, decreased RVA viscosity at 95 °C and increased the extractabilities of 34
glutenin and α- and γ-gliadin after hydrothermal treatment. Subsequent addition at 90 °C of 35
a reducing agent (glutathione, 3.1 and 6.2 µmol/g protein) recovered the control RVA 36
profile and restored the control protein extractabilities after RVA analysis. This shows the 37
importance of heat-induced gliadin-glutenin reactions for gluten viscosity and of the 38
presence of free SH-groups for the polymerization of gluten proteins. A model explaining 39
gliadin-glutenin polymerization through a sulfhydryl-disulfide exchange mechanism and 40
demonstrating the effects of redox agents is put forward. 41
42
3
Abbreviations: db, dry basis; DTT, dithiothreitol, GSH, glutathione; HPLC, high 43
performance liquid chromatography; NEMI, N-ethylmaleimide; RP, reversed-phase; SDS, 44
sodium dodecyl sulfate; SE, size-exclusion; SH, sulfhydryl; SS, disulfide 45
46
47
Keywords: Wheat gluten, Heat treatment, Gliadin-glutenin interaction, Protein 48
extractability, Redox agents, Thiol-disulfide interchange49
4
1. Introduction 50
The storage proteins of wheat (consisting of monomeric gliadin and polymeric glutenin) are 51
very important for wheat flour functionality. They have the unique rheological ability to 52
form a dough matrix which determines bread quality. Gliadin represents a heterogeneous 53
mixture of proteins containing α-, γ-, and ω-gliadins. All cysteine residues in α- and γ-type 54
gliadins are involved in intra-chain disulfide (SS) bonds. In contrast, ω-gliadins lack 55
cysteine residues. Glutenin consists of glutenin subunits (GS) of high molecular weight 56
(HMW-GS) and low molecular weight (LMW-GS). The LMW-GS are classified as B-, C-, 57
and D-types. LMW-GS form both intra-chain and inter-chain disulfide bonds among 58
themselves and with HMW-GS leading to glutenin polymers (Veraverbeke & Delcour, 59
2002). Heat treatment of these proteins strongly influences the characteristics of baked 60
products. The changes induced by heat eventually lead to large gluten protein aggregates 61
with formation of gliadin-glutenin bonds through SS (cross-)linking in the process 62
(Lagrain, Brijs, Veraverbeke & Delcour, 2005; Morel, Redl & Guilbert, 2002; Redl, Morel, 63
Bonicel, Vergnes & Guilbert, 1999; Schofield, Bottomley, Timms & Booth, 1983; Singh & 64
MacRitchie, 2004). Lagrain et al. (2005) applied a temperature profile and simultaneously 65
measured rheological changes of a gluten-water suspension in the Rapid Visco Analyser 66
(RVA). When the temperature was increased to 95 °C, mainly the glutenin extractability 67
decreased. The polymerization of glutenin may involve oxidation (Singh et al., 2004) and 68
sulfhydryl (SH)-SS exchange (Lagrain et al., 2005). Holding at 95 °C resulted in 69
polymerization of both gliadin and glutenin and this caused a viscosity rise in the RVA 70
profile (Lagrain et al., 2005). Oxidizing agents decreased RVA viscosities in the holding 71
step and increased sodium dodecyl sulfate (SDS) protein extractabilities suggesting 72

5
decreased gliadin-glutenin cross-linking. In contrast, reducing agents increased RVA 73
viscosity at lower temperatures and lowered SDS extractabilities. It was postulated that 74
addition of reducing agent facilitates gliadin-glutenin cross-linking during heating while 75
oxidants hinder gluten polymerization due to decreased levels of free SH-groups and less 76
flexibility of the glutenin chains (Lagrain, Brijs & Delcour, 2006). These observations were 77
ascribed to a SH-SS exchange mechanism (Lagrain et al., 2006) as originally proposed by 78
(Schofield et al., 1983). This was concluded from the observation that the total level of free 79
SH-groups remained constant irrespective of the temperature (Schofield et al., 1983). 80
Recently, an SH-SS exchange mechanism in gluten was also observed under high pressure 81
(Schurer, Kieffer, Wieser & Koehler, 2007) and in bread making (Lagrain, Thewissen, 82
Brijs & Delcour, 2007). The SH-SS exchange mechanism requires free SH-groups. Thus, 83
changes in the level of free SH during hydrothermal treatment should affect gliadin-84
glutenin association. 85
To further increase insight into the mechanism of the covalent association between gliadin 86
and glutenin during hydrothermal treatment, the aim of the present work is to investigate 87
the importance of free SH-groups at certain temperatures. To this end, RVA viscosities and 88
protein extractabilities were measured in the presence of redox additives.89
6
2. Experimental 90
2.1. Materials 91
All reagents were at least of analytical grade and from Sigma-Aldrich (Steinheim, 92
Germany) unless otherwise specified. Vital wheat gluten [moisture content: 6.10%, crude 93
protein content (N x 5.7): 83.5% on dry basis (db), starch content: 10.4% on db] was 94
obtained by industrial gluten-starch separation of European spring wheat flour by Tate & 95
Lyle Europe (Aalst, Belgium). The gluten powder passed through a 250 µm sieve. 96
97
2.2. Controlled heating and cooling 98
A Rapid Visco Analyser (RVA-4D, Newport Scientific, Sydney, Australia) was used to 99
apply a temperature profile to 25.00 g of 20% (w/w) suspensions of control gluten in the 100
presence or absence of additives (Lagrain et al., 2006). The RVA converts the current 101
required to maintain constant mixing speed (160 rpm) of a paddle into a viscosity value in 102
Poise (P, 0.1 kg m-1 s-1), the unit of dynamic viscosity. This viscosity value is further 103
referred to as RVA viscosity. At the start of the RVA analysis, suspensions were 104
homogenized by hand-shaking and mixing (900 rpm for 20 s). The temperature profile 105
included a temperature increase from room temperature to 40 °C (in 1 min), a linear 106
temperature increase to 95 °C in 14 min, a holding step (40 min at 95 °C), a cooling step (7 107
min) with a linear temperature decrease to 50 °C, and a final holding step at 50 °C (13 108
min). Potassium iodate (2.1 µmol/g protein) or dithiothreitol (6.1 µmol DTT/g protein) 109
were added as aqueous solutions (200 µl) immediately before RVA analysis, after 13 min 110
(at 90 °C) and after 30 min (after 15 min at 95 °C). N-ethylmaleimide (8.0 µmol NEMI/g 111
protein) was added as aqueous solution (200 µl) immediately before RVA analysis. At 90 112
7
°C, 3.1 or 6.2 µmol glutathione (GSH)/g protein was added to the suspension with NEMI. 113
After RVA analysis, the gluten suspensions were frozen in liquid nitrogen, freeze-dried and 114
ground in a laboratory mill (IKA, Staufen, Germany). Three characteristic viscosity values 115
were recorded. The initial viscosity, the highest viscosity (in cP) at the start of the RVA 116
run; the minimal viscosity, the lowest viscosity before the holding step; and the maximal 117
viscosity, the highest viscosity in the holding step at 95 °C (Lagrain et al., 2006). All RVA 118
analyses were performed at least in triplicate. The standard deviations calculated for the 119
initial, the minimal and the maximal viscosities were less than 10% of the respective mean 120
values. 121
122
2.3. Size-exclusion HPLC 123
SE-HPLC was conducted using a LC-2010 system (Shimadzu, Kyoto, Japan) with 124
automatic injection. Freeze-dried gluten samples (1.0 mg) were shaken with 1.0 ml of a 125
0.05 M sodium phosphate buffer (pH 6.8) containing 2.0% SDS for 60 min at room 126
temperature. After centrifugation (5 min, 10 000 g), the supernatant (60 µl) was loaded on a 127
Biosep-SEC-S4000 column (Phenomenex, Torrance, United States). The elution solvent 128
was (1:1, v/v) acetonitrile (ACN)/water containing 0.05% (v/v) trifluoroacetic acid (TFA). 129
The flow rate was 1.0 ml/min at a temperature of 30 °C (Dachkevitch & Autran, 1989) and 130
eluted protein was detected at 214 nm. 131
The elution profiles were divided into two fractions using the lowest absorbance reading 132
between the two peaks as the cutoff point. The first fraction corresponded to the level of 133
SDS extractable glutenin, the second was assigned to the level of SDS extractable gliadin. 134
Total SDS extractable protein, gliadin and glutenin were calculated from the peak areas and 135
8
expressed as percentage of the peak area of unheated gluten extracted with the SDS buffer 136
in the presence of 1.0% DTT. 137
138
2.4. Reversed-phase HPLC 139
Samples (100.0 mg) were extracted three times with 3.0 ml 60% (v/v) ethanol (gliadin 140
extract) and three times with 3.0 ml 0.05 M Tris/HCl buffer (pH 7.5) containing 50% 141
propan-1-ol, 2.0 M urea and 1% (w/v) DTT and kept under nitrogen (reduced glutenin 142
extract). The gliadin and glutenin extracts were loaded (80 µl) on a Nucleosil 300-5 C8 143
column (Machery-Nagel, Düren Germany). The elution system consisted of deionised 144
water + 0.1% (v/v) TFA (A) and ACN + 0.1% TFA (v/v) (B). Proteins were eluted with a 145
linear gradient from 24% B to 56% B in 50 min and detected at 214 nm. 146
α-Gliadin, γ-gliadin, ω-gliadin, B/C-LMW-GS, D-LMW-GS and HMW-GS were 147
distinguished based on absorbance minima between specific peaks as outlined earlier by 148
Wieser, Antes & Seilmeier (1998). 149
150
2.5. Statistical analysis of data 151
Significant differences (P < 0.05) in initial, minimal and maximal RVA viscosities were 152
determined by the ANOVA procedure using the SAS package (SAS system for Windows 153
V8, SAS Institute Inc., Cary, NC, USA) and were based on at least three individual 154
measurements. 155
156

9
3. Results and Discussion 157
3.1 Addition of redox agents at different points during RVA analysis 158
The impact on RVA viscosity of the addition of 6.1 µmol DTT/g protein (800 ppm) at 0 159
min, at 13 min (90 °C) and at 30 min (after 15 min at 95 °C) during hydrothermal treatment 160
of a 20% (w/w) gluten-in-water suspension is shown in Figure 1. The control gluten 161
suspension showed a substantial initial RVA viscosity which decreased when the 162
temperature was raised to 90 °C. In the holding step (95 °C), the RVA viscosity steadily 163
increased. During cooling, the RVA viscosity decreased again and, in the final holding step 164
at 50 °C, no viscosity changes were observed (Fig. 1). These effects were previously 165
described by Lagrain et al. (2005). The interaction between gliadin and glutenin is 166
responsible for the initial RVA viscosity (Lagrain et al., 2005). The decrease of RVA 167
viscosity during heating can be ascribed to changes in physico-chemical properties of the 168
gluten proteins, such as conformational changes and a loss of hydrogen bonds, which 169
readily break on heating. The viscosity rise in the RVA profile at temperatures exceeding 170
90 °C was caused by formation of large glutenin polymers with the incorporation of gliadin 171
through SS bonds impacting the rotation of the RVA paddle. The sudden decrease in 172
apparent viscosity during cooling was due to the protein polymers aggregating tightly and 173
sticking to the paddle caused by the loss of kinetic energy from heating (Lagrain et al., 174
2005). Addition of 6.1 µmol DTT/g protein before RVA analysis resulted in initial, 175
minimal, and maximal viscosities that were all significantly lower (P < 0.05) than the 176
control viscosities (Table 1). Minimal viscosity was reached at lower temperatures (Fig. 1). 177
Addition of DTT at 13 or 30 min still resulted in a significantly lower maximal viscosity 178
(Table 1). Heating gluten suspensions first decreased glutenin extractability and, during 179
10
holding at 95 °C, also gliadin extractability (Lagrain et al., 2005). The effect of the addition 180
of 6.1 µmol DTT/g protein on protein SDS extractability after RVA analysis was the same 181
for the addition after 0, 13 or 30 min (Table 2). Addition of DTT decreased both gliadin 182
and glutenin SDS extractabilities of control gluten after hydrothermal treatment. The 183
decrease in gliadin extractability could be attributed to a decrease in α- and γ-gliadin 184
extractabilities as calculated from RP-HPLC data (Fig. 2). The levels of α-gliadin and γ-185
gliadin decreased drastically after RVA analysis of control gluten, to respectively 13% and 186
6% of their original values, whereas that of ω-gliadin only slightly decreased to 73% of its 187
original extractability. Addition of DTT did not affect ω-gliadin extractability after RVA 188
analysis, but α- and γ-gliadin became nearly unextractable in 60% ethanol (Fig. 2), 189
irrespective whether DTT was added at 0, 13 or 30 min during RVA analysis. The decrease 190
in extractable gliadin levels after hydrothermal treatment (Fig. 2a) was accompanied by a 191
significant increase in the apparent levels of the glutenin subunits (Fig. 2b), suggesting that 192
a major portion of gliadins, unextractable in 60% ethanol after heat treatment, became 193
extractable in the glutenin fraction. This resulted mainly in an apparent increased 194
proportion of B/C-LMW-GS. The total amount of extractable protein (gliadin + glutenin) 195
after complete reduction lowered when holding gluten at 95°C for 15 min and longer in the 196
RVA (Lagrain et al., 2005) and this effect was enhanced with the addition of DTT, 197
suggesting a greater heat sensitivity of gluten proteins in the presence of a reducing agent. 198
While adding 2.1 µmol potassium iodate/g protein at the start of RVA analysis resulted in 199
almost no viscosity increase in the holding step, the addition at 13 min or at 30 min led to a 200
maximal viscosity that did not differ significantly from the control viscosity (Figure 3, 201
Table 1). Potassium iodate increased the protein extractabilities at the end of the RVA run 202
11
compared to the control after hydrothermal treatment, but to a lesser extent than added at 203
later points during hydrothermal treatment. The effect could be ascribed to both higher 204
glutenin and gliadin extractabilities (Table 2). More specifically, the addition of potassium 205
iodate mainly resulted in increased α- and γ-gliadin extractabilities after RVA analysis 206
accompanied by apparent decreases in LMW-GS compared to the control after 207
hydrothermal treatment (Figure 4). The sum of the levels of extractable gliadin and glutenin 208
after reduction was higher in the presence of potassium iodate after RVA treatment, but it 209
decreased when iodate was added later in the process approaching the levels of control total 210
extractability (results not shown). 211
Reducing agents, such as DTT, facilitate gliadin-glutenin cross-linking during heating. This 212
effect depends on the available concentration of SH-groups in the system (Lagrain et al., 213
2006). Therefore, DTT addition had the strongest effect on the solubility because of the 214
highest concentration of SH-groups. In the control gluten suspension, the SH-concentration 215
was lower, and, hence, the extent of SH-SS interchange was lower than when DTT was 216
added. Moreover the effect of DTT was independent of the time of addition during 217
hydrothermal treatment. Thus, the introduction of a certain level of free SH-groups at any 218
time during hydrothermal treatment results in proportionally more gliadin-glutenin cross-219
linking and less extractability of the proteins even after total reduction. In contrast, oxidants 220
lower the level of free SH and decrease glutenin flexibility. This hinders SH-SS exchange 221
reactions between gliadin and glutenin that normally occur at temperatures of at least 90 °C 222
(Lagrain et al., 2006). As such, oxidizing agents terminate gluten polymerization at that 223
specific point of their addition during hydrothermal treatment with, depending on their 224
concentration, little if any further reaction afterwards. Since ω-gliadins do not contain SH-225

12
groups, they are not involved in SH-SS exchange reactions and their extractability is not 226
influenced by redox agents. 227
228
3.2 Combination of NEMI and glutathione 229
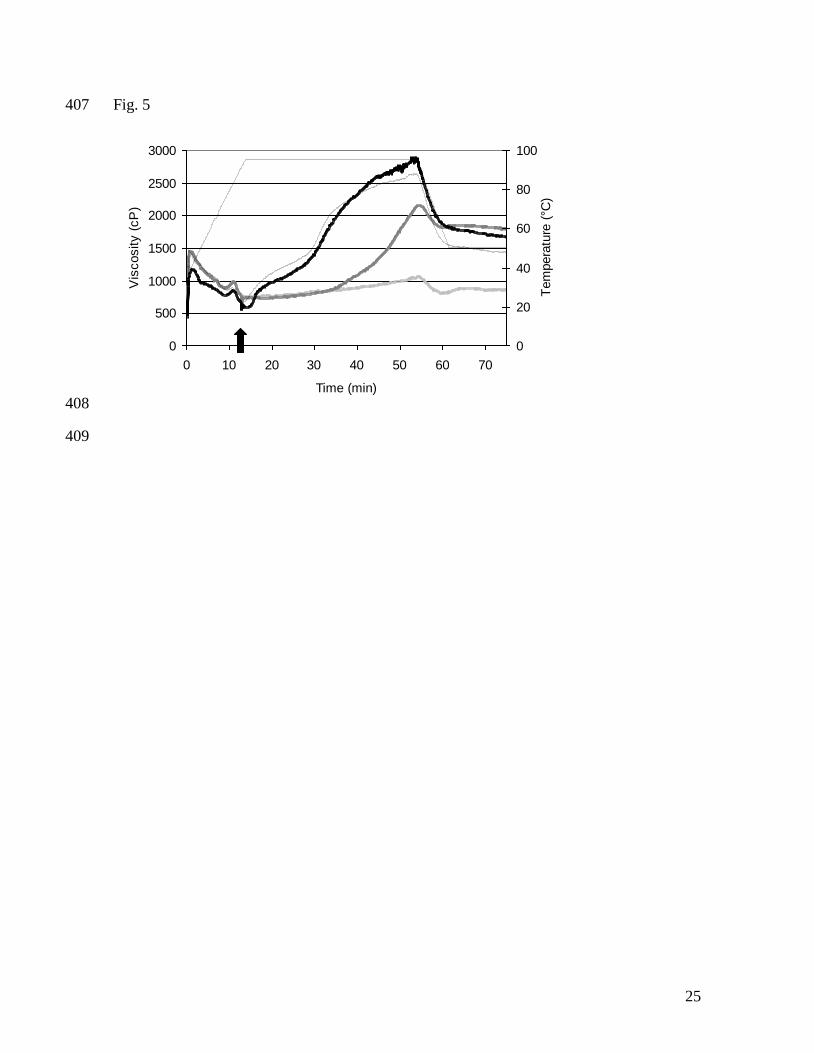
The gluten proteins contained about 8.0 µmol free SH per g protein (Lagrain et al., 2005). 230
Addition of an equimolar level of the SH-blocking agent NEMI to the gluten suspension 231
resulted in an RVA profile with no viscosity increase in the heating and holding phases 232
(Fig. 5). Potassium iodate and NEMI had similar effects on RVA viscosity (Fig 3 and 5). 233
Subsequent addition of increasing concentrations of reducing agent with one SH-group 234
(GSH) at minimal RVA viscosity (after 13 min and at 90 °C) increased RVA viscosity at 235
95 °C, and 6.2 µmol GSH/g protein restored the control RVA profile (Fig. 5). NEMI 236
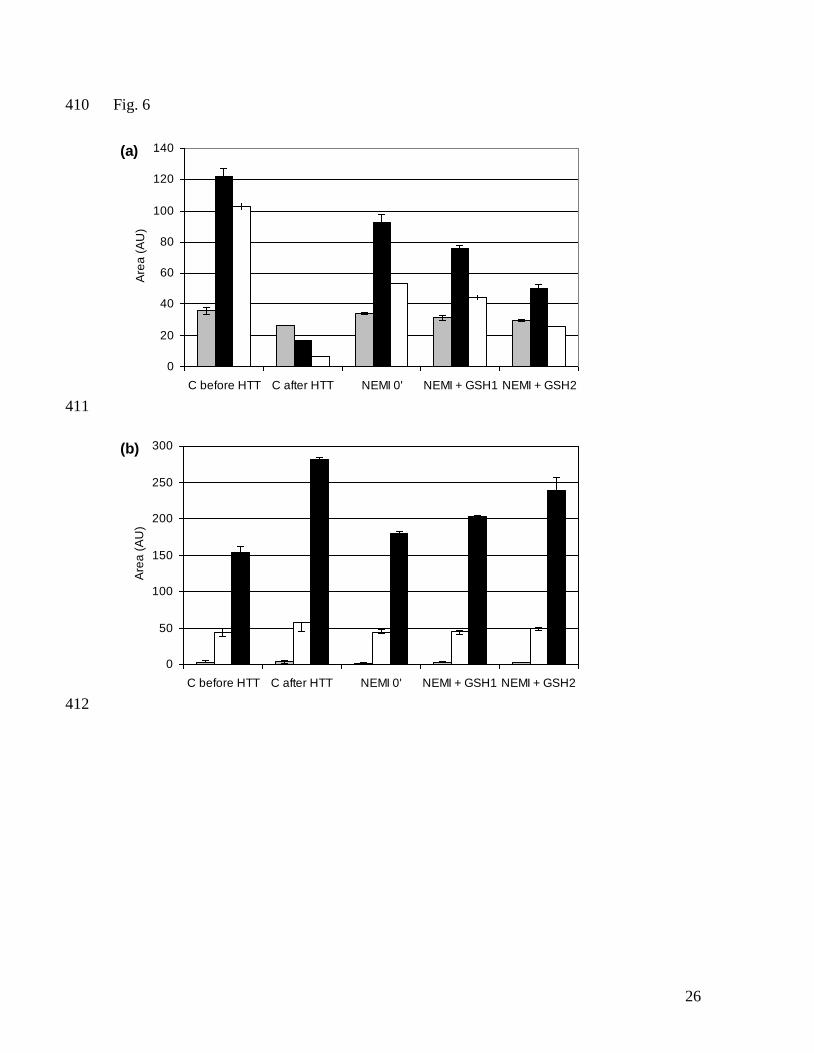
increased gliadin and, to a lesser extent, glutenin extractabilities after heat treatment of the 237
control, suggesting less gliadin-glutenin reactions. Subsequent addition of increasing GSH 238
concentrations decreased protein extractabilities to approximate those of a control 239
suspension at 6.2 µmol GSH/g protein. This was reflected in decreased α- and γ-gliadin 240
extractabilities and apparent increases in LMW-GS extractabilities after RVA analysis over 241
the control extractability (Fig. 6). 242
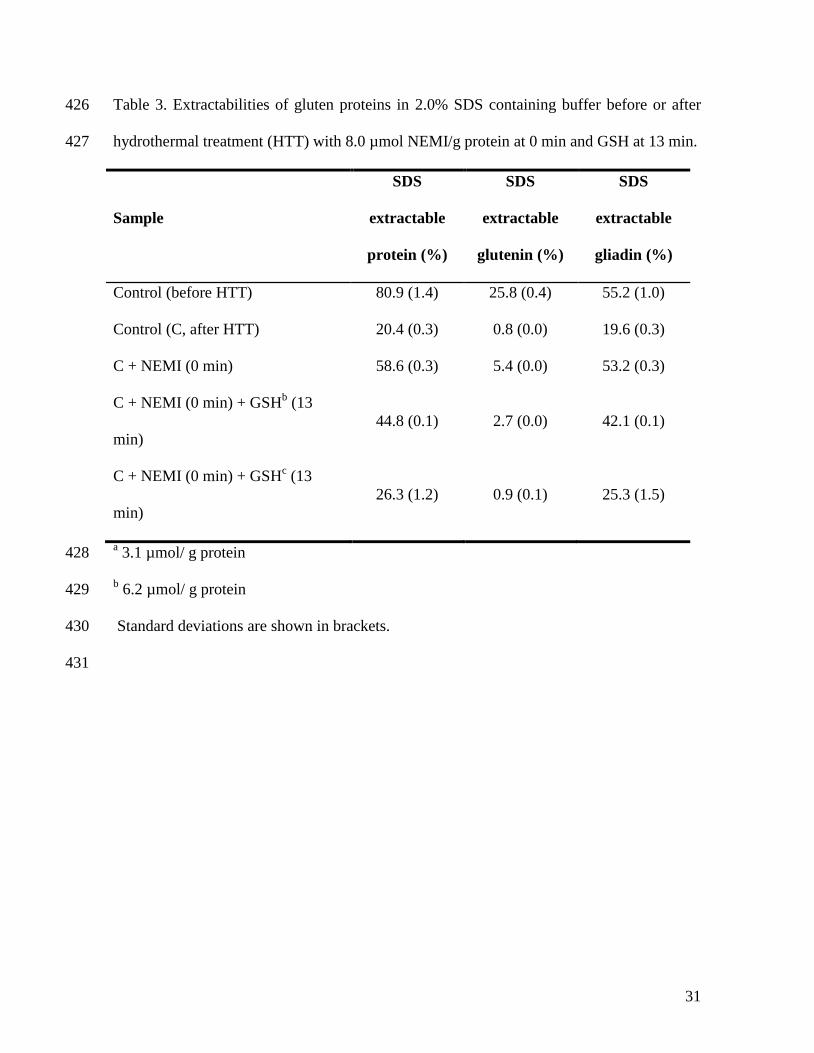
The addition of 8.0 µmol NEMI/g protein may alkylate and, as such, block the free SH-243
groups that were measured in unheated gluten proteins. Apparently this did not suffice to 244
completely prevent further glutenin polymerization, since glutenin extractability decreased 245
even in the presence of such a concentration of NEMI (Table 3). Addition of higher 246
concentrations of NEMI (100 µmol/g protein) had similar effects on RVA viscosity 247
(Lagrain et al., 2005), but completely inhibited the effect of hydrothermal treatment on 248

13
protein extractability with no change in gliadin and glutenin extractabilities after heating 249
(results not shown). The fact that low concentrations of NEMI could not totally inhibit 250
further glutenin linking during heating, indicates the possible exposure of previously 251
inaccessible free SH-groups by conformational changes. Such groups may induce glutenin 252
linking mainly through oxidation. This then would result in almost no free SH-groups at 95 253
°C preventing gliadin-glutenin cross-linking. 254
The addition of GSH at 90 °C after SH blocking probably restored the ability of gliadin to 255
link to glutenin through a SH-SS exchange mechanism. However, in comparison to the 256
control, the alkylated SH-groups were no longer accessible for reduction and, therefore, the 257
protein extractability after addition of GSH approximated, but did not completely reached 258
the control extractabilities. 259
260
3.3 Model of gliadin-glutenin cross-linking 261
As a whole, our results combined with earlier studies (Guerrieri, Alberti, Lavelli & Cerletti, 262
1996; Singh et al., 2004) lead to a view on gliadin-glutenin reactions and the impact of 263
oxidants and reducing agents therein that we visualize in Figure 7. Glutenin is presented as 264
a large molecule containing free SH-groups, while gliadin is a smaller molecule with only 265
intramolecular SS bonds and, hence, no free SH-moieties. Heating to 90 °C first resulted in 266
conformational changes exposing previously unavailable areas (Guerrieri et al., 1996) 267
possibly containing free SH-groups and, next, polymerization of glutenin with oxidation of 268
most but not all SH-groups (Lagrain et al., 2005; Singh et al., 2004). At 90 °C still some 269
free SH-groups can be measured (Lagrain et al., 2006; Lagrain et al., 2005). At 270
temperatures exceeding 90 °C, these free SH-groups of glutenin can induce a covalent 271
14
linkage with gliadin through a heat induced SH-SS exchange mechanism. This exchange 272
reaction is catalyzed by SH-groups and readily occurs in (other) proteins at higher 273
temperatures. The free SH-group carries out nucleophilic attack on the sulfur atom of a 274
disulfide (Volkin & Klibanov, 1987). It is probable that conformational changes at 90 °C in 275
the gluten proteins (Guerrieri et al., 1996) are necessary for gliadin-glutenin cross-linking. 276
Addition of a reducing agent, such as DTT, increases the level of free SH-groups. Before 277
heating this first leads to depolymerization of protein-protein disulfides with the formation 278
of proteins with free SH-groups. At higher temperatures, these free SH-groups increase the 279
level of gliadin-glutenin cross-linking. These observations were also made for gluten under 280
high pressure in the presence of cysteine supporting the hypothesis of an ionic mechanism 281
for SH-SS exchange reactions in gluten proteins such as stated by Schurer et al. (2007). In 282
contrast, the presence of NEMI or an oxidant such as potassium iodate decreases the level 283
of free SH-groups (Lagrain et al., 2006) leaving little if any free SH-groups in glutenin and 284
hence little if any gliadin-glutenin cross-linking at temperatures exceeding 90 °C. However, 285
subsequent addition of a reducing agent (e.g. GSH) containing at least one free SH-group, 286
leads to incorporation of this group in glutenin and, as such, gliadin-glutenin cross-linking 287
becomes possible again (Fig. 7). The subsequent addition of reducing agent at 90 °C can 288
restore the control situation at this temperature. This then will lead to a similar level of 289
gliadin-glutenin cross-linking with the recovery of the control RVA profile (Fig. 5) and the 290
control SDS extractability (Table 3). 291
292
4. Conclusions 293

15
We can conclude that, at any time during hydrothermal treatment, free SH-groups initiate 294
gliadin-glutenin reactions at higher temperatures. The extent of these reactions depends on 295
the available concentration of SH-groups in the system. Removing such groups by addition 296
of an oxidant or a SH blocking agent strongly reduces the extent to which gliadin becomes 297
unextractable. By subsequently increasing the level of free SH-groups by adding a reducing 298
agent, the capacity of gliadin to link to glutenin is restored. These findings can contribute to 299
more insight in the impact of redox agents in cereal based processes such as bread, pasta, 300
and cookie production. 301
302
303

16
Acknowledgements 304
K. Brijs wishes to acknowledge the Industrial Research Fund (K.U.Leuven, Leuven, 305
Belgium). Financial support was obtained from the Institute for the Promotion of 306
Innovation through Science and Technology in Flanders (IWT-Vlaanderen, Brussels, 307
Belgium). 308
309
17
References 310
Dachkevitch, T., & Autran, J. C. (1989). Prediction of baking quality of bread wheats in 311
breeding programs by size-exclusion high-performance liquid-chromatography. Cereal 312
Chemistry, 66(6), 448-456. 313
Guerrieri, N., Alberti, E., Lavelli, V., & Cerletti, P. (1996). Use of spectroscopic and 314
fluorescence techniques to assess heat-induced molecular modifications of gluten. Cereal 315
Chemistry, 73(3), 368-374. 316
Lagrain, B., Brijs, K., & Delcour, J. A. (2006). Impact of redox agents on the physico-317
chemistry of wheat gluten proteins during hydrothermal treatment. Journal of Cereal 318
Science, 44(1), 49-53. 319
Lagrain, B., Brijs, K., Veraverbeke, W. S., & Delcour, J. A. (2005). The impact of heating 320
and cooling on the physico-chemical properties of wheat gluten-water suspensions. Journal 321
of Cereal Science, 42(3), 327-333. 322
Lagrain, B., Thewissen, B. G., Brijs, K., & Delcour, J. A. (2007). Impact of redox agents on 323
the extractability of gluten proteins during bread making. Journal of Agricultural and Food 324
Chemistry, 55(13), 5320-5325. 325
Morel, M. H., Redl, A., & Guilbert, S. (2002). Mechanism of heat and shear mediated 326
aggregation of wheat gluten protein upon mixing. Biomacromolecules, 3(3), 488-497. 327
Redl, A., Morel, M. H., Bonicel, J., Vergnes, B., & Guilbert, S. (1999). Extrusion of wheat 328
gluten plasticized with glycerol: Influence of process conditions on flow behavior, 329
rheological properties, and molecular size distribution. Cereal Chemistry, 76(3), 361-370. 330
18
Schofield, J. D., Bottomley, R. C., Timms, M. F., & Booth, M. R. (1983). The effect of heat 331
on wheat gluten and the involvement of sulfhydryl-disulfide interchange reactions. Journal 332
of Cereal Science, 1(4), 241-253. 333
Schurer, F., Kieffer, R., Wieser, H., & Koehler, P. (2007). Effect of hydrostatic pressure 334
and temperature on the chemical and functional properties of wheat gluten II. Studies on 335
the influence of additives. Journal of Cereal Science, 46(1), 39-48. 336
Singh, H., & MacRitchie, F. (2004). Changes in proteins induced by heating gluten 337
dispersions at high temperature. Journal of Cereal Science, 39(2), 297-301. 338
Veraverbeke, W. S., & Delcour, J. A. (2002). Wheat protein composition and properties of 339
wheat glutenin in relation to breadmaking functionality. Critical Reviews in Food Science 340
and Nutrition, 42(3), 179-208. 341
Volkin, D. B., & Klibanov, A. M. (1987). Thermal-destruction processes in proteins 342
involving cystine residues. Journal of Biological Chemistry, 262(7), 2945-2950. 343
Wieser, H., Antes, S., & Seilmeier, W. (1998). Quantitative determination of gluten protein 344
types in wheat flour by reversed-phase high-performance liquid chromatography. Cereal 345
Chemistry, 75(5), 644-650. 346
347
348
349

19
Fig. captions 350
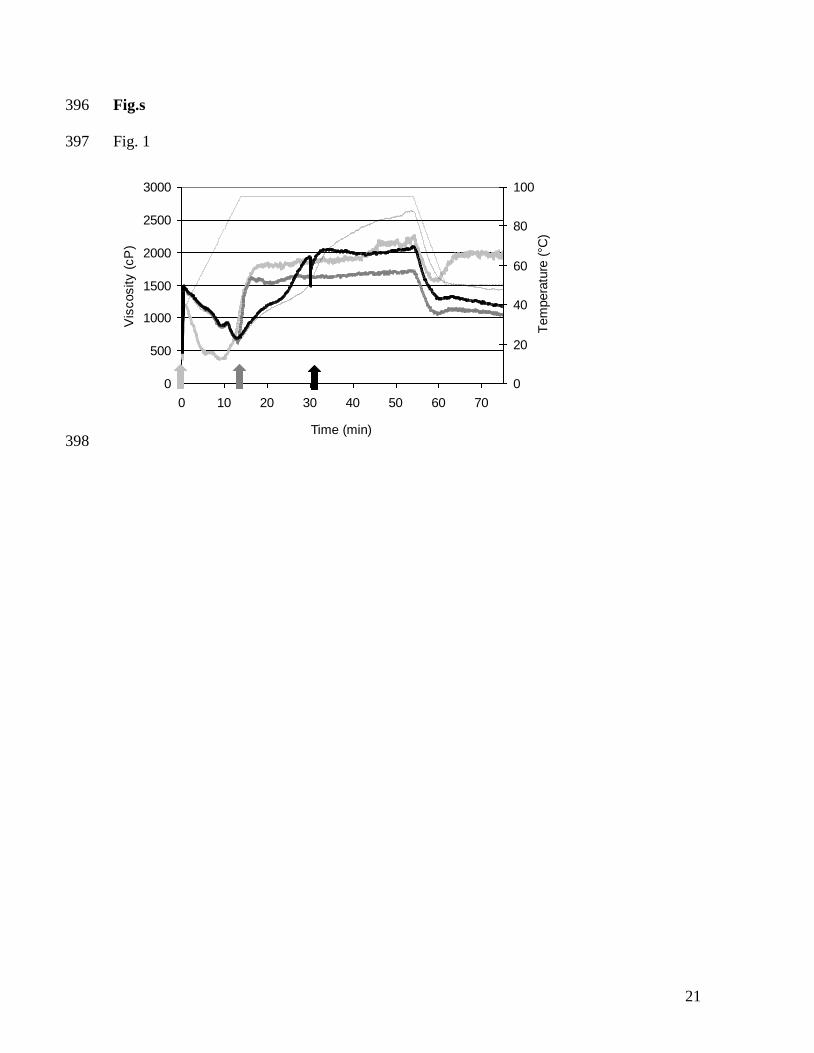
Fig. 1. RVA profiles (40 min at 95 °C) of gluten-water suspensions with addition of DTT 351
(6.1 µmol/g gluten) at 0, 13 and 30 min. Control viscosity profile (------), DTT at 0 min 352
( ), DTT at 13 min ( ), DTT at 30 min ( ), temperature ( ). Arrows 353
indicate moments of addition. 354
Fig. 2. Areas in RP-HPLC chromatogram representing gluten extractability with 60 % 355
ethanol and 0.05 M Tris/HCl buffer (pH 7.5) with 50% propan-1-ol, 2.0 M urea and 1% 356
(w/v) DTT after RVA analysis with addition of DTT (6.1 µmol/g gluten) at 0, 13 and 30 357
min during RVA analysis. Fig. 2a shows the gliadin fraction with ω-gliadin (grey), α-358
gliadin (black) and γ-gliadin (white). Fig. 2b shows the reduced glutenin fraction with the 359
apparent amounts of D-LMW-GS (grey), HMW-GS (white) and B/C-LMW-GS (black); 360
AU, arbitrary units; C, control gluten suspension; HTT, hydrothermal treatment. 361
Fig. 3. RVA profiles (40 min at 95 °C) of gluten-water suspensions with addition of 362
potassium iodate (2.1 µmol/g gluten) at 0, 13 and 30 min. Control viscosity profile 363
(------), potassium iodate at 0 min ( ), potassium iodate at 13 min ( ), potassium 364
iodate at 30 min ( ), temperature ( ). Arrows indicate moments of addition. 365
Fig. 4. Areas in RP-HPLC chromatogram representing gluten extractability after RVA 366
analysis with addition of potassium iodate (2.1 µmol/g gluten) at 0, 13 and 30 min during 367
RVA analysis. Fig. 4a shows the gliadin fraction with ω-gliadin (grey), α-gliadin (black) 368
and γ-gliadin (white). Fig. 4b shows the reduced glutenin fraction with the apparent 369
amounts of D-LMW-GS (grey), HMW-GS (white) and B/C-LMW-GS (black); AU, 370
arbitrary units; C, control gluten suspension; HTT, hydrothermal treatment. 371

20
Fig. 5. RVA profiles (40 min at 95 °C) of gluten-water suspensions with addition of NEMI 372
(8.0 µmol/g gluten) at 0 min and GSH at 13 min. Control viscosity profile (------), 8.0 373
µmol NEMI/g of protein ( ), NEMI + 3.1 µmol GSH/g protein at 13 min ( ), NEMI 374
+ 6.2 µmol GSH/g protein at 13 min ( ), temperature ( ). Arrow indicates 375
moment of addition. 376
Fig. 6. Areas in RP-HPLC chromatogram representing gluten extractability after RVA 377
analysis with addition of NEMI (8.0 µmol/g gluten) at 0 min and GSH at 13 min during 378
RVA analysis. Fig. 6a shows the gliadin fraction with ω-gliadin (grey), α-gliadin (black) 379
and γ-gliadin (white). Fig. 6b shows the reduced glutenin fraction with the apparent 380
amounts of D-LMW-GS (grey), HMW-GS (white) and B/C-LMW-GS (black); AU, 381
arbitrary units; C, control gluten suspension; GSH1, 3.1 µmol GSH/g protein at 13 min; 382
GSH2, 6.2 µmol GSH/g protein at 13 min; HTT, hydrothermal treatment. 383
Fig. 7. Model for gliadin-glutenin cross-linking through SH-SS exchange reactions during 384
hydrothermal treatment. (I.1) In the absence of additives heating to 90 °C leads to 385
conformational changes exposing previously unavailable free SH-groups and 386
polymerization of glutenin with oxidation of SH-groups. (I.2) Glutenin can link to gliadin 387
at temperatures exceeding 90 °C through a SH-SS exchange reaction and the generated free 388
SH-group can react further with either gliadin or glutenin. (II.1) Reducing agents first 389
depolymerize glutenin and increase the level of free SH-groups and, hence, (II.2) increase 390
gliadin-glutenin cross-linking. (III.1) Addition of an oxidizing agent decreases the level of 391
free SH and, hence, hinders glutenin linking and gliadin-glutenin cross-linking above 90 392
°C. (III.2) Subsequent addition of a SH containing agent can introduce new free SH-groups 393
in the gluten proteins and again induce gliadin-glutenin covalent cross-linking. 394
395
21
Fig.s 396
Fig. 1 397
0
500
1000
1500
2000
2500
3000
0 10 20 30 40 50 60 70
Time (min)
Vis
cosity (
cP
)
0
20
40
60
80
100
Tem
pera
ture
(°C
)
398

22
Fig. 2 399
(a)
0
20
40
60
80
100
120
140
C before HTT C after HTT DTT 0' DTT 13' DTT 30'
Are
a (
AU
)
400
(b)
0
50
100
150
200
250
300
350
C before HTT C after HTT DTT 0' DTT 13' DTT 30'
Are
a (
AU
)
401

23
Fig. 3 402
0
500
1000
1500
2000
2500
3000
0 10 20 30 40 50 60 70
Time (min)
Vis
cosity (
cP
)
0
20
40
60
80
100
Tem
pera
ture
(°C
)
403

24
Fig. 4 404
(a)
0
20
40
60
80
100
120
140
C before HTT C after HTT KIO3 0' KIO3 13' KIO3 30'
Are
a (
AU
)
405
(b)
0
50
100
150
200
250
300
350
C before HTT C after HTT KIO3 0' KIO3 13' KIO3 30'
Are
a (
AU
)
406
25
Fig. 5 407
0
500
1000
1500
2000
2500
3000
0 10 20 30 40 50 60 70
Time (min)
Vis
cosity (
cP
)
0
20
40
60
80
100
Tem
pera
ture
(°C
)
408
409
26
Fig. 6 410
(a)
0
20
40
60
80
100
120
140
C before HTT C after HTT NEMI 0' NEMI + GSH1 NEMI + GSH2
Are
a (
AU
)
411
(b)
0
50
100
150
200
250
300
C before HTT C after HTT NEMI 0' NEMI + GSH1 NEMI + GSH2
Are
a (
AU
)
412

27
Fig. 7 413

28
414
SH
SH
S S
glutenin
gliadin
S
S
SH
S
S
SH
S
S
T < 90 °C T < 90 °C
III. Oxidizing agent, e.g. KIO3 II. Reducing agent, e.g. DTT
S
S
S S
S
S
SH
S
S
S
S
SH
T > 90 °C T > 90 °C
S SH
S
S S
S
S
S S
S S
S
S
SH
SH
SG
III.2. Reducing agent, e.g. GSH
SH
I. 1
I. 2
III. 1
Further reaction
SH
SH
SH
SHH
SH
SH
SH S S
S
S
SH
SH S
S
S
S S
S SH
S
S
SH
II. 1
II. 2

29
Tables 415
Table 1. Characteristic RVA viscosities (means of at least 3 observations) of gluten-water 416
suspensions (20% w/v) during hydrothermal treatment in the presence of 6.10 µmol DTT/g 417
protein or 2.1 µmol KIO3/g protein added at 0 min, 13 min or 30 min during RVA analysis. 418
Sample Initial
Viscosity (cP)
Minimal
Viscosity (cP)
Maximal
Viscosity (cP)
Control (C) 1405a 662a 2587a
C + DTT at 0 min 1228b 485b 2271b
C + DTT at 13 min 1424a 605a 1864b
C + DTT at 30 min 1416a 689a 2098b
C + KIO3 at 0 min 1216a 682a 1010c
C + KIO3 at 13 min 1498a 650a 2383a
C + KIO3 at 30 min 1428a 705a 2384e
Control (C) 1405a 662a 2587a
Values in the same column followed by a different letter differ significantly (P < 0.05). 419
Relative standard deviations were less than 10% 420

30
Table 2. Extractabilities of gluten proteins in 2.0% SDS containing buffer before or after 421
hydrothermal treatment (HTT) with 6.1 µmol DTT/g protein or 2.1 µmol KIO3/g protein 422
added at 0 min, 13 min or 30 min during RVA analysis. 423
Sample SDS
extractable
protein (%)
SDS
extractable
glutenin (%)
SDS
extractable
gliadin (%)
Control (before HTT) 80.9 (1.4) 25.8 (0.4) 55.2 (1.0)
Control (C, after HTT) 20.4 (0.3) 0.8 (0.0) 19.6 (0.3)
C + DTT at 0 min 10.0 (1.0) 0.3 (0.0) 9.7 (0.9)
C + DTT at 13 min 11.7 (0.9) 0.4 (0.0) 11.3 (0.9)
C + DTT at 30 min 11.7 (0.0) 0.2 (0.0) 11.5 (0.0)
C + KIO3 at 0 min 51.0 (0.1) 4.9 (0.0) 46.1 (0.1)
C + KIO3 at 13 min 47.8 (0.1) 4.3 (0.0) 43.5 (0.1)
C + KIO3 at 30 min 24.2 (0.3) 0.8 (0.0) 23.4 (0.3)
Standard deviations are shown in brackets. 424
425
31
Table 3. Extractabilities of gluten proteins in 2.0% SDS containing buffer before or after 426
hydrothermal treatment (HTT) with 8.0 µmol NEMI/g protein at 0 min and GSH at 13 min. 427
Sample
SDS
extractable
protein (%)
SDS
extractable
glutenin (%)
SDS
extractable
gliadin (%)
Control (before HTT) 80.9 (1.4) 25.8 (0.4) 55.2 (1.0)
Control (C, after HTT) 20.4 (0.3) 0.8 (0.0) 19.6 (0.3)
C + NEMI (0 min) 58.6 (0.3) 5.4 (0.0) 53.2 (0.3)
C + NEMI (0 min) + GSHb (13
min)
44.8 (0.1) 2.7 (0.0) 42.1 (0.1)
C + NEMI (0 min) + GSHc (13
min)
26.3 (1.2) 0.9 (0.1) 25.3 (1.5)
a 3.1 µmol/ g protein 428
b 6.2 µmol/ g protein 429
Standard deviations are shown in brackets. 430
431