chemistry of urban grime: inorganic ion composition of ... · 137 efficiency was examined by...
TRANSCRIPT

TSpace Research Repository tspace.library.utoronto.ca
Chemistry of urban grime: Inorganic ion
composition of grime vs. particles in Leipzig, Germany
Alyson M. Baergen, Sarah A. Styler, Dominik van Pinxteren, Konrad Muller, Hartmut Herrmann and D.James Donaldson
Version Post-print/accepted manuscript
Citation (published version)
Baergen, A. M.; Styler, S. A.; van Pinxteren, D.; Muller, K.; Herrmann, H.; Donaldson, D. J. Environ. Sci. Technol. 2015, 49 (21), 12688–12696.
Publisher’s statement This document is the Accepted Manuscript version of a Published Work that appeared in final form in Environmental Science & Technology, copyright © American Chemical Society after peer review and technical editing by the publisher. To access the final edited and published work see DOI: 10.1021/acs.est.5b03054.
How to cite TSpace items
Always cite the published version, so the author(s) will receive recognition through services that track citation counts, e.g. Scopus. If you need to cite the page number of the author manuscript from TSpace
because you cannot access the published version, then cite the TSpace version in addition to the published version using the permanent URI (handle) found on the record page.
This article was made openly accessible by U of T Faculty. Please tell us how this access benefits you. Your story matters.

Chemistry of urban grime: Inorganic ion composition of grime vs. 1
particles in Leipzig, Germany 2
Alyson M. Baergen,1 Sarah A. Styler,2,3 Dominik van Pinxteren,2 Konrad Müller,2 3
Hartmut Herrmann2 and D. James Donaldson* 1,4 4
1. Department of Chemistry, University of Toronto, 80 St George St. Toronto, ON, 5
CANADA M5S 3H6 6
2. Leibniz-Institut für Troposphärenforschung (TROPOS), Atmospheric Chemistry 7
Dept.(ACD), Permoserstr. 15, 04318 Leipzig, Germany. 8
3. Now at Department of Chemistry, University of Alberta, 11227 Saskatchewan Drive, 9
Edmonton, AB, Canada, T6G 2G2 10
4. Department of Physical and Environmental Sciences, University of Toronto 11
Scarborough, 1265 Military Trail, Toronto, ON M1C 1A4 12
* Email: [email protected] 13
14

Abstract 15
Deposition of atmospheric constituents - either gas phase or particulate - onto urban 16
impervious surfaces gives rise to a thin "urban grime" film. The area exposed by these 17
impervious surfaces in a typical urban environment is comparable to, or greater than, that 18
of particles present in the urban boundary layer, however it is largely overlooked as a site 19
for heterogeneous reactions. Here we present the results of a field campaign to determine 20
and compare the chemical composition of urban grime and of particles collected 21
simultaneously during the autumn of 2014 at an urban site in central Leipzig, Germany. 22
We see dramatically reduced ammonium and nitrate levels in the film as compared to 23
particles suggesting a significant loss of ammonium nitrate, thus enhancing the mobility 24
of these species in the environment. Nitrate levels are 10% lower for films exposed to 25
sunlight compared to those that were shielded from direct sun, indicating a possible 26
mechanism for recycling nitrate anion to reactive nitrogen species. Finally, chloride 27
levels in the film suggest that it could represent an unrecognized source of continental 28
chloride available for ClNO2 production even in times of low particulate chloride. Such 29
source and recycling processes could prove to be important to local and regional air 30
quality. 31
TOC Image 32
33
H2O
NH3
NO2
HONO ClNO2 ???
HNO3 HNO3%
SO2
HNO3 N2O5

Introduction 34
Heterogeneous and multiphase reactions are important in the troposphere, promoting 35
reactions that are not favourable in the gas phase.1 N2O5 and NO2 hydrolysis,2,3 ClNO2 36
formation,4,5 heterogeneous SO2 oxidation,6 interactions of trace gases with mineral dust 37
components7,8 and surface photochemistry9 are all examples of such important 38
atmospheric-surface interactions. The studies of these reactions are usually limited to 39
particle and sea surfaces; however, in an urban setting, there are many impervious 40
surfaces, such as buildings, roadways and windows providing another type of surface that 41
is often overlooked despite having a combined surface area estimated to be similar to that 42
of atmospheric particles.10,11 When impervious surfaces are exposed to the atmosphere, 43
surface films form over time.12-26 Sometimes referred to as urban grime, the films are a 44
complex mixture of species formed via the deposition and subsequent processing of 45
atmospheric species.27 46
47
Models have been developed which try to characterize the growth of urban grime and 48
give insight into the growth mechanism. Many of these are empirical models, fitting 49
observed changes in total film mass, a particular constituent’s mass or changes in optical 50
properties to descriptive equations as a function of time.17,20,28 These models highlight the 51
complexity of the growth mechanisms and the variability of film formation depending on 52
location. More recently the models have been further parameterized to include 53
atmospheric measurements, giving more insight into the growth mechanism. They show 54
that PM10 is the dominant driver for film formation but also that the inclusion of SO2 and 55
NO2 into the models allows for a better fit to the observed growth characteristics.29,30 56
Semi-volatile compounds have also been observed to approach an equilibrium between 57
the film and surrounding atmosphere,25 implying dynamic partitioning behaviour, and 58
polymers have been detected that are suggested to form through reactions within the 59
film.16 This highlights that grime is not merely a collection of deposited particles, but 60
rather acts as a dynamic system, which is influenced by the continued exposure to the 61
atmosphere. 62
63
While such models are helpful in understanding film formation, they say little about the 64
potential environmental impact of urban grime. Diamond and coworkers have begun to 65
address this issue by developing regional models which include film dynamics, showing 66
that the films enhance the mobility of organic constituents in the environment through 67
partitioning and water runoff.10,11,31,32 At this point, however, there is limited work on 68
inorganic species and understanding the films as a reactive environment. Reactive studies 69
have been limited to the use of organic proxy films, such as PAH films, a mixture of 70
potassium nitrate and pyrene, or octanol spread on a film of silicon vacuum grease.33-41 71
The exception is our recent laboratory report on nitrate photochemistry within real grime, 72
which demonstrated that the grime-associated nitrate is photolabile.42 73
74
In the current study, we measured the composition of one of the major sources of these 75
films, PM10 (particles smaller than 10μm in diameter), simultaneously with that of grime 76
samples collected at the same location. The inorganic composition will be the focus of 77
this paper, while the organic composition will be reported separately. There has been 78
only a single study published to date in which particle composition was measured 79

simultaneously to that of grime, with the particles being collected over 3 months using an 80
air filtration unit.22 Further investigation is clearly warranted, using a more standardized 81
particle sampling method and with samples taken at a higher time frequency to more fully 82
track the formation of the grime in the context of changing particle concentrations. The 83
goal of the present study is to utilize the comparison of particle and grime compositions 84
during initial grime formation to begin to identify grime-mediated processes that could 85
impact environmental cycling of some key chemical species. Here we also report the first 86
measurement of urban grime photochemistry derived from field measurements using real 87
sunlight. 88
89
Experimental 90
Sampling of urban grime and atmospheric particles was carried out in Leipzig, Germany 91
between September 16 and October 25, 2014 at the “Leipzig-Mitte” (51.33°N, 12.38°E) 92
site described previously.43 Briefly, this is a roadside site at the corner of a major 93
intersection opposite the main train station in the middle of Leipzig. Figure S1a of the 94
Supporting Information (SI) shows a photograph of the sampling site. Local 95
meteorological, NOx and SO2 measurements were collected over the duration of the 96
campaign from the same location by the Saxon State Agency for Environment, 97
Agriculture and Geology and are presented in Figure S2. 98
99
Film Sampling 100
Film samples were collected by exposing 3 mm diameter soda-lime glass beads (Sigma 101
Aldrich) to the atmosphere. These beads, similar to those used by Wu et al,24,25 were 102

chosen to provide a high surface area surrogate for common window glass. A possible 103
impact of using bead surrogates is that the geometry of the beads, with both horizontal 104
and vertical surfaces, may favour the collection of larger particles in comparison to 105
vertical window surfaces.44 Beads were prepared by soaking in a base bath for one hour 106
followed by rinsing the beads ten times with tap water, soaking overnight in de-ionized 107
water and a further eight rinses in deionized water. They were then baked in a 100°C 108
oven overnight to remove residual water. 109
110
Beads were divided into 80.0 g samples and each sample was placed into one of the 48 111
compartments within the sampler, forming a single layer of beads, as illustrated in Figure 112
S1b. It was built out of stainless steel with stainless steel mesh tray bottoms and open 113
sides to allow gas flow. The sampler was covered by a Plexiglas GS, UV transmitting 114
clear 2458 window, shielding the sampler from precipitation while allowing light through 115
to the samples. The beads were further protected from precipitation with metal slats 116
around the outside of each layer, which could be removed to access the beads. As shown 117
in Figure S1a, there were three trays of beads. Only the top two were used for this study. 118
Below the first level of beads there was a sheet of stainless steel shielding the bottom two 119
levels of beads from direct sunlight. In this way, light-exposed and light-shielded 120
samples were collected in parallel, and thus photochemistry occurring on the film could 121
be probed. 122
123
The grid boxes of each tray were numbered from one to sixteen. Once every three days, a 124
grid box number was selected using a random number generator. At 11:00 local time 125

(GMT+2) all of the beads for each of the “light” and “dark” samples corresponding to the 126
chosen number were collected into amber vials for transport. Samples were kept 127
refrigerated until analysis. Field blanks were measured by placing three 80.0 g bead 128
samples onto the sampler and then collecting immediately. Laboratory blanks were also 129
analyzed in which three clean 80.0 g bead samples were analyzed without being 130
transported to the field site. 131
132
For analysis, 4.0 g of beads were transferred to a Nalgene bottle and extracted into 3.00 133
mL of deionized water by shaking the bead/water mixture for 5 min, while the remaining 134
76.0 g of beads were used for analysis of the organic components of the film. The 135
aqueous extract was removed and analyzed for ions as described below. The extraction 136
efficiency was examined by performing serial extractions in which a previously analyzed 137
sample was extracted for a second time. For all ions, less than 9% remained in the second 138
extraction. While attempts were made to allow equal airflow to all compartments in the 139
sampler, there is some variability depending on location in the sampler. To examine this 140
variability between samples, samples were taken from three different compartments on 141
October 7, 2014, indicating less than 35% deviation from the mean value. This is shown 142
in Figure S3. 143
144
Particle Sampling 145
PM10 (particles below 10 μm in diameter) were sampled through an inlet with a 10 μm 146
cut-off for 72 hours (11:00-11:00 local time) with a ‘Partisol 2000’ low volume sampler 147
at a sampling rate of 1.0 m3/hr. Particles were collected onto 45 mm diameter quartz 148

filters which were preconditioned by heating at 105°C for 24 hours. Sections of the filter 149
(1 cm2) were removed for organic carbon/elemental carbon analysis while two 6 mm 150
diameter circles were removed for GC-MS analysis of PAHs and alkanes. The 151
remaining filter area (1434 mm2) was extracted into 1.50 mL of deionized water through 152
10 minutes of sonication, 10 minutes of shaking and a further 10 minutes of sonication. 153
Beginning on October 20, 2015, the composition of size-resolved particles was also 154
determined by collecting samples using a five-stage (stage 1: 0.05–0.14 mm, stage 2: 155
0.14–0.42 mm, stage 3: 0.42–1.2 mm, stage 4: 1.2–3.5 mm, stage 5: 3.5–10 μm, 156
aerodynamical particle diameter) stainless steel low pressure Berner impactor (Hauke, 157
Austria) with a flow rate of 4.5 m3/hr.45 The particles were collected onto aluminum foil 158
for 24 hours and a fraction of this foil was extracted into 2.00 mL of deionized water 159
using the technique described above for filters. Foils had a calcium contamination 160
contributing up to 89% of the measured calcium mass. Reported values were corrected by 161
subtracting the average of the blank values from the sample measurements, with the 162
exception of two samples from stage 1 which were within error of the blank values and 163
are reported as 0 μg/m3. 164
165
Because 3-day filter collection times were used, we expect the occurrence of sampling 166
artefacts such as volatilization of high vapour pressure compounds like ammonium 167
nitrate and small organics.22 Similar processes are expected for the aging of film samples, 168
thus biasing the measured particle compositions towards that of the grime film. 169
Therefore, the film and particle composition may appear more similar than they are in 170
reality. However, we note that the particle filter was within a temperature controlled 171

environment, with the temperature maintained at 20.7 ± 0.4°C. Therefore the collected 172
filter samples did not undergo the same temperature cycles as the film (as shown in 173
Figure S2a). 174
175
Ion Analysis 176
All aqueous extracts were filtered using a 0.45μm Acrodisc syringe filter to remove 177
insoluble materials. The resulting solutions were analyzed using ion chromatography to 178
detect the main water-soluble ions (Cl-, SO42-, NO3
-, C2O42-, NH4
+, Na+, K+, Ca2+, Mg2+) 179
using a Thermo ion chromatograph (ICS3000) with AS18/AG18 column/guard column 180
with potassium hydroxide eluent for anion analysis and CS16/CG16 column/guard 181
column with methanesulfonic acid eluent for cation analysis. Conductivity detection was 182
used for all ions with the exception of NO3- that was detected using UV at 208nm. 183
184
Results 185
Particle and grime samples were each collected at the Leipzig-Mitte site during the period 186
between September 16 and October 25, 2014 and the major water-soluble ions in each 187
sample type were analyzed via ion chromatography. Figure 1 displays the observed ion 188
mass fractions, Figure 2 displays the molar ratios of ions normalized to total sulfate, and 189
Figures S3 and S4 present the absolute concentrations determined for the particles and 190
light-exposed grime samples, respectively. The variability among the grime samples is 191
indicated in the scatter plots, which show three separate data points (hollow circles) for 192
the three grime samples collected on October 7. Sulfate was chosen as the normalizing 193
species because it is expected to be stable within the film, having low volatility and 194
photoactivity. We note that there may be additional gas phase sources of sulfate to the 195
film, such as SO2 deposition and oxidation, akin to particulate sulfate sources,46 due to the 196
grime's continued exposure to the atmosphere. Chabas and coworkers have also 197
suggested that SO2 can react with sodium and calcium, either in the film or within the 198
glass substrate, to form salts such as CaSO4 and Na2SO4.18,22 Extra sulfate sources to the 199
film would result in the sulfate-normalized values underestimating additional sources of 200
ions to the film or overestimating the losses of ions from the film. Further study is 201
warranted to establish the relative importance of such sulfate sources in addition to 202
particulate deposition. However, for the subsequent discussion it is assumed that sulfate 203
sources from such heterogeneous reactions are minor in comparison to particulate sulfate 204
sources to the film. 205
206
In general, we note that the particle ion compositions fall within the range of mass 207
fractions and mass loadings observed at this site in the past.47 A similar comparison to 208
past film composition measurements is not possible because there are no urban grime 209
composition measurements reported over these timescales, nor are there any reported 210
from this area. However, comparing to the few compositional studies performed in other 211
cities and over much longer time frames, the Leipzig mass fractions are similar to that 212
reported in Paris 22 but generally more sulfate rich and calcium poor than a separate study 213
with film compositions reported from six different European cities.18 214
215
216
217

218
Depletion of ammonium and nitrate in grime versus particles 219
From examination of Figure 1, it is evident that both the film and particle compositions 220
are dominated by the presence of sulfate and nitrate anions. Notably, however, 221
ammonium, which is the dominant cation measured within the particles, is hardly 222
observable within the grime samples. For most samples ammonium was below the 223
detection limit and thus the values reported herein are the detection limit of the system 224
and so represent upper limits to the ammonium present in the film. A contrast between 225
the ammonium presence in particles versus film samples has been reported previously, 226
!
! !!
1.0
0.8
0.6
0.4
0.2
0.0
Mas
s Fr
actio
n
9/19
/14
9/22
/14
9/25
/14
9/28
/14
10/1
/14
10/4
/14
10/7
/14
10/1
0/14
10/1
3/14
10/1
6/14
10/1
9/14
Date
a) Grime1.0
0.8
0.6
0.4
0.2
0.0
Mas
s Fr
actio
n
9/19
/14
9/22
/14
9/25
/14
9/28
/14
10/1
/14
10/4
/14
10/7
/14
10/1
0/14
10/1
3/14
10/1
6/14
10/1
9/14
Date
b) Particle
108642
Mas
s Fr
actio
n
3 6 9 12 15 18 21 21 21 24 27 30 33 36 39
Time (days)
Chloride Sulfate Nitrate Sodium Ammonium Calcium Other
1.0
0.8
0.6
0.4
0.2
0.0
Mas
s Fr
actio
n
9/19
/14
9/22
/14
9/25
/14
9/28
/14
10/1
/14
10/4
/14
10/7
/14
10/1
0/14
10/1
3/14
10/1
6/14
10/1
9/14
Date
a) Grime
Figure 1: Mass fraction of the major ions: Cl- (orange), SO4
2- (red), NO3- (dark blue), Na+
(light blue), NH4+ (yellow), Ca2+ (brown) and
the sum of the minor ions C2O42-, Mg2+ and K+
(pink) measured in the a) light-exposed grime and b) particle samples.
1.0
0.8
0.6
0.4
0.2
0.0
Mas
s Fr
actio
n
9/19
/14
9/22
/14
9/25
/14
9/28
/14
10/1
/14
10/4
/14
10/7
/14
10/1
0/14
10/1
3/14
10/1
6/14
10/1
9/14
Date
b) Particle

also indicating that there were low or undetectable levels of ammonium in urban grime 227
films.18,22 The authors of those previous studies suggested that the lower-than-expected 228
concentration of ammonium is due to the loss of ammonium nitrate. In support of this 229
hypothesis, we observe that nitrate is also significantly lower in the grime than in the 230
particles, most clearly seen by the nitrate to sulfate ratio shown in Figure 2c. Ammonium 231
nitrate is semivolatile, and there are many reports of its loss by evaporation from filter 232
samples and particles (e.g.48,49). Because the grime film is exposed to the atmosphere for 233
an extended time period, it cycles through different temperature and relative humidity 234
regimes (as displayed in Figure S2). High temperatures and low relative humidities have 235
been shown to favour ammonium nitrate evaporation.49 236
237
As a further investigation into ammonium nitrate evaporation, the size resolved particle 238
data collected during the final 5 days of measurements can be examined; this is displayed 239
in Figures S5 and S6 of the SI. The particles rich in ammonium and nitrate are the fine 240
particles in the size bins below 1.3μm, while the coarse particles, between 1.3μm and 241
10μm, are ammonium-poor with nitrate likely present as salts such as Ca(NO3)2.50 The 242
average nitrate to sulfate ratio for the total PM10 over the five days is 1.4 ± 0.5 (mean ± 1 243
standard deviation), significantly larger than the campaign average of 0.48 ± 0.06 244
observed for the film. This ratio becomes lower if it is assumed that all of the nitrate 245
associated with deposition of fine-mode particles evaporates as ammonium nitrate, 246
leaving only the coarse mode nitrate. Under this assumption, the average nitrate to 247
sulfate mole ratio is reduced to 0.7±0.5, which lies within the uncertainty of the ratio 248
observed in the film. While the possibility of gas phase nitrate sources to the grime such 249
as N2O5 or NO2 hydrolysis or HNO3 deposition cannot be ruled out, the comparison of 250
these nitrate to sulfate ratios suggest the importance of evaporation for much, if not all, of 251
the nitrate that is deposited as ammonium nitrate. 252
253
However, if ammonium nitrate loss from deposited particles is the sole mechanism for 254
ammonium depletion (i.e. if the grime ammonium and nitrate amounts are initially the 255
same as those in particles, but are then altered via ammonium nitrate evaporation) we 256
would expect a smaller decrease in the total amount of ammonium than that which is 257
observed in the grime samples. Subtracting the average ammonium-to-sulfate and nitrate-258
to-sulfate mole ratios in the grime over the course of the campaign from the 259
corresponding average particle ratios, the ammonium to sulfate mole ratio decreases by 260
2.1±0.6 while the nitrate to sulfate mole ratio only decreases by 0.8±0.6. Therefore, 261
ammonium nitrate evaporation cannot fully explain the observed loss of ammonium. As 262
shown in the size-resolved particle measurements displayed in Figures S5 and S6, larger 263
particles contain minimal quantities of ammonium, while maintaining moderate amounts 264
of nitrate. If large particles are preferentially deposited and retained on the grime film, or 265
if significant amounts of particles larger than PM10 (also expected to show minimal 266
ammonium, see for instance VandenBoer et al51) are deposited onto the grime, this would 267
lower the ammonium fraction measured within the film to a greater extent than for 268
nitrate. 269
270
There may also be chemical mechanisms at play that remove the ammonium from the 271
grime film. Favez et al. suggested that ammonium could be lost from grime via either or 272

both of the exchange of ammonium nitrate with NaCl to form NaNO3 and gas phase HCl 273
and NH3, or the biological conversion of ammonium to nitrate.18 Another possibility is 274
suggested by the long integration time for collection of the film sample, which could lead 275
to the mixing of the components of the externally mixed coarse and fine particles. This 276
mixing of the particles' components has previously been discussed as a potential artefact 277
for samples collected on filters under high relative humidities,52 where the presence of 278
water can facilitate ionic mixing. In the present study, the particles were collected in a 279
climate-controlled environment, lowering the possibility of this occurring on the particle 280
filters. However, in the case of grime collected onto glass substrates, we note that glass 281
surfaces are hygroscopic; lab studies also show significant water uptake mediated by the 282
grime film itself.26,27,42 At the high relative humidities, mostly above 60%, which existed 283
during the campaign (shown in figure S2), there will certainly be water associated with 284
the grime. 285
286
Although the ion balance of the particles is quite variable, half of the PM10 samples 287
collected measured excess cations; this suggests that the mixture of these ions could be 288
alkaline.53 Because the larger particle classes contain fewer sulfate and ammonium ions 289
and more of the crustal cations such as sodium and calcium (see Figures S5 and S6), they 290
are more alkaline than the smaller ones. Upon mixing of the components of these more 291
basic particles with those from the smaller acidic ammonium rich particles, there would 292
be an increase in the pH, favouring the formation of ammonia from ammonium. The 293
ammonia could then partition to the gas phase, depending on the local ammonia levels, 294

depleting the film ammonium and giving rise to a smaller proportion of ammonium in the 295
grime than measured in the PM10 particles. 296
297
298
Temporal changes in grime and particle compositions 299
Figure 2 illustrates that for all of the ions measured here, there is much more variability 300
in particle composition over time than there is for the film. Because the film is 301
continually collecting mass over the course of the campaign, its measured composition 302
results from an integration of particle and gas phase species deposition, evaporative 303
2.52.01.51.00.50.0
NO
3- : SO
4 2- M
ole
Rat
io
9/21/14 10/1/14 10/11/14 10/21/14
Date
c) Nitrate
0.6
0.4
0.2
0.0
Na+ : S
O42-
Mol
e R
atio
9/21/14 10/1/14 10/11/14 10/21/14Date
b) Sodium0.4
0.3
0.2
0.1
0.0Cl- : S
O42-
Mol
e R
atio
9/21/14 10/1/14 10/11/14 10/21/14Date
a) Chloride
0.6
0.4
0.2
0.0C
a2+: S
O42-
Mol
e R
atio
9/21/14 10/1/14 10/11/14 10/21/14Date
d) Calcium
3.0
2.0
1.0
0.0
NH
4+ : SO
42- M
ole
Rat
io
9/21/14 10/1/14 10/11/14 10/21/14
Date
e) Ammonium
Figure 2: Sulfate normalized mole ratios of a) Chloride b) Sodium c) Nitrate d) Calcium e) Ammonium extracted from film and particle samples. Light-exposed grime values are shown in black circles while particle values are red bowties. The spread in data from collection and analysis is displayed for the three separate samples collected on October 7, 2015 shown in hollow circles. When ammonium was not detected, values were calculated from the detection limits, and are thus upper limits for ammonium in grime.

losses and chemical processing. This long-time averaging has the result that fluctuations 304
in atmospheric composition are smoothed in comparison to the particle samples, which 305
are averaged over a shorter period. Another consequence of this averaging is that the film 306
may maintain a “memory” of periods of time where there is high deposition of a specific 307
chemical species. At the beginning of this campaign, between September 19 and 28, 308
2015, there was an episode where particles showed high levels of chloride and sodium 309
(see Figure S4). Hysplit back trajectories54 run for the previous 24 hours period suggest 310
that the air mass sampled during that time was mostly transported over the North Sea 311
prior to arriving in Leipzig leading to marine influenced particles, high in sodium and 312
chloride. In these particles, the sodium to chloride mole ratio is above one (2.6±1.1), 313
typical of marine particles undergoing chloride displacement by HNO3 during transport 314
over continental air.55 Following September 28, the masses of chloride and sodium in the 315
particles drop due to a shift in the geographic origin of the particles to continental areas.54 316
This change in particle composition also results in a drop of both chloride and sodium in 317
the film, as the composition is diluted with particles lower in chloride and sodium, but to 318
a much lesser extent than is evident in the particles. 319
320
The change in chloride amount in the grime can be represented by assuming that there is 321
a period, between September 19 and 28, 2015, of fast chloride growth on the film 322
(6.7x10⁻⁴ μmol/day). The growth rate is calculated from a linear fit of the moles of 323
chloride in the film over time displayed in Figure 3a, where the amount on September 19 324
is fixed. After September 28, the growth rate is assumed to be 25% of the fast growth 325
rate (1.7x10⁻⁴ μmol/day) for the remainder of the campaign. This corresponds to the ratio 326

of the average amount of chloride in the particles between September 28 and October 25 327
to the average chloride content in the particles between September 19 and 28 (Figure S4). 328
By normalizing the resulting growth curves of chloride to experimental sulfate values, 329
these results can be compared to experimental values as shown in Figure 3b. Although 330
there is significant scatter, the calculated chloride values demonstrate that a one-week 331
period of elevated chloride mass in the particles can result in a high chloride 332
concentration in the film maintained for over a month. However, this does not exclude 333
the possibility of an additional source from HCl or a chloride source from the deposition 334
of particles greater than 10 μm in diameter. The scatter in the sodium data limits the 335
certainty of carrying out a similar analysis for this ion. 336
337
338
0.35
0.30
0.25
0.20
0.15
0.10
0.05
0.00
Cl- :
SO
4 M
ole
Rat
io
9/21/14 10/1/14 10/11/14 10/21/14Date
Experimental Calculated
b)
0.014
0.012
0.010
0.008
0.006
0.004
0.002
0.000
Mol
e pe
r Are
a (m
ol/c
m2 )
9/21/14 10/1/14 10/11/14 10/21/14Date
a)
Experimental Calculated
Figure 3: Comparison of experimental (black) and calculated (orange) values for a) moles of chloride per area and b) sulfate normalized moles of chloride in grime over time.

The calcium to sulfate mole ratios in the grime also show a gradual increase over time 339
(Figure 2d). In this case, the calcium to sulfate ratio for the final two particle samples are 340
also higher than the first 3 samples, and thus the film may be responding to these 341
changes. Chabas et al. suggested the possibility of the leaching of calcium from the glass 342
into the film both through the reactions with gas phase species as mentioned above, or 343
through cation exchange with film protons.22,56 One would also expect an enhancement of 344
these ions if there were a large input of particles larger than PM10. However, because 345
there does not seem to be a large difference between the calcium to sulfate ratios between 346
the film and particle these processes do not seem to be playing a large role under the 347
present conditions. The times of greatest discrepancy can be attributed to the film’s slow 348
response to decreasing particle concentrations, as discussed for chloride. 349
350
Photochemical processing of nitrate 351
Previous work from our lab41,42 and others57 has shown that nitrate deposited onto 352
environmental surfaces as HNO3 shows rapid photochemical loss, orders of magnitude 353
faster than aqueous nitrate, and that this process is a potential renoxification mechanism 354
in the environment. As part of the present campaign, we explored such a loss process 355
from ambient film samples. This was probed by collecting samples both exposed to and 356
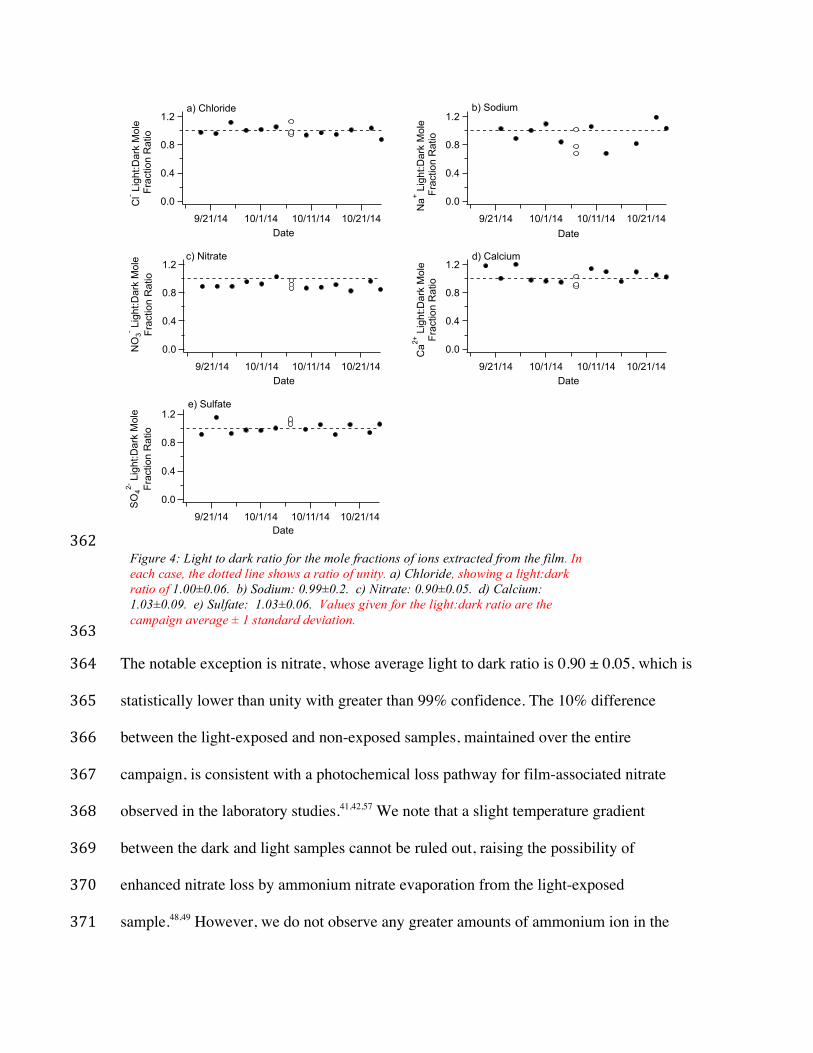
shielded from sunlight. Figure 4 displays the ratio of the light to dark mole fractions of 357
the ions investigated here over the course of the campaign. One expects that the ions that 358
are neither photolabile nor photoproducts will show no preference for light versus dark, 359
therefore showing a ratio of unity for the duration of the experiment. This is indeed seen 360
for the majority of the ions within the film, with the ratios scattered around a value of 1.0. 361
362
363
The notable exception is nitrate, whose average light to dark ratio is 0.90 ± 0.05, which is 364
statistically lower than unity with greater than 99% confidence. The 10% difference 365
between the light-exposed and non-exposed samples, maintained over the entire 366
campaign, is consistent with a photochemical loss pathway for film-associated nitrate 367
observed in the laboratory studies.41,42,57 We note that a slight temperature gradient 368
between the dark and light samples cannot be ruled out, raising the possibility of 369
enhanced nitrate loss by ammonium nitrate evaporation from the light-exposed 370
sample.48,49 However, we do not observe any greater amounts of ammonium ion in the 371
1.2
0.8
0.4
0.0Na+ L
ight
:Dar
k M
ole
Frac
tion
Rat
io
9/21/14 10/1/14 10/11/14 10/21/14Date
b) Sodium1.2
0.8
0.4
0.0Cl- L
ight
:Dar
k M
ole
Fra
ctio
n R
atio
9/21/14 10/1/14 10/11/14 10/21/14Date
a) Chloride
1.2
0.8
0.4
0.0Ca2+
Lig
ht:D
ark
Mol
eFr
actio
n R
atio
9/21/14 10/1/14 10/11/14 10/21/14Date
d) Calcium
1.2
0.8
0.4
0.0SO
42- L
ight
:Dar
k M
ole
Frac
tion
Rat
io
9/21/14 10/1/14 10/11/14 10/21/14Date
e) Sulfate
1.2
0.8
0.4
0.0NO
3- Lig
ht:D
ark
Mol
eFr
actio
n R
atio
9/21/14 10/1/14 10/11/14 10/21/14Date
c) Nitrate
Figure 4: Light to dark ratio for the mole fractions of ions extracted from the film. In each case, the dotted line shows a ratio of unity. a) Chloride, showing a light:dark ratio of 1.00±0.06. b) Sodium: 0.99±0.2. c) Nitrate: 0.90±0.05. d) Calcium: 1.03±0.09. e) Sulfate: 1.03±0.06. Values given for the light:dark ratio are the campaign average ± 1 standard deviation.

dark film sample than in the light-exposed one, suggesting that this pathway is probably 372
not important here. 373
374
Discussion 375
Diamond and coworkers have demonstrated that urban grime films can increase the 376
mobility of species in the environment, both by being a temporary reservoir for organic 377
species to partition into, and through film wash-off during precipitation events.10,11,31,32 In 378
the present study we see not only this increased mobility in the volatilization of 379
ammonium nitrate, but also evidence for potential chemical transformations of inorganic 380
ions. As shown in Figure 2, the grime film’s composition changes over time in a way 381
distinct from that seen in the surrounding particles, despite the particles being a major 382
source of ions to the film. Following deposition onto a hygroscopic urban surface, 383
particles of different composition and size are subject to mixing when water is taken up 384
onto the grime film. In this medium, further processing is possible through reaction or 385
through the exchange of gas phase species, which can be released from or deposited onto 386
the surface. 387
388
One such species is ammonia, a basic gas that plays an important role in particle 389
nucleation and neutralizing aerosols, reacting with acidic species to form ammonium.46 390
While ammonium is clearly present in the particles we monitored here, we do not 391
measure quantifiable amounts of ammonium in grime, suggesting a loss of ammonium 392
during the grime film formation and growth. There are different hypotheses to explain 393
this loss, but it is clear that deposition to the film is altering the cycling of ammonium in 394

the environment, in contrast to a simple deposition framework. It has been shown that it 395
is important to use a scheme including bidirectional ammonia flux when describing 396
atmosphere-biosphere interactions.58 Our results demonstrate that bidirectional exchange 397
between urban grime films and the surrounding atmosphere may also need to be 398
considered to understand urban atmospheric chemistry. A study of the pH of the grime 399
would be required in order to investigate ammonia-ammonium equilibrium on the film, 400
and the corresponding equilibrium ammonia vapour pressure and thereby obtain the 401
potential for the release of ammonia. However during this campaign, the observed low 402
level of grime ammonium suggests that the film was releasing ammonia back into the 403
atmosphere. A study completed in Toronto observed a significant ammonia source within 404
a street canyon, attributing this to the green space contained within the cavity,59 however, 405
if ammonium is being lost from grime the urban films formed along the building could 406
also be playing a role in the ammonia gradient measured. 407
408
A further impact of the film environment on the nitrogen cycling is nitrate photolysis in 409
the grime. Over the campaign, nitrate samples exposed to solar illumination showed 410
statistically significant lower nitrate concentrations than the corresponding dark samples, 411
providing the first direct field evidence for nitrate photochemistry in urban grime. Studies 412
are still ongoing to classify the gas phase products of the nitrate chemistry in grime; 413
however earlier studies of nitrate photolysis in water and on ice, metal oxides and glass, 414
suggest that this photochemistry would lead to the formation of the reactive nitrogen 415
species NO, NO2 and HONO (e.g.42,57,60,61). Thus the observed photolability of film nitrate 416
could provide a renoxification process in the urban environment. We note that such 417

processes could contribute to unknown reactive nitrogen sources such as a fixed 418
photochemical source of HONO within 20m of the ground found in Houston, TX.62,63 419
420
Another aspect of the grime-associated atmospheric processing is “capture events”, in 421
which particular ions are elevated due to an influx of these species associated with a 422
particular population of particles. As seen here, particulate chloride can be episodic in 423
nature such as when marine-influenced particles are transported inland or in regions 424
where chloride salts are used for snow management. When particulate chloride levels are 425
high, large amounts of chloride can be captured on the film extending the period in which 426
elevated chloride levels are exposed to the atmosphere. Chloride levels are of interest 427
due to known heterogeneous reaction between N2O5 and chloride to form ClNO2.5 This 428
reaction, which also produces nitrate anion, releases active chlorine and nitrogen in the 429
morning when ClNO2 photolyzes thereby increasing the oxidative capacity of the 430
atmosphere.4,64 Although previously thought of as only important in marine regions, there 431
have now been multiple observations of ClNO2 in mid-continental environments through 432
reaction of N2O5 with chloride attributed to transported sea spray, biomass burning and 433
coal fired power plants.65,66 ClNO2 production is limited by the availability of chloride 434
which is currently defined in terms of the sum of particulate chloride and HCl.66,67 435
However, the chloride captured on the film may also be available for reaction with N2O5, 436
which in turn could impact the ClNO2 production in these urban continental regions. 437
438
In summary, by comparing the composition of particles and urban grime films collected 439
simultaneously, several possible processes were elucidated that add to our understanding 440

of grime film formation; as well, these processes suggest that urban grime films could 441
have an important environmental impact. These possibilities include the potential for 442
grime to act as a source of ClNO2 as well as to recycle ammonia and reactive nitrogen 443
back into the atmosphere. Further study into these processes is warranted. 444
445
Acknowledgements. The authors acknowledge the technical support of O. Böge, A. 446
Dietze, S. Fuchs, R. Gräfe, A. Grüner, C. Kurze, A. Rödger and G. Spindler. We 447
appreciate the support of the Saxon State Agency for Environment, Agriculture and 448
Geology (LfULG) in conducting the sampling at Leipzig-Mitte as well as their provision 449
of additional data. We thank NSERC for ongoing financial support. AMB acknowledges 450
NSERC for the award of a CGS-D graduate fellowship and the Chemistry Department of 451
the University of Toronto for travel support. 452
453
Supporting Information. 454
Information on sampling site, meteorological conditions and gas phase species present 455
during the measurement period, absolute particle and grime concentrations and size 456
resolved particle composition for the final five days of measurement is located in the 457
Supporting Information available free of charge on the ACS Publications website. 458
459
References 460
461
(1) Ravishankara, A. R. Heterogeneous and Multiphase Chemistry in the 462
Troposphere. Science 1997, 276, 1058–1065. 463
(2) Chang, W. L.; Bhave, P. V.; Brown, S. S.; Riemer, N.; Stutz, J.; Dabdub, D. 464

Heterogeneous Atmospheric Chemistry, Ambient Measurements, and Model 465
Calculations of N2O5: A Review. Aerosol Sci and Tech 2011, 45, 665–695. 466
(3) Finlayson-Pitts, B. J.; Wingen, L. M.; Sumner, A. L.; Syomin, D.; Ramazan, K. 467
A. The Heterogeneous Hydrolysis of NO2 In Laboratory Systems and in Outdoor 468
and Indoor Atmospheres: an Integrated Mechanism. Phys Chem Chem Phys 469
2002, 5, 223–242. 470
(4) Riedel, T. P.; Wolfe, G. M.; Danas, K. T.; Gilman, J. B.; Kuster, W. C.; Bon, D. 471
M.; Vlasenko, A.; Li, S. M.; Williams, E. J.; Lerner, B. M.; et al. An MCM 472
Modeling Study of Nitryl Chloride (ClNO2) Impacts on Oxidation, Ozone 473
Production and Nitrogen Oxide Partitioning in Polluted Continental Outflow. 474
Atmos Chem Phys 2014, 14, 3789–3800. 475
(5) Finlayson-Pitts, B. J.; Ezell, M. J.; Pitts, J. N. Formation of Chemically Active 476
Chlorine Compounds by Reactions of Atmospheric NaCl Particles with Gaseous 477
N2O5 And ClONO2. Nature 1989, 337, 241–244. 478
(6) Harris, E.; Sinha, B.; Foley, S.; Crowley, J. N.; Borrmann, S.; Hoppe, P. Sulfur 479
Isotope Fractionation During Heterogeneous Oxidation of SO2 On Mineral Dust. 480
Atmos Chem Phys 2012, 12, 4867–4884. 481
(7) Usher, C. R.; Michel, A. E.; Grassian, V. H. Reactions on Mineral Dust. Chem 482
Rev 2003, 103, 4883–4939. 483
(8) Mamane, Y.; Gottlieb, J. Heterogeneous Reactions of Minerals with Sulfur and 484
Nitrogen Oxides. J Aerosol Sci 1989, 20, 303–311. 485
(9) George, C.; Ammann, M.; D'Anna, B.; Donaldson, D. J.; Nizkorodov, S. A. 486
Heterogeneous Photochemistry in the Atmosphere. Chem Rev 2015, 115, 4218–487

4258. 488
(10) Diamond, M. L.; Priemer, D. A.; Law, N. L. Developing a Multimedia Model of 489
Chemical Dynamics in an Urban Area. Chemosphere 2001, 44, 1655–1667. 490
(11) Csiszar, S. A.; Diamond, M. L.; Thibodeaux, L. J. Modeling Urban Films Using 491
a Dynamic Multimedia Fugacity Model. Chemosphere 2012, 87, 1024–1031. 492
(12) Diamond, M. L.; Gingrich, S. E.; Fertuck, K.; McCarry, B. E.; Stern, G. A.; 493
Billeck, B.; Grift, B.; Brooker, D.; Yager, T. D. Evidence for Organic Film on an 494
Impervious Urban Surface: Characterization and Potential Teratogenic Effects. 495
Environ Sci Technol 2000, 34, 2900–2908. 496
(13) Law, N. L.; Diamond, M. L. The Role of Organic Films and the Effect on 497
Hydrophobic Organic Compounds in Urban Areas: an Hypothesis. Chemosphere 498
1998, 36, 2607–2620. 499
(14) Simpson, A. J.; Lam, B.; Diamond, M. L.; Donaldson, D. J.; Lefebvre, B. A.; 500
Moser, A. Q.; Williams, A. J.; Larin, N. I.; Kvasha, M. P. Assessing the Organic 501
Composition of Urban Surface Films Using Nuclear Magnetic Resonance 502
Spectroscopy. Chemosphere 2006, 63, 142–152. 503
(15) Liu, Q.-T.; Chen, R.; McCarry, B. E.; Diamond, M. L.; Bahavar, B. 504
Characterization of Polar Organic Compounds in the Organic Film on Indoor and 505
Outdoor Glass Windows. Environ Sci Technol 2003, 37, 2340–2349. 506
(16) Lam, B.; Diamond, M. L.; Simpson, A. J.; Makar, P. A.; Truong, J.; Hernandez-507
Martinez, N. A. Chemical Composition of Surface Films on Glass Windows and 508
Implications for Atmospheric Chemistry. Atmos Environ 2005, 39, 6578–6586. 509
(17) Lombardo, T.; Ionescu, A.; Lefèvre, R. A.; Chabas, A.; Ausset, P.; Cachier, H. 510

Soiling of Silica-Soda-Lime Float Glass in Urban Environment: Measurements 511
and Modelling. Atmos Environ 2005, 39, 989–997. 512
(18) Favez, O.; Cachier, H.; Chabas, A.; Ausset, P.; Lefevre, R. Crossed Optical and 513
Chemical Evaluations of Modern Glass Soiling in Various European Urban 514
Environments. Atmos Environ 2006, 40, 7192–7204. 515
(19) Lombardo, T.; Ionescu, A.; Chabas, A.; Lefevre, R.; Ausset, P.; Candau, Y. 516
Dose–Response Function for the Soiling of Silica–Soda–Lime Glass Due to Dry 517
Deposition. Sci Total Environ 2010, 408, 976–984. 518
(20) Ionescu, A.; Lefèvre, R. A.; Chabas, A.; Lombardo, T.; Ausset, P.; Candau, Y.; 519
Rosseman, L. Modeling of Soiling Based on Silica-Soda-Lime Glass Exposure at 520
Six European Sites. Sci Total Environ 2006, 369, 246–255. 521
(21) Alfaro, S.; Chabas, A.; Lombardo, T.; Verney-Carron, A.; Ausset, P. Predicting 522
the Soiling of Modern Glass in Urban Environments: a New Physically-Based 523
Model. Atmos Environ 2012, 60, 348–357. 524
(22) Chabas, A.; Lombardo, T.; Cachier, H.; Pertuisot, M. H.; Oikonomou, K.; 525
Falcone, R.; Verità, M.; Geotti-Bianchini, F. Behaviour of Self-Cleaning Glass in 526
Urban Atmosphere. Build Environ 2008, 43, 2124–2131. 527
(23) Duigu, J. R.; Ayoko, G. A.; Kokot, S. Building and Environment. Build Environ 528
2009, 44, 2228–2235. 529
(24) Wu, R. W.; Harner, T.; Diamond, M. L. Evolution Rates and PCB Content of 530
Surface Films That Develop on Impervious Urban Surfaces. Atmos Environ 531
2008, 42, 6131–6143. 532
(25) Wu, R. W.; Harner, T.; Diamond, M. L.; Wilford, B. Partitioning Characteristics 533
of PCBs in Urban Surface Films. Atmos Environ 2008, 42, 5696–5705. 534
(26) Chabas, A.; Alfaro, S.; Lombardo, T.; Verney-Carron, A.; Da Silva, E.; Triquet, 535
S.; Cachier, H.; Leroy, E. Long Term Exposure of Self-Cleaning and Reference 536
Glass in an Urban Environment: a Comparative Assessment. Build Environ 2014, 537
79, 57–65. 538
(27) Lombardo, T.; Chabas, A.; Verney-Carron, A.; Cachier, H.; Triquet, S.; Darchy, 539
S. Physico-Chemical Characterization of Glass Soiling in Rural, Urban and 540
Industrial Environments. Environ Sci Pollut Res 2014, 21, 9251–9258. 541
(28) Chabas, A.; Lombardo, T.; Verney-Carron, A.; Ausset, P. Predicting the Soiling 542
of Modern Glass in Urban Environments: a New Physically-Based Model. Atmos 543
Environ 2012, 60, 348–357. 544
(29) Verney-Carron, A.; Dutot, A. L.; Lombardo, T.; Chabas, A. Predicting Changes 545
of Glass Optical Properties in Polluted Atmospheric Environment by a Neural 546
Network Model. Atmos Environ 2012, 54, 141–148. 547
(30) Lombardo, T.; Ionescu, A.; Chabas, A.; Lefèvre, R. A.; Ausset, P.; Candau, Y. 548
Dose–Response Function for the Soiling of Silica–Soda–Lime Glass Due to Dry 549
Deposition. Sci Total Environ 2010, 408, 976–984. 550
(31) Priemer, D. A.; Diamond, M. L. Application of the Multimedia Urban Model to 551
Compare the Fate of SOCs in an Urban and Forested Watershed. Environ Sci 552
Technol 2002, 36, 1004–1013. 553
(32) Diamond, M. L.; Melymuk, L.; Csiszar, S. A.; Robson, M. Estimation of PCB 554
Stocks, Emissions, and Urban Fate: Will Our Policies Reduce Concentrations 555
and Exposure? Environ Sci Technol 2010, 44, 2777–2783. 556

(33) Monge, M. E.; D'Anna, B.; Mazri, L.; Giroir-Fendler, A.; Ammann, M.; 557
Donaldson, D. J.; George, C. Light Changes the Atmospheric Reactivity of Soot. 558
Proc Natl Acad Sci 2010, 107, 6605–6609. 559
(34) Brigante, M.; Cazoir, D.; D'Anna, B.; George, C.; Donaldson, D. J. 560
Photoenhanced Uptake of NO2 By Pyrene Solid Films. J Phys Chem A 2008, 561
112, 9503–9508. 562
(35) Cazoir, D.; Brigante, M.; Ammar, R.; D'Anna, B.; George, C. Heterogeneous 563
Photochemistry of Gaseous NO2 On Solid Fluoranthene Films: a Source of 564
Gaseous Nitrous Acid (HONO) in the Urban Environment. J Photoch Photobio A 565
2014, 273, 23–28. 566
(36) Styler, S. A.; Brigante, M.; D'Anna, B.; George, C.; Donaldson, D. J. 567
Photoenhanced Ozone Loss on Solid Pyrene Films. Phys Chem Chem Phys 2009, 568
11, 7876–7884. 569
(37) George, C.; Strekowski, R. S.; Kleffmann, J.; Stemmler, K.; Ammann, M. 570
Photoenhanced Uptake of Gaseous NO2 on Solid-Organic Compounds: a 571
Photochemical Source of HONO? Faraday Disc 2005, 130, 195–210. 572
(38) Kahan, T. F.; Kwamena, N. O. A.; Donaldson, D. J. Heterogeneous Ozonation 573
Kinetics of Polycyclic Aromatic Hydrocarbons on Organic Films. Atmos Environ 574
2006, 40, 3448–3459. 575
(39) Kwamena, N.-O. A.; Clarke, J. P.; Kahan, T. F.; Diamond, M. L.; Donaldson, D. 576
J. Assessing the Importance of Heterogeneous Reactions of Polycyclic Aromatic 577
Hydrocarbons in the Urban Atmosphere Using the Multimedia Urban Model. 578
Atmos Environ 2007, 41, 37–50. 579
(40) Ammar, R.; Monge, M. E.; George, C.; D'Anna, B. Photoenhanced NO2 Loss on 580
Simulated Urban Grime. Chem Phys Chem 2010, 11, 3956–3961. 581
(41) Handley, S. R.; Clifford, D.; Donaldson, D. J. Photochemical Loss of Nitric Acid 582
on Organic Films: a Possible Recycling Mechanism for NOX. Environ Sci 583
Technol 2007, 41, 3898–3903. 584
(42) Baergen, A. M.; Donaldson, D. J. Photochemical Renoxification of Nitric Acid 585
on Real Urban Grime. Environ Sci Technol 2013, 47, 815–820. 586
(43) Engler, C.; Birmili, W.; Spindler, G.; Wiedensohler, A. Analysis of Exceedances 587
in the Daily PM10 Mass Concentration (50 Μgm−3) At a Roadside Station in 588
Leipzig, Germany. Atmos Chem Phys 2012, 12, 10107–10123. 589
(44) Creighton, P. J.; Lioy, P. J.; Haynie, F. H.; Lemmons, T. J.; Miller, J. L.; Gerhart, 590
J. Soiling by Atmospheric Aerosols in an Urban Industrial Area. J Air Waste 591
Manage Assoc 2012, 40, 1285–1289. 592
(45) Berner, A.; Luerzer, C. Mass Size Distributions of Traffic Aerosols at Vienna. J 593
Phys Chem 1980, 84, 2079. 594
(46) Finlayson-Pitts, B. J.; Pitts, J. N., Jr. Chemistry of the Upper and Lower 595
Atmosphere: Theory, Experiments, and Applications; Academic Press: San 596
Diego, California, 1999. 597
(47) Herrmann, H.; Brüggemann, E.; Franck, U.; Gnauk, T.; Löschau, G.; Müller, K.; 598
Plewka, A.; Spindler, G. A Source Study of PM in Saxony by Size-Segregated 599
Characterisation. J Atmos Chem 2006, 55, 103–130. 600
(48) Du, H.; Kong, L.; Cheng, T.; Chen, J.; Yang, X.; Zhang, R.; Han, Z.; Yan, Z.; 601
Ma, Y. Insights Into Ammonium Particle-to-Gas Conversion: Non-Sulfate 602

Ammonium Coupling with Nitrate and Chloride. Aerosol and Air Quality 603
Research 2010, 10, 589–595. 604
(49) Schaap, M.; Spindler, G.; Schulz, M.; Acker, K.; Maenhaut, W.; Berner, A.; 605
Wieprecht, W.; Streit, N.; Müller, K.; Brüggemann, E.; et al. Artefacts in the 606
Sampling of Nitrate Studied in the “INTERCOMP” Campaigns of EUROTRAC-607
AEROSOL. Atmos Environ 2004, 38, 6487–6496. 608
(50) Hodzic, A.; Bessagnet, B.; Vautard, R. A Model Evaluation of Coarse-Mode 609
Nitrate Heterogeneous Formation on Dust Particles. Atmos Environ 2006, 40, 610
4158–4171. 611
(51) VandenBoer, T. C.; Petroff, A.; Markovic, M. Z.; Murphy, J. G. Size 612
Distribution of Alkyl Amines in Continental Particulate Matter and Their Online 613
Detection in the Gas and Particle Phase. Atmos Chem Phys 2011, 11, 4319–4332. 614
(52) Pathak, R. K.; Chan, C. K. Inter-Particle and Gas-Particle Interactions in 615
Sampling Artifacts of PM2.5 In Filter-Based Samplers. Atmos Environ 2005, 39, 616
1597. 617
(53) Hennigan, C. J.; Izumi, J.; Sullivan, A. P.; Weber, R. J.; Nenes, A. A Critical 618
Evaluation of Proxy Methods Used to Estimate the Acidity of Atmospheric 619
Particles. Atmos Chem Phys 2015, 15, 2775–2790. 620
(54) Draxler, R. R.; Rolph, G. D. HYPSPLIT (HYbrid Single-Particle Lagrangian 621
Integrated Trajectory) Model Access via NOAA ARL READY Website 622
(Http://Www.Arl.Noaa.Gov/HYSPLIT.Php); NOAA Air Resources Laboratory: 623
College Park, MD. 624
(55) Möller, D.; Acker, K. Chlorine-Phase Partitioning at Melpitz Near Leipzig. In 625

Nucleation and Atmospheric Aerosols; Springer Netherlands: Gallaway, Ireland, 626
2007; pp. 654–658. 627
(56) Lombardo, T.; Chabas, A.; Lefèvre, R. A.; Verità, M.; Geotti-Bianchini, F. 628
Weathering of Float Glass Exposed Outdoors in an Urban Area. Glass Technol 629
2005, 46, 271. 630
(57) Zhou, X.; Gao, H.; He, Y.; Huang, G.; Bertman, S. B.; Civerolo, K.; Schwab, J. 631
Nitric Acid Photolysis on Surfaces in Low-NOX Environments: Significant 632
Atmospheric Implications. Geophys Res Lett 2003, 30, 2217. 633
(58) Flechard, C. R.; Massad, R. S.; Loubet, B.; Personne, E.; Simpson, D.; Bash, J. 634
O.; Cooter, E. J.; Nemitz, E.; Sutton, M. A. Advances in Understanding, Models 635
and Parameterizations of Biosphere-Atmosphere Ammonia Exchange. 636
Biogeosciences 2013, 10, 5183–5225. 637
(59) Hu, Q.; Zhang, L.; Evans, G. J.; Yao, X. Variability of Atmospheric Ammonia 638
Related to Potential Emission Sources in Downtown Toronto, Canada. Atmos 639
Environ 2014, 99, 365–373. 640
(60) Grannas, A. M.; Jones, A. E.; Dibb, J.; Ammann, M.; Anastasio, C.; Beine, H. J.; 641
Bergin, M.; Bottenheim, J.; Boxe, C. S.; Carver, G.; et al. An Overview of Snow 642
Photochemistry: Evidence, Mechanisms and Impacts. Atmos Chem Phys 2007, 7, 643
4329–4373. 644
(61) Nanayakkara, C. E.; Jayaweera, P. M.; Rubasinghege, G.; Baltrusaitis, J.; 645
Grassian, V. H. Surface Photochemistry of Adsorbed Nitrate: the Role of 646
Adsorbed Water in the Formation of Reduced Nitrogen Species on α-Fe2O3 647
Particle Surfaces. J Phys Chem A 2014, 118, 158–166. 648

(62) Wong, K. W.; Tsai, C.; Lefer, B.; Grossberg, N.; Stutz, J. Modeling of Daytime 649
HONO Vertical Gradients During SHARP 2009. Atmos Chem Phys 2013, 13, 650
3587–3601. 651
(63) Wong, K. W.; Tsai, C.; Lefer, B.; Haman, C.; Grossberg, N.; Brune, W. H.; Ren, 652
X.; Luke, W.; Stutz, J. Daytime HONO Vertical Gradients During SHARP 2009 653
in Houston, TX. Atmos Chem Phys 2012, 12, 635–652. 654
(64) Simpson, W. R.; Brown, S. S.; Saiz-Lopez, A.; Thornton, J. A.; Glasow, R. V. 655
Tropospheric Halogen Chemistry: Sources, Cycling, and Impacts. Chem Rev 656
2015, 115, 4035–4062. 657
(65) Mielke, L. H.; Furgeson, A.; Osthoff, H. D. Observation of ClNO2 In a Mid-658
Continental Urban Environment. Environ Sci Technol 2011, 45, 8889–8896. 659
(66) Thornton, J. A.; Kercher, J. P.; Riedel, T. P.; Wagner, N. L.; Cozic, J.; Holloway, 660
J. S.; Dubé, W. P.; Wolfe, G. M.; Quinn, P. K.; Middlebrook, A. M.; et al. A 661
Large Atomic Chlorine Source Inferred From Mid-Continental Reactive 662
Nitrogen Chemistry. Nature 2010, 464, 271–274. 663
(67) Simon, H.; Kimura, Y.; McGaughey, G.; Allen, D. T.; Brown, S. S.; Coffman, 664
D.; Dibb, J.; Osthoff, H. D.; Quinn, P.; Roberts, J. M. Modeling Heterogeneous 665
ClNO2 Formation, Chloride Availability, and Chlorine Cycling in Southeast 666
Texas. Atmos Environ 2010, 44, 5476–5488. 667
668