chesapeake bay 2017 midpoint assessment policy issues for ...€¦ · overview of psc meeting today...
TRANSCRIPT

Chesapeake Bay Program Principals’ Staff Committee December 19, 2017
Chesapeake Bay 2017 Midpoint Assessment—
Policy Issues for Partnership Decisions

Overview of Meeting and Policy Decision Recommendations
Teresa Koon, WV DEP, CBP Water Quality Goal Implementation Team Vice Chair
2

Day 1 Requested PSC Decisions
1. Adoption of the Phase 6 suite of modeling tools for finalizing the draft Phase III planning targets and for management application in the Phase III WIPs and two-year milestones through 2025
2. Approval of the proposed Bay’s assimilative capacity
3. Approval of the process for the 4-month Partnership review of the draft Phase III WIP planning targets, including how special cases are addressed
4. Base Phase III WIP development on 2025 current zoning conditions
3

Day 2 Requested PSC Decisions
5. Develop a Partnership implementation plan to address Conowingoinfill
6. Adopt a dual approach to factor climate change into the Phase III WIPs
7. Approval of the draft Phase III WIP planning targets as a starting point of the 4-month Partnership review period
4

Overview of PSC Meeting
Today
Focus on building understanding and answering questions
Focus on consensus building and collaborative decision-making on foundational midpoint assessment issues
Opportunity for evening jurisdictional caucuses
Tomorrow
Focus on consensus building and collaborative decision-making on key policy issues
5

Jurisdiction1985
Baseline 2013
ProgressGrowth in Load
to 2025Phase III
Planning Target
NY 18.71 15.44 -0.74 10.59
PA 122.41 99.28 1.66 73.18
MD 83.56 55.89 1.52 45.30
WV 8.73 8.06 -0.02 6.35
DC 6.48 1.75 0.00 2.43
DE 6.97 6.59 0.48 4.59
VA 84.29 61.53 1.09 55.82
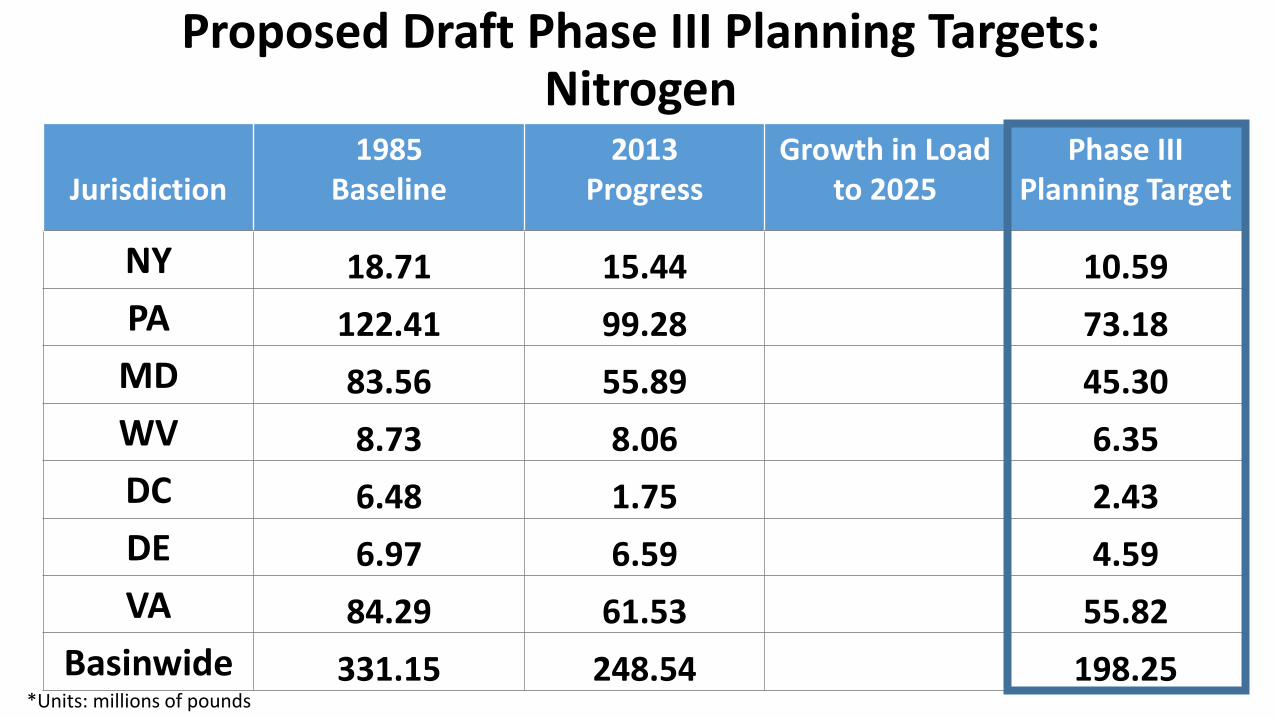
Basinwide 331.15 248.54 4.00 198.25*Units: millions of pounds
WQGIT & Modeling Workgroup Recommendations: Nitrogen

Jurisdiction 1985 Baseline
2013 Progress
Growth in Load to 2025
Phase III Planning Target
NY 1.198 0.710 -0.005 0.506
PA 6.115 3.696 0.044 3.073
MD 7.419 3.919 -0.015 3.604
WV 0.793 0.560 -0.017 0.456
DC 0.090 0.062 0.000 0.130
DE 0.225 0.115 0.007 0.120
VA 13.545 6.345 0.140 6.186
Basinwide 29.384 15.408 0.154 14.073*Units: millions of pounds
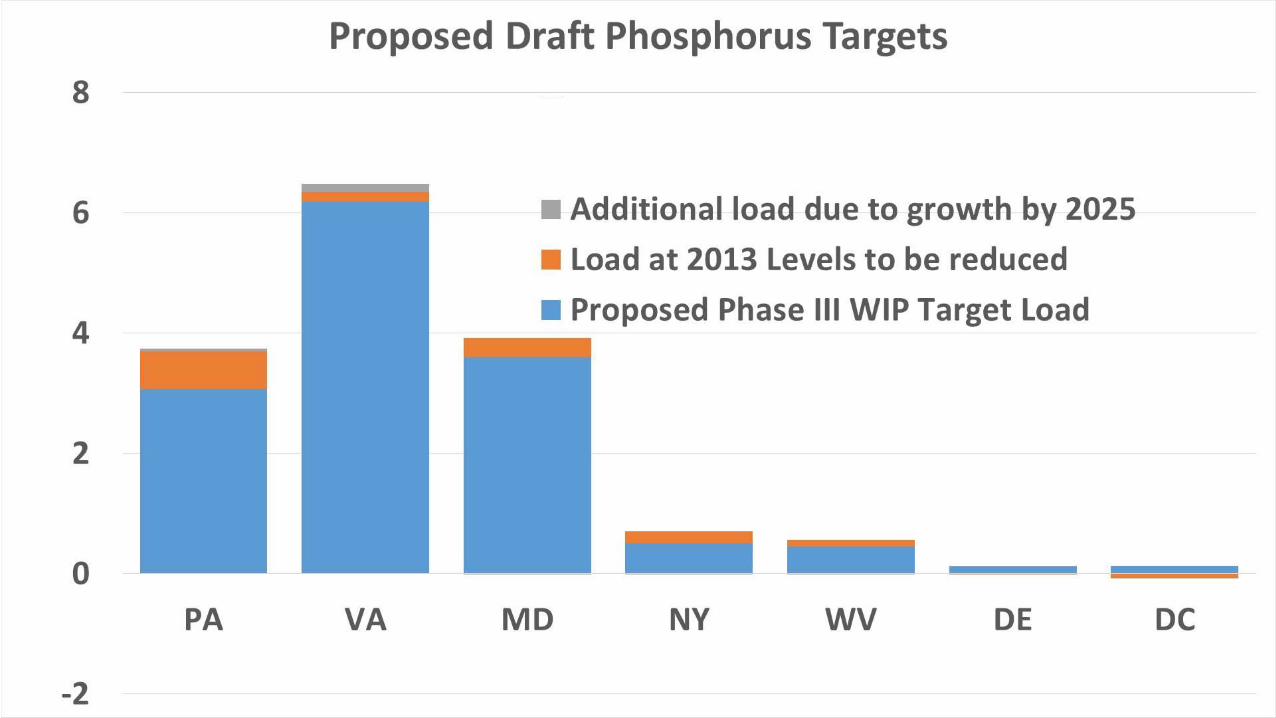
WQGIT & Modeling Workgroup Recommendations: Phosphorus


Cautions About Comparisons Back to Phase II WIPs
Be cautious with comparing the proposed draft Phase III planning targets with the jurisdictions’ Phase II WIP loads
• Different watershed models – more BMPs, different land uses and loading rates
• State-driven changes between Phase II and Phase III
• Phase II WIP planning targets were not derived using the Bay TMDL allocation methodology—they were based on a similar level of effort to the Phase I WIPs
10

What’s Changed, the Implications, and Our Improved ModelsLee Currey, MDE, CBP Modeling Workgroup Co-Chair
11

What’s Changed, Why, and Implications
A lot has changed since 2010 and our Phase I and Phase II WIPs
• Much improved modeling and other decision support tools
• High resolution land cover data for entire watershed
• Hundreds more BMPs available for crediting
• Significant data gathered from local agricultural and municipality partners incorporated into our models and other decision support tools
12

Improved Partnership Models
• 5 years of collaborative Partnership decision-making on every aspect of every model
• Multiple STAC-sponsored technical workshops from soil phosphorus to Conowingo
• Independent scientific peer reviews of every Partnership model
• Comprehensive fatal flaw review and issue resolution by the partners
13

14
Average Load + Inputs * Sensitivity
Land Use Acres
BMPs
Land to Water
Stream Delivery
River Delivery
Phase 6 Watershed Model
Phase 6 Bay Watershed Model
Prior Bay Watershed Models
*
*
*
*
*6
Trees
Roots Leaves
Particulate
Refractory
Organic N
Particulate
Labile
Organic N
Solution
Ammonia
Nitrate
Solution
Labile
Organic N
Adsorbed
Ammonia
Solution
Refractory
Organic N
Each submodel has a complex hydrologic or nutrient cycling structure
Atm
osp
her
ic D
eposi
tion
Den
itri
fica
tio
n
Export
Export Export ExportExport Export Export

Phase 5 30-Meter
Resolution Land
Use/Land Cover Data
Phase 6 1-Meter
Resolution Land
Use/Land Cover Data

Hundreds More BMPs
16
Advanced Grey Infrastructure Nutrient Discovery Program Dry Waste Storage Structure RI Headw ater Wetland Gains - Reestablished Nutrient Management P Placement Stream Restoration Urban Waste Treatment - Dairy Cover Crop Traditional - FED Cover Crop Traditional - NutRND
Ag Shoreline Management Dry Well Headw ater Wetland Restoration Nutrient Management P Rate Streambank and Shoreline Protection Waste Treatment - Horse Cover Crop Traditional - FEO Cover Crop Traditional - NutRNO
Ag Shoreline Non-Vegetated Erosion & Sediment Control High Residue Tillage Management Nutrient Management P Timing Streambank Restoration Waste Treatment - Layer Cover Crop Traditional - FPEA Cover Crop Traditional - NutTED
Ag Shoreline Vegetated Erosion and Sediment Control Level 1 Horse Pasture Management Pasture and Hay Planting Streambank Stabilization Waste Treatment - Other Cattle Cover Crop Traditional - FPED Cover Crop Traditional - NutTEO
Alternative Crop/Sw itchgrass RI Erosion and Sediment Control Level 2 Hydrodynamic Structures Permanent w ildlife habitat, non-easement Street Cleaning Practice 1 Waste Treatment - Poultry Cover Crop Traditional - FPEO Cover Crop Traditional - NutTLD
Alternative Crops Erosion and Sediment Control Level 3 IFAS Permeable Pavement - NoSVNoUDAB Street Cleaning Practice 2 Waste Treatment - Pullet Cover Crop Traditional - FPND Cover Crop Traditional - NutTLO
Alternative Water System Establishment of permanent introduced grasses and legumes IFAS Elevated Mound Permeable Pavement - NoSVUDAB Street Cleaning Practice 3 Waste Treatment - Sw ine Cover Crop Traditional - FPNO Cover Crop Traditional - NutTND
Amendments for the Treatment of Agricultural Waste Exclusion Fence w ith Forest Buffer IFAS Shallow Pressure Permeable Pavement - NoSVUDCD Street Cleaning Practice 4 Waste Treatment - Turkey Cover Crop Traditional - LEA Cover Crop Traditional - NutTNO
Animal Compost Structure RI Exclusion Fence w ith Forest Buffer RI IMF Permeable Pavement - SVNoUDAB Street Cleaning Practice 5 Waste Treatment Lagoon Cover Crop Traditional - LED Cover Crop Traditional - NutWED
Animal Mortality Facility Exclusion Fence w ith Grass Buffer IMF Elevated Mound Permeable Pavement - SVUDAB Street Cleaning Practice 6 Wastew ater Treatment Strip Cover Crop Traditional - LEO Cover Crop Traditional - NutWEO
Animal Trails and Walkw ays Exclusion Fence w ith Grass Buffer RI IMF Shallow Pressure Permeable Pavement - SVUDCD Street Cleaning Practice 7 Water Control Structure Cover Crop Traditional - LGHEA Cover Crop Traditional - NutWLD
Animal Waste Management Systems (All Types) Exclusion Fence w ith Narrow Forest Buffer Impervious Disconnection Prescribed Grazing Street Cleaning Practice 8 Water Control Structure RI Cover Crop Traditional - LGHED Cover Crop Traditional - NutWLO
Barnyard Clean Water Diversion RI Exclusion Fence w ith Narrow Forest Buffer RI Infiltration Basin Proprietary Ex Situ Street Cleaning Practice 9 Watering Facility Cover Crop Traditional - LGHEO Cover Crop Traditional - NutWND
Barnyard Runoff Controls Exclusion Fence w ith Narrow Grass Buffer Infiltration Practices Proprietary Ex Situ Elevated Mound Street Cleaning Practice 10 Watering Trough RI Cover Crop Traditional - LGHND Cover Crop Traditional - NutWNO
Biofiltration Exclusion Fence w ith Narrow Grass Buffer RI Infiltration Trench Proprietary Ex Situ Shallow Pressure Street Cleaning Practice 11 Wet Extended Detention Cover Crop Traditional - LGHNO Cover Crop Traditional - OHEA
Bioretention - A/B soils, no underdrain Extension of CREP Watering System Land Reclamation, Abandoned Mined Land Rain Garden Street Sw eeping Wet Pond Cover Crop Traditional - LGLEA Cover Crop Traditional - OHED
Bioretention - C/D soils, underdrain Feed Management Land Retirement to Mixed Open Reduced Tillage Structure for Water Control Wet Ponds & Wetlands Cover Crop Traditional - LGLED Cover Crop Traditional - OHEO
Biosw ale Field Border Land Retirement to Pasture Reduction of Impervious Surface Surface Sand Filter Wet Sw ale Cover Crop Traditional - LGLEO Cover Crop Traditional - OHND
Channel Bed Stabilization Filter Strip Loafing Lot Management System Reforestation of Erodible Crop and Pastureland Tidal Algal Flow -w ay Wetland Creation Cover Crop Traditional - LGLND Cover Crop Traditional - OHNO
Cisterns & Rain Barrels Filtering Practices Manure Incorporation High Disturbance Regenerative Stormw ater Conveyance Tree Planting Wetland Functional Gains - Enhanced Cover Crop Traditional - LGLNO Cover Crop Traditional - OKEA
Composter Facilities Filtration Manure Incorporation High Disturbance Immediate Retirement of Highly Erodible Land Tree/Shrub Establishment Wetland Gains - Established Cover Crop Traditional - LND Cover Crop Traditional - OKED
Conservation Cover Floating Treatment Wetland 1 Manure Incorporation High Disturbance Late Retrofit Runoff Reduction Underground Infiltration System Wetland Gains - Reestablished Cover Crop Traditional - LNO Cover Crop Traditional - OKEO
Conservation Plans Floating Treatment Wetland 2 Manure Incorporation Low Disturbance Retrofit Stormw ater Treatment Urban Filter Strip Runoff Reduction Wetland Rehabilitation Cover Crop Traditional - NutARED Cover Crop Traditional - REA
Conservation Tillage Floating Treatment Wetland 3 Manure Incorporation Low Disturbance Immediate Ridge Tillage Urban Filter Strip Storw ater Treatment Wetland Restoration Cover Crop Traditional - NutAREO Cover Crop Traditional - RED
Constructed Wetland Floating Treatment Wetland 4 Manure Incorporation Low Disturbance Late Riparian Forest Buffer Urban Forest Buffer Windbreak/Shelterbelt Establishment Cover Crop Traditional - NutARND Cover Crop Traditional - REO
Constructed Wetland Elevated Mound Floating Treatment Wetland 5 Manure Injection Riparian Herbaceous Cover Urban Forest Planting Woodland Buffer Filter Area Cover Crop Traditional - NutARNO Cover Crop Traditional - RLD
Constructed Wetland Septic Forest Buffer on Watercourse RI Manure Transport RMF Urban Infiltration Practices Commodity Cover Crop - Early Cover Crop Traditional - NutBED Cover Crop Traditional - RLO
Constructed Wetland Shallow Pressure Forest Buffers Monitored Non-Tidal Algal Flow -w ay RMF Elevated Mound Urban Nutrient Management Plan Commodity Cover Crop - Standard Cover Crop Traditional - NutBEO Cover Crop Traditional - RND
Conversion to Hayland RI Forest Conservation Monitored Tidal Algal Flow -w ay RMF Shallow Pressure Urban Nutrient Management Plan - MDCA Cover Crops Cover Crop Traditional - NutBND Cover Crop Traditional - RNO
Conversion to Pasture RI Forest Harvesting Practices Mulch Tillage Roof runoff management Urban Nutrient Management Plan - MDDIY CoverCropComLate Cover Crop Traditional - NutBNO Cover Crop Traditional - TEA
CREP Riparian Forest Buffer Forest Nutrient Exclusion Area on Watercourse Narrow RI Narrow Forest Buffers Roof Runoff Structure Urban Nutrient Management Plan - PlanHR Cover Crop Traditional - AREA Cover Crop Traditional - NutBRED Cover Crop Traditional - TED
CREP Wetland Restoration Forest Stand Improvement Narrow Urban Forest Buffer Rotational Grazing RI Urban Nutrient Management Plan - PlanLR Cover Crop Traditional - ARED Cover Crop Traditional - NutBREO Cover Crop Traditional - TEO
CREP Wildlife Habitat Grass Buffer on Watercourse RI New Runoff Reduction SCWQP Urban Shoreline Management Cover Crop Traditional - AREO Cover Crop Traditional - NutFPED Cover Crop Traditional - TLD
Critical Area Planting Grass Buffer Strip New Stormw ater Treatment Septic Connections Urban Shoreline Non-Vegetated Cover Crop Traditional - ARND Cover Crop Traditional - NutFPEO Cover Crop Traditional - TLO
D&G Road - E&S Control and Outlets Grass Buffers No Tillage Septic Denitrif ication Urban Shoreline Vegetated Cover Crop Traditional - ARNO Cover Crop Traditional - NutFPND Cover Crop Traditional - TND
D&G Road - Outlets Only Grass Filter Strips Non-Tidal Algal Flow -w ay Septic Eff luent Elevated Mound Urban stream restoration Cover Crop Traditional - BEA Cover Crop Traditional - NutFPNO Cover Crop Traditional - TNO
D&G Road - Surface Aggragate and Rasied Roadbed Grass Nutrient Exclusion Area on Watercourse Narrow RI NSF 40 Septic Eff luent Shallow Pressure Vegetated Open Channels Cover Crop Traditional - BED Cover Crop Traditional - NutOHED Cover Crop Traditional - WEA
Dead Bird Composting Facility Grassed Waterw ay NSF 40 Elevated Mound Septic Tank Advanced Treatment Vegetated Treatment Area Cover Crop Traditional - BEO Cover Crop Traditional - NutOHEO Cover Crop Traditional - WED
Default - Bioretention - A/B soils, underdrain Grazing Land Protection NSF 40 Shallow Pressure Septic Tank Pumpout Waste Control Facilities Cover Crop Traditional - BND Cover Crop Traditional - NutOHND Cover Crop Traditional - WEO
Disconnection of Rooftop Runoff Green Roofs Nutrient Management Core N Solid/Liquid Waste Separation Facility Waste Storage Facility Cover Crop Traditional - BNO Cover Crop Traditional - NutOHNO Cover Crop Traditional - WLD
Dry Detention Ponds Hardw ood tree planting Nutrient Management Core P Storm Drain Cleaning Waste Storage Pond Cover Crop Traditional - BREA Cover Crop Traditional - NutRED Cover Crop Traditional - WLO
Dry Detention Ponds & Hydrodynamic Structures Headw ater CREP Wetland Restoration Nutrient Management N Placement Stream Channel Stabilization Waste Storage Structure Cover Crop Traditional - BRED Cover Crop Traditional - NutREO Cover Crop Traditional - WND
Dry Extended Detention Ponds Headw ater Wetland Creation Nutrient Management N Rate Stream Improvement for Fish Habitat Waste Treatment - Beef Cover Crop Traditional - BREO Cover Crop Traditional - NutRLD Cover Crop Traditional - WNO
Dry Sw ale Headw ater Wetland Gains - Established Nutrient Management N Timing Stream Restoration Ag Waste Treatment - Broiler Cover Crop Traditional - FEA Cover Crop Traditional - NutRLO

Local Agricultural and Municipality Data
• Municipal Separate Storm Sewer Systems
• Combined Sewer Systems
• Sewer Service Areas
• Land Cover
• Land Use
• Parcels
• Roads
• Beaches
• Institutional lands
• Federal lands
• Golf courses
• Surface mines
• Landfills
• Protected lands
• Streams
• Wetlands
• Tidal zones
• Floodplains
• Frequently flooded soils
• Livestock populations
• Poultry populations
• Crop, hay and pasture acreages
• Crop yields
• Soil P concentrations
• BMPs
17

Our Models are Tested using Decades of Monitoring Data
• Hundreds of thousands of water quality monitoring data points
• Hundreds of monitoring stations
• Nitrogen, phosphorus, and sediment
• Data records lasting up to 3 decades
Size of circle denotes relative number of data points: 100s to 1,000s

y=0.9889x
R²=0.92566
0
5
10
15
20
25
30
35
40
0 5 10 15 20 25 30 35 40
NitratePerAcreLoad,NSE=0.9243
y=0.9754x
R²=0.6632
0.0
0.3
0.6
0.9
1.2
1.5
1.8
2.1
2.4
0.0 0.3 0.6 0.9 1.2 1.5 1.8 2.1 2.4
PhosphorusPerAcreLoad,NSE=0.6099
y=0.9416x
R²=0.94272
0
5
10
15
20
25
30
35
40
0 5 10 15 20 25 30 35 40
NitrogenPerAcreLoad,NSE=0.9370
y=0.9863x
R²=0.64849
0.0
0.2
0.4
0.6
0.8
1.0
1.2
1.4
1.6
0.0 0.2 0.4 0.6 0.8 1.0 1.2 1.4 1.6
SedimentPerAcreLoad,NSE=0.5696
[1] Model calibration is made to improve agreement with monitoring data [2] Simulated vs. WRTDS Per Acre Load and the Geographic Efficiencies
[3] Simulated vs. WRTDS loads
3.0
3.5
4.0
4.5
5.0
5.5
6.0
6.5
7.0
7.5
8.0
8.5
9.0
9.5
3.0 3.5 4.0 4.5 5.0 5.5 6.0 6.5 7.0 7.5 8.0 8.5 9.0 9.5
SIMULA
TEDLOADS(lbs/ye
ar)
USGS- WRTDSLOADS(lbs/year)
1-to-1
TOTN
1E31E41E51E61E71E81E9
1E31E41E51E61E71E81E9
assuming+/- 10%uncertaintyinWRTDSestimates
BASIN Sept June Phase5
SUSQ -01% -03% -01%
POTO -09% -09% -22%
JAME -09% -02% -07%
RAPP -11% -07% -10%
APPO -18% -07% -02%
PAMU -08% 00% 06%
MATT 06% 07% -06%
PATU 08% 05% 19%
CHOP -01% 08% -13%
[4] Agreement between the simulated and WRTDS loads at the RIM sites
Extensive Testing of the Models Throughout the
Watershed

Best Match with Monitoring Data Ever!
20
NSE of monthly phosphorus load
NSE of annual phosphorus loads
= 0.942
= 0.935
Conowingo Phase 6 Simulation Compared to Annual WRTDS Loads

Best Match with Monitoring Data Ever!
21
NSE of monthly phosphorus load
NSE of annual phosphorus loads
= 0.942
= 0.935
Conowingo Phase 6 Simulation Compared to Monthly WRTDS Loads

Today’s Requested Policy Decision
Adoption of the Phase 6 suite of modeling tools for finalizing the Phase III planning targets and for management application in the Phase III WIPs and two-year milestones through 2025
22

Phase III WIP Planning Targets MethodologyGary Shenk, USGS, CBP Phase 6 Watershed Model
Coordinator
23

Review of the Phase III Planning Targets Methodology
• A step by step walk through of the agreed-to Phase III planning targets methodology
• How it works to allocate updated cap loads equitably among the jurisdictions
24

Three Partnership Principals
• Allocated loads must result in achievement of the states’ Bay water quality standards
• Major river basins that contribute the most to Bay water quality problems must do the most to resolve those problems
• All tracked and reported reductions in loads are credited toward achieving assigned loads
25Source: 2010 Chesapeake Bay TMDL

26
More Impact, Do MorePhase 5 Nitrogen Nitrogen
Phase 6 Nitrogen

27
More Impact, Do MorePhase 5 Phosphorus Phase 6 Phosphorus

No Action
E3
Controllable Load
Defining the Controllable Load
28
No Action: • Watershed conditions with minimal to
no controls on load • Wastewater at primary treatment
E3 or “Everything by Everyone, Everywhere”:• Watershed conditions with maximum
controls on loads, regardless of cost• Wastewater at high level of nutrient
control • 3mg/l TN, 0.1 mg/l TP

Determining the Bay’s Ability to Absorb Pollutants

Allowing for Special Cases
• Previously agreed to consider special cases put forth by jurisdictions
• Consideration of special cases factored into four-month review process
• CBPO will provide support to jurisdictions considering special cases
• Final decisions on allowance of special cases will be made by the PSC in April 2018
30
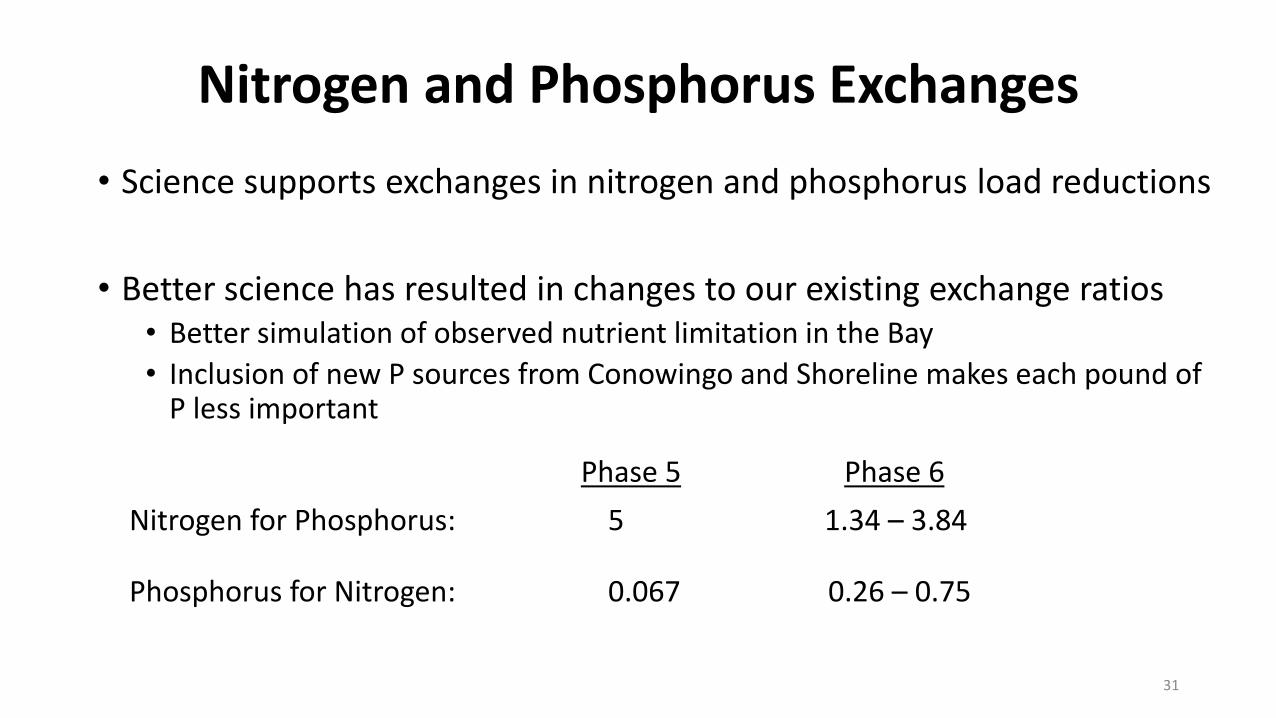
Nitrogen and Phosphorus Exchanges
• Science supports exchanges in nitrogen and phosphorus load reductions
• Better science has resulted in changes to our existing exchange ratios• Better simulation of observed nutrient limitation in the Bay
• Inclusion of new P sources from Conowingo and Shoreline makes each pound of P less important
31
Phase 5 Phase 6
Nitrogen for Phosphorus: 5 1.34 – 3.84
Phosphorus for Nitrogen: 0.067 0.26 – 0.75

Accounting for Nitrogen Air Deposition to Bay Watershed
• Updated estimated benefits to Bay and watershed from clear air actions.
• From 1985 through 2025, the jurisdictions will receive an estimated 254 million lbs. less nitrogen on their lands and rivers.
32
0
100
200
300
400
500
600
1984
1985
1986
1987
1988
1989
1990
1991
1992
1993
1994
1995
1996
1997
1998
1999
2000
2001
2002
2003
2004
2005
2006
2007
2008
2009
2010
2011
2012
2013
2014
2015
2016
2017
2018
2019
2020
2021
2022
2023
2024
2025
2026
2027
2028
2029
2030
MillionsofPoundsInorganicNitrogen
InorganicNitrogenDepositiontotheChesapeakeWatershed

Accounting for Nitrogen Air Deposition to Bay Tidal Waters
• From 1985 through 2025, loads will be reduced from 21.5 to 15.6 million lbs.
• By 2025, 0.1 million pounds below EPA’s Bay TMDL allocation (15.7 million lbs.)
• By 2030, load drops to 14.9 millions lbs., 0.8 million pounds below EPA’s Bay TMDL allocation
33

Determining the Bay’s Ability to Absorb Pollutants
(Assimilative Capacity)Rich Batiuk, U.S. EPA CBPO Associate Director for Science,
Analysis and Implementation
34

Here’s Where We Want to Get to

What’s Changed and the ImplicationsAn improved Water Quality and Sediment Transport Model (WQSTM) is providing a better
simulation of dissolved oxygen in the tidal Bay affording higher confidence in implementation planning for 2025.
Good simulation of DO concentrations of Open Water, Deep Water, and Deep Channel (CB4 shown here)

What’s Changed and the Implications
37
The Chesapeake Bay’s summertime
dead zone is decreasing in size!
Source: Testa et al. 2017

What Hasn’t Changed
38
Delaware, District of Columbia, Maryland and Virginia’s Chesapeake Bay water quality standards regulations have not changed since 2012
• Five tidal habitat-based designated uses
• Dissolved oxygen, SAV, water clarity and chlorophyll a criteriato protect those uses
• Fully consistent criteria attainment assessment procedures
• How we use model output to assess criteria attainment under model-simulated load conditions

Maryland’s water quality standards regulations still contain restoration variances agreed to by the Partners/approved by EPA in 2010 and updated in 2012
Maryland’s Restoration Variances
Patapsco River Deep-water 7%
Lower Chester River Deep-channel 16%
Eastern Bay Deep-channel 2%
Middle Central Chesapeake Bay• Deep-water 7%• Deep-channel 2%

• ANATF_DC• ANATF_MD• PISTF• POTOH1_MD• POTOMH_MD• PMKOH• YRKMH• YRKPH
Attained
Not Attained
Not Applicable
Segments Attaining Oxygen Standards: Open-Water Use
No Action
404 TN 41.7 TP
E3
All Forest
• ELIPH• C&Dcanal• ELKOH• SASOH• EASMH• CHOTF• CHOOH• CHOMH2• CHOMH1• POCTF• POCOH_MD• POCOH_VA• TANMH_VA
• CB2OH• CB6PH• CB7PH• BSHOH• SEVMH• PAXOH• PAXMH• POTTF_DC• POTTF_MD
Segments NOT in Attainment
Attained
Not Attained
Not Applicable
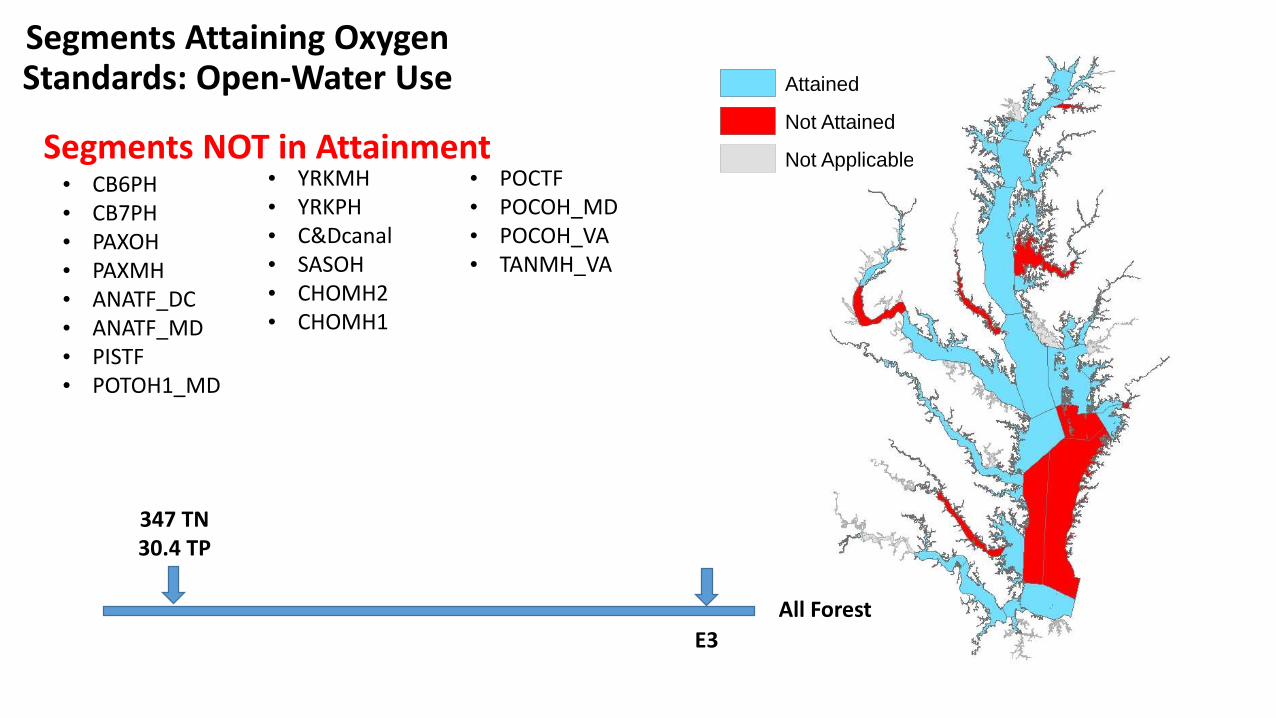
Segments Attaining Oxygen Standards: Open-Water Use
347 TN 30.4 TP
E3
All Forest
• CB6PH• CB7PH• PAXOH• PAXMH• ANATF_DC• ANATF_MD• PISTF• POTOH1_MD
• YRKMH• YRKPH• C&Dcanal• SASOH• CHOMH2• CHOMH1
• POCTF• POCOH_MD• POCOH_VA• TANMH_VA
Segments NOT in Attainment

Attained
Not Attained
Not Applicable
Segments Attaining Oxygen Standards: Open-Water Use
E3
All Forest
• CB6PH• CB7PH• PAXOH• PAXMH• ANATF_DC• ANATF_MD• PISTF• POTOH1_MD
• YRKMH• YRKPH• C&Dcanal• SASOH• CHOMH2• CHOMH1
• POCTF• POCOH_MD• POCOH_VA• TANMH_VA
Segments NOT in Attainment
337 TN23.7 TP

Attained
Not Attained
Not Applicable
Segments Attaining Oxygen Standards: Open-Water Use
337 TN23.7 TP
E3All Forest
• CB6PH• CB7PH• WSTMH• PAXOH• PAXMH• ANATF_DC• ANATF_MD• PISTF
• YRKMH• YRKPH• SASOH• CHOMH2• CHOMH1• TANMH_VA
Segments NOT in Attainment

Attained
Not Attained
Not Applicable
Segments Attaining Oxygen Standards: Open-Water Use
317 TN 21.9 TP
E3
All Forest
• CB6PH• CB7PH• PAXOH• ANATF_DC• ANATF_MD• PISTF
• YRKMH• SASOH• CHOMH2• POCTF• POCOH_MD• POCOH_VA
Segments NOT in Attainment

Attained
Not Attained
Not Applicable
Segments Attaining Oxygen Standards: Open-Water Use
E3
All Forest
• CB6PH• CB7PH• PAXOH• ANATF_DC• ANATF_MD• PISTF
• YRKMH• SASOH• CHOMH2• POCTF• POCOH_MD• POCOH_VA
Segments NOT in Attainment
266 TN 16.9 TP

Attained
Not Attained
Not Applicable
Segments Attaining Oxygen Standards: Open-Water Use
253 TN 15.9 TP
E3
All Forest
• CB7PH• ANATF_DC• ANATF_MD• PISTF
• YRKMH• CHKOH
Segments NOT in Attainment
Attained
Not Attained
Not Applicable
Segments Attaining Oxygen Standards: Open-Water Use
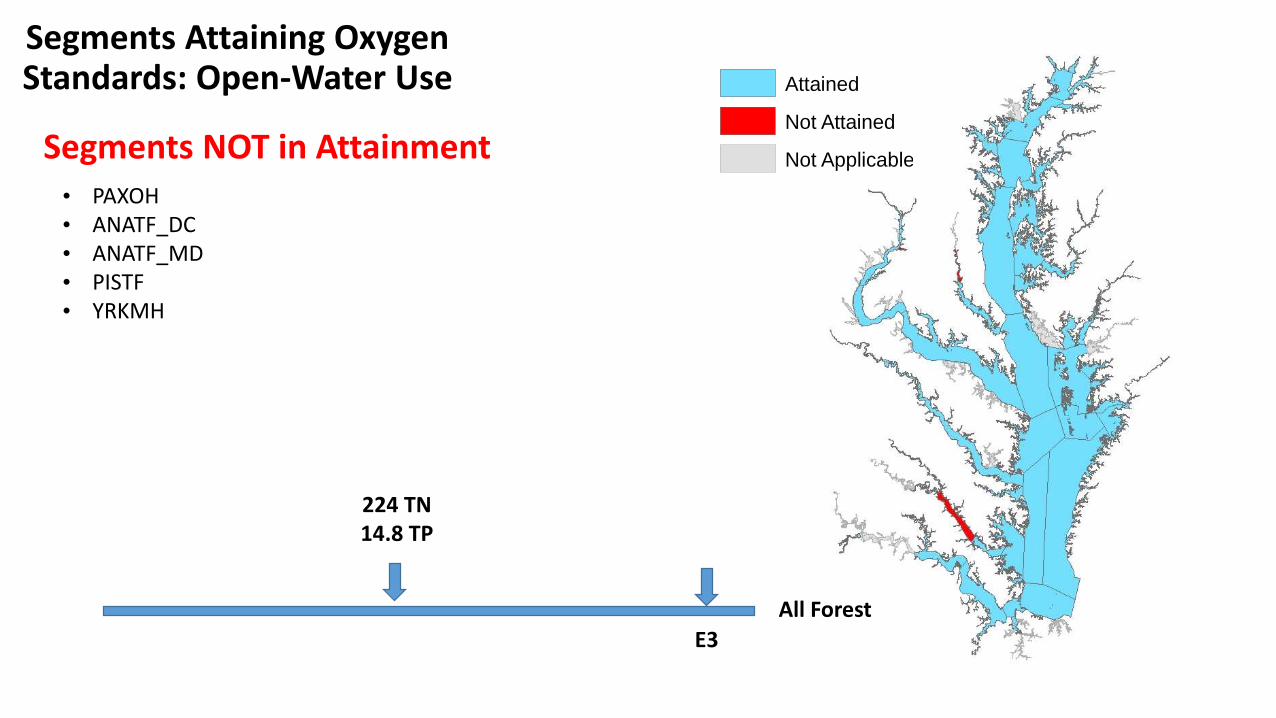
224 TN 14.8 TP
E3
All Forest
• PAXOH• ANATF_DC• ANATF_MD• PISTF• YRKMH
Segments NOT in Attainment

Attained
Not Attained
Not Applicable
Segments Attaining Oxygen Standards: Open-Water Use
205 TN 14.0 TP
E3All Forest
• ANATF_MD• YRKMH
Segments NOT in Attainment
Attained
Not Attained
Not Applicable
Segments Attaining Oxygen Standards: Open-Water Use
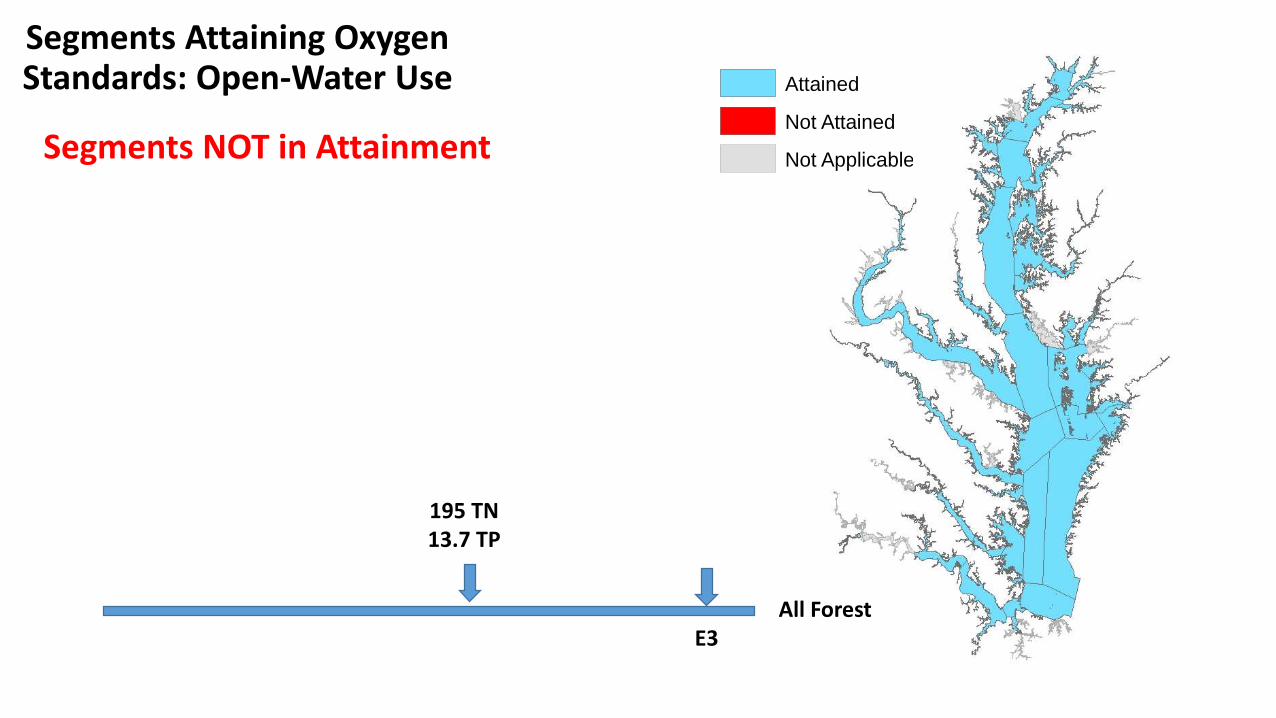
195 TN 13.7 TP
E3All Forest
Segments NOT in Attainment
Attained
Not Attained
Not Applicable
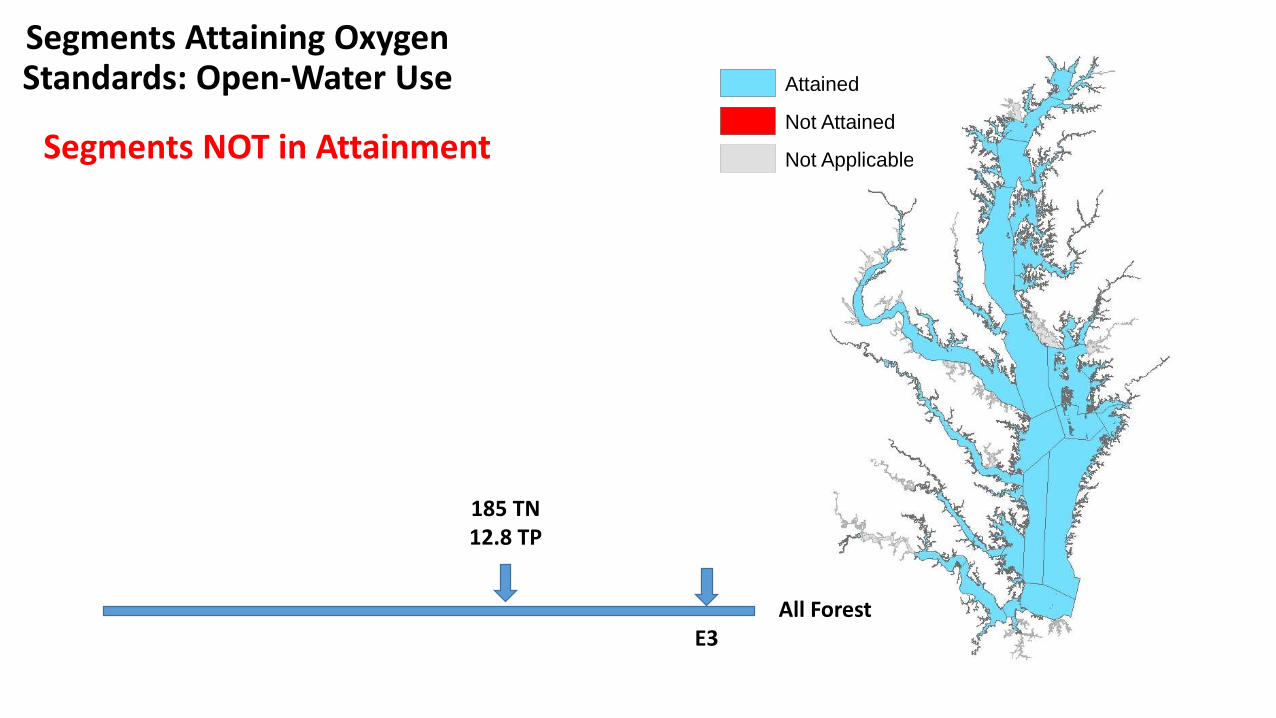
Segments Attaining Oxygen Standards: Open-Water Use
185 TN 12.8 TP
E3All Forest
Segments NOT in Attainment
Attained
Not Attained
Not Applicable
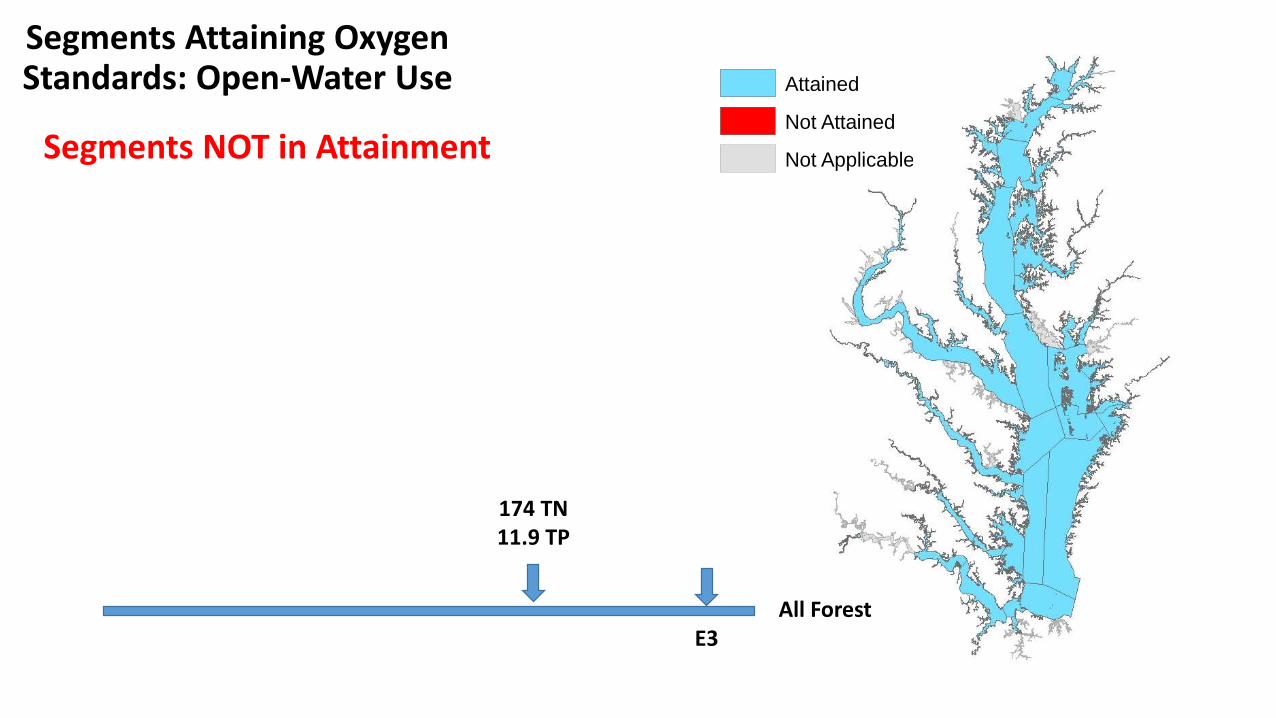
Segments Attaining Oxygen Standards: Open-Water Use
174 TN 11.9 TP
E3All Forest
Segments NOT in Attainment

Attained
Not Attained
Not Applicable
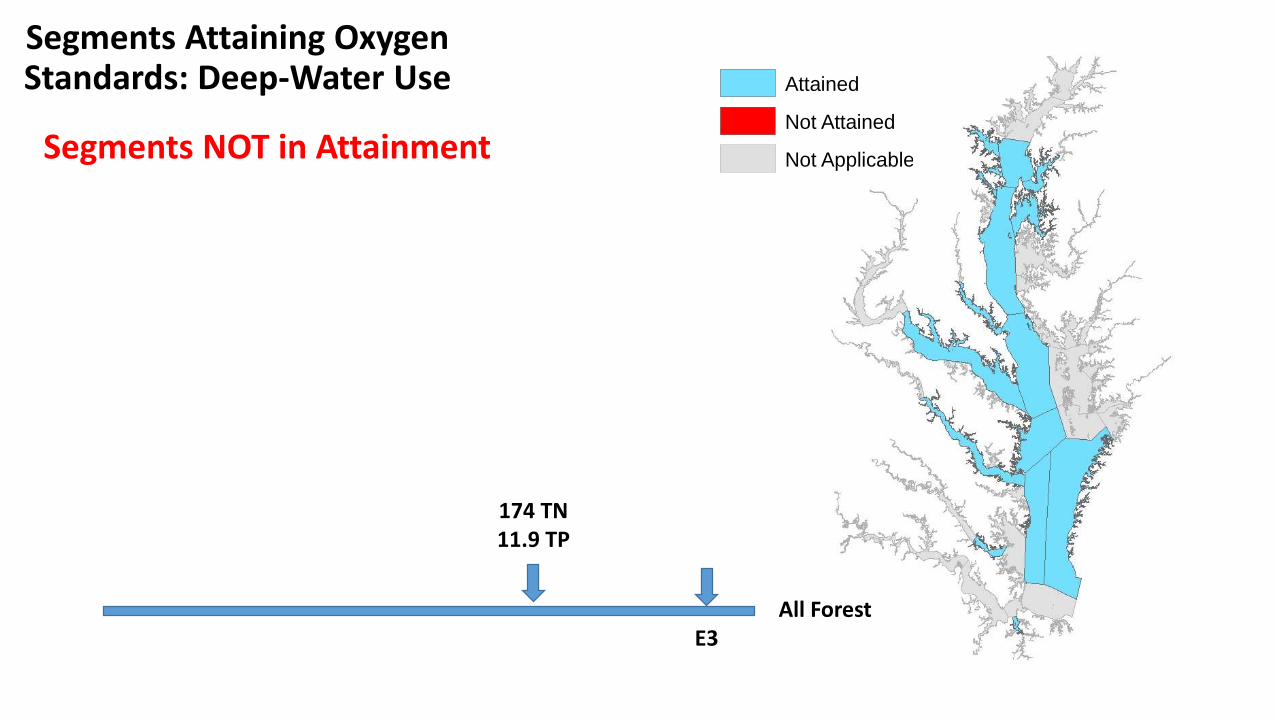
Segments Attaining Oxygen Standards: Open-Water Use
133 TN 8.6 TP
E3All Forest
Segments NOT in Attainment
Attained
Not Attained
Not Applicable
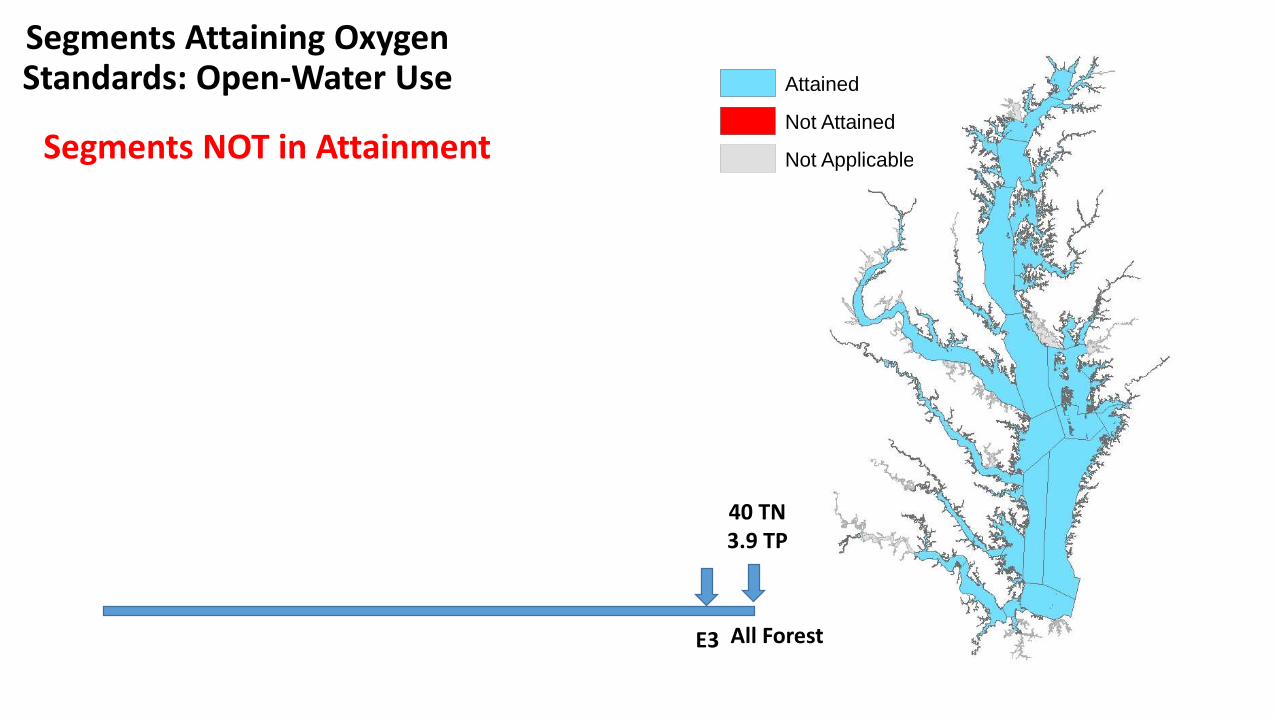
Segments Attaining Oxygen Standards: Open-Water Use
All Forest
40 TN 3.9 TP
E3
Segments NOT in Attainment

Segments Attaining Oxygen Standards: Open-Water Use

Attained
Not Attained
Not Applicable
Segments Attaining Oxygen Standards: Deep-Water Use
No Action
404 TN 41.7 TP
E3All Forest
• CB3MH• CB4MH• CB5MH_MD• PATMH• MAGMH• SEVMH• PAXMH• POTMH• RPPMH• CHSMH• EASMH
Segments NOT in Attainment
Attained
Not Attained
Not Applicable
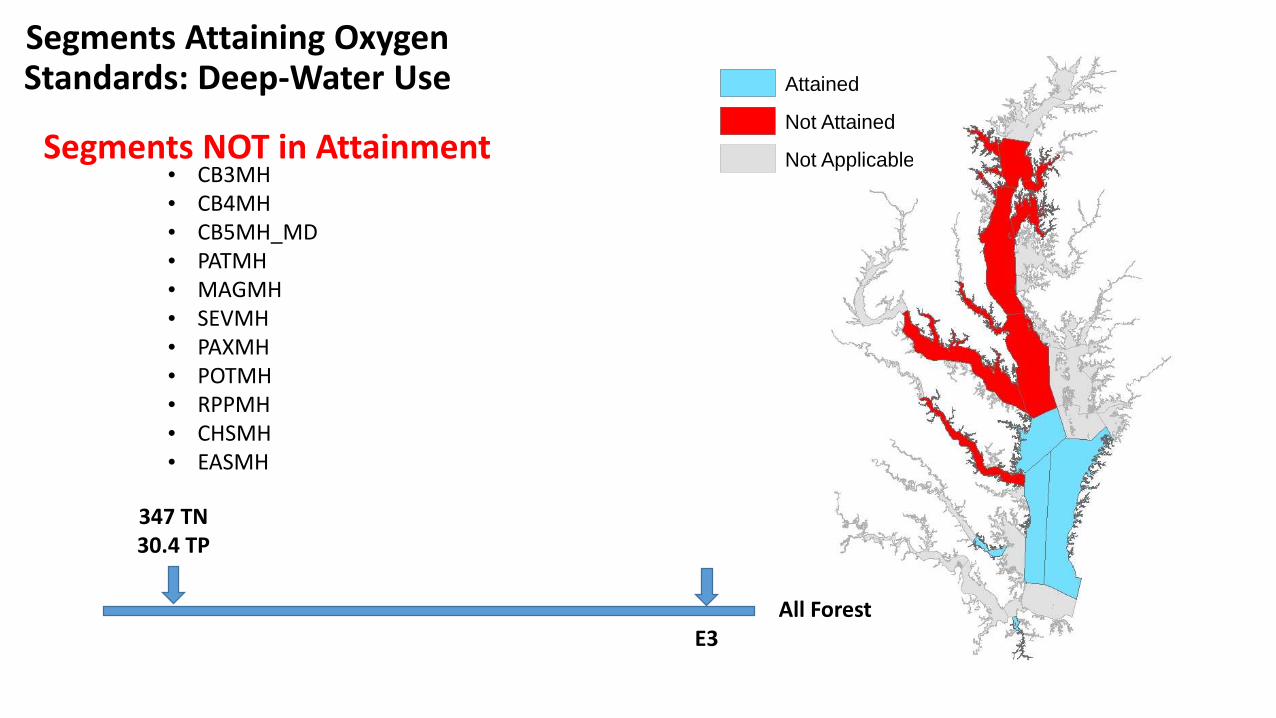
Segments Attaining Oxygen Standards: Deep-Water Use
347 TN 30.4 TP
E3All Forest
• CB3MH• CB4MH• CB5MH_MD• PATMH• MAGMH• SEVMH• PAXMH• POTMH• RPPMH• CHSMH• EASMH
Segments NOT in Attainment

Attained
Not Attained
Not Applicable
Segments Attaining Oxygen Standards: Deep-Water Use
E3
All Forest
• CB3MH• CB4MH• CB5MH_MD• PATMH• MAGMH• SEVMH• PAXMH• POTMH• RPPMH• CHSMH• EASMH
Segments NOT in Attainment
338 TN 27.7 TP

Attained
Not Attained
Not Applicable
Segments Attaining Oxygen Standards: Deep-Water Use
337 TN23.7 TP
E3All Forest
• CB4MH• CB5MH_MD• PATMH• MAGMH• SEVMH• PAXMH• POTMH• RPPMH• CHSMH• EASMH
Segments NOT in Attainment

Attained
Not Attained
Not Applicable
Segments Attaining Oxygen Standards: Deep-Water Use
317 TN 21.9 TP
E3
All Forest
• CB4MH• CB5MH_MD• PATMH• MAGMH• PAXMH• POTMH• RPPMH• CHSMH
Segments NOT in Attainment

Attained
Not Attained
Not Applicable
Segments Attaining Oxygen Standards: Deep-Water Use
E3All Forest
Segments NOT in Attainment
317 TN 21.9 TP
• CB4MH• CB5MH_MD• MAGMH• RPPMH

Attained
Not Attained
Not Applicable
Segments Attaining Oxygen Standards: Deep-Water Use
253 TN 15.9 TP
E3All Forest
• CB4MH• CB5MH_MD• MAGMH• RPPMH
Segments NOT in Attainment

Attained
Not Attained
Not Applicable
Segments Attaining Oxygen Standards: Deep-Water Use
224 TN 14.8 TP
E3All Forest
• CB5MH_MD• MAGMH
Segments NOT in Attainment

Attained
Not Attained
Not Applicable
Segments Attaining Oxygen Standards: Deep-Water Use
205 TN 14.0 TP
E3All Forest
• MAGMH
Segments NOT in Attainment

Attained
Not Attained
Not Applicable
Segments Attaining Oxygen Standards: Deep-Water Use
195 TN 13.7 TP
E3All Forest
Segments NOT in Attainment

Attained
Not Attained
Not Applicable
Segments Attaining Oxygen Standards: Deep-Water Use
185 TN 12.8 TP
E3All Forest
Segments NOT in Attainment
Attained
Not Attained
Not Applicable
Segments Attaining Oxygen Standards: Deep-Water Use
174 TN 11.9 TP
E3All Forest
Segments NOT in Attainment

Attained
Not Attained
Not Applicable
Segments Attaining Oxygen Standards: Deep-Water Use
E3All Forest
133 TN 8.6 TP
Segments NOT in Attainment

Attained
Not Attained
Not Applicable
Segments Attaining Oxygen Standards: Deep-Water Use
AllForest
40 TN 3.9 TP
E3
Segments NOT in Attainment

Segments Attaining Oxygen Standards: Deep-Water Use
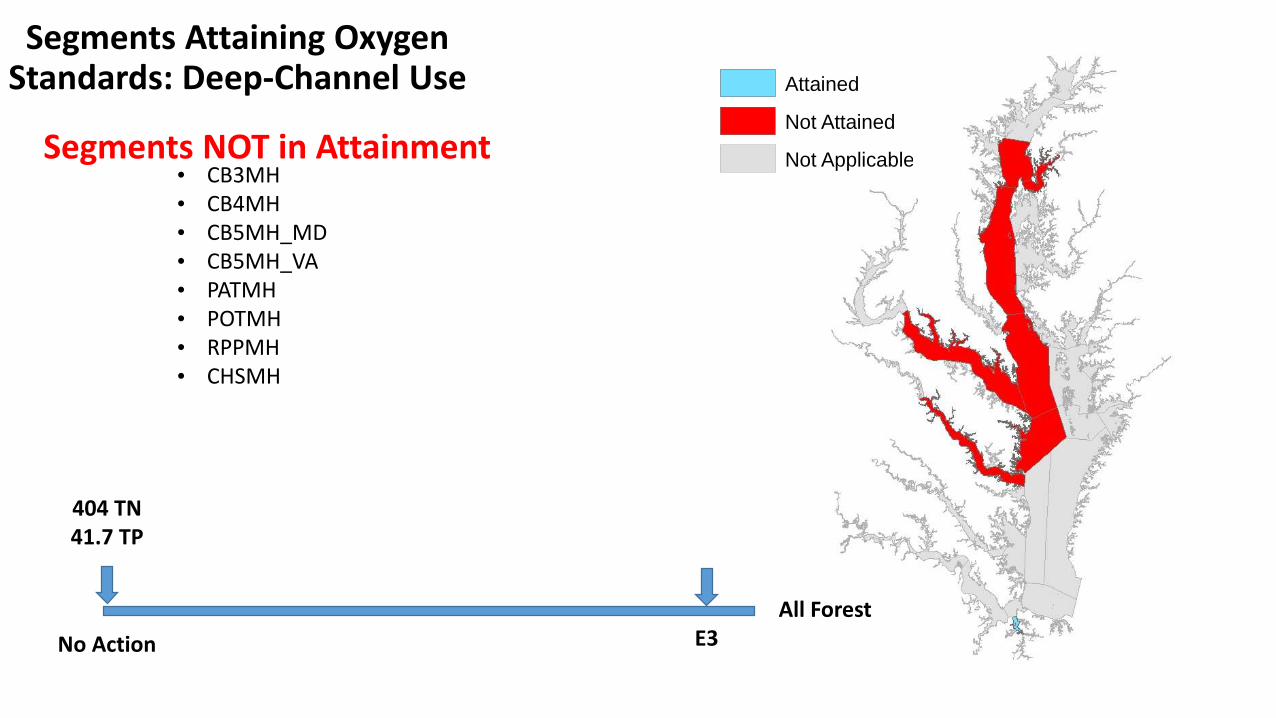
Segments Attaining Oxygen Standards: Deep-Channel Use
No Action
404 TN 41.7 TP
Count: X of YY
Attained
Not Attained
Not Applicable• CB3MH• CB4MH• CB5MH_MD• CB5MH_VA• PATMH• POTMH• RPPMH• CHSMH
E3All Forest
Segments NOT in Attainment

Segments Attaining Oxygen Standards: Deep-Channel Use
347 TN 30.4 TP
Count: X of YY
Attained
Not Attained
Not Applicable• CB3MH• CB4MH• CB5MH_MD• CB5MH_VA• PATMH• POTMH• RPPMH• CHSMH
E3All Forest
Segments NOT in Attainment

Segments Attaining Oxygen Standards: Deep-Channel Use
Count: X of YY
Attained
Not Attained
Not Applicable• CB3MH• CB4MH• CB5MH_MD• CB5MH_VA• PATMH• POTMH• RPPMH• CHSMH
E3All Forest
Segments NOT in Attainment
338 TN 27.7 TP

Segments Attaining Oxygen Standards: Deep-Channel Use
Count: X of YY
Attained
Not Attained
Not Applicable
337 TN23.7 TP
• CB3MH• CB4MH• CB5MH_MD• CB5MH_VA• POTMH• RPPMH• CHSMH
E3All Forest
Segments NOT in Attainment

Segments Attaining Oxygen Standards: Deep-Channel Use
317 TN 21.9 TP
Count: X of YY
Attained
Not Attained
Not Applicable
E3All Forest
Segments NOT in Attainment• CB3MH• CB4MH• CB5MH_MD• CHSMH• POTMH• RPPMH

Attained
Not Attained
Not Applicable
Segments Attaining Oxygen Standards: Deep-Channel Use
253 TN 15.9 TP
E3All Forest
• CB4MH• CB5MH_MD
Segments NOT in Attainment

Segments Attaining Oxygen Standards: Deep-Channel Use
224 TN 14.8 TP
Count: X of YY
Attained
Not Attained
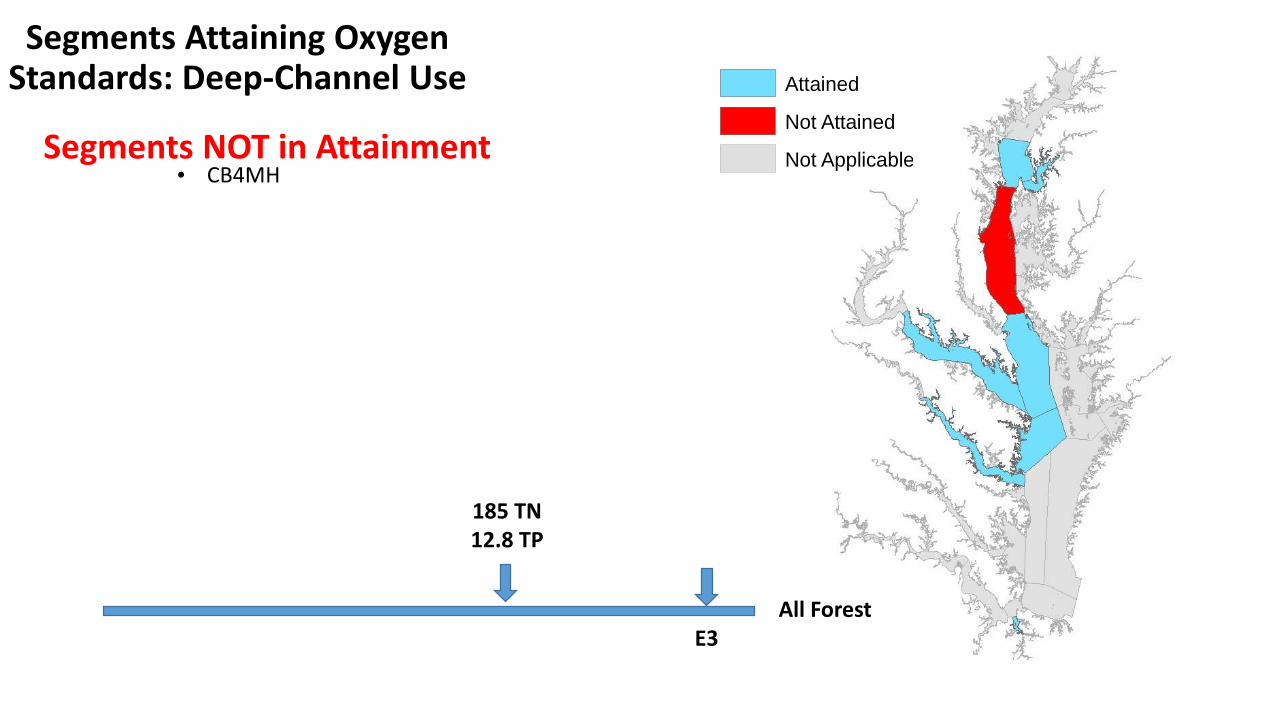
Not Applicable• CB4MH
E3All Forest
Segments NOT in Attainment

Segments Attaining Oxygen Standards: Deep-Channel Use
205 TN 14.0 TP
Count: X of YY
Attained
Not Attained
Not Applicable• CB4MH
E3All Forest
Segments NOT in Attainment

Segments Attaining Oxygen Standards: Deep-Channel Use
195 TN 13.7 TP
Count: X of YY
Attained
Not Attained
Not Applicable• CB4MH
E3All Forest
Segments NOT in Attainment
Segments Attaining Oxygen Standards: Deep-Channel Use
185 TN 12.8 TP
Count: X of YY
Attained
Not Attained
Not Applicable• CB4MH
E3All Forest
Segments NOT in Attainment

Segments Attaining Oxygen Standards: Deep-Channel Use
174 TN 11.9 TP
Attained
Not Attained
Not Applicable
E3All Forest
Segments NOT in Attainment

Segments Attaining Oxygen Standards: Deep-Channel Use Attained
Not Attained
Not Applicable
133 TN 8.6 TP
E3All Forest
Segments NOT in Attainment

Segments Attaining Oxygen Standards: Deep-Channel Use Attained
Not Attained
Not Applicable
AllForest
40 TN 3.9 TP
E3
Segments NOT in Attainment

Segments Attaining Oxygen Standards: Deep-Channel Use

Determining the Bay’s Ability to Absorb Pollutants

Rationale for Pollutant Loads Bay Can Absorb
• Clear monitoring-based evidence of reductions on volumes of low/no oxygen in deeper waters observed in Bay and tidal tributaries
• At 195 million lbs. nitrogen and 13.7 million lbs. phosphorus, we reach:• Loading levels where all segments’ designated uses, except CB4 deep-
channel, come into attainment
• Point of diminishing returns for the increased level of reductions approaching E3
85

Diminishing Return for Additional Reductions
Scoping Scenarios to explore water quality attainment at loads around 195N and 13.7P
+10M lbs TN
+19M lbs TN
- 9M lbs TN
-21M lbs TN

Proposed Path Forward
• Support Maryland updating their water quality standards regulations’ existing restoration variances
• Change CB4 deep-channel from 2 percent to 6 percent
• Change CB4 deep-water from 7 percent to 5 percent
• No change to the Eastern Bay restoration variance of 2 percent
• Remove the lower Chester River deep-channel restoration variance of 16 percent
• Remove the Patapsco River deep-water restoration variance of 7 percent
87

Proposed Path Forward
• Agreement to a common set of Partnership communication messages
• Reflects application of an additional decade of new data and scientific understanding along with improved models
• Approach followed is fully consistent with approach taken during development of the 2010 Bay TMDL
• Fully consistent with Maryland’s existing water quality standards regulations requirement for regular check-ins and modifications based on new data or assumptions incorporated into the Partnership’s Chesapeake Bay water quality model
88
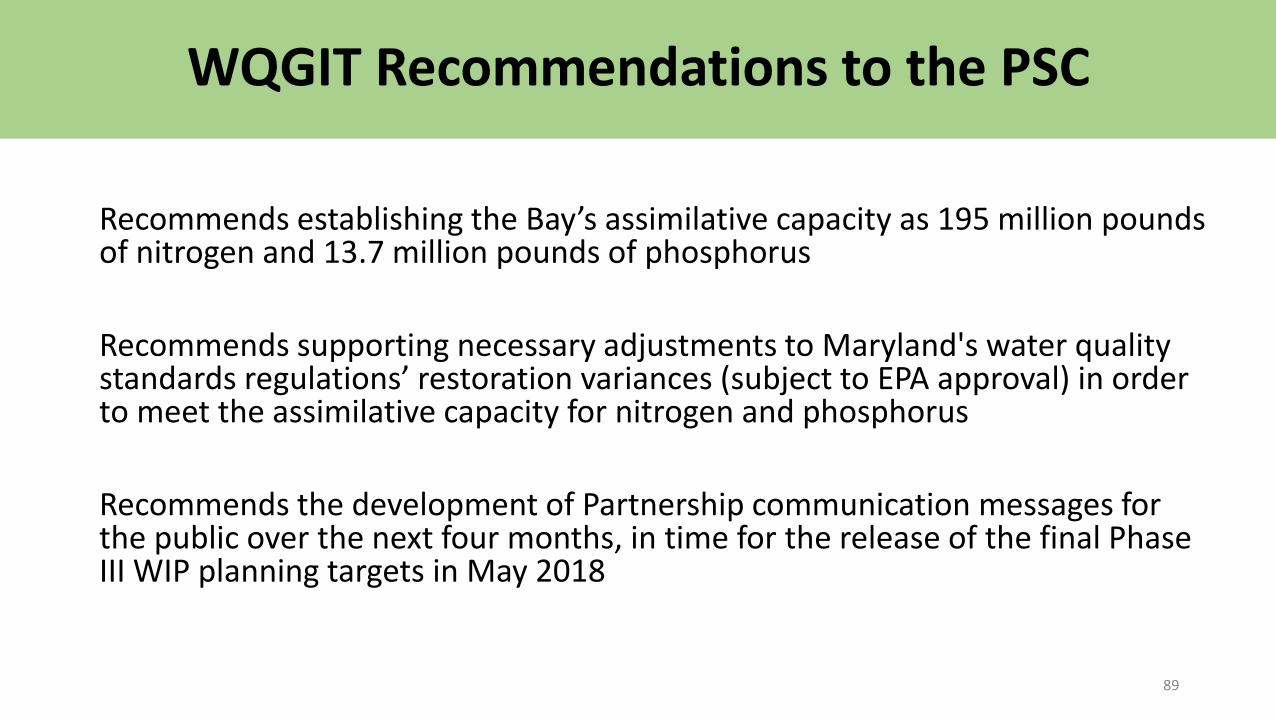
WQGIT Recommendations to the PSC
Recommends establishing the Bay’s assimilative capacity as 195 million pounds of nitrogen and 13.7 million pounds of phosphorus
Recommends supporting necessary adjustments to Maryland's water quality standards regulations’ restoration variances (subject to EPA approval) in order to meet the assimilative capacity for nitrogen and phosphorus
Recommends the development of Partnership communication messages for the public over the next four months, in time for the release of the final Phase III WIP planning targets in May 2018
89

Today’s Requested Policy Decisions
Approval of the Bay’s assimilative capacity as 195 million pounds of nitrogen and 13.7 million pounds of phosphorus
Support the necessary adjustments to Maryland’s restoration variances
Approval for the development of the Partnership’s public communication messages
90

Proposed Draft Phase III Planning Targets
Gary Shenk, USGS, CBP Phase 6 Watershed Model Coordinator
91

We Have All the Needed Components
Agreed-to methodology
No Action scenario
E3 scenario
Watershed and estuarine relative effectiveness
Assimilative capacity of the Bay
Accounting for projected atmospheric deposition load reductions
92

Deriving the Draft Phase III Planning Targets: Nitrogen
93

Deriving the Draft Phase III Planning Targets: Phosphorus
94
Jurisdiction1985
Baseline 2013
ProgressGrowth in Load
to 2025Phase III
Planning Target
NY 18.71 15.44 10.59
PA 122.41 99.28 73.18
MD 83.56 55.89 45.30
WV 8.73 8.06 6.35
DC 6.48 1.75 2.43
DE 6.97 6.59 4.59
VA 84.29 61.53 55.82
Basinwide 331.15 248.54 198.25
Proposed Draft Phase III Planning Targets: Nitrogen
*Units: millions of pounds

JurisdictionSpecial Cases With Special
CasesPhase III
Planning Target
NY 1.00 11.59 10.59
PA -0.58 72.60 73.18
MD -0.31 44.99 45.30
WV -0.03 6.31 6.35
DC 0.00 2.42 2.43
DE -0.06 4.53 4.59
VA -0.24 55.58 55.82
Basinwide -0.22 198.03 198.25
Proposed Draft Phase III Planning Targets with Special Cases: Nitrogen
*Units: millions of pounds

Jurisdiction 1985 Baseline
2013 Progress
Growth in Load to 2025
Phase III Planning Target
NY 1.198 0.710 0.506
PA 6.115 3.696 3.073
MD 7.419 3.919 3.604
WV 0.793 0.560 0.456
DC 0.090 0.062 0.130
DE 0.225 0.115 0.120
VA 13.545 6.345 6.186
Basinwide 29.384 15.408 14.073
Proposed Draft Phase III Planning Targets: Phosphorus
*Units: millions of pounds

JurisdictionSpecial Cases With Special
CasesPhase III
Planning Target
NY 0.100 0.606 0.506
PA -0.102 2.971 3.073
MD -0.083 3.521 3.604
WV 0.200 0.656 0.456
DC -0.001 0.129 0.130
DE -0.004 0.115 0.120
VA -0.133 6.053 6.186
Basinwide -0.023 14.05 14.073
Proposed Draft Phase III Planning Targets with Special Cases: Phosphorus
*Units: millions of pounds

99

100

Jurisdiction-Specific Proposed Draft Phase III WIP Planning
TargetsTeresa Koon, WV DEP CBP Water Quality Goal
Implementation Team Vice Chairand
WQGIT Jurisdictional Representations101

Draft Phase III Planning Targets
WQGIT jurisdictional representatives will present their respective profiles to the PSC
Day Two Requested Policy Decision
Approval of draft Phase III Planning Targets as the starting point for the Partnership’s 4-month review process
103

Proposed Process and Schedule for 4-Month
Review PeriodLucinda Power, U.S. EPA, CBP Water Quality Goal
Implementation Team Coordinator
104

PSC Approved Schedule
• December 19-20, 2017: PSC 2-day retreat and decision making
• December 22, 2017: Release of draft Phase III WIP planning targets
• December 22, 2017 – April 20, 2018: Partnership’s review of the draft Phase III WIP planning targets, including consideration of special case requests
• Late April/Early May 2018: PSC approval of the final Phase III WIP planning targets with any agreed-to special cases
• May 7, 2018: Release of the final Phase III WIP planning targets
105

During the 4-Month Review Period
• Analyze level of effort to achieve the draft planning targets
• Evaluate effects of accounting for growth, Conowingo infill, and climate change on level of effort
• Assess the need for exchanges of nitrogen and/or phosphorus loads between a jurisdiction’s major river basins
• Assess the need for exchanges of nitrogen for phosphorus or phosphorus for nitrogen within a jurisdiction’s major river basins
• Determine if any special cases are needed
106

Further Analyses for Consideration
Testing out preliminary development of measurable, local planning goals below the major state-basin level
107

Apply the results of the geographic isolation runs to help inform implementation planning and targeting
108
Further Analyses for Consideration

Further Analyses for Consideration
109
45%
11%
28%
1%15%
Agriculture Urban Runoff Wastewater+CSO Forest+
51%
8%
18%
2%
21%
39%
12%17%
3%
29%
1985 2015
Where did the Nitrogen reductions
come from?
Evaluate potential changes needed to a jurisdiction’s Phase I and Phase II WIP source sector goals
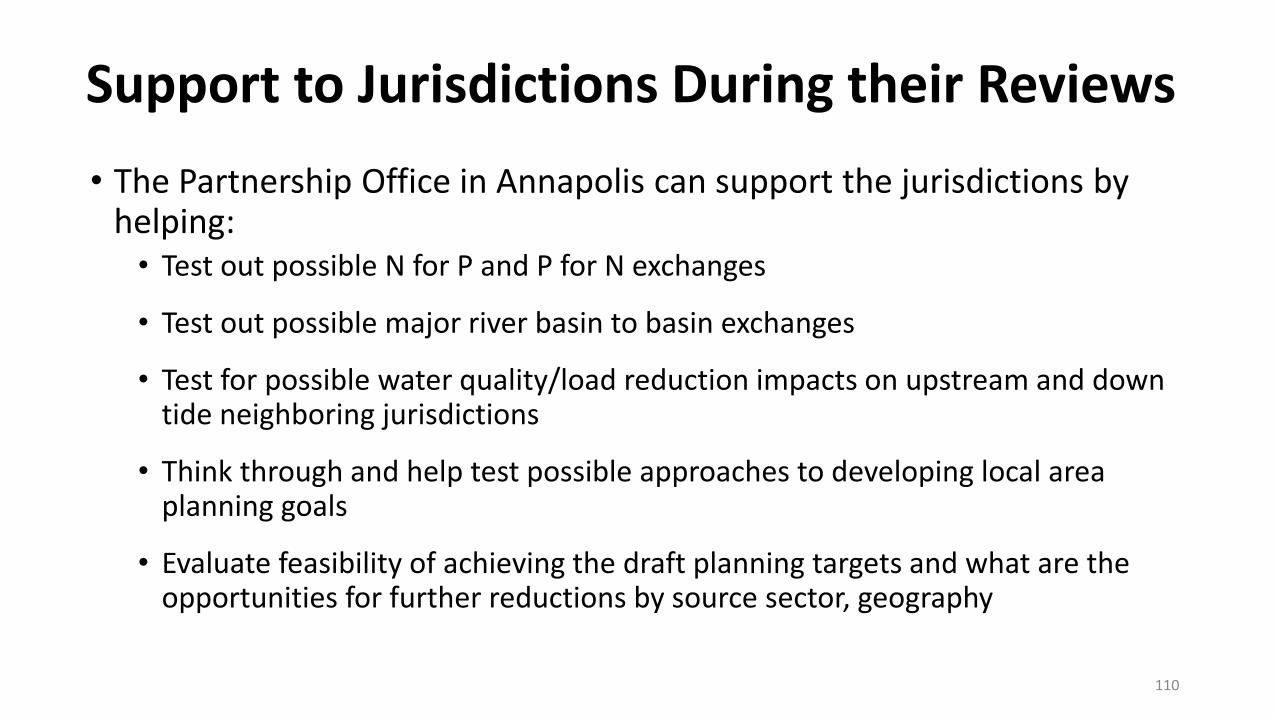
Support to Jurisdictions During their Reviews
• The Partnership Office in Annapolis can support the jurisdictions by helping:• Test out possible N for P and P for N exchanges
• Test out possible major river basin to basin exchanges
• Test for possible water quality/load reduction impacts on upstream and down tide neighboring jurisdictions
• Think through and help test possible approaches to developing local area planning goals
• Evaluate feasibility of achieving the draft planning targets and what are the opportunities for further reductions by source sector, geography
110

Possible Changes Between Now and April 2018
• Requests for special conditions
• Conducting basin to basin exchanges of N, P, and sediment loads
• Conducting significant N for P and P for N exchanges
111

What are Special Cases?
Special cases are requests by the jurisdictions for any:
1) Changes to their draft Phase III WIP planning targets
2) Changes to the methodology used to establish the draft Phase III WIP planning targets
112

Who Can Submit a Special Case Request?
• Any one of the seven Bay watershed jurisdictions to the CBP Water Quality Goal Implementation Team (WQGIT) Chair and the CBP WQGIT Coordinator
113

Notification of Special Case Requests
March 16, 2018
Final deadline for submitting the special case request(s), along with the justification and nutrient and basin exchanges that have multi-jurisdictional impacts, to the Partnership for consideration
114

Process for Addressing Special Cases
1. CBPO staff will work with the jurisdictions to address and identify potential resolutions for special cases during the 4-month review period
2. For transparency, updates will be provided to the WQGIT during each conference call during the 4-month review period communicating:
• Who has submitted special case requests
• Proposed options for resolving the special case request(s)
3. PSC will approve any special case requests submitted to the Partnership for review and consideration
115
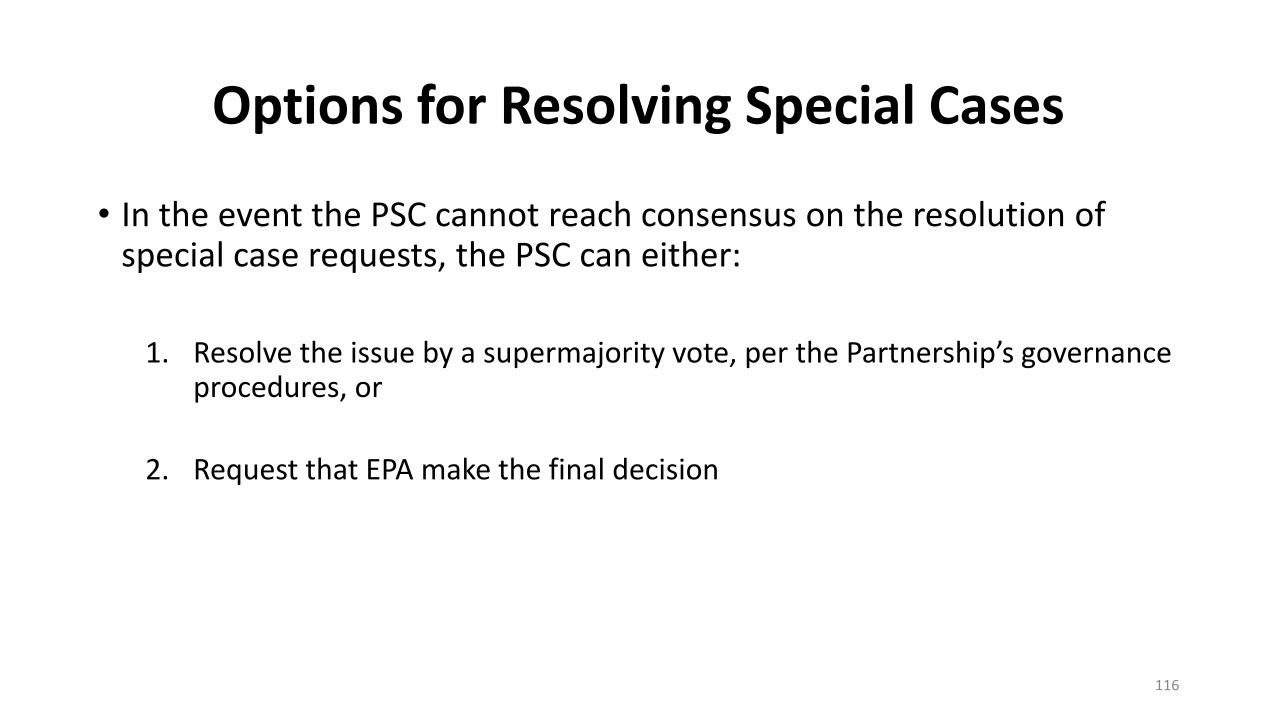
Options for Resolving Special Cases
• In the event the PSC cannot reach consensus on the resolution of special case requests, the PSC can either:
1. Resolve the issue by a supermajority vote, per the Partnership’s governance procedures, or
2. Request that EPA make the final decision
116

Today’s Requested Policy Decision
Approval of proposed process for the Partnership’s 4-month review of the draft Phase III WIP planning targets, including addressing special case requests
117

Accounting for Growth in the Jurisdictions’
Phase III WIPsKarl Berger, MWCOG, CBP Land Use Workgroup Chair
andPeter Claggett, USGS, CBP Land Use Workgroup
Coordinator
118

Accounting for Growth Equitably Across Jurisdictions
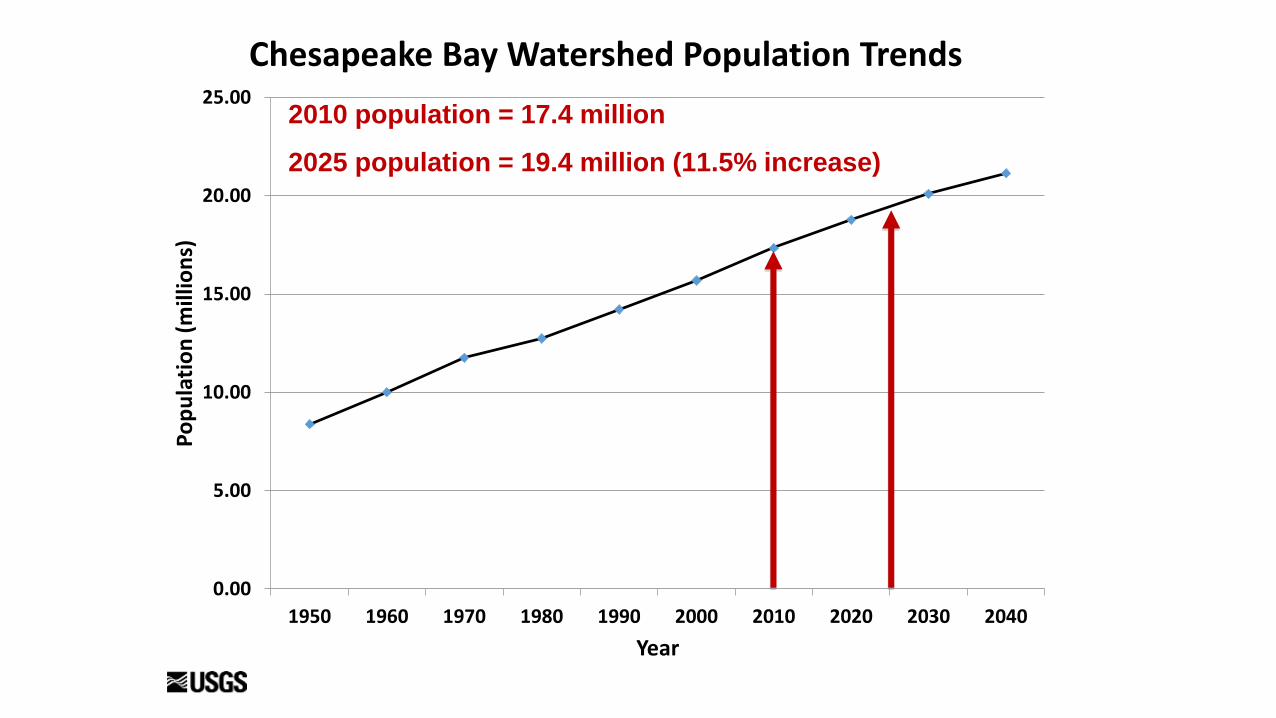
1. Watershed population is increasing by over 1 million persons/decade• Population change from 2010 -2025 = 2.0 million persons
2. Chesapeake Bay Land Change Model (CBLCM) estimates land use and wastewater impacts of future population growth. • Parameterized uniquely for every state/county/city in the Bay watershed.• Accounts for uncertainty at sub-county scales.
3. Partnership agreement on future land use scenarios reflecting a range of planning and conservation efforts.
4. Developing the WIPs on 2025 land use conditions enable the use of planning and conservation efforts to help “account for growth” for the TMDL.
119

Why Account for Growth?
120
2025 growth projection
Load reductions necessary to meet the 2025 Phase III WIP Planning Target (lock box)
0.00
5.00
10.00
15.00
20.00
25.00
1950 1960 1970 1980 1990 2000 2010 2020 2030 2040
Po
pu
lati
on
(m
illio
ns)
Year
Chesapeake Bay Watershed Population Trends
2010 population = 17.4 million
2025 population = 19.4 million (11.5% increase)

-100% -80% -60% -40% -20% 0% 20% 40% 60% 80% 100%
DE
MD
NY
PA
VA
WV
CBW
Estimated % Change in Animal Units from 2013 through 2025
Total Poultry Cattle Swine Other

-10.0% -7.5% -5.0% -2.5% 0.0% 2.5% 5.0% 7.5% 10.0%
DC
DE
MD
NY
PA
VA
WV
CBW
Estimated % Change in Sector Acres by Sector from 2013 through 2025
Developed Natural Ag

Partnership’s Chesapeake Bay Land Change Model
124

125
Land Change Model Outputs
• Impervious surface and
turf grass expansion
• Forest conversion to
development
• Farmland conversion to
development
• Future population on
sewer and septicRural Residential57 acres227 households on sewer0.25 acre lots
27.8% Impervious 72.2% Turf grass
20-acres farmland loss37-acres forest loss

Future Growth Scenarios: 2025
Purpose:
To provide information to state and local partners to account for the effects of land use planning and conservation actions for reducing future pollutant loads in their Phase III WIPs and two-year milestones.
Current Zoning Scenario: 2025 Baseline for Phase III WIPs
• Continuation of historic trends constrained by existing local zoning
• Includes the best available regional and local data representing current conditions
126

Future Growth ScenariosConservation Plus Scenario: Package of Planning & Conservation “BMP’s”
• Protect 100-year floodplain and frequently-flooded soils• Protect riparian zones (35-ft, 100-ft, 300-ft)• Protect large forest tracts (250+ acres, 1000+ acres) or green infrastructure• Protect shoreline forests (all contiguous tracts 1000-ft from shoreline)• Adjusting demand script:
• Increase percent of infill/redevelopment (e.g., 5%, 10%, 15%)• Increase proportion of urban vs rural growth (e.g., 5%, 10%, 15%)
• Protect Agricultural Districts• Avoid growth on soils unsuitable for septic systems• Expand sewer service areas layer (e.g., 1-mile buffer, 2-mile buffer)• Avoid growth in areas subject to category 3 Hurricane storm surge• Protect highly productive farms, prime farmlands, farmland of state importance• Protect state-designated “Healthy watersheds”• Protect areas subject to marsh migration (e.g., upland buffer around tidal wetlands and
National Wildlife refuges)127
128
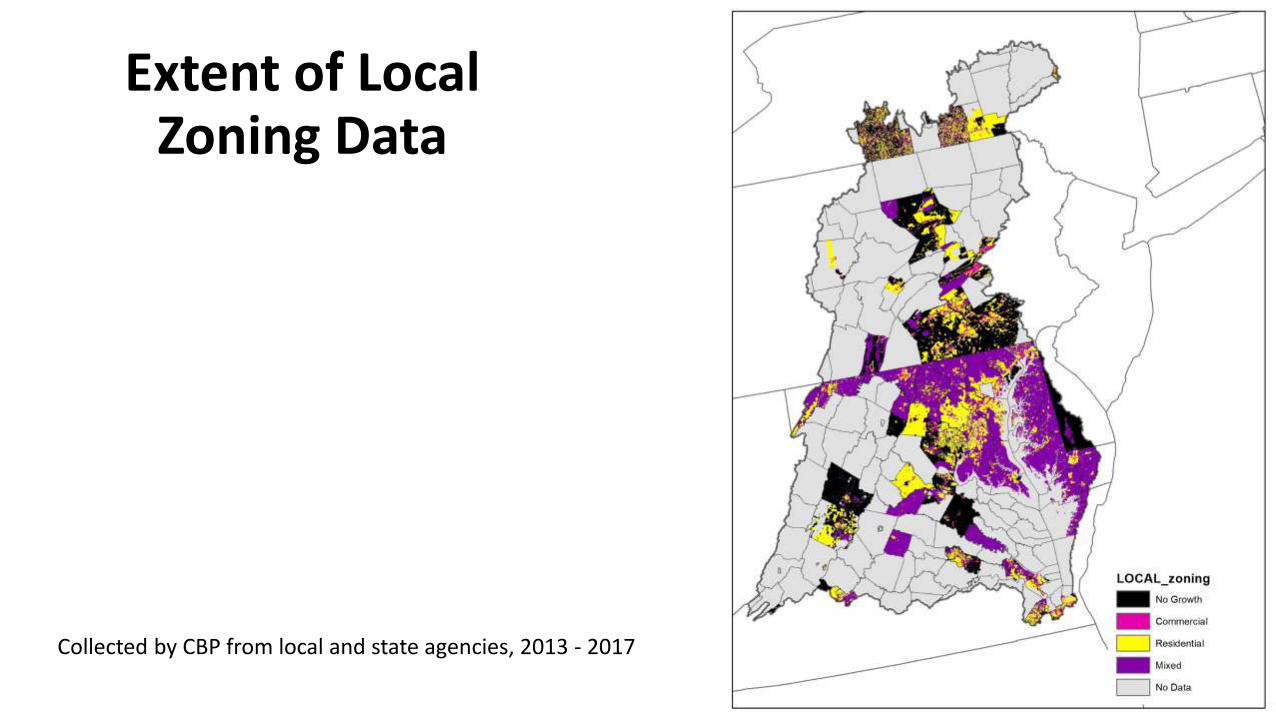
Extent of Local Zoning Data
Collected by CBP from local and state agencies, 2013 - 2017

Residential Infill/Redevelopment Commercial Infill/Redevelopment
Current ZoningScenario
Current ZoningScenario

130
Increase in Impervious Surfaces Increase in Turf Grass
Current ZoningScenario
Current ZoningScenario

Forest Conversion to Development
131
Current ZoningScenario

Growth on Sewer and Septic
132
Current ZoningScenario

Farmland Conversion to Development Farmland Conversion + Land Retirement
Current ZoningScenario
Current ZoningScenario

Jurisdiction1985
Baseline 2013
ProgressGrowth in Load
to 2025Phase III
Planning Target
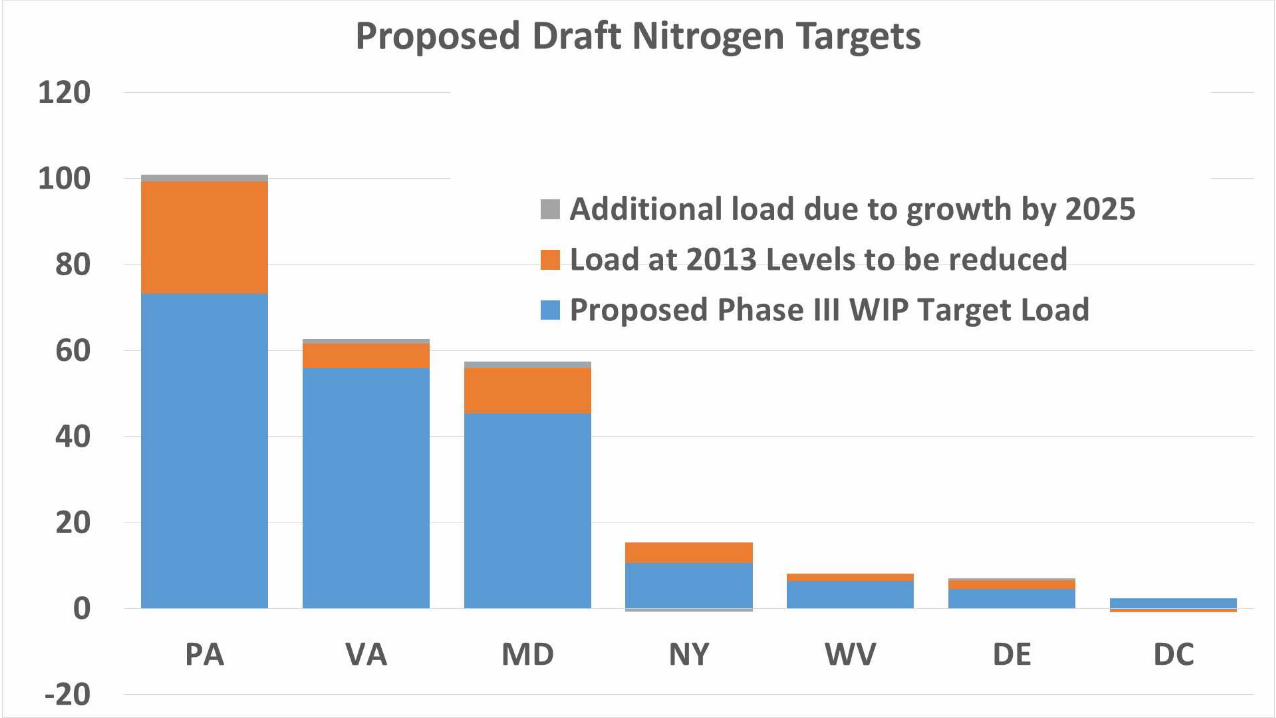
NY 18.71 15.44 -0.74 10.59
PA 122.41 99.28 1.66 73.18
MD 83.56 55.89 1.52 45.30
WV 8.73 8.06 -0.02 6.35
DC 6.48 1.75 0.00 2.43
DE 6.97 6.59 0.48 4.59
VA 84.29 61.53 1.09 55.82
Basinwide 331.15 248.54 4.00 198.25*Units: millions of pounds
WQGIT & Modeling Workgroup Recommendations: Nitrogen

Jurisdiction 1985 Baseline
2013 Progress
Growth in Load to 2025
Phase III Planning Target
NY 1.198 0.710 -0.005 0.506
PA 6.115 3.696 0.044 3.073
MD 7.419 3.919 -0.015 3.604
WV 0.793 0.560 -0.017 0.456
DC 0.090 0.062 0.000 0.130
DE 0.225 0.115 0.007 0.120
VA 13.545 6.345 0.140 6.186
Basinwide 29.384 15.408 0.154 14.073*Units: millions of pounds
WQGIT & Modeling Workgroup Recommendations: Phosphorus


WQGIT Recommendations to the PSC
138
• Use the Partnership’s Land Change Model to establish growth projections, with the opportunity for states (e.g., Maryland) to provide data or alternative modeling approaches in future years, which will be vetted through the Partnership approval process
• Use 2025 growth projections based on current zoning as base conditions for the Phase III WIPs
• Update the growth projections every 2 years with the best available data to inform the development of the two-year milestones

Today’s Requested Policy Decisions
Approval of the Water Quality Goal Implementation Team’s recommended use of 2025 projected conditions (based on the current zoning scenario) to account for growth in the development and implementation of the jurisdictions’ Phase III WIPs
139

Today’s Requested Policy Decisions
Approval of the Water Quality Goal Implementation Team’s proposed approach to continued Partnership accounting for growth into the future by:
• Updating the Partnership’s projection of future growth every two years
• Factoring these updated future projections into next round of the jurisdictions’ two-year milestones
• Factoring in future (every 4 years) updates to the Partnership’s high resolution land use/cover data across the entire watershed
• Ensuring local partner review of the future growth forecasts with each 2-year update
140

Conowingo Dam Infill: How Much, Who, How,
and By WhenLee Currey, MDE, CBP Modeling Workgroup Co-Chair
141

142
• Almost all of the nutrients are from upstream sources
• Much of the nutrients are biologically available to algae when they enter tidal waters
• Some of the nutrients are scoured from the bottom sediments behind the dam
• Much of these scoured nutrients are not biologically available to algae when they enter tidal waters
Estimated Loads to the Bay with ConowingoDam and Reservoir at Infill Conditions
Therefore, the determination of nutrient loads to be reduced to account for Conowingo infill must factor in the type of nutrients and the timing of delivery

Conowingo Effect on Loads at the WIP2 condition
1863
3217
0
1000
2000
3000
4000
5000
6000
7000
TSSX
Millions
ConowingoAverageAnnualSuspendedSolidsDelivery
2010WIP2(91-00)
2010WIP2DE(91-00)
3
54
12
69
3
54
25
82
0
20
40
60
80
100
120
140
160
NH3X NO23 ORGN TOTN
Millions
ConowingoAverageAnnualNitrogenDelivery
2010WIP2(91-00) 2010WIP2DE(91-00)
0.81.2 1.1
3.1
0.8
1.9 2.1
4.9
0.0
1.0
2.0
3.0
4.0
5.0
6.0
7.0
8.0
9.0
10.0
PO4X PIPX ORGP TOTP
Millions
ConowingoAverageAnnualPhosphorusDelivery
2010WIP2(91-00) 2010WIP2DE(91-00)

Estimated Loads to the Bay with Conowingo Dam and Reservoir at Infill Conditions
144
Additional Phosphorus Loads to be Addressed: 0.26 million pounds
Additional Nitrogen Loads to be Addressed: 6 million pounds

Who?
How?
When?
Original Options: How to Offset the Additional Loads Due to Conowingo Dam Infill
By 2025Post-2025 with agreed-upon date
Beyond 2025 –no future date identified
Allocation equity rules used in the Bay TMDL
Assign additional load as local planning goal
145
Who?
When?
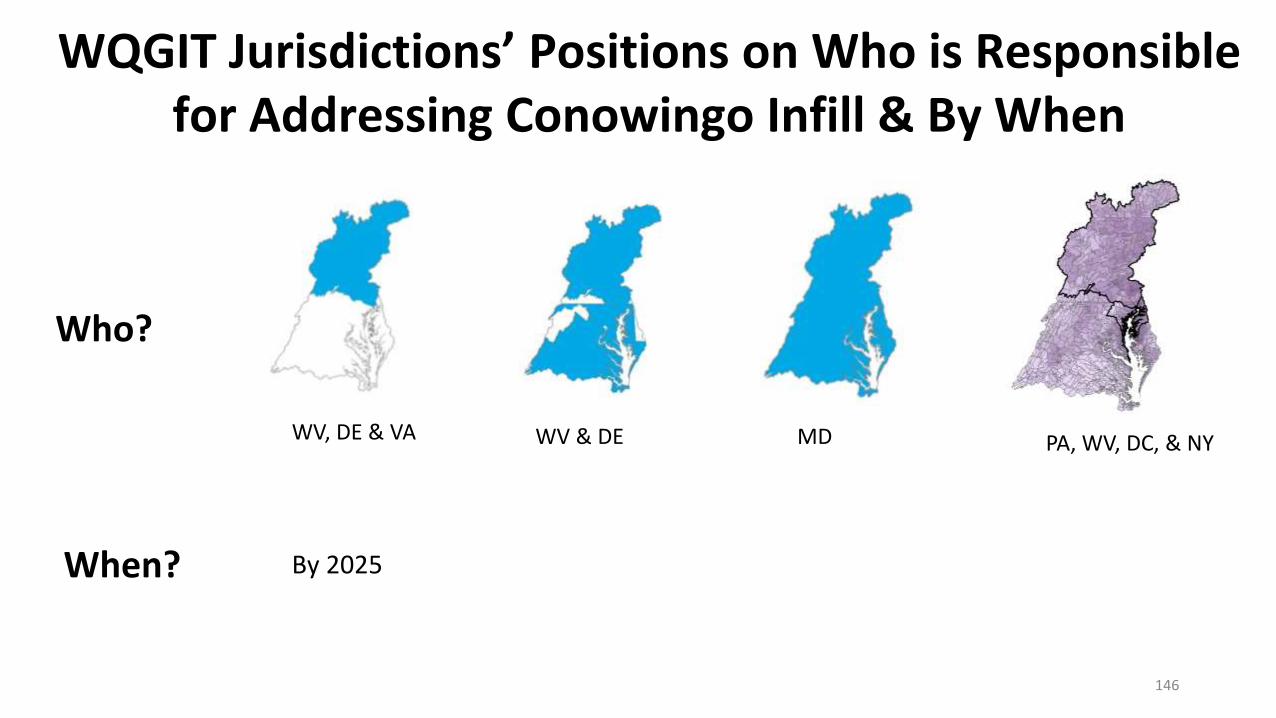
WQGIT Jurisdictions’ Positions on Who is Responsible for Addressing Conowingo Infill & By When
By 2025
146
WV, DE & VA WV & DE MD PA, WV, DC, & NY
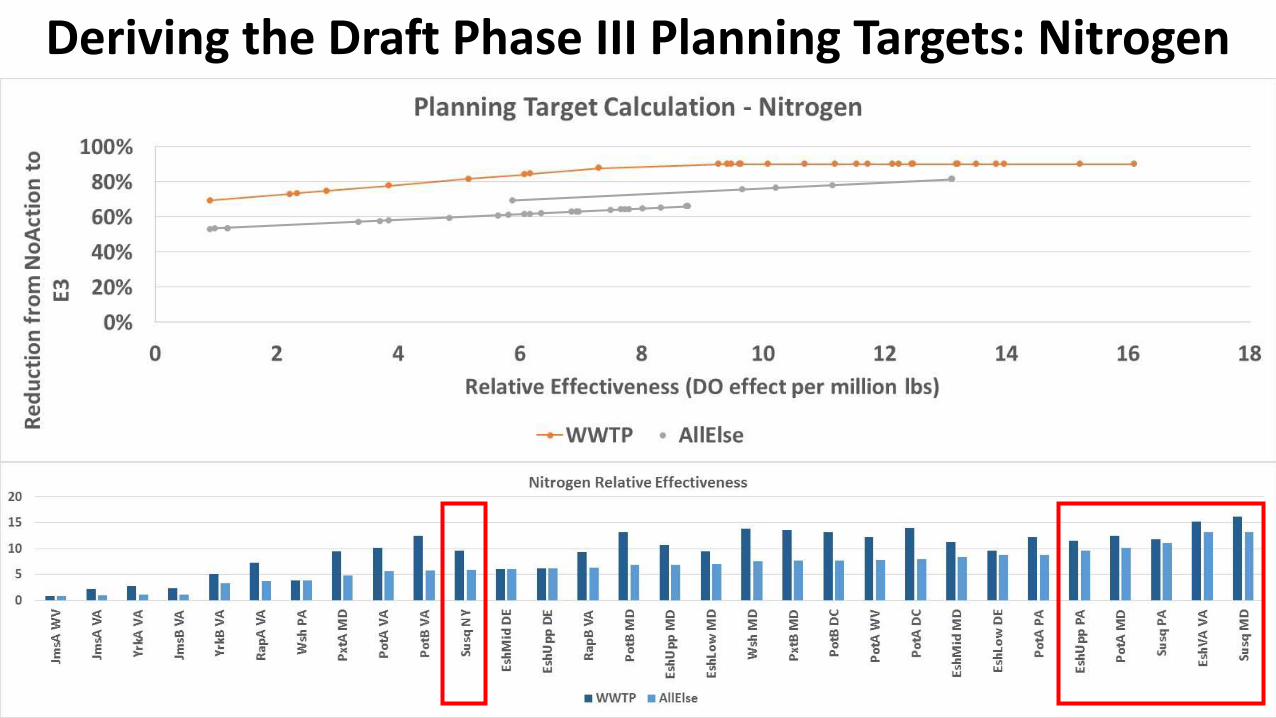
Deriving the Draft Phase III Planning Targets: Nitrogen
147

Deriving the Draft Phase III Planning Targets: Phosphorus
148

Relative Effectiveness with Conowingo in 1990s condition
Relative Effectiveness with Conowingo in current condition
Note changes in Susquehanna relative effectiveness only
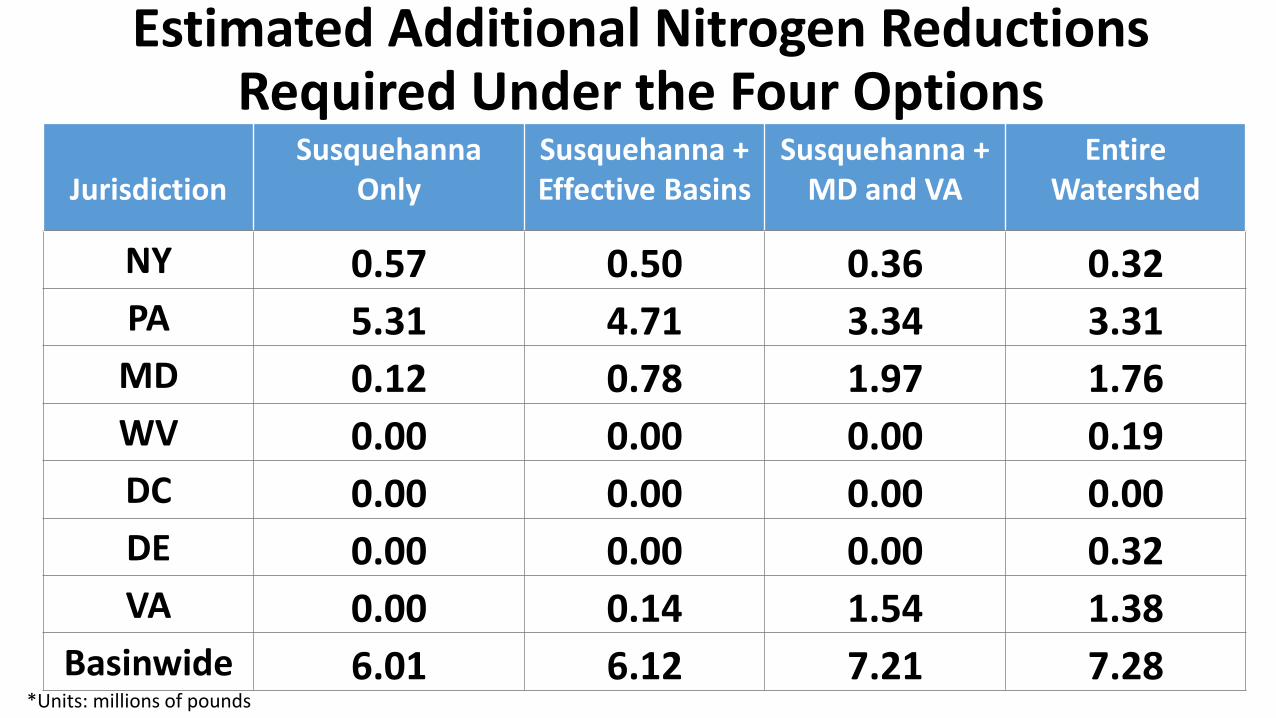
JurisdictionSusquehanna
Only Susquehanna + Effective Basins
Susquehanna + MD and VA
Entire Watershed
NY 0.57 0.50 0.36 0.32
PA 5.31 4.71 3.34 3.31
MD 0.12 0.78 1.97 1.76
WV 0.00 0.00 0.00 0.19
DC 0.00 0.00 0.00 0.00
DE 0.00 0.00 0.00 0.32
VA 0.00 0.14 1.54 1.38
Basinwide 6.01 6.12 7.21 7.28
Estimated Additional Nitrogen Reductions Required Under the Four Options
*Units: millions of pounds

JurisdictionSusquehanna
Only Susquehanna + Effective Basins
Susquehanna + MD and VA
Entire Watershed
NY 5.4% 4.7% 3.4% 3.0%
PA 7.3% 6.4% 4.6% 4.5%
MD 0.3% 1.7% 4.3% 3.9%
WV 0.0% 0.0% 0.0% 3.0%
DC 0.0% 0.0% 0.0% 0.2%
DE 0.0% 0.0% 0.0% 6.9%
VA 0.0% 0.2% 2.8% 2.5%
Estimated Additional Nitrogen Reductions Required Under the Four Options

JurisdictionSusquehanna
Only Susquehanna + Effective Basins
Susquehanna + MD and VA
Entire Watershed
NY 0.027 0.020 0.013 0.012
PA 0.230 0.176 0.109 0.115
MD 0.005 0.070 0.101 0.093
WV 0.000 0.000 0.000 0.013
DC 0.000 0.000 0.000 0.001
DE 0.000 0.000 0.000 0.005
VA 0.000 0.000 0.162 0.150
Basinwide 0.262 0.266 0.385 0.389
Estimated Additional Phosphorus Reductions Required Under the Four Options
*Units: millions of pounds

JurisdictionSusquehanna
Only Susquehanna + Effective Basins
Susquehanna + MD and VA
Entire Watershed
NY 5.3% 4.0% 2.5% 2.3%
PA 7.5% 5.7% 3.5% 3.7%
MD 0.1% 1.9% 2.8% 2.6%
WV 0.0% 0.0% 0.0% 2.9%
DC 0.0% 0.0% 0.0% 0.6%
DE 0.0% 0.0% 0.0% 4.1%
VA 0.0% 0.0% 2.6% 2.4%
Estimated Additional Phosphorus Reductions Required Under the Four Options

WQGIT Recommendations to the PSC
WQGIT-recommended approach recognizes that all jurisdictions have benefited from the Conowingo reservoir and its nutrient and sediment pollution trapping and that there is a less costly approach than assignment of allocations that achieves water quality objectives and does not require reductions by all jurisdictions
• Develop a separate implementation plan, which is a Partnership collaboration to address the additional reductions needed as a result of infill • Address impacts in a way that makes the most scientific and economic sense,
and supports those that can reduce pollution more effectively
154

WQGIT Recommendations to the PSC
WQGIT-recommended approach recognizes that all jurisdictions have benefited from the Conowingo reservoir and its nutrient and sediment pollution trapping and that there is a less costly approach than assignment of allocations that achieves water quality objectives and does not require reductions by all jurisdictions
• Create approach that pools resources • Pooled resources, which may include funding, technical assistance, advocacy,
intellectual property, etc., from all jurisdictions would be managed (both in terms of allocation of funds and verification / tracking of reductions) by a third party under Partnership oversight
• Pooling of resources and implementation would be phased in over time as appropriate
155

WQGIT Recommendations to the PSC
• Necessary steps to implement proposed approach • Reach Partnership consensus on the approach
• PSC to send letter to Exelon
• All jurisdictions and other partners develop the plan
• Determine the role of Exelon in plan implementation based on Maryland’s decisions regarding 401 certification
• Finalize plan and determine gaps and contingencies
• Begin plan implementation
156

WQGIT Recommendations to the PSC
• Necessary steps to implement proposed approach (Continued)• Evaluate, as is currently done with the milestones, the effectiveness and progress of the
plan on an annual basis
• Reevaluate the plan and make any necessary adjustments based on jurisdictional WIP implementation and any other factors that might influence plan success
• Need to develop timelines to develop and implement the plan (by 2025?) • Includes conducting a gap analysis to determine if the plan could be fully implemented
by 2025
• Conowingo Plan development likely to occur concurrently with Phase III WIP development
157
Day Two Requested Policy Decisions
Approval of the WQGIT-proposed approach to account for the additional nutrient loads delivered to the Bay due to the Conowingo infill
Approval of the timeframe by which the jurisdictions have to address the additional nutrient loads
158

Factoring in Climate Change into the
Jurisdictions’ Phase III WIPsMark Bennett, USGS, CBP Climate Resiliency
Workgroup Chair
159

PSC-Approved Guiding Principles Phase III WIP Development
• Capitalize on “Co-benefits” – maximize BMP selection to increase climate resiliency
• Account for and integrate planning and consideration of existing stressors – consider existing stressors in establishing reduction targets or BMP selection
• Align with existing climate resilient plans and strategies – document jurisdictions’ action plans and strategies to address climate change
• Manage for risk and plan for uncertainty – employ risk management and flexible implementation strategies to achieve and maintain water quality standards
• Engage Local Agencies and Leaders – work cooperatively with local partners to provide best available data on local impacts

PSC-Approved Guiding PrinciplesPhase III WIP Implementation
• Reduce vulnerability – use “Climate Smart” principles to site and design BMPs
• Build in flexibility and adaptability – allow for adjustments in BMP implementation to consider potential uncertainties and response options
• Adaptive manage – allow for changes in BMP selection or WIP implementation over-time

Accounting for Changing Conditions
162

Impact of Changing Conditions on Bay and Watershed Increase Through Time
• Based on STAC guidance1, the Partnership is using projections for 2025 that have a high level of confidence
• Selection of projections for sea level rise and precipitation change were based on past records of observed climatic and resultant river flow conditions.
• There is less uncertainty in downscaled temperature projections for 2025.
• According to the National Climate Assessment2, impacts associated with precipitation, temperature and sea level are all expected to increase beyond 2025
1631. CBP Scientific and Technical Advisory Committee. 2016. The Development of Climate Projections for Use in Chesapeake Bay Program Assessments. March 2016 Workshop. 2. 4th National Climate Assessment (November 2017)
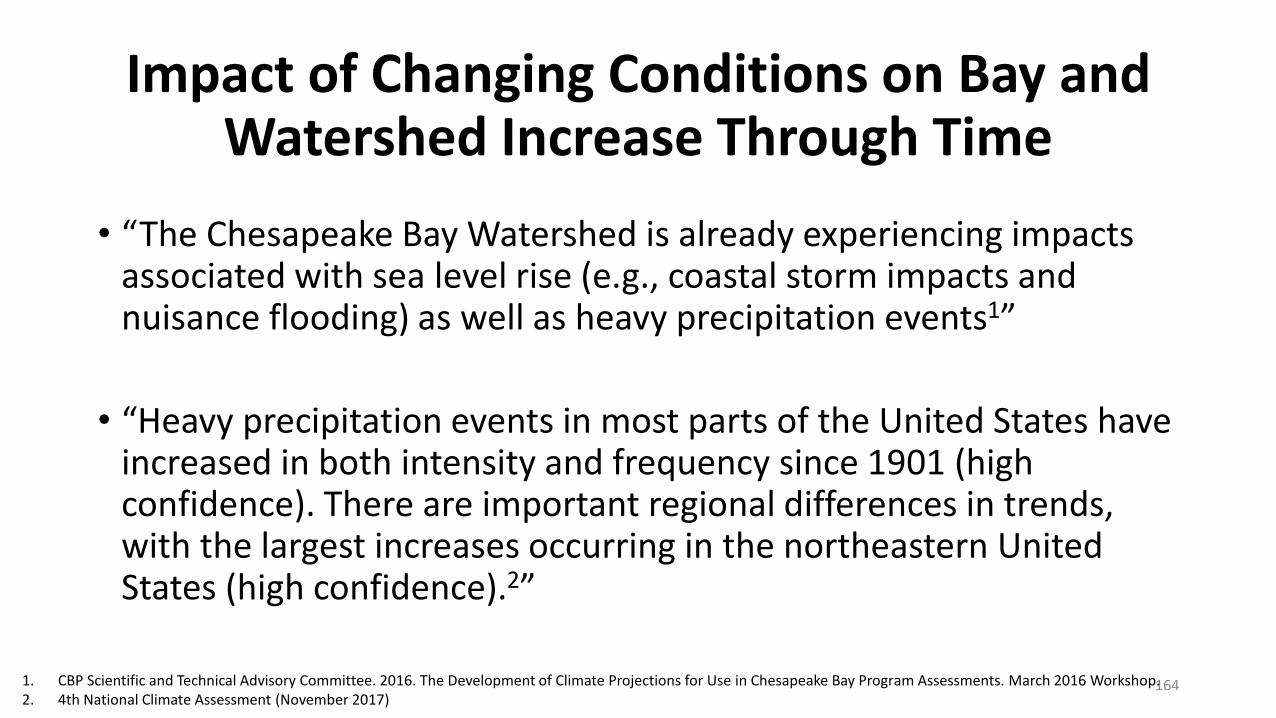
Impact of Changing Conditions on Bay and Watershed Increase Through Time
• “The Chesapeake Bay Watershed is already experiencing impacts associated with sea level rise (e.g., coastal storm impacts and nuisance flooding) as well as heavy precipitation events1”
• “Heavy precipitation events in most parts of the United States have increased in both intensity and frequency since 1901 (high confidence). There are important regional differences in trends, with the largest increases occurring in the northeastern United States (high confidence).2”
1641. CBP Scientific and Technical Advisory Committee. 2016. The Development of Climate Projections for Use in Chesapeake Bay Program Assessments. March 2016 Workshop. 2. 4th National Climate Assessment (November 2017)

-1
0
1
2
3
4
5
6
7
8
9
10
11
12
1930 1940 1950 1960 1970 1980 1990 2000 2010 2020 2030 2040 2050 2060 2070 2080 2090 2100
Sea
Leve
l Rel
ativ
e to
MSL
in 1
99
2 (
ft)
Year
Relative Sea Level Rise Scenarios for Annapolis with Annapolis Monthly Mean Sea Level Data for 1930-2016
The six Global Mean Sea Level (GMSL) scenarios in Sweet et al., 2017, identified by the height in meters in 2100 relative to MSL in 2000, span the range of scientifically plausible sea level rise scenarios. The shaded regions represent a central 80% probability range for each scenario. These curves have been adjusted to depict MSL relative to 1992.
The five scenarios described in Hall et al., 2016 correspond to GMSL of 2.0m, 1.5m, 1.0m, 0.5m, and 0.2m relative to MSL in 1992, and are indicated by thick black lines.
Intermediate Low (0.5m)
Intermediate (1.0m)
Intermediate High (1.5m)
High (2.0m)
Extreme (2.5m)
Low (0.3m)
High Emission Scenario withMax Contribution from Ice Sheets;Low Probability, High Consequences
Low Emissions; RequiresMajor Carbon Cuts and Removal
Moderate to High Emissions
Graphic by E.T. Petruncio
Relative Sea Level Rise
165
.17 meter/.6 feet
Sources: Hall et al. (2016) and Sweet et al. (2017)
CBP Climate Resiliency
Workgroup recommended
2025 projection: .17 meter/.6 feet

Temperature Change2025/2050 STAC Recommended Projections
166
1.98° F / 1.1° C Increase in Average Annual Temp
1995-2025 1995-2050
3.5° F / 1.94° C Increase in Average Annual Temp
Source: Kyle Hinson, CRC/CBPO

11
Precipitation Change 2025 STAC Recommended Projection: Trends in 88-years of annual PRISM[1] data
Change in Rainfall Volume 2021-2030 vs. 1991-2000
[1] Parameter-elevation Relationships on Independent Slopes ModelSource: Kyle Hinson, CRC/CBPO
Major Basins PRISM Trend
Youghiogheny River 2.1%
Patuxent River Basin 3.3%
Western Shore 4.1%
Rappahannock River Basin 3.2%
York River Basin 2.6%
Eastern Shore 2.5%
James River Basin 2.2%
Potomac River Basin 2.8%
Susquehanna River Basin 3.7%
Chesapeake Bay Watershed 3.1%
167
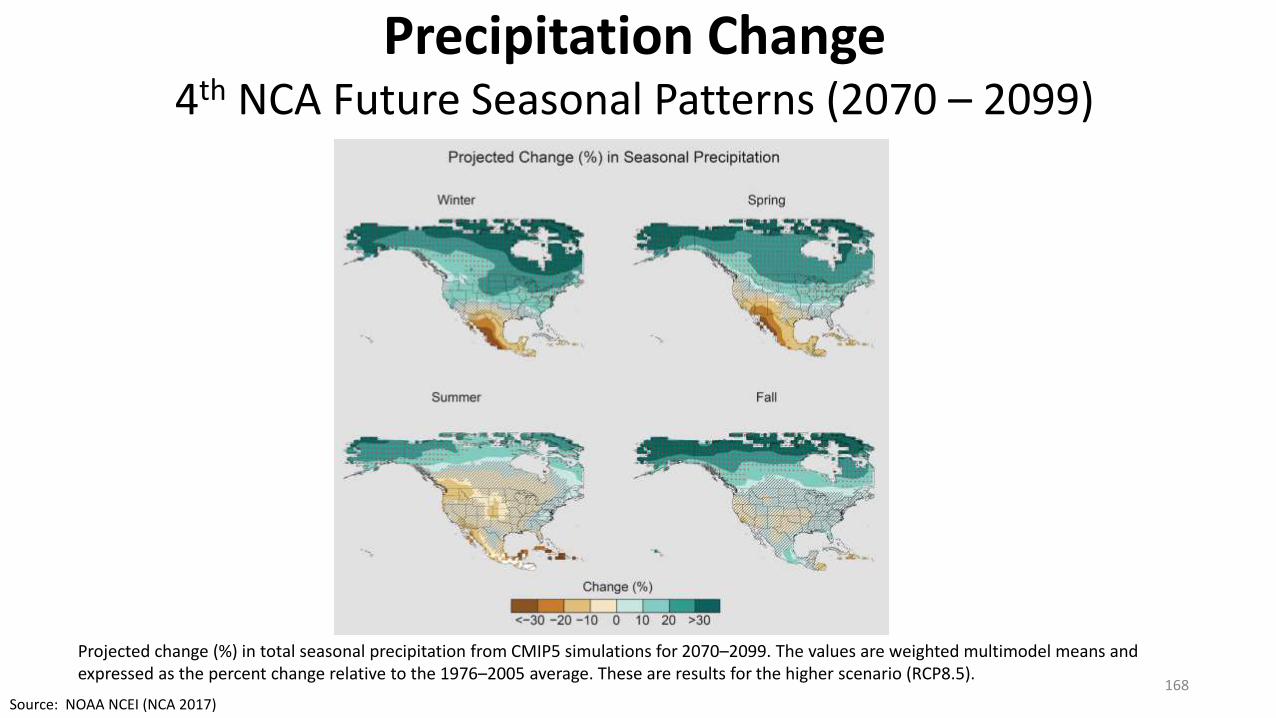
Precipitation Change4th NCA Future Seasonal Patterns (2070 – 2099)
Projected change (%) in total seasonal precipitation from CMIP5 simulations for 2070–2099. The values are weighted multimodel means and expressed as the percent change relative to the 1976–2005 average. These are results for the higher scenario (RCP8.5).
168Source: NOAA NCEI (NCA 2017)
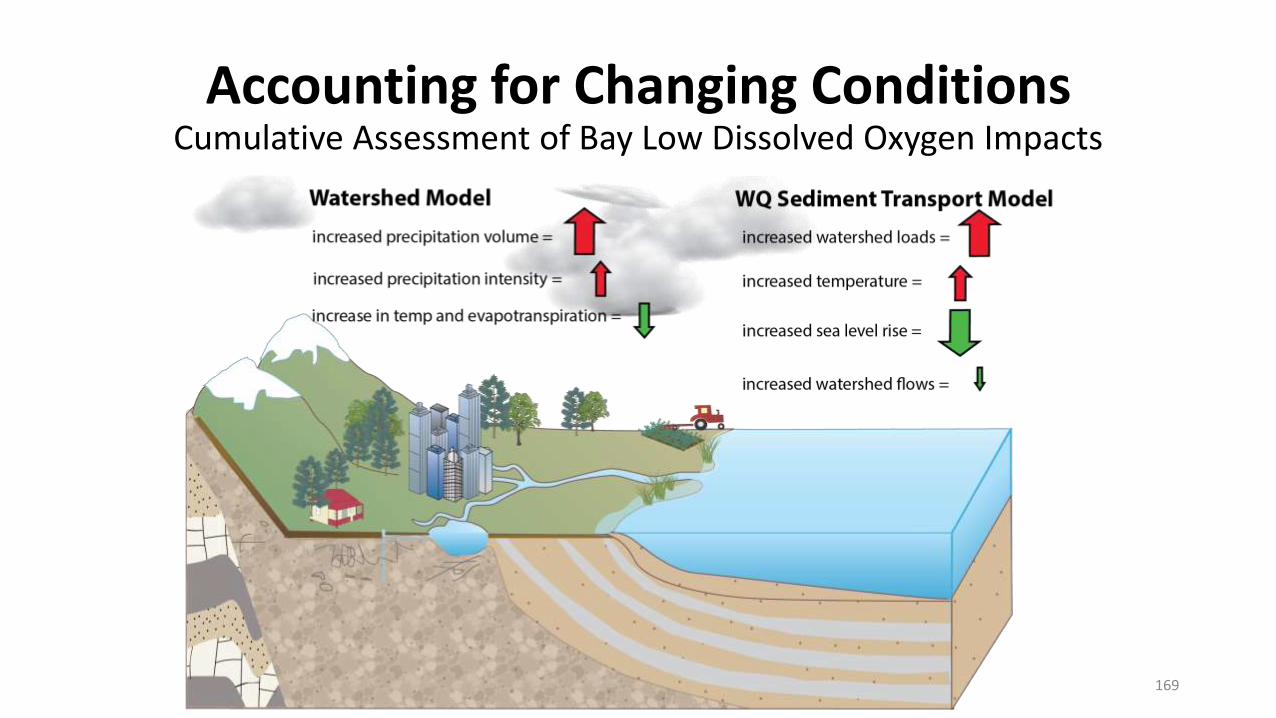
Accounting for Changing ConditionsCumulative Assessment of Bay Low Dissolved Oxygen Impacts
169

Estimated Changes in Watershed and Bay Loads by 2025 Due to Climate Change
• Inorganic nutrients are increased with climate change
• Organic nutrients are decreased
• Inorganic nutrients have a higher effect on dissolved oxygen

Jurisdiction1985
Baseline 2013
ProgressClimate Change Phase III
Planning Target
NY 18.710 15.440 0.400 (3.8%) 10.594
PA 122.414 99.275 4.135 (5.7%) 73.181
MD 83.556 55.893 2.194 (4.8%) 45.296
WV 8.727 8.065 0.236 (3.7%) 6.347
DC 6.481 1.754 0.006 (0.2%) 2.425
DE 6.968 6.587 0.397 (8.7%) 4.587
VA 84.295 61.530 1.722 (3.1%) 55.822
Basinwide 331.151 248.544 9.089 (4.6%) 198.253
Climate Change Loads: Nitrogen
*Units: millions of pounds

Jurisdiction 1985 Baseline
2013 Progress
Climate Change Phase III Planning Target
NY 1.198 0.710 0.015 (2.9%) 0.506
PA 6.115 3.696 0.143 (4.7%) 3.073
MD 7.419 3.919 0.117 (3.2%) 3.604
WV 0.793 0.560 0.017 (3.7%) 0.456
DC 0.090 0.062 0.001 (0.8%) 0.130
DE 0.225 0.115 0.006 (5.1%) 0.120
VA 13.545 6.345 0.187 (3.0%) 6.186
Basinwide 29.384 15.408 0.485 (3.4%) 14.073
Climate Change Loads: Phosphorus
*Units: millions of pounds

Policy Options for Accounting for Climate
Change in the Jurisdictions’ Phase III WIPs
Mark Bennett, USGS, CBP Climate Resiliency Workgroup Co-Chair
173
Two Policy Approaches
Numeric Programmatic
174
and/or

Numerical Approach
• A quantitative, numerical approach will result in a changed level of effort necessary to meet water quality standards
• Account for the increased pollutant loads to each jurisdiction’s portion of the Bay watershed
• Accounts for feedbacks to the Bay’s assimilative capacity
• This approach would treat the estimated cumulative effect of changed conditions due to climate change similarly to the approach being taken to account for growth
• Jurisdictions would develop Phase III WIPs which account for the estimated increased pollutant loads
175

Numerical Approach: Pros & Cons
Pros Cons Comprehensive, straight-forward
approach
Demonstrates Partnership’s
commitment to Chesapeake Bay
Agreement Climate Resiliency Goal
Near-term response
Implemented in sequence with
development of Phase III WIPs
Increased level of effort
required to meet water
quality standards
If implemented in isolation,
would not address the
anticipated impacts of
climate change on BMPs
176

• An “adaptive management approach” that would be implemented through the two-year milestone process
• Would not change a jurisdictions' planning targets
• Directs the Partnership to collect and consider new information on the performance of BMPs, including the contribution of seasonal, inter-annual climate variability, and weather extremes.
• Jurisdictions would assess this information and adjust plans, over-time, to better mitigate anticipated changes in loads and impacts on the performance of BMPs.
• Would require the inclusion of a narrative strategy in Phase III WIPs, describing a jurisdictions’ programmatic commitments to address climate change.
• A sample “narrative strategy” would be provided to jurisdictions to guide implementation.
177
Programmatic Approach

Programmatic Approach: Pros & Cons
Pros Cons• Adaptively managing for long-term
change
• Allows for use of local expertise and
knowledge
• Provides for learning across jurisdictions
about methods and results
• Allows for flexibility in jurisdictions’
approaches to addressing climate change
• Provides standard elements to be
addressed
• If implemented in isolation (w/o numeric
approach), delays substantive action to
address climate change in the near-term
• Lack of specific technical understanding to
guide implementation
• Requires additional monitoring and
assessment efforts
• Inconsistency in implementation across
jurisdictions
178

WQGIT Recommendations to the PSC: Adopt a dual approach to factor climate change into the Phase III WIPs
1. Adopt a programmatic approach to address climate change
• Include a narrative strategy in the Phase III WIPs that describes the jurisdictions’ current action plans and strategies to address climate change, as well as the jurisdiction-specific nutrient pollutant loadings due to 2025 climate change conditions (derived using the planning targets methodology)
• Incorporate local priorities (e.g., flooding) and actions to address climate change impacts
179

WQGIT Recommendations to the PSC: Adopt a dual approach to factor climate change into the Phase III WIPs
1. Adopt a programmatic approach to address climate change (Continued)
• Document the current understanding of the science and identify the research gaps and needs, and what we hope to learn over time given the current state of uncertainty (e.g., a better understanding of the BMP responses, including new or other emerging BMPs, to climate change conditions)
• Identify a date by which the Partnership will provide additional science and information to help inform implementation efforts to address climate change (early 2021 to inform 2022-2023 milestones?)
180

WQGIT Recommendations to the PSC: Adopt a dual approach to factor climate change into the Phase III WIPs
2. Document and communicate additional nutrient pollutant loads of up to 9 million pounds of nitrogen and 0.5 million pounds of phosphorus due to 2025 climate change conditions
• Continue to understand the nature and effect of climate change impacts in the watershed and estuary to inform management strategies (e.g., WIP/2-year milestones)
• By [insert date], develop recommendations for new and/or refined methods and modeling techniques to better assess projected impacts on watershed loads and estuarine impacts for a range of future scenarios, including the methodology used to develop jurisdiction-specific nutrient pollutant loads due to 2025 climate change conditions
181

WQGIT Recommendations to the PSC: Adopt a dual approach to factor climate change into the Phase III WIPs
2. Document and communicate additional nutrient pollutant loads of up to 9 million pounds of nitrogen and 0.5 million pounds of phosphorus due to 2025 climate change conditions (Continued)
• By [insert date], consider results of updated methods, techniques, and studies and revisit whether to explicitly account for those additional nutrient pollutant loads due to 2025 climate change conditions in the Phase III WIPs and/or 2-year milestones
• Identify a date (post-2025) by which the Partnership will fully address the additional nutrient pollutant loads in a Phase III WIP addendum and/or 2-year milestones
182

WQGIT Recommendations to the PSC
Provide the jurisdictions with the flexibility to explicitly account for additional nutrient pollutant loadings due to 2025 climate change impacts in their Phase III WIPs and/or 2-year milestones prior to the Partnership agreed-upon date
183
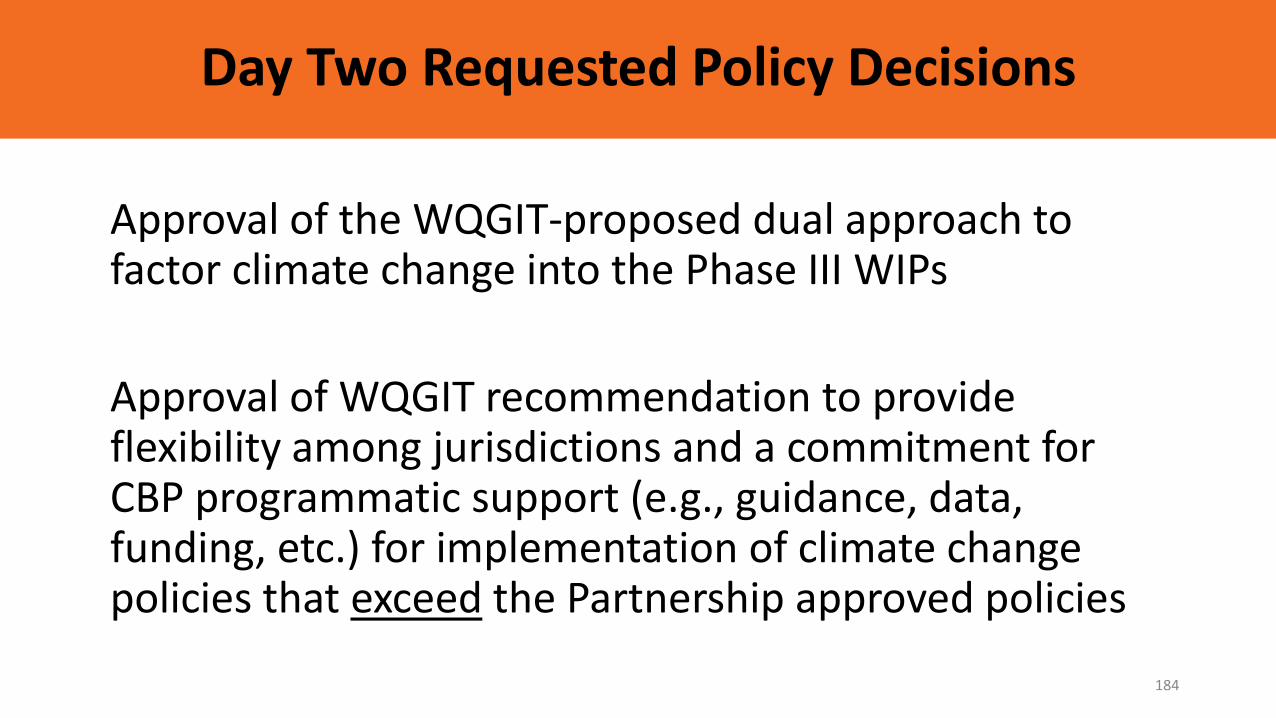
Day Two Requested Policy Decisions
Approval of the WQGIT-proposed dual approach to factor climate change into the Phase III WIPs
Approval of WQGIT recommendation to provide flexibility among jurisdictions and a commitment for CBP programmatic support (e.g., guidance, data, funding, etc.) for implementation of climate change policies that exceed the Partnership approved policies
184

Accounting for Changed Conditions in the
Jurisdictions’ Phase III WIPsTeresa Koon, WV DEP, CBP Water Quality Goal
Implementation Team Vice Chairand
Lee Currey, MDE, CBP Modeling Workgroup Co-Chair
185

Jurisdiction1985
Baseline 2013
ProgressGrowth in Load
to 2025Phase III
Planning Target
NY 18.71 15.44 -0.74 10.59
PA 122.41 99.28 1.66 73.18
MD 83.56 55.89 1.52 45.30
WV 8.73 8.06 -0.02 6.35
DC 6.48 1.75 0.00 2.43
DE 6.97 6.59 0.48 4.59
VA 84.29 61.53 1.09 55.82
Basinwide 331.15 248.54 4.00 198.25*Units: millions of pounds
Summary of “All the Numbers”: Nitrogen

Summary of “All the Numbers”: Phosphorus
*Units: millions of pounds
Jurisdiction 1985 Baseline
2013 Progress
Growth in Load to 2025
Phase III Planning Target
NY 1.198 0.710 -0.005 0.506
PA 6.115 3.696 0.044 3.073
MD 7.419 3.919 -0.015 3.604
WV 0.793 0.560 -0.017 0.456
DC 0.090 0.062 0.000 0.130
DE 0.225 0.115 0.007 0.120
VA 13.545 6.345 0.140 6.186
Basinwide 29.384 15.408 0.154 14.073


Day Two Requested Policy Decisions
1) Approval of the draft Phase III Planning Targets as the starting point for the 4-month review process
2) Approval of the approach to account for the additional loads delivered to the Bay due to the Conowingo infill
3) Approval of how to factor climate change into the Phase III WIPs
190