chester high coniction fund - constant...
TRANSCRIPT
Chester High Conviction FundMarket Commentary
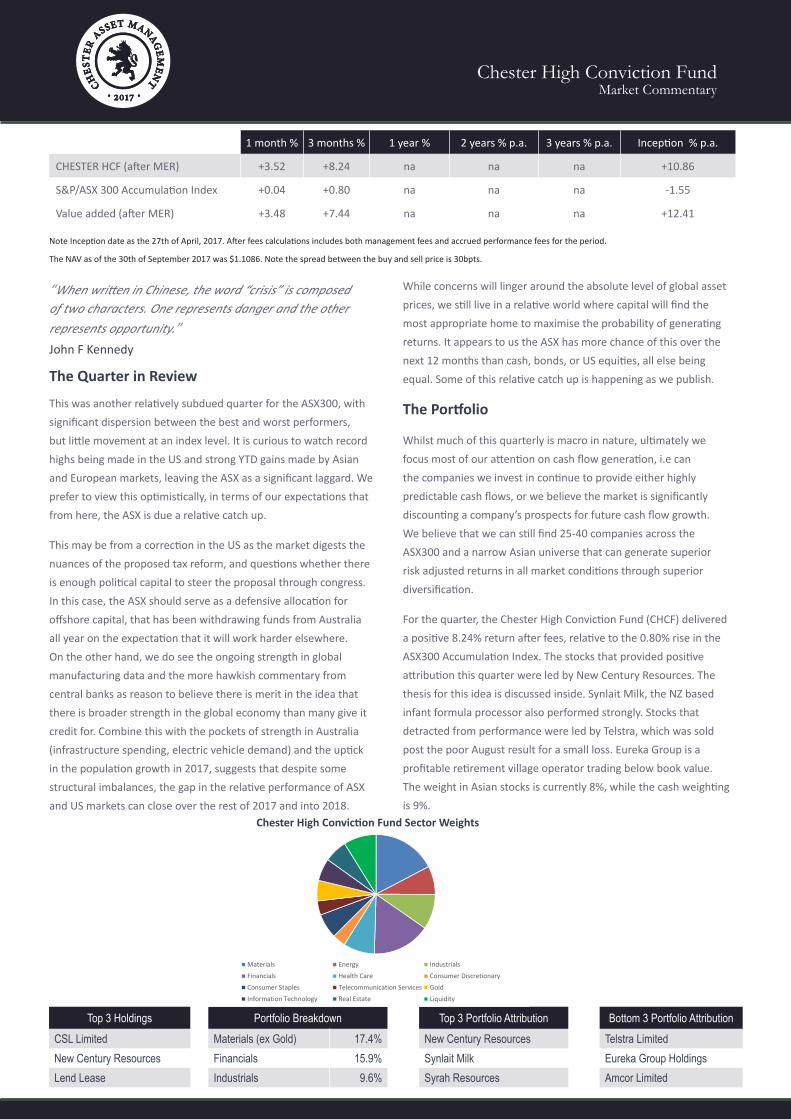
Top 3 Holdings Portfolio Breakdown Top 3 Portfolio Attribution Bottom 3 Portfolio AttributionCSL Limited Materials (ex Gold) 17.4% New Century Resources Telstra LimitedNew Century Resources Financials 15.9% Synlait Milk Eureka Group HoldingsLend Lease Industrials 9.6% Syrah Resources Amcor Limited
While concerns will linger around the absolute level of global asset prices, we still live in a relative world where capital will find the most appropriate home to maximise the probability of generating returns. It appears to us the ASX has more chance of this over the next 12 months than cash, bonds, or US equities, all else being equal. Some of this relative catch up is happening as we publish.
The Portfolio
Whilst much of this quarterly is macro in nature, ultimately we focus most of our attention on cash flow generation, i.e can the companies we invest in continue to provide either highly predictable cash flows, or we believe the market is significantly discounting a company’s prospects for future cash flow growth. We believe that we can still find 25-40 companies across the ASX300 and a narrow Asian universe that can generate superior risk adjusted returns in all market conditions through superior diversification.
For the quarter, the Chester High Conviction Fund (CHCF) delivered a positive 8.24% return after fees, relative to the 0.80% rise in the ASX300 Accumulation Index. The stocks that provided positive attribution this quarter were led by New Century Resources. The thesis for this idea is discussed inside. Synlait Milk, the NZ based infant formula processor also performed strongly. Stocks that detracted from performance were led by Telstra, which was sold post the poor August result for a small loss. Eureka Group is a profitable retirement village operator trading below book value. The weight in Asian stocks is currently 8%, while the cash weighting is 9%.
1 month % 3 months % 1 year % 2 years % p.a. 3 years % p.a. Inception % p.a.
CHESTER HCF (after MER) +3.52 +8.24 na na na +10.86
S&P/ASX 300 Accumulation Index +0.04 +0.80 na na na -1.55
Value added (after MER) +3.48 +7.44 na na na +12.41
“When written in Chinese, the word “crisis” is composed of two characters. One represents danger and the other represents opportunity.”John F Kennedy
The Quarter in Review
This was another relatively subdued quarter for the ASX300, with significant dispersion between the best and worst performers, but little movement at an index level. It is curious to watch record highs being made in the US and strong YTD gains made by Asian and European markets, leaving the ASX as a significant laggard. We prefer to view this optimistically, in terms of our expectations that from here, the ASX is due a relative catch up.
This may be from a correction in the US as the market digests the nuances of the proposed tax reform, and questions whether there is enough political capital to steer the proposal through congress. In this case, the ASX should serve as a defensive allocation for offshore capital, that has been withdrawing funds from Australia all year on the expectation that it will work harder elsewhere. On the other hand, we do see the ongoing strength in global manufacturing data and the more hawkish commentary from central banks as reason to believe there is merit in the idea that there is broader strength in the global economy than many give it credit for. Combine this with the pockets of strength in Australia (infrastructure spending, electric vehicle demand) and the uptick in the population growth in 2017, suggests that despite some structural imbalances, the gap in the relative performance of ASX and US markets can close over the rest of 2017 and into 2018.
Note Inception date as the 27th of April, 2017. After fees calculations includes both management fees and accrued performance fees for the period.
The NAV as of the 30th of September 2017 was $1.1086. Note the spread between the buy and sell price is 30bpts.
Chester High Conviction Fund Sector Weights
Materials Energy Industrials
Financials Health Care Consumer Discretionary
Consumer Staples Telecommunication Services Gold
Information Technology Real Estate Liquidity

Chester High Conviction FundMarket Commentary
2013# 2014 2015 2016 2017^ Total Return Total Return % p.a.
SGH Australia Plus (after MER) +5.68 +19.38 +22.05 +10.73 +3.25 +76.05 +18.16
S&P/ASX 300 Accumulation Index +4.75 +5.30 +2.80 +11.79 +1.34 +28.53 +7.62
Value added (after MER) +0.93 +14.08 +19.25 -1.06 +1.91 +47.52 +10.54
# Inception date as the 8th of October, 2013. ^ First 2 months of 2017. After fees calculation includes both management fees and accrued performance fees.
Source, SGH Australia Plus unit price history, Bloomberg
2005 2006 2007 2008 2009 Total Return Total return % p.a.
HSBC Australian Country Funds (USD) +18.44 +31.25 +35.33 -47.17 +78.96 +98.83 +14.74
FTSE AUS+NZ (USD) +15.42 +30.18 +27.80 -50.76 +73.69 +64.23 +10.43
Value added (after MER) +3.02 +1.07 +7.53 +3.59 +5.27 +34.60 +4.31
Past Performance - SGH Australia Plus Fund October 2013 - February 2017
Past Performance - HSBC Australian Country Fund January 2005 - December 2009
We note this is a statement of fact of the performance achieved by the fund during the time which Rob Tucker was the sole Portfolio Manager making active decisions on the SGH Australia Plus portfolio. We note performance is the record of the firm not the individual however past performance has been constructed from publicly available unit price data. Past performance is not necessarily indicative of future performance and should not be relied upon in making investment decisions.
We note this is a statement of fact of the performance achieved by the fund during the time which Rob Tucker was the sole Portfolio Manager making active decisions on the HSBC Austra-lian portfolios. Past performance is not necessarily indicative of future performance and should not be relied upon in making investment decisions. The HSBC Australian Funds were run on a benchmark aware basis with a 3% tracking error constraint, hence are not directly comparable to the Chester High Conviction Fund.
Source: HSBC Asset Management (formerly known as Halbis Capital Management). Performance is a combination of various institutional mandates that has been presented in a GIPS com-pliant format.

Chester High Conviction FundMarket Commentary
What we are thinking about...
1. US Tax Reform - Regardless of our personal view of the Trump Administration and the President’s own shortcomings, we have been of the view since his election in November 2016 that tax reform is a crucial piece in driving US economic growth and reducing the reliance on monetary policy and central banks. While it may be too early to assess what probability there is of this policy being legislated, we look at the pros and cons of it on page 5. We have always been of the view that US equity markets need the earnings accretion (upgrades) from lower taxes to drive markets higher. At least now we have a roadmap to assess the implications of this tax reform, and how this might change the Federal Reserves’ interest rate forecasts.
2. Global PMI Data - We confess to have been in the glass half empty camp in terms of economic expansion, believing much of it is (particularly in China) has been led by credit growth and is unlikely to reflect a true underlying demand pull for economic growth. We may very well be late to the party, but it appears to us that (in conjunction with US tax reform above) that globally, we may experience a period of co-ordinated global growth that has not been the case since 2010. The global economic surprise index has recovered strongly over the past 3 months, as has Dr Copper.
3. Australia’s Infrastructure “Wave” - This will not be news to many people, particularly industry participants, but Australia is on the cusp of a multi year uptrend in infrastructure spending on roads and rail. This is essentially by design, to absorb some of the labor market slack as a result of the wave of completions in the Australian apartment markets, which has driven much of the growth in Melbourne and Sydney over the past 4 years. While it is not clear how sustainable this is, the recent pick up in population growth (births and net migration) suggests that with this uptick in infrastructure spending, there may well be an elongated housing cycle, that actually absorbs much of the excess labor market. Could we finally see wage pressure in Australia? We look in depth on page 6.
4. The Oil market - What happens to Shale? – We detail on page 8 our thoughts on the US Shale market. Much of the oil price destruction over the past 3 years has been led by a strong surge in shale production in the US. BHP has admitted that their 6 year shale experiment has not worked by deciding to sell these assets at a large loss. More recently Harold Hamm (US Shale billionaire) commented that the EIA (Energy Information Administration) had overstated US oil growth by 100%. A startling claim in itself and would have large ramifications for the oil market if this were to play out.
5. The Cobalt Problem - Electric Vehicles do seem to be the hottest topic globally at the moment. The announcements from
both traditional car manufacturers and individual countries are appearing weekly in terms of new EV models, or setting targets for the end of ICE (internal combustible engines). China has effectively added weight to this by suggesting there will be a date where only EV cars will be manufactured. This is truly transformational, but not new news. What we are grappling with is the actual supply of raw materials that have to be supplied to build EV batteries. We think the most significant bottleneck in this channel is cobalt. We discuss this, and the ramifications for the car industry on page 10.
6. Accounting Quality - We spend much of our time in August looking through financial statements. We focus heavily on cash flow, particularly the conversion of EBITDA to operating cash flow after adjusting for working capital changes (if a business is growing, it makes sense to hold more inventory than the prior year). We also shake our heads at times for individual companies ability to determine for us (the financial community) what they define as underlying profit vs statutory profit (what they actually report). Often there is valid reasons for a difference between the two, but we do take a very close look at companies whose executives are remunerated with underlying profit growth. It allows them greater flexibility in determining what they deem to be “one off” accounting issues. We take a look at CSL and Ramsay Healthcare as examples of different degrees of accounting quality on page 12.
7. Balance Sheet Recapitalisation - When we think of the risks in investing, the 3 main ones for each individual company are operating risk (industry structure), financial risk (too much debt) and corporate governance risk (management and ESG issues). While we can spend much time theoretically assessing each of these risks, financial risk is the easiest to assess, and hopefully eliminate. We are very focused on taking no financial risk with the companies we invest in. We have found though, over time, there is significant value to be made in investing in companies, once it is clear there is no more financial risk. These balance sheet recapitalisation stories do wonders for the equity value shareholders are happy to place on companies once the debt issue has been resolved. We look in more detail on page 9.
8. Portfolio Construction - While every portfolio manager (and firm) will have their own style, and many portfolios are skewed towards mirroring the ASX300 Index to a large extent, our portfolio is different. By and large we are looking to hold the bulk of the funds in stocks where we are expecting companies to achieve relatively predictable earnings, and hopefully, cash flow growth, although from experience, this is easier said than done. We will also invest a portion of the funds in more cyclical areas of the market, where there is less predictability in cash flows, but only where we see a significant margin of safety from a valuation perspective. Conceptually, we outline this framework on page 13.
Chester High Conviction FundMarket Commentary
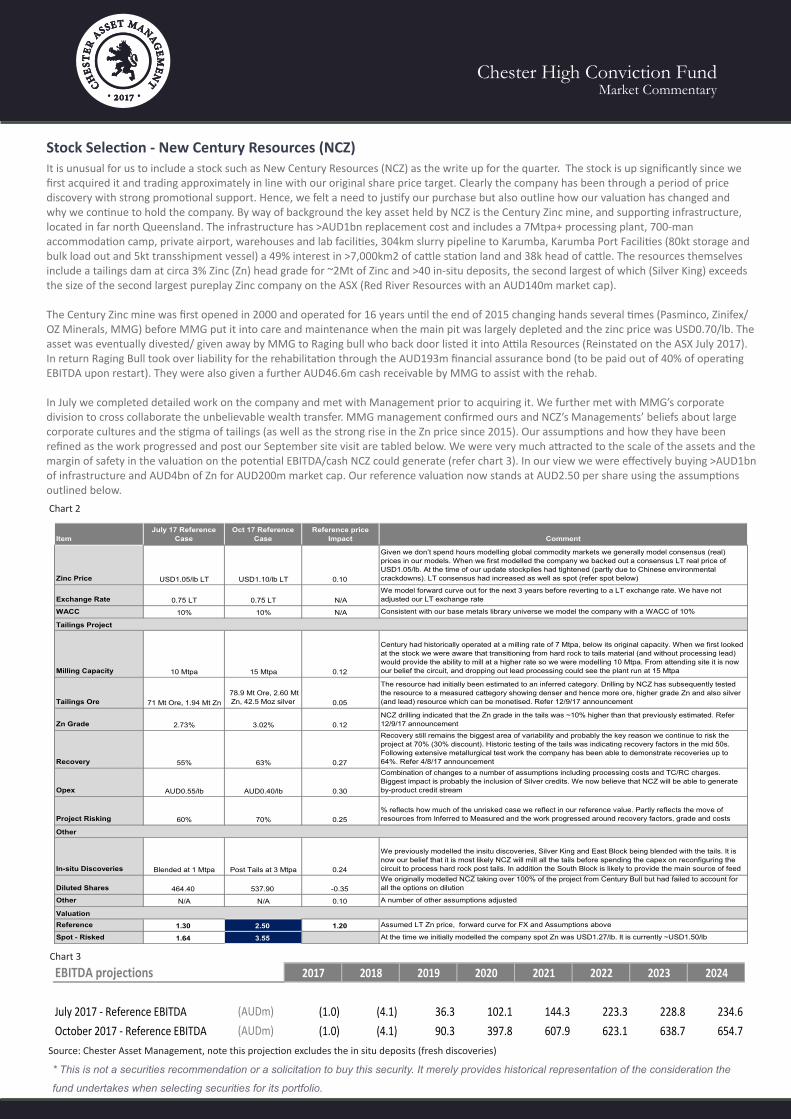
Stock Selection - New Century Resources (NCZ)It is unusual for us to include a stock such as New Century Resources (NCZ) as the write up for the quarter. The stock is up significantly since we first acquired it and trading approximately in line with our original share price target. Clearly the company has been through a period of price discovery with strong promotional support. Hence, we felt a need to justify our purchase but also outline how our valuation has changed and why we continue to hold the company. By way of background the key asset held by NCZ is the Century Zinc mine, and supporting infrastructure, located in far north Queensland. The infrastructure has >AUD1bn replacement cost and includes a 7Mtpa+ processing plant, 700-man accommodation camp, private airport, warehouses and lab facilities, 304km slurry pipeline to Karumba, Karumba Port Facilities (80kt storage and bulk load out and 5kt transshipment vessel) a 49% interest in >7,000km2 of cattle station land and 38k head of cattle. The resources themselves include a tailings dam at circa 3% Zinc (Zn) head grade for ~2Mt of Zinc and >40 in-situ deposits, the second largest of which (Silver King) exceeds the size of the second largest pureplay Zinc company on the ASX (Red River Resources with an AUD140m market cap).
The Century Zinc mine was first opened in 2000 and operated for 16 years until the end of 2015 changing hands several times (Pasminco, Zinifex/ OZ Minerals, MMG) before MMG put it into care and maintenance when the main pit was largely depleted and the zinc price was USD0.70/lb. The asset was eventually divested/ given away by MMG to Raging bull who back door listed it into Attila Resources (Reinstated on the ASX July 2017). In return Raging Bull took over liability for the rehabilitation through the AUD193m financial assurance bond (to be paid out of 40% of operating EBITDA upon restart). They were also given a further AUD46.6m cash receivable by MMG to assist with the rehab. In July we completed detailed work on the company and met with Management prior to acquiring it. We further met with MMG’s corporate division to cross collaborate the unbelievable wealth transfer. MMG management confirmed ours and NCZ’s Managements’ beliefs about large corporate cultures and the stigma of tailings (as well as the strong rise in the Zn price since 2015). Our assumptions and how they have been refined as the work progressed and post our September site visit are tabled below. We were very much attracted to the scale of the assets and the margin of safety in the valuation on the potential EBITDA/cash NCZ could generate (refer chart 3). In our view we were effectively buying >AUD1bn of infrastructure and AUD4bn of Zn for AUD200m market cap. Our reference valuation now stands at AUD2.50 per share using the assumptions outlined below.
* This is not a securities recommendation or a solicitation to buy this security. It merely provides historical representation of the consideration the
fund undertakes when selecting securities for its portfolio.
Source: Chester Asset Management, note this projection excludes the in situ deposits (fresh discoveries)
EBITDA projections 2017 2018 2019 2020 2021 2022 2023 2024
July 2017 - Reference EBITDA (AUDm) (1.0) (4.1) 36.3 102.1 144.3 223.3 228.8 234.6October 2017 - Reference EBITDA (AUDm) (1.0) (4.1) 90.3 397.8 607.9 623.1 638.7 654.7
Chart 2
Chart 3
ItemJuly 17 Reference
CaseOct 17 Reference
CaseReference price
Impact Comment
Zinc Price USD1.05/lb LT USD1.10/lb LT 0.10
Given we don’t spend hours modelling global commodity markets we generally model consensus (real) prices in our models. When we first modelled the company we backed out a consensus LT real price of USD1.05/lb. At the time of our update stockpiles had tightened (partly due to Chinese environmental crackdowns). LT consensus had increased as well as spot (refer spot below)
Exchange Rate 0.75 LT 0.75 LT N/AWe model forward curve out for the next 3 years before reverting to a LT exchange rate. We have not adjusted our LT exchange rate
WACC 10% 10% N/A Consistent with our base metals library universe we model the company with a WACC of 10%
Milling Capacity 10 Mtpa 15 Mtpa 0.12
Century had historically operated at a milling rate of 7 Mtpa, below its original capacity. When we first looked at the stock we were aware that transitioning from hard rock to tails material (and without processing lead) would provide the ability to mill at a higher rate so we were modelling 10 Mtpa. From attending site it is now our belief the circuit, and dropping out lead processing could see the plant run at 15 Mtpa
Tailings Ore 71 Mt Ore, 1.94 Mt Zn 78.9 Mt Ore, 2.60 Mt Zn, 42.5 Moz silver 0.05
The resource had initially been estimated to an inferred category. Drilling by NCZ has subsequently tested the resource to a measured cattegory showing denser and hence more ore, higher grade Zn and also silver (and lead) resource which can be monetised. Refer 12/9/17 announcement
Zn Grade 2.73% 3.02% 0.12NCZ drilling indicated that the Zn grade in the tails was ~10% higher than that previously estimated. Refer 12/9/17 announcement
Recovery 55% 63% 0.27
Recovery still remains the biggest area of variability and probably the key reason we continue to risk the project at 70% (30% discount). Historic testing of the tails was indicating recovery factors in the mid 50s. Following extensive metallurgical test work the company has been able to demonstrate recoveries up to 64%. Refer 4/8/17 announcement
Opex AUD0.55/lb AUD0.40/lb 0.30
Combination of changes to a number of assumptions including processing costs and TC/RC charges. Biggest impact is probably the inclusion of Silver credits. We now believe that NCZ will be able to generate by-product credit stream
Project Risking 60% 70% 0.25% reflects how much of the unrisked case we reflect in our reference value. Partly reflects the move of resources from Inferred to Measured and the work progressed around recovery factors, grade and costs
In-situ Discoveries Blended at 1 Mtpa Post Tails at 3 Mtpa 0.24
We previously modelled the insitu discoveries, Silver King and East Block being blended with the tails. It is now our belief that it is most likely NCZ will mill all the tails before spending the capex on reconfiguring the circuit to process hard rock post tails. In addition the South Block is likely to provide the main source of feed
Diluted Shares 464.40 537.90 -0.35 We originally modelled NCZ taking over 100% of the project from Century Bull but had failed to account for all the options on dilution
Other N/A N/A 0.10 A number of other assumptions adjusted
Reference 1.30 2.50 1.20 Assumed LT Zn price, forward curve for FX and Assumptions above
Spot - Risked 1.64 3.55 At the time we initially modelled the company spot Zn was USD1.27/lb. It is currently ~USD1.50/lb
Tailings Project
Valuation
Other

Chester High Conviction FundMarket Commentary
US Tax ReformWe don’t profess to be US tax reform experts, far from it, but we do believe it will be a significant milestone for the Trump Administration should it be passed. Warren Buffett recently noted that “Any politician that can’t pass a tax cut is probably in the wrong line of work”, believing that the chance of this tax cut being passed into law is “higher than most people think”. We have seen estimates that suggest that S&P500 eps growth rates will be (in aggregate) 12% higher if reform is passed. Given the record highs being made in the US market every day, we suspect the market has factored in a very high probability of the tax act being passed, and if we believe the Republicans, this will occur by the end of 2017. We shall see.In our view, the prospect of tax reform has increased with the more conservative members of the Republican Party being less dogmatic about the reform being revenue neutral. That is, they now accept that the budget deficit will increase, due to these changes, while Gary Cohn (Trump economic adviser) suggests that the economic benefit given to the economy will more than offset the reduced revenue, all else being equal.It is too early to tell effectively what the final deficit increase will look like, as the final bill is still to be unveiled over the next few weeks. It is fair to say that Trump needs a good news story. From an equity market perspective we have always been of the view that to see markets continue higher, we need continued upward earnings revisions and accommodative liquidity. Chart 6 highlights that even in absence of the US Fed since 2015, the BOJ and ECB have been adding combined over USD150bn per month to global markets. In this scenario (if it continues), the Fed shrinking their balance sheet by USD10bn per month initially, should not cause any market distress. Even USD50bn per month should not move the needle materially, as long as the BOJ and ECB are acting together. We will change our view on markets if this liquidity injection starts being wound back materially, which eventually, will have to be the case. As will higher interest rates.We do note that recent PMI data (shown in chart 7) is looking stronger, which highlights the stronger business and consumer confidence numbers in the US is starting to feed through to the real economy, which is as strong as its been since the GFC. This should theoretically translate into better economic growth, and subsequently positive eps revisions.
Source: Ernst & Young
Chart 4
Source: CLSA
Chart 5
Source: DB
Chart 6 Liquidity still being added to the market
Fed starts to shrink the Balance Sheet
US Tax reform proposal
Deutsche Bank 24Torsten Slok, [email protected] +1 212 250-2155 October 2017
Source: FRB, ECB, BoJ, BoE, DB Global Markets Research
Still plenty of liquidity being added to markets: ECB and BoJ buying around $170bn every month
Trump Campaign Plan House Republican Blueprint
Top corporate tax rate (now 35%) 15%, corporate AMT eliminated 10%, corporate AMT eliminated
Top pass through rate (now 39.6%15% rate within the personal income tax system for pass through entities that want to retain profits in the business
25%
Taxation of future foreign earningsin September 2015, proposed immediate worldwide taxation, repeal of deferral, unclear if he still supports it
Territorial, 100% exemption for dividends paid from foreign subsidiaries. Border tax adjustment mechanism
Mandatory tax, untaxed accumulated foreign earnings 10% 8.75% for cash/cash equivalents, 3.5%
otherwise, payable over 8 years
Cost recovery Expensing for manufacturers 100% expensing of tangible, intangible assets except land
Interest Manufacturers electing to expense capital investment lose the deductibility of corporate interest expense
No current deduction will be allowed for net interest expense
Individual rates (now 10%, 15%, 25%, 28%, 33%, 35%, 39.6%) 12%, 25%, 33% 12%, 25%, 33%
Chart 7 US PMI data looking stronger
45
47
49
51
53
55
57
59
61
63
Oct
-11
Jan-
12
Apr
-12
Jul-
12
Oct
-12
Jan-
13
Apr
-13
Jul-
13
Oct
-13
Jan-
14
Apr
-14
Jul-
14
Oct
-14
Jan-
15
Apr
-15
Jul-
15
Oct
-15
Jan-
16
Apr
-16
Jul-
16
Oct
-16
Jan-
17
Apr
-17
Jul-
17
US Manufacturing PMI US Services PMISource: Bloomberg, Chester AM
Section 1: Global and regional overview Asia Maxima
4 [email protected] 4Q17
also lowered its median expectations for inflation this year and next. Thus, the Fed lowered its core PCE inflation forecast this year from 1.7% projected in June to 1.5%, and from 2.0% to 1.9% for 2018. It is also the case that wage growth has remained tepid. Average hourly earnings growth has slowed from 2.9% YoY in December to 2.5% YoY in August (see following chart). Yet the Fed also signalled at the same September meeting that it plans more rate hikes over the next year. Chairwoman Janet Yellen said in her post-meeting press conference that “additional gradual rate hikes are likely to be appropriate over the next few years to sustain the economic expansion”.
Federal Reserve balance sheet reduction plan
Source: CLSA, Federal Reserve
US average hourly earnings growth for all private employees
Source: US Bureau of Labour Statistics
The above is surprising in the context of the extremely doveish history of the Fed run by both Yellen and her predecessor Ben Bernanke, and raises the issue of whether the Fed is still “data dependent”. The answer is that there is a division within the Fed between those who prioritise “data dependency”, and who are still hoping that this year’s downturn in inflation proves to be transitory, and those who prioritise normalising monetary policy almost regardless of the data. This division is all the more important given that
0.0
0.5
1.0
1.5
2.0
2.5
3.0
3.5
4.0
4.5
5.0 (US$tn)
Other assetsAgency debt & MBSTreasury securities
(Fed's plan)
1.5
2.0
2.5
3.0
3.5
4.0 (% YoY)
Yellen’s signalling
Is the Fed still “data dependent”?

Chester High Conviction FundMarket Commentary
Will Australian Wage Growth Return?The structural imbalances in the Australian economy are well known, with too much household debt. As APRA and the major banks (rightly) address Interest Only loans by raising variable rates out of cycle to curb the excessive lending of this practice, it has clearly been felt in the retail landscape, with soft retail figures continuing throughout 2017.
The panacea to this problem lies with stronger wage growth, which as per chart 9 is yet to be seen, and in fact is falling to record lows. The wage growth problem is exacerbated by a high level of under employment (those who would work more if they could) and the structural challenges of the retail sector, as one of the nations largest employers.
So how does higher wage growth occur? The positive momentum in employment (chart 9) is now running at its highest level since 2007, which combines with the infrastructure wave (chart 10), suggests in some sectors of the economy, the labor force will tighten quite quickly. We know from the latest (Sept) employment data that construction workers grew at 10% yoy, we also know that anecdotally, the largest construction firms in Australia see experienced engineers as a premium skill set over the next 3-5 years as this wave unfolds. We are also of the view that should all these projects eventuate, then it will add another 100-150k jobs in Australia, or 0.8-1.2% of the work force (12.2m people). This has been by design, in the sense that the housing/apartment boom of the past 3 years is peaking and many projects will be completed in the next 12-18 months, leaving a workforce of theoretically a similar size, looking for work.
The bullish scenario occurs if we see continued population growth (as per chart 8), which will ensure the housing market (not as much house and apartment pricing, but construction of new dwellings) stays at an elevated level, relative to previous cycles, acknowledging that the this recent cycle, has been unprecedented in Australia. Should this be the case, and housing related construction stays strong, we would expect the labor force to move back towards full employment and would hope that this can lead to stronger wage growth through 2018. It is the mostly likely reason the RBA would start raising interest rates in 2018, but until we see that average earnings line (chart 9) turn up, we see interest rates on hold in Australia. There are just too many households that can’t afford materially higher interest rates.
Source: Macro Monitor 2017
Chart 10
21
Source: Macromonitor – March 2017
MAJOR AUSTRALIAN TRANSPORT INFRASTRUCTURE PROJECTS – (YEARS ENDED JUNE)
Australian construction outlook$bn
18 July 2017HY17 Results
Major Australian Transport Infrastructure projects
People growth reaches record high in 2017
Source: UBS
Source: UBS
Employment growth strong not wage growth
0
1
2
3
4
0.00
0.25
0.50
0.75
1.00
92 94 96 98 00 02 04 06 08 10 12 14 16
Net overseas migration (LHS)*Net short-term arrivals - Employment or education (LHS)**Share of population (RHS)***
Millions (annual sum) %
* Latest observation estimated** Short-term is 12-months or less*** Does not adjust for potential double counting
0
100
200
300
400
500
600
700
0
100
200
300
400
500
600
700
Sep-13 Mar-14 Sep-14 Mar-15 Sep-15 Mar-16 Sep-16 Mar-17 Sep-17
Other*MelbourneBrisbaneSydneyTotal
Number RLB residential crane count
*Other is Newcastle, Gold Coast, Adelaide, Perth, Darwin & Canberra
Number
-4
-3
-2
-1
0
1
2
3
4
5
6
-4
-2
0
2
4
6
8
10
89 91 93 95 97 99 01 03 05 07 09 11 13 15 17
Average earnings (LHS)* Employment (RHS)**
% y/y (4-quarter average)
* GDP basis - Average compensation per employee; ** latest is Q3-17 quarter to date vs Q2-17
% y/y (4-quarter average)
Chart 8
Chart 9

Chester High Conviction FundMarket Commentary
ChinaThere are always reasons to be cautious around the growth rate in the Chinese credit data. We outlined our reasons in the July Quarterly as to why we don’t believe there is a systemic risk issue in the Chinese credit markets just yet, but is always something to be mindful of. We do however see signs of Beijing cleaning up some of the excesses from the credit bubble which points towards a more stable growth trajectory going forward.Cynics may suggest that much of the restructuring and pro-growth initiatives in the past 18 months have all been geared towards the leadership transition that is happening at the 19th Party Congress (Oct 18th). This is a significant milestone in Xi Jinping’s leadership, where he hopes to secure a standing committee (top 7 Party Officials) that are aligned to his philosophy of Government. We are of the view that this transition will enable an acceleration of some of the reform agenda, where the biggest social impact will be through the ongoing restructuring of SOE’s (State Owned Enterprises) that over produce steel, aluminum and cement. The focus on cleaning up the air quality places this reform at the top of the priority list post the leadership transition.In any event, Beijing has reached its objective of keeping the economy in calm waters leading up to this Congress, and have had some measure of success in addressing two of the biggest concerns in China 18 months ago. These were the level of unsold housing stock (chart 11), which has been addressed, and the ongoing capital outflows putting pressure on the RMB. This has also been addressed to an extent this year (chart 12). The other major issue, which remains the source of the biggest credit risk has been the rise in shadow banking (chart 13). This remains the biggest risk to Chinese liquidity if banks refuse to lend to NBFI (non bank financial institutions), so the dramatic rise in loan growth to NBFI’s represents this risk. However, we have seen a sharp contraction in the growth rate of shadow banking facilities, which highlights how quickly Chinese Policy making can change industry outcomes. It remains our biggest source of concern in China. In reality, as we sit here in Q4 2017, Chinese macro data looks reasonably healthy. We have taken a quick pulse (chart 14) of some of the macro indicators which suggest that broadly, the consumer data points remain strong, while industrial data looks more mixed, it appears to be in line with a GDP growth rate that will moderate over time.
Source: CLSA, Sofun
Chart 11
Source: DB, Haver Analytics, PBOC
Chart 12
Source: CLSA, PBOC data
Chart 13 Slowdown in credit growth to NBFI’s
China FX reserves stabilising (USD)
Chinese Housing Inventory destocking
Deutsche Bank 16Torsten Slok, [email protected] +1 212 250-2155 October 2017
China's FX reserves stabilizing
Source: PBC, Haver Analytics, DB Global Markets Research
$3.1trn
Section 1: Global and regional overview Asia Maxima
3Q17 [email protected] 15
dependence on wholesale financing. Still it has been addressed over the pastyear by raising short-term funding costs and, since earlier this year, imposing new rules requiring the banks to bring more loans back on balance sheet. For example, the PBOC has since 1Q17 started to include off-balance sheet WMPs in its so-called macro prudential assessment framework.
China credit growth and nominal GDP growth
Note: Domestic credit includes loans and other claims on government, other financial institutions and non-financial sectors. Source: PBOC, CEIC Data, CLSA
The primary focus of the regulatory drive has been, correctly, on inter-financial sector claims. This is why the best evidence of the squeeze on shadow banks remains the sharp decline in the growth of credit extended by deposit taking banks to non-bank financial institutions. Thus, the growth in depository corporations’ claims on other financial institutions has slowed sharply from a peak of 73.7% YoY in February 2016 to 15.9% YoY in May (see following chart). Indeed the level of such claims peaked at Rmb28.4tn at the end of March and has since declined by 2.6% to Rmb27.7tn at the end of May. Meanwhile the regulatory focus on shadow banking has also coincided with the long running anti-corruption campaign moving into the financial sector in the recent past, a development which is entirely logical.
China depository corporations' claims on other financial institutions
Source: PBOC, CEIC Data, CLSA
5
10
15
20
25
30
35
40 (% YoY)Depository corporations' domestic credit growthRenminbi bank loan growthSocial financing outstanding growthNominal GDP growth
(40)
(20)
0
20
40
60
80
0
5
10
15
20
25
30 (Rmbtn) (% YoY)Depository corporations' claims on other financial institutions%YoY (RHS)
The regulatory focus on inter-financial sector
claims
Consumption 12 months ago Current units % changePassenger Car Sales 2.071 2.186 mns 5.6%
Retail Sales 2753.96 3032.97 tns 10.1%Air Passenger traffic 43.5 48.6 mns 11.7%
Railway Freight 1689.29 1936.35 mt 14.6%Household Electricity Consumption 87.7 102.1 bn kwh 16.4%
Manufacturing 12 months ago Current units % changeSteel Production 68571 74594 Aug mt 8.8%
Cement production 217.72 211.85 Aug mt -2.7%Residential Property Sales (Value) 5.7043 6.5156 RMB Tns 14.2%
Industrial Production 6.30% 6.00% -4.8%Total Power Generation 0.562 0.595 m kwh 5.9%
Caixin manufacturing PMI (index) 50.4 52.4 4.0%
Source: Chester AM, Bloomberg
China pulse looks reasonably strongChart 14

Chester High Conviction FundMarket Commentary
What happens to Shale Oil?A Ponzi scheme is defined as an investment scam that pays existing investors out of money invested by new investors giving the appearance of profits where there are none. During the recent reporting season, we were privy to a comment that BHP had taken USD40bn and 6 years to work out that shale oil is a Ponzi scheme. Whether this is the case is beyond the length and purpose of this note but what is fact is that in 2011 BHP spent USD4.7bn acquiring Fayetteville assets from Chesapeake, USD15.1bn acquiring Petrohawk, and USD17.8bn in capex over 6 years (chart 15) developing those assets. During that time the assets generated a USD4.5bn EBIT loss (USD8.8bn EBITDA gain). If the publicized sale price of USD10bn is to be believed that equates to USD32bn in wasted capital. This may seem trivial to the overall landscape of shale but at the time of the Petrohawk acquisition BHP became the 7th largest independent upstream oil and gas company globally. BHP through Fayetteville and Haynesville has/had an overexposure to gas in the portfolio but if they now believe shale is a Ponzi scheme, when do other shale producers, and what does that mean for oil prices?
The near-term demand picture for oil, despite the market’s bullishness on EVs (including ours) is still strong. Approximate estimates are for 1.5 million barrels per day (mmbbld) demand growth in each of the next 2 years. OPEC nations, namely Libya and Nigeria have surprised on supply growth but ex shale there have been limited recent non-OPEC supply additions. In 2017 OPEC is projecting 0.78 mmbbld in supply growth of which 0.63 mmbbld is coming from the US. In 2018 they are projecting 1 mmbbld in growth of which 0.84 mmbbld is coming from the US. OPEC goes on to project that in 2017 tight crude and unconventional NGLs are delivering 0.63 mmbbld of liquids growth so 100% of their projected US supply growth is coming from what we have colloquially referred to as shale. We are of the view that this growth is highly unlikely.
US supply (chart 16) and more specifically shale is a big swing factor in global oil balances. In late September US shale billionaire Harold Hamm, one of the pioneers of shale (currently Chairman of Continental Resources) stated EIA had overestimated US oil growth by 100%. His point being that EIA had underappreciated that US drillers are now becoming more disciplined in their drilling. In the same week Anadarko announced a USD2.5bn share purchase program, rather than investing that money in growth for growth’s sake. The fact is that production profiles showed a massive leap to 2010 but since then things haven’t been quite as euphoric. Technology cost savings are real in the shale industry, but of these savings, only about 10 percent is technology driven and about 90 percent is because “oil field service companies have slashed prices to survive”. Advances in US technology have resulted in higher early production rates however these are often accompanied by increased decline rates (chart 17). Borrowing a mining euphemism, shale has experienced “high grading” in that the productive areas I.e. liquids rich Tier 1 quality drilling locations in the Eagleford and Bakken have been drilled first. This is showing up in the data in that the last 5 months of US oil production has shown relatively flat oil production but is still expected to grow strongly in 2018.
The last point we will make on global oil is the IPO for an interest in the worlds largest company, Saudi Aramco. Not unlike our thinking of private equity pumping up the numbers of a company before a float, the numbers must look good to ensure the highest price. Hence the kingdom is highly incentivised to see a higher oil price. Possibly a conspiracy theory, but when aligned to slowing production from US Shale, the stars may well align for the oil price over the next 12 months.
Source: Chester AM, BHP annual reports
Chart 15
Source: EIA
Chart 16
Source: Drilling Info & Labyrinth Consulting services Inc
Chart 17 US Shale fields decline rate accelerating
But the US is expected to grow strongly
BHP’s wealth destruction on Shale
USDm Capex EBIT EBITDA
FY12 3,293 -140 1,300
FY13 4,816 -287 1,508
FY14 4,226 -156 2,270
FY15 3,682 -1,387 2,036
FY16 1,239 -1,756 692
FY17 575 -777 1,004
Total 17,831 -4,503 8,810
Note some liberties have been taken in this for ease of communication. We re-fer to all liquids as “oil” and US unconventional as shale despite it technically being tight oil and gas as much as shale.
-1.0
-0.5
0.0
0.5
1.0
1.5
2.0million barrels per day
Non-OPEC crude oil and liquid fuels production growth
2016
2017
2018

Chester High Conviction FundMarket Commentary
Balance Sheet RecapitalisationWe always frame our idiosyncratic (stock specific) decision making around three key risks, namely operating, financial and corporate governance risks. These are the most likely risks to bring about a poor decision at the individual company level. The one risk that we find the easiest to mitigate is financial risk (touch wood). Paying close attention to the leverage, interest coverage and debt characteristics (maturity profile) should mean no unforeseen events that derail the share price. Often, the problem with interest cover lies in operating cash flow, or an inability to roll over debt at maturity, or as per the GFC, the world freezes up and nobody lends to anyone.
Historically stocks that are too highly leveraged trade at discounts to stocks that have appropriate gearing. We have found many instances where the finance risk has been removed (a capital raising, asset sale, or significantly higher cash flows) the share price (equity value) will be re-rated as a direct result of the debt over hang being removed. We have also found that companies with too much debt spend a lot of management time focusing on this issue, with cost cutting, head count reduction, renegotiating maturity dates and often take their eye off the more strategic and arguably more important issues such as employee engagement, customer satisfaction, market share and new business opportunities. But when a company is weighed down by too much debt, it does become all consuming, to the detriment of the future cash generation.
We have highlighted here three examples over the past 8 years where we have (in different roles) added significant alpha (performance) by investing at the point in time when companies no longer had an insurmountable debt burden. All three companies actually operate in industries with relatively predictable cash flows (Elders does have some commodity price (cattle) exposure) while Capitol Health is a Diagnostic Imaging provider. It has high fixed costs (radiologists) but with the right staffing levels and volumes, generates predictable cash flows.
Wesfarmers raised AUD2.8bn close to the bottom of the GFC (along with many other companies), the share price did close 2009 at AUD32, or a 124% gain from the equity raising price. The gain was partly due to the imminent removal of any financial risk, and with it, a higher equity valuation, and partly due to improved operating performance at Coles and the coal division.
Elders Rural Services had been hamstrung for years by Futuris, particularly the Automotive and Foresty businesses, which bled cash. Selling these assets, shoring up the balance sheet and reducing corporate overheads ensured that Elders Rural Services could start competing in its core business again. The share price rose 124% from the September 2014 capital raise over the next 12 months.
Capitol Health (CAJ) had been the victim of aggressive gearing by a former CEO who went on a buying spree to gain market share. With a downturn in the industry, volumes fell as did CAJ’s ability to service that debt. Removing that debt overhang in March 2017 has seen the share price rise 100% over the past 6 months. Through an asset divestment, it is now in a net cash position with volumes looking much stronger.
One of our screens internally looks at companies that have a significant debt burden. We have a narrow subset of 4-5 stocks that look extremely interesting should they be in a position to remove this financial risk.
Source: Bloomberg, Chester AM
Chart 18
Source: Bloomberg, Chester AM
Chart 19
Source: Bloomberg, Chester AM
Chart 20 Capitol Health Recap March 2017
Elders Recap Sept 2014
Wesfarmers Recap January 2009
$0.00
$0.05
$0.10
$0.15
$0.20
$0.25
$0.30
$0.35
$0
$5
$10
$15
$20
$25
$30
$35
$40
$45
$50
$0.00
$0.50
$1.00
$1.50
$2.00
$2.50
$3.00
$3.50
$4.00
$4.50

Chester High Conviction FundMarket Commentary
The Cobalt ProblemThe most obvious megatrend at play globally in 2017 is the rise of Electric Vehicles (EV’s). We wrote about this in our July Quarterly and touch on it again now. The trend for countries (Norway, France, Germany, UK etc) to start phasing out internal combustible engines (ICE’s) vehicles by 2030 has led the way for many Automobile manufacturers (chart 21) to start forecasting how they will respond to this regulatory change. The announcement by China on September the 8th that they would also look to phase out manufacturing of ICE’s for EV’s has really transformed the battery market. Note China has not yet set a date for the end of ICE manufacturing, but it does produce more than 30% of the world’s cars. The estimated demand for EVs at 10m by 2025 has significant forecasting error based on what timeframe China decides to embark on this EV only push.Given the large investment needed in battery manufacturing capability, we have always been of the view the biggest bottleneck to any exponential growth in the EV market is the raw materials. These planned Gigafactories (chart 22), will not reach capacity unless they are able to access the lithium, graphite, nickel and cobalt needed to construct the lithium ion batteries. There has been (led by Tesla) a step away from lithium manganese ore (LMO) and lithium ion phosphate (LFP) batteries towards nickel manganese cobalt (NMC) batteries. This is driven predominantly by Tesla’s desire to improve safety, slow degradation, increase range and most importantly, acceleration (if you’re a Tesla driver). the trouble is the ability for battery manufacturers to find reliable sources of cobalt with increasing production demands. Right now the world produces around 100kt of cobalt and this is forecast to rise to 200kt in the next 10 years as NMC battery demand increases. The problem being 90% of cobalt is currently produced as a by product of copper and nickel mines, while around 65% of cobalt production originates in the Democratic Republic of Congo (DRC). Chinese companies have foreseen this issue arise and have purchased stake’s in the biggest producing assets in the DRC as a way of securing access to around 60% of the global cobalt production.Volkswagen (VW) is leading the European effort to find a reliable source of cobalt by putting out to tender a ten year offtake agreement for 16-24kt of cobalt. Note, this is 16-24% of current cobalt production, for one car company. To this point, they have been unsuccessful in finding any offtake partner. In the past 18 months, cobalt has risen from USD10.50/lb to currently USD28.00/lb. It appears to us the incentive price will have to rise further to entice the copper and nickel producers to increase output, which may end up producing cobalt with nickel or copper as a by product, rather than the other way around. UBS concluded recently that cobalt demand would need to rise by 1928% to support an annual EV base of 100m units, which is forecast by 2040. The problem being simply, we know what the demand profile looks like, we just don’t know yet what the supply of cobalt looks like, and the incentive price needed to create the supply response to meet this demand. We are spending considerable time on this cobalt shortage and in Australia see 4-5 very interesting ways to gain access to this cobalt thematic. To read in more depth around the cobalt issue, we suggest reading “The cobalt cliff will crush Tesla’s business” written by John Petersen and published on Seeking Alpha.
Source: Primarily International Energy Agency Global EV Outlook
Chart 21
Source: Cleanteq
Chart 23 Cobalt demand
10m Electric Vehicles by 2025 or more?Carmaker Targets
BMW 100k EV sales in 2017, 15-25% of the BMW group sales by 2025
Chevrolet 30k annual electric car sales by 2017
Chinese OEMs (incl BYD) 4.5m annual electric car sales by 2020; ~7m by 2025 with speculation China is looking to ban sales of Internal Combustion Engine Vehicles by 2030-2040
Daimler (inc Mercedes) 100k annual electric car sales by 2020. 15-25% of production being electric by 2025
Ford 13 new EV models by 2020
Honda 2/3 of the 2030 sales to be EV's (including hybrids, PHEVs, BEVs and FCEVs
Mazda ? Plans to be revealed - tie-up with Toyota to accelerate strategy
Renault- Nissan 1.5m cumulative sales of electric cars by 2020
Tesla 500k annual sales by 2018, 1m sales by 2020
Toyota ? Plans to be revealed - tie-up with Mazda to accelerate strategy
VW (inc Audi) 2-3m annual electric car sales by 2025
Volvo 1m cumulative electric car sales by 2025
Planned Gigafactories to be builtChart 22
Source: Galaxy Resources, Benchmark Minerals
0
20
40
60
80
100
120
2015 2025
kt
Cobalt Demand
262% growth over ten years

Chester High Conviction FundMarket Commentary
Artificial IntelligenceWe read with interest recently that Alibaba (one of our holdings) is going to invest more than USD15bn in R&D over the next 2-3 years. Its research areas will cover data intelligence, the Internet of Things, fintech, quantum computing and human-machine interaction. Within those areas, it will focus on real-world applications like machine learning, network security, visual computing and Natural Language Processing. In the context of what USD15bn means, across the ASX 300 Universe, i.e. the entire stock market in Australia, we estimate that Australian companies spend less than USD5.0bn per annum on R&D. So one Chinese company, is spending more on R&D than the entire ASX. This is an estimate, as by and large Australian companies aren’t compelled to report R&D spend, and for many companies (banks, large retailers, telco’s) the R&D spend actually appears in IT costs, where it is often capitalised. So does this represent a threat, or an opportunity? We do come across many ASX listed entities that are genuinely world class companies with disruptive technology, but most are at the mid to smaller end of the market. While we don’t intend to list all of them, we do find the opportunity set very compelling for Capitol Health (CAJ) with their 25% ownership in Enlitic. Enlitic was ranked by the MIT Technology Review as the 14th smartest company in 2016, ahead of Facebook. Enlitic uses deep machine learning to improve clinical outcomes in assessing diagnostic images for the health care industry. The goal of Enlitic software is simply to assist doctors and radiologists make more accurate decisions, in a more timely and productive manner. Enlitic’s first technical proof-of-concept was to develop automated methods to support early detection of lung cancer, which leads to the best chance of survival. They adapted deep learning technology to ingest 3D lung CTs, automatically detect small lung nodules, and estimate their probability of malignancy. These tests have proven that Enlitic’s algorithm as a 50% better chance at a correct diagnosis than human experts. This software has been in development for 4-5 years, and is now being rolled out to clinical radiologists to assist in improving the quality and cost of diagnostic care, while improving the productivity of radiologists (i.e. directing the focus to the most clinically relevant aspect of the image). Capitol Health has the licence to sell the Enlitic software across the Asian region (including China), where clinical outcomes are far inferior to those experienced in developed markets. We value CAJ at AUD0.35 per share on it’s current cash flow profile (currently trading at AUD0.28 per share), which allows for no value for the Enlitic opportunity, which we see as significant blue sky, should the software prove commercially successful. While it is still pre revenue, Enlitic did recently win a European challenge as judged by Steve Wozniak for developing technology with the greatest potential to positively impact the world. We also look at a range of other technologies that appear conceptually interesting, but haven’t met our criteria for identifying why they are on a path to sustainable cash flow growth. One of these conceptually interesting companies (on our watchlist) is Fastbricks Robotics (FBR). FBR has developed the Hadrian X, which is a globally patented 3D robotic bricklaying system. It has recently won a contract in Saudia Arabia for a pilot project and has signed an MOU with Caterpillar for manufacturing and distribution. It’s worth watching.
Source: MIT Technology Review, 2016
Chart 24
Source: Capitol Health, Enlitic
Chart 25
Source: Fastbricks Robotics
Chart 26 Automated Bricklaying Machines
Enlitic Deep Learning Imaging software
50 Smartest Companies Globally (extract)
1 Amazon 11 First Solar
2 Baidu 12 Nvidia
3 Illumina 13 Cellectis
4 Tesla 14 Enlitic
5 Aquion Energy 15 Facebook
6 Mobile Eye 16 SpaceX
7 23andme 17 Toyota
8 Alphabet 18 Airware
9 Spark Therapeutics 19 IDE Technology10 Huawei 20 Tencent
MIT Technology Review

Chester High Conviction FundMarket Commentary
Accounting QualityThis notes purpose is to illustrate how we think about companies during reporting season and how we assess the quality or otherwise of a result. For examples we have used two well known and high quality companies. CSL and Ramsay Healthcare (RHC), to summarise, we think CSL represented a stronger set of accounts and we are more justified paying a higher multiple (PER) for CSL than RHC, all else being equal. We do readily admit we are comparing a hospital operator with a pharmaceutical company. So this is not necessarily a like for like comparison. The first thing we assess when looking at a company’s results is the EBITDA number (Earnings before Interest Tax Amortisation and Depreciation) to the operating cash flow figure. We simply look at the cash receipts less cash payments, and then adjust for the change in working capital to try to reconcile the gross cash flow to EBITDA. In the case of both CSL and RHC, using this calculation, they both offered very strong cash conversion, although it should be noted that using simple reported numbers, CSL grew cash flow at 20%, while RHC only grew at 1.4%, although we do note that these accounts for RHC are stated in AUD, where the impact of a stronger currency diminished the reported growth by around 4%. So CSL had far superior cash flow growth in the FY17 financial year.The second issue we examine closely in accounts is the difference between statutory profit and underlying profit. We readily admit from year to year there will be items that are from an accounting perspective treated as abnormal, and are therefore excluded from “underlying” profit trends. It’s just how often these “abnormals” recur that is of interest. We are heavily focused on assessing how management teams are remunerated, where in most cases, the STI’s and LTI’s are assessed on underlying profits. In the case of RHC, this is how they define “core” profit. This example should be seen as an illustration, rather than any negative assessment of RHC’s reporting standards, but in chart 26, we illustrate how over the past 5 years (we could go back 10 years), RHC has consistently adjusted “non core” expenses from “core” expenses, which is how the management team is remunerated. While this in one sense raises awareness of this issue, we can say in the case of RHC, at least they are consistent in their use of “non core” items, and they do fully disclose what these items are. This is more than can be said for other companies. It is most often the grey area of “Acquisition, disposal, impairment, restructuring, development costs and profit/loss on disposal of non current assets” that creates “flexibility” for how management wish to present information.The third area we look to is how conservative the accounting treatment is for particular issues. CSL for example, chooses to expense all its R&D spend, it always has. Chart 29 highlights that more than half (in FY17 USD400m of USD645m) was R&D spent on new product development. Companies working on “new markets or products” are justified in capitalising this spend (i.e. put it on the balance sheet rather than expense it through the P&L). In most companies then, USD400m would be an asset on the balance sheet, not written off in the year that it was spent. Using a 30% tax rate, notionally CSL could report a net profit USD280m higher, or 21% higher than they actually reported. We are also aware that in FY17, they chose to write down around USD190m of inventory, mostly to do with the flu business, but in more aggressive accounting treatment, they could have decided not to write some of this inventory off. In other words, the net profit could be far higher and therefore headline PE for CSL could be far lower with more aggressive accounting treatment. We have run out of space to talk about the reason to be excited about the R&D spend, which is a potentially transformational product to treat cholesterol in arteries. In any case, we find running through these relatively simple steps crucial in assessing the quality of a company’s accounts.
Source: Chester AM, company accounts
Chart 27
Source: Chester AM, Ramsay Annual Reports and presentations. Note the years with an * represent before tax adjustments.
Chart 28
Source: CSL FY17 presentation
Chart 29 CSL R&D (USD) is all expensed
Ramsay Healthcare non core items
Cash Conversion CSL and RHCRHC 2017 2016underlying EBITDA 1313.9 1268.9growth 3.5%Cash Receipts less cash payments 1211.2 1233.91Change in working capital 83 42Gross operating cash flow 1294.2 1275.91growth 1.4%Cash conversion 98.5% 100.6%
CSL (USD) 2017 2016underlying EBITDA 2163 1749growth 23.7%Cash Receipts less cash payments 1802.3 1565.7Change in working capital 327 205Gross operating cash flow 2129.3 1770.7growth 20.3%Cash conversion 98.4% 101.2%
2017* 2016 2015 2014 2013
Core Net Profit 542.7 481.4 412.1 346.2 266.4
Non Cash portion of rent expense relating to leased UK hospitals -15.6 -15.9 -16.6 -17.3 -15.1
Amortisation - Service concession assets -3.3 -3.1 -2.9 -2.8 -2.3Acquisition, disposal, impairment, restructuring, development costs and
profit/(loss) on disposal of non current assets-34.6 -22.7 -11.8 -14.4 -7.7
Former CEO's unvested performance rights -or employees share plan -8.6 0 -9.9
Borrowing costs associated with refinancing -12.0 0Impact of change in French corporate income tax rate on deferred tax
balance, or tax consolidation legislation (2012)13.5
Pre tax (if allocated) -74.1 -28.2 -31.3 -44.4 -25.1
Income tax expense on non core items 23.1
Non controlling interest in non core items (net of tax) -2.8 2.9 4.7 2 0.6
Net non core items (net of tax) attributable to members of the parent -53.8 -25.3 -26.6 -42.4 -24.5
Statutory Profit 488.9 450.3 385.5 303.8 241.9
0
100
200
300
400
500
600
700
FY12 FY13 FY14 FY15 FY16 FY17
New Product Development Market Development Lifecycle Management

Chester High Conviction FundMarket Commentary
Portfolio Construction
This is a conceptual representation of how we think about building a diversified portfolio. Generally we look to invest at least 70% of our capital in sectors that display predictable cash flows, while between 15-25% can theoretically be allocated to more cyclical sectors of the economy. We use cash traditionally as a balancing item, where we prefer to hold a small cash buffer in the expectation that if opportunities present themselves, then we are not capital constrained in our thought process. Note our portfolio construction does not take into account any index weights in any way. In that sense, our approach to investing money is completely benchmark unaware.
Most of our portfolio is invested in stocks that can grow cash flows in a sound industry structure. These are often associated with companies with strong barriers to entry and assets that are difficult to replicate. If companies do display these characteristics, they often have higher valuations attached to those cash flows as investors “pay up” for quality. The most obvious company in our portfolio that has these characteristics is CSL. We touched on this in our last quarterly thoughts (July) when we highlighted 5 stocks that we believed could double cash flows over 5 years. It should be noted that if we are investing in Asian stocks, they will all come from sectors that are predictable in nature, being Technology, Infrastructure, Health care or Consumer names.
Of course this universe is conceptual in nature. We would point to Health care stocks such as Mayne Pharmaceuticals and Healthscope as stocks that theoretically should display predictable earnings, but over the past 12 months disappointing earnings (downgrades) has led to extremely volatile share price performance. Arguably both stocks now screen as reasonable value, but only if we draw the conclusion that we are confident in the cash flow outlook, which will require due diligence.
Many of these other sectors (Paper and Packaging, Technology, Consumer Staples etc) also have individual stocks that are not necessarily “predictable” in cash flow generation, and as such we emphasise again the conceptual nature of this framework, as in reality, our decision making is very focused on individual companies. From our experience, we have seen many companies that seemingly offer predictable earnings, but given the transformation of technology and the interference of government policy, disruption is occurring in many industries that make strategic planning for some companies beyond a 12 month window very challenging. The Australian Electricity market comes to mind.
We do allocate capital to cyclical sectors, while clearly a smaller allocation, we believe strong returns can be generated by these sectors of the economy, by focusing heavily on a valuation margin of safety. The most recent example of this thought process was in the purchase of New Century Resources (discussed on page 4). Given the higher beta (more volatile) nature of cyclical stocks (which also includes an allocation to gold), these stocks often appear at the top of the monthly list of positive or negative performers, but they remain, in aggregate, a relatively small portion of the overall fund holdings.
Individual stocks weights are determined by our conviction level with regards to the discount to valuation, any insight that we have that leads us to have a different view of earnings than the market, and the overall quality of the company - focusing on management, the industry structure and any significant regulatory changes.
Source: Chester Asset Management
Chart 30
Typical Sectors
Health Care
Paper & Packaging
Infrastructure
Utilities
Technology
Financials
Consumer Staples
Typical Sectors
Materials (Building)
Commodities and Energy
Retail

Chester High Conviction FundMarket Commentary
Characteristics of Highly Accomplished Investors
There are no magic ingredients that go into managing money, but we read this through the quarter and we thought it was worth sharing. We are always trying to improve as investors, so always keep these behavioral traits in mind as we make our decisions. This was published by Eric Conley on Seeking Alpha in September, with our additional comments in parentheses.
1. Experience. It is an essential attribute in becoming a competent investor. It is impossible to become proficient in investing without having experienced at least one full market cycle that includes both a bull and a bear phase. Full market cycles take about 4 years to complete, on average. (We are acutely aware of how liquidity can evaporate and PE multiples contract in a bear market, having invested through the Tech wreck and the GFC).
2. Intelligence. It may surprise you to learn that raw intelligence (as measured by I.Q.) is not a reliable predictor of investing competence. In fact, some studies I’ve seen indicate that investors with a very high I.Q are more susceptible to overconfidence than investors with an average I.Q. Overconfidence is a killer in investing. It not only leads to very expensive mistakes, it also hinders the ability to learn from these mistakes. That’s a double-whammy.In my experience, someone with a 120 I.Q. who thinks he’s a 110 is more likely to succeed than a 140 I.Q. who thinks he’s a 160. The former has humility and the latter has hubris. Humility is a winner every time. As Warren Buffett famously said, “The most important quality for an investor is temperament, not intellect.” (Fortunately, we are not blessed with raw intelligence).
3. Self-awareness. It is a trait that is difficult, but not impossible, to learn - if you weren’t fortunate enough to have been born with it. It requires a willingness to look inward, and make an honest accounting of your tendencies towards biased thinking and flawed logic. It’s very hard to do, even for someone like a trained psychologist. But again, it’s not impossible.The rewards for putting forth the effort to become a more self-aware investor are substantial. You will not repeat the same mistakes as often. You will tend to avoid giving in to emotional impulses that have gotten you into trouble in the past. And you will be in a better position to find a strategy that fits well with your natural instincts and decision-making style.
4. Situational awareness. While self-awareness is all about turning inward, situational awareness is about turning outward. It’s about seeing reality as it is, rather than as you wish it to be. Are you the type of person who is quick to conclude that sometimes things just don’t add up? The many ways in which this skill translates into the avoidance of a disaster are obvious. A stock that appears to be unbelievably cheap might be cheap for good reasons. A strategy that seems too good to be true might be bogus. Whenever I find myself salivating to buy a great stock that has been dropping sharply in price, the first thing I want to know is… who is selling it? Do they know something that I don’t?
5. Math skills. Investing is filled with lots of third or fourth-grade level mathematics when it comes to odds, ratios and other percentage plays that can boost your chances for success. Understanding basic probability theory will go a long way. Here’s the good news: All of the math that you will need to achieve competence as an investor can be learned in 10 hours or less. (We may slightly disagree with this notion, but accept that the most important aspect to investing is the keep it simple stupid “KISS” principle).
6. Willingness to learn. No matter how much experience and intelligence you have, you will not reach true competence as an investor unless you are open to learning from your own mistakes, and the wisdom of those who came before you. This can be done through books, training videos, one-on-one coaching or exchanging ideas with someone you look up to. If you think you have it all figured out, you’re probably doomed.
7. Ability to control emotions. In investing, it is always important to have a logical, rational basis for what you are doing. Our emotions are not equipped to deal with probability and randomness, which are two defining elements of investing.The ability to control your emotions in order to make rational decisions consistently is one of the hardest things for investors to master.
8. Discipline. The most successful investors know when to stick to their guns and when to cut their losses. You won’t win on every trade, and you should work hard to admit to yourself when you’re on the wrong side. Having discipline as an investor is not as hard as you might think. If you take the time to develop a plan, formulate a strategy, set specific money-management rules, and have a Plan B ready for contingencies, the rest is automatic.
9. Patience. Investors become competent when they give their strategy enough time to work. I have seen countless investors abandon a strategy at the first sign of trouble. They impatiently move on to the next shiny object that catches their attention. Instead of viewing a short-term loss as a defeat, why not take it as an opportunity to learn and improve your skill set? (We are always happy to reassess the situation if the fundamentals have changed, but if nothing changes, and we believe our thesis is still in tact, then patience will win out).
10. Adaptability. The best investors are good at adapting to changing circumstances. When the facts on the ground change, they ask themselves whether their assumptions are still valid. What they don’t do is bail out of a trade, or a strategy, simply because it has become uncomfortable. (If the facts change, then it is logical to assume we should change our mind).
11. Risk management. Finding a great strategy is all well and good, but it’s all for naught if you can’t stay in the game. Keep a record of your most and least successful trades, and adjust your bets accordingly. If your staying power will be compromised by a potential loss on a strategy or a trade, it’s time to rethink it.

Chester High Conviction FundFact Sheet
What is the Chester High Conviction Fund?• It is a predominantly Australian equities portfolio with the right to
invest up to 20% of its assets in Asia. It will hold between 25-40 stocks
• A Concentrated, high-conviction portfolio• Highly Index unaware, with better sector diversification than the
ASX300 universe• Focus on risk adjusted returns and capital preservation• Portfolio managed for after-tax returns
The Chester High Conviction Fund is a differentiated Australian equity fund in that it has the right, but not the obligation to invest in the highest quality companies listed in Asia, without necessarily taking full emerging market risk. We believe our experience in Asia, having visited China over 40 times in the past 13 years, gives us a unique insight into the most influential driver of the Australian equity and property markets. The approach is long-term, applying a high conviction methodology that seeks to optimise after-tax returns to investors.
The Chester High Conviction Fund is not bound by external indices, allowing the Fund to invest only in those companies that meet its strict investment criteria. While the fund will look very different to the benchmark ASX300 index, we believe it will offer greater sector diversification and therefore, over the long term, offer more appropriate returns for the level of risk investors are exposed to.
The Chester High Conviction Fund is run by Chester Asset Management as the Investment Manager, using Copia Investment Partners as the Responsible Entity and Trustee. NAB is the custodian of the assets.
The Investment ManagersRob Tucker and Anthony Kavanagh have worked together for over 7 years, most recently running the SGH Australia Plus strategy. Rob was the portfolio manager of SGH Australia Plus from October 2013 to February 2017. SGH Australia Plus generated a 18.2% per annum return, after fees during this period. Relative to the 7.7% return the ASX300 Accumulation index delivered this equates to a 10.5% outperformance per annum over more than 3 years.* The Chester High Conviction Fund is run using the same strategy as SGH Australia Plus.
A strong focus on capital preservation The Chester High Conviction Fund will focus heavily on stock specific risk and assesses the operational, financial and corporate governance risks of each investment on its own merits.
Fund at a glanceInception date April 2017
Objective To outperform the ASX300 Accumulation Index by 5%
on a rolling 3 year basis
Fee 95bp base fee plus a 15% performance fee based on
outperformance, after fees, of the benchmark. The
performance fee is subject to a highwater mark
Style Tilt towards quality and growth, but with an emphasis
on a valuation margin of safety
Investment strategy
Invests in a concentrated portfolio of companies
offering outstanding long-term potential. A company’s
weighting is mainly determined by the likelihood of a
company achieving superior returns over 5 years. The
fund has a predominant bottom up stock picking style
overlayed with portfolio diversification and risk
controls.
Active Share This is the % of the portfolio that is different from the
S&P/ASX 300 index. This will range between 70-90%
Benchmark S&P/ASX 300 Accumulation Index
Number of Holdings
Will range between 25-40 stocks with up to 20%#
invested in Asia
Investment universe
Generally within the largest 300 companies listed on
the ASX, plus companies listed in Asia with a focus on
Asian domestic consumption. This increases the
investment universe by 40-50 investable stocks
Typical company characteristics
We look to invest in companies that display sustainable
earnings growth which is characterised by free cash
flow growth. We look for a valuation margin of safety
as capital preservation is a key focus for the fund.
Risk Guidelines • Maximum stock weight
• Large Cap = 8% soft, 10% hard
• Mid/Small Cap = 4% soft, 5% hard
• Asian Stocks = 2% soft, 3% hard
• No less than 25 stocks, no more than 40
• Maximum active sector position = +20% GICS tier 2.
That is no more than 20% over weight one industry
sector.
• Up to 100% invested in ASX300 stocks
• Between 0% - 20%# invested in Asian stocks
• Between 0% - 20% invested in Cash
• Expected Tracking Error 5% – 10% (but not limited)
• Derivative overlay can be taken as portfolio
protection
#This represents a soft guideline. Price movement may move the exposure above this range. 20% exposure will be a hard guideline where stocks will be sold to limit the exposure.
Disclosure Statement: This document is for wholesale and retail investors. Chester Asset Management may hold positions in companies mentioned in this newsletter. This is general information and is not intended to constitute a securities recommendation. Chester Asset Management is not licensed to give advice and does not warrant that past performance is an indication of future performance. A reference to a Fund or a company as to an outlook, or possible factors affecting future performance should not be relied upon or considered as being a statement of likelihood of future performance. While the information contained in this newsletter has been prepared with all reasonable care, Chester Asset Management accepts no responsibility or liability for any errors or omissions however caused. Performance results are presented after all management and custodial fees and after all performance fees and trading costs. All fees are disclosed in the Information Memorandum and is available upon request. Before you make a decision to invest in the Fund you should obtain an Information Memorandum as it contains crucial information including risks. *We note this is a statement of fact of the performance achieved by the fund during the time which Rob Tucker was the only Portfolio Manager making active decisions on the Australia Plus Portfolio. We note performance is the record of the firm not of the individual however past performance has been constructed from publicly available unit price data.