chief executive officer - tie kinetix...consultancy 2,131 1,981 software as a service 3,678 3,305...
TRANSCRIPT

TIE Kinetix N.V. ANNUAL REPORT 2016
A Premium partner

J.B. Sundelin (Jan) Chief Executive Officer
TIE Kinetix

Dr. M. Wolfswinkel (Michiel)Chief Financial OfficerTIE Kinetix


Lost - Yesterday, somewhere
between sunrise and sunset,
two golden hours, each set with
sixty diamond minutes.
No reward is offered,
for they are gone forever.
Horace Mann (1796-1859)
TIE Kinetix N.V. ANNUAL REPORT 2016

6
FINANCIAL RESULTS 2016 2015
Total Revenue 20,250 22,263
EBITDA 2,065 (134)
Depreciation and Amortization Expense 1,280 1,172
Impairment Gain (Loss) - 84
Operating Result 786 (1,390)
Net Income 41 (2,366)
Cash Flow from operating activities 1,500 656
Net Cash Flow generated 1,194 58
SHARE PRICE
Last Trading Day in reporting period 9.35 7.12
Highest 11.74 8.30
Lowest 7.00 3.90
EMPLOYEES (expressed as full time equivalents)
Average Number of Employees 133 149
Average Revenue per Employee 152 149
EQUITY
Total Assets 16,108 15,851
Total Shareholders' Equity 7,123 4,308
Total Equity Instruments 45 45
Total Equity 7,168 4,353
Solvency Ratio 45% 27%
PER SHARE OF ORDINARY SHARES
Net Income 0.03 (1.93)
Shareholders' Equity 4.50 3.55
Number of Shares Outstanding at year-end (x 1.000) 1,593 1,227
Weighted Average Number of Shares Outstanding (x 1,000) 1,475 1,177
Weighted Average Number of Shares adjusted for diluted effect 1,830 1,182
Diluted earnings per share (x 1,000) 0.02 (2.00)
(EUR in thousands except number of employees and per share amounts)
Key FiguresTIE KINETIX N.V. ~ ANNUAL REPORT 2016

7 6 Key Figures
8 Performance Highlights
12 Revenue Breakdowns
15 Key Headlines FY2016 15 Financial Press Releases 15 Subsequent Events
16 Letter from the Chief Executive Officer, Mr. Jan Sundelin
17 Our Corporate Story 17 Corporate Story 18 Key Business Metrics – Financial Year 2016 19 Our Vision 19 Our Mission 20 Our Strategy 20 Our Story 21 Our Company Values 22 FLOW Partner Automation 28 TIEKinetixSubsidiaries&Offices 30 Organization Chart
34 The Supervisory Board
36 The Executive Board
38 Important Information
39 Report from the Supervisory Board
44 Report from the Executive Board 44 Developments and Achievements 45 Accountability of Set Targets and Priorities for 2016 46 Review 2016 47 Management Statement 48 Management’s Discussion and Analysis 49 Revenue Analysis 51 Order Intake 51 Highlights in 2016 54 Risk Assessment & Risks 55 Acquisition Strategy
56 Corporate Sustainability
60 Corporate Governance 60 Legal Framework 60 Shares and Shareholders 61 Shareholders Meeting and Voting Rights 61 Amendment of the Articles of Association 61 Executive Board 62 Supervisory Board 63 Notes on the Company’s Corporate Governance 63 Deviations 63 In Control Statement
66 Consolidated Financial Statements of TIE Kinetix N.V. for the Year 2016
71 Notes to the Consolidated IFRS Financial Statements
82 Notes to the Consolidated Statement of Financial Position
98 Notes to the Consolidated Statement of Comprehensive Income
112 Dutch GAAP TIE Kinetix N.V. Balance Sheet as at September 30, 2016
114 Dutch GAAP TIE Kinetix N.V. Income Statement for the Year Ending September 30, 2016
115 Notes to the Company Balance Sheet
113 Notes to the Company Balance Sheet
121 Notes to the Company Income Statement
122 Other Information
123 Independent Auditor’s Report
128 TIE Kinetix Subsidiaries & Offices
130 Glossary
132 Contact Information
Table of ContentsTIE KINETIX N.V. ~ ANNUAL REPORT 2016

8
133
€ 41 k
€ 7,123k€ 1,500k 1,593k
€ 20,250kNET INCOME
2016:
SHAREHOLDEREQUITY2016:
OPERATIONAL CASH FLOW
2016:
NUMBER OF OUTSTANDING SHARES
2016:
TOTAL REVENUE 2016:
2015: 149
2015: € -2,366k
2015: € 4,308k2015: € 656k 2015: € 1,227k
2015: € 22,263k
Performance Highlights
SOLVENCYRATIO 2016:
2015: 27%
45%
AVERAGE NUMBER OF
EMPLOYEES IN 2016:
TIE KINETIX N.V. ~ ANNUAL REPORT 2016

9
€ 744k
€ 2,988k
7% € 4.50
€ 5,794kOTHER
INCOME 2016:
2016MAINTENANCE AND SUPPORT REVENUE
SAASREVENUE
2016SHAREHOLDER
EQUITY PER SHARE
CONSULTANCY
REVENUE 2016:
2015: € 2,363k
2015: € 3,019k
2016: € 9,818k
2015: € 9,180k 2015: € 3,55
2015: € 6,897k
TIE KINETIX N.V. ~ ANNUAL REPORT 2016

10
The Netherlands & International
2016 2015
Licenses 146 135
Maintenance and Support 651 684
Consultancy 2,131 1,981
Software as a Service 3,678 3,305
Other Income 639 1,860
Total Revenue 7,246 7,965
North America 2016 2015
Licenses 634 468
Maintenance and Support 2,064 2,099
Consultancy 1,295 1,034
Software as a Service 2,831 2,477
Other Income (1) 7
Total Revenue 6,823 6,085
Revenue type by Geographic Region
TIE KINETIX N.V. ~ ANNUAL REPORT 2016

11
France 2016 2015
Licenses 13 80
Maintenance and Support 162 136
Consultancy 313 427
Software as a Service 717 589
Other Income 3 8
Total Revenue 1,208 1,240
DACH 2016 2015
Licenses 113 121
Maintenance and Support 111 100
Consultancy 2,055 3,455
Software as a Service 2,593 2,809
Other Income 101 488
Total Revenue 4,973 6,973
TIE KINETIX N.V. ~ ANNUAL REPORT 2016

12 Revenue Breakdowns (€ x 1,000)
Revenue per Business Line 2016 2015
Integration 11,082 55% 9,540 43%
E-Commerce 1,784 9% 3,145 14%
Demand Generation 3,853 19% 4,237 19%
Analytics & Optimization 2,787 14% 2,978 13%
EU & Other projects 743 4% 2,363 11%
Total Revenue 20,250 100% 22,263 100%
Revenue per Business Line
2016
TIE KINETIX N.V. ~ ANNUAL REPORT 2016

13
Revenue per Region 2016 2015
The Netherlands incl International
7,246 36% 7,965 36%
North America 6,823 34% 6,085 27%
France 1,208 6% 1,240 6%
DACH 4,973 25% 6,973 31%
Total Revenue 20,250 100% 22,263 100%
Revenue per Type 2016 2015
Licenses 906 5% 804 5%
Maintenance and Support 2,988 15% 3,019 14%
Consultancy 5,794 29% 6,897 36%
Software as a Service 9,818 49% 9,180 39%
Revenues 19,507 96% 19,900 94%
Other Income 743 4% 2,363 6%
Total Revenue 20,250 100% 22,263 100%
Revenue per Type Revenue per Region
20162016
TIE KINETIX N.V. ~ ANNUAL REPORT 2016

Marc Lammers,Olympic field hockey coach
“FLOW is not just something that you get easily. You have to work on a lot of details, combine all of the various elements & data and connect them. You have to make it 1 system, make it work together as one. Just like a team of players who work together to accomplish the common goal: become the best together.”

15Key Headlines FY2016
16-10-2015TIE Kinetix and Leaseweb announce Strategic Partnership
18-11-2015Trading update Q4 and full year financial Statements
01-12-2015Order intake in excess of €1 million
09-12-2015Issue of 50.000 shares following conversion of warrants
30-12-2015Publication of Annual report 2015
31-12-2015Issue of 170.536 shares
06-02-2015Update on Reclaim EU Development Grants
05-01-2016Order intake in excess of €1 million
04-02-2016TIE Kinetix suspends Strategic Partnership with Leaseweb
16-02-2016TIE Kinetix appointed as first 3-star partner of Optimizely
04-10-2016Order intake in excess of €1 million
02-11-2016Private offer for the business received
16-11-2016TIE Kinetix rejects private offer
16-11-2016Trading Update Q4 and Full Year Financial Statements
14-12-2016TIE Kinetix issues 16.007 new shares to Management under the Performance Share Plan
Financial Press Releases
Subsequent Events
17-02-2016Trading update: Profitable Operations, Strong Order intake and Losses on EU Projects
17-02-2016Convocation Annual General Meeting of shareholders
04-03-2016Order intake in excess of €1 million
17-03-2016Business integration for Drabbe
29-03-2016Issue of 144.791 shares
31-03-2016TIE Kinetix launches FLOW: the world’s First Self Service Partner Automation Platform
05-04-2016Order intake in excess of €1 million
05-04-2016Voting results of the Annual General Meeting of Shareholders
21-04-2016TIE Kinetix and MarketLogic announce Strategic Partnership
26-04-2016TIE Kinetix and Google announce Strategic Collaboration for Google AdWords
18-05-2016Trading update First Half year FY 2016
04-07-2016Order intake in excess of €1 million
02-08-2016Order intake in excess of €1 million
17-08-2016Trading Update Q3

16
Letter from the Chief Executive Officer, Jan Sundelin
Dear reader,
In the company’s history, the year 2016 will be looked back at as the year of conversion. With the introduction of FLOW Partner Automation all our offerings are brought together into one SaaS platform with a new and appealing user interface. Thanks to impressive efforts from both our Development Team and our Central Marketing Team a successful launch of FLOW was realized, in line with plan, in March. Our new product was very well received and the first commercial contracts for FLOW started coming in even ahead of plan.
In 2016 we have been able to realize further improvement of our bottom line by focusing on marketing and sales of our core strategic product suite, by focusing on value selling in our consultancy projects and by enhancing our back office efficiency. More work remains to be done to bring our performance to the next level to meet best in class market standards.
In 2016, the company also faced drawbacks; the largest one being the news that Google decided not to accept any more new orders for its licensed product Search Appliance (GSA), going to end of life in the medium term, anticipating the replacement of the current licenses hardware product to a hosted SaaS solution. New business that we had scheduled for 2016, particularly in Europe (Germany), suffered from this decision. In 2016 our EU projects team was further reduced, following completion of most of the EU projects. As from 2017 onwards TIE is only participating in one project which is scheduled to be completed at the end of 2018.
In 2017 we will make some significant changes to our Sales organization to bring FLOW to the market. To do this right and find new customers, we will focus on FLOW applications with a proven track record to bring in new accounts in and create dynamics in the Partner Automation market as follows:
For Integration we see a major growth in Business to Government modules and Purchase to Pay applica-tions. FLOW is perfectly positioned for this: with the new set-up of onboarding suppliers and customers, this solution can be implemented for 80% by the customer itself (self-service), which will significantly improve implementation cycles. We will take advantage of this new opportunity in the coming years.
For Google AdWords (in the channel), operating in combination with our Demand Generation solution, we have experienced strong customer attraction with our initiative in co-operation with Google. In 2017, we will put extra focus in all our markets to this very promising revenue opportunity.
With Analytics and Optimization and the introduction of the Google Analytics 360 suite of 6 new products for Big Data, we are able to highlight the value of our solutions allowing us to upsell and cross sell our FLOW solutions. With tail wind generated by Google’s marketing efforts, we will start in Germany and have planned further introductions in our key markets in 2017.
In the past, present and future TIE Kinetix nurtures its entrepreneurial environment, creating the agility to reap the benefits of the rapidly changing market for supply chain integration processes. We plan to grow our profitability in 2017 returning value to our shareholders. More rapid growth of FLOW will require investments in sales and marketing, preferably with equity. Clearly, our current position in the Dutch capital market, our limited access to capital funding and the lack of tradable securities to fund acquisitive growth, is restricting our ambitions with FLOW.
As always, we are very thankful to our shareholders, our strategic partners and customers and last but not least to our world class staff. We proudly look back to a successful launch of FLOW and we are keen to turn FLOW into commercial success in 2017.
Sincerely,
Jan SundelinCEO, TIE Kinetix N.V.
TIE KINETIX N.V. ~ ANNUAL REPORT 2016

17Our Corporate Story
TIE Kinetix was founded in 1987 and started as an Electronic Data
Interchange (EDI) provider focused on the food and distribution
markets within the Netherlands.
2008 Addition of E-Commerce functionality to the product
range. This can be a shop in a shop, but can also be a separate shop. With this, TIE Kinetix became a 100% E-Commerce solutions provider.
2012 Acquisition of Light B.V., strengthening both commercial and
development teams in portal related front-end technologies.
2012 Acquisition of ascention GmbH expanding geographical coverage
and adding skills with respect to business intelligence solutions.
2014 Acquisition of Tomorrow Focus Technologies GmbH (TFT) expanding
coverage in Germany with respect to web business performance, user experience, e-commerce strategy, consulting and hosting.
2016 Introduction of FLOW: the world’s First Self Service
Partner Automation Platform
2000 Initial Public Offering (IPO) and listing on the Amsterdam stock
exchange as an Internet orientated company. Introduction of Extensible Markup Language (XML) support and one of the first companies to offer E-invoicing solutions to companies.
2003 Development of an advanced Catalog Management product
together with an article verification system influenced by the introduction of Radio Frequency Identification (RFID) technology.
2006 Acquisition of Digital Channel (DC). DC’s front-end marketing
solution is in fact the predecessor of TIE Kinetix Content Syndication Platform. Before customers purchase a product, they orientate themselves based on product- and marketing information. This information is made available at the point of sale by using DC’s solutions.
TIE KINETIX N.V. ~ ANNUAL REPORT 2016

18
Key Business Metrics – Financial Year 2016
Revenue Mix Total 2012-2016
Revenue per Business Line
Integration
E-Commerce
Demand Generation
Analytics & Optimization
EU & Other projects
Licenses
Maintenance and Support
Consultancy
Software as a Service
Other Income
0
2016
2015
2016
2015
2013
2012
2014
0
5,000
2,500
10,000
5,000
15,000
7,500
20,000
10,000
TIE KINETIX N.V. ~ ANNUAL REPORT 2016

19Our Vision
Market, Sell, Deliver and Optimize through the supply chain via the web
Our Total Integrated E-Commerce (T.I.E.) view on the digital world enables TIE Kinetix to develop and offer solutions that allow organizations to eliminate inefficient activities throughout their supply chain. Critical information needs to flow continuously and accurately through the supply chain via a number of channels. By automating and simplifying cumbersome steps in marketing, E-commerce and fulfillment
We provide our customers with solutions that facilitate their web-based marketing, sales and fulfillment channel strategy through the supply chain. Leveraging our platforms, TIE Kinetix will be a leading global supplier in providing customers with integrated E-commerce software solutions to facilitate them to increase sales, facilitate productivity, and provide economic vitality to the supply chain.
Our Mission
through indirect channel and supply chain, TIE Kinetix has developed software solutions allowing business to accomplish more with less. Our mantra to the customer is “Making Technology perform so you can focus on your business”.
The Total Integrated E-commerce solution is a proven technology combining our proprietary solutions for Demand Generation, E-commerce, Supply Chain oriented B2B Integration & Integration Brokerage and Analytics & Optimization.
TIE KINETIX N.V. ~ ANNUAL REPORT 2016

20 Our Strategy
TIE Kinetix transforms the digital supply chain by providing Total Integrated E-Commerce solutions. These integrated e-commerce solutions maximize revenue opportunities by minimizing the energy and cost needed to market, sell, deliver and analyze online. Customers and partners utilizing TIE Kinetix consistently benefit from innovative, field-tested technology and are able to remain focused on their core business. TIE Kinetix develops cloud based solutions, backed with over 25 years of proven technology and awards.
Within the TIE Kinetix approach, the company delivers software-based web-centric solutions. These solutions empower organizations to improve their supply chain efficiency and coordination. Our integrated FLOW platforms enable trading partners to work seamlessly together on the major business processes throughout the supply chain: market, sell, deliver, optimize.
TIE Kinetix minimizes the energy needed for the major business processes through the supply chain to maximize revenue and minimize cost. Our Demand Generation platform enables channel marketeers and executives to accelerate demand generation and sales conversion for and through their independent partner community. Our E-Commerce platform provides companies with solutions that facilitate their online sales and transactions. Our Integration
platform enables companies to effortlessly provide, share and control the fulfillment of transactions with trading partners through the supply chain. Our Analytics & Optimization solutions help our customers to optimize the value and revenue of their online business. In 2016 our solutions have converged under the name of FLOW: the world’s First Partner Automation Platform, combining our supply chain integration solutions with our demand generation and E-commerce solutions on the same platform.
Our market focus is at specific markets where our solutions have been successful. These include Media and Publishing, Food Industry, Non Food, Telecom, IT hardware and software, Consumer Electronics, Industry & Home Improvement, Business Services and Office Supplies. Our solutions are sold in combination with strategic partners, through VARs and Distributors, and direct to end-users.
We have a longstanding historic involvement in the development of next generation technologies. Our Development is active in key topical areas such as SaaS, Cloud, Mobile, Semantics, and Interoperability in vital technologies.
Our Story
“We provide our customers with solutions that optimize their web-based marketing, sales and fulfillment strategy through the indirect channel and supply chain. Implementation of the FLOW platform will enhance productivity, increase demand and revenue, reduce cost and add to the bottom line.”
TIE KINETIX N.V. ~ ANNUAL REPORT 2016
20

TIE Kinetix has defined how it wants to
achieve the goals:
» Openness and Honesty.
» Trust and Togetherness.
» Competence and Quality.
21Our Company values
Openness and HonestyWe can only excel as an organization if we work closely with all of our stakeholders on all matters. Working closely together also means that we need to be communicative and as an organization to be open and honest in our dialogue with colleagues, clients, suppliers and shareholders.
Trust and TogethernessOnly from openness and honesty, trust and togetherness arises. We believe that we need to form a team with our colleagues, clients and all other stakeholders in all of our operations, activities and initiatives. Trust and togetherness enable us to reach our common and individual goals together.
Competence and QualityAs a software based company, we continuously build our competence and our quality on an organizational and individual level. We believe with competence and quality, in addition to software solutions, we can add value to all of our stakeholders and further strengthen our competitive edge.
TIE KINETIX N.V. ~ ANNUAL REPORT 2016

Our TIE Kinetix and FLOW Partner Automation clients
22 FLOW Partner Automation
The next generation Supply Chain IntegrationOur supply chain integration technology has transformed the digital supply chain for 30 years:
» we enable the seamless integration of all data, documents, content and information through
(independent) suppliers, trading partners and channel partners connected in any supply chain;
» we ensure a seamless integration with the full technology stack of our customers;
» our solutions maximize revenue potential with minimal efforts for channel partners.
Traditionally, supply chain integration solutions are focused on individual collaboration processes. Such solutions either minimize cost by integrating with partner’ systems on the supply side OR they maximize revenue by integrating Marketing or Sales processes on the demand side. We recognized a growing demand for unified data and analytics across both sides of the supply chain with the purpose to BOTH minimize costs AND optimize revenue potential.
Our next generation supply chain integration solutions provide the seamless integration of AND data, including trading documents, product information, marketing information between trading partners. The added benefit is a full visibility of relevant customer data ready for commercial engagement.
The launch of FLOW Partner Automation from TIE Kinetix in April 2016 marks the next generation of Supply Chain Integration. It brings together BOTH supply side solutions AND demand side solutions in one unified open supply chain integration platform where all solutions work seamlessly together and integrate the supply chain processes for marketing, sales and fulfillment.
FLOW is a self-service portal in which customers can build their own community with partners and suppliers. Low cost, care free and easy to maintain.
FLOW unifies all data, and analytics and intelligence to ensure optimized processes and both the demand side and the supply side of our customers’ supply chain.
TIE KINETIX N.V. ~ ANNUAL REPORT 2016
Our Partners
23
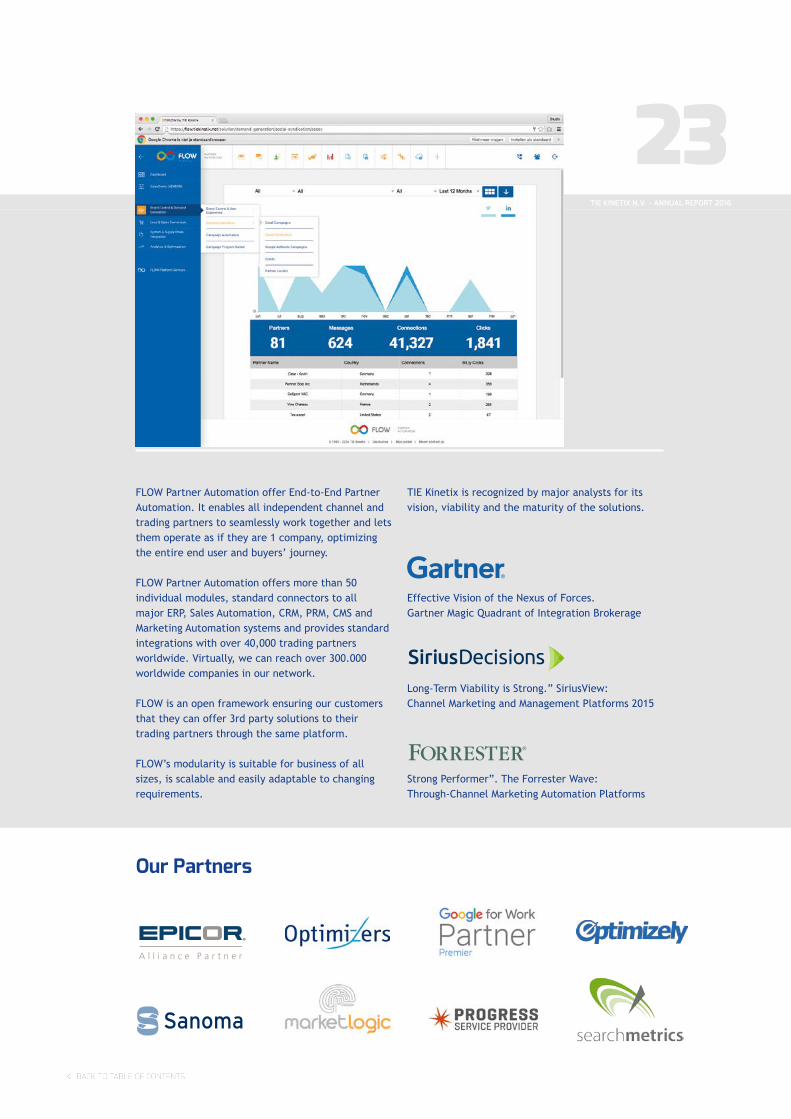
FLOW Partner Automation offer End-to-End Partner Automation. It enables all independent channel and trading partners to seamlessly work together and lets them operate as if they are 1 company, optimizing the entire end user and buyers’ journey.
FLOW Partner Automation offers more than 50 individual modules, standard connectors to all major ERP, Sales Automation, CRM, PRM, CMS and Marketing Automation systems and provides standard integrations with over 40,000 trading partners worldwide. Virtually, we can reach over 300.000 worldwide companies in our network.
FLOW is an open framework ensuring our customers that they can offer 3rd party solutions to their trading partners through the same platform.
FLOW’s modularity is suitable for business of all sizes, is scalable and easily adaptable to changing requirements.
TIE Kinetix is recognized by major analysts for its vision, viability and the maturity of the solutions.
Effective Vision of the Nexus of Forces. Gartner Magic Quadrant of Integration Brokerage
Long-Term Viability is Strong.” SiriusView: Channel Marketing and Management Platforms 2015
Strong Performer”. The Forrester Wave: Through-Channel Marketing Automation Platforms
TIE KINETIX N.V. ~ ANNUAL REPORT 2016
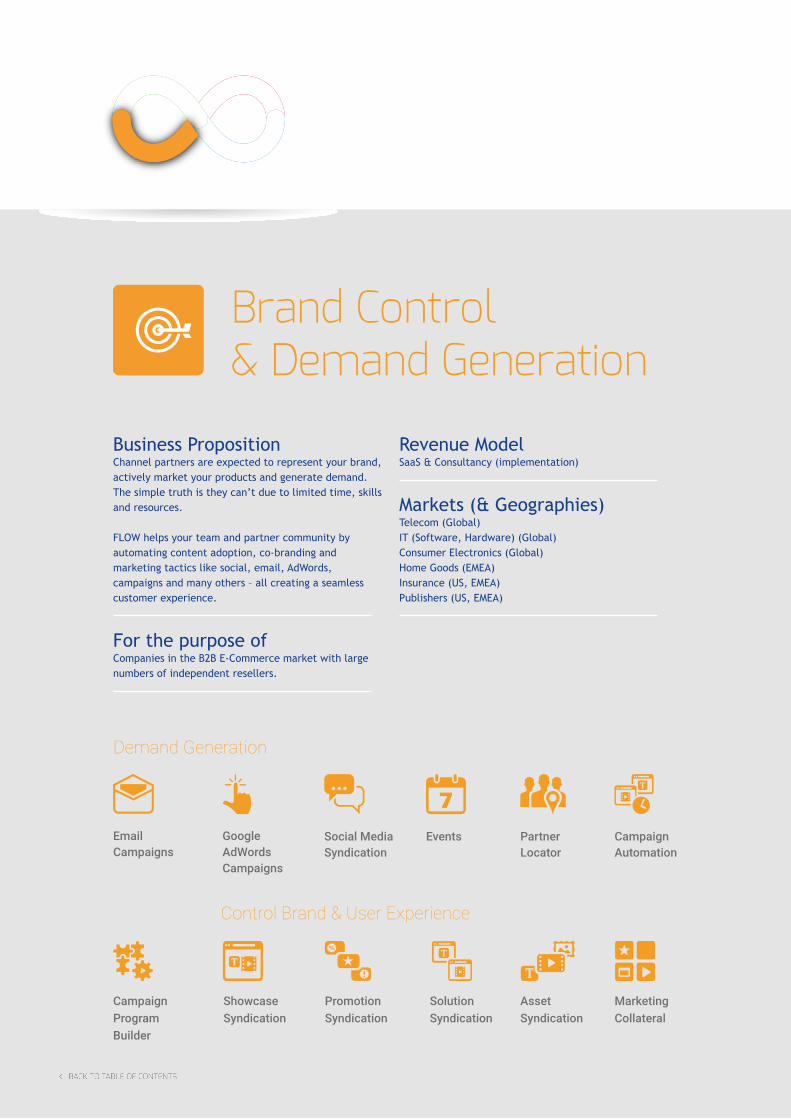
Brand Control& Demand Generation
Business PropositionChannel partners are expected to represent your brand, actively market your products and generate demand. The simple truth is they can’t due to limited time, skills and resources.
FLOW helps your team and partner community by automating content adoption, co-branding and marketing tactics like social, email, AdWords, campaigns and many others – all creating a seamless customer experience.
For the purpose of Companies in the B2B E-Commerce market with large numbers of independent resellers.
Revenue ModelSaaS & Consultancy (implementation)
Markets (& Geographies)Telecom (Global)IT (Software, Hardware) (Global)Consumer Electronics (Global)Home Goods (EMEA)Insurance (US, EMEA)Publishers (US, EMEA)
Social MediaSyndication
Partner Locator
Events CampaignAutomation
G JI KEmailCampaigns
Google AdWordsCampaigns
F H
Demand Generation
Control Brand & User Experience
PromotionSyndication
BCampaign ProgramBuilder
Showcase Syndication
L ASolutionSyndication
AssetSyndication
MarketingCollateral
C D E

25
Business PropositionConverting leads into sales through partners is challenging. Your partners often have limited capabilities to follow up and convert.
FLOW enables partners to convert leads and sell more online by facilitating micro-shops for partners without an e-commerce presence. It helps partners to increase conversion in their existing web shops. FLOW also delivers your sales focused content and tools directly to partner rep mobile devices, desktops and intranets to facilitate the offline sale process.
For the purpose of Companies in B2B & B2C that sell online.
Revenue ModelSaaS & Consultancy (implementation)
Markets (& Geographies)Telecom (NL)Fashion (NL)Distribution (EMEA)Retail (EMEA)
Lead & SalesConversion
TIE KINETIX N.V. ~ ANNUAL REPORT 2016
LeadManagement
Sales ResourceCenter
OLeadQualification
LeadDistribution
M N
Lead ConversionOffline Sales Conversion
Online Sales Conversion
Buy ButtonSyndication
RInlineSyndication
Explore Product Syndication
UpsellSyndication
SyndicatedWebshop
P
S T U V

System & Supply Chain Integration
Business PropositionThe fulfillment process through trading partners often leads to costly manual work, errors and too much paper. You and your partners have limited resources to optimize these processes.FLOW automates inbound and outbound orders, invoices and other B2B and B2G documents between your company, your partners and customers. Easily connect your business systems (ERP, WMS and finance systems) with FLOW. Leverage a rich library of trading partner maps and application connectors to exchange EDI and invoice messages with your partner community.
For the purpose of B2B and B2G companies that integrate and exchange electronic messages with their trading partners in the supply chain.
Revenue ModelSaaS, License (in combination with Managed Services) & Consultancy
Markets (& Geographies)Food & Beverage (US, EMEA)Manufacturing (US, EMEA)Construction (US, EMEA)DIY (US, EMEA)Health & Pharma (US, EMEA)Retail (US, EMEA)Government (NL)
eInvoicing Smart PDF Trading Partner Connections
Y ZBusiness Document Validator
Electronic DataInterchange (EDI)
W X
Business-to-Business SolutionsTrading Partner Connections
eArchivingSystemConnectorsBusiness-to-Government Solutions
eGov Invoicing
YBusiness Document Validator
Electronic DataInterchange - PEPPOL
W aInvoicingPortal eArchiving
SystemConnectors
b
c
d e

Analytics &Optimization
27
Business PropositionFrom sales and marketing to IT, finance and operation, it’s critical for all of your business stakeholders to understand what’s happening throughout your partner ecosystem.
FLOW gives you a 360 degree view on what’s influencing both sides of the demand and supply chain. Leverage actionable data and insights to constantly increase revenue and minimize cost for you and your partners.
For the purpose of To optimize the value of TIE Kinetix solutions and 3rd party online solutions for our customers.
Revenue ModelSaaS, License & Consultancy
Markets & GeographiesAcross all existing markets.
TIE KINETIX N.V. ~ ANNUAL REPORT 2016
Searchmetrics Google Analytics and Big Query
g hGoogle GSA Optimizely
o fOptimization Tools
DataWarehouse
Business IntelligenceAnalytics
Analytics
jBusiness Intelligence
Data Warehouse
Integration Optimization Report
i
k l

28
1 32
TIE Kinetix Subsidiaries & Offices
TIE Kinetix has offices worldwide, with our most important regions being:» The Netherlands» US» Germany/DACH Region» France
On October 1, 2016, TIE has about 133 employees, of which:» About 37% is based in the Netherlands.» About 25% is based in the US.» About 29% is based in Germany/Dach region. » About 6% is based in France.» About 2% is based in Rest of the World
TIE Kinetix has multiple offices over the world. Below the most important offices are listed, with the number of employees and the main activities described:
TIE Nederland B.V. / TIE International B.V. / TIE Kinetix N.V. The Netherlands (Breukelen)
Number of employees: 54 FTEActivities : Headquarters and central back office (finance/legal/administration) – Executive Board and Group Management
– Sales and operations (Integration, Analytics & Optimization) – Development
The operations in The Netherlands are located in Breukelen, along the highway A2.
TIE Kinetix DACH Germany
Number of employees: 41 FTE’sActivity: In Munich TIE Kinetix has an office servicing the German speaking markets in Germany, Austria and Switzerland. This office serves the German speaking market in Europe (DACH region) and is the worldwide headquarter for TIE Kinetix’s Analytics and Optimization products.
TIE Kinetix France SASFrance
Number of employees: 10 FTEActivity: In France TIE Kinetix has an office in Montpellier and satellite sales offices in Paris and Lille. The Montpellier office provides consultancy and customer support and sales.
5
5 Boston
St. Paul

291
4
23
4
TIE Kinetix UKUnited Kingdom
Number of employees: 1 FTEActivities: Representation office for the UK clients.
TIE Commerce Inc – US (St. Paul and Boston)
Number of employees: 36 FTEActivity: The St. Paul office provides product support and maintenance for our integration clients. The Boston office serves the E-Commerce and content syndication market in the US and harbors TIE Kinetix’s sales and marketing and technical development team for the content syndication platform. Part of TIE Kinetix’s management is also stationed in this office. The Boston office also manages the development activities taking place in our off shore development center (Vietnam).
TIE Kinetix Asia-Pacific Ltd.Australia
Number of employees: 1 FTEActivities : Representation office for the Asia-Pacific clients.
MontpellierMunich
BreukelenCrewe
5 6
TIE KINETIX N.V. ~ ANNUAL REPORT 2016
30 Organization Chart
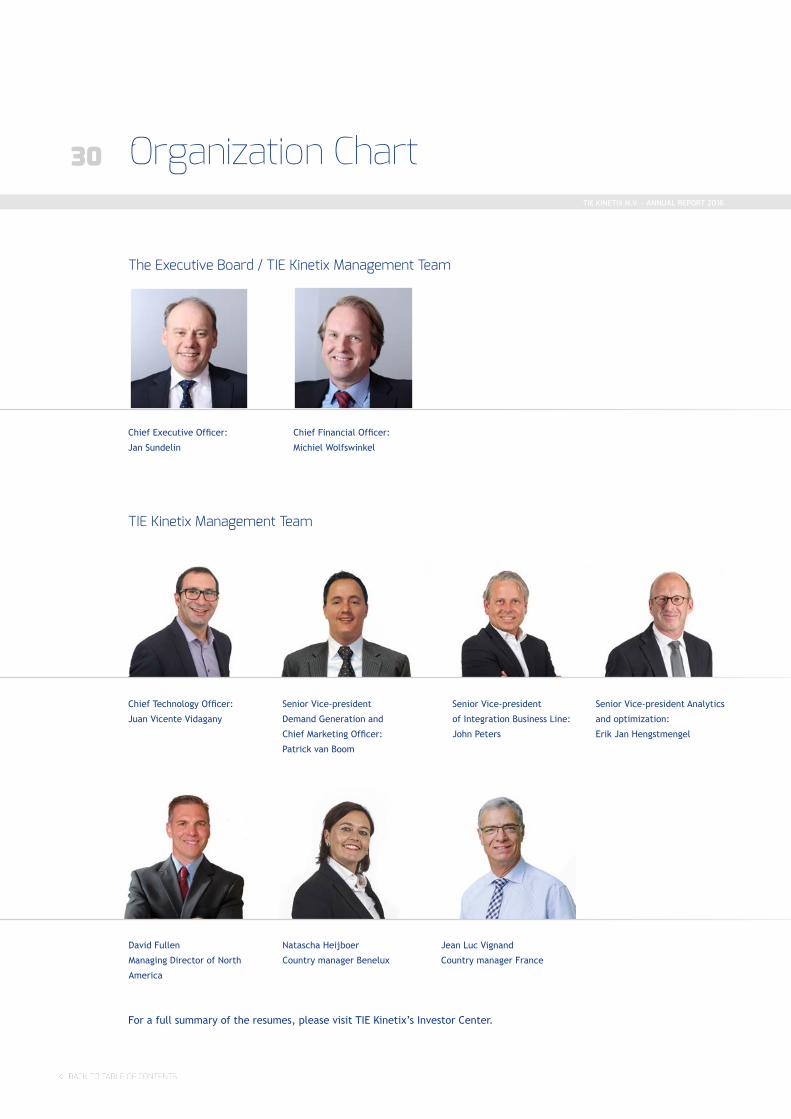
The Executive Board / TIE Kinetix Management Team
TIE Kinetix Management Team
Chief Executive Officer:
Jan Sundelin
Chief Financial Officer:
Michiel Wolfswinkel
Chief Technology Officer:
Juan Vicente Vidagany
David Fullen
Managing Director of North
America
Senior Vice-president Analytics
and optimization:
Erik Jan Hengstmengel
Senior Vice-president
Demand Generation and
Chief Marketing Officer:
Patrick van Boom
Natascha Heijboer
Country manager Benelux
Senior Vice-president
of Integration Business Line:
John Peters
Jean Luc Vignand
Country manager France
For a full summary of the resumes, please visit TIE Kinetix’s Investor Center.
TIE KINETIX N.V. ~ ANNUAL REPORT 2016

31Corporate Management Structure
Chief Executive
Executive Board
Jan Sundelin
Chief Financial
Michiel Wolfswinkel
Chief Technology
Officer
Juan Vicente Vidagany
Chief Marketing
Officer
Patrick van Boom
Senior Vice-president
Analytics and optimization
Erik Jan Hengstmengel
Senior Vice-president of Integration Business Line
John Peters
TIE KINETIX N.V. ~ ANNUAL REPORT 2016

32
The Supervisory Board & Executive Board
TIE KINETIX N.V. ~ ANNUAL REPORT 2016

33TIE KINETIX N.V. ~ ANNUAL REPORT 2016

34
Dr. Ir. A.F.L. (Ton) Veth – Chairman
Gender: MaleDate of birth: October 11, 1946Nationality: DutchPrincipal position: Chairman Supervisory board TIE Kinetix NVOther relevant positions: NoneDate of initial appointment: May 2003 Current term of office ends: May 2019 Supervisory Board memberships of other public companies: None
Ton Veth has a background in electrical engineering (M.Sc) and Medicine (Ph.D). He started the first EDI projects in health care in the 80’s as Director for Cendata B.V. He was appointed as Professor in EDI/eBusiness at the Technical University of Eindhoven (TU/e) in 1992. He was CEO of Cebra, a TU/e research Centre, which was dedicated to advising companies and government institutions on the application of ICT/EDI and the streamlining of their business processes and eBusiness.
The role of the Supervisory
Board is to exercise supervision
over the policies adopted by the
Executive Board and over the
general conduct of business of
the Company as well as to
assist the Executive Board by
providing advice.
In the performance of their duty, the Supervisory Board shall be guided by the interests of the Company, and shall take into account the relevant interests of all the Company’s stakeholders.
The Supervisory Board shall have due regard for the corporate social responsibility issues that are relevant to the Company. The Supervisory Board is responsible for the quality of its own performance.
With respect to the Supervisory Board the new legislation regarding diversity will be taken into account at the moment of new appointments of new Supervisory Board members.
The Supervisory BoardTIE KINETIX N.V. ~ ANNUAL REPORT 2016

35
D. (Dirk) Lindenbergh
Gender: MaleDate of birth: March 6, 1949Nationality: DutchPrincipal position: -.Other relevant positions: NoneDate of initial appointment: March 2014 Current term of office ends: March 2018 Supervisory Board memberships of other public companies: member of the supervisory board of Docdata NV, Midlin NV
Dirk Lindenbergh obtained a Masters of Business Administration from Nyenrode Business Universiteit and studied Business Valuation at Erasmus Universiteit Rotterdam. In 2004 he followed the Advanced Management Program at Nyenrode University. In 2005 he has taken up the supervisory directors program at the same University. He has studied Philosophy at Groningen University. He founded a Company in the gaming industry which he sold in 2000 to ABN Amro Equity and NPM Capital. During the period he has also held directorships within the employers’ organization of the industry on domestic and European level. He holds supervisory positions for Docdata N.V. and Midlin N.V.
Mr. Drs. E.R. (Erik) Honée
Gender: MaleDate of birth: September 23, 1957Nationality: DutchPrincipal position: Informal investorOther relevant positions: NoneDate of initial appointment: May 2008Current term of office ends: May 2020 Supervisory Board memberships of other public companies: None
Erik Honée has a background in legal and organization sociology (Erasmus University, Rotterdam). He has over twenty years of experience as a lawyer and seven years experience as a Merger and Acquisitions consultant. In recent years, he has been a member of the Supervisory Board of Rabobank, Rotterdam (until May 2005) and member of the Supervisory Board of RT Company N.V./Vivenda Media GroupN.V. (until March 2008). Erik is currently Chairman of the Supervisory Board of Applied Radar Technology B.V.,partner at Value and Creation Company (M & A), director of Merula Participaties and Beleggingen B.V., director of Honee Advocatuur Holding B.V. and investor in multiple companies.
TIE KINETIX N.V. ~ ANNUAL REPORT 2016

36 The Executive Board
Chief Executive OfficerJan brings decades of executive management experience to TIE Kinetix. Before joining TIE Kinetix Jan served as CEO and president of TallyGenicom EMEA, where he was responsible for more than € 170mln in revenue. He helped the organization return to profitability by rationalizing operations and restructuring their sales channels, and was responsible for sales and marketing in more than 60 countries.
Previously, Jan served as senior vice president of strategic planning and global sales and marketing for Minolta-QMS Mobile, a company he joined in 1989 as a sales manager and later served as EMEA president. During his tenure as senior vice president of global sales and marketing, Jan was instrumental in increasing worldwide sales from € 250mln to € 300mln. Jan Sundelin is not a member of the Supervisory Board of another listed Company.
J.B. Sundelin (Jan) ChiefExecutiveOfficer
Date of birth: October 21, 1960Nationality: SwedishDate of initial appointment member of theExecutive Board: February 14, 2007Date of announcement reappointment as member ofthe Executive Board: March 27, 2015Current term of office: 4 yearsNumber of shares in the Company: 30,014Number of options in the Company: 21,148Number of warrants in the Company: 11,428
TIE KINETIX N.V. ~ ANNUAL REPORT 2016

37
Chief Financial OfficerMichiel Wolfswinkel (1963) studied Business Economics at the Erasmus University in Rotterdam, Business Law at the University of Amsterdam and holds a PhD in Corporate Finance/Financial Management from the Rotterdam School of Management/Erasmus University. His corporate career started with the AT&T / Unisource telecommunication venture, where he spent some 7 years. He subsequently held several financial management positions, taking restructuring assignments and increasingly complex mergers and acquisitions roles.
When the AT&T / Unisource venture was unwound he held senior financial management roles with MatrixOne and Eneco. At Eneco, he lead the € 250 mln project financing for the off shore wind farm Amalia. In subsequent roles as CFO at the Executive Board of VDM NV and Qurius NV, both publicly quoted companies, he actively worked with capital markets in the US and The Netherlands.
Dr. M. Wolfswinkel (Michiel)ChiefFinancialOfficer
Date of birth: June 11, 1963Nationality: DutchDate of initial appointment member of theManagement Board: November 28, 2013Current term of office: 4 yearsNumber of shares in the Company: 0Number of options in the Company: 0Number of warrants in the Company: 0
TIE KINETIX N.V. ~ ANNUAL REPORT 2016

38 Important Information
Investors in the Ordinary Shares
are reminded that their invest-
ment carries financial risks.
Investors should therefore take
careful notice of the entire
contents of, and disclosures
contained within, this report and
the Financial Statements 2016
(October 1, 2015 September 30,
2016).
Cautionary Statement on Forward-Looking Information. Certain statements contained in this report are “forward-looking statements”. Such statements may be identified, among others by:» the use of forward-looking wording such as
“believes”, “expects”, “may”, “anticipates” or similar expressions;
» discussions of strategy that involve risks and uncertainties;
» discussions of future developments with respect to the business of TIE Kinetix N.V.
In addition, from time to time, TIE Kinetix N.V., or its representatives, have made or may make forward-looking statements either orally or in writing. Furthermore, such forward-looking statements may
be included in, but are not limited to, press releases or oral statements made by or with approval of an authorized executive officer of TIE Kinetix N.V.
Forward-looking statements are subject to risks, uncertainties and other factors that could cause actual results to differ materially from future results expressed or implied in such statements.
Important factors, which could cause actual results to differ materially from the information set forth in any forward-looking statements include, but are not limited to:» General economic conditions;» Performance of financial markets;» Levels of interest rates;» Currency exchange rates;» Changes in laws and regulations;» Changes in policies of Dutch and foreign
governments;» Competitive factors, on a national and/or global
scale;» TIE Kinetix’s ability to attract and retain qualified
management and personnel;» TIE Kinetix’s ability to successfully complete
ongoing development efforts;» TIE Kinetix’s ability to integrate acquisitions and
manage the continuous growth of the company;» TIE Kinetix’s ability to anticipate and react to
rapid changes in the market.
Many of these factors are beyond TIE Kinetix’ control or ability to predict. Given these uncertainties, investors are cautioned not to place undue reliance on any forward-looking statement.
TIE KINETIX N.V. ~ ANNUAL REPORT 2016

39Report from the Supervisory Board
To the shareholders,
As TIE Kinetix’ Supervisory Board we on the one hand advise and supervise the added value and the realization of the company’s goals and strategy. On the other hand we ascertain ourselves that our span of control is aligned with the increasing complexity of the Company. Therefore an overview of what we have supervised and what we have discussed with the Executive Board is included in this report. In the financial year 2016, the Supervisory Board met 14 times and no board members were absent.
Organizational aspectsThe Supervisory Board currently consists of three members. For detailed information of each individual member, reference is made to page 34 of the annual report. During his assignment Mr. Erik Honée holds 1.67 % of the shares (in total 26,600) in TIE Kinetix and as from March 29, 2016, Dirk Lindenbergh holds 9.1% of the shares in TIE Kinetix, through Blikkenburg BV (in total 144,791).
The Supervisory Board is construed in line with best practices provisions as stated in chapter III of the Code (Chapter II of the new Code). With reference to the Code, all three members are considered independent.
The Supervisory Board notes that its composition is in line with the profile of the Supervisory Board. Each board member has his specific field of complementary expertise.
General BusinessThe Supervisory Board supervised and monitored the following:
The achievement of the objectives of the Company and its managementThe Supervisory Board discussed the objectives of the Company and monitored the development of the results and the actual results versus the targets set. The Company aims at growing the business substantially in order to reach the scale, required for a public company, to cover the costs of being “public” and to realize a healthy profit level. First of all, the Company has shown to be able to grow autonomously. TIE Kinetix was again cash flow positive (from operating activities) in
the year 2016. The Supervisory Board monitored the cost structure of the Company and advised the Executive Board on all relevant aspects.
The corporate risk profile and the internal risk management and control systemThe Supervisory Board discussed the Company’s risk profile with the Executive Board and with the external auditor. The Supervisory Board recognizes that the risk profile of TIE Kinetix is adequately understood, monitored and acted upon by the Executive Board in a sufficient way. In the year 2016, special attention was paid to the alignment of the internal IT systems. Also all systems used for delivering services to our clients were carefully screened on their security levels to ensure that all services comply with the highest security levels.The Supervisory Board is satisfied with the structure and operation of the internal risk management and control system and is convinced that its (financial) consequences have been adequately reflected in the Company’s processes and accounting principles.
Audit CommitteeThe Supervisory Board as a whole monitored the accounting and reporting processes in its functions as audit committee. In order to ensure the quality of the financial reporting process and to discuss the findings on the financial statements, the Supervisory Board has met with the Company’s external auditors BDO, both with and without the Executive Board being present. The Supervisory Board closely followed whether the advices of the external auditors received a proper follow up by the Executive Board.
Meetings of the Supervisory BoardIn 2016, the Supervisory Board as a whole met 14 times. Its members met several times with the member(s) of the executive board and the management board team in order to advice and to follow the operations closely.
Apart from the meetings triggered by the monthly and quarterly results, the following subjects were discussed in depth:» Strategy; meetings with the Executive Board
and Management Team members were devoted to all aspects of the chosen strategy, focusing all activities to the FLOW project;
» Product development alignment with the strategy;
TIE KINETIX N.V. ~ ANNUAL REPORT 2016
40 Report from the Supervisory Board
» Positioning the hybrid hosting services;» Remuneration; evaluation personal targets and
targets for the performance share plan;» Evaluation progress on country levels;» Evaluation of a non-binding offer.
Remuneration Policy
The Remuneration Policy outlines the terms and conditions for the members of the Executive Board of the Company. The objective of the Remuneration Policy is to provide a structure that retains and motivates the current members of the Executive Board by providing a well-balanced and incentive based compensation.
According to article 135 of book 2 of the Dutch Civil Code, the Remuneration Policy needs the approval of the General Meeting of Shareholders. On March 27, 2015, the General Meeting of Shareholders has adopted the Remuneration Policy for 2015 and thereafter. The Supervisory Board, within the scope of the Remuneration Policy, will determine the Remuneration Plan, which will be the basis of the remuneration of the members of the Executive Board.
Term of appointmentA member of the Executive Board will be appointed for a maximum period of four (4) years. On expiry of the four-year term, a member of the Executive Board may be reappointed for successive terms of four years each.
Termination of employmentThe contracts with the members of the Executive Board include an arrangement on the notice period required to terminate the contract. The contracts with the members of the Executive Board will not be renewed or will be terminated if the member of the Executive Board reaches the age of retirement, on the date as provided in the relevant pension scheme. Upon termination of the contract by the Company (or by a competent court on request of the Company) and provided that the special circumstances as described in the contracts with the members of the Executive Board do not apply, the member of the Executive Board will be entitled to a severance payment.
Severance PackageThe members of the Executive Board have been
offered a severance package with a maximum of one (1) year’s salary.
Remuneration Executive BoardThe remuneration of the members of the Executive Board may comprise of the following components:» Salary;» Variable compensation in the form of a cash
bonus based on the realization of short term targets and the share based variable compensation as adopted by the General Meeting of Shareholders on March 27, 2015. The share based part was implemented in 2016, in accordance with the Performance Share Plan as adopted by the General Meeting of Shareholders on March 31, 2016.
The salary includes base salary, holiday allowance, pension arrangements and lease vehicles. The remuneration levels are set to reflect the requirements, performance and responsibilities regarding a position in the Executive Board and the targets of the Company. The Supervisory Board will review the salary level of the Executive Board regularly, considering circumstances that would justify adjustments, such as changes in the individual’s responsibilities, the individual as well as collective performance, developments in the business environment and developments in the salary level of personnel in the Company. The Supervisory Board shall evaluate the remuneration structure regularly in order to ensure that it meets the objective of the Remuneration Policy. The contract with the members of the Executive Board includes an arrangement for the reimbursement of all reasonable expenses incurred in the performance of its duties. The variable part of the remuneration is designed to strengthen the Executive Board member’s commitment to the Company and its objectives. An annual bonus is linked to previously determined and objectively measurable performance targets. The Supervisory Board determined the performance targets for each individual member of the Executive Board, based on a long term operating plan. These performance targets reflect the individual responsibilities of the member of the Executive Board, such as, but not limited to, financial results and/or operational results per focus area. The performance targets are based
TIE KINETIX N.V. ~ ANNUAL REPORT 2016

41the General Meeting of Shareholders on March 31, 2016.
LoansThe Company does not grant its Executive Board members any personal loans, guarantees or the like, unless in the normal course of business and on terms applicable to the personnel as a whole, and after approval of the Supervisory Board. No remission of loans shall be granted.
Remuneration report J.B. Sundelin
In 2016, Mr. Sundelin had a base salary of € 250k. The remuneration including expenses (net of option expense) was paid to CAPTA Management B.V., Mr. Sundelin’s consultancy company. The Supervisory Board evaluated the performance of the CEO along the references laid down in the applicable arrangements and decided that the CEO is entitled to receive variable compensation.
Remuneration report M. Wolfswinkel
In 2016, Mr. Wolfswinkel had a base salary of € 200k. The remuneration including expenses (net of option expense) was paid to Mr. Wolfswinkel. The Supervisory Board evaluated the performance of the CFO along the references laid down in the applicable arrangements and decided that the CFO is entitled to receive variable compensation.
The remuneration of the Executive Board is disclosed in detail on page 104.
A.F.L. Veth
Chairman Supervisory Board, TIE Kinetix N.V.
on the Company’s strategic agenda, which includes financial targets. Since these targets contain commercially sensitive information, the exact targets shall not be disclosed. However the information is available for the external auditor of TIE Kinetix.
The Executive Board updates the Supervisory Board on the achievement against the individual performance criteria on a quarterly basis. After the end of a financial year, the Executive Board prepares an evaluation of the past financial year. The evaluation includes the extent to which the individual performance targets have been met. On the basis of this evaluation and its own investigation, the Supervisory Board reviews the performance of the members of the Executive Board and decides whether the performance targets are met and therefore a member of the Executive Board should receive his bonus.The Supervisory Board may take special circumstances into consideration in determining the achievement of the targets.
Remuneration Supervisory BoardThe remuneration of the members of the Supervisory Board remained unchanged in 2016.The date of initial appointment and the current term of end of office of the members of the Supervisory Board is scheduled as follows:» Dr. Ir. A.F.L. (Ton) Veth:
Date of initial appointment: May 2003 Current term ends: May 2019
» Mr. Drs. E.R. (Erik) Honée: Date of initial appointment: May 2008 Current term ends: May 2020
» D. (Dirk) Lindenbergh: Date of initial appointment: March 2014 Current term ends: March 2018
SharesThe members of the Executive Board will not be offered any TIE Kinetix shares without financial consideration, unless the specific approval of the Supervisory Board has been obtained (i.e. the shares are offered (as part of) an annual bonus). Shares in the Company, held by a member of the Executive Board, are long-term investments.
Based upon the Remuneration Policy as adopted by the General Meeting of Shareholders of March 27, 2015, the Supervisory Board has introduced a Performance Share Plan in 2016 as adopted by
TIE KINETIX N.V. ~ ANNUAL REPORT 2016

42TIE KINETIX N.V. ~ ANNUAL REPORT 2016

43
Jim Bovens,Solutions ConsultantTIE Kinetix
“At TIE Kinetix, we continuously invest in the development of our solutions and employees to deliver the best results for our customers and partners.”
TIE KINETIX N.V. ~ ANNUAL REPORT 2016

44
Report from the Executive Board
Developments and achievements in view of the set targets
and priorities
Prior year achievements
Market leader with state-of-the-art Integration products
Strategic partnership with Epicor
Successful conversion from license to SaaS business model
Recognition on Gartner’s Magic Quadrant for Integration Brokerage
Established E-Commerce business in new markets
Established Demand Generation business in the US with successful position and modular product offering
Recognition of Demand Generation business by Forrester
Acquisition Münich based TFT and subsequent expansion of Google Analytics business to the Benelux
Developments in 2016
Strategic partnership with Google AdWords
Launch of FLOW, the world’s First Self Service Partner Automation Platform
TIE KINETIX N.V. ~ ANNUAL REPORT 2016

45
Accountability of set targets and priorities for 2016
2016 was the year of FLOW and the Company fully directed its development capacity to developing the World’s First Self Service Partner Automation Platform. This unique platform, bringing together all of the TIE Kinetix functionality in one single sign on solution was successfully launched at the Annual general Meeting of shareholders on March 31st, 2016. The market launch, including sales training followed thereafter. In the second half of 2016, the Company focused on marketing and sales of FLOW and the further development of functionality within FLOW.
In order to achieve our goals TIE Kinetix set the following priorities for 2016:
Develop and launch FLOW in first half year Successful
Market and sell FLOW in second half year Successful
Expand Google Partnership Successful
Consolidate hosting provisioning Successful
Start to offer all solutions worldwide in all our markets Not successful
Grow US business Successful
Expand Integration to Germany Not successful
Expand Google GSA to France Not successful
TIE KINETIX N.V. ~ ANNUAL REPORT 2016

46 Report from the Executive Board
Review 2016
2016 was the year of conversion: the start of bringing all our solutions together with the introduction of FLOW. FLOW Partner Automation brings all offerings within TIE into one SaaS platform with a future proof user interface. In 2016, our Development Team and Central Marketing Team have been working very hard to achieve this with a successful introduction in line with plan at March 31st. We also closed our first FLOW deals, deals with a value over 50k Euro representing at least two of our Business Lines offerings. In 2016 we have closed 7 FLOW deals, within our installed base but also to new customers such as Xerox, Dell and Svedex. Given the launch only at mid-year, this can be seen as a positive market response towards FLOW, especially when we take into account regular sales cycles of 6-9 months.
Quarter on quarter, we improved our profit line by focusing on the development of our core business, and by optimizing our delivery processes. Our billable rate has gone up but we also recognize more work remains to be done. Our core business is strengthened by the partnership with Google Adwords. This novel product fits well with our Demand Generation solutions and is an ideal tool to enter new accounts for our other FLOW modules. After the partnership announcement the company signed up various large enterprise customers (among which Xerox, Svedex, Michelin and Dell) for a trial phase in the subsequent months.
The news that Google Search Appliance (GSA) in the license model was going to ‘End of Life’ in the mid-term to TIE Kinetix meant that Google was unable to deliver the product to new customers in the license model. This obviously was a serious disappointment to our business developers in Germany and the Netherlands but also prohibited our planned introduction of GSA in France, costing the Company some € 2 million in Order Intake. We do expect, however, to be able to initiate selling the new Google GSA functionality when Google releases that in the SaaS model in the near term.
All invoiced EU damages have been paid. In July 2016 the company was notified by the EC that the remainder of the damages would be dealt with shortly. At this stage we believe that adequate provisions have been created to avoid any impact on future earnings. As from 2017 onwards the company is only engaged in one single EU project that will be completed at the end of 2018.
We are taking important steps towards a centrally managed business model. Certain local roles have been replaced by central management in our Breukelen headquarter. Local roles are now fully focused on customer engagement with central management taking more overhead type roles (IT, G&A, branding, etc.).
Our internal IT landscape has been streamlined by bringing functionality from various business applications back to our core ERP system while outsourcing the maintenance thereof with external professional service providers. More backoffice efficiency materializes in lower cost per unit.
In 2016, the Company redeemed non-current liabilities, comprising of all long term acquisition loans from TFAG and DZ–Bank. The item non-current liabilities/loans in 2016 decreased from € 1,165k (September 30, 2015) to € 9k (September 30, 2016). In the same period current liabilities, short term debt and bank overdrafts, were redeemed from € 1,552k to € 34k. With RABO Bank an (currently still undrawn) overdraft facility was agreed amounting to € 1,250k. At year end, the company is almost completely unlevered.
TIE KINETIX N.V. ~ ANNUAL REPORT 2016

47Integrated Report
TIE Kinetix attaches great importance to Corporate Social Responsibility (CSR), which is an essential component of our business strategy. In this Annual Report, we made provide accountability for both our financial and social performance, and describe how we strive to create added value in diverse areas.
Management Statement
In accordance with the EU Transparency Directive as incorporated in chapter 5.25c paragraph 2 sub c of the Dutch Financial Supervision Act (Wet Financieel Toezicht), the Management Board confirms to the best of its knowledge that:a) the annual financial statements for the year ended September 30, 2016 give a true and fair view of the
assets, liabilities and financial position and comprehensive income of TIE Kinetix N.V. and its consolidated companies;
b) the management report presented in the Annual Report gives a true and fair view of TIE Kinetix N.V. and its consolidated companies as of September 30, 2016 and the state of affairs during the financial year to which the report relates;
c) the annual management report describes the principal risks the Company is facing.
TIE KINETIX N.V. ~ ANNUAL REPORT 2016
48
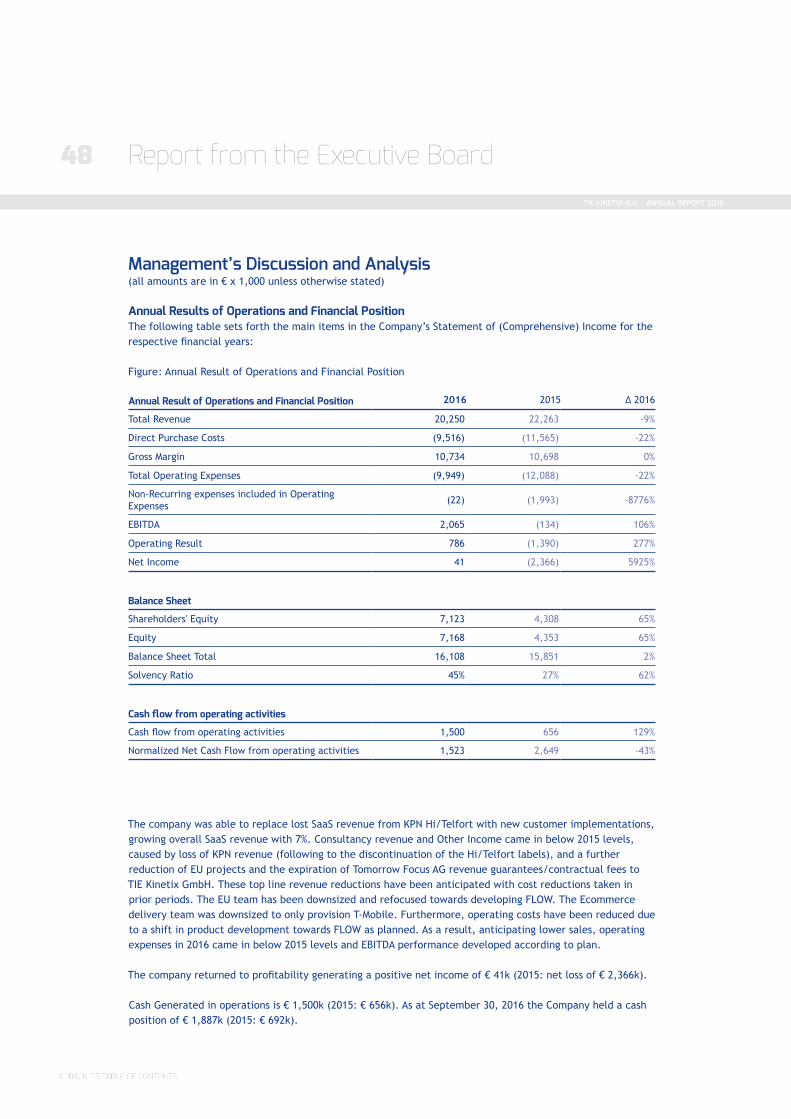
Annual Result of Operations and Financial Position 2016 2015 Δ 2016
Total Revenue 20,250 22,263 -9%
Direct Purchase Costs (9,516) (11,565) -22%
Gross Margin 10,734 10,698 0%
Total Operating Expenses (9,949) (12,088) -22%
Non-Recurring expenses included in Operating Expenses (22) (1,993) -8776%
EBITDA 2,065 (134) 106%
Operating Result 786 (1,390) 277%
Net Income 41 (2,366) 5925%
Balance Sheet
Shareholders' Equity 7,123 4,308 65%
Equity 7,168 4,353 65%
Balance Sheet Total 16,108 15,851 2%
Solvency Ratio 45% 27% 62%
Cash flow from operating activities
Cash flow from operating activities 1,500 656 129%
Normalized Net Cash Flow from operating activities 1,523 2,649 -43%
Management’s Discussion and Analysis(all amounts are in € x 1,000 unless otherwise stated)
Annual Results of Operations and Financial PositionThe following table sets forth the main items in the Company’s Statement of (Comprehensive) Income for the respective financial years:
Figure : Annual Result of Operations and Financial Position
The company was able to replace lost SaaS revenue from KPN Hi/Telfort with new customer implementations, growing overall SaaS revenue with 7%. Consultancy revenue and Other Income came in below 2015 levels, caused by loss of KPN revenue (following to the discontinuation of the Hi/Telfort labels), and a further reduction of EU projects and the expiration of Tomorrow Focus AG revenue guarantees/contractual fees to TIE Kinetix GmbH. These top line revenue reductions have been anticipated with cost reductions taken in prior periods. The EU team has been downsized and refocused towards developing FLOW. The Ecommerce delivery team was downsized to only provision T-Mobile. Furthermore, operating costs have been reduced due to a shift in product development towards FLOW as planned. As a result, anticipating lower sales, operating expenses in 2016 came in below 2015 levels and EBITDA performance developed according to plan.
The company returned to profitability generating a positive net income of € 41k (2015: net loss of € 2,366k).
Cash Generated in operations is € 1,500k (2015: € 656k). As at September 30, 2016 the Company held a cash position of € 1,887k (2015: € 692k).
Report from the Executive Board TIE KINETIX N.V. ~ ANNUAL REPORT 2016

49
Total Income and Income Net of Direct Purchase Costs
2016 2015
Licenses 906 4% 804 3%
Maintenance and Support 2,988 15% 3,019 14%
Consultancy 5,794 29% 6,897 31%
Software as a Service 9,818 48% 9,180 41%
Revenues 19,507 96% 19,900 89%
Other Income 743 4% 2,363 11%
Total Revenue 20,250 100% 22,263 100%
Direct Purchase Costs (9,516) -47% (11,565) (52%)
Revenue net of Direct Puchase Costs 10,734 53% 10,698 48%
Revenue AnalysisThe following tables provide the breakdown of total income by category :
Figure: Total Revenue 2016 - 2015
The Company agreed a new € 1.25 million senior revolving credit facility with RABO Bank. The facility includes a pledge on all receivables, has an indefinite term and bears interest at a EURIBOR based rate. The facility replaces a revolving credit facility of € 0.5 million. Although currently no drawings are scheduled, the Company intends to use any funds borrowed under the Credit Facility from time to time for general corporate purposes, which may include working capital needs, capital expenditures, and satisfaction of other obligations of the Company.
In FY 2016 in total 365,327 shares have been issued, bringing the total number of issued shares to 1,592,704 as at September 30, 2016.
Shareholders’ Equity amounts to € 7,123k (or € 4.47 per share) on September 30, 2016 (2015: € 4,308k, or € 3.51 per share). In 2016, the company redeemed non-current liabilities, comprising of long term debts due to TFAG and credit institutions, from € 1,165k (September 30, 2015) to € 9k (September 30, 2016). In the same period current liabilities, short term debt and bank overdrafts, were redeemed from € 1,552k to € 34k.
TIE KINETIX N.V. ~ ANNUAL REPORT 2016

50
The figure shows that revenue of Software as a Service (SaaS) is growing year on year and is the single largestrevenue driver with 48% (2015: 41%). Revenue from maintenance and support activities is (in €) relatively stable over the years at € 2,988k (2014: € 3,019k). License revenue continues to decrease as our customers prefer SaaS delivery of our solution, in line with TIE Kinetix’ strategy to deliver long term sustainable growth with a SaaS revenue stream. SaaS refers to the delivery of our hosting, webEDI (TiedByTIE), EDI managed services and Value Added Network services; they all are part of the Business Integration Solution. These services are generally provided on the basis of a 12, 24 or 36 months contract whereby fees are based on actual use of the service or a subscription fee or a combination of thereof. SaaS revenue also includes revenue from Demand Generation and E-Commerce; these services are provided on a subscription basis with a fixed contract period, generally 12 months upto 36 months. Revenues are accounted for on a percentage of completion bases based on IFRS standards. Maintenance and Support is the annual maintenance fee for maintenance/updates of sold licenses. Our SaaS our revenue grew with 7%, despite losing customer KPN, some major portal customers in Germany and our inability to continue selling Google GSA (pending Google’s release of GSA as a hosted solution). We experienced a decline in consultancy revenue due to lower activity levels in Germany and France.
Other Income amounted to € 744k (2015: € 2,363k), and predominantly relates to EU Development Projects. In 2016 two more projects have been completed (Alfred and SAM). In 2017 the Company is only engaged in one EU Project (Accept), which is expected to be completed at the end of 2018.
Report from the Executive Board
5-year development of revenue for the period 2012-2016
Licenses
Maintenance and Support
Consultancy
Software as a Service
Other Income
02012 2013 2014 2015 2016
2,000
4,000
6,000
8,000
10,000
TIE KINETIX N.V. ~ ANNUAL REPORT 2016
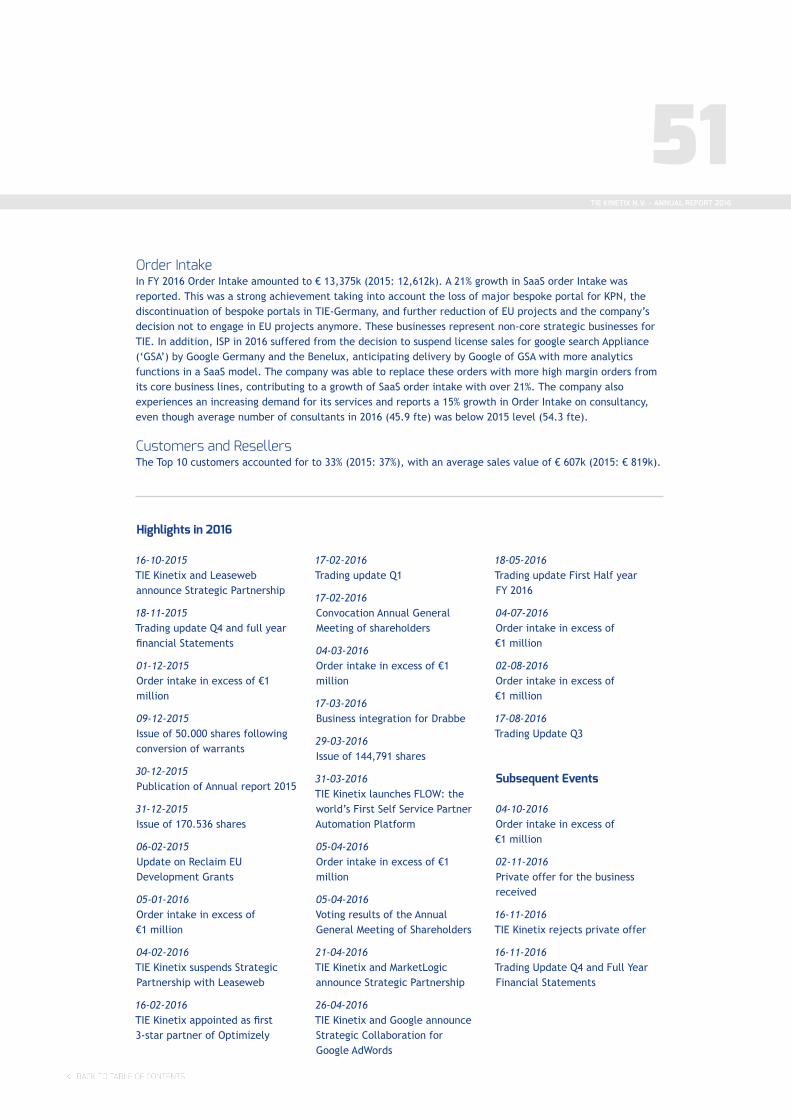
51Order IntakeIn FY 2016 Order Intake amounted to € 13,375k (2015: 12,612k). A 21% growth in SaaS order Intake was reported. This was a strong achievement taking into account the loss of major bespoke portal for KPN, the discontinuation of bespoke portals in TIE-Germany, and further reduction of EU projects and the company’s decision not to engage in EU projects anymore. These businesses represent non-core strategic businesses for TIE. In addition, ISP in 2016 suffered from the decision to suspend license sales for google search Appliance (‘GSA’) by Google Germany and the Benelux, anticipating delivery by Google of GSA with more analytics functions in a SaaS model. The company was able to replace these orders with more high margin orders from its core business lines, contributing to a growth of SaaS order intake with over 21%. The company also experiences an increasing demand for its services and reports a 15% growth in Order Intake on consultancy, even though average number of consultants in 2016 (45.9 fte) was below 2015 level (54.3 fte).
Customers and ResellersThe Top 10 customers accounted for to 33% (2015: 37%), with an average sales value of € 607k (2015: € 819k).
Highlights in 2016
16-10-2015 TIE Kinetix and Leaseweb announce Strategic Partnership
18-11-2015 Trading update Q4 and full year financial Statements
01-12-2015Order intake in excess of €1 million
09-12-2015Issue of 50.000 shares following conversion of warrants
30-12-2015 Publication of Annual report 2015
31-12-2015 Issue of 170.536 shares
06-02-2015Update on Reclaim EU Development Grants
05-01-2016 Order intake in excess of €1 million
04-02-2016TIE Kinetix suspends Strategic Partnership with Leaseweb
16-02-2016 TIE Kinetix appointed as first 3-star partner of Optimizely
17-02-2016 Trading update Q1
17-02-2016 Convocation Annual General Meeting of shareholders
04-03-2016 Order intake in excess of €1 million
17-03-2016 Business integration for Drabbe
29-03-2016 Issue of 144,791 shares
31-03-2016 TIE Kinetix launches FLOW: the world’s First Self Service Partner Automation Platform
05-04-2016 Order intake in excess of €1 million
05-04-2016 Voting results of the Annual General Meeting of Shareholders
21-04-2016 TIE Kinetix and MarketLogic announce Strategic Partnership
26-04-2016 TIE Kinetix and Google announce Strategic Collaboration for Google AdWords
18-05-2016 Trading update First Half year FY 2016
04-07-2016 Order intake in excess of €1 million
02-08-2016 Order intake in excess of €1 million
17-08-2016 Trading Update Q3
Subsequent Events
04-10-2016 Order intake in excess of €1 million
02-11-2016Private offer for the business received
16-11-2016TIE Kinetix rejects private offer
16-11-2016 Trading Update Q4 and Full Year Financial Statements
TIE KINETIX N.V. ~ ANNUAL REPORT 2016

52
Operating Expenses and Non-Recurring ExpensesThe following table provides a breakdown of the total operating expenses for the financial years indicated:
Operating Expenses 2016 As % 2016 2015 As % 2015
Employee Benefits 5,548 56% 5,069 42%
Non-Recurring Expenses 22 0% 1,993 16%
Depreciation and Amortization Expense 1,280 13% 1,172 10%
Impairment CSP Trademark - 0% 84 1%
Other Operating Expenses
Accommodation Expenses 691 7% 655 5%
Professional Services 618 6% 567 5%
Communication Expenses 471 5% 468 4%
Marketing 512 5% 531 4%
Travel Expenses 458 5% 445 4%
Supplies 249 3% 403 3%
General & Administration 100 1% 701 6%
Subtotal Other Operating Expenses 3,099 31% 3,770 31%
Total Operating Expenses 9,949 100% 12,088 100%
Product DevelopmentIn 2016 our Development efforts were fully aimed at the mid-year launch of FLOW. Some 30 modules and connectors have been developed and enhanced by our centrally managed development team. With FLOW our solutions have converged into one single platform offering, with seamless integrations to many third party systems. The FLOW modules allow (in part) easy to use, self-service onboarding, reducing the entry costs for our customers. Within FLOW, our customers can benefit from all data generated within their own community of suppliers, distribution partners and end users.
An important element of the FLOW offering is the deployment of our hybrid hosting strategy. Our hybrid hosting strategy allows TIE to offer our solutions in public, and private and hybrid cloud deployment with the objective to benefit from the latest and most efficient technologies. It allows our customers freedom of choice. Hybrid hosting is an aspect that sets TIE apart from its competitors, traditionally offering feature rich but expensive private hosting, hosted either on bare metal or on virtual machines.
With smart partnerships TIE Kinetix aims to expand its hybrid hosting strategy to all its solutions and markets in 2017.
Report from the Executive Board TIE KINETIX N.V. ~ ANNUAL REPORT 2016

53Financial Income and/or ExpenseInterest Income relates to received interest on the bank accounts; The Interest expense consists of interest paid.
Figure: Financial Income and/or Expense
Impairment of Intangible AssetsCash generating units are identified in line with the way management monitors, and will continue to monitor, the business. This is based on the internal reporting to the Executive Board as main decision-making body in the company. Our strategic planning is primarily based on Business Lines. Country segments are used for tactical purposes such as annual budgeting, statutory reporting, tax reporting and recognition of cash generating units. Revenue items, and direct cost items and fee earning staff are allocated to Business Lines. To avoid arbitrary and volatile allocation, indirect costs and non-fee earning staff are not allocated directly to business lines, but rather allocated to country operations (or holding functions). The Company applies an intercompany transfer pricing mechanism to account for the various roles the respective country operations have in the value chain towards its customers. As the case may be, the company identifies sales roles, product ownership roles and development roles, with each role rewarded commensurate with its place in the value chain. The intercompany pricing mechanism may distort the intra year as well as the year-on-year country segment comparison.
TIE Kinetix has four business lines: Integration, E-Commerce, Demand Generation and Analytics & Optimization. TIE Kinetix currently has country operations in the Netherlands, in the US, in Germany, and in France. This leads to the cash generating units TIE Kinetix Nederland/International, TIE MamboFive, TIE Kinetix France, TIE Kinetix US, TIE Kinetix Germany incl. DACH and TIE Product Development.
As in past years we used a discounted cash flow model to determine the value in use, based on a 12% WACC and 10 years horizon. Management has assessed the assumptions used and has conducted sensitivity tests with WACC of 13% and 14%.
Management has conducted annual impairment testing and assessed that for all cash generating units the Value in Use [IAS 36.30-57] exceeds Carrying Value [IAS 36.8-9]. Furthermore, management has no indications that individual assets of any cash generating units may be impaired.
With respect to TIE Kinetix Germany GmbH management assessed the following. The former owner TFAG committed to a revenue guarantee expiring at December 31, 2015. In the succeeding periods actual revenue developed at lower levels. Management conducted impairment testing as at September 30, 2016 taking into account actual business performance and the best estimate planned performance. As in prior years we have used a discounted cash flow model to determine the value in use, based on 12% WACC and a 10 years horizon. Based on the chosen assumptions, management assessed that for the cash generating unit TIE Kinetix Germany the Value in Use [IAS 36.30-57] exceeds Carrying Value [IAS 36.8-9], and that currently available
Financial Income and/or Expense 2016 2015
Interest Income 29 31
Interest Expenses (80) (146)
Exchange gains/(losses) (24) (63)
Total (74) (178)
TIE KINETIX N.V. ~ ANNUAL REPORT 2016

54
headroom for the cash generating unit TIE Kinetix Germany remains limited as at September 30, 2016. New impairment testing will be conducted at September 30, 2017, or earlier upon the occurrence of a triggering event.
With respect to TIE MamboFive BV management assessed the following. TIE MamboFive’ major customer is T-Mobile Netherlands, for who various Webshops and portals have been successfully developed, and are being serviced and maintained to the customer’s full satisfaction. The contract with T-Mobile formally terminates at February 2017. At the request of T-Mobile, parties are currently engaged in negotiation for the extension of contract. Management has conducted impairment testing as at September 30, 2016 based on the assumption that the T-Mobile contract can be extended with terms and conditions generating sufficient headroom of the Value in Use [IAS 36.30-57] over Carrying Value [IAS 36.8-9]. New impairment testing will be conducted at September 30, 2017, or earlier upon the occurrence of a triggering event.
Income TaxesThe carrying value of the Deferred Tax Asset in the US amounts to € 693k ($ 775k) in the US (2015: € 1,168k or $ 1,310k), and is substantially caused by timing differences. The US net operating losses for both Federal Tax purposes and State tax purposes are largely utilized as a result of which the offset to current income is limited and the company’s effective tax rate is increasing. The carrying value of the Deferred Tax Liability in Germany amounts to € 42k (2015: € 62k), and in the Netherlands €18k (2015: € 18k).
Cash PositionIn 2016, the Cash Generated in operations is € 1,500k (2015: € 656k). As at September 30, 2016 the Company held a cash position of € 1,887k (2015: € 692k).
Risk Assessment & Risks
The Company is exposed to various risks, including market risks (currency risk and interest rate risk), credit risk, and liquidity risk. Financial instruments held are accounted for under Assets (Loans and Receivables) and Equity (Convertible Bonds). The risks are monitored on a recurring basis at a Management Board level, applying input received from Management in the individual geographical areas, with whom the Management Board has contact on regular basis.
The risk analysis focuses predominantly on business risks that result in managerial decisions, in particular with respect to:» Span of control, i.e. oversight.» Commercial dependency of our partners.» Our churn rate and retention rate.» Downtime of datacenters.» Contractually agreed (SLA) obligations.» Legal aspects.» Financial Disclosure.» Acquisitions.» Entering new markets.
Financing and funding decisions are made by the Chief Financial Officer in the Executive Board, guaranteeing that management is aware of any changes and developments. Individual debtors with collectability issues are discussed on an item-by-item basis. The Company neither holds nor issues financial instruments for trading or hedging purposes.
Report from the Executive Board TIE KINETIX N.V. ~ ANNUAL REPORT 2016

55Fair valueThe Company does not hold any financial assets or liabilities accounted for at fair value through the Profit and Loss Account. Fair values disclosed are calculated based on current interest rates, taking into account the terms and conditions of the financial asset or liability. In most cases, fair values will equal the carrying value of the item.
Currency RiskThe Currency Risk is discussed on page 79 of this report.
Credit RiskThe Credit Risk is discussed on page 79 of this report.
Liquidity RiskThe Liquidity Risk is discussed on page 80 of this report.
Interest Rate RiskThe Interest Rate Risk is discussed on page 81 of this report.
BrexitTIE Kinetix does not operate a separate business in the United Kingdom, nor does it have sales or purchasing contracts denomintaed in UK Pounds Stirling. The effects, if any, of the anticipated separation of the United Kingdom from the European Union, may be expected to be minimal to the Company.
Acquisition Strategy
TIE Kinetix strives for long term sustainable growth of the SaaS value of its solutions. FLOW is our core product in all our markets. We aim to achieve our growth objectives through organic growth in our existing markets, supported – as and when the opportunity arises – by acquisitive growth. With the introduction and roll out of FLOW TIE Kinetix has refocused its acquisition strategy. Acquisitions will be considered by TIE Kinetix to support the roll out of FLOW in its existing markets.
Our acquisition strategy is based on the following considerations:1. customers are potential FLOW customers. 2. Within existing geographical footprint of TIE Kinetix.3. Strengthens or expands current local country operation.4. Cultural fit.5. Customers are in vertical markets that strategically fit with TIE Kinetix 6. Financing with newly issued shares only if the earnings per share improve with the acquisition.
TIE KINETIX N.V. ~ ANNUAL REPORT 2016

56 Corporate Sustainability
Our EmployeesEmployees are very important to TIE Kinetix and our employees are the driving force behind our success, and critical to TIE Kinetix’s profitability, sustainability and long-term growth. We strive to be a good employer and invest in engaging, supporting and developing our people and treating their safety and wellbeing as a paramount concern. Personal growth of our staff is of great value to the Company. This can be obtained through setting challenging targets, guidance by management and education. The personal growth of the staff members is closely monitored and recurring evaluations and assessment meetings take place.
Since the worlds of mobile, social media, big data, and multi-channel are subject to constant change, TIE Kinetix and its business is changing as well. All these changes necessitate a more result-oriented approach. This belief is the reason for TIE Kinetix to further improve its existing performance and competency management towards its employees in 2016, in order to enable and optimize the realization and support of the organizational strategy.
The workforce of TIE Kinetix is diverse and multicultural as TIE Kinetix employs a large variety of nationalities. In official announcements and communication TIE uses English as the main international business language. As a result thereof the non-native English speakers may be offered training in the English language. In order to improve the integration, TIE Kinetix has additionally offered Dutch lessons to the foreign staff members in the Netherlands.
In general TIE Kinetix aims to provide its staff members with safe and healthy working conditions. The absence due to illness in financial year 2016
amounted to 1.5% (excl. pregnancy leave, 2015: 0.83%), which is low compared to the average of 3,1% in the same period for the commercial services sector in The Netherlands (source: Statistics Netherlands/Centraal Bureau voor de Statistiek).
TIE Kinetix provides extra encouragement to employees in the Netherlands by offering them an extra vacation day if they have not been ill during a certain period. By facilitating its employees the possibility to balance their private life with their business responsibilities, TIE Kinetix endorses “Het Nieuwe Werken” in the Netherlands. TIE Kinetix offers flexible working hours and an extensive special leave arrangement as well.
Compliance with Laws and RegulationsTIE Kinetix will abide by all human rights and supports the development of them wherever it operates within the legitimate role of business. TIE Kinetix rejects any restrictions to free trade other than duly enacted national and international laws.TIE Kinetix offers its employees and applicants equal opportunities, and does not tolerate any form of harassment or unfair or unlawful discrimination based on race, age, gender, sexual orientation, disability or national origin. TIE Kinetix has a policy in place for dealing with complaints regarding harassment or discrimination. Additionally, TIE Kinetix has a Whistleblower’s policy in place, allowing employees to report suspected irregularities without jeopardizing their positions.
The Code of Conduct has been drawn up to provide all of our employees with a clear set of guiding principles on integrity and ethics in business conduct.
Also, TIE Kinetix has regulations on insider knowledge in place, preventing trading with insider knowledge. Every
It is the role of the Executive Board to manage the corporate responsibility issues that are relevant to the Company.As such the Company focuses on several subjects and the corporate responsi-bility aspects thereof. This chapter provides an overview of the important subjects in light of the corporate social esponsibilities. As a whole, the Company is committed to achieve a correct balance between growing as a company and our corporate responsibility.
TIE KINETIX N.V. ~ ANNUAL REPORT 2016

57
employee, executive, specified person, Executive Board member and Supervisory Board member is to inform the Compliance Officer of its intention to trade in TIE Kinetix shares prior to any transaction. The Compliance Officer is the Chief Financial Officer of the Company, ensuring that every employee, executive, specified person, Executive Board member and Supervisory Board member abides by the applicable laws and restrictions. The silent period, in which every employee, executive, specified person, Executive Board member and Supervisory Board member is prohibited from trying to execute and/or executing a transaction TIE Kinetix shares, irrespective of whether or not he or she possesses insider knowledge, is published on our website and communicated at the start of every silent period.
For members of the Supervisory Board and the Executive Board a personal liability insurance is in place. More information on compliance with laws and regulations can be found in the Code of Conduct and together with our other policies, published on our Investor Center, section Corporate Governance, Policies & Procedures.
Workers CouncilTIE Kinetix recognizes the employees’ right to
organize them in order to protect their own rights. As of 1999, TIE has a Worker’s Council (Ondernemingsraad) in the Netherlands. As of 2005, this Worker’s Council has continued on a voluntary basis, due to the number of employees in the Netherlands. In 2015 both members of the Netherlands’ workers council stepped down their position while no other candidates have stepped forward since. As at September 30, 2016 the appointment of a new Worker’s Council in the Netherlands is pending.
Investor RelationsTIE Kinetix’ Investor Relations objectives are aimed at maintaining and improving relationships with existing shareholders and developing relationships with new investors. The overall goal is to increase transparency, minimize information asymmetry and to reduce stock price volatility. We develop relations with analysts with the aim to clarify our strategy and achievements. We aim for transparent communication and we therefore provide detailed, clear and timely information to existing and potential shareholders, financial analysts and the media. We also operate an open-door policy with regard to enquiries. TIE Kinetix provides its shareholders and financial market stakeholders with similar and simultaneous
Age distribution
31% 27%
30%
22%7%
7%
3%2%
1%1%
14%
37%
15%2%
Nationalities in %
Rest of WorldRussion FederationIndia
Greece
SpainDach RegionFranceUSA
Netherlands
60+
50-60
41-5031-40
18-30
TIE KINETIX N.V. ~ ANNUAL REPORT 2016

58 Corporate Sustainability
Our Carbon Footprint
Our solutionsAt TIE Kinetix we are dedicated to fulfill our corporate social responsibility. This dedication reflects in our continuous efforts to develop software solutions which contribute to the digital processes and connecting business processes within the E-Commerce environment. Through our solutions, TIE Kinetix improves to the sustainability profile of all stakeholders within supply chain from end to end.
An example is e-invoicing as business processes within the E-Commerce supply chain, which decreases paper-usage. With our FreeConnect platform, we provide SME’s a paper-free solution to digitally process their invoices. Our solutions in The Netherlands are predominantly hosted at LeaseWeb. LeaseWeb is dedicated to corporate social responsibility as they are constantly addressing their practices to ensure that they are kept sustainable, and for that reason LeaseWeb utilizes green datacenters. LeaseWeb is also connecting more clients to their cloud products daily, which results in improved resource utilization.
Our office in Breukelen, The NetherlandsOur office has a parking lot which is fully lit by LED-lights and is equipped with moving sensors for lighting the office. The office also accommodates charging of electric cars, various cars leased by TIE Kinetix are electric or hybrid.
TIE KINETIX N.V. ~ ANNUAL REPORT 2016
59
Financial Calendar 2017
January 25, 2017 until February 17, 2017 - Closed Period» February 15, 2017: Publication of the Q1 Trading Update» March 31, 2017: Annual General Meeting of Shareholders
April 26, 2017 until May 17, 2017 – Closed Period» May 17, 2017: Publication of the 1st half year results
July 26, 2017 until August 16, 2017 – Closed Period» August 16, 2017: Publication of the Q3 Trading Update
October 25, 2017 until November 15, 2017 – Closed Period» November 15, 2017: Publication of the annual results
information about potentially price sensitive matters and is very careful with contacts between company executives and shareholders and analysts.
TIE will not engage in actions that might compromise analyst independence and does not assess, comment on or correct – other than factually – any analysts’ reports or analyst valuations.
TIE Kinetix communicates with shareholders and analysts through regular meetings such as the Annual General Meeting of Shareholders or bilateral meetings as the case may be. Bilateral meetings are organized to ensure that (potential) shareholders receive a balanced and comprehensive view of our performance and strategy and the issues TIE Kinetix faces in the execution of its goals. In all our contacts we are always careful to observe the rules on fair disclosure, equal treatment of shareholders, insider trading and transparency in all our communications.
TIE Kinetix publishes an annual report, semi-annual results and quarterly trading updates. In addition, TIE Kinetix keeps its stakeholders informed through press releases. TIE Kinetix also issues press releases of a commercial or strategic nature, if and when the company deems that to be of interest to its stakeholders. Commercial sensitivity may prevent us from disclosing contract details (such as customer names, transaction value etc.). TIE Kinetix’ policy is to issue a press release when it receives an order with an order value exceeding € 250,000, or an order of strategic nature or when TIE Kinetix engages in a strategic partnership. TIE Kinetix also issues a press release when its monthly cumulative order value exceeds € 1 million for any given month.
Contacts with the capital markets are always dealt with by the Executive Board or staff mandated by the Executive Board.
Outlook for Financial Year 2017
For 2017 the Company has ambitious plans aimed at maximizing the deployment of FLOW. The conversion towards one homogeneous FLOW product portfolio will continue in 2017. Certain non-core (non-FLOW) products may discontinue in 2017. It cannot be excluded that the build-up of FLOW revenue is insufficient to replace the discontinuation of non-core products. As a result, top line revenue growth in FY 2017 may be limited.
We will continue to invest in the development of FLOW functionality. Our development team remains at the current deployment levels and we do not anticipate to significantly grow our consultancy team. We will invest in more sales capacity at the senior level to sell FLOW in all our existing markets. We will have completed the harmonization of its integration offering under one integration platform worldwide.
We will continue our hybrid hosting strategy through partnering. This is a logical consequence of the strategic decision not to develop an own in-house hybrid hosting proposition. Instead we will be partnering with a strategic partner who secures access to best of breed, cloud independent and cost efficient internet infrastructure. We will further consolidate our back office functions and functionality, with the aim to reduce cost per unit.
TIE KINETIX N.V. ~ ANNUAL REPORT 2016

60 Corporate Governance
This means that a company may deviate from the principles and the best practice provisions of the Code, provided that, in its annual report, it gives a sound reason as to why such deviation has been made.
Legal frameworkTIE Kinetix N.V. (the “Company”), is a public limited liability company, established under the laws of the Netherlands. Its shares are listed on NYSE Euronext, Amsterdam. As such, several laws and regulations apply to the Company: the Dutch Civil Code, the Dutch securities laws such as the Dutch Financial Supervision Act, the NYSE Euronext listing rules and the Dutch corporate governance code (the “Code”). Additionally, the Company, the Executive Board, the Supervisory Board and the staff members are bound by the Company’s Articles of Association, the Terms of Reference of the Supervisory Board, the Terms of Reference of the Executive Board, the Code of Conduct, the Remuneration Policy, the Insider Knowledge Regulations, the Whistleblower Policy and several internal procedures. More details and the most recent documents can be found on our website, https://tiekinetix.com/nl/investor-relations.
Shares and shareholdersUp to June 3, 2015, the Company’s authorized share capital amounts to € 14 million, consisting of 2 million ordinary shares, with a nominal value of € 7.00. Following the decision of the General Meeting of Shareholders on March 27, 2015, the Company has changed its Articles of Association on June 3, 2015, in order to change the Company’s authorized share capital to € 500,000, consisting of 5 million ordinary shares, with a nominal value of € 0.10.
The General Meeting of Shareholders decides on resolutions with regard to the issuance of shares and may grant this authority to another company body
The Dutch corporate governance code is an important code for Dutch
listed companies, regulating the relations between the company, its
shareholders and its corporate bodies, the Executive Board and the
Supervisory Board. The Code is self-regulatory in nature and is based
on the principle known as “apply or explain”.
for a period up to five years. At the issuance of shares, each shareholder has a pre-emptive right proportional to his existing shareholding, subject to statutory provisions. The pre-emptive right may be restricted or excluded by a resolution of the General Meeting of Shareholders or by another company body if it has been authorized to do so by a resolution of the General Meeting of Shareholders, for a period up to five years. On March 31, 2016 the General Meeting of Shareholders decided not to prolong the authorization of the Executive Board to issue shares and rights to acquire shares (options, warrants, convertibles). In case the Company wishes to issue shares or rights to acquire shares, the Company convenes a General Meeting of Shareholders or an Extraordinary General Meeting of Shareholders. The Company does not have an anti-takeover provision.
Shareholders who have reported their interest in the Company pursuant to Chapter 5.3 of the Dutch Act of Financial Supervision are Mr. P. van Schaick (through Alto Imaging Group N.V.) 13.4 %, Mr. C. Komen (through DW Vastgoed Beleggingen B.V.) 25.8 %, Objectif Lune International Inc. 9.9 %, Mr. D. Lindenbergh (through Blikkenburg BV) 9.1 %, and Mr. G. van Lookeren 5.0% all excluding potential interests. No shareholders agreements have been concluded between the Company and these major shareholders, except with respect to one agreement for the issue of shares in order to cover the damage the Company will suffer as a result of the EU Claim. On request of the shareholder, its identity will be treated as confidential.
Shareholders meeting and voting rightsResponsible corporate governance requires the fully-fledged participation of shareholders in the decision-making in the General Meeting of Shareholders. The Company attaches great value to shareholder relations. In line with relevant laws and
TIE KINETIX N.V. ~ ANNUAL REPORT 2016

61regulations, the Company provides all shareholders and other parties in the financial markets with equal and simultaneous information about matters that could have a significant influence on the price of the Company’s listed securities, thereby taking into account possible exceptions permitted by those laws and regulations. The Company regularly issues press releases and maintains a mailing list of interested parties. The Company actively communicates its strategy and the developments of its business to the financial markets. The dates of publication of the quarterly results are announced well in advance and these publications are accessible online via the Company’s website. Meetings with analysts, investors and shareholders are announced on the Company’s website or through press releases. At least once a year a General Meeting of Shareholders is convened by a notice on the Company’s website, announcing the meeting date and place, the registration date, the agenda of the meeting with explanatory notes and the procedure for attendance. In accordance with Dutch law the shareholding at the registration date is decisive for the right to attend and address the meeting and to exercise voting rights, notwithstanding a subsequent sale of the shares.Each share entitles its holder to cast one vote. Resolutions are passed by a simple majority of the votes cast, unless Dutch law or the Articles of Association require a larger majority.
Amongst other things the General Meeting of Shareholders decides on the adoption of the financial statements, the appropriation of the net results, the (re)appointment, discharge and remuneration of the members of the Supervisory Board, material changes of the Remuneration Policy, the (re)appointment and the discharge of the members of the Executive Board, the appointment of the external auditor, the authorization of another company body to issue new shares, the amendment of the Articles of Association, and other important matters such as major acquisitions or the sale of a substantial part of the Company. The Company prepares a list of decisions made during a shareholders meeting and publishes it on the Company’s website. The Company also prepares the minutes, which will be set by the shareholders at the next General Meeting of Shareholders.
The Company has discussed the option to enable shareholders to vote remotely in the General Meeting of Shareholders by using electronic communication devices. At present the opinion of the Executive
Board is that, given the size of the Company, the use of such devices will not improve the transparency of the decision-making process.
Amendment of the Articles of AssociationAt the Annual General Meeting of Shareholders of March 27, 2015, it has been decided to amend the articles of association of the Company as described above. Other amendments have not been made in 2015 and 2016.
Executive BoardThe Executive Board is entrusted with the management of the Company. This means that it is responsible for the achievement of the Company’s targets, its strategy with the associated risk profile, the development of the results and the social aspects of doing business relevant to the Company. For its management the Executive Board is accountable to the Supervisory Board and the General Meeting of Shareholders. In the performance of its duties, the Executive Board is guided by the interests of the Company, taking the relevant interests of all stakeholders into account.
The Executive Board performs its activities under the supervision of the Supervisory Board. The Executive Board attends the meetings of the Supervisory Board with exception of the meetings focusing on the evaluation of the Supervisory Board and the Executive Board and the annual meeting with the external auditor. The Executive Board provides the Supervisory Board timely with all information essential for the Supervisory Board to exercise its duties.
The Executive Board consists of Mr. J.B Sundelin and Dr. M. Wolfswinkel. Mr. J. Sundelin, CEO, has been a member of the Executive Board since February 2007. His term is renewed at the Annual General Meeting of Shareholders of March 27, 2015 and will end on March 13, 2019. Dr. Wolfswinkel joined the company as CFO on August 19, 2013 and has been appointed to the Executive Board on November 28, 2013. His term will end on November 28, 2017. At the General Meeting of Shareholders of March 31, 2017, the Supervisory Board will propose a renewal of the appointment of Mr. M. Wolfswinkel.The remuneration of the members of the Executive Board has been set in conformance with the
TIE KINETIX N.V. ~ ANNUAL REPORT 2016

62 Corporate Governance
Remuneration Policy of the Company and is in line with the provisions of the Code. The severance package of the Executive Board is in line with best practice provision II.2.8 of the Dutch corporate governance code (3.2.3. of the new Dutch corporate governance code). More information about the remuneration of the Executive Board can be found in the notes to the consolidated statement of comprehensive income.
The Executive Board avoids (the appearance of) conflicts of interests between the Company and a member of the Executive Board. All transactions in which a conflict of interest exists or is deemed to exist must be concluded on terms at least customary in the sector concerned. Resolutions for entering into such transaction must be approved by the Supervisory Board. In the financial year 2016, there were no reports on conflicts of interest.
Supervisory BoardThe role of the Supervisory Board is to exercise supervision over the policies adopted by the Executive Board and over the general conduct of business of the Company as well as to provide the Executive Board with advice. The general duties of the Supervisory Board include supervising, monitoring and advising the Executive Board on the realization of the Company’s operational and financial objectives, the corporate strategy, the risks inherent in the business activities, the design and effectiveness of the internal risk management and control systems, the main financial parameters, the financial reporting process, compliance with applicable laws and regulations, the relationship of the Company with its shareholders and the corporate social responsibility issues that are relevant to the Company. In the performance of its duties, the Supervisory Board is guided by the interests of the Company and takes the relevant interests of all the Company’s stakeholders into account. The Supervisory Board is responsible for the quality of its own performance.
The Supervisory Board of the Company consists of Dr. Ir. A.F.L. Veth, chairman, Mr. Drs. E.R. Honée and D. Lindenbergh. Further information about the members of the Supervisory Board can be found in the report of the Supervisory Board as included in this annual report. All members of the Supervisory Board are independent, subject to the relevant requirements of provision III 2.1 and III 2.2 of the Code (2.1.6 and
2.1.7 of the new Code). The composition of the Supervisory Board is such that its members are able to act critically and independently of one another and of the Executive Board and any particular vested interests. Each member of the Supervisory Board is capable of assessing a broad outline of the overall strategy of the Company and its business. As a whole, the composition is such that it enables the Supervisory Board to best carry out the variety of its responsibilities and duties to the Company and other stakeholders. The Supervisory Board is constituted in a balanced manner as to reflect the nature and variety of the Company’s businesses and the desirability to have available expertise in such fields as finance, economics, management, legal/ corporate governance, information technology and the Company’s business in general and more specifically the national and international E-Commerce market. The Supervisory Board members are appointed by the General Meeting of Shareholders. A Supervisory Board member is appointed or reappointed for a term commencing on the date of his appointment and ending at the day of the first General Meeting of Shareholders held after the fourth anniversary of this appointment. On March 27, 2015 the General Meeting of Shareholders approved the fourth appointment of Mr. A.F.L. Veth until May, 2019.
Furthermore, the General Meeting of Shareholders approved the remuneration of the members of the Supervisory Board. The remuneration of Mr. Lindenbergh and Mr. Honée is € 10k and the remuneration of Mr. Veth is € 20k. The members of the Supervisory Board abstained from voting about their reappointment and remuneration.
In the financial year 2016 the Supervisory Board met 14 times. Since the Supervisory Board comprises only three members, no separate remuneration committee and selection and appointment committee have been formed. The audit committee consists of all members of the Supervisory Board and meets during Supervisory Board meetings. It is the opinion of the Supervisory Board that, at present, there is no need for an internal audit function in the Company.
The Supervisory Board avoids (the appearance of) conflicts of interests between the Company and a member of the Supervisory Board and/or a member of the Executive Board. In the financial year 2016, there were no reports on conflicts of interest.
TIE KINETIX N.V. ~ ANNUAL REPORT 2016

63Notes on the Company’s corporate governance.All members of the Executive Board and the Supervisory Board comply with the rules of Dutch corporate governance regarding the limitations of the number of board positions in Dutch large companies as all members of the Executive Board and the Supervisory Board have no other positions than their position within the Company.BDO Audit & Assurance B.V. has been the external auditor during the financial year 2016, being appointed at the General Meeting of Shareholders of March 31, 2016.
In the Remuneration policy, a claw back clause on variable pay, in line with the proposed law on claw back and best practice provision II. 2.11, (and provision 3.1.4 of the new Code) has been incorporated.
DeviationsOn March 27, 2015, the General Meeting of Shareholders reelected Mr. A.F.L. Veth for a fourth term. Members of the Supervisory Board of the Company are appointed for a period of four years, commencing at the date of (re-)appointment and ending at the day of the first General Meeting of Shareholders held after the fourth anniversary of the appointment. This implies that, Mr. A.F.L. Veth has completed his third term, he has been a member of the Supervisory Board of the Company from May 2003 until the date of this General Meeting of Shareholders and therefore for a period exceeding the maximum of three four-year terms as described in best practice provision III.3.5. of the Code. The Company notes that it has deviated from this provision as of May 14, 2015 because Mr. Veth has in-depth knowledge of TIE Kinetix products and development, and will consider the possible deviation at a point later in the future.
Although the composition of the Executive Board and the Supervisory Board are currently not in accordance with the statutory requirements on gender diversity, the Boards recognize the importance of a gender balanced composition and will take this into account when selecting potential nominees. However, as gender is only part of diversity, the Boards will continue to select their members on the basis of their background, knowledge and experience.
In control statementIn order to ensure adequate and effective internal risk management and control systems, all internal business processes are aligned according to the internal instrument called My-TIE. This system gives the Executive Board complete visibility on all transactions that have taken place anywhere within the company and provides detailed reports on revenue costs. It also provides for strong procedures to control purchasing, order fulfillment and support. It provides information on policies and procedures, customers and prospects, human resources, assets, documentation and pricing of products and services. My-TIE is the platform to collaborate with other employees, customers and resellers. The system has been outsourced in order to ensure 24/7 global availability and free up internal resources
Functionality and design are continuously developed to further improve supporting business processes. In 2014 the platform was upgraded to the latest version of Exact Synergy. In 2016, we phased out our time tracking application and migrated this functionality towards Exact Synergy. Also, in 2016, we consolidated our customer resource management processes within Synergy allowing tighter control and management. My-TIE has proven to be a very effective instrument of the internal risk management and control system. Any shortcomings that come to light as the Executive Board continues to evaluate processes and procedures, also in light of changing circumstances and business processes, are addressed and resolved as soon as possible.
In view of the above, the Executive Board believes that with the implementation of My-TIE as a system of monitoring and reporting, it has taken adequate steps to implement an appropriate risk management and internal control system. This system provides, with reasonable certainty, reliable internal and external reports. These reports supply adequate information to determine in how far the company is achieving the strategic goals it has set and assurance that the company is operating within the boundaries of the law.
My-TIE significantly reduces, but cannot fully eliminate the possibility of poor judgment in decision-making, human errors, abuse and control processes being deliberately circumvented by employees and others, management overriding controls and the occurrence of other unforeseeable circumstances. Another limiting factor is the need to
TIE KINETIX N.V. ~ ANNUAL REPORT 2016

64 Corporate Governance
consider the relative costs and benefits of risk responses. A properly designed and implemented risk management and internal control system will therefore provide reasonable but not absolute assurance that a company will not be hindered in achieving its business objectives, in orderly and legitimate conduct of its business. It can also not provide absolute insurance that a misstatement in the financial reporting would be prevented or detected. In this context, reasonable assurance refers to a degree of assurance that would be satisfactory for a prudent manager in the management of his affairs in the given circumstances. Notwithstanding the forgoing and in view of the above, the Management Board makes the following statement:» The Executive Board is of the opinion that it has
implemented an internal risk management and control system that is adequate and effective, suitable for the company’s business;
» The internal risk management and control system provide a reasonable assurance that the financial reporting does not contain any errors of material importance; the financial statements therefore provide as far as the Executive Board is aware, a fair view of the financial position, the assets and liabilities and the financial results of the company and consolidated enterprises as of September 30, 2016;
» The internal risk management and control system has worked properly in financial year 2016 and there are no indications to believe that the internal risk management and control system will not continue to function properly in financial year 2017.
The Executive Board has discussed the internal risk management and control system with the Supervisory Board.
TIE KINETIX N.V. ~ ANNUAL REPORT 2016

65
Nawin Raghoebarsing,Integration ConsultantTIE Kinetix
“At TIE Kinetix, we work closely together with our business partners to optimize the performance throughout the supply chain.”
TIE KINETIX N.V. ~ ANNUAL REPORT 2016
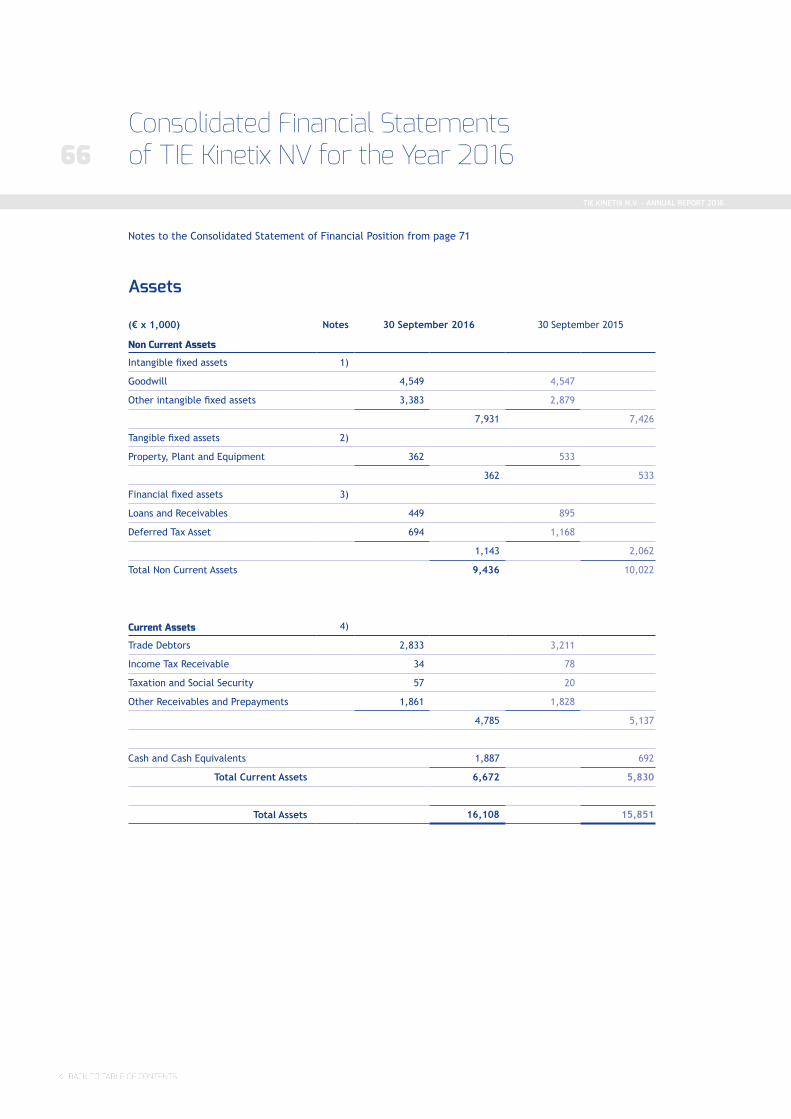
66Consolidated Financial Statements of TIE Kinetix NV for the Year 2016
Notes to the Consolidated Statement of Financial Position from page 71
(€ x 1,000) Notes 30 September 2016 30 September 2015
Non Current Assets
Intangible fixed assets 1)
Goodwill 4,549 4,547
Other intangible fixed assets 3,383 2,879
7,931 7,426
Tangible fixed assets 2)
Property, Plant and Equipment 362 533
362 533
Financial fixed assets 3)
Loans and Receivables 449 895
Deferred Tax Asset 694 1,168
1,143 2,062
Total Non Current Assets 9,436 10,022
Current Assets 4)
Trade Debtors 2,833 3,211
Income Tax Receivable 34 78
Taxation and Social Security 57 20
Other Receivables and Prepayments 1,861 1,828
4,785 5,137
Cash and Cash Equivalents 1,887 692
Total Current Assets 6,672 5,830
Total Assets 16,108 15,851
Assets
TIE KINETIX N.V. ~ ANNUAL REPORT 2016

67
(€ x 1,000) Notes 30 September 2016 30 September 2015
Equity 5)
Shareholders’ Equity 7,123 4,308
Convertible Bonds 45 45
Total Equity 7,168 4,353
Non Current Liabilities 6)
Loans 8 1,165
Deferred Tax Liability 60 80
Deferred Revenue 562 886
Contingent Consideration 55 55
Provisions 514 492
Total Non Current Liabilities 1,199 2,678
Current Liabilities 7)
Provisions - 29
Short term debt 34 860
Bank overdraft - 692
Trade Creditors 826 1,171
Deferred Revenue 3,676 3,187
Taxation and Social Security, Income tax 872 743
Other Payables and Accruals 2,333 2,138
Total Current Liabilities 7,741 8,820
Total Equity and Liabilities 16,108 15,851
Equity and Liabilities
TIE KINETIX N.V. ~ ANNUAL REPORT 2016

68
Consolidated Statement of Comprehensive Income for the year ending September 30, 2016
(Notes to the Consolidated Statement of Comprehensive Income from page 98 onwards)
Revenues (€ x 1,000) Note 2016 2015
Licenses 906 804
Maintenance and Support 2,988 3,019
Consultancy 5,794 6,897
Software as a Service 9,818 9,180
Revenues 19,507 19,900
EU Projects 552 1,865
Onetime income 192 498
Total Revenue 20,250 22,263
Third party hire (730) (933)
Direct Employee Costs (5,430) (7,164)
Direct Purchase Costs (3,356) (3,468)
Gross Margin 10,734 10,698
Operating Expenses 8Employee Benefits 5,548 5,069
Acquisition costs and onetime expenses 22 1,993
Depreciation and Amortization 1,280 1,172
Impairments - 84
Other Operating Expenses 3,099 3,770
Total Operating Expenses 9,949 12,088
Operating Income/(loss) 786 (1,390)
Interest and other Financial Income 9 29 31
Interest and other Financial Expense 9 (103) (209)
Income/(loss) before Tax 711 (1,568)
Corporate Income Tax 10 (670) (798)
Net Income/(loss) 41 (2,366)
Comprehensive Income 2016 2015
Net Income/(loss) 41 (2,366)
Exchange differences on translating of foreign operations 20 300
Total Comprehensive Income/(loss) net after Tax
61 (2,066)
Attributable to Shareholders of TIE Kinetix: 11 2016 2015
Income after Tax 41 (2,366)
Comprehensive Income net after Tax 61 (2,066)
Net result per share – basic 0.03 (2.01)
Weighted average shares outstanding – basic (thousands) 1,475 1,177
Net result per share – diluted 0.02 (2.00)
Weighted average number of shares fully diluted (thousands) 1,830 1,182
TIE KINETIX N.V. ~ ANNUAL REPORT 2016

69Consolidated Statement of Changes in Equity for the year ending September 30, 2016
(€ x 1,000)Share Capital (Incl Surplus)
Retained Earnings
Foreign Currency
translation reserve
Share- holders Equity
ConvertibleBonds
TotalEquity
Balance per September 30, 2014 58,045 (51,911) (159) 5,975 45 6,020
Foreign currency translation reserve - - 300 300 - 300
Net Income - (2,366) - (2,366) - (2,366)
Total Comprehensive Income (loss) - (2,366) 300 (2,066) - (2,066)
Shares issued and Share Premium 700 - - 700 - 700
Costs of shares issued (304) - - (304) - (304)
Share based payments - 13 - 13 - 13
Other movements (10) - - (10) - (10)
Balance per September 30, 2015 58,431 (54,264) 141 4,308 45 4,353
Foreign currency translation reserve - - 20 20 - 20
Net Income - 41 - 41 - 41
Total Comprehensive Income (loss) - 41 20 61 - 61
Shares issued and Share Premium 2,762 - - 2,762 - 2,762
Costs of shares issued (6) - - (6) - (6)
Share based payments 5 - 5 - 5
Other movements (7) - (7) - (7)
Balance per September 30, 2016 61,187 (54,225) 161 7,123 45 7,168
More details are explained in note 5 on page 91.
TIE KINETIX N.V. ~ ANNUAL REPORT 2016

70
(€ x 1,000) Note 2016 2015
Income before tax 711 (1,568)
Adjustments:
Share based payments expense 5 5 13
Depreciation and amortization 8 1,280 1,172
Impairments 8 - 84
Increase (decrease) provisions (7) 425
1,278 1,694
Working Capital Movements
(Increase) decrease in debtors and other receivables 357 370
(Decrease) increase in deferred revenue 170 536
(Decrease) increase in current liabilities (944) (167)
(417) 739
Cash generated (applied) in operations 1,572 865
Interest paid (58) (172)
Interest received 9 29 31
Income tax paid (21) (57)
Sales taxes paid (22) (11)
Net Cash flow from operating activities 1,500 656
Investments in intangible fixed assets (1,522) (755)
Acquisition of subsidiary net of cash acquired - -
Investments in tangible fixed assets (85) (166)
Net Cash flow generated / (used) in investing activities (1,607) (921)
Increase (decrease) long term loans (1,157) (362)
Issue of new shares 2,457 685
Net Cash flow generated / (used) by financing activities 1,300 323
Net increase (decrease) in Cash and Cash Equivalents 1,193 58
Currency Exchange Rate Difference on opening balance Cash and Cash Equivalents 2 40
Opening balance Cash and Cash Equivalents 692 594
Closing balance Cash and Cash Equivalents 1,887 692
Consolidated Statement of Cash Flows for the year ending September 30, 2016
TIE KINETIX N.V. ~ ANNUAL REPORT 2016
71Notes to the Consolidated IFRS Financial Statements
General information and
Summary of significant
accounting policies
Company InformationTIE Kinetix N.V. is a public company incorporated in the Netherlands with its registered address of De Corridor 5d, Breukelen. Subsidiaries are located in Asia-Pacific, France, Germany, Switzerland, the Netherlands and the US. TIE Kinetix is listed on the NYSE EuroNext in Amsterdam. In the following pages, the name “TIE Kinetix” or “the Company” will be used to refer to TIE Kinetix N.V. and its various subsidiaries. TIE Kinetix develops, sells, and distributes software and services under TIE Kinetix’s Total Integrated E-Commerce concept around the world through a network of subsidiaries and resellers. The Company has been active not only in the software development but in the standardization process as well. The consolidated financial statements for the year ending September 30, 2016 are authorized for issuing through a resolution of the Executive Board dated December 30, 2016. The Annual General Meeting of Shareholders, to be held on March 31, 2017 will be requested to decide on the Consolidated Financial Statements.
Statement of ComplianceThe consolidated financial statements of the Company included on pages 66 to 113, have been prepared in accordance with the International Financial Reporting Standards (IFRS) and its interpretations, as issued by the International Accounting Standards Board (IASB) and endorsed by the European Commission.
Basis of PreparationThe principal accounting policies applied in the preparation of these consolidated financial statements are detailed below and have been prepared on a historical cost basis, unless stated otherwise. These policies have been consistently applied to all the presented years, unless stated otherwise. The consolidated financial statements are presented in Euros, and all values are rounded to the nearest thousand (€ x 1,000), unless stated otherwise. The Company has opted to prepare a condensed profit and loss account in accordance with the exemptions provided by article 2:402 of
the Dutch Civil Code in the Company Only Financial Statements.
Implications of new, amended and improved standardsThe Company has adopted the following new standards with a date of initial application of 1 January 2015:» IFRIC 21 ‘Levies’*;» Annual improvements 2010-2012 cycle;» Annual improvements 2011-2013 cycle;» Amendments to IAS 19 - Defined Benefit Plans:
Employee Contributions;» In addition, the IFRS amendments included in the
annual improvements 2010-2012 and 2011-2013 cycles have a negligible impact on the Company’s consolidated financial statements;
» The Company adopted the narrow scope amendments to IAS 19 - Employee benefits entitled “Defined Benefit Plans: Employee Contributions” which apply to contributions from employees or third parties to defined benefit plans in order to simplify their accounting in specific cases.
There was no effect from the adoption of these amendments.
Future Changes in Accounting Policies and DisclosuresA number of standards and/or interpretations which have been issued, but are not yet effective, may impact future financial statements. These standards and interpretations are:» IFRS 9 will become effective after January 1,
2018;Financial Instruments replacing IAS 39 Recognition and Measurement
» IFRS 15 will become effective after January 1, 2018; Revenue from Contracts with Customers: Replacing IAS 18 Revenue and IAS 11 Construction contracts including all relevant interpretations. The company is currently investigating the possible impact of IFRS 15.
» IFRS 16 Leases sets out the principles for the recognition, measurement, presentation and disclosure of leases for both parties to a contract and replaces the previous leases standard, IAS 17 - Leases. IFRS 16, which is not applicable to service contracts, but only applicable to leases or lease components of a contract, defines a lease as a contract that conveys to the customer (lessee) the right to use an asset for a period of time in exchange for consideration. IFRS 16 eliminates the classification of leases for the lessee as either operating leases or finance leases as required by
TIE KINETIX N.V. ~ ANNUAL REPORT 2016

72Notes to the Consolidated IFRS Financial Statements
IAS 17 and, instead, introduces a single lessee accounting model whereby a lessee is required to recognize assets and liabilities for all leases with a term that is greater than 12 months, unless the underlying asset is of low value, and to recognize depreciation of leases assets separately from interest on lease liabilities in the income statement. As IFRS 16 substantially carries forward the lessor accounting requirements in IAS 17, a lessor will continue to classify its leases as operating leases or finance leases and to account for those two types of leases differently. The Group is currently evaluating the method of implementation and impact of adoption on its Consolidated Financial Statements.
Annual Improvements 2012-2014 Cycle makes amendments to the following standards:» IFRS 5 — Adds specific guidance in IFRS 5 for cases
in which an entity reclassifies an asset from held for sale to held for distribution or vice versa and cases in which held-for-distribution accounting is discontinued
» IFRS 7 — Additional guidance to clarify whether a servicing contract is continuing involvement in a transferred asset, and clarification on offsetting disclosures in condensed interim financial statements
» IAS 9 — Clarify that the high quality corporate bonds used in estimating the discount rate for post-employment benefits should be denominated in the same currency as the benefits to be paid
» IAS 34 — Clarify the meaning of ‘elsewhere in the interim report’ and require a cross-reference
TIE Kinetix will assess the impact of the standards in due time.
Going Concern ConsiderationsAs at September 30, 2016 the European Commission had fully collected the amount of the initial claim (€ 705,075). The Company has not yet received any further EC claims following its extrapolation of audit findings sent to the EC on July 15th, 2015. However, in July 2016 the company received a pre-notification that the EC intends to study the letter that TIE Kinetix sent on July 15th, 2015. At this stage the company considers that it has taken adequate provisions for damages following the 2013 EC audit.
Based on Budget 2016, the Company expects positive operational cash flow. The Company has
become less sensitive to intra year cash flow fluctuations as a result of the large proportion of recurring subscription based revenue in combination with maintenance and support income. With certain commercial counterparties, the Company is occasionally accepting extended credit terms that may impact working capital negatively. Taking everything into account, management believes it will have adequate cash to run its operations for the next year. In October, the company has agreed a credit facility with Rabo Bank (in the amount of € 1,250k) to cover working capital balances. In the event the Company needs additional funding, the Company could consider attracting additional credit facilities, or issue loans, or alternatively issue Convertible Bonds or shares. Based on all items discussed above, Management concludes that it is correct to prepare the accompanying financial statements on a ‘going concern’ basis.
Basis of ConsolidationThe consolidated financial statements include the financial statements of TIE Kinetix N.V. and its subsidiaries.
Where the Company has control over an investee, it is classified as a subsidiary. The Company controls an investee if all three of the following elements are present: power over the investee, exposure to variable returns from the investee, and the ability of the investor to use its power to affect those variable returns. The assessment of control is based on the substance of the relationship between the Company and the entity and, among other things, considers existing and potential voting rights that are presently exercisable and convertible. Subsidiaries are fully consolidated from the date of acquisition, which is the date on which the Company obtains control. It will continue to be consolidated until the date in which such control ceases. All intra-company balances, transactions, and income and expenses resulting from intra-company transactions are eliminated in full.
Foreign Currency TranslationForeign operations prepare their financial statements in the currency of the primary environment in which they operate (functional currency). For consolidation purposes, foreign operations are translated into Euro, the functional currency of TIE Kinetix N.V. and the designated presentation currency. Assets and liabilities are translated using the closing rate at September 30,
TIE KINETIX N.V. ~ ANNUAL REPORT 2016

732016. Income and expenses are translated using weighted average exchange rates or the actual rate at the date of the transaction, if more appropriate. All resulting exchange rate differences are recognized in a special component of equity. In the event of a sale of a foreign operation, the relevant component of the special component of equity pertaining to the entity sold will be released from Equity and included in the realized gain or loss on the sale.
Per September 30, 2016, monetary assets and liabilities are translated against the closing rate. Non-monetary items carried at a cost are translated by using the exchange rate at the date of the transaction. Exchange rate differences on monetary items are recognized in income whenever they arise.
Inter-company monetary items, which form part of an enterprise net investment, are translated against the closing rate per September 30, 2016. An inter-company current account between TIE Kinetix N.V. and the US subsidiary, TIE Commerce Inc. is denominated in USD. All transactions are accounted for at the transaction rate at TIE Kinetix N.V. Currency Exchange Rate Differences are taken to the special component of Equity.
Significant Accounting Judgments and EstimatesThe preparation of the financial statements involves making assumptions and estimates on the recognition and measurement of assets and liabilities, contingent liabilities and income and expense items. The most significant assumptions for future and other key sources estimation uncertainty at balance sheet date that have a significant risk of causing a material adjustment to the carrying amount of assets are in note 1, page 82.
Impairment of AssetsImpairments of assets (intangible and tangible) are tested on a Cash Generating Unit (CGU) level. In assessing whether there are indications for impairment or reversal of impairment, management considers changes in the economic and technological environment, sales trends and other data that may be, or become relevant. When testing for impairment, a discounted cash flow model is applied to determine net present values of future cash flows for CGU’s in order to compare with asset-carrying values. In accordance with IFRS no reversal of impairment of Goodwill has been considered. The models applied to determine the net present
value of these future cash flows encompasses management’s judgment and estimates with respect to the following elements:» Discount rate;» Reasonable reliably estimable future cash flows;» Estimated business growth rates.
Intangible Fixed Assets
Development CostsProduct development costs are eligible for capitalization only when a projected outcome is determined technically feasible and deemed probable that future economic benefits will flow from the released product. Also, these economic benefits must be expected to exceed capitalized development cost. In determining both technical and economic feasibility of a project, management exercises judgment with respect to the current economic and technical environment, as well as expected developments therein. This not only establishes a potential market for the product under development, but also estimates potential sales volumes.
Customer BaseThe Customer Base of recent acquisitions has been identified as a separate intangible asset upon acquisition. The asset has been recognized at fair value. Since there is no direct active market for the Customer Base to use for valuation, a valuation model has been used to determine the fair value of the asset. This valuation model encompasses management’s judgment and estimate with respect to the following elements:» Renewal rate customer contracts;» Discount rate;» Net Cash Flow starting point;» 10 years of discounted Cash Flow (5 years for
Customer Base of TFT);» No new business.
TIE KINETIX N.V. ~ ANNUAL REPORT 2016

74Notes to the Consolidated IFRS Financial Statements
Detailed Description of
Accounting Principles
Intangible Fixed Assets
GoodwillGoodwill is recognized as an intangible asset for interests in subsidiaries and is measured as the positive difference between the cost of the business combination and the Company’s interest in the net fair value of the entity’s identifiable assets, liabilities and contingent liabilities. Subsequently, goodwill is carried at a cost less accumulated impairment charges. Upon disposal of an entity in relation to which a goodwill balance is held, the remaining goodwill balance will be taken to income as part of the gain or loss on disposal of the entity.
Demand Generation Concept/FLOW Upon initial recognition of the assets and liabilities and activities during 2006, a separate intangible fixed asset representing the Content Syndication Concept was recognized. The fair value has been determined as described on page 82 under Trademarks. Initially, and awaiting the convergence of all TIE Kinetix’ business applications in one common platform, the Content Syndication Concept was considered to have an indefinite useful life and no amortization was applied. Upon the introduction of FLOW, the concept has been developed further and several product modules have now been developed that can only be sold using this concept. Upon the introduction of these FLOW product modules, TIE Kinetix management has re-assessed the concept and its useful life and considers an economic life of 7 years as viable. Management projects a useful life of 7 years in line with the useful life of generally used ERP software in the industry. As from January 1, 2016 onwards, all FLOW development efforts are allocated per commercial module. All FLOW modules are developed under the direction of the CTO and TIE Kinetix Management Team. FLOW product modules compete with products developed by other vendors in the market place and may be expected to be replaced by our next generation products over a 5 year period. For that reason management has assessed a useful life of 5 years. Development CostsProjects for the development of software are
broken down into a research phase and development phase. The costs pertaining to research are expensed immediately. The development costs are recognized as an intangible asset after establishing the technical feasibility of the project. Future economic benefits from the project are deemed probable and sufficient resources are available and devoted to the project to facilitate successful completion. Development costs are carried at a cost minus amortization and accumulated impairments. Development costs of products other than FLOW are amortized based on an expected useful life of three years. The useful life assessment is based on the current experience and the present economic and technological environment. The useful life of this asset is reassessed periodically and adjusted when circumstances give rise to such action.
SoftwareSoftware purchased from third parties, as well as the related development and implementation costs, are recognized at a cost without accumulated amortization and impairment charges and are amortized based upon a straight-line method over an estimated useful life of three years. The useful life of these assets is reassessed periodically and adjusted when circumstances give rise to such action.
Tangible Fixed Assets
Property, Plant and EquipmentOffice equipment (including Furniture, Fixtures and Office Machinery), Hardware and Leasehold Improvements are recognized as Property, Plant and Equipment and measured at cost less accumulated depreciation and impairments. Costs include expenses directly attributable to the acquisition of the asset and the expense of replacing a part of the Property, Plant and Equipment when that cost is incurred and the recognition criteria are met. Each component of an item of Property, Plant and Equipment with an initial carrying value (cost) significant in relation to the total cost of the item is separately depreciated. Property, Plant and Equipment is depreciated against income on a straight-line basis over its estimated useful life to its estimated residual value (generally nil). Depreciation periods are as follows:» Leasehold improvements – 10 years or the term of
the lease;
TIE KINETIX N.V. ~ ANNUAL REPORT 2016

75» Hardware – 3-5 years;» Office equipment – 3-5 years.
Useful life estimates are based on management’s best estimate of the amount of time over which economic benefits from these assets will flow to the Company. For Leasehold improvements, this period has been limited to the term of the rental agreements of the respective office buildings.
Computer hardware is generally replaced after a maximum of three years of service.
An annual assessment is performed to establish whether circumstances exist to call for an impair-ment of an individual asset. Residual values and useful lives are reviewed annually and are adjusted when appropriate. Assets are impaired to recoverable value when carrying values are found to be in excess of the recoverable amount of the individual or as part of a CGU for assets that do not generate an independent cash flow. Impairment losses for CGU’s as a whole are first charged against the Goodwill balances of the CGU. Any remaining impairments are allocated to the assets of the CGU as a whole. Any reversal of an impairment loss is immediately recognized in income.
The carrying amount of an asset is derecognized in the event that no future economic benefit is expected to arise from its use or disposal. Gains and/ or losses on derecognition are the differences between the net disposal proceeds and the carrying value of the asset. Gains and/or losses on derecognition are accounted for in income.
Financial Assets
Deferred Tax AssetsDeferred Tax Assets reflect the net tax effect of losses carried forward and temporary timing differences between the carrying amounts of assets for financial reporting purposes and the amounts used for income tax purposes. Deferred Tax Assets are recognized when they are considered to be realizable in the future, which is reassessed each year-end. Deferred Income Tax Assets are measured at the tax rates that are expected to apply to the year when the asset is realized, based on tax rates (and tax laws) that have been enacted or substantively enacted per year-end. Deferred Tax Assets and
Deferred Tax Liabilities are offset if a legally enforceable right exists to set off current tax assets against current income tax liabilities and the deferred taxes relate to the same taxable entity and the same taxation authority.
Loans and Receivables/Trade Receivables Loans and Receivables are recognized initially at fair value plus transaction costs. After initial measurement loans and receivables are measured at amortized cost, using the effective interest method net of impairments. This involves calculating the net present value of future cash flows using the current market rate at the time of initial recognition of the asset. Interest is accounted for in the Statement of Comprehensive Income at the effective interest rate at the time of the initial recognition of the asset. Impairments are only considered when there are indications of impairment. The difference between the effective interest rate and the (notional) interest receivable is allocated to the asset balance changing its carrying value. Trade Receivables are recognized at amount receivable less a provision for uncollectability. The provision for uncollectability is set up on an item for item basis when there is evidence of uncollectability. The provision represents the difference between carrying value of trade receivables and management’s best estimate of the future cash flow resulting from the item. All strengthening and releases from the provision are accounted for in income.
Other receivables include unbilled turnover for services already provided, other receivables and accrued income. Accrued income also includes amounts receivable for projects in progress at the balance sheet date insofar as these receivables have already exceeded the amounts billed for these projects. If the amounts billed for current projects exceed the sum of costs incurred and gains realized, the balance of these projects is recognized within `other payables´.
Cash & Cash EquivalentsCash and Cash Equivalents include cash in hand, deposits, and other short-term highly liquid investments with original maturities of three months or less. For the purpose of the consolidated cash flow statement, cash and cash equivalents consist of cash and cash equivalents as defined above, excluding bank overdrafts.
TIE KINETIX N.V. ~ ANNUAL REPORT 2016

76Notes to the Consolidated IFRS Financial Statements
Equity
Shareholders’ EquityFinancial instruments issued by the Company to the extent that they indicate a residual interest in the assets of the Company are classified as Equity. All proceeds from the issue of equity instruments, or considerations paid for the purchase of equity instruments, are recognized in Equity. Incremental external costs that are directly attributable to the issuing of TIE Kinetix equity instruments are also recognized in Equity, net of tax. Dividends and other distributions to holders of equity instruments are recognized in Equity net of tax. A liability for dividends payable is not recognized until the dividends have been declared and approved by the General Meeting of Shareholders.
Convertible BondsConvertible Bonds issued by the Company have been classified as Equity, based on the fact that under the terms and conditions of these bonds, there is evidence of a residual interest in the Company’s assets after deducting all of its liabilities. If applicable, split accounting has been applied for. Distributions to holders of equity instruments are recognized directly in Equity net of tax.For Convertible Bonds in which a liability component has been identified with respect to interest payments in cash, a liability is established against Equity.
Non-Employee Stock OptionsStock Options/Warrents issued to non-employees are Gross Settled Stock Options under the terms of the respective contracts, and, therefore, qualify as Equity Instruments. Any considerations received for such options will be accounted for in Equity. Any cash flows at settlement are accounted for in Equity as well.
Liabilities
LoansLoans are recognized initially at fair value plus transaction costs. After initial recognition, interest bearing loans and borrowings are subsequently measured at amortized cost using the effective interest rate method. Gains and losses are recognized in the income statement when the liabilities are derecognized as well as through the amortization process. Amortized cost is calculated by taking into account any discount or premium on
acquisition and fees or costs that are an integral part of the effective interest rate. The effective interest rate amortization is included in finance costs in the Comprehensive Statement of Income.
ProvisionsThe Company recognizes a provision in cases in which a present obligation resulting from a past event, with a probable future outflow of resources, settles the obligation at an amount that can be reliably estimated.
Provisions are measured at the present value of the future outflow required to settle the obligation, using a pre-tax rate that reflects current market assessments of the time value of money and the risks specific to the obligation. The change in the time value of future outflows is recognized under expenses. The time value is considered a material component.
To the extent that future events are likely to occur and are expected to have an effect on the amount required to settle a recognized liability, these future events are taken into consideration in determining the appropriate provision level. Provisions are reviewed at each balance sheet date and will be adjusted to reflect the current best estimate.
Deferred Tax LiabilityDeferred tax is provided using the liability method on temporary differences between the tax bases of assets and liabilities and their carrying amounts for financial reporting purposes at the reporting date.
Deferred tax liabilities are measured at the tax rates that are expected to apply in the year when the liability is settled, based on tax rates (and tax laws) that have been enacted or substantively enacted at the reporting date. Deferred Tax Assets and Deferred Tax Liabilities are offset if a legally enforceable right exists to set off current tax assets against current income tax liabilities and the deferred taxes relate to the same taxable entity and the same taxation authority.
Recognition and Measurement of Income and Expenses
Recognition of IncomeIncome is recognized to the extent that it is
TIE KINETIX N.V. ~ ANNUAL REPORT 2016

77probable that economic benefits will flow to the Company and be reliably measured. Revenue is measured at the fair value of the consideration received, excluding taxes and following the deduction of discounts and rebates as well as the transferring of all significant risks and rewards.The Company generates income from the following sources:» Software license fees;» Maintenance and Support;» Consultancy Services;» Software as a Service;» Other income.
LicensesRevenues from software licenses are recognized at once when the purchase agreement has been reached with the customer and the software has been shipped to the client. At that point:» A non-revocable agreement has been reached;» The delivery of the software has been made;» The fee is determinable;» The collection of the receivable outstanding is
deemed probable by management.
Maintenance and SupportMaintenance subscriptions include relevant updates of TIE Kinetix products and (telephone) support. The related revenues are recognized over the contract period where services are provided.
Consultancy ServicesWhile consultancy services are generally provided over a short period of time, the outcome of the transaction can be reliably estimated. Revenues are recognized in the period in which the service is provided on a percentage of completion. Revenue from fixed-price contracts for delivering design services is recognized by reference to the stage of completion of a transaction as a proportion of the total transaction (percentage of completion (POC) method), where the services performed on the balance sheet date can be reliably measured and the costs incurred for the transaction and the costs required to complete the transaction can be reliably estimated. Under the POC method, revenue is recognized based on the services performed to date as a percentage of the total estimated costs to meet the contractual obligations. This estimate is primarily based on the services/hours already performed/ booked in relation to the services/hours still to be performed/booked. If circumstances arise that may change the original estimates of extent of progress
toward completion, estimates are revised. These revisions may result in increases or decreases in estimated revenues or costs and are reflected in income in the period in which the circumstances that give rise to the revision become known by management.
Software as a Service (SaaS)SaaS consists of webEDI, Managed Services, Value Added Network services, Content Syndication and E-Commerce. These services are generally provided on the basis of a 12, 24 or 36 month contract whereby fees are based on actual use of either the service or a subscription fee or a combination of both.
Other SaaS revenues consist of revenues from marketing campaigns, which are invoiced on a “pay as you go” basis. Revenues are accounted for on a percentage of completion.
Other IncomeEU and other grants are accounted for under other incomes. EU and other grants are recognized only when there is reasonable assurance that the Company will comply with the conditions attached to them and the grants will be received. These EU and other grants are recognized as income over the periods necessary to match them with the related costs, which they are intended to compensate.
Deferred RevenuesDeferred Revenues consist of the unearned portion of revenues pertaining to maintenance and subscriptions as well as amounts invoiced in advance on software design, installation, and consultancy projects.
Direct Purchase CostsDirect Purchase Costs represent the cost directly associated with revenue. This includes hosting costs, third party consultants, and costs of third-party software.
Employee Benefits and Expenses
Short term Employee BenefitsShort-term Employee Benefits entail salaries payable over past service, short-term compensated absences in which they are expected to occur within twelve months after the end of the period in which the employee renders the related service, profit sharing, or bonus arrangements. A liability is set up to the extent that amounts are due based on rendered services. WBSO (Wet Bevordering Speur- en
TIE KINETIX N.V. ~ ANNUAL REPORT 2016

78Notes to the Consolidated IFRS Financial Statements
Ontwikkelingswerk) received as a grant on wage tax has been deducted upon the employee benefits expenses.
Termination BenefitsTermination Benefits are the result of the Company’s decision to terminate an employee’s employment before normal retirement date. Termination benefits are expensed immediately when the Company is demonstrably committed to terminate employment prior to normal retirement date. The termination benefits include all termination of employment related expenses.
Post-Employment BenefitsThe Company operates with insured defined contribution pension plans in the Netherlands and Germany. Under the terms and conditions of this plan, the Company has no obligation towards the employees covered under the plan, other than to pay a fixed contribution. The contributions payable are recognized as an expense in income. To the extent that the paid amount exceeds the amount due for services rendered, an asset is recognized. Plan contributions payable to a third-party insurer are recognized as a liability.
TIE Kinetix France has an arrangement resulting in a retirement bonus, which qualifies as a post- employment arrangement under IFRS. While the present value of this retirement bonus liability is recognized on the face of the Statement of Financial Position, movements in this liability are accounted for in income. In the US, the Company staff participates in a corporate 401(k) savings plan with its discretionary contributions. These discretionary payments are recognized in income if and when they are paid into the plan.
Share Based PaymentsIn prior years, the Company has issued stock options under a Stock Option Plan to TIE Kinetix staff that entitles staff members to receive equity instruments it has issued. These Stock Options Plans are classified as Equity Settled Instruments. Stock Options granted under the annual Stock Options Plan have a vesting period of three years after issuance. Stock Options granted under another Stock Options Plan contain a vesting period amounting to one to three years. The expense resulting from the options is based on the fair value of the options at grant date. The expense is recognized in income, with the offsetting entry in Equity over the term in which the services are rendered, i.e. the vesting period of the options. The
expense reflects management’s best estimate of the number of Stock Options expected to vest. Any considerations received net of any directly attributable transaction costs are accounted for in Equity upon exercise of the options. When a Stock Option is cancelled, it is treated as if it had vested on the date of cancellation, and any expense not yet recognized for the Stock Option is recognized immediately. However, if a new Stock Option is awarded in substitution of the cancelled Stock Option, the substitution is treated as if it is a modification of the original. An additional expense is recognized to the extent the modification results in an increased fair value of the modified Stock Options, compared to the original ones.
In 2016 the Company has implemented a Performance Share Plan. Under this Plan, certain members of the TIE Kinetix Management Team may be awarded shares, based on achievement of performance conditions tied to the company’s operational performance and achievement of strategic goals. Shares issued under the Performance Share Plan are subject to transfer restrictions.
LeasesArrangements have been assessed to determine the extent in which the fulfillment is dependent on the use of a specific asset, and secondly, whether the arrangement conveyed the right of use of that specific asset. Arrangements satisfying both criteria have been classified Leases. Reassessment of these arrangements will take place under the following circumstances:» Change in the terms of the contract;» Exercise of a renewal option;» A change in determination of the arrangement;» An asset subject to the arrangement undergoes a
substantial physical change.To the extent that an arrangement contains, among other components, a lease, the lease element is accounted for separately from other components. Classified as operating leases are ones in which a significant portion of the risks and reward of ownership are retained by the lessor. Payments made under operating leases are charged to the Statement of Comprehensive Income on a straight-line basis over the period of the lease.
Earnings per ShareBasic Earnings per Share are calculated by dividing net income attributable to equity holders of TIE Kinetix after deduction of interest on Convertible Bonds, by the weighted average number of
TIE KINETIX N.V. ~ ANNUAL REPORT 2016

79outstanding shares. Diluted Earnings per Share take into effect the dilutive effect of convertible instruments and stock options upon exercise or conversion. The dilutive effect of these instruments equals the number of shares issuable under the terms and conditions of these arrangements for no consideration. Stock Options are considered non-dilutive when the exercise price of the Stock Options is in excess of the average market price of the shares during the period. Convertible Bonds are considered non-dilutive when the related interest net of tax and other changes to income and expense, per ordinary share obtainable upon conversion, exceed the basic earnings per share.
Post Balance Sheet EventsThese financial statements include the effects of events occurring between balance sheet date and the date these financial statements are authorized for issue, to the extent that these events provide evidence of conditions that existed at the balance sheet date. While effects of events that arise post-balance sheet date are disclosed, they have not resulted in an adjustment of the financial statements.
Financial Risk ManagementThe Company’s activities expose it to a variety of risks, including market (currency risk and interest rate risk), credit, and liquidity risks. Financial instruments are accounted for under Assets (Loans and Receivables) and Equity (Convertible Bonds). The Company neither holds nor issues financial instruments for trading or hedging purposes.
Fair ValueThe Company does not hold any financial assets or liabilities accounted for at fair value through the profit and loss. Fair values disclosed are calculated based upon current interest rates, taking into account the terms and conditions of the financial asset or liability. In most cases, fair values will equal the carrying value of the item.
Derecognition of Financial AssetsAll items derecognized during this financial year have been taken from the face of the balance sheet if and when substantially all risks and rewards of ownership have been transferred.
Reclassification of Financial AssetsNo Reclassification of Financial Assets has been
applied in 2016 (nor in 2015).
Currency RiskThe Company operates across the globe in various currency environments and is exposed to foreign exchange risks, mainly with respect to the US dollar. To minimize the exposure, it is the intention to balance assets and liabilities in foreign currencies as much as possible. The local balance sheet contains no foreign currency other than the functional currency of the entity. Currency effect arised during the year are directly accounted for in the Consolidated Statement of (Comprehensive) Income, limiting the exposure for currency risk per balance sheet (IFRS 7.35 and 42).Reference rates include 1.1181 (2015: 1.1222) for the year-end closing rate, USD against the Euro. For net income, the average rate of USD against the Euro was 1.1121 (2015: 1.1423).Management has provided an analysis of the effects of multiple scenarios, all within a range that may be considered likely to occur, rather than limiting the analysis to a single scenario.
Credit RiskThe Company has assessed its credit risk. The Company has no significant concentrations of credit risk. The Top 100 customers account to 68% (2015: 69%) of total revenue, while no individual customers accounts to more than 8.3% (2015: 7.4%). The Company serves a number of verticals like Business Services, Industry & Home Improvement, Telecom, Insurance, Food Industry & Food Retail, Non Food, Consumer Electronics, Transport & Logistics, Office Supplies, Automotive, Medical and Others mitigating the risk of being dependent from one sector.
Management has policies in place to ensure that sales of products are made to customers with an appropriate credit history. In the event of collectability issues, the Company takes an impairment charge to cover the potential loss. The requirement for impairment is analyzed at each reporting date on an individual basis for major clients. Additionally, based on actually incurred historical data the remaining receivables are assessed for impairment collectively.
The maximum risk is the outstanding balance of Loans and Trade Receivables, for details see page 89. The Top 10 outstanding debtors amount to 47% (2015: 49%) of the outstanding receivables. Credit Risks form balances with banks relates to the risk that certain
TIE KINETIX N.V. ~ ANNUAL REPORT 2016

80Notes to the Consolidated IFRS Financial Statements
financial covenants are not met, which could trigger early termination resulting in redemption of the loan. Outstanding bank balances are recorded against their carrying amount. The Company has no derivative financial instruments in use.
Liquidity RiskIn the past, the Company experienced from time to time temporary cash flow shortages, caused by incidental events such as the EU damages or occasionally caused by seasonal effects such as increased debtor balances. In the past, such cash flow shortages have been resolved either through issuing additional shares, or the conversion of financial instruments (bonds or warrants) to fund working capital. Due to the fact that the Company SaaS business is growing, the Company is becoming less sensitive to cash flow seasonality. However, with
the expansion of our business the Company also engaged in contracts with commercially dominant counterparts with who occasionally extended payment terms have been agreed. These payment terms put a strain on working capital balances. The company has a working capital facility in place for working capital purposes. The Company’s current liabilities consist for a substantial part out of deferred revenue, limiting the Liquidity Risk that may exist. The remaining liquidity risk of the Company originating from financial instruments is limited. Management regularly assesses the outstanding debt position as well as the outstanding equity instruments. It also evaluates funding opportunities, like issuing new shares and/or Convertible Bonds and obtaining a new credit facility, further limiting the liquidity risk.
Short term Long term
Summary of Financial Liabilities > 0 months< 3 months
> 3 months< 12 months
> 1 year < 5 years > 5 years
Total2016
Loans/Long term Debt 40 42 - - 82
Bank overdraft - - - - -
Trade Creditors 553 273 - - 826
Other Payables 334 1,001 - - 1,335
Total 927 1,316 - - 2,243
Short term Long term
Summary of Financial Liabilities > 0 months< 3 months
> 3 months< 12 months
> 1 year < 5 years > 5 years
Total2015
Loans 189 370 1,165 - 1,724
Bank overdraft 173 519 - - 692
Trade Creditors 785 386 - - 1,171
Other Payables 432 1,298 - - 1,730
Total 1,579 2,573 1,165 - 5,317
Summary of financial liabilities (including long term liabilities) based on contractual undiscounted payments per year-end 2016 and 2015:
TIE KINETIX N.V. ~ ANNUAL REPORT 2016

81In 2016, the company redeemed non-current liabilities, comprising of long term debts due to TFAG and credit institutions, from € 1,165k (September 30, 2015) to € 9k (September 30, 2016). In the same period current liabilities, short term debt and bank overdrafts, were redeemed from € 1,552k to € 34k.
Interest Rate RiskInterest Rate Risk is defined as the risk that the fair value or future cash flows of a financial instrument will fluctuate due to changes in market interest rates. The exposure of the Company to this risk is limited to the financial instruments with RABO Bank (EURIBOR based). Due to the nature of the financial instruments as well as the fact that assets are held to maturity the Convertible Bonds are expected to be converted into common shares, either on or prior to maturity date. The Convertible Bonds outstanding at
2016 year-end are non-interest bearing. Management regularly assesses the outstanding debt position and evaluates funding opportunities.
At 2016 year-end, the Company held € 34k (2015: € 559k) short term (interest bearing) debt, resulting from the acquisitions of Light (bearing interest at 6.5%). The remaining payments of the settlement of the Samar claim are included under current liabilities (€ 72,912).
Business Combinations
Acquisitions 2016No acquisitions have been made in 2016.
Liability Interest rate Outstanding 30-9-2016
+10 basis points
-10 basis points
Rabobank RABO BASE + 500bps - 0 0
TF AG EURIBOR + 300 bps - 0 0
DZ Bank EURIBOR + 275 bps - 0 0
The impact of a variable interest rate on the liabilities are as follows:
TIE KINETIX N.V. ~ ANNUAL REPORT 2016
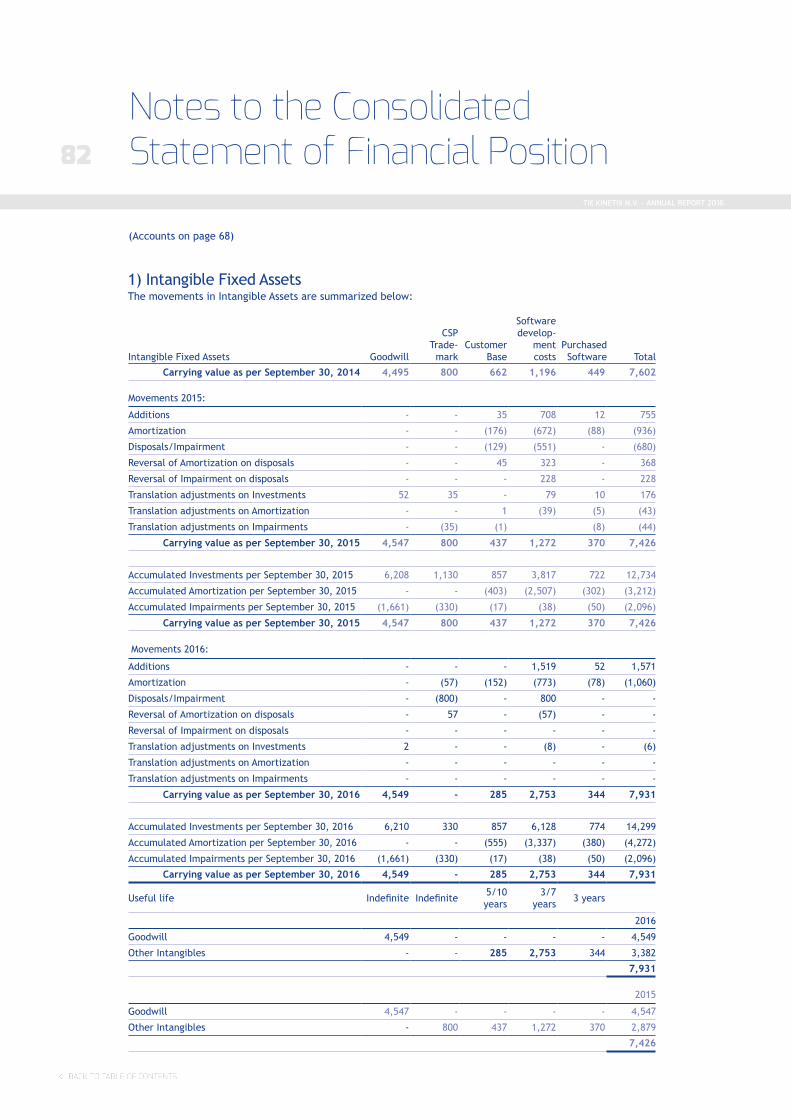
82
1) Intangible Fixed AssetsThe movements in Intangible Assets are summarized below:
(Accounts on page 68)
Intangible Fixed Assets Goodwill
CSP Trade-
mark Customer
Base
Software develop-
mentcosts
PurchasedSoftware Total
Carrying value as per September 30, 2014 4,495 800 662 1,196 449 7,602
Movements 2015:
Additions - - 35 708 12 755
Amortization - - (176) (672) (88) (936)
Disposals/Impairment - - (129) (551) - (680)
Reversal of Amortization on disposals - - 45 323 - 368
Reversal of Impairment on disposals - - - 228 - 228
Translation adjustments on Investments 52 35 - 79 10 176
Translation adjustments on Amortization - - 1 (39) (5) (43)
Translation adjustments on Impairments - (35) (1) (8) (44)
Carrying value as per September 30, 2015 4,547 800 437 1,272 370 7,426
Accumulated Investments per September 30, 2015 6,208 1,130 857 3,817 722 12,734
Accumulated Amortization per September 30, 2015 - - (403) (2,507) (302) (3,212)
Accumulated Impairments per September 30, 2015 (1,661) (330) (17) (38) (50) (2,096)
Carrying value as per September 30, 2015 4,547 800 437 1,272 370 7,426
Movements 2016:
Additions - - - 1,519 52 1,571
Amortization - (57) (152) (773) (78) (1,060)
Disposals/Impairment - (800) - 800 - -
Reversal of Amortization on disposals - 57 - (57) - -
Reversal of Impairment on disposals - - - - - -
Translation adjustments on Investments 2 - - (8) - (6)
Translation adjustments on Amortization - - - - - -
Translation adjustments on Impairments - - - - - -
Carrying value as per September 30, 2016 4,549 - 285 2,753 344 7,931
Accumulated Investments per September 30, 2016 6,210 330 857 6,128 774 14,299
Accumulated Amortization per September 30, 2016 - - (555) (3,337) (380) (4,272)
Accumulated Impairments per September 30, 2016 (1,661) (330) (17) (38) (50) (2,096)
Carrying value as per September 30, 2016 4,549 - 285 2,753 344 7,931
Useful life Indefinite Indefinite 5/10 years
3/7 years 3 years
2016
Goodwill 4,549 - - - - 4,549
Other Intangibles - - 285 2,753 344 3,382
7,931
2015
Goodwill 4,547 - - - - 4,547
Other Intangibles - 800 437 1,272 370 2,879
7,426
Notes to the Consolidated Statement of Financial Position
TIE KINETIX N.V. ~ ANNUAL REPORT 2016

83With the introduction of FLOW, the company has re-assessed the useful life of the trademark CSP (from indefinite to 7 years) and amortizes this Intangible Asset accordingly. This asset was transferred from the category trademark to software development costs. Other movements consist of Foreign Currency movements for the North American CGU and TIE Ascention in Switzerland. The movement of the software development costs predominantly consists of the year’s capitalized-developed software, the depreciation thereupon and disposal of fully amortized (and impaired) software that is not in use anymore.
ImpairmentsCash generating units are identified in line with the way management monitors, and will continue to monitor, the business. This is based on the internal reporting to the Executive Board as main decision making body in the company. Our planning and reporting is based on business line segments, as well as using country segments. All revenue, direct costs and fee earning staff are allocated to business lines. To avoid arbitrary and volatile allocation, indirect costs and non-fee earning staff are not allocated directly to business lines, but rather allocated to country operations (or holding functions). TIE Kinetix has four business lines (Integration, E-Commerce, Demand Generation and A&O) and country operations in the Netherlands, in the US, in Germany, and in France. This leads to the following cash generating units:» TIE Nederland+International » TIE France
» TIE US » TIE Germany
» TIE E-Commerce » TIE Product Development
As in past years we used a discounted cash flow model to determine the value in use, based on a 12% WACC and 10 years horizon. Management has assessed the assumptions used and has conducted sensitivity tests with WACC of 13% and 14%.
Management has conducted annual impairment testing and assessed that for all cash generating units the Value in Use [IAS 36.30-57] exceeds Carrying Value [IAS 36.8-9]. Furthermore, management has no indications that individual assets of any cash generating units may be impaired.
Headroom considerationsWith respect to TIE Kinetix Germany GmbH management assessed the following. The former owner TFAG committed to a revenue guarantee expiring at December 31st 2015. In the succeeding periods actual revenue developed at lower levels. Management conducted impairment testing as at September 30, 2016 taking into account actual business performance and the best estimate planned performance. As in prior years we have used a discounted cash flow model to determine the value in use, based on 12% WACC and a 10 years horizon. Based on the chosen assumptions, management assessed that for the cash generating unit TIE Kinetix Germany the Value in Use [IAS 36.30-57] exceeds Carrying Value [IAS 36.8-9], and that currently available headroom for the cash generating unit TIE Kinetix Germany remains limited as at September 30, 2016. New impairment testing will be conducted at September 30, 2017, or earlier upon the occurrence of a triggering event.
With respect to TIE MamboFive BV management has assessed the following. TIE MamboFive’ major customer is T-Mobile Netherlands, for who various Webshops and portals have been successfully developed, and are being serviced and maintained to the customer’s full satisfaction. The contract with T-Mobile formally terminates at February 2017. At the request of T-Mobile, parties are currently engaged in negotiation for the extension of contract. Management has conducted impairment testing as at September 30, 2016 based on the assumption that the T-Mobile contract can be extended with terms and conditions generating sufficient headroom of the Value in Use [IAS 36.30-57] over Carrying Value [IAS 36.8-9]. New impairment testing will be conducted at September 30, 2017, or earlier upon the occurrence of a triggering event.
TIE KINETIX N.V. ~ ANNUAL REPORT 2016

84Notes to the Consolidated Statement of Financial Position
CGU NL+Int France US DACHE-com-merce
Prod.Dev.
Total 2016
Goodwill 594 153 473 2,282 1,046 - 4,549
Trademarks - - - - - 743 743
Customer Base 24 - - 134 119 - 277
Software Development Costs - - 162 - - 1,858 2,020
Purchased Software 329 1 13 - - - 343
Total 946 155 648 2,416 1,165 2,601 7,931
CGU NL+Int France US DACHE-com-merce
Prod. Dev.
Total 2015
Goodwill 594 153 472 2,282 1,046 - 4,547
Trademarks - - - - - 800 800
Customer Base 35 - - 194 208 - 437
Software Development Costs - - 351 - - 921 1,272
Purchased Software 352 - 13 5 - - 370
Total 981 153 836 2,481 1,254 1,721 7,426
Allocation of the carrying value of the Intangible Fixed Assets tested to the CGU’s and segments for impairment per September 30, 2016 and comparative number per September 30, 2015 are as follows:
As in previous years impairment test was based on a discounted cash flow model to determine the value in use. In 2007, the goodwill and trademark for the Netherlands were fully impaired. For 2012 and 2011, the recoverable amount of a CGU was determined based on value in use calculation. The impairment of the CSP concept is now fully reversed. For further details regarding the assumptions see below. In 2013 the goodwill of Ascention and the value of Ascention’s product Revolution were fully impaired.
For all Cash Generating Units modest annual growth rates have been applied (varying between 0-15% for all operations) in line with our multi-year planning assumptions and based on market estimates of external advisory firms. These growth rates are used to extrapolate cash flow beyond budget 2017, as approved by the Management Board and Supervisory Board and the following nine years. After ten years no residual value is taken into account. A discount rate of 12% before tax has been used;
Growth Rate Estimates: Growth rates are based on published industry research and management’s assessment of how the CGU develops in the forecast period. The growth rate applied varies per CGU, which varies in the range of 0% upto 15%. Residual Value: Our discounted cash flow calculation showed no residual value after 10 years; adding additional years to the cash flow calculation have limited effect under the applied discount rate and the residual value becomes less predictable. Discount Rate: The discount rate is based on the WACC and reflects the current market assessment of the risks specific to each CGU. The discount rate used was estimated on the weighted average costs of capital for shareholders’ equity and loan capital. The cost structure of shareholder’s capital is determined on the basis of the interest rate adjusted for cyclical and market risks. The rate of loan capital is determined on the basis of an interest rate for long term state loans for business risks and also adjusted due by a reasonable risk premium for SME’s. The assumptions have been used for the analysis of each CGU within the operating segment for Intangible assets and Goodwill as well as over the total Company.
Sensitivity analysisWith regard to the assessment of the recoverable amount of each CGU and the total Company, management believes that reasonably possible change in any of the above key assumptions could cause changes to the results of the executed impairment test. For sensitivity analyses on the impairment see above.
TIE KINETIX N.V. ~ ANNUAL REPORT 2016

852) Tangible Fixed Assets
Property, Plant and EquipmentMovements in Property, Plant and Equipment are shown below:
Tangible Fixed Assets Fixtures & Fittings Hardware Total
Accumulated Investments per September 30, 2014 494 693 1,187
Accumulated Amortization per September 30, 2014 (176) (399) (575)
Accumulated Impairments per September 30, 2014 (7) (9) (16)
Carrying value as per September 30, 2014 311 285 596
Movements 2015 Additions 108 58 166
Depreciation per Statement of (Comprehensive) Income (76) (161) (237)
Disposals - (6) (6)
Amortization on Disposals - 6 6
Translation Adjustments Investments 15 22 37
Translation Adjustments Depreciation (10) (19) (29)
Carrying value as per September 30, 2015 348 185 533
Accumulated Investments per September 30, 2015 617 767 1,384
Accumulated Amortization per September 30, 2015 (262) (573) (835)
Accumulated Impairments per September 30, 2015 (7) (9) (16)
Carrying value as per September 30, 2015 348 185 533
Movements 2016 Additions 12 104 116
Depreciation per Statement of (Comprehensive) Income (87) (201) (288)
Disposals (18) (15) (33)
Amortization on Disposals 10 6 16
Impaired value on Disposals 8 9 17
Impairments - - -
Translation Adjustments Investments - 1 1
Translation Adjustments Depreciation - - -
Carrying value as per September 30, 2016 273 89 362
Accumulated Investments per September 30, 2016 611 857 1,468
Accumulated Amortization per September 30, 2016 (339) (768) (1,107)
Accumulated Impairments per September 30, 2016 1 - 1
Carrying value as per September 30, 2016 273 89 362
Useful life 4 to 10 years 3 years
At balance sheet date there are no restrictions on title. No items of Property Plant and Equipment have been pledged as security against liabilities. The fair value of the Property, Plant and Equipment is deemed to be a close approximation of the carrying value. The investments in Fixtures & Fittings predominantly relate to Leasehold and Office Equipment in the US; while Hardware relate to new computer equipment in all territories. The translation adjustment on Investments and Depreciation predominantly results from the fluctuation of the US Dollar.
TIE KINETIX N.V. ~ ANNUAL REPORT 2016

86
3) Financial Assets
Deferred Taxes
The deferred tax and movements thereupon are discussed below.
United StatesThe carrying value of the Deferred Tax Asset in the US amounts to € 694k ($ 775k) in the US (2015: € 1,168k or $ 1,310k). The Deferred Tax Asset in the US pertains in full to the activities of the Company in the United States and represents temporary differences and tax losses carried forward to the extent management expects to recover these items from probable future taxable income. The recognized deferred tax asset represents the full amount of tax losses carried forward; management assessed the good historical track record and stability of the business going forward with sizeable portion recurring revenue and margins, and considers strong likelihood of utilizing the tax loss carry forward position. A summary of the detailed breakdown of movements in the deferred tax amount is provided below:
Deferred Taxes Balance as of October 1, 2016 2015
From US operations 694 1,168
From Dutch operations - 0
Balance as at September 30, 694 1,168
Temporary Differences (Asset) 2016 2015
Deferred Revenue 1,308 1,314
Acrrued vacation days 152 157
Bad debt impairments - 24
R&D capitalization 108 -
Depreciation of fixed assets 48 46
Rent 35 -
AMT credits 44 -
Total Temporary Differences (Asset) 1,695 1,541
Temporary Differences (Liability) 2016 2015
Goodwill (473) (472)
R&D capitalization - (83)
Total Temporary Differences (Liability) (473) (555)
Total Temporary Differences (Net position) 1,222 986
Net deferred Tax Asset 2016 2015
Deferred Tax Asset at 40% on temporary differences 483 398
Deferred Tax Asset at 40% on loss carry forward 211 770
Net deferred Tax Asset 694 1,168
Notes to the Consolidated Statement of Financial Position
TIE KINETIX N.V. ~ ANNUAL REPORT 2016

87Movements 2016 2015
Balance as at October 1, 1,168 1,344
Credited/(Debited) to Income on temporary differences 84 (63)
Credited/(Debited) to Income on loss carry forward (561) (279)
Net Currency Translation Effect 3 166
Balance as at September 30, 694 1,168
The amount debited to income pertains to the temporary differences € 84k and carry forward of tax losses (€ 561k) detailed above. The principle item included in the temporary difference is the tax pertaining to the change in the temporary difference between the carrying value and the tax base of the Goodwill and deferred revenues. In addition to the temporary differences, there is a fully recognised Loss Carry Forward in the US amounting to € 632k ($ 707k). Based on the current tax legislation in the United States, the federal loss carry forward potential has a remaining life of between 11 to 20 years, starting with the losses incurred in 2005.
The NetherlandsIn the Netherlands, the available but substantially unrecognized loss carry forward totals € 9,075k (2015: € 10,818k), which is available to offset future taxable income for a maximum period of 9 years. The total amount that lapsed in FY 2016 amounts to € 1,6 mln. The carrying value of the Deferred Tax Asset in the Netherlands amounts to € 0k (2015: € 0k). Management has decided not to recognize the carrying value of the Netherlands Deferred Tax Asset because of low track record of cash flow against plan realization, including the currently uncertain outcome of how the EC is handling the EU claim.
In previous years no deferred tax liability was recognized for temporary fiscal differences in the Netherlands, because of the availability of sufficient unrecognized carry forward losses to compensate. In 2015 it was decided to adjust this and disclose the deferred amounts separately. A Deferred Tax Liability has been created for temporary differences in the Netherlands amounting to € 267k (2015: € 251k) resulting from Goodwill CSP and Trademark CSP. Comparative figures are adjusted for this purpose as well. Based on IAS 12.34 and in view of the available tax loss carry forward position a Deferred Tax Asset has been created for the same amount as it is expected that the temporary fiscal differences will be settled in the same period that unrecognised tax losses are available. Both amounts are offset against each other and therefore the net impact of this adjustment is nil.
Net deferred Tax Asset 2016 2015
Deferred Tax Asset at 20/25% on temporary differences (267) (251)
Deferred Tax Asset at 20/25% on loss carry forward 267 251
Net deferred Tax Asset - -
Temporary Differences 2016 2015
Goodwill (594) (534)
Trade Mark (743) (720)
Total Temporary Differences (Asset) (1,337) (1,254)
Total deferred tax liability for Temporary Differences at 20/25% (267) (251)
TIE KINETIX N.V. ~ ANNUAL REPORT 2016

88Notes to the Consolidated Statement of Financial Position
Loans and Receivables 2016 2015
Balance as of October 1, 895 196
Movement from short term receivables 63 797
Movement to short term receivables (509) (98)
Balance as at September 30, 449 895
The opening balance relates to the acquisition of TIE Light (previously Light) and prepaid amounts to suppliers (resulting from SaaS sales to customers for the part > 1 year). The movement relates to the movement in supplier prepayments.
Loans and Receivables
Movements 2016 2015
Balance as of October 1, - 347
Charged to Income from loss carry forward - (347)
Balance as at September 30, - -
TIE KINETIX N.V. ~ ANNUAL REPORT 2016

89
Trade ReceivablesThe following table reflects the gross outstanding Trade Receivable balance as of September 30, broken down into 1) balances that have not passed their due dates and 2) balances that have passed their due dates. The latter category is further broken down into categories detailing the extent to which they have passed their due dates. The “less than 30 day” outstanding category represents receivables that have not yet passed their respective due dates and are not impaired.
Trade Receivables and Other Receivables 2016 2015
Trade Receivables 2,893 3,600
Less: Valuation Allowance (61) (389)
Trade debtors net of valuation allowance 2,833 3,211
Income Tax Receivable 34 8
Taxation and social security prepaid 57 90
Security Deposits 86 86
Subsidized Projects 159 76
Projects to be Invoiced (WIP) 376 466
Employees 6 -
Prepayments 1,234 1,200
Other Receivables and Prepayments 1,861 1,828
Total 4,785 5,137
Past due not impaired
Trade Receivables by region
Less than 30 days
31 to 61 days
61 to 90 days
In excess of 90 days
Total 2016
The Netherlands 1,096 15 2 57 1,171
North America 736 208 82 32 1,058
France 145 10 12 41 208
DACH 378 74 - 3 456
Total 2,355 308 96 134 2,893
Past due not impaired
Trade Receivables by region
Less than 30 days
31 to 61 days
61 to 90 days
In excess of 90 days
Total 2015
The Netherlands + International 644 259 57 40 1,000
North America 582 198 48 13 841
France 130 6 33 80 249
DACH 1,313 119 1 77 1,510
Total 2,669 582 139 210 3,600
4) Current Assets
Trade Receivables and Other Receivables
TIE KINETIX N.V. ~ ANNUAL REPORT 2016

90Notes to the Consolidated Statement of Financial Position
Trade receivables from Tie Kinetix Nederland BV, TIE MamboFive BV and TIE International BV are pledged to RABO Bank as collateral for a working capital facility provided by RABO Bank. The fair value of Trade Debtors amounts to € 2,893k (2015: € 3,600k). Details on the movements in the provision for doubtful debt (excluding recoverable VAT) are found below:
The unused amounts reversed relates to revenue generated under the Tommorrow Focus revenue guarantee and was offset following a settlement agreement.
Other Receivables and Prepaid ExpensesOther Receivables predominantly consist of security deposits for rental agreements. Subsidized projects consist of EU projects completed and awaiting final approval and settlement. Projects to be invoiced relate to work that has been performed, but not yet invoiced. Prepayments include short term prepaid amount to suppliers (resulting from SaaS sales to customers < 1 year) prepaid rent, car lease, and insurance premiums.
Cash and Cash EquivalentsUnder this heading, the company only includes cash at banks, potentially short term deposits, and payments in transfer. The reported cash balance was available at balance sheet date; there were no restrictions with respect to availability.
The Fair Value of Cash and Cash Equivalents approximate the nominal value of these items.
Movements in the provision of doubtful debtIndividually
ImpairedCollectively
Impaired Total
Balance as at September 30, 2014 25 44 69
Charge for the year 353 41 394
Utilised (2) (67) (69)
Unused amounts reversed (7) - (7)
Currency exchange rate differences - 2 2
Balance as at September 30, 2015 369 20 389
Charge for the year 5 - 5
Utilised - - -
Unused amounts reversed (314) (20) (334)
Currency exchange rate differences - - -
Balance as at September 30, 2016 60 - 60
TIE KINETIX N.V. ~ ANNUAL REPORT 2016

915) Equity
Shareholders’ EquityManagement policy with respect to managing Capital, consisting of all components of Equity, including the Convertible Bonds, is to maintain a positive Equity, while limiting funding through Debt as much as possible due to the liquidity risks attached to Debt. This implies that Business Combinations, Investments and Operations are funded primarily by issuing Equity Instruments, also in the event of a cash component payable arising from a Business Combination.
Share CapitalThe company’s authorized share capital amounts to € 500k (2015: € 500k), consisting of 5 million ordinary shares with a nominal value of € 0.10 each. In 2016 in total 365,327 shares have been issued, bringing the total number of issued shares to 1.592.704 as at September 30, 2016. Shareholders’ Equity amounts to € 7,125k (or € 4.47 per share) on September 30, 2016 (2015: € 4,308k, or € 3.51 per share).
The movements in the number of Common Shares outstanding can be summarized as follows:
Details on movements in Issued Capital in nominal values and Share Premium Account are found below:
Share Capital Share Premium Account
(€ x 1,000) 2016 2015 2016 2015
Balance as of October 1, 123 7,892 58,308 50,150
Transfer to Share Premium - (8,469) - 8,469
Issue of new shares 36 700 2,425 -
Other Movements - - 297 (311)
Balance as at September 30, 159 123 61,030 58,308
(number of shares) 2016 2015
Balance as of October 1, 1,227,377 1,127,377
Issued 365,327 100,000
Balance as at September 30, 1,592,704 1,227,377
In € (x 1,000) 159 123
In 2015, an amount of € 8,469k was transferred from Share Capital to the Share Premium account as a result of Capital reduction. The other movement predominantly results from the fact that the Company and a guarantor have agreed to a guarantee fee of € 300k payable in shares. The shares for the guarantee fee were issued in 2016, whereas the liability for the guarantee fee was recorded in 2015.
Equity Settled Share Based Payments
Annual Stock Options PlanThe Stock Options granted under the Annual Stock Options Plan have a three-year vesting period and a subsequent exercise period of 7 years. Staff members leaving the Company within the vesting period lose their Stock Options. During 2016, no new Stock Options have been issued under the Annual Stock Option Plan. The weighted remaining average lifetime of all Stock Options is 2.81 years (2015: 3.44 years).
TIE KINETIX N.V. ~ ANNUAL REPORT 2016
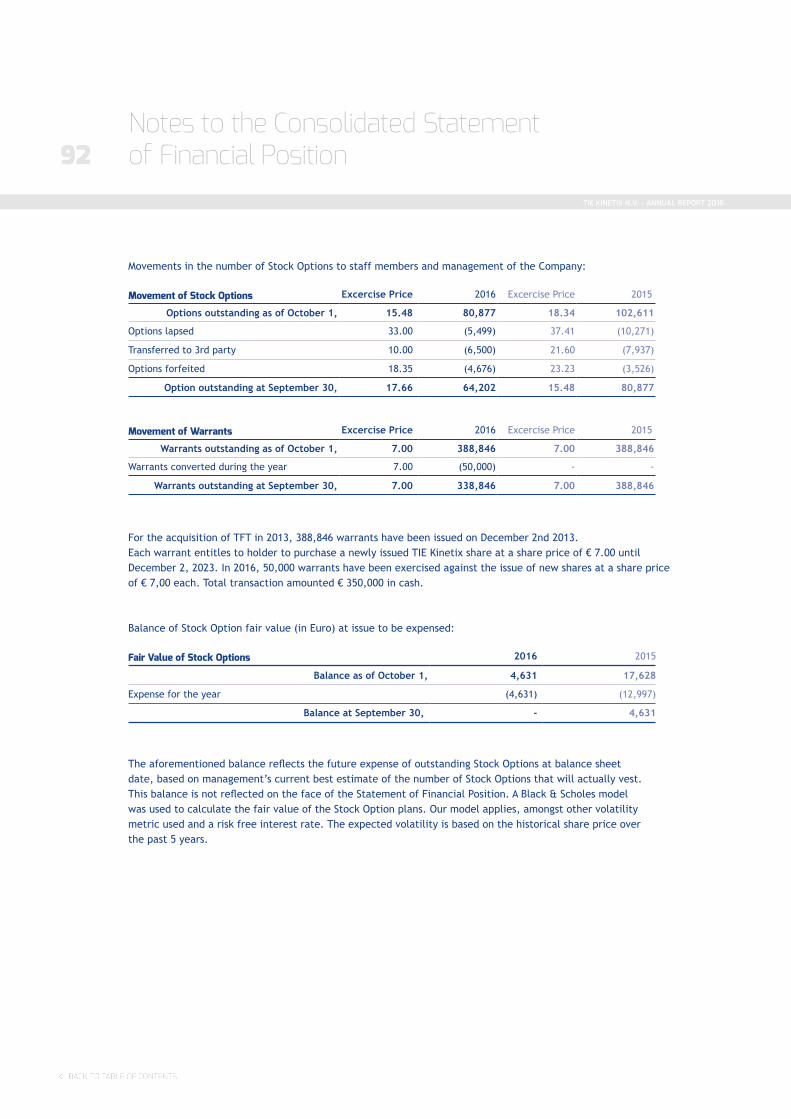
92Notes to the Consolidated Statement of Financial Position
The aforementioned balance reflects the future expense of outstanding Stock Options at balance sheet date, based on management’s current best estimate of the number of Stock Options that will actually vest. This balance is not reflected on the face of the Statement of Financial Position. A Black & Scholes model was used to calculate the fair value of the Stock Option plans. Our model applies, amongst other volatility metric used and a risk free interest rate. The expected volatility is based on the historical share price over the past 5 years.
Balance of Stock Option fair value (in Euro) at issue to be expensed:
Movements in the number of Stock Options to staff members and management of the Company:
Fair Value of Stock Options 2016 2015
Balance as of October 1, 4,631 17,628
Expense for the year (4,631) (12,997)
Balance at September 30, - 4,631
Movement of Stock Options Excercise Price 2016 Excercise Price 2015
Options outstanding as of October 1, 15.48 80,877 18.34 102,611
Options lapsed 33.00 (5,499) 37.41 (10,271)
Transferred to 3rd party 10.00 (6,500) 21.60 (7,937)
Options forfeited 18.35 (4,676) 23.23 (3,526)
Option outstanding at September 30, 17.66 64,202 15.48 80,877
Movement of Warrants Excercise Price 2016 Excercise Price 2015
Warrants outstanding as of October 1, 7.00 388,846 7.00 388,846
Warrants converted during the year 7.00 (50,000) - -
Warrants outstanding at September 30, 7.00 338,846 7.00 388,846
For the acquisition of TFT in 2013, 388,846 warrants have been issued on December 2nd 2013. Each warrant entitles to holder to purchase a newly issued TIE Kinetix share at a share price of € 7.00 until December 2, 2023. In 2016, 50,000 warrants have been exercised against the issue of new shares at a share price of € 7,00 each. Total transaction amounted € 350,000 in cash.
TIE KINETIX N.V. ~ ANNUAL REPORT 2016

93
Stock Options Third Party Investors Issue Date Options Granted Exercise Price Maturity date
Third Party Investors June 3, 2008 10,500 € 10.00 June 3, 2018
Third Party Investors February 24, 2009 10,000 € 10.00 February 24, 2019
Third Party Investors June 19, 2009 250 € 18.00 June 19, 2019
Third Party Investors August 31, 2010 3,400 € 10.00 August 31, 2020
Third Party Investors December 27, 2010 7,937 € 12.60 December 27, 2020
Total 32,087
2016IssueDate
OptionsGranted
Con-verted
Moved to 3rd party Lapsed Forfeiture
Out-standingOptions
Weightedaverageexercise
priceMaturity
Date
2007 Management Board Sep 30, 2007 2,182 - - - 1,333 848 € 26.00 Oct 01, 2017
2009 Management Board Mar 11, 2009 7,500 - - - - 7,500 € 10.00 Mar 11, 2019
2010 Management Board Mar 10, 2010 7,500 - - - - 7,500 € 19.10 Mar 10, 2020
2010 Management Board Aug 31, 2010 300 - - - - 300 € 10.00 Aug 31, 2020
2013 Management Board Mar 13, 2013 5,000 - - - - 5,000 € 10.00 Mar 13, 2023
Sub Total Management Board 22,482 - - 1,333 21,148
2006 Sep 30, 2006 12,495 - - 5,499 6,996 - € 33.00 Oct 01, 2016
2007 Sep 30, 2007 10,394 - - - 6,096 4,298 € 26.00 Oct 01, 2017
2008 Jun 03, 2008 18,500 - 5,500 - 5,000 8,000 € 10.00 Jun 03, 2018
2008 Sep 30, 2008 15,550 - - - 6,745 8,805 € 10.00 Sep 30, 2018
2009 Feb 24, 2009 27,500 8,000 10,000 - 310 9,190 € 10.00 Feb 24, 2019
2009 Jun 01, 2009 1,000 - - - - 1,000 € 17.00 Jun 01, 2019
2009 Aug 04, 2009 4,500 - - - - 4,500 € 18.00 Aug 04, 2019
2010 Jan 05, 2010 16,215 - - - 8,954 7,261 € 21.60 Jan 05, 2020
Sub Total personnel 106,153 8,000 15,500 5,499 34,101 43,053
Total Sep 30, 2016 128,635 8,000 15,500 5,499 35,434 64,202
During the 2016 no (2015: no) Stock Options have been awarded to staff members of Members of the Executive Board. In 2016 no options have been exercised. The Stock Options from managers, who left the Company, that were issued in relation to credit facilities offered to the Company, have been classified as Stock Options held by Third Party Investors.
Stock Options held by Third Party InvestorsStock Options outstanding with non-staff members as per September 30, 2016:
The outstanding non-staff member Stock Options were issued in relation to credit facilities offered to the Company by the various lenders. It is the Company’s policy and intention to issue new shares upon exercise of these Stock Options. Outstanding non-staff member Stock Options do not have vesting periods, but rather contain a one-year lock-up period and no requirement to be expensed. Considerations received for these Gross Equity Settled Instruments at issue were credited to equity. The movement during FY 2016 is explained under Annual Stock Option Plan above.
Stock Options outstanding to staff members and management of the Company, as per September 30, 2016, are detailed as follows:
TIE KINETIX N.V. ~ ANNUAL REPORT 2016

94Notes to the Consolidated Statement of Financial Position
Long Term Liabilities 2016 2015
Loans/Long term Debt 8 1,165
Deferred Revenue 562 886
Deferred Tax Liability 60 80
Contingent Consideration 55 55
Pension Provisions 110 91
Other Provisions 404 401
Total Long Term Liabilities 1,199 2,678
Movement of Loans/Long term Debt 2016 2015
Balance as of October 1, 1,165 1,527
Settlement, non cash* (600) -
Repayments (450) -
Obtained in 2015 - 72
To Short Term Loan (107) (434)
Balance as at September 30 8 1,165
*Settlement TFAG
6) Non Current Liabilities
Convertible BondsIssue date
Maturity date
Conversion rate in €
(€ x 1,000)2016
(€ x 1,000)2015
Related Party August 4, 2009 August 4, 2019 € 18.00 40 40
Sub Total Related Party 40 40
Third Party Investors June 19, 2009 June 19, 2019 € 18.00 5 5
Sub Total Third Party Investors 5 5
Total Convertible Bonds 45 45
Convertible BondsConvertible Bonds issued by the Company have been classified as Equity, based on the fact that under the terms and conditions of these bonds, there is evidence of a residual interest in the Company’s assets after deducting all of its liabilities. The conversion rates are fixed, and all Convertible Bonds are non-interest bearing. Distributions to holders of Equity Instruments are recognized directly in equity net of tax. There were no movements to report in 2016. In 2016 no Convertible Bonds were issued.
The Balance outstanding as of September 30, 2016 consists of the following Convertible Bonds:were no movements.
The Loans relates to the acquisition of Light and TFT and the settlement of the Samar claim. In 2016, the company redeemed non-current liabilities from € 1,165k (September 30, 2015) to € 9k (September 30, 2016).
TIE KINETIX N.V. ~ ANNUAL REPORT 2016

95
Movement of Other Provisions 2016 2015
Balance as of October 1, 401 20
To Short Term Liabilities - -
From Short Term Liabilities 3 381
Balance as at September 30 404 401
Movement of Contingent Consideration 2016 2015
Balance as of October 1, 55 56
From Current Liabilities - (1)
Balance as at September 30 55 55
Movement of Pension Provisions 2016 2015
Balance as of October 1, 91 76
Charged to income 19 15
Balance as at September 30 110 91
Movement of Deferred Revenue 2016 2015
Balance as of October 1, 886 480
From Current Liabilities (324) 406
Balance as at September 30 562 886
The other provision relates to the EC claim.
Deferred Revenue represents the long term part of the unearned portion of revenues earned and invoiced for contract lasting over 12 months.
The deferred tax liability is discussed on page 97.
The Contingent Consideration relates to the acquisition of Light BV.
The pension provision relates to a retirement provision in France (€ 38k) and in Germany (€ 72k) as discussed on page 78.
TIE KINETIX N.V. ~ ANNUAL REPORT 2016

96
Provisions
Short Term Debt
The short term debt related to the debts from Light, TFT and the short term amount resulting from the settlement of the Samar Claim. In 2016 current liabilities, short term debt was redeemed from € 860k to € 34k, including the effect of the settlement of the revenue guarantee against short term debt with Tomorrow Focus amounting to € 500k.
Deferred RevenueDeferred Revenue represents the unearned portion of revenues earned over a specific period. The maintenance and support agreement entitles the user to support and updates of the software. These maintenance contracts are deferred (100%) and recognized over the related contract period, usually 12 months. Consulting fees are recognized upon the performance based on the completion method. The deferred revenue is the difference between the amount invoiced and revenue recognized. In the event of overspending, the outstanding amount is expensed through the Comprehensive Statement of Income. SaaS contracts consist of a subscription fee, which is deferred and recognized over the related contract period, for a maximum of 12 months.
Movement of Provisions 2016 2015
Balance as of October 1, 29 -
Charged to income - 29
To short term provisions (29) -
Balance as at September 30 - 29
Short Term Debt 2016 2015
Balance as of October 1 860 464
Loans obtained - 125
Obligation to Shareholder - 300
Redeemed (326) (463)
Settlement, non cash * (500) -
From Long Term Loan - 434
Balance as at September 30 34 860
* Settlement TFAG, & obligation to share holder
7) Current Liabilities
Notes to the Consolidated Statement of Financial Position
TIE KINETIX N.V. ~ ANNUAL REPORT 2016

97
Other Payables and Accruals 2016 2015
EC and other Grants 135 187
Accrued Expenses 1,518 1,548
Other Accruals and Payables 664 367
Pension Premiums 2 17
Supervisory Board Compensation 14 19
Total 2,333 2,138
Other Payables and Accruals
Other Payables and Accruals include accrual for holiday allowance, holiday days not taken, pension accrual, prefunded amounts received on EU projects and accrued expenses.
Deferred tax Liabilities The carrying value of the Deferred Tax Liability in Germany amounts to € 42k (2015: € 62k) and in the Netherlands (through TIE Light) amounts to € 18k (2015: € 18k).
Taxation and Social Security 2016 2015
Payroll Tax 150 136
Social Security Contributions 104 101
VAT/Sales tax US 334 331
Income Tax payable 284 175
Total 872 743
Taxation and Social SecurityThe Taxation and Social Security balance are detailed as follows:
Deferred tax liability Netherlands TIE Light DACH Total
Carrying value as per September 30, 2014 - 18 113 131
Movements 2015
Additions - - - -
Release to Statement of (Comprehensive) Income on impairment - - (25) (25)
Release to Statement of (Comprehensive) Income on amortisation - - (26) (26)
Carrying value as per September 30, 2015 - 18 62 80
Movements 2016
Additions - - - -
Release to Statement of (Comprehensive) Income on impairment - - -
Release to Statement of (Comprehensive) Income on amortisation - - (20) (20)
Carrying value as per September 30, 2016 - 18 42 60
TIE KINETIX N.V. ~ ANNUAL REPORT 2016
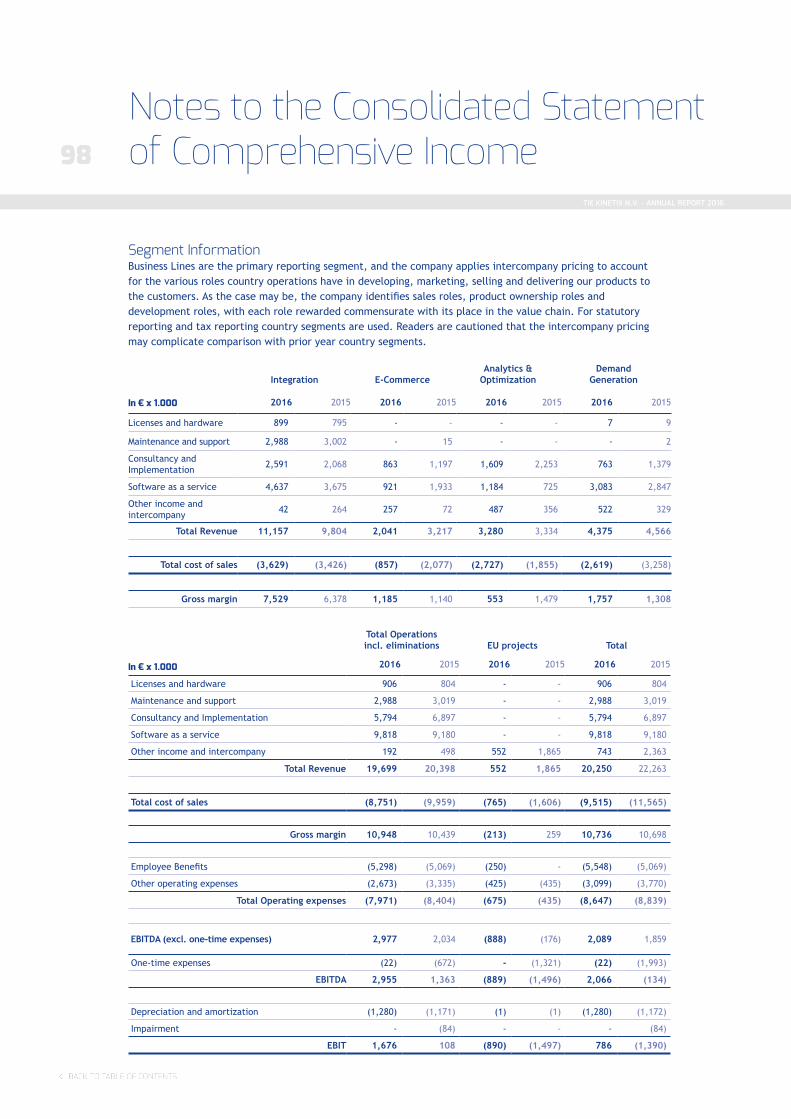
98
Segment Information Business Lines are the primary reporting segment, and the company applies intercompany pricing to account for the various roles country operations have in developing, marketing, selling and delivering our products to the customers. As the case may be, the company identifies sales roles, product ownership roles and development roles, with each role rewarded commensurate with its place in the value chain. For statutory reporting and tax reporting country segments are used. Readers are cautioned that the intercompany pricing may complicate comparison with prior year country segments.
Notes to the Consolidated Statement of Comprehensive Income
Integration E-CommerceAnalytics &
OptimizationDemand
Generation
In € x 1.000 2016 2015 2016 2015 2016 2015 2016 2015
Licenses and hardware 899 795 - - - - 7 9
Maintenance and support 2,988 3,002 - 15 - - - 2
Consultancy and Implementation 2,591 2,068 863 1,197 1,609 2,253 763 1,379
Software as a service 4,637 3,675 921 1,933 1,184 725 3,083 2,847
Other income and intercompany 42 264 257 72 487 356 522 329
Total Revenue 11,157 9,804 2,041 3,217 3,280 3,334 4,375 4,566
Total cost of sales (3,629) (3,426) (857) (2,077) (2,727) (1,855) (2,619) (3,258)
Gross margin 7,529 6,378 1,185 1,140 553 1,479 1,757 1,308
Total Operations incl. eliminations EU projects Total
In € x 1.000 2016 2015 2016 2015 2016 2015
Licenses and hardware 906 804 - - 906 804
Maintenance and support 2,988 3,019 - - 2,988 3,019
Consultancy and Implementation 5,794 6,897 - - 5,794 6,897
Software as a service 9,818 9,180 - - 9,818 9,180
Other income and intercompany 192 498 552 1,865 743 2,363
Total Revenue 19,699 20,398 552 1,865 20,250 22,263
Total cost of sales (8,751) (9,959) (765) (1,606) (9,515) (11,565)
Gross margin 10,948 10,439 (213) 259 10,736 10,698
Employee Benefits (5,298) (5,069) (250) - (5,548) (5,069)
Other operating expenses (2,673) (3,335) (425) (435) (3,099) (3,770)
Total Operating expenses (7,971) (8,404) (675) (435) (8,647) (8,839)
EBITDA (excl. one-time expenses) 2,977 2,034 (888) (176) 2,089 1,859
One-time expenses (22) (672) - (1,321) (22) (1,993)
EBITDA 2,955 1,363 (889) (1,496) 2,066 (134)
Depreciation and amortization (1,280) (1,171) (1) (1) (1,280) (1,172)
Impairment - (84) - - - (84)
EBIT 1,676 108 (890) (1,497) 786 (1,390)
TIE KINETIX N.V. ~ ANNUAL REPORT 2016

99Segment items included in the Segment Statement of Financial Position as of September 30, 2016 or further details of items in the segment Statement of Income account are:
Revenues
Netherlands incl.
InternationalTIE
MamboFiveNorth
America France DACH
Product Develop-
ment
Holdingand Elimi-
nations Total
Licenses 146 - 634 13 113 - - 906
Maintenance and Support 628 23 2,064 162 112 - - 2,988
Consultancy 1,248 884 1,295 313 2,055 - - 5,794
Software as a Service 2,727 951 2,831 717 2,593 - - 9,818
Revenues 4,749 1,858 6,824 1,204 4,872 - - 19,507
EU Projects 553 (1) - - - - - 552
Onetime income 31 33 572 3 796 542 (1,785) 192
Revenue 5,333 1,890 7,396 1,208 5,668 542 (1,785) 20,250
Third Party Hire (136) (104) (225) (1) (259) (5) - (730)
Direct Employee Costs (981) (431) (1,972) (277) (1,705) - (64) (5,430)
Other Direct Purchase Costs (1,622) (409) (848) (312) (1,712) (257) 1,803 (3,356)
Income Net of Direct Purchase Costs 2,595 945 4,350 619 1,991 280 (46) 10,734
Operating Expenses
Employee Benefits (1,161) (95) (796) (538) (1,088) (43) (2,103) (5,823)
Onetime expenses (22) - - - - - - (22)
Other Operating Expenses (1,505) (503) (1,714) (217) (612) (544) 2,273 (2,822)
Total Operating expenses (2,688) (599) (2,510) (755) (1,699) (586) 170 (8,668)
EBITDA (94) 347 1,840 (136) 292 (306) 124 2,066
Assets
Netherlands incl.
InternationalTIE
MamboFiveNorth
America France DACH
Product Develop-
ment
Holdingand Elimi-
nations Total 2016
Intangible Fixed Assets 617 119 648 1 2,417 2,601 1,528 7,931
Tangible Fixed Assets 7 4 92 8 29 - 222 362
Financial Assets (deferred tax) & Loans 218 55 694 - 176 - - 1,143
Current Assets 1,438 713 1,607 413 1,374 720 406 6,672
Total Assets 2,280 891 3,040 422 3,996 3,321 2,157 16,108
Liabilities
Non Current Liabilities 684 26 29 38 366 - 55 1,199
Current Liabilities 2,094 715 (3,688) 461 1,776 9,591 (3,508) 7,741
Total Liabilities 3,078 741 (3,658) 499 2,143 9,591 (3,453) 8,940
Other Selected Income Statement Items
Capital Expenditure 6 - 27 - 4 1,515 57 1,609
Capital Divestment - - - (8) (144) - - (152)
Other Non Cash Expenses 2 - - - - - 3 5
FTE at year end 27 8 33 12 36 - 13 129
TIE KINETIX N.V. ~ ANNUAL REPORT 2016

100
Revenues 2015
Netherlands incl.
InternationalTIE
MamboFiveNorth
America France DACH
Product Develop-
ment
Holdingand Elimi-
nations Total
Licenses 135 - 468 80 121 - - 804
Maintenance and Support 661 23 2,099 136 100 - - 3,019
Consultancy 891 1,090 1,034 427 3,455 - - 6,897
Software as a Service 1,945 1,360 2,477 589 2,809 - - 9,180
Revenues 3,632 2,473 6,078 1,232 6,485 - - 19,900
EU Projects & Other Income 1,880 - 256 8 1,278 385 (1,444) 2,363
Total Revenue 5,512 2,473 6,334 1,240 7,763 385 (1,444) 22,263
Total Cost of Sales (3,130) (1,583) (2,644) (410) (5,186) - 1,388 (11,565)
Gross Margin 2,382 890 3,690 830 2,577 385 (56) 10,698
Operating Expenses
Employee Benefits 743 (199) 578 616 1,139 - 2,192 5,069
Onetime expenses 1,656 56 - - - - 281 1,993
Other Operating Expenses 945 307 1,386 213 397 - 522 3,770
Total Operating expenses 3,344 164 1,964 829 1,536 - 2,995 10,832
EBITDA (962) 726 1,726 1 1,041 385 (3,051) (134)
Notes to the Consolidated Statement of Comprehensive Income
Segment items included in the Segment Statement of Financial Position as of September 30, 2015 or further details of items in the segment Statement of Income account are:
TIE Netherlands: strong 2016 performance with 57% growth in SaaS revenue with sizable new customer implementations. Consultancy revenue increased 35% on the back of higher demand for our value added solutions.
TIE MamboFive: loss of KPN contract caused 19% lower consultancy revenue and 30% lower SaaS revenue. The 2016 EBITDA performance is comparable with 2015, as a result of timely cost savings. For FY 2017 and beyond an extension of the T-Mobile contracts are being discussed.
TIE France: performance suffered from adverse market conditions and temporary lack of adequate resources. Actions are taken to solidify the performance in 2017.
TIE Germany: following the expiration of the revenue guarantee from Tomorrow Focus AG (the previous owner) in January 2016, TIE Germany reported lower consultancy revenue. In the second half year activity levels have been gradually increasing as a consequence of new business coming in (SKY, Siemens).
TIE Commerce (US): following management changes TIE Commerce performed very well in 2016 paving the way for further growth in 2017. All revenue categories contributed to overall growth of our US revenue of 14% (in$). The introduction of FLOW in the US was well received by our customers and prospects. Marketing efforts are further stepped up and investments in sales capacity will be further increased, as we are planning for even higher growth in the US in 2017.
TIE KINETIX N.V. ~ ANNUAL REPORT 2016

101Assets
Netherlands incl.
InternationalTIE
MamboFiveNorth
America France DACH
Product Develop-
ment
Holdingand Elimi-
nationsTotal 2015
Intangible Fixed Assets 1,429 209 835 - 2,480 921 1,552 7,426
Tangible Fixed Assets 9 13 118 7 98 - 288 533
Financial Assets (de-ferred tax)& Loans 439 55 1,168 - 401 - - 2,063
Current Assets 1,741 623 1,320 621 2,226 - (702) 5,829
Total Assets 3,618 900 3,441 628 5,205 921 1,138 15,851
Liabilities
Non Current Liabilities 597 60 - 47 1,091 - 655 2,450
Current Liabilities 3,029 278 1,758 560 2,198 - 1,369 9,192
Total Liabilities 3,626 338 1,758 607 3,289 - 2,024 11,642
Other Selected Income Statement Items
Capital Expenditure 37 - 265 9 2 572 36 921
Other Non Cash Ex-penses 8 - - - - - 5 13
FTE at year end 31 9 35 10 40 - 11 136
The actual geographical distribution of intangible assets differs from the intangible assets distribution displayed above as part of the segment infromation. The geographical distribution of intangible assets is displayed below:
Geographical distribution of non current assets 2016 2015
The Netherlands incl. TIE-International 2,112 2,235
North America 648 836
DACH 2,416 2,481
France 155 153
Product Development (The Netherlands) 2,601 1,721
Total 7,931 7,426
The assets in the Netherlands include 100% of the TIE Kinetix N.V. assets.
TIE KINETIX N.V. ~ ANNUAL REPORT 2016

102Notes to the Consolidated Statement of Comprehensive Income
The breakdown shows the number of FTE per department at year-end:
FTE per department 2016 2015
Research and Development 11 14
Sales and Marketing 28 27
Consulting and Support 70 70
General and Administrative 21 25
Total 129 136
TIE KINETIX N.V. ~ ANNUAL REPORT 2016

103
Employee Benefits 2016 2015
Salaries 8,418 9,057
Salaries variable component 917 650
Social Security Charges 1,208 1,432
Contributions to Post Employment arrangements 295 282
Share based payments 5 13
Other Employee Benefits 1,576 1,500*
Capitalized R&D employee cost (1,440) (701)
Total 10,978 12,233
Employee Benefits 2016 2015
Direct Employee Costs 5,430 7,164
Employee Benefits 5,548 5,069
Total 10,978 12,233
* reclass for comparison reasons
The WBSO grants received for FY 2016, amounting to € 211k (2015: € 311k), have been deducted from the social security charges. The contributions to Post Employment Arrangements include premiums payable with respect to the Netherlands operations’ Defined Contribution Post Employment Plan as well as the discretionary employer contributions to the tax facilitated retirement plan (401(k)) in the United States. Other employee Benefits includes € 158k (2015: €0) for the 2016 Performance Share Plan for certain members of the Management Team.
8) Operating Expenses
The Consolidated Statement of Comprehensive Income has been prepared using a classification based upon the nature of the expenses. The expense categories identified have been included below for further disclosure.
Direct Purchase Costs consist of expenses directly associated with revenue. This includes third party software licenses, consultant fees and hosting costs.
Employee BenefitsEmployee benefits can be broken down as follows:
TIE KINETIX N.V. ~ ANNUAL REPORT 2016

104
Key Management Personnel CompensationThe total key management personnel compensation, including the remuneration of the Executive Board, amounted to € 734k (2015: € 557k).
Remunerations and expenses of Jan Sundelin are paid to his personal management B.V., CAPTA Management B.V.
The CEO received the following remuneration: The CFO received the following remuneration:
Notes to the Consolidated Statement of Comprehensive Income
Short Term employee Benefits 2016 2015
Remuneration 250 234
Bonus 96 60
Total 346 294
Post employment Benefits 2016 2015
Contributions to Post Employ-ment arrangements - -
Share Based payments 2016 2015
Stock Option Expense 5 13
Performance share plan 40 -
Short Term employee Benefits 2016 2015
Remuneration 200 175
Bonus 86 50
Total 286 225
Post employment Benefits 2016 2015
Contributions to Post Employ-ment arrangements 25 25
Share Based payments 2016 2015
Stock Option Expense - -
Performance share plan 32 -
Depreciation, Impairment, Divestment and Amortization 2016 2015
Depreciation and Amortization Expense 1,280 1,172
Impairment on disposal Customer Base - 84
1,280 1,256
The remuneration policy is discussed in detail on page 41.
Remuneration of the Supervisory BoardThe General Meeting of Shareholders sets the remuneration of the members of the Supervisory Board. All members are entitled to a remuneration of € 10k per year, the Chairman € 20k per year. The total amount of compensation of the Supervisory Board for FY 2016 amounted to € 40k (2015: € 40k).
Depreciation and Amortization Expense, Divestment and Impairment Losses
TIE KINETIX N.V. ~ ANNUAL REPORT 2016

105
Other Operating Expenses 2016 2015
Accomodation Expenses 691 655
Professional Services 618 567
Communications 471 468
Marketing 512 531
Travel expenses 458 445
Office Supplies 249 403
General & Administration 100 701
Total 3,099 3,770
In 2015 General & Administration included € 600k (2016: € 0) for non-collectability of certain receivables under the
TFAG agreements.
Onetime Expenses 2016 2015
Liquidation result Ascention Germany & Austria 22 -
EU Claim - 1,296
Redundancy & Severance costs - 337
Samar Claim - 304
Temporary staff hires - 52
Other Non-Recurring costs - 4
Total 22 1,993
Other Operating Expenses and Non-Recurring Expenses
TIE KINETIX N.V. ~ ANNUAL REPORT 2016

106
Financial Income and/or Expense 2016 2015
Interest Income 29 31
Interest Expenses (80) (146)
Exchange gains/(losses) (24) (63)
Total (74) (178)
2016 2015
Employee Benefits 1,955 1,653
Other R&D related expenses 350 441
Capitalized Development expenses (1,515) (701)
Amortization of Capitalized Development expenses 635 672
Total 1,425 2,065
In 2015 one-time expenses have been incurred in relation to the EU penalties and damages, including the legal and support costs incurred in this respect, severance costs resulting from layoffs, legal costs relating to the settlement of the Samar case and other legal costs. In 2016, the former Ascention companies have been liquidated resulting in € 22k unwinding costs. In 2017 Ascention CH will be unwound.
Research and Development Expenses
9) Financial income and/or Expense
Interest Expenses are attributable to the loans for the acquisition of Light and TFT.
A number of projects executed by the R&D team in the Netherlands have funding from the European Commission and from RVO. The EU and other grants received have been accounted for under Other Income. The EU and other grants in 2016 amounted to € 552k (2015: € 1.865k).
Notes to the Consolidated Statement of Comprehensive Income
TIE KINETIX N.V. ~ ANNUAL REPORT 2016

10710) Corporate Income Tax
The company operates predominantly in the Netherlands, Germany, France and North America. Applicable tax rates are 25%/20% (2015: 25%/20%) for the Netherlands, France 33.3% (2015: 33.3%), for the US 34% (2015: 34%) for federal tax and 6% (2015: 6%) for state tax, and for Germany 33% (Körperschaftssteuer 15.8%, Gewerbesteuer 17.2%) (2015: 29% (Körperschaftssteuer 15%, Gewerbesteuer 17.2%)).These rates represent a weighted average rate as income tax returns are filed on a calendar year basis, whereas these financial statements have been drawn up to reflect the Company’s financial year, which runs from October 1 through September 30. The effective tax rate based on income before taxes is 57.7% (2015: 28.1%); the weighted average tax rate amounts to 12.2% (2015: 13.3%).
Reconciliation between standard and effective income tax is as follows:
Reconciliation between Standard and effective income tax 2016 2015
Pre Tax Income 711 (1,568)
Corporate Tax (670) (798)
Net Income (loss) after tax 41 (2,366)
Weighted local statutory tax rate (17-40%) on pre tax income 410 (208)
Adjustment on (temporary) differences pre tax income and taxable income in fiscal books (117) (202)
Income tax per fiscal books using weighted local statutory tax rate (17-40%) 293 (410)
Utilisation of loss carry forward in the US (561) (279)
Tax losses in the Netherlands not recognised as deferred tax asset 457 830
Alternative Minimum Tax France 12 -
Alternative Minimum Tax US 12 12
Tax Charge 2014 Germany - 7
Current Income tax charge 213 160
Income Tax reported in the Comprehensive Income Statement 2016 2015
Movement deferred taxes during the year (457) (638)
Current Income tax charge (213) (160)
Other tax items - -
Income Tax reported in the Comprehensive Income Statement (670) (798)
Movement deferred taxes during the year 2016 2015
Derecognition of deferred tax asset for loss carry forward in the Netherlands - 347
Credited to Income: movement from loss carry forward in the Netherlands (DTA) 12 -
Debited to Income on temporary differences in the Netherlands (DTL) (12) -
Credited to Income: movement in temporary differences in the US (DTA) (84) -
Debited to Income: movement in temporary differences in the US (DTA) - 63
Debited to Income: utilization of losses carry forward in the US (DTA) 562 279
Credited to Income: movement in temporary differences in Germany (DTL) (20) (26)
Credited to Income: release of temporary differences on impairment in Germany (DTL) - (25)
Movement deferred taxes during the year 457 638
TIE KINETIX N.V. ~ ANNUAL REPORT 2016

108
11) Earnings per Share
Basic Earnings per ShareBasic Earnings per Share are calculated by dividing net income attributable to equity holders of TIE by the weighted average number of shares outstanding.
Diluted Earnings per ShareDiluted Earnings per Share take into effect the dilutive effect of convertible instrument and Stock Options upon exercise or conversion. The dilutive effect of these instruments amounts to the number of shares issuable under the terms and conditions of these arrangements for no consideration. The fair value of future service for (partially) unvested Stock Options has been taken into consideration by adjusting the exercise price for these Stock Options. Stock Options are considered non-dilutive when the exercise price of the options is in excess of the average market price of the shares during the period. Convertible Bonds are considered non-dilutive when the related interest net of tax and other changes to income and expense per ordinary share obtainable upon conversion exceeds the Basic Earnings per Share.
Basic Earnings per Share 2016 2015
Net income attributable to equity holders of TIE 41 (2,366)
Net Income adjusted for calculation of basic earnings per Share 41 (2,366)
Weighted average number of shares outstanding in thousands 1,475 1,177
Basic Earnings per Share (€ per Share) 0.03 (2.01)
Notes to the Consolidated Statement of Comprehensive Income
The changes in the Deferred Tax Asset are discussed on page 86 in detail. The main item of the Deferred Tax Asset in FY 2016 is the capitalization of loss carry forward on TIE Commerce as described in more detail on page 86.
All Dutch subsidiaries of TIE Kinetix N.V. and TIE Kinetix N.V. form a tax unit and are jointly and severally liable for all tax liabilities originating within the tax unit.
Summary of expiration of tax loss carry forward in years
In 2016, TIE Ascention Austria GmbH and TIE Ascention Germany GmbH have been liquidated. The liquidation losses amounting to € 356k will be included in TIE Kinetix NV 2016 taxable income. These amounts are not included in the table above.
Overview on Tax Loss Carry Forward expiration 0 ≤ 5 years 6 ≤ 10 years ≥ 10 years Total 2016
TIE Kinetix NV 4.10 4.97 - 9.07
TIE Commerce Inc - - 0.42 0.42
TIE TFT Holding GmbH - - - -
TIE France SAS - - - -
Total 4.10 4.97 0.42 9.49
TIE KINETIX N.V. ~ ANNUAL REPORT 2016

109
The Stock Options have been excluded from the calculation of the Diluted Earnings per Share as the exercise price of these Stock Options exceeded the TIE Kinetix N.V. average share price over the period. The Convertible Bonds and warrants outstanding are considered dilutive and have been included from date of issue.
Diluted Earnings per Share 2016 2015
Net Income adjusted for calculation of basic earnings per Share 41 (2,366)
Weighted average number of shares outstanding 1,475 1,177
Dilutive effect of stock options outstanding at September 30, - -
Dilutive effect of warrants outstanding at September 30, 350 -
Dilutive effect on Convertible Bonds 5 5
Weighted average number of shares adjusted for calculation of diluted earnings per Share 1,830 1,182
Diluted Earnings per Share (€ per Share) 0.02 (2.00)
Commitments and Contingent Liabilities
Leases (Including Rental Agreements)Company cars were contracted under an operating lease agreement (mainly 4 year term) in The Netherlands and Germany only. The monthly lease charge at September 30, 2016 amounted to € 22k (2015: € 28k).
The remaining terms of leases in the Netherlands are 3.5 years. The lease contract for the Boston office in the United States was renewed till June 30th 2022 and for St Paul a 3 month notice period is applicable; the lease contract for the French office was renewed till January 2017; the lease in Germany was renewed and till June 30th, 2020. Office Rentals due within one year amount to € 0.4 mln, rentals due between one and five years are approximately € 1.8 mln and over 5 years € 0.1 mln.
Hosting costs relates to leasing of hosting infrastructure € 0.4 mln annually. In the Netherlands this is for one remaining year, in Germany this varies from 3 months to 5 years.
In summary, detailing amounts payable within one year, between one and five years and over five years under this contract means:
2016 2015
Leases < 1year > 1 year < 5 years >5 years < 1year > 1 year < 5
years >5 years
Office Leases 444 1,837 71 474 1,737 239
Hosting Contracts 382 380 - 780 1,648 -
Operational leases company cars 263 174 - 303 412 -
Operational leases servers and photocopiers 59 128 - 95 239 -
Total 1,148 2,519 71 1,652 4,036 239
TIE KINETIX N.V. ~ ANNUAL REPORT 2016

110Notes to the Consolidated Statement of Comprehensive Income
CollateralFor 2016 TIE Kinetix NV had an undrawn working capital facility with RABO Bank (amounting to € 500k) with an ongoing pledge on the receivables. Loans from the acquisition of TIE Kinetix GmbH (former TFT GmbH) with DZ Bank (€ 800k) and with former owner TFAG (€ 800k) have been redeemed. For 2017 and beyond the Company agreed a working capital facility with RABO Bank amounting to € 1,250k. The facility includes a pledge on all receivables, has an indefinite term and bears interest at a rate of EURIBOR plus a margin. The facility replaces the facility of € 0.5 million. Although currently no drawings are scheduled, the Company intends to use any funds borrowed under the Credit Facility from time to time for general corporate purposes, which may include working capital needs, capital expenditures, and satisfaction of other obligations of the Company.
For the rent of the office in Breukelen the company issued a bank guarantee of € 69k.
TIE Kinetix N.V. and subsidiariesThe consolidated financial statements include the financial data of TIE Kinetix N.V., Breukelen and its subsidiaries:
Name Statutory Seat 2016 2015
TIE Nederland B.V. Amsterdam (Schiphol-Rijk), The Netherlands 100% 100%
TIE Product Development B.V. Hoofddorp, The Netherlands 100% 100%
TIE International B.V. Hoofddorp, The Netherlands 100% 100%
TIE MamboFive B.V. Utrecht, The Netherlands 100% 100%
TIE Light B.V. Amsterdam, The Netherlands 100% 100%
Gordian Investments B.V. Hoofddorp, The Netherlands 100% 100%
Pingli B.V. Hoofddorp, The Netherlands 100% 100%
TIE Commerce Inc. Burlington, MA, USA 100% 100%
TIE France S.A.S. Montpellier, France 100% 100%
TIE Asia-Pacific Ltd Hongkong, People's Republic of China 100% 100%
TIE TFT Holding GmbH Munchen, Germany 100% 100%
TIE Kinetix GmbH (TFT) Munchen, Germany 100% 100%
TIE ascention GmbH St Gallen, Switzerland 100% 100%
Liquidated in 2016 Statutory Seat 2016 2015
TIE ascention GmbH Friedrichshafen, Germany - 100%
TIE ascention GmbH Vienna, Austria - 100%
TIE KINETIX N.V. ~ ANNUAL REPORT 2016

111
September 30, 2016 September 30, 2015
Name Position Shares % of Shares Options Position Shares % of Shares Options
Jan Sundelin CEO 30,014 1.9% 21,148 CEO 30,014 2.4% 21,148
Erik Honée SB 26,600 1.7% - SB 26,600 2.2% -
Dirk Lindenberg* SB 144,791 9.1% - - - - -
* Via Blikkenburg B.V.Stock option expenses are included in note 8 under Key Management Personnel Compensation.
The company applies an intercompany pricing mechanism to account for the various roles the respective country operations have in the value chain towards the customers. As the case may be the company identifies sales roles, produc ownership roles and development roles, with each role rewarded commensurate with its place in the value chain.
Related Party Transactions
EU Development Grants repaymentIn October 2014 TIE Kinetix received a first invoice from the European Commission (“EC”) for a repayment of EU development grants of € 705.075, following an audit carried out under supervision of the EC over the period 2008-2011. Furthermore, the European Commission requested that the audit findings were extrapolated over other eligible projects that TIE Kinetix participated in. TIE Kinetix hired an interim subsidy specialist to fully recalculate all current and past EU projects and turned to Deloitte to assure that the recalculations were in line with the audit findings and EU regulations. Management has spent a considerable effort in investigating possibilities to mitigate damages, communicate with EU officials and their auditors to try and find an amicable resolution or payment plan. In the first half year of 2015, the full scope of the repayment of EU subsidies became clear. The EU officials responded negatively to all TIE Kinetix’ requests for resolution and even our request for phased payments was rejected. As a consequence, TIE Kinetix had to repay EU subsidies calculated at approximately € 1.085.383, for which amount a provision has been created in the first half year of 2015. Furthermore, TIE Kinetix obtained a shareholder guarantee for EU damages up to an amount of € 2 million. On March 31, 2015 a first draw-down of € 700.000 under this guarantee was done. All draw-downs under this guarantee are reflected under the company’s equity. A second draw down of € 652.976 was done December 30, 2015.
As at September 30, 2016 the European Commission had fully collected the amount of the initial claim of € 705.075. The Company has not yet received any further EC claims following its extrapolation of audit findings sent to the EC on July 15th, 2015. However, in July 2016 the company did receive a pre-notification that the EC intends to study the letter that TIE Kinetix sent on July 15th, 2015. At this stage the company considers that it has taken adequate provisions for damages following the 2013 EC audit.
As at September 30, 2016 the projects Alfred, Sam and Singularity have been completed or are in the final stages of completion. The Company currently only participates in project Accept. The company will not engage in large scale European Commission projects anymore in future.
Private Offer for the businessOn November 2, 2016 the Company annouced that it had received a private offer for the business. The Company subsequently annouced on November 16, 2016 that, after studying the offer, the Company reached the conclusion that the offer would not be presented to the Company’s shareholders.
Performance Share PlanOn December 14, 2016 the Company announced that it will issue 16.007 new shares to certain members of TIE Kinetix Management Team under the Performance Share Plan as approved by the Annual General Meeting of Shareholders. After completion of the issue, the total number of issued shares of TIE Kinetix will amount to 1.608.711.
TIE KINETIX N.V. ~ ANNUAL REPORT 2016
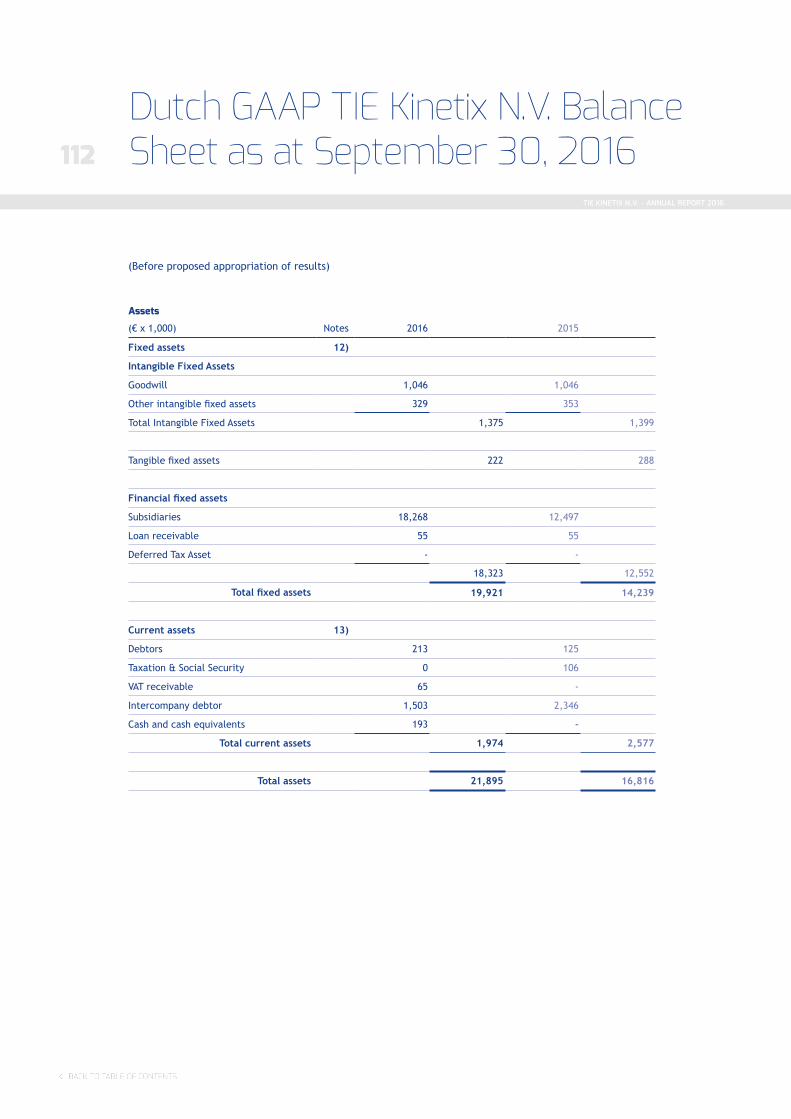
112
Dutch GAAP TIE Kinetix N.V. Balance Sheet as at September 30, 2016
Assets
(€ x 1,000) Notes 2016 2015
Fixed assets 12)
Intangible Fixed Assets
Goodwill 1,046 1,046
Other intangible fixed assets 329 353
Total Intangible Fixed Assets 1,375 1,399
Tangible fixed assets 222 288
Financial fixed assets
Subsidiaries 18,268 12,497
Loan receivable 55 55
Deferred Tax Asset - -
18,323 12,552
Total fixed assets 19,921 14,239
Current assets 13)
Debtors 213 125
Taxation & Social Security 0 106
VAT receivable 65 -
Intercompany debtor 1,503 2,346
Cash and cash equivalents 193 -
Total current assets 1,974 2,577
Total assets 21,895 16,816
(Before proposed appropriation of results)
TIE KINETIX N.V. ~ ANNUAL REPORT 2016

113
Liabilities and Equity
(€ x 1,000) Notes 2016 2015
Shareholders’ equity 14)
Issued and paid-up share capital 159 123
Share premium 59,024 57,046
Legal reserves 2,020 1,272
Foreign Currency Translation Reserve 161 141
Retained earnings (54,282) (51,908)
Net Result 41 (2,366)
7,123 4,308
Convertible Bonds 45 45
Total Equity 7,168 4,353
Non Current Liabilities 15)
Loans - 600
Provisions 636 90
Total Non Current Liabilities 636 690
Current Liabilities 16)
Creditors 14,091 11,029
Banks - 681
Taxation and Social Security - 63
Total Current Liabilities 14,091 11,773
Total Liabilities and Equity 21,895 16,816
TIE KINETIX N.V. ~ ANNUAL REPORT 2016

114Dutch GAAP TIE Kinetix N.V. Income Statementfor the year ending September 30, 2016
Notes to the Company Financial Statements
Corporate InformationThe Company financial statements for the year ended September 30, 2016 are authorized for issue through a resolution of the Management Board dated December 15, 2016. The General Meeting of Shareholders, to be held on March 31, 2017, will be requested to approve the Company financial statements.
Basis of PreparationThese Financial Statements have been prepared in accordance with accounting principles, generally accepted in the Netherlands, as embodied in Title 9 of Book 2 of the Dutch Civil Code. Based on article 2:362(8) of the Dutch Civil Code, the valuation principles applied are based on International Financial Reporting Standards (IFRS), as applied in the preparation of the consolidated financial statements of the Company. Companies are allowed to apply IFRS valuation principles in their financial statements prepared under Title 9 of Book 2 of the Dutch Civil Code. Subsidiaries and associates are accounted for at net asset value determined on the basis of IFRS, as applied in the Consolidated Financial Statements. For details on the accounting policies applied in the Consolidated Financial Statements, please refer to the Notes to the Consolidated Financial Statements, starting on page XX
Subsequent EventsOn November 2, 2016 the Company received a non-binding offer on the business. The Company has studied the offer and subsequently discussed it with the bidder. Following these discussion management concluded not to present the offer as currently structured to its.
(€ x 1,000) 2016 2015
Result of participating interests after tax (169) (491)
Other income after tax 209 (1,875)
Net Result 41 (2,366)
TIE KINETIX N.V. ~ ANNUAL REPORT 2016
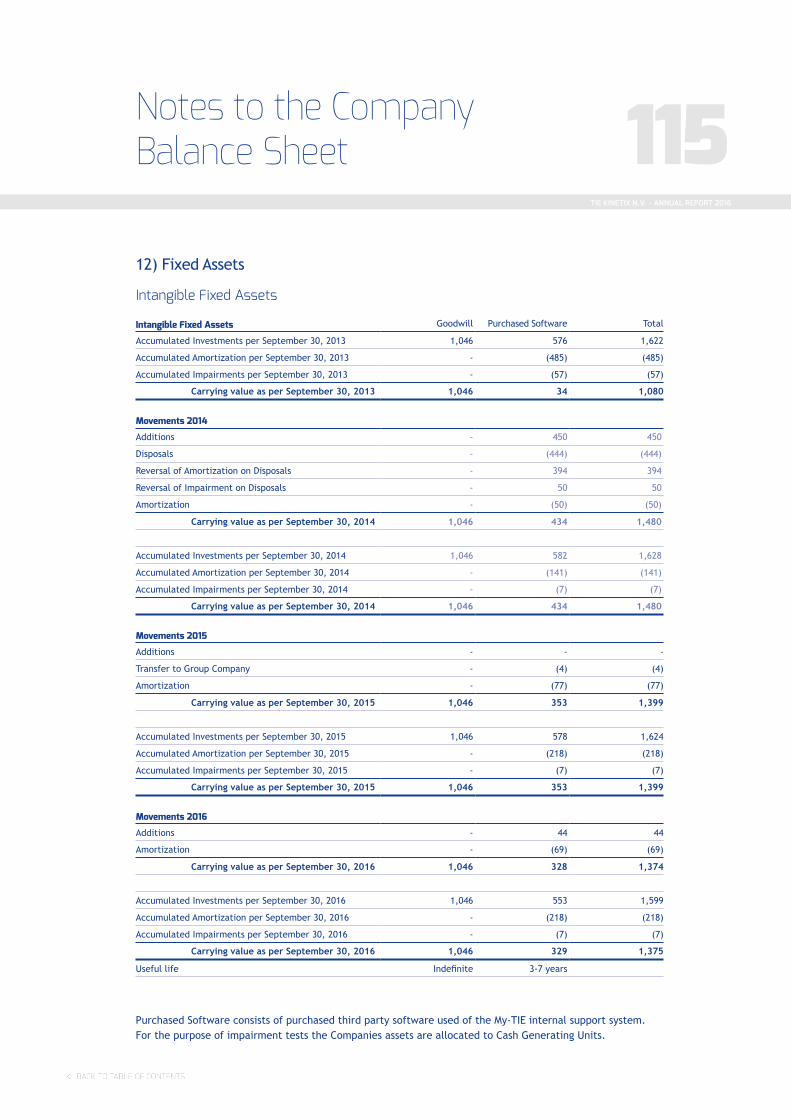
115Notes to the Company Balance Sheet
12) Fixed Assets
Intangible Fixed Assets
Purchased Software consists of purchased third party software used of the My-TIE internal support system. For the purpose of impairment tests the Companies assets are allocated to Cash Generating Units.
Intangible Fixed Assets Goodwill Purchased Software Total
Accumulated Investments per September 30, 2013 1,046 576 1,622
Accumulated Amortization per September 30, 2013 - (485) (485)
Accumulated Impairments per September 30, 2013 - (57) (57)
Carrying value as per September 30, 2013 1,046 34 1,080
Movements 2014
Additions - 450 450
Disposals - (444) (444)
Reversal of Amortization on Disposals - 394 394
Reversal of Impairment on Disposals - 50 50
Amortization - (50) (50)
Carrying value as per September 30, 2014 1,046 434 1,480
Accumulated Investments per September 30, 2014 1,046 582 1,628
Accumulated Amortization per September 30, 2014 - (141) (141)
Accumulated Impairments per September 30, 2014 - (7) (7)
Carrying value as per September 30, 2014 1,046 434 1,480
Movements 2015
Additions - - -
Transfer to Group Company - (4) (4)
Amortization - (77) (77)
Carrying value as per September 30, 2015 1,046 353 1,399
Accumulated Investments per September 30, 2015 1,046 578 1,624
Accumulated Amortization per September 30, 2015 - (218) (218)
Accumulated Impairments per September 30, 2015 - (7) (7)
Carrying value as per September 30, 2015 1,046 353 1,399
Movements 2016
Additions - 44 44
Amortization - (69) (69)
Carrying value as per September 30, 2016 1,046 328 1,374
Accumulated Investments per September 30, 2016 1,046 553 1,599
Accumulated Amortization per September 30, 2016 - (218) (218)
Accumulated Impairments per September 30, 2016 - (7) (7)
Carrying value as per September 30, 2016 1,046 329 1,375
Useful life Indefinite 3-7 years
TIE KINETIX N.V. ~ ANNUAL REPORT 2016

116Dutch GAAP TIE Kinetix NV Income Statementfor the year ending September 30, 2016
Tangible Fixed Assets
The investments in Fixtures & Fittings relate to small investments. Tangible Fixed assets relate to computer equipment.
Tangible Fixed Assets Fixtures & Fittings Hardware Total
Carrying value as per September 30, 2014 293 41 334
Movements 2015
Additions 19 16 35
Depreciation per Statement of (Comprehensive) Income (56) (25) (81)
Carrying value as per September 30, 2015 256 32 288
Accumulated Investments per September 30, 2015 391 108 499
Accumulated Amortization per September 30, 2015 (135) (76) (211)
Carrying value as per September 30, 2015 256 32 288
Movements 2016
Additions 3 8 11
Depreciation per Statement of (Comprehensive) Income (57) (20) (77)
Carrying value as per September 30, 2016 202 20 222
Accumulated Investments per September 30, 2016 394 116 510
Accumulated Amortization per September 30, 2016 (192) (96) (288)
Carrying value as per September 30, 2016 202 20 222
Useful life 4 to 10 years 3 years
TIE KINETIX N.V. ~ ANNUAL REPORT 2016

117
The deferred tax asset is discussed on page 87.
Name Statutory Seat 2016 2015
TIE Nederland B.V. Amsterdam (Schiphol-Rijk), The Netherlands 100% 100%
TIE Product Development B.V. Hoofddorp, The Netherlands 100% 100%
TIE International B.V. Hoofddorp, The Netherlands 100% 100%
TIE MamboFive B.V. Utrecht, The Netherlands 100% 100%
TIE Light B.V. Amsterdam, The Netherlands 100% 100%
Gordian Investments B.V. Hoofddorp, The Netherlands 100% 100%
Pingli B.V. Hoofddorp, The Netherlands 100% 100%
TIE Commerce Inc. Burlington, MA, USA 100% 100%
TIE Asia-Pacific Ltd Hongkong, People's Republic of China 100% 100%
Funding to subsidiaries is in principle interest bearing with interest rates varying between 0% and 5.5% (2015: 0% and 5.5%). This funding is accounted for as part of the net investment in subsidiaries. There are currently no repayment schedules, nor does management have the intention to recall these funds.
Since 2010 the Capital Contributions, resulting from the stock options, have been booked directly within TIE Kinetix N.V. as this is the issuing Company. The stock option costs over previous periods have been recharged through the intercompany accounts to the relevant subsidiaries.
In 2016 and years prior, some subsidiaries had a negative net investment value. For these subsidiaries, a provision for Equity Deficit was set up as the Company intends to cover all debts arising from legally conducted transactions.
Direct subsidiaries of the Company are:
Financial Fixed Assets
Financial Fixed Assets relate to the Company’s share in subsidiaries. The movements are summarized below:
2016 2015
Total subsidiaries as per October 1, 12,497 11,689
Share in Net income (169) (491)
Investments - -
Movements of IC funding 5,394 698
Transfer to (from) provision for Equity Deficit 546 (118)
Foreign Currency Exchange Rate Differences - 719
Total subsidiaries as per September 30, 18,268 12,497
Loans Receivable 55 55
Deferred tax Asset - -
Total Financial Fixed Assets 18,323 12,552
TIE KINETIX N.V. ~ ANNUAL REPORT 2016

118Dutch GAAP TIE Kinetix NV Income Statementfor the year ending September 30, 2016
In 2016 in total 365,327 shares have been issued, bringing the total number of issued shares to 1,592,704 as at September 30, 2016. Shareholders’ Equity amounts to € 7,125k (or € 4.47 per share) on September 30, 2016 (2015: € 4,308k, or € 3.51 per share). The Company’s authorized share capital amounts to € 500k, consisting of 5 million ordinary shares with a nominal value of € 0.10 each.
Shareholders’ Equity is broken down as follows:
14) Shareholders’ Equity
For the movement in shares, we refer to page 91.
Legal reserves:The Foreign Currency Translation Reserve represents the foreign currency exchange differences from the translation of the financial statements of the foreign subsidiaries.The Other Legal Reserves pertain to the capitalized software development costs.
Shareholders’ EquityShare
Capital Paid inSurplus
ForeignCurrency
TranslationReserve
OtherLegal
Reserves RetainedEarnings
Share-holdersEquity
Balance per September 30, 2014 7,892 48,957 (159) 1,196 (51,911) 5,975
Denomination of Shares (8,469) 8,469 - - - -
Shares issued and Share Premium 700 - - - (10) 690
Costs of Shares issued - (304) - - - (304)
Foreign Currency Translation Reserve - - 300 - - 300
Shares Based Payments - - - - 13 13
Transfers to (from) legal reserve - (76) - 76 - -
Net Income 2015 - - - - (2,366) (2,366)
Balance per September 30, 2015 123 57,046 141 1,272 (54,274) 4,308
Shares issued and Share Premium 36 2,726 - - - 2,762
Costs of Shares issued - - - - (6) (6)
Foreign Currency Translation Reserve - - 20 - - 20
Shares Based Payments - - - - 5 5
Transfers to (from) legal reserve - (748) - 748 - -
Other movements - - - - (7) (7)
Net Income 2016 - - - - 41 41
Balance per September 30, 2016 159 59,024 161 2,020 (54,241) 7,123
Taxations and Social Security Contributions relate to VAT recoverable.
13) Current Assets
Other Receivables
TIE KINETIX N.V. ~ ANNUAL REPORT 2016

119
Provision
15) Non-Current Liabilities
16) Current Liabilities
In 2016 and years prior, some subsidiaries held a negative net investment value. For these subsidiaries, a provision for Equity Deficit was established as the Company intends to cover all debts arising from legally conducted transactions.
Other provision resulted from the acquisition of Light B.V. in 2012.
Bank relates to the overdraft on Rabobank, currently not drawn. The inter-company payable is an outstanding with TIE International B.V., TIE MamboFive B.V., TIE France SAS, TIE Commerce Inc and the indirect held subsidiary TIE Kinetix GmbH. No interest is due on this balance.
Provision for Equity Deficit Subsidiaries 2016 2015
Opening Balance as per October 1, 90 208
Movements from (to) Financial Fixed Assets 546 (118)
Closing Balance as per September 30, 636 90
Current Liabilities 2016 2015
Bank - 481
Trade creditors 175 391
Taxations and social security contributions 38 63
Inter-company payable 13,043 9,858
Short term debt - 200
Other payable and accruals 836 780
Total 14,091 11,773
Equity Settled Share Based Payments
Annual Stock Options PlanFor the Annual Stock Option Plan for staff members, we refer to page 91, Note 5 of the Consolidated Statement of Financial Position under Annual Stock Options Plan.
Other Stock OptionsFor the Other Stock Options, we refer to page 93, Note 5 of the Consolidated Statement of Financial Position under Other Stock Options.
Convertible BondsFor the issued and outstanding Convertible Bonds, we refer to page 94, Note 5 of the Consolidated Statement of Financial Position under Convertible Bonds.
TIE KINETIX N.V. ~ ANNUAL REPORT 2016

120TIE KINETIX N.V. ~ ANNUAL REPORT 2016

121Notes to the Company Income Statement
The Companies Income
No revenue is included in 2016 (2015: € 0k).
The Companies ExpensesExpenses accounted for consist of the ones related to the Companies activities of TIE Kinetix N.V, including allocated employee benefits. TIE Kinetix N.V. had 13 employees during 2016 (2015: 12). The remuneration of the Supervisory Board amounting to € 10k for members and € 20k for the chairman is included in the company’s expenses. For a detailed description of the remuneration of the sole member of the Management Board, we refer to page 106 of the Notes to the Consolidated Financial Statements. Included are Legal and Consultancy fees amounting to € 382k (2015: € 264k) as well as a Stock Option expense, listing fee and amortization charges pertaining to assets. The audit fees from BDO Audit & Assurance B.V. relating to the audit of the financial statements amount to € 100k (2015: € 111k). Other audit related fees from BDO amount to € 0 (2015: € 6k).
Income TaxThe Company holds unrecognized deferred tax assets with respect to past tax losses amounting to
approximately € 11,3 mln. All Dutch subsidiaries of TIE Kinetix N.V. and the Company form a tax unit and are jointly and severally liable for all tax liabilities originating within the tax unit.
Commitments and Contingent Liabilities
TaxesThe Company has formed a fiscal unit for corporate income tax and VAT with TIE Nederland B.V., TIE International B.V., TIE Product Development B.V., TIE MamboFive B.V., TIE Light B.V. and Gordian Investments B.V. Based on this, TIE Kinetix N.V. is jointly and severally liable for the corporate income tax liabilities of the fiscal unit as a whole.
OtherThe Company has no issued guarantees. Pending litigations and subsequent events are disclosed on page 111.
J.B. Sundelin CEO, TIE Kinetix N.V.
M. WolfswinkelCFO, TIE Kinetix N.V.
Breukelen, January 10, 2017
TIE KINETIX N.V. ~ ANNUAL REPORT 2016

122
Appropriation of Net Result
According to Article 26 of the Company’s articles of association, the annual meeting of shareholders determines the appropriation of the company’s net result for the year. The Management Board proposes that the net profit of € 41k will be added to retained Earnings and the other Comprehensive Profit of € 20k will be added to the Comprehensive Profit in Shareholders’ Equity.Article 26 of the Articles of Association reads as follows:1. The General meeting of shareholders determines
the appropriation of the company’s net results.2. The company can only make payments in as much
as its shareholders’ equity is greater than the paid-up and called-up part of the issued capital, plus the reserves, which must be maintained by law.
3. Payment of profits shall not take place until after adoption of the annual accounts, showing that this is authorized.
4. Shares or depositary receipts on shares held by the company and shares or depositary receipts on shares which the company holds in usufruct shall not be taken into account in the calculation of the profit distribution.
5. The General Meeting can only decide to make interim payments at the proposal of the Supervisory Board. A decision to pay an interim dividend from the profits in the current financial year can be taken by the Executive Board only with the prior approval of the Supervisory Board. Payments as referred to in this paragraph may only be made if the provision of par. 2 of this article has been met.
6. The General Meeting can decide that dividends shall be paid fully or partially in the form of shares in the Company’s capital.
7. Unless the General Meeting sets a different term, dividends are paid within fourteen days of being set. Claims for payments in cash shall lapse, in as much as these payments have not been collected within five years and one day of the date on which they became payable.
8. A deficit may only be offset against the reserves prescribed by law, if and to the extent permitted by law.
Dividend policyOver the past financial years, TIE Kinetix has not declared or paid dividends to its shareholders. The Executive Board carefully balances the use of future earnings for investment in product development, in the expansion of the Company and for dividend payments. The Company intends to initiate an active dividend policy as soon as its financial position allows. Holders of Ordinary Shares will be fully entitled to any dividends in future financial years. Payment of dividends can be made either in cash or in stock.
Other InformationTIE KINETIX N.V. ~ ANNUAL REPORT 2016
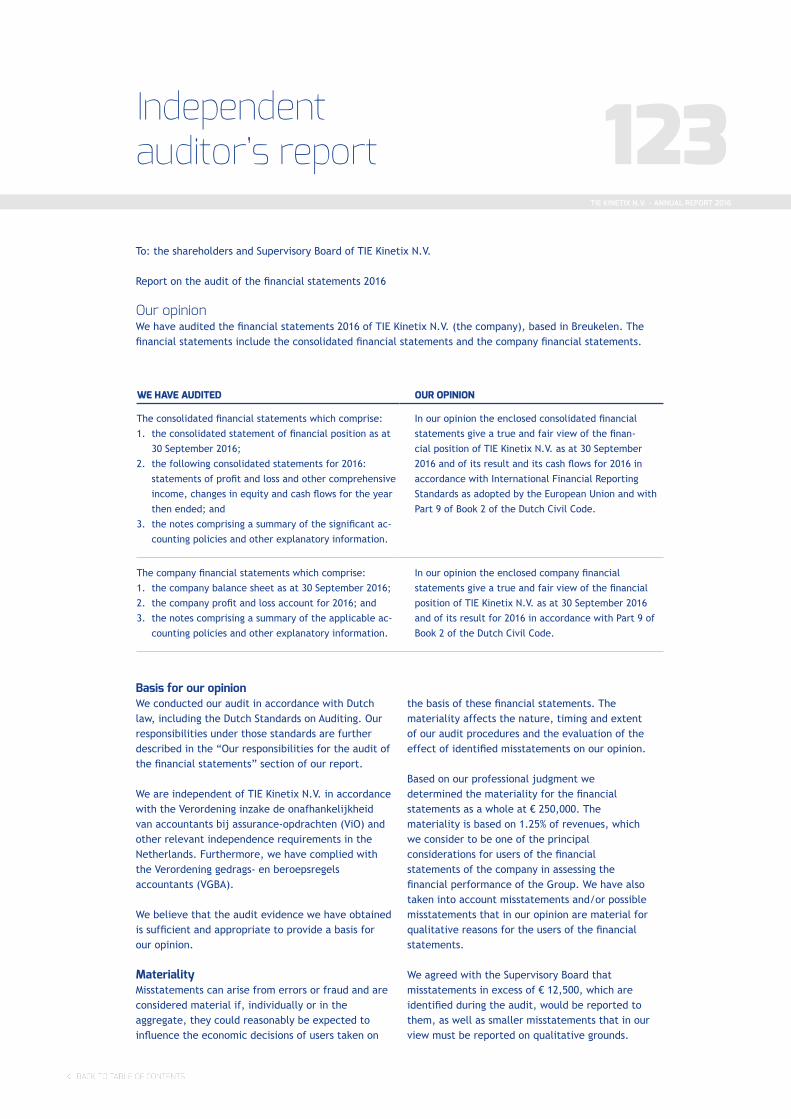
123Independent auditor’s report
To: the shareholders and Supervisory Board of TIE Kinetix N.V.
Report on the audit of the financial statements 2016
Our opinion We have audited the financial statements 2016 of TIE Kinetix N.V. (the company), based in Breukelen. The financial statements include the consolidated financial statements and the company financial statements.
the basis of these financial statements. The materiality affects the nature, timing and extent of our audit procedures and the evaluation of the effect of identified misstatements on our opinion.
Based on our professional judgment we determined the materiality for the financial statements as a whole at € 250,000. The materiality is based on 1.25% of revenues, which we consider to be one of the principal considerations for users of the financial statements of the company in assessing the financial performance of the Group. We have also taken into account misstatements and/or possible misstatements that in our opinion are material for qualitative reasons for the users of the financial statements.
We agreed with the Supervisory Board that misstatements in excess of € 12,500, which are identified during the audit, would be reported to them, as well as smaller misstatements that in our view must be reported on qualitative grounds.
Basis for our opinion We conducted our audit in accordance with Dutch law, including the Dutch Standards on Auditing. Our responsibilities under those standards are further described in the “Our responsibilities for the audit of the financial statements” section of our report.
We are independent of TIE Kinetix N.V. in accordance with the Verordening inzake de onafhankelijkheid van accountants bij assurance-opdrachten (ViO) and other relevant independence requirements in the Netherlands. Furthermore, we have complied with the Verordening gedrags- en beroepsregels accountants (VGBA).
We believe that the audit evidence we have obtained is sufficient and appropriate to provide a basis for our opinion.
MaterialityMisstatements can arise from errors or fraud and are considered material if, individually or in the aggregate, they could reasonably be expected to influence the economic decisions of users taken on
WE HAVE AUDITED OUR OPINION
The consolidated financial statements which comprise:
1. the consolidated statement of financial position as at
30 September 2016;
2. the following consolidated statements for 2016:
statements of profit and loss and other comprehensive
income, changes in equity and cash flows for the year
then ended; and
3. the notes comprising a summary of the significant ac-
counting policies and other explanatory information.
In our opinion the enclosed consolidated financial
statements give a true and fair view of the finan-
cial position of TIE Kinetix N.V. as at 30 September
2016 and of its result and its cash flows for 2016 in
accordance with International Financial Reporting
Standards as adopted by the European Union and with
Part 9 of Book 2 of the Dutch Civil Code.
The company financial statements which comprise:
1. the company balance sheet as at 30 September 2016;
2. the company profit and loss account for 2016; and
3. the notes comprising a summary of the applicable ac-
counting policies and other explanatory information.
In our opinion the enclosed company financial
statements give a true and fair view of the financial
position of TIE Kinetix N.V. as at 30 September 2016
and of its result for 2016 in accordance with Part 9 of
Book 2 of the Dutch Civil Code.
TIE KINETIX N.V. ~ ANNUAL REPORT 2016

124
Scope of the group auditTIE Kinetix N.V. is head of a group of entities. The financial information of this group is included in the consolidated financial statements of TIE Kinetix N.V.
Because we are ultimately responsible for the opinion, we are also responsible for directing, supervising and performing the group audit. In this respect we have determined the nature and extent of the audit procedures to be carried out for group entities. Decisive were the size and/or the risk profile of the group entities or operations. On this basis, we selected group entities for which an audit or review had to be carried out on the complete set of financial information or specific items.
Our group audit mainly focused on significant group entities. We consider a component significant when: » it is of individual financial significance to the
group; or » the component, due to its specific nature or
circumstances, is likely to include significant risks of material misstatement, whether due to fraud or error of the group financial statements.
To this extent we:» performed audit procedures ourselves at group
entities TIE Kinetix Nederland B.V. (Netherlands), Mambo Five B.V. (Netherlands), TIE Commerce Inc. (US) and TFT GmbH (Germany);
» performed review procedures or specific audit procedures at other group entities.
By performing the procedures mentioned above at group entities, together with additional procedures at group level, we have been able to obtain sufficient and appropriate audit evidence about the group’s financial information to provide an opinion about the consolidated financial statements.
Our key audit mattersKey audit matters are those matters that, in our professional judgment, were of most significance in our audit of the financial statements. We have communicated the key audit matters to the Supervisory Board. The key audit matters are not a comprehensive reflection of all matters discussed.
These matters were addressed in the context of our audit of the financial statements as a whole and in forming our opinion thereon, and we do not provide a separate opinion on these matters.
1. Revenue recognition, including the timing of revenue recognition
Refer to the Description of accounting principles on page 77.
The company’s businesses continue to evolve with new revenue arrangements. This results in circumstances which require careful consideration regarding what multiple performance obligations exist and what revenue recognition pattern is appropriate.
New revenue arrangements are material and require management’s judgement as the revenue recognition is complex and therefore revenue recognition is considered a key audit matter.
Our audit approach:Per individual source of income we have tested whether revenue is recognised when the applicable criteria for revenue recognition under IAS 18 are met. Main audit procedures for these sources of income are as follows:» For Software licence fees we have tested, based
on the underlying contract and delivery of the licence to the customer, whether revenue was recognised in the correct period for the price which was agreed in the contract between the company and the client.
» For Maintenance and Support fees we have tested whether revenue recognition takes place over the contract period in accordance with the underlying contracts and that the prices which are invoiced are in line with these contracts.
» Regarding Consultancy services, we have tested whether the related revenues are recognised in line with the stage of completion of the transaction.
» SaaS contracts can include a multiple-element arrangement with clients. For these type of contracts we have performed specific procedures to test the allocation of revenue to the specific identifiable performance obligations.
Furthermore we evaluated and tested processes, procedures and controls regarding the accounting treatment for the various sources of income the company has. For all types of revenue, we performed various substantive testing, including detailed contract reviews, revenue cut-off procedures, journal entry testing and data analysis and review of log files. Additionally, we performed substantive analytical procedures.
Independent auditor’s reportTIE KINETIX N.V. ~ ANNUAL REPORT 2016

1252. The assessment of the carrying value of
goodwill and acquired intangible fixed assetsRefer to note 1 Intangible fixed assets on page 82-84.
The company has material amounts of goodwill and other intangible fixed assets resulting from acquisitions in the past. The company is required to perform annual impairment tests for each cash-generating unit (“CGU”) or smallest group of CGUs to which a portion of the carrying amount can be allocated on a reasonable and consistent basis. The identification of CGUs is based on the internal reporting structure and did not change compared to prior year.
The impairment testing is based on significant assumptions and estimates by management and is therefore considered a key audit matter.
Our audit approach:In previous financial year we used an auditor’s expert to determine the appropriateness of the models and calculations used for the goodwill and intangible fixed asset impairment testing and we determined that the models did not change during this financial year. We challenged management’s assumptions for the CGUs (TIE Nederland + International, TIE E-Commerce, TIE France, TIE US, TIE Germany and TIE Product Development) by corroborating them to historical budget achievement rates, available budgets and market trends. Amongst others we focused on the cash flow projections, discount rates (WACC), growth rates, sensitivities and available headroom.
3. The carrying value of internally developed intangible assets
Refer to note 1 Intangible fixed assets on page 82.
The company capitalizes internal development costs if it can demonstrate the technical feasibility of completing the intangible asset, reliably measure costs attributable to the intangible fixed asset during its development and estimate future economic benefits. During the year € 1.5 million development costs were capitalised, mainly relating to consultancy hours for the new Flow product. We consider the internally developed intangible assets to be a key audit matter due to the nature and size of the account.
Our audit approach:We reconciled capitalized hours to internal time
registration and determined adequate distinction in research and development stages. We reconciled the hourly rates used with payroll output and challenged management’s assessment as to whether development projects in-progress were still expected to be completed and deliver sufficient positive economic benefits to the combined businesses upon their completion, and for completed development projects, considered whether the useful economic lives selected remained appropriate. To this extent we have inquired at appropriate management levels within the company and reviewed sales forecasts and available business cases per project.
4. The recoverability of deferred tax assetsRefer to note 3 Financial assets on page 86-88.
The company has material amounts of unutilised taxable losses in the Netherlands and US. IFRS states that a deferred tax asset shall only be recognised for the carry forward of tax losses to the extent that it is probable that future taxable profits will be available against which the unused tax losses can be utilised. This assessment depends on significant assumptions and estimates by management and is therefore considered a key audit matter.
Management recognised a deferred tax asset for TIE US based on probability of utilisation and decided not to recognise a deferred tax asset for TIE Netherlands because of the low track record of taxable profits.
Our audit approach:We considered the appropriateness of management’s assumptions and estimates in relation to the likelihood of generating suitable future taxable profits to support the recognition of deferred tax assets, challenging those assumptions and considering supporting forecasts and estimates. We also determined the availability of taxable losses by requesting confirmation letters from tax advisors and corroborated supporting forecasts with available long-term budgets, taking into account historical achievement rates.
Responsibilities of management and the Supervisory Board for the financial statements Management is responsible for the preparation and fair presentation of the financial statements in accordance with EU-IFRS and Part 9 of Book 2 of
TIE KINETIX N.V. ~ ANNUAL REPORT 2016

126
the Dutch Civil Code. Furthermore, management is responsible for such internal control as management determines is necessary to enable the preparation of the financial statements that are free from material misstatement, whether due to errors or fraud.
As part of the preparation of the financial statements, management is responsible for assessing the company’s ability to continue as a going concern. Based on the financial reporting frameworks mentioned, management should prepare the financial statements using the going concern basis of accounting unless management either intends to liquidate the company or to cease operations, or has no realistic alternative but to do so. Management should disclose events and circumstances that may cast significant doubt on the company’s ability to continue as a going concern in the financial statements.
The Supervisory Board is responsible for overseeing the company’s financial reporting process.
Our responsibilities for the audit of the financial statements Our objective is to plan and perform the audit assignment in a manner that allows us to obtain sufficient and appropriate audit evidence for our opinion.
Our audit has been performed with a high, but not absolute, level of assurance, which means we may not have detected all errors and fraud.
Misstatements can arise from errors or fraud and are considered material if, individually or in the aggregate, they could reasonably be expected to influence the economic decisions of users taken on the basis of these financial statements. The materiality affects the nature, timing and extent of our audit procedures and the evaluation of the effect of identified misstatements on our opinion.
We have exercised professional judgment and have maintained professional scepticism throughout the audit, in accordance with Dutch Standards on Auditing, ethical requirements and independence requirements. Our audit included e.g.:» Identifying and assessing the risks of material
misstatement of the financial statements, whether due to errors or fraud, designing and
performing audit procedures responsive to those risks and obtaining audit evidence that is sufficient and appropriate to provide a basis for our opinion. The risk of not detecting a material misstatement resulting from fraud is higher than for one resulting from errors, as fraud may involve collusion, forgery, intentional omissions, misrepresentations or the override of internal control;
» Obtaining an understanding of internal control relevant to the audit in order to design audit procedures that are appropriate in the circumstances, but not for the purpose of expressing an opinion on the effectiveness of the company’s internal control;
» Evaluating the appropriateness of accounting policies used and the reasonableness of accounting estimates and related disclosures made by management;
» Concluding on the appropriateness of management’s use of the going concern basis of accounting, and based on the audit evidence obtained, whether a material uncertainty exists related to events or conditions that may cast significant doubt on the company’s ability to continue as a going concern. If we conclude that a material uncertainty exists, we are required to draw attention in our auditor’s report to the related disclosures in the financial statements or, if such disclosures are inadequate, to modify our opinion. Our conclusions are based on the audit evidence obtained up to the date of our auditor’s report. However, future events or conditions may cause the company ceasing to continue as a going concern;
» Evaluating the overall presentation, structure and content of the financial statements, including the disclosures; and
» Evaluating whether the financial statements represent the underlying transactions and events in a manner that achieves fair presentation.
Because we are ultimately responsible for the opinion, we are also responsible for directing, supervising and performing the group audit. In this respect we have determined the nature and extent of the audit procedures to be carried out for group entities. Decisive were the size and/or the risk profile of the group entities or operations. On this basis, we selected group entities for which an audit or review had to be carried out on the complete set of financial information or specific items.
We communicate with the Supervisory Board regarding, among other matters, the planned scope and timing of
Independent auditor’s reportTIE KINETIX N.V. ~ ANNUAL REPORT 2016

127the audit and significant audit findings, including any significant findings in internal control that we identify during our audit.
We provide the Supervisory Board with a statement that we have complied with relevant ethical requirements regarding independence, and to communicate with them all relationships and other matters that may reasonably be thought to bear on our independence, and where applicable, related safeguards.
From the matters communicated with the Supervisory Board, we determine those matters that were of most significance in the audit of the financial statements of the current period and are therefore the key audit matters. We describe these matters in our auditor’s report unless law or regulation precludes public disclosure about the matter or when, in extremely rare circumstances, not mentioning it is in the public interest.
Report on other legal and regulatory requirements
Other information This report includes, next to the financial statements and our opinion thereon, other information. This other information consists of:» the Report of the Executive Board;» the other information on page 122;» the Key Figures, Performance Highlights, Revenue
Breakdowns, Key Headlines FY2016, Letter from the CEO, Our Corporate Story, The Supervisory Board, The Executive Board, Important Information, Report from the Supervisory Board, Corporate Sustainability and Corporate Governance.
standards we report that:» we have no deficiencies to report as a result of
our examination whether the Report of the Executive Board, to the extent we can assess, has been prepared in accordance with Part 9 of Book 2 of the Dutch Civil Code, and whether the other information on page 122 as required by Part 9 of Book 2 of the Dutch Civil Code have been annexed.
» the Report of the Executive Board, to the extent we can assess, is consistent with the financial statements.
» we have nothing to report regarding the other information other than the Report of the Executive Board and the other information on page 122.
Our opinion on the financial statements does not include the other information and we do not express an opinion or other assurance conclusion on the other information. As part of our audit on the financial statements and based on the auditing standards, it is our responsibility to read the other information. We have to assess whether there are any material inconsistencies between the other information and the financial statements. In order to do so, we use the obtained audit evidence of audit of the financial statements and the conclusions drawn in our audit. We also determine whether the other information in other ways seems to include material deficiencies. If we conclude, based on the procedures performed, that the other information includes a material deficiency, we are required to report this matter.
Management is responsible for the preparation of the other information including the preparation of the Report of The Executive Board and the other information on page 122 in accordance with Part 9 of Book 2 of the Dutch Civil Code.
EngagementWe were engaged by the Supervisory Board as auditor of TIE Kinetix N.V. on 27 May 2014, as of the audit for the year ended 30 September 2014 and have operated as statutory auditor ever since that date.
Amstelveen, 10 January 2017
For and on behalf of BDO Audit & Assurance B.V.,
Sgd.J.A. de Rooij RA
TIE KINETIX N.V. ~ ANNUAL REPORT 2016

TIE Kinetix – Germany
Neumarkter Straße 6181673 MünchenTel: +49-89-990164-0
TIE Commerce Inc – US (Boston)
3 Highwood Drive #101-ETewksbury, MA 01876Tel: 1-800-624-6354
TIE Commerce Inc – US (St. Paul)
1360 Energy Park Drive, ST 110St Paul, MN 55108Tel: 1-651-999-8600
TIE Kinetix N.V. The Netherlands (Breukelen)
De Corridor 5d - 3rd FloorBreukelen, 3621 ZATel: +31-88-369-8000
TIE Kinetix delivers Total Integrated E-Commerce solutions that maximize revenue opportunities by minimizing the energy needed to Market, Sell, Deliver and Optimize online.
2
1
1 2 3 4
128
TIE Kinetix Subsidiaries & Offices
TIE KINETIX N.V. ~ ANNUAL REPORT 2016

TIE Kinetix Asia-Pacific Ltd. - Australia
PO Box 7664Baulkham Hills NSW 2153Phone: +61-41-185-8810Fax: +61-2-9652-1647
TIE Kinetix UK - United Kingdom
37 Crewe RoadCW1 5QR Haslington, Crewe
TIE Kinetix France SAS - France
Parc de Bellegarde, Bât. B1 Chemin de Borie34170 Castelnau-le-LezTel: +33-4-11-95-01-00
5
7
63
4
5 6 7
129TIE KINETIX N.V. ~ ANNUAL REPORT 2016
Jori de Bont, Support Consultant TIE Kinetix
“At TIE Kinetix, we work closely together with our business partners to optimize the performance throughout the supply chain.”
TIE KINETIX N.V. ~ ANNUAL REPORT 2016

131Glossary
AFM Authoriteit Financiële Markten; The Netherlands Authority for the Financial MarketsAGM Annual General MeetingAOP Annual Operating PlanB.V. Besloten Vennootschap; private limited liability companyB2B Business to BusinessB2C Business to ConsumerBI Business IntegrationBIP Business Integration PlatformCEO Chief Executive OfficerCGU Cash Generating UnitCMO Chief Marketing OfficerCOO Chief Operations OfficerCS Content Syndication CSP Content Syndication PlatformCSR Corporate Social ResponsibilityDACH Germany, Austria and SwitzerlandEC E-CommerceEDI Electronic Data InterchangeEMEA Europe, the Middle East and AfricaERP Enterprise Resource PlanningEU European UnionFTE Full time equivalentFY Financial YearGAAP Generally Accepted Accounting Principles GmbH Gesellschaft mit beschränkter Haftung; company with limited liabilityHRM Human Resource ManagementIAS International Accounting StandardsIFRS International Financial Reporting StandardsInc. IncorporationIR Investor RelationsLLP Limited Liability PartnershipLtd Limited company; Private company limited by sharesMOU Memorandum of UnderstandingN.V. Naamloze Vennootschap; public limited liability companyPR Public RelationsR&D Research and DevelopmentROI Return on InvestmentRoW Rest of the WorldRSS Reverse Stock SplitSaaS Software as a ServiceSME Small & Medium EnterprisesUK United KingdomUS or USA United States of AmericaVP Vice PresidentWACC Weighted Average Cost of CapitalWBSO Wet Bevordering Speur- en OntwikkelingswerkWIP Work in Progress
TIE KINETIX N.V. ~ ANNUAL REPORT 2016

132
Chief Executive OfficerMr. Jan Sundelin
T: +31 88 369 8000E: [email protected]
Chief Financial OfficerDr. Michiel Wolfswinkel
T: +31 88 369 8000E: [email protected]
TIE KINETIX N.V. ~ ANNUAL REPORT 2016