chikungunya cases identified through passive … transcription–polymerase chain reaction (rrt-pcr)...
TRANSCRIPT

suspected chikungunya cases as they do dengue because of the similarities in symptoms and increased risk for complications in dengue patients that are not appropriately managed. Residents of and travelers to the tropics can minimize their risk for both chikungunya and dengue by taking standard measures to avoid mosquito bites.
Chikungunya* is an emerging infectious disease character-ized by fever and arthralgia (2). After the first locally acquired chikungunya case was reported from St. Martin in December 2013, CHIKV spread rapidly throughout the Americas, with nearly 1 million cases reported to date.† Both CHIKV and the four dengue viruses (DENV-1–4) are transmitted by Aedes aegypti and Aedes albopictus mosquitoes. Dengue§ is endemic
Continuing Education examination available at http://www.cdc.gov/mmwr/cme/conted_info.html#weekly.
U.S. Department of Health and Human ServicesCenters for Disease Control and Prevention
Morbidity and Mortality Weekly ReportWeekly / Vol. 63 / No. 48 December 5, 2014
Chikungunya and dengue are mosquito-borne, viral, acute febrile illnesses that can be difficult to distinguish clinically. Whereas dengue is endemic in many countries in the Caribbean and the Americas, the first locally acquired chikungunya case in the Western Hemisphere was reported from the Caribbean island of St. Martin in December 2013 and was soon followed by cases in many parts of the region (1). In January 2014, the Puerto Rico Department of Health (PRDH) and CDC initiated chikungunya surveillance by building on an exist-ing passive dengue surveillance system. To assess the extent of chikungunya in Puerto Rico, the severity of illnesses, and the health care–seeking behaviors of residents, PRDH and CDC analyzed data from passive surveillance and investiga-tions conducted around the households of laboratory-positive chikungunya patients. Passive surveillance indicated that the first locally acquired, laboratory-positive chikungunya case in Puerto Rico was in a patient with illness onset on May 5, 2014. By August 12, a total of 10,201 suspected chikungunya cases (282 per 100,000 residents) had been reported. Specimens from 2,910 suspected cases were tested, and 1,975 (68%) were positive for chikungunya virus (CHIKV) infection. Four deaths were reported. The household investigations found that, of 250 participants, 70 (28%) tested positive for current or recent CHIKV infection, including 59 (84%) who reported illness within the preceding 3 months. Of 25 laboratory-positive par-ticipants that sought medical care, five (20%) were diagnosed with chikungunya and two (8%) were reported to PRDH. These investigative efforts indicated that chikungunya cases were underrecognized and underreported, prompting PRDH to conduct information campaigns to increase knowledge of the disease among health care professionals and the public. PRDH and CDC recommended that health care providers manage
Chikungunya Cases Identified Through Passive Surveillance and Household Investigations — Puerto Rico, May 5–August 12, 2014
Tyler M. Sharp, PhD1, Nicole M. Roth1, Jomil Torres, MS2, Kyle R. Ryff, MPH2, Nicole M. Pérez Rodríguez1, Chanis Mercado, MPH2, Maria del Pilar Diaz Padró, MPH2, Maria Ramos, MPH2, Raina Phillips, MD3,4, Matthew Lozier, PhD4,5, Carmen S. Arriola, DVM, PhD4,6, Michael Johansson, PhD1, Elizabeth Hunsperger, PhD1, Jorge L. Muñoz-Jordán, PhD1, Harold S. Margolis, MD1, Brenda Rivera García, DVM2 (Author affiliations at end of text)
INSIDE1129 Pertussis Epidemic — California, 20141133 Respiratory Syncytial Virus — United States, July
2012–June 20141137 Notes from the Field: Transmission of Chikungunya
Virus in the Continental United States — Florida, 2014
1138 Announcements1140 QuickStats
* Additional information available at http://www.cdc.gov/chikungunya. † Up-to-date case counts available at http://www.paho.org/hq/index.
php?itemid=40931.§ Additional information available at http://www.cdc.gov/dengue.

Morbidity and Mortality Weekly Report
1122 MMWR / December 5, 2014 / Vol. 63 / No. 48
The MMWR series of publications is published by the Center for Surveillance, Epidemiology, and Laboratory Services, Centers for Disease Control and Prevention (CDC), U.S. Department of Health and Human Services, Atlanta, GA 30329-4027.Suggested citation: [Author names; first three, then et al., if more than six.] [Report title]. MMWR Morb Mortal Wkly Rep 2014;63:[inclusive page numbers].
Centers for Disease Control and PreventionThomas R. Frieden, MD, MPH, Director
Harold W. Jaffe, MD, MA, Associate Director for Science Joanne Cono, MD, ScM, Director, Office of Science Quality
Chesley L. Richards, MD, MPH, Deputy Director for Public Health Scientific ServicesMichael F. Iademarco, MD, MPH, Director, Center for Surveillance, Epidemiology, and Laboratory Services
MMWR Editorial and Production Staff (Weekly)Charlotte K. Kent, PhD, MPH, Acting Editor-in-Chief
John S. Moran, MD, MPH, EditorTeresa F. Rutledge, Managing Editor
Douglas W. Weatherwax, Lead Technical Writer-EditorJude C. Rutledge, Writer-Editor
Martha F. Boyd, Lead Visual Information SpecialistMaureen A. Leahy, Julia C. Martinroe, Stephen R. Spriggs, Terraye M. Starr
Visual Information SpecialistsQuang M. Doan, MBA, Phyllis H. King
Information Technology Specialists
MMWR Editorial BoardWilliam L. Roper, MD, MPH, Chapel Hill, NC, Chairman
Matthew L. Boulton, MD, MPH, Ann Arbor, MIVirginia A. Caine, MD, Indianapolis, IN
Jonathan E. Fielding, MD, MPH, MBA, Los Angeles, CADavid W. Fleming, MD, Seattle, WA
William E. Halperin, MD, DrPH, MPH, Newark, NJKing K. Holmes, MD, PhD, Seattle, WA
Timothy F. Jones, MD, Nashville, TNRima F. Khabbaz, MD, Atlanta, GADennis G. Maki, MD, Madison, WI
Patricia Quinlisk, MD, MPH, Des Moines, IAPatrick L. Remington, MD, MPH, Madison, WI
William Schaffner, MD, Nashville, TN
in Puerto Rico (3) and throughout the tropics¶ where these mosquitoes exist (4), and is characterized by fever, aches and pains, leukopenia, and minor bleeding manifestations (e.g., petechial and gingival bleeding) (5). Whereas DENV infection does not lead to long-lasting cross-protective immunity but rather is associated with increased risk for developing severe dengue after infection with another DENV, infection with CHIKV results in long-lived immunity that protects from future illness.
In January 2014, PRDH and CDC initiated chikungunya surveillance in Puerto Rico by modifying the existing Passive Dengue Surveillance System (PDSS) (3) to include suspected chikungunya. Patients for whom a clinician suspected chi-kungunya as the cause of illness were reported by sending a serum specimen along with a dengue case investigation form** on which “suspected chikungunya” was indicated. Specimens collected within 5 days of illness onset were tested by real-time reverse transcription–polymerase chain reaction (rRT-PCR) (6) with updated primers to detect current CHIKV infection. Specimens collected ≥6 days after illness onset were tested by immunoglobulin M capture enzyme-linked immunosorbent assay (MAC-ELISA) (7) to detect recent CHIKV infection. Specimens from suspected dengue patients and some specimens from suspected chikungunya patients were tested by rRT-PCR
(8) or MAC ELISA to detect current or recent DENV infec-tion, respectively. Laboratory-positive chikungunya cases were defined as suspected chikungunya cases with test results indicating current or recent CHIKV infection.
Epidemiologic and Laboratory InvestigationPassive surveillance analysis. Suspected chikungunya cases
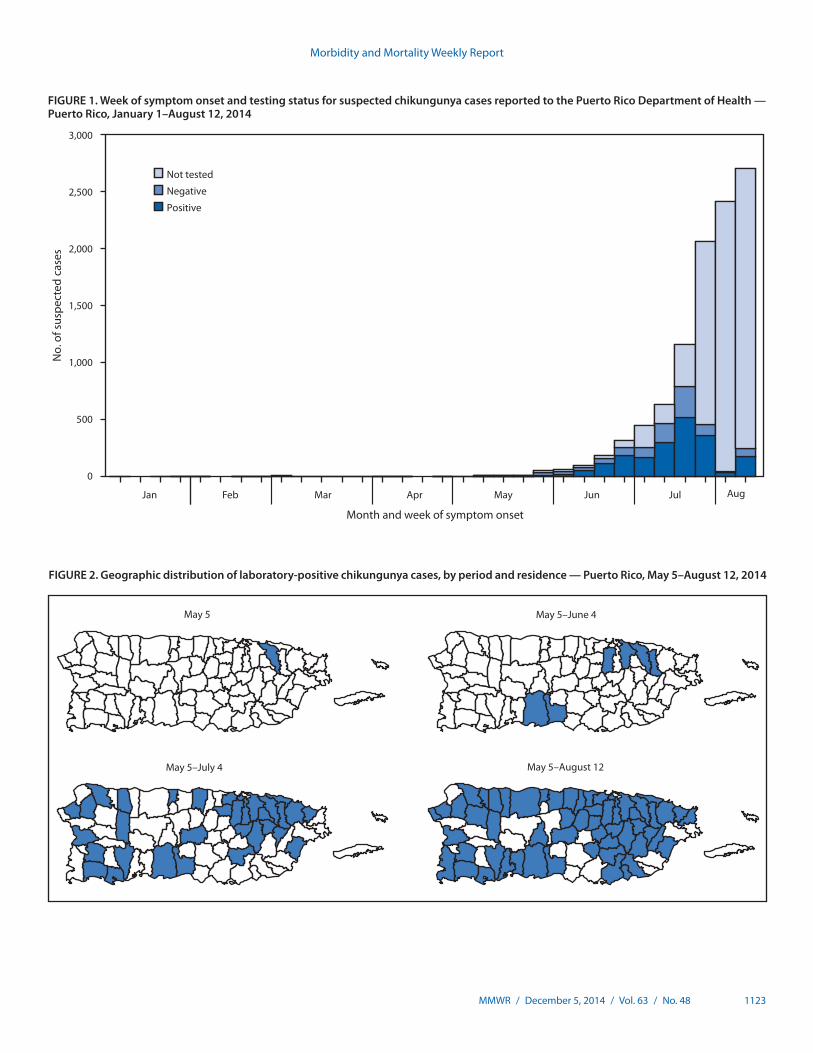
were first reported in January 2014, and the first laboratory-positive patient had illness onset on May 5 (Figure 1). The patient was a resident of the San Juan metropolitan area and did not report travel outside of Puerto Rico in the 14 days before illness onset. Additional laboratory-positive chikungunya cases were reported in the following weeks from throughout the San Juan and Ponce metropolitan areas (Figure 2). By August 12, a total of 10,201 suspected chikungunya cases (282 per 100,000 residents) had been reported from 57 (73%) of Puerto Rico’s 78 municipalities. Specimens from 2,910 suspected chikungunya cases were tested for CHIKV infection, and 1,975 (68%) were laboratory-positive. Suspected and laboratory-positive chikun-gunya cases were reported in all age groups, and incidence was highest among persons aged ≥50 years (291 suspected and 57 laboratory-positive cases per 100,000 residents) (Figure 3).
Of 652 laboratory-positive cases for which demographic and clinical information was available, 344 (53%) were in females, and the most commonly reported symptoms were fever (87%), arthralgia (79%), and myalgia (79%) (Table). Hospitalization
¶ Additional information available at http://www.healthmap.org/dengue/en. ** Available at http://www.cdc.gov/dengue/resources/denguecasereports/dcif_
english.pdf.
Morbidity and Mortality Weekly Report
MMWR / December 5, 2014 / Vol. 63 / No. 48 1123
FIGURE 1. Week of symptom onset and testing status for suspected chikungunya cases reported to the Puerto Rico Department of Health — Puerto Rico, January 1–August 12, 2014
0
500
1,000
1,500
2,000
2,500
3,000
No.
of s
uspe
cted
cas
es
Month and week of symptom onset
Not tested
Negative
Positive
Jan Feb AugJulJunMayAprMar
FIGURE 2. Geographic distribution of laboratory-positive chikungunya cases, by period and residence — Puerto Rico, May 5–August 12, 2014
May 5–June 4
May 5–August 12May 5–July 4
May 5

Morbidity and Mortality Weekly Report
1124 MMWR / December 5, 2014 / Vol. 63 / No. 48
was uncommon (13%), and major bleeding (3%) or severe manifestations (2%) were rarely reported.
Four deaths were reported among laboratory-positive chikungunya patients. The first patient was a woman aged 31 years with coexisting medical conditions (i.e., morbid obesity, diabetes, hypothyroidism, and asthma) who was brought to the emergency department because of difficulty breathing and acute febrile illness. She died within 24 hours of hospitalization. The second and third patients were men aged 45 and 78 years with preexisting diabetes. Both sought care for acute febrile illness, were diagnosed with a localized source of bacterial infection that was not confirmed by bacterial culture, and died <24 hours and 3 days after hospitalization, respectively. The fourth patient was a man aged 57 years with a history of congestive heart failure, diabetes, and obesity, who was found in his home unresponsive, febrile, and with labored breathing. A history of acute febrile illness was obtained, and
an electrocardiogram revealed evidence of recent myocardial infarction. He died <24 hours after hospitalization.
DENV and CHIKV cross-testing. Of 4,433 suspected dengue cases reported to PDSS during January 1–August 12, 426 (9.6%) were laboratory-positive for DENV infection. Of 147 suspected dengue cases that were laboratory-negative for DENV infection and subsequently tested for CHIKV infec-tion, 21 (14%) were laboratory-positive. Of 761 suspected chikungunya cases also tested for DENV infection, 14 (2%) were laboratory-positive for DENV infection. Of 908 sus-pected dengue or chikungunya cases tested for infection with both viruses, none were concurrently infected.
Household investigations. Household-based cluster investigations were conducted to 1) describe the spectrum of disease in CHIKV-infected persons; 2) determine the health care–seeking behaviors of persons with chikungunya; and 3) determine whether persons with chikungunya who sought
FIGURE 3. Number of suspected chikungunya cases, by age group* and test status, and number per 100,000 population — Puerto Rico, January 1–August 12, 2014
0
50
100
150
200
250
300
350
0
200
400
600
800
1,000
1,200
1,400
<1 1–9 10–19 20–29 30–39 40–49 50–59 60–69 70–79 ≥80
No.
of s
uspe
cted
cas
es
Age group (yrs)
No. of suspected cases per 100,000 population
Not testedNegativePositive Suspected cases per 100,000
* Age was available for 9,911 suspected chikungunya cases.

Morbidity and Mortality Weekly Report
MMWR / December 5, 2014 / Vol. 63 / No. 48 1125
medical care were appropriately diagnosed and reported. The rationale for the design of this investigation was based on prior observations that dengue cases cluster within households and neighborhoods (9) because of the movement of infected mosquitoes and humans (10), whereas human movement is the major vehicle for DENV dispersal >100 meters (11). Because the same pattern is presumed to be true for CHIKV transmission, additional infected persons were expected to be found among neighbors of chikungunya patients.
The residences of a convenience sample of reported laboratory-positive chikungunya patients were visited, and residents of households within a 50-meter radius were offered chikungunya diagnostic testing. Participants provided a serum specimen and answered a questionnaire regarding household characteristics, demographics, travel history, and recent ill-nesses. Laboratory-positive participants were household inves-tigation participants with current or recent CHIKV infection.
During June 20–August 19, a total of 21 household inves-tigations were conducted in the health regions of San Juan
(nine investigations), Bayamón (eight), Ponce (two), Arecibo and Caguas (one each). Of 499 houses visited, 433 (87%) were occupied, and an adult was present at the time of visit at 200 (46%). From these 200 eligible households, a total of 250 residents in 137 (69%) of the households agreed to participate in the investigation. The median number of residents per participating household was three (range = 1–9), and a mean of two (range = 1–6) residents per household participated in the investigation. Median age of the participants (45 years) was higher than that of persons who did not participate in the investigation but lived in participating households (25 years).
Of the 250 household investigation participants, 70 (28%) were laboratory-positive for CHIKV infection, including 12 (17%) who had current and 58 (83%) who had recent CHIKV infection. Of the 70 who were laboratory-positive for CHIKV infection, 59 (84%) reported an acute illness in the preceding 3 months (Table). Of these 59, a total of 56 (95%) reported arthralgia, 55 (93%) reported fever, and 53 (90%) reported fever and arthralgia. Median duration of illness was 6 days
TABLE. Characteristics and signs and symptoms of chikungunya cases reported to the Puerto Rico Department of Health or detected through household investigations — Puerto Rico, 2014
Characteristic
Reported cases (N = 652)Recently ill household investigation participants
(N = 59)
No. (%) No. (%)
Demographics and clinical courseHistory of recent travel* 31 (5) 1 (1)Female 344 (53) 27 (46)Pregnant 8 (1) 1 (2)Hospitalized 84 (13) 10 (17)Median days from onset to specimen collection (range) 1 (0–40) 18 (1–60)
Signs and symptoms†
Fever 567 (87) 55 (93)Arthralgia 512 (79) 56 (95)Myalgia 518 (79) 48 (81)Headache 434 (67) 41 (69)Chills 343 (53) 42 (71)Rash 263 (40) 32 (54)Eye pain 282 (43) 18 (31)Nausea/Vomiting 170 (26) 19 (32)Abdominal pain 117 (18) 16 (27)Arthritis§ 97 (15) 29 (49)Nasal congestion 87 (13) 12 (20)Cough 92 (14) 13 (22)Sore throat 101 (15) 14 (24)Diarrhea 74 (11) 17 (29)Conjunctivitis 16 (2) 20 (34)Bleeding manifestations 175 (27) 7 (12)
Minor¶ 172 (26) 7 (12)Major** 17 (3) 0 (0)
Severe manifestations†† 16 (2) 0 (0)
* Travel outside of Puerto Rico and the United States in the 14 days before illness onset. † Signs and symptoms were either defined by a clinician for reported cases or were self-reported by household investigation participants. § Five cases reported arthritis in the absence of arthralgia. No investigation participants reported arthritis in the absence of arthralgia. ¶ Petechiae, bleeding gums, epistaxis, unspecified mucosal bleeding, and hematuria. ** Purpura/ecchymosis (16 persons), melena (two), hematemesis (two), and vaginal bleeding (one). †† Jaundice (nine persons), convulsions (four), effusion (two), encephalitis (one), and hepatomegaly (one).

Morbidity and Mortality Weekly Report
1126 MMWR / December 5, 2014 / Vol. 63 / No. 48
(range = 2–21 days). After excluding the index patient for each household cluster, 25 (63%) of 40 laboratory-positive symptomatic participants sought medical care, of whom five (20%) were diagnosed with chikungunya, three (12%) were hospitalized, and two (8%) were reported to PRDH as having suspected chikungunya.
Public Health ResponseIn accordance with International Health Regulations, CDC
was notified after the first locally acquired chikungunya case in Puerto Rico was identified. The public health response to the impending epidemic focused on raising chikungunya aware-ness, both among health care providers and the public, and implementing syndromic surveillance with laboratory testing to enable timely detection of cases. Messaging to health care providers focused on the signs and symptoms of chikungunya and the need to manage suspected chikungunya patients as dengue patients because of their clinical similarity and the increased risk for morbidity and mortality if dengue patients are not managed appropriately (5,12). Mandatory reporting of novel diseases such as chikungunya was already required in Puerto Rico; however, supplemental regulations were issued requiring reporting of suspected chikungunya cases to PRDH. To enable more timely surveillance, a chikungunya sentinel surveillance system was initiated in August with nine represen-tative health facilities selected to monitor epidemiologic trends.
Discussion
CHIKV was first detected in modern-day Tanzania in 1952–1953 (13), and later caused outbreaks in countries in the Indian Ocean and southern Asia (2). Chikungunya outbreaks typically affect a large proportion of the population (e.g., 38%–63%) because of high viremia in the host and infected mosquitoes, inability to control vector mosquitoes, and lack of preexisting protective immunity (2). Some chikungunya patients experi-ence prolonged morbidity and disability because of joint pain that can persist for months or years (14). Fatal chikungunya cases are rare (i.e., <0.1% of cases) and are typically associated with underlying health conditions or very young or advanced age (15). Although there is no specific treatment for either dengue or chikungunya, close clinical monitoring of dengue patients along with judicious fluid management can reduce morbidity and mortality (5,12).
Passive surveillance for any illness is dependent on ill persons seeking medical care, clinician recognition of the illness, and reporting of cases to public health authorities. The household investigations conducted during the chikungunya epidemic in Puerto Rico identified cases that had not been reported, sug-gesting that the magnitude of the epidemic is larger than sug-gested by passive surveillance. Because the population of Puerto
Rico is presumed to be immunologically naïve with respect to CHIKV infection and Ae. aegypti mosquitoes are present year-round, the high infection rates observed in the household investigations were not unexpected. Prior investigations have reported rates of asymptomatic CHIKV infection of 3%–28% (16,17), similar to the rate observed in this investigation.
Because of overlapping signs and symptoms, chikungu-nya and dengue are often difficult to distinguish clinically. Therefore, surveillance in areas where both CHIKV and DENV are circulating should include laboratory diagnostic testing for both illnesses. Although aches and pains are charac-teristic of both illnesses, arthralgia might be more prominent in patients with chikungunya, whereas dengue patients typically complain of generalized myalgia and retro-orbital eye pain. Similarly, although rash might be present in both dengue and chikungunya patients, studies have suggested that it is more common and develops earlier in chikungunya patients (18,19). Nonetheless, until arthralgia, rash, or other clinical signs or
What is already known on this topic?
Chikungunya is an emerging infectious disease caused by chikungunya virus, which is transmitted via the bite of infected Aedes aegypti and Aedes albopictus mosquitoes and was introduced into the Western Hemisphere in late 2013. Because of clinical similarity with dengue, which is endemic throughout the tropics and depends on early identification and proper management to reduce morbidity and mortality, patients with suspected chikungunya should be managed according to recommended strategies for dengue patients.
What is added by this report?
The first locally acquired, laboratory-confirmed chikungunya case was detected in Puerto Rico in early May 2014, and 10,201 suspected cases (282 per 100,000 residents) had been reported by August 12. Fever and arthralgia were reported in most chikungunya patients, of whom 13% were hospitalized and four died. A series of household investigations found that, of 250 participants, 70 persons (28%) tested positive for current or recent chikungunya virus infection, including 59 who reported illness within the preceding 3 months. Among 25 participants with chikungunya that sought medical care, only two (8%) had been reported to health authorities. The identification of chikungunya patients through household investigations suggests that the actual incidence of chikungunya is higher than demonstrated by passive surveillance data.
What are the implications for public health practice?
Improved vigilance and reporting of suspected chikungunya cases by health care providers can help health authorities estimate the health burden of chikungunya in Puerto Rico and help mobilize the resources needed to respond to the epidemic and direct them to affected areas. The chikungunya epidemic is expected to continue until a critical threshold of the population is no longer susceptible to infection, until which time early and accurate identification of dengue patients will remain a challenge.

Morbidity and Mortality Weekly Report
MMWR / December 5, 2014 / Vol. 63 / No. 48 1127
symptoms have been shown to clearly differentiate patients with chikungunya from those with dengue, the introduction of chikungunya to the Americas heightens the clinical chal-lenge of ensuring optimal management of dengue patients†† (i.e., hospitalization of patients with warning signs of severe dengue [e.g., persistent vomiting, severe abdominal pain] or other severe manifestations, and providing outpatients with appropriate anticipatory guidance). Because persons with suspected chikungunya might have dengue, nonsteroidal anti-inflammatory drugs (e.g., aspirin and ibuprofen) should be avoided and fever and pain should be managed with acet-aminophen until there is a clear diagnosis and the patient is free of warning signs.
Although severe disease manifestations were uncommon among CHIKV-infected persons in Puerto Rico, clinicians should be aware of severe manifestations that have been pre-viously associated with CHIKV infection (e.g., encephalitis and vesiculobullous skin lesions). Future investigations should describe the incidence and clinical course of patients in the Americas with severe manifestations of CHIKV infection, and verify previously identified risk factors for developing them (e.g., hypertension, underlying respiratory or cardiac conditions, and age ≥40 years) (15). Similarly, additional investigation is needed to determine the relative contribution of CHIKV infection and underlying medical conditions in the four fatal cases thus far reported. Finally, because CHIKV infection has been associated with persistent joint pain for months after the initial illness (14), additional investigation in the Americas is needed to quantitate disability caused by chikungunya-associated persistent joint pain.
The findings in this report are subject to at least two limita-tions. First, because of the large volume of cases reported to PRDH, not all specimens were tested. Instead, priority was assigned to specimens from hospitalized patients and munici-palities that had not yet identified a laboratory-positive case. Thus, age- and municipality-specific incidence of chikungunya could not be accurately calculated. Second, household inves-tigations were conducted during the daytime on weekdays, when children and working-age adults might not be available. Older persons might spend more hours at home during the day, when Ae. aegypti mosquitoes are most active, and might also have preexisting arthritis or other health conditions that might be exacerbated following CHIKV infection. Consequently, the rates of CHIKV infection and the associated symptoms identified through household investigations might not be representative of the population.
Because of the high volume of reported chikungunya cases, a network of sentinel chikungunya surveillance sites was estab-lished across Puerto Rico to better monitor the progression and trends of the chikungunya epidemic and the concurrent incidence of dengue. Clinical education seminars have been conducted throughout Puerto Rico to improve provider aware-ness of chikungunya, including the need to manage patients with suspected chikungunya the same way that dengue patients are managed. Messages to the public have emphasized the need to dispose of or empty water containers that can serve as mosquito breeding sites (e.g., refuse, discarded tires, and flower pots), and recommended seeking care early for acute febrile illness and managing fever and pain with acetaminophen. The chikungunya epidemic is expected to continue until a critical proportion of the population is no longer susceptible to infection. Forecasting the duration of the epidemic might be achieved through serologic surveys to monitor increases in population immunity.
Residents of and travelers to areas of the tropics with ongoing CHIKV and DENV transmission should employ mosquito avoidance strategies to prevent illness. Such strategies should include use of mosquito repellent, wearing long sleeves and pants, and staying in residences with air conditioning and screens on doors and windows. Additional information on chikungunya, including up-to-date case counts and affected areas, is available at www.cdc.gov/chikungunya. 1Division of Vector-Borne Diseases, National Center for Emerging and Zoonotic
Infectious Diseases, CDC; 2Office of Epidemiology, Puerto Rico Department of Health; 3Division of Environmental Hazards and Health Effects, National Center for Environmental Health, CDC; 4Epidemic Intelligence Service, CDC; 5Influenza Division, National Center for Immunization and Respiratory Diseases, CDC; 6Division of Global Health Protection, Center for Global Health, CDC (Corresponding author: Tyler M. Sharp, [email protected], 787-706-2399)
References 1. Fischer M, Staples JE. Notes from the field: chikungunya virus spreads
in the Americas—Caribbean and South America, 2013–2014. MMWR Morb Mortal Wkly Rep 2014;63:500–1.
2. CDC and Pan American Health Organization. Preparedness and response for chikungunya virus introduction in the Americas. Washington, DC: Pan American Health Organization; 2011. Available at http://www.paho.org/hq/index.php?option=com_topics&view=readall&cid=5511&itemid=40931&lang=en.
3. Sharp TM, Hunsperger E, Santiago GA, et al. Virus-specific differences in rates of disease during the 2010 dengue epidemic in Puerto Rico. PLoS Negl Trop Dis 2013;7:e2159.
4 Bhatt S, Gething PW, Brady OJ, et al. The global distribution and burden of dengue. Nature 2013;496:504–7.
5. World Health Organization. Dengue: guidelines for diagnosis, treatment, prevention and control: new edition. Geneva, Switzerland: World Health Organization; 2009. Available at http://www.who.int/rpc/guidelines/ 9789241547871/en.
6. Lanciotti RS, Kosoy OL, Laven JJ, et al. Chikungunya virus in US travelers returning from India, 2006. Emerg Infect Dis 2007;13:764–7.
†† Dengue clinical case management online training course available at http://www.cdc.gov/dengue/training/cme.html.

Morbidity and Mortality Weekly Report
1128 MMWR / December 5, 2014 / Vol. 63 / No. 48
7. Martin DA, Muth DA, Brown T, et al. Standardization of immunoglobulin M capture enzyme-linked immunosorbent assays for routine diagnosis of arboviral infections. J Clin Microbiol 2000;38:1823–6.
8. Santiago GA, Vergne E, Quiles Y, et al. Analytical and clinical performance of the CDC real time RT-PCR assay for detection and typing of dengue virus. PLoS Negl Trop Dis 2013;7:e2311.
9. Mammen MP, Pimgate C, Koenraadt CJ, et al. Spatial and temporal clustering of dengue virus transmission in Thai villages. PLoS Med 2008;5:e205.
10. Liebman KA, Stoddard ST, Morrison AC, et al. Spatial dimensions of dengue virus transmission across interepidemic and epidemic periods in Iquitos, Peru (1999-2003). PLoS Negl Trop Dis 2012;6:e1472.
11. Stoddard ST, Forshey BM, Morrison AC, et al. House-to-house human movement drives dengue virus transmission. Proceedings of the National Academy of Sciences of the United States of America; 2012.
12. Lam PK, Tam DT, Diet TV, et al. Clinical characteristics of dengue shock syndrome in Vietnamese children: a 10-year prospective study in a single hospital. Clin Infect Dis 2013;57:1577–86.
13. Lumsden WH. An epidemic of virus disease in Southern Province, Tanganyika Territory, in 1952–53. II. General description and epidemiology. Trans R Soc Trop Med Hyg 1955;49:33–57.
14. Schilte C, Staikowsky F, Couderc T, et al. Chikungunya virus–associated long-term arthralgia: a 36-month prospective longitudinal study. PLoS Negl Trop Dis 2013;7:e2137.
15. Economopoulou A, Dominguez M, Helynck B, et al. Atypical Chikungunya virus infections: clinical manifestations, mortality and risk factors for severe disease during the 2005–2006 outbreak on Reunion. Epidemiol Infect 2009;137:534–41.
16. Moro ML, Gagliotti C, Silvi G, et al. Chikungunya virus in North-Eastern Italy: a seroprevalence survey. Am J Trop Med Hyg 2010;82:508–11.
17. Queyriaux B, Simon F, Grandadam M, et al. Clinical burden of chikungunya virus infection. Lancet Infect Dis 2008;8:2–3.
18. Mohd Zim MA, Sam IC, Omar SF, et al. Chikungunya infection in Malaysia: comparison with dengue infection in adults and predictors of persistent arthralgia. J Clin Virol 2013;56:141–5.
19. Laoprasopwattana K, Kaewjungwad L, Jarumanokul R, et al. Differential diagnosis of Chikungunya, dengue viral infection and other acute febrile illnesses in children. Pediatr Infect Dis J 2012;31:459–63.

Morbidity and Mortality Weekly Report
MMWR / December 5, 2014 / Vol. 63 / No. 48 1129
On June 13, 2014, the California Department of Public Health (CDPH) declared that a pertussis epidemic was occur-ring in the state when reported incidence was more than five times greater than baseline levels. The incidence of pertussis in the United States is cyclical, with peaks every 3–5 years, as the number of susceptible persons in the population increases. The last pertussis epidemic in California occurred in 2010, when approximately 9,000 cases were reported, including 808 hospitalizations and 10 infant deaths, for a statewide incidence of 24.6 cases per 100,000 population (1). During January 1–November 26, 2014, a total of 9,935 cases of per-tussis with onset in 2014 were reported to CDPH, for a state-wide incidence of 26.0 cases per 100,000. CDPH is working closely with local health departments to prioritize public health activities, with the primary goal of preventing severe cases of pertussis, which typically occurs in infants. All prenatal care providers are being encouraged to provide tetanus, diphtheria, and acellular pertussis vaccine (Tdap) to pregnant women during each pregnancy, ideally at 27–36 weeks’ gestation, as is recommended by the Advisory Committee on Immunization Practices (ACIP) (4), or refer patients to an alternative pro-vider, such as a pharmacy or local public health department, to receive Tdap.
For this analysis, case report forms with preliminary data on demographics, symptoms, clinical course, and exposures were completed by local and state health department investigators through patient interviews and medical record reviews and were available for 8,562 (86%) cases. All cases met either the Council of State and Territorial Epidemiologists definition for confirmed pertussis, its definition for probable pertussis,* or the CDPH definition for suspected pertussis (2).
Disease incidence in California among infants aged <12 months was 174.6 cases per 100,000 during January 1–November 26, 2014, and was significantly higher among Hispanic infants (rate ratio = 1.7; 95% confidence interval [CI] = 1.5–2.1) and lower among Asian/Pacific Islander infants (rate ratio = 0.4; CI = 0.3–0.6) than among white, non-Hispanic infants (Table 1). Of 6,790 cases with available data, 347 patients had been hospitalized, including 275 (79%) who were aged <12 months, of whom 214 (62% of those hospitalized) were aged <4 months. Among hospital-ized infants aged <12 months with complete information, 33% required intensive care; few (24%) had received any
doses of diphtheria, tetanus, and acellular pertussis vaccine (DTaP) (Table 2). One death was reported in an infant aged 5 weeks at the time of illness onset. Two additional fatal cases in infants who became ill in 2013 were also reported in early 2014; both were aged <5 weeks at the time of illness onset, and one was hospitalized for more than a year before succumbing to pertussis-related complications.
Of 211 (50%) infants aged <4 months whose mothers’ Tdap immunization histories were available, only 35 (17%) had mothers who reported receiving Tdap at 27–36 weeks’ gesta-tion during their most recent pregnancy. Among mothers not vaccinated during pregnancy, 56 (36%) received Tdap within 7 days after delivery.
Disease incidence was also high among older children and adolescents, peaking at 137.8 cases per 100,000 among adolescents aged 15 years (Figure). Among the 2,006 cases in adolescents aged 14–16 years, five patients (0.2%) were hospi-talized; four were admitted for ≤2 days, and one was admitted for 5 days. Among the 83% of adolescent cases aged 14–16 years with known vaccination histories, only 2.2% reported never receiving any doses of pertussis-containing vaccine. Of those vaccinated adolescents with complete data, 87% had previously received the Tdap booster vaccine, and the median length of time since prior Tdap dose was 3 years (range = 0–7 years). Of the 1,321 (66%) adolescents aged 14–16 years with known race and ethnicity, rates were highest among non-Hispanic white (166.2 cases per 100,000) adolescents and lower among Hispanic (64.2 per 100,000), Asian/Pacific Islander (43.9 per 100,000) and non-Hispanic black (23.7 per 100,000) adolescents.
Discussion
Because infants aged <12 months have the greatest risk for hospitalization and death from pertussis, public health
* Available at http://wwwn.cdc.gov/nndss/script/casedef.aspx?condyrid=950&datepub=1/1/2014%2012:00:00%20am.
TABLE 1. Number and rate of pertussis cases among infants aged <12 months, by race/ethnicity — California, 2014*
Race/Ethnicity No.Rate per 100,000 RR (95% CI)
White, non-Hispanic 169 120.7 Referent —Hispanic, all races 551 207.0 1.7 (1.5–2.1)Black, non-Hispanic 30 110.0 0.9 (0.6–1.4)Asian/Pacific Islander, non-Hispanic 31 48.5 0.4 (0.3–0.6)Other/Unknown 132
Abbreviations: RR = rate ratio; CI = confidence interval.* N = 913. Rates based on population estimates obtained from the California
Department of Finance.
Pertussis Epidemic — California, 2014Kathleen Winter, MPH1, Carol Glaser, MD, DVM1, James Watt, MD2, Kathleen Harriman, PhD1 (Author affiliations at end of text)

Morbidity and Mortality Weekly Report
1130 MMWR / December 5, 2014 / Vol. 63 / No. 48
strategies have been prioritized towards preventing disease in this age group. During the 2010 pertussis epidemic in California, the main strategy used to protect infants was “cocooning” (i.e., vaccinating contacts of infants so they do not transmit pertussis to the infant). However, this strategy is difficult to implement, and even if all anticipated contacts could be immunized, infants could still be exposed to infected persons in the community.
In 2011, data became available demonstrating efficient trans-placental transfer of antipertussis antibodies to the fetus, which might protect vulnerable infants until they are old enough to receive the primary DTaP series beginning at aged 2 months. In that year, ACIP recommended that pregnant women who had never received Tdap receive a dose after 20 weeks’ gestation (3). In 2012, ACIP reviewed data indicating that antipertus-sis antibody concentrations declined substantially 1 year after vaccination; therefore, ACIP recommended that Tdap be administered during the third trimester of every pregnancy. Since the immune response to Tdap peaks about 2 weeks
TABLE 2. Number and percentage of infants aged <12 months hospitalized with pertussis, by selected characteristics — California, 2014*
Characteristic No. (%)
Age group<2 mos 135 (49)2 mos to <4 mos 79 (29)4 mos to <6 mos 33 (12)6 mos to <12 mos 28 (10)
Vaccination history†
DTaP >7 days before onset 53 (24)No DTaP or <7 days before onset 169 (76)
Hospital courseMedian length of stay (days)§ 3 (1–50)Admitted to intensive care unit¶ 71 (33)Intubated** 18 (8)Died 1 (1)
Abbreviation: DTaP = diphtheria, tetanus, and acellular pertussis vaccine. * N = 275. † Out of 222 with known vaccination status. § Out of 225 with complete data. ¶ Out of 216 with complete data. ** Out of 237 with complete data.
FIGURE. Incidence of pediatric pertussis, by age — California, 2014*
* Reported to the California Department of Public Health as of November 26, 2014.
0
20
40
60
80
100
120
140
160
<1 1 2 3 4 5 6 7 8 9 10 11 12 13 14 15 16 17
No.
of c
ases
per
100
,000
pop
ulat
ion
Age (yrs)
180
200

Morbidity and Mortality Weekly Report
MMWR / December 5, 2014 / Vol. 63 / No. 48 1131
after administration and the majority of maternal antibodies are acquired by the fetus at 36–40 weeks’ gestation, Tdap is currently recommended at 27–36 weeks gestation to optimize antibody transfer and protection at birth (4,5). Preliminary data indicate that infants born to vaccinated mothers have a lower risk for pertussis early in life (6).
Very few mothers of infants with pertussis had received Tdap during pregnancy; many more were vaccinated after delivery, which does not confer any direct protection to the infant and is no longer a preferred strategy. Recently published data indicate that Tdap vaccination coverage among pregnant women was only 19.5% in 2012 across California Vaccine Safety Datalink sites (7). Similarly, in a survey conducted at 100 birthing hos-pitals in California during October 2013, only 25% of new mothers reported receiving Tdap during pregnancy, whereas an additional 44% received Tdap in the hospital after deliv-ery (CDPH, unpublished data, 2013). However, efforts to increase vaccine coverage have been successful among Northern
California Kaiser patients, and in the third quarter of 2014, an estimated 84% of pregnant women received Tdap vaccine in their third trimester (T. Flanagan; Northern California Kaiser; personal communications; November 26, 2014).
Prenatal care providers should vaccinate all pregnant patients with Tdap during the third trimester of each pregnancy, ide-ally at 27–36 weeks’ gestation, as is recommended by ACIP (4). If Tdap cannot be administered on-site during routine prenatal care visits, CDPH encourages prenatal care providers to take the following steps: 1) provide the patient with a strong recommendation and patient-specific prescription for Tdap; 2) refer the patient to specific alternative sites for vaccine, such as pharmacies, primary care providers, or local health depart-ments; and 3) assess Tdap status at follow-up visits to confirm and record receipt of vaccine. In addition, timely initiation of the primary DTaP infant series is essential for reducing severe disease in young infants. According to the American Academy of Pediatrics, DTaP can be administered to infants at an acceler-ated schedule, with the first dose administered as early as age 6 weeks, when pertussis is prevalent in the community. Even 1 dose of DTaP might offer some protection against serious pertussis disease in infants (8).
Hispanic infants age <12 months have the highest and Asian/Pacific Islanders of all ages have the lowest rates of disease compared with other racial and ethnic groups. However, the Hispanic overrepresentation among infants disappeared by age 1 year, and disease incidence among older children and adolescents was highest among non-Hispanic whites, similar to trends reported previously in California (1). Nationally, since the 1990s, Hispanic infants have been noted to have higher rates of reported disease and pertussis-related deaths compared with non-Hispanic infants (8). The causes of these disparities are unknown, and data are needed to assess the contributing factors. Current hypotheses attribute the disparities to larger household size and/or cultural practices that increase the num-ber of persons in contact with young infants.
Notably, the peak age of disease incidence beyond infancy increased to age 14–16 years in 2014 compared with the peak among children aged 10 years during the 2010 pertussis epi-demic (1). Children and teenagers born in the United State since 1997 have only received acellular pertussis vaccine, and the upper age of this cohort correlates with the peak age in incidence during both epidemic years. Data available since the 2010 epidemic indicate that immunity conferred by acellular vaccines, particularly when used for the primary series, wanes more rapidly than that conferred by older, whole-cell vaccines that were used in the United States from the 1940s to the 1990s. Because of vaccine safety concerns related to whole-cell pertussis vaccines, acellular pertussis vaccines were developed
What is already known on this topic?
In the prevaccine and postvaccine eras, pertussis incidence has been cyclical and peaks every 3–5 years. Incidence of reported pertussis has been increasing in the United States since the 1980s despite widespread use of pertussis vaccines. Large outbreaks of pertussis occurred in California in 2010 and in other states during 2011–2012.
What is added by this report?
During January 1–November 26, a total of 9,935 cases of pertussis with onset in 2014 were reported in California, for an incidence of 26.0 cases per 100,000 population. The highest burden of disease is being observed in infants aged <12 months, especially Hispanic infants, and in non-Hispanic white teenagers aged 14–16 years, consistent with the upper age of the cohort of children who have only received acellular pertussis vaccines. Severe and fatal disease continues to occur almost exclusively in infants who are too young (age <2 months) to be vaccinated against pertussis. Few mothers of infants diagnosed with pertussis in California (17%) reported receiving tetanus, diphtheria, and acellular pertussis vaccine (Tdap) during the third trimester of pregnancy, as is recom-mended by the Advisory Committee on Immunization Practices.
What are the implications for public health practice?
Pertussis incidence is likely to continue to increase in the United States. Prevention efforts should be focused on preventing severe disease and death from pertussis in young infants. The preferred strategy is vaccination of pregnant women during the third trimester of each pregnancy to provide placental transfer of maternal antibodies to the infant. Prenatal care providers are encouraged to provide Tdap to pregnant women (considered best practice) or refer patients to obtain vaccine from an alternative provider, such as a pharmacy or local public health department. Efforts should be made to eliminate barriers to receiving vaccines from prenatal care providers.

Morbidity and Mortality Weekly Report
1132 MMWR / December 5, 2014 / Vol. 63 / No. 48
and recommended in 1992 for the 4th and 5th doses of the pertussis vaccine series and for all 5 doses in 1997. Acellular pertussis vaccines are less reactogenic than whole-cell vaccines, but the immunity conferred by them wanes more quickly. Most of the cases among adolescents aged 14–16 years were among those who had previously received Tdap ≥3 years earlier, sug-gesting that their illness was the result of waning immunity. It is likely that increased incidence will continue to be observed among this cohort in the absence of a new vaccine or more effective vaccination strategy. Although the highest burden of disease is currently being observed in adolescents aged 14–16 years, severe disease is uncommon at this age, and <0.5% of reported cases in this age group resulted in hospitalization. More data are needed to assess the potential benefit and timing of Tdap booster doses.
CDPH is working with local public health departments as well as prenatal and pediatric health care providers, with the primary goal of encouraging vaccination of pregnant women and infants. In addition, CDPH is providing free Tdap to local health departments and community health centers to support vaccination of uninsured and underinsured pregnant women and is working to identify and mitigate barriers to Tdap vac-cination for pregnant women. CDPH has been working closely with California local health departments to modify guidance for managing the high burden of disease in older children and teenagers, including school outbreaks of pertussis, by prioritiz-ing follow-up of patients and contacts who are at higher risk for developing severe disease (9).
As long as currently available acellular pertussis vaccines are in use, it is likely that the “new normal” will be higher disease incidence throughout pertussis cycles. The number of reported cases in 2014 has surpassed that of the 2010 epidemic and rep-resents the most cases reported in California in nearly 70 years (1). However, it is important to put the current pertussis epi-demic in historical perspective. In the immediate prevaccine era, there were approximately 157 reported cases of pertussis per 100,000 population in the United States, with 1.5 deaths per 1,000 infants (10). Therefore, despite the limitations of currently available pertussis vaccines, they continue to have an important impact on pertussis. Strategies to prevent the most severe cases of pertussis, which occur primarily in young infants, should be prioritized.
Acknowledgments
Sixty-one California local health jurisdictions. James Cherry, MD, David Geffen School of Medicine, University of California, Los Angeles. Stacey Martin, MSc, Division of Bacterial Diseases, National Center for Immunization and Respiratory Diseases, CDC.
1Immunization Branch, California Department of Public Health; 2Division of Communicable Disease Control, California Department of Public Health (Corresponding author: Kathleen Winter, [email protected], 510-620-3770)
References 1. Winter K, Harriman K, Zipprich J, et al. California pertussis epidemic,
2010. J Pediatr 2012;161:1091–6. 2. California Department of Public Health. Pertussis: CDPH case
definition. January 1, 2014. Available at http://www.cdph.ca.gov/healthinfo/discond/documents/cdph_pertussis%20case%20definition_1-2014.pdf.
3. CDC. Updated recommendations for use of tetanus toxoid, reduced diphtheria toxoid and acellular pertussis vaccine (Tdap) in pregnant women and persons who have or anticipate having close contact with an infant aged <12 months—Advisory Committee on Immunization Practices (ACIP), 2011. MMWR Morb Mortal Wkly Rep 2011;60:1424–6.
4. CDC. Updated recommendations for use of tetanus toxoid, reduced diphtheria toxoid, and acellular pertussis vaccine (Tdap) in pregnant women–Advisory Committee on Immunization Practices (ACIP), 2012. MMWR Morb Mortal Wkly Rep 2013;62:131–5.
5. Palmeira P, Quinello C, Silveira-Lessa AL, et al. IgG placental transfer in healthy and pathological pregnancies. Clin Dev Immunol 2011; October 1 [Epub ahead of print].
6. Dabrera G, Amirthalingam G, Andrews N, et al. A case-control study to estimate the effectiveness of maternal pertussis vaccination in protecting newborn infants in England and Wales, 2012–2013. Clin Infect Dis 2014; October 19 [Epub ahead of print].
7. Kharbanda EO, Vazquez-Benitez G, Lipkind H, et al. Receipt of pertussis vaccine during pregnancy across 7 Vaccine Safety Datalink Sites. Prev Med 2014; June 18 [Epub ahead of print].
8. Tanaka M, Vitek CR, Pascual FB, et al. Trends in pertussis among infants in the United States, 1980–1999. JAMA 2003;290:2968–75.
9. California Department of Public Health. CDPH pertussis quicksheet. Available at http://www.cdph.ca.gov/healthinfo/discond/documents/cdph_pertussis_quicksheet.pdf.
10. Cherry J, Brunnel P, Golden G. Report of the Task Force on Pertussis and Pertussis Immunization, 1988. Pediatrics 1988;81:933–84.

Morbidity and Mortality Weekly Report
MMWR / December 5, 2014 / Vol. 63 / No. 48 1133
Respiratory syncytial virus (RSV) causes lower respiratory infection among infants and young children worldwide (1). Annually in the United States, RSV infection has been associ-ated with an estimated 57,527 hospitalizations and 2.1 million outpatient visits among children aged <5 years (2). In tem-perate climate zones, RSV generally circulates during the fall, winter, and spring (3). However, the exact timing and dura-tion of RSV seasons vary by region and from year-to-year (4). Knowing the start of the RSV season in any given locality is important to health care providers and public health officials who use RSV seasonality data to guide diagnostic testing and the timing of RSV immunoprophylaxis for children at high risk for severe respiratory infection (5). To describe RSV seasonality (defined as onset, offset, peak, and duration) nationally, by U.S. Department of Health and Human Services (HHS) regions and for the state of Florida, CDC analyzes RSV laboratory detec-tions reported to the National Respiratory and Enteric Virus Surveillance System (NREVSS). Florida is reported separately because it has an earlier season onset and longer season duration than the rest of the country (3). For 2012–13, the RSV season onset ranged from late October to late December, and season offset ranged from late December to late April, excluding Florida. For 2013–14, the RSV season onset ranged from late October to late January, and season offset from late January to early April, excluding Florida. Weekly updates of RSV national, regional, and state RSV trends are available from NREVSS at http://www.cdc.gov/surveillance/nrevss.
NREVSS records U.S. laboratory-based specimen data on RSV and other viral pathogens. Participating laboratories voluntarily report the aggregated numbers of tests performed and positive results each week (Sunday through Saturday). Season onset, offset, peak, and duration* are reported for each HHS region,† the state of Florida, and nationally, with and without Florida. This allows geographic variation in RSV activity to be described and accommodates the unusually early season onset and longer season duration observed in Florida compared with the rest of the United States (3). During July 7, 2012–June 29, 2013, approximately 93% of laboratories iden-tified RSV by antigen detection methods (direct and indirect
immunofluorescence antigen diagnostic tests). For this reason, and for consistency in reporting, only results from antigen detection methods are included in the analysis.
2012–13 SeasonDuring July 7, 2012–June 2013, a total of 504 laboratories
reported the results of at least 1 week of RSV testing by any testing method to NREVSS. For consistency, only results from antigen detection methods are included in the analysis. Antigen detection was used by 93% of participating labora-tories during the 2012–13 season. CDC limited this analysis to 178 (35%) laboratories in 41 states that met the following criteria for inclusion: 1) reported RSV antigen testing results for ≥30 weeks during the 12-month NREVSS season and 2) averaged ≥10 antigen tests per week during the 52 weeks of the NREVSS season.§ Qualifying laboratories reported a total of 292,285 tests, of which 16% were positive for RSV. Nationally, RSV onset occurred the week ending October 27, 2012, and lasted 23 weeks until the week ending March 30, 2013 (Table). The proportion of specimens positive for RSV by antigen detection reached a season high of 25% during the week ending January 5, 2013. With Florida data excluded, the national onset occurred 2 weeks later (November 10, 2012), and the season duration decreased by 2 weeks compared with the national onset calculated with Florida data included. Onset for the 10 HHS regions (excluding Florida) ranged from late October to late December, and offset ranged from late December to late April (Figure). The season peak ranged
* In NREVSS, the onset week in an area (national, region, or state) is defined as the first of 2 consecutive weeks when the weekly percentage of all specimens testing positive for RSV antigen in all reporting laboratories in the area is ≥10%. The offset is the end of the last 2 consecutive weeks when the weekly percentage positive exceeds 10%. The peak is the week when the percentage of positive RSV antigen tests is the highest. The season duration is comprised of the onset week, the offset week, and the weeks between.
† Listed by region number and headquarters city. Region 1 (Boston): Connecticut, Maine, Massachusetts, New Hampshire, Rhode Island, and Vermont; Region 2 (New York): New Jersey and New York; Region 3 (Philadelphia): Delaware, District of Columbia, Maryland, Pennsylvania, Virginia, and West Virginia; Region 4 (Atlanta): Alabama, Florida, Georgia, Kentucky, Mississippi, North Carolina, South Carolina, and Tennessee; Region 5 (Chicago): Illinois, Indiana, Michigan, Minnesota, Ohio, and Wisconsin; Region 6 (Dallas): Arkansas, Louisiana, New Mexico, Oklahoma, and Texas; Region 7 (Kansas City): Iowa, Kansas, Missouri, and Nebraska; Region 8 (Denver): Colorado, Montana, North Dakota, South Dakota, Utah, and Wyoming; Region 9 (San Francisco): Arizona, California, Hawaii, and Nevada; Region 10 (Seattle): Alaska, Idaho, Oregon, and Washington. The District of Columbia, Idaho, Maine, Montana, Nevada, New Mexico, Oklahoma, Rhode Island, Vermont, and Wyoming did not have laboratories meeting the inclusion criteria for the 2012–13 season analysis. The District of Columbia, Alaska, Arizona, Delaware, Idaho, Illinois, Iowa, Kentucky, Maine, Montana, Nebraska, New Hampshire, New Mexico, Oklahoma, Rhode Island, Utah, Vermont, Wisconsin, and Wyoming did not have laboratories meeting the inclusion criteria for the 2013–14 season analysis.
§ The 12 months included in a particular reporting season that runs from July through June.
Respiratory Syncytial Virus — United States, July 2012–June 2014Amber K. Haynes, MPH1, Mila M. Prill, MSPH1, Marika K. Iwane, PhD1, Susan I. Gerber, MD1 (Author affiliations at end of text)

Morbidity and Mortality Weekly Report
1134 MMWR / December 5, 2014 / Vol. 63 / No. 48
from early December to early March, and the duration ranged from 6–23 weeks, with a median of 19 weeks (Table). Region 1 (Boston) had the shortest season, and Region 9 (San Francisco) had the longest. The season onset for Florida occurred the week ending July 21, 2012, and the season continued through the week ending January 26, 2013 (Table).
2013–14 SeasonDuring July 6, 2013–June 28, 2014, a total of 408 (84%)
laboratories identified RSV by antigen detection methods. The 2013–14 RSV season analysis is limited to 84 (21%) laboratories that met the inclusion criteria described previ-ously. A total of 141,021 RSV antigen tests and 19,614 (12%) positive results were reported by eligible laboratories located in 33 states. Nationally, RSV onset occurred the week end-ing November 9, 2013, and lasted 21 weeks until the week ending March 29, 2014 (Table). The season peak occurred the week ending December 28, 2013. Excluding Florida, the national onset occurred 1 week later (November 16, 2013), and the season duration decreased by 1 week compared with the national onset, including Florida. Excluding Florida, the onset for the 10 HHS regions ranged from late October to late January, and offset ranged from late January to late April (Figure). Region 1 (Boston) and Region 2 (New York) had the shortest season, and Region 6 (Dallas) had the longest season.
In Florida, the season onset occurred in the week ending July 6, 2013, and the season continued through the week ending January 25, 2014 (Table).
Discussion
The national and regional RSV onsets for the 2013–14 sea-son were similar to patterns previously reported (4). Florida’s season onset for the 2012–13 season occurred 3 weeks earlier than in the 2011–12 season and the 2013–14 season onset occurred 2 weeks before the 2012–13 season. Florida’s earlier onset has been well documented, as have differences in activity from year-to-year in the same geographic location (3). Social and demographic factors, population density, pollution, and climate each might influence national and regional RSV activ-ity (3,6–8). Furthermore, RSV activity might vary between areas in the same region and areas in close proximity.
NREVSS surveillance data can be used to identify RSV activ-ity and coordinate timing of immunoprophylaxis with palivi-zumab. Palivizumab is a monoclonal antibody recommended by the American Academy of Pediatrics to be administered to high-risk infants and young children likely to benefit from immunoprophylaxis based on gestational age, certain underly-ing medical conditions, and RSV seasonality (5).¶ NREVSS
TABLE. Summary of 2012–13 and 2013–14 respiratory syncytial virus seasons, by U.S. Departments of Health and Human Services (HHS) Region,* and in Florida — National Respiratory and Enteric Virus Surveillance System, June 2012–July 2014
HHS Region or state
2012–13 season† 2013–14 season§
No. of laboratories
reporting
Onset week
ending
Peak week
ending
Offset week
ending
Season duration
(wks)
No. of laboratories
reporting
Onset week
ending
Peak week
ending
Offset week
ending
Season duration
(wks)
National 174 10/27/2012 1/5/2013 3/30/2013 23 84 11/9/2013 12/28/2013 3/29/2014 21National without Florida 156 11/10/2012 1/5/2013 3/30/2013 21 77 11/16/2013 12/28/2013 3/29/2014 20Region 1 (Boston) 6 11/24/2012 12/15/2012 12/29/2012 6 4 12/7/2013 12/28/2013 2/15/2014 11Region 2 (New York) 15 11/3/2012 12/1/2012 3/2/2013 18 6 11/16/2013 12/14/2013 1/25/2014 11Region 3 (Philadelphia) 19 11/3/2012 12/22/2012 3/16/2013 20 6 11/16/2013 12/28/2013 2/1/2014 12Region 4 (Atlanta)¶ 24 11/10/2012 1/19/2013 3/2/2013 17 19 11/9/2013 12/28/2013 2/22/2014 16Region 5 (Chicago) 24 11/24/2012 2/2/2013 4/20/2013 22 11 11/23/2013 2/8/2014 4/12/2014 21Region 6 (Dallas) 24 10/27/2012 1/5/2013 3/23/2013 22 12 10/19/2013 1/4/2014 3/22/2014 23Region 7 (Kansas City) 11 11/17/2012 12/29/2012 3/30/2013 20 3 11/30/2013 2/22/2014 4/26/2014 22Region 8 (Denver) 7 12/29/2012 3/2/2013 4/20/2013 17 4 1/18/2014 2/15/2014 4/12/2014 13Region 9 (San Francisco) 18 10/27/2012 1/5/2013 3/30/2013 23 9 12/21/2013 2/22/2014 4/12/2014 17Region 10 (Seattle) 8 12/15/2012 2/9/2013 4/6/2013 17 3 12/28/2013 2/15/2014 4/12/2014 16Florida 18 7/21/2012 10/13/2012 1/26/2013 28 7 7/6/2013 11/16/2013 1/25/2014 30
* Listed by region number and headquarters city. Region 1 (Boston): Connecticut, Maine, Massachusetts, New Hampshire, Rhode Island, and Vermont; Region 2 (New York): New Jersey and New York; Region 3 (Philadelphia): Delaware, District of Columbia, Maryland, Pennsylvania, Virginia, and West Virginia; Region 4 (Atlanta): Alabama, Florida, Georgia, Kentucky, Mississippi, North Carolina, South Carolina, and Tennessee; Region 5 (Chicago): Illinois, Indiana, Michigan, Minnesota, Ohio, and Wisconsin; Region 6 (Dallas): Arkansas, Louisiana, New Mexico, Oklahoma, and Texas; Region 7 (Kansas City): Iowa, Kansas, Missouri, and Nebraska; Region 8 (Denver): Colorado, Montana, North Dakota, South Dakota, Utah, and Wyoming; Region 9 (San Francisco): Arizona, California, Hawaii, and Nevada; Region 10 (Seattle): Alaska, Idaho, Oregon, and Washington.
† District of Columbia, Idaho, Maine, Montana, Nevada, New Mexico, Oklahoma, Rhode Island, Vermont, and Wyoming did not have laboratories meeting the inclusion criteria for the 2012–13 season analysis.
§ District of Columbia, Alaska, Arizona, Delaware, Idaho, Illinois, Iowa, Kentucky, Maine, Montana, Nebraska, New Hampshire, New Mexico, Oklahoma, Rhode Island, Utah, Vermont, Wisconsin, and Wyoming did not have laboratories meeting the inclusion criteria for the 2013–14 season analysis.
¶ Excludes data from Florida.
¶ CDC does not make recommendations regarding the administration of RSV immunoprophylaxis.

Morbidity and Mortality Weekly Report
MMWR / December 5, 2014 / Vol. 63 / No. 48 1135
FIGURE. Respiratory syncytial virus season duration and peak, by U.S. Department of Health and Human Services Region,* and in Florida — National Respiratory and Enteric Virus Surveillance System, weeks ending July 7, 2012–June 29, 2013,† and weeks ending July 6, 2013–June 28, 2014§
* Listed by region number and headquarters city. Region 1 (Boston): Connecticut, Maine, Massachusetts, New Hampshire, Rhode Island, and Vermont; Region 2 (New York): New Jersey and New York; Region 3 (Philadelphia): Delaware, District of Columbia, Maryland, Pennsylvania, Virginia, and West Virginia; Region 4 (Atlanta): Alabama, Florida, Georgia, Kentucky, Mississippi, North Carolina, South Carolina, and Tennessee; Region 5 (Chicago): Illinois, Indiana, Michigan, Minnesota, Ohio, and Wisconsin; Region 6 (Dallas): Arkansas, Louisiana, New Mexico, Oklahoma, and Texas; Region 7 (Kansas City): Iowa, Kansas, Missouri, and Nebraska; Region 8 (Denver): Colorado, Montana, North Dakota, South Dakota, Utah, and Wyoming; Region 9 (San Francisco): Arizona, California, Hawaii, and Nevada; Region 10 (Seattle): Alaska, Idaho, Oregon, and Washington.
† District of Columbia, Idaho, Maine, Montana, Nevada, New Mexico, Oklahoma, Rhode Island, Vermont, and Wyoming did not have laboratories meeting the inclusion criteria for the 2012–13 season analysis.
§ District of Columbia, Alaska, Arizona, Delaware, Idaho, Illinois, Iowa, Kentucky, Maine, Montana, Nebraska, New Hampshire, New Mexico, Oklahoma, Rhode Island, Utah, Vermont, Wisconsin, and Wyoming did not have laboratories meeting the inclusion criteria for the 2013–14 season analysis.
¶ Excludes data from Florida.
27 29 31 33 35 37 39 41 43 45 47 49 51 01 03 05 07 09 11 13 15 17 19 21 23 25Jul Aug Sept Oct Nov Dec Jan Feb Mar Apr May Jun
Month and MMWR week
2012–13 season
National excluding Florida
National
Florida
Region 6 (Dallas)
Region 4 (Atlanta)¶
Region 2 (New York)
Region 3 (Philadelphia)
Region 5 (Chicago)
Region 7 (Kansas City)
Region 1 (Boston)
Region 9 (San Francisco)
Region 10 (Seattle)
Region 8 (Denver)
27 29 31 33 35 37 39 41 43 45 47 49 51 01 03 05 07 09 11 13 15 17 19 21 23 25Jul Aug Sept Oct Nov Dec Jan Feb Mar Apr May Jun
Month and MMWR week
2013–14 season
National excluding Florida
National
Florida
Region 6 (Dallas)
Region 4 (Atlanta)¶
Region 2 (New York)
Region 3 (Philadelphia)
Region 5 (Chicago)
Region 7 (Kansas City)
Region 1 (Boston)
Region 9 (San Francisco)
Region 10 (Seattle)Region 8 (Denver)

Morbidity and Mortality Weekly Report
1136 MMWR / December 5, 2014 / Vol. 63 / No. 48
provides timely data on RSV trends at the national, regional, and state levels, which have correlated with RSV-associated hospitalizations in select regions (9). Consequently, physicians and public health professionals use NREVSS data to guide diagnostic testing to assess possible causes of regional outbreaks of respiratory infection. In a study using NREVSS data, a 5-year median onset and offset were calculated for individual laboratories and showed local RSV transmission did not always reflect regional trends (7). Surveillance data collected by state and local health departments as well as some children’s hospitals might more accurately describe RSV trends at a local level.
The findings in this report are subject to at least four limi-tations. First, reporting to NREVSS is voluntary and might be biased to over-represent more active reporters. Second, the percentage of laboratory tests that are positive each week reflects not only disease burden (i.e., number of cases per capita or severity of seasonal outbreaks) but also the volume of tests ordered. Third, NREVSS data cannot adequately quantify RSV activity in select locales because participation varies at the state and sub-state levels. Finally, periods of low RSV activity might not be captured by the NREVSS onset and offset definitions. Despite these limitations, NREVSS provides useful guidance to clinicians ordering diagnostic tests and planning to initiate immunoprophylaxis.
Weekly updates of national, regional, and state RSV trends are available from NREVSS at http://www.cdc.gov/surveil-lance/nrevss. Laboratories that wish to report data to NREVSS may register at https://wwwn.cdc.gov/nrevss/register/lab.aspx or contact [email protected] for more information. Additional information regarding Florida RSV trends is available from the Florida Department of Health at http://www.doh.state.fl.us/disease_ctrl/epi/rsv/rsv.htm. 1Division of Viral Diseases, National Center for Immunization and Respiratory
Diseases, CDC (Corresponding author: Amber K. Haynes, [email protected], 404-639-6050)
Acknowledgment
National Respiratory and Enteric Virus Surveillance System laboratories.
References1. Nair H, Nokes DJ, Gessner BD, et al. Global burden of acute lower
respiratory infections due to respiratory syncytial virus in young children: a systematic review and meta-analysis. Lancet 2010;375:1545–55.
2. Hall CB, Weinberg GA, Iwane MK, et al. The burden of respiratory syncytial virus infection in young children. N Engl J Med 2009;360:588–98.
3. Mullins JA, Lamonte AC, Bresee JS, Anderson LJ. Substantial variability in community respiratory syncytial virus season timing. Pediatr Infect Dis J 2003;22:857–62.
4. CDC. Respiratory syncytial virus activity—United States, July 2011–January 2013. MMWR Morb Mortal Wkly Rep 2013;62:141–4.
5. American Academy of Pediatrics, Committee on Infectious Diseases and Bronchiolitis Guidelines Committee. Updated guidance for palivizumab prophylaxis among infants and young children at increased risk of hospitalization for respiratory syncytial virus infection. Pediatrics 2014;134:415–20.
6. Sloan C, Moore ML, Hartert T. Impact of pollution, climate, and sociodemographic factors on spatiotemporal dynamics of seasonal respiratory viruses. Clin Transl Sci 2011;4:48–54.
7. Panozzo CA, Fowlkes AL, Anderson LJ. Variation in timing of respiratory syncytial virus outbreaks: lessons from national surveillance. Ped Infect Dis J 2007;26(11 Suppl):S41–5.
8. Zachariah P, Shah S, Gao D, Simoes EA. Predictors of the duration of the respiratory syncytial virus season. Ped Infect Dis J 2009;28:772–6.
9. Hampp C, Asal N, Lipowski E, et al. Validity of laboratory-based surveillance for detection of respiratory syncytial virus seasons. Am J Epidemiol 2013;177:841–51.
What is already known on this topic?
Respiratory syncytial virus (RSV) circulates in the United States from fall to spring, except in Florida, where circulation occurs from summer through spring. Knowing when the season has started and ended in any given locality is important for guiding diagnostic testing and the timing of prophylaxis for severe RSV infection. A network of laboratories report RSV testing results to the National Respiratory and Enteric Virus Surveillance System (NREVSS); annually, these data are summarized nationally and regionally.
What is added by this report?
During the 2012–13 season, RSV began circulating nationally in late October and ended in late March. Circulation peaked at 25% test positivity in early January. During the 2013–14 season, RSV began circulating nationally in early November and ended in late March. Circulation peaked at 24% in late December. These patterns in national RSV circulation were similar to those previously described. Onset and offset dates and season duration varied considerably among the regions and Florida.
What are the implications for public health practice?
Practitioners can use NREVSS data to determine which respira-tory viruses are circulating in the United States and use the information to make decisions about the management of their patients with acute respiratory illness. Weekly updates of RSV national, regional, and state RSV trends are available from NREVSS at http://www.cdc.gov/surveillance/nrevss.

Morbidity and Mortality Weekly Report
MMWR / December 5, 2014 / Vol. 63 / No. 48 1137
Transmission of Chikungunya Virus in the Continental United States — Florida, 2014
Katherine Kendrick, MPH1, Danielle Stanek, DVM1, Carina Blackmore, DVM, PhD1 (Author affiliations at end of text)
On June 27, 2014, the Florida Department of Health in Miami-Dade County was notified by the Florida Poison Information Center Network of a patient with travel to Southeast Asia who was suspected of having chikungunya virus infection. After further investigation and additional testing, it was determined that the patient had not recently traveled to an endemic area, and this case was confirmed as the first locally acquired chikungunya case in the continental United States. Since the first case of locally acquired chikungunya virus infec-tion in the Americas was reported on the Caribbean island of St. Martin in December 2013, the United States has seen an increase in chikungunya cases among travelers returning from areas where chikungunya has become endemic, particularly the Caribbean and South America (1). Compared with other states, Florida has seen an especially large number of chikungunya fever cases. During January 1–October 14, 2014, a total of 272 imported cases were reported in Florida, compared with 1,110 reported in the other 47 contiguous states. In addition, 11 locally acquired chikungunya cases have been identified. The recent spread of the virus and the presence of competent mosquito vectors provide the conditions for transmission of chikungunya virus in Florida (2,3).
Beginning with the first report on June 27, a total of 11 autochthonous chikungunya disease cases in Florida have been reported from four counties: two in Miami-Dade, four in Palm Beach, four in St. Lucie, and one in Broward. All four counties are in South Florida, and three of them (Miami-Dade, Palm Beach, and Broward counties) have reported 131 (48%) of the 272 imported cases in Florida. All 11 locally acquired cases were laboratory-confirmed, seven by polymerase chain reaction. Two of the patients in St. Lucie County live within 1,500 feet (457 meters) of each other, and the cases appear to be linked because of their proximity in space and time; the source is unknown. Of the persons with locally acquired cases, eight (73%) of 11 were female, eight (80%) of 10 were white, and nine (90%) of 10 were non-Hispanic. Median age of the patients was 43 years (range = 29–78 years).
In comparison, of the 272 persons with imported cases, 155 (57%) of 272 were female, 113 (42%) of 267 were white, and 141 (53%) of 265 were non-Hispanic; median age was 48 years (range = 0–88 years). Among imported cases, the most com-mon country of exposure was Haiti (38%), followed by the Dominican Republic (30%); the most common reason for travel was to visit friends and relatives (72%).
Surveillance related to local introductions of chikungunya virus included 50–100 meter cluster investigations around a patient’s residence, enhanced syndromic surveillance, and medical record review. Awareness was increased through media coverage, reverse 911 dialing, and targeted mailings. For more than half of the cases, both locally acquired and imported, local mosquito control workers were notified and deployed to patients’ residences before or on the same day the counties received the positive laboratory test results.
Based on U.S. experiences with dengue virus, which shares the same vectors as chikungunya virus, awareness of the situ-ation in Florida can help inform surveillance activities and control efforts throughout the United States.
Because no vaccine exists to prevent chikungunya fever, the mainstay of prevention is avoiding bites of the mosquitoes that transmit the virus, mostly during daylight hours. The Florida Department of Health and CDC recommend using air conditioning or screens to keep mosquitoes outside, emptying standing water from containers such as flowerpots and buckets where mosquitoes might breed, wearing long-sleeved shirts and long pants, and using insect repellents (1). 1Florida Department of Health (Corresponding author: Carina Blackmore,
[email protected], 850-245-4732)
References1. CDC. Chikungunya virus. Atlanta, GA: US Department of Health and
Human Services, CDC; 2014. Available at http://www.cdc.gov/chikungunya.2. Pan American Health Organization. Preparedness and response for
chikungunya virus introduction in the Americas. Washington, DC: Pan American Health Organization, World Health Organization; 2011. Available at http://new.paho.org/hq/index.php?option=com_ docman&task=doc_download&gid=16984&itemid.
3. Fischer M, Staples JE. Notes from the field: chikungunya virus spreads in the Americas—Caribbean and South America, 2013–2014. MMWR Morb Mortal Wkly Rep 2014;63:500–1.
Notes from the Field

Morbidity and Mortality Weekly Report
1138 MMWR / December 5, 2014 / Vol. 63 / No. 48
Announcements
National Influenza Vaccination Week — December 7–13, 2014
The U.S. Department of Health and Human Services, CDC, state and local health departments, and other health agencies will observe National Influenza Vaccination Week December 7–13, 2014, with educational and promotional activities scheduled across the country. The observance was begun in 2005 to highlight the importance of annual influ-enza vaccination and to foster greater use of influenza vac-cine in the months of December, January, and beyond. As of November 14, 2014, approximately 139.7 million doses of 2014–15 seasonal influenza vaccine had been distributed to vaccination providers in the United States (1).
The Advisory Committee on Immunization Practices recom-mends influenza vaccination for all persons aged ≥6 months (2). Influenza vaccination is especially important for certain persons at higher risk for influenza-related complications. Persons in high-risk groups include children aged <5 years, especially those aged <2 years; persons with certain chronic health conditions, such as heart disease, asthma, and diabetes; pregnant women; and adults aged ≥65 years. In addition, health care personnel are at greater risk for acquiring influenza and can transmit it to their patients (3).
Educational materials, web tools, and CDC’s planned activi-ties for National Influenza Vaccination Week are available at http://www.cdc.gov/flu/nivw/index.htm, whereas general materials regarding influenza vaccination are available at http://www.cdc.gov/flu/freeresources. Additional information and resources for health care professionals are available at http://www.cdc.gov/flu/professionals. End of season vaccination cov-erage estimates for the 2013–14 influenza season are available at http://www.cdc.gov/flu/fluvaxview.
References1. CDC. Seasonal influenza vaccine and total doses distributed. Atlanta,
GA: US Department of Health and Human Services, CDC; 2014. Available at http://www.cdc.gov/flu/professionals/vaccination/vaccinesupply.htm.
2. Grohskopf LA, Olsen SJ, Sokolow LZ, et al. Prevention and control of seasonal influenza with vaccines: recommendations of the Advisory Committee on Immunization Practices (ACIP)—United States, 2014–15 influenza season. MMWR Morb Mortal Wkly Rep 2014;63:691–7.
3. CDC. Immunization of health-care personnel: recommendations of the Advisory Committee on Immunization Practices (ACIP). MMWR Recomm Rep 2011;60(No. RR-7).
Recommendation Regarding Obesity Prevention and Control — Community Preventive Services Task Force
The Community Preventive Services Task Force recently posted new information on its website: “Obesity Prevention and Control: Behavioral Interventions that Aim to Reduce Recreational Sedentary Screen Time Among Children.” The information is available at http://www.thecommunityguide.org/obesity/behavioral.html.
Established in 1996 by the U.S. Department of Health and Human Services, the task force is an independent, nonfederal, uncompensated panel of public health and prevention experts whose members are appointed by the Director of CDC. The task force provides information for a wide range of decision makers on programs, services, and policies aimed at improving population health. Although CDC provides administrative, research, and technical support for the task force, the recom-mendations developed are those of the task force and do not undergo review or approval by CDC.

Morbidity and Mortality Weekly Report
MMWR / December 5, 2014 / Vol. 63 / No. 48 1139
Errata
Vol. 63, No. 46In the report “Ebola Virus Disease Cluster in the United
States — Dallas County, Texas, 2014” two errors occurred.On page 1087, in the second paragraph, the first sen-
tence should read, “On September 25, a man aged 45 years (patient 1), who had arrived in the United States from Liberia 5 days earlier, went to a Dallas County, Texas, emergency department with fever, initially 100.1°F (37.8°C) but increased to 102.9°F (39.4°C), abdominal pain, and headache (Figure).”
In the fourth paragraph, the first sentence should read, “On October 10, a nurse (patient 2) previously involved in direct care of patient 1 had a sore throat; on October 11, patient 2 went to the emergency department with fever (100.6°F [38.1°C]) and was confirmed to have Ebola by real-time PCR later that day.”
Vol. 63, No. 44In the report, “Arthritis Among Veterans — United States,
2011–2013,” several errors occurred.On page 999, in the first paragraph, the fourth sentence
should read as follows: “This report summarizes the results of these analyses, which found that one in three veterans reported that they had arthritis (34.7%) and that that age-standardized prevalence was higher among veterans than nonveterans across most sociodemographic categories, including sex (age-standardized prevalence among male and female veterans was 25.0% and 31.3%, respectively).”
Also on page 999, in the fourth paragraph, the first sentence should read as follows: “Veterans had a higher overall crude prevalence of reported arthritis than nonveterans, 34.7% (CI = 34.3–35.1) versus 24.0 (CI = 23.8–24.1).”
On page 1000, in Table 1, the characteristics of race/eth-nicity, highest educational attainment, employment status, annual household income, and body mass index should have been footnoted using the existing * footnote (i.e., “*Age-standardized to 2000 U.S. projected population [age groups 18–44, 45–64, and ≥65 years]; includes only those for whom age was reported.”). Also in Table 1, the n’s in the right sided column headings under “Overall” should read as “Overall (n = 1,420,290),” Nonveterans (n = 1,277,596),” and “Veterans (n = 184,694).”
Also on page 1000, in the first paragraph, the first two sen-tences should read as follows: “Among the 50 states and DC, the median state-specific age-standardized arthritis prevalence among veterans was 25.4% (range = 18.8% in Hawaii to 32.7% in West Virginia) (Table 2, Figure). Among male veter-ans, the median age-standardized state-specific prevalence was 24.7% (range = 18.4% in Hawaii to 32.7% in West Virginia); among women the median was 30.3% (range = 22.4% in Hawaii to 42.7% in Oregon) (Table 2).”
Finally, in the summary box on page 1003, in the “What is added by this report?” section, the second sentence should read as follows: “The analysis found that 34.7% of veterans reported having arthritis (35.0% among men and 31.3% among women) and that prevalence was higher among veterans than nonveterans across most sociodemographic categories.”

Morbidity and Mortality Weekly Report
1140 MMWR / December 5, 2014 / Vol. 63 / No. 48
Abbreviation: GED = General Educational Development certificate.* Based on response to the question, “Do you have trouble seeing, even when wearing glasses or contact
lenses?Ӡ Estimates are based on household interviews of a sample of the noninstitutionalized U.S. civilian population
and are derived from the National Health Interview Survey sample adult component.§ 95% confidence interval.
The percentage of adults who reported having trouble seeing when wearing corrective lenses declined with education level for all age groups. Among adults aged 25–44 years in 2012–2013, 6.6% of those who did not graduate from high school reported trouble seeing, compared with 4.1% of those who had a bachelor’s degree or higher. Trouble seeing was about twice as likely for those who did not graduate from high school compared with those with a bachelor’s degree or higher among adults aged 45–64 years (17.8% versus 7.8%) and aged ≥65 years (19.4% versus 10.3%). The percentage of adults aged 45–64 years and ≥65 years who reported trouble seeing was higher than the percentage for adults aged 25–44 years at every level of education.
Source: National Health Interview Survey, 2012–2013. Available at http://www.cdc.gov/nchs/nhis.htm.
Reported by: Brandy Lipton, PhD, [email protected], 301-458-4318; Sandra Decker, PhD.
0
5
10
15
20
25
25–44 45–64 ≥65
Perc
enta
ge
Age group (yrs)
Less than a high school diplomaHigh school diploma or GEDSome collegeBachelor's degree or higher
§
QuickStats
FROM THE NATIONAL CENTER FOR HEALTH STATISTICS
Percentage of Adults Aged ≥25 Years with Trouble Seeing When Wearing Corrective Lenses,* by Education Level and Age Group — National Health
Interview Survey, United States, 2012–2013†


ISSN: 0149-2195
The Morbidity and Mortality Weekly Report (MMWR) Series is prepared by the Centers for Disease Control and Prevention (CDC) and is available free of charge in electronic format. To receive an electronic copy each week, visit MMWR’s free subscription page at http://www.cdc.gov/mmwr/mmwrsubscribe.html. Paper copy subscriptions are available through the Superintendent of Documents, U.S. Government Printing Office, Washington, DC 20402; telephone 202-512-1800.
Readers who have difficulty accessing this PDF file may access the HTML file at http://www.cdc.gov/mmwr/index2014.html. Address all inquiries about the MMWR Series, including material to be considered for publication, to Editor, MMWR Series, Mailstop E-90, CDC, 1600 Clifton Rd., N.E., Atlanta, GA 30329-4027 or to [email protected].
All material in the MMWR Series is in the public domain and may be used and reprinted without permission; citation as to source, however, is appreciated.
Use of trade names and commercial sources is for identification only and does not imply endorsement by the U.S. Department of Health and Human Services.
References to non-CDC sites on the Internet are provided as a service to MMWR readers and do not constitute or imply endorsement of these organizations or their programs by CDC or the U.S. Department of Health and Human Services. CDC is not responsible for the content of these sites. URL addresses listed in MMWR were current as of the date of publication.
Morbidity and Mortality Weekly Report