child care in america: 2016 state fact sheets
TRANSCRIPT

2016 State Fact SheetsChild Care in America:

Every week in the United States, child care providers care for nearly 11
million children younger than age 5 whose parents are working. On
average, these children spend 36 hours a week in child care, and one
quarter (nearly 3 million) are in multiple child care arrangements due to
the traditional and nontraditional working hours of their parents.1
Research has continually illustrated the importance of quality early
experiences in achieving good health, especially within the most
vulnerable populations. Families, child care providers and state and
federal policymakers share responsibility for the safety and wellbeing
of children while they are in child care settings. Basic state
requirements and oversight help lay the foundation necessary to
protect children and promote their healthy development while in child
care.
The Child Care and Development Block Grant (CCDBG) program
serves approximately 1.45 million children annually in communities
across the country. CCDBG is the primary federal grant program that
provides child care assistance for families and funds child care quality
initiatives. Funds are administered to states in formula block grants,
and states use the grants to subsidize child care for low-income
working families.
In November 2014, President Barack Obama signed S.1086, the Child
Care and Development Block Grant Act of 2014 into law. The new law
includes several measures focused on quality, including requiring
states to:
Promote quality child care by increasing activities to improve the care, enhancing states’ ability to train providers and develop safer and more effective child care services.
Strengthen health and safety requirements in child care programs and providers.
Improve access to child care by expanding eligibility for participating families and helping families connect with quality programs that meet their needs by enhancing consumer education, providing greater options for quality child care and working to ensure continuity of care, essential for both the well-being and stability of a child.2
With the new federal child care measures set to take effect, states are
rapidly building, evaluating, and changing their early care and
education quality focused systems (Quality Rating and Improvement
System (QRIS), professional development, licensing and standards).
Implementation of the new regulations must align with these efforts for
sustainability and maximum impact.
Over the past several years, Child Care Aware® of America has
surveyed and conducted focus groups with parents of young children,
grandparents, national child advocacy organizations, and state and
local Child Care Resource and Referral (CCR&R) agencies. Those
conversations underscored that child care is an essential building block
1 U.S. Census Bureau. (2013, April). Who’s minding the kids? Child care arrangements:
Spring 2011. Retrieved May 24, 2013 from http://www.census.gov/prod/2013pubs/p70-135.pdf
2 Child Care Aware® of America. (2014). S.1086 – The childcare and development block grant act of 2014. Retrieved from http://usa.childcareaware.org/wp-content/uploads/2015/05/s.1086_onepager.pdf
of any community and that investments in child care are investments in
our children, our economy, and our future. Child care plays an
important role in the economy, helping to generate 15 million jobs and
more than $500 billion in income annually.3 Families need child care so
that they can work, go to school, and/or receive workforce training, and
children need a safe place to be where they can learn and thrive.
The cost of child care in every state rivals families’ annual expenditures on
housing, transportation and the cost of tuition at a four-year, public
university. Further, in 38 states, the cost of infant care exceeds 10 percent
of the state’s median income for a two-parent family.4
Recent focus groups done by Child Care Aware® of America suggest that
parents are trading off the nice-to-haves, including coverage that fits their
schedules, against cost. Costs are high even for two parent families, and
some families are making the decision to have one parent leave their job
and stay home since the additional paycheck would just go directly to cover
child care.5
Annually, states spend more than $10 billion in government money for
child care. For the most part, public funding for child care comes from
the CCDBG, the Temporary Assistance for Needy Families (TANF)
program, the Social Services Block Grant (SSBG or Title XX) and state
funds. Even so, parents assume almost 60 percent of the cost of child
care, and the percentage is even higher for middle income families.
For several years now, Child Care Aware® of America has surveyed
CCR&Rs to gather current information about the average cost of child care
in child care centers and family child care homes for infants, 4-year-old
children and school-age children. Our 2015 Cost of Care report indicated
that the average annual cost of full-time care for an infant in center-based
care ranges from $4,822 in Mississippi to $17,062 in Massachusetts. For
an infant in a family child care home the cost ranges from $3,972 in
Mississippi to $10,666 in Massachusetts. For a 4-year-old, center-based
care ranges from $3,997 in Mississippi to $12,781 in Massachusetts. Care
in a family child care home for a 4-year-old ranges from $3,675 in
Mississippi to $10,030 in Alaska. 6
3 Committee for Economic Development (2015). Child Care in State Economics: 2015 Report.
Retrieved October 9, 2015 from https://www.ced.org/childcareimpact 4 Child Care Aware of America. (2015). Parents and the High Cost of Child Care: 2015 Report.
Retrieved May 19, 2016 from http://usa.childcareaware.org/wp-content/uploads/2016/05/Parents-and-the-High-Cost-of-Child-Care-2015-FINAL.pdf
5 Child Care Aware of America (2016). Parent Focus Group Report. 6 Child Care Aware of America. (2015). Parents and the High Cost of Child Care: 2015 Report.
Retrieved May 19, 2016 from http://usa.childcareaware.org/wp-content/uploads/2016/05/Parents-and-the-High-Cost-of-Child-Care-2015-FINAL.pdf

While many families are able to take advantage of child care subsidies
offered by state and federal organizations, there is not enough funding to
cover all need. In fact, Child Care Aware® of America estimates that child
care assistance funds reach fewer than 18 percent of eligible children.
Families who earn between $25,000 and $50,000 annually are among
those who stand to benefit most from increased and expanded subsidy
support for child care, as these families tend not to be eligible for subsidies,
and therefore rely on unlicensed, unsafe or unreliable care.
Parents also rely on federal tax credits—for both families and
employers—to help pay for child care. However, available tax credits
are piecemeal, vary significantly from state to state, and provide an
average benefit of only $550 per year – well short of average child care
costs. Further, benefits such as the Dependent Care Tax Credit
(DCTC) are not available for parents who attend school part-time,
which means that parents who both work and attempt to improve their
economic condition through furthering their education are unable to
receive additional support, thus fostering an unending cycle of poverty.
Early, quality child care provides a solid foundation for children’s academic
and behavioral success. For instance, research has demonstrated that
children and families who attend Early Head Start programs fare better
than their peers in several domains; however, Early Head Start is
underfunded and can only serve four percent of eligible children.7
Vulnerable populations, in particular, struggle to gain access to quality early
child care due to barriers such as lack of transportation options and
irregular work schedules. Many communities face shortages of licensed
quality child care; these areas are known as child care deserts. Low-
income and rural communities and neighborhoods are especially likely to
lack high-quality child care facilities. Rural communities have unique needs
and challenges far different from urban settings. For example, the majority
of Hispanics live in rural settings.8 The lack of licensed child care, long
travel distances to work sites, lack of public transportation and irregularity of
work schedules reduce child care options available for rural families as
well. Investments in child care expansion thus help to ensure that children
have access to safe learning environments and that parents are able to
contribute to the local economy.
Existing child care centers in underserved areas must work to address
these issues by expanding child care hours and working with state and
federal agencies to secure access for all families. Without these measures,
families may be forced to rely on unlicensed care providers that may not be
able to provide the emotional and academic support children need in order
to be school-ready by the time they enter Kindergarten.
Children in unlicensed care may not be protected by regulations
concerning physical activity time, developmental screening practices or
food safety guidelines. In fact, studies show that children of color,
English language learners and low income families benefit greatly from
quality child care, yet they are the least likely to gain access to high-
quality early care and education.9
7CLASP & NCCP (2013). Investing in Young Children: A Fact Sheet on Early Care and
Education Participation, Access, and Quality. Retrieved June 23, 2016 from http://eric.ed.gov/?id=ED547124
8 Emerging and Established Hispanic Communities: Implications of Changing Hispanic Demographics. National Research Center on Hispanic Children & Families. Retrieved June 23, 2016 from http://www.childtrends.org/?multimedia=emerging-and-established-hispanic-communities-implications-of-changing-hispanic-demographics-2
9 Barnett, S., Carolan, M., & Johns, D. (2013). Equity and Excellence: African-American Children’s Access to Quality Preschool. National Institute for Early Education Research. Retrieved June 23, 2016 from http://nieer.org/sites/nieer/files/Equity%20and%20Excellence%20African-American%20Children%E2%80%99s%20Access%20to%20Quality%20Preschool_0.pdf
While the new CCDBG reauthorization in 2014 calls for stronger
health, safety and quality measures, it remains to be seen how
implementation of these measures will unfold. Thus, child care
assistance is an important two generation strategy that helps parents
and their children simultaneously.
Though the exact definition of quality child care evolves with new
research, experts agree on some general characteristics that enrich
early childhood environments, including:
Low child/teacher ratios.
Small group size.
Professional development opportunities for workforce.
Positive provider/child interactions.
Accreditation or high licensing standards.
Age appropriate activities.
Family engagement.
Good health and safety practices.
Quality Rating Information Systems (QRIS) at the state and local level
are one way to track quality in child care settings. As of May 2016,
however, QRIS implementations across states vary widely in status,
from county- and locality-based systems in California to a pilot program
in Alabama to full state-wide implementation in states such as Texas
and Massachusetts. Many states, including Connecticut and Wyoming,
are still in planning stages without any kind of QRIS system
implementation.10
Investments in high-quality early education generate returns of over $8
for every $1 spent.11 The science is clear: there are long-term positive
outcomes for children who begin learning from birth, and for 15 million
children in America each week, the child care setting is an opportunity
to learn and set healthy habits for life. Decades of research emphasize
that quality child care has a lasting positive impact, particularly for
children from low-income homes.12 13 14
Approximately 2.2 million individuals earn a living caring for children
under age 5. The early care and education landscape remains fairly
complex, with programs offered in a variety of settings, designed to
accommodate varying traditions and cultures, funded through multiple
sources, and subjected to disparate regulations. In addition, more than
half of the states only require that licensed child care providers
possess a high school diploma.
Thirty-one states require a high school diploma or less for
child care center lead teachers.
10 QRIS National Learning Network. (June 2016). QRIS Map. Retrieved June 23, 2016 from
http://qrisnetwork.org/sites/all/files/maps/QRISMap.pdf 11 Executive Office of the President of the United States. The economics of early childhood
investments. (2015, January). Retrieved June 12, 2015 from https://www.whitehouse.gov/sites/default/files/docs/early_childhood_rep ort_update_final_non-embargo.pdf
12 Campbell, F. A., Pungello, E. P., Burchinal, M., Kainz, K., Pan, Y., Wasik, B. H., Sparling, J. & Ramey, C. T. (2012). Adult outcomes as a function of an early childhood educational program: an Abecedarian Project follow-up. Developmental Psychology, 48(4), 1033.
13 Schweinhart, L. J., Montie, J., Xiang, Z., Barnett, W. S., Belfield, C. R. & Nores, M. (2005). Lifetime Effects: The High/Scope Perry Preschool Study Through Age 40. Monographs of the High/Scope Educational Research Foundation. Retrieved June 23, 2016 from
http://www.highscope.org/file/Research/PerryProject/specialsummary_rev2011_02_2.pdf 14 Reynolds, A. J., Temple, J. A., Ou, S.-R., Robertson, D. L., Mersky, J. P., Topitzes, J. W., &
Niles, M. D. (2007). Effects of a school-based, early childhood intervention on adult health and well-being. Archives of Pediatrics & Adolescent Medicine, 161(8), 730–739. doi:10.1001/archpedi.161.8.730

Forty-one states require a high school diploma or less for
regulated family child care providers.15
Currently, there is national momentum to promote agreement on core
knowledge and competencies for child care educators. In 2015, the
Institute of Medicine (IOM) and the National Research Council (NRC)
published a major study16 about the child care and education
workforce. Given what scientists know about how the brain develops
and about how children learn, the authors then asked, is critical brain
science being applied in child care settings? Their answer was no, and
that 1) the care and education workforce is under-respected and
under-trained, and 2) an overhaul of our nation’s child care systems is
urgently needed.
The IOM study describes the current status of the country's child care
systems as “fragmented.” The use of the word systems (plural) is
intentional, as there is no single entity that governs and no single set of
standards that applies to all early childhood education. Within child
care itself, there are many systems with inconsistent standards for how
child care settings are staffed, licensed (if at all), and operated. These
include inconsistencies in educational and training requirements,
licensing standards, and funding support and related quality
requirements. If you add other early childhood education settings to the
equation, the inconsistencies among standards and systems grow
even larger.
Not surprisingly, it is difficult to recruit credentialed child care
professionals when compensation is so low. To be clear, despite the
labor-intensive costs of running a child care business, according to a
new report by the Economic Policy Institute,17 most child care workers
live in poverty. Like many service industries, approximately 80 percent
of the cost in a child care program is for payroll and payroll related
expenses. Despite tremendous responsibilities, the average income for
a full-time early child care worker in 2015 was just $10.72 an hour,
putting the wages of child care workers below those of 97 percent of all
occupations in the American economy.18
Almost 15% of child care workers live below the poverty line, and a
third have incomes that are below twice the poverty line. Early
childhood education teachers are half as likely as general employees
to be offered health insurance coverage, and only 24 percent of
employers in the field offer retirement plans.19 The gap becomes even
more pronounced when college degrees are taken into consideration, 15 Data are provided by the State CCR&R Network and are derived from CCR&R data or are
provided by state licensing offices. 16 Institute of Medicine and National Research Council. (2015). Transforming the Workforce for
Children Birth Through Age 8: A Unifying Foundation. Washington, DC: The National Academies Press. doi:10.17226/
17 Gould, E. (2015, 5 November). Child care workers aren’t paid enough to make ends meet. Economic Policy Institute. Retrieved June 23, 2016 from http://www.epi.org/publication/child-care-workers-arent-paid-enough-to-make-ends-meet/#can-child-care-workers-afford-child-care?
18 Whitebook, Phillips, and Howes “Worthy Work, STILL Unlivable Wages,” and “National Occupational and Employment Wage Statistics, May 2015,” Bureau of Labor Statistics. Retrieved June 23, 2016 from http://www.bls.gov/oes/current/oes252012.htm
19 Ibid: Richard Brandon, et al., “Number and Characteristics of Early Care and Education Workforce.” Daphna Bassok, Maria Fitzpatrick, Susanna Loeb, and Agustina Paglayan, “The Early Childhood Care and Education Workforce from 1990 through 2010.
with early childhood education workers earning only one-third of the
average income of other workers in the country. Further, while the
number of immigrant workers in the field of early childhood education
has tripled since 1990, these workers are significantly more likely to
live below the poverty line than their native counterparts.20
Not surprisingly, many child care workers are unable to afford child
care for their own families. According to Child Care Aware® of
America’s 2015 calculations, in every state, child care workers would
need to spend over 80 percent of their income in order to afford center-
based child care for two children. According to the US Department of
Health and Human Services’ standard of affordable care, there is no
state in which early childhood education employees’ average earnings
are high enough to meet the standard as compared to the average
cost of child care.21 Further, in six states plus D.C., over 100 percent of
the median child care worker's income is required to put two children in
center-based care.22 Furthermore, there is little to no support from the
government for families working in early childhood education, with
nearly half of all early childhood education employees living in families
eligible for programs such as TANF and SNAP.23 24
Major research studies have found correlation between higher wages
or higher teacher education levels with quality of child care,
emphasizing the importance of attracting and maintaining a talented
workforce. Consistent, stable relationships with adults are especially
impactful in childhood development, making increased investment in
compensation for the providers who work with children very important.
In addition, early childhood education workers who are paid higher
wages express lower levels of economic worry, allowing them to
provide more nurturing, warm and stress-free care for children.25
To date, sustained investments in child care providers—both through
compensation and training—have not been sufficient to ensure that all
providers, including those who receive federal reimbursement for their
services, meet even minimal quality standards. It’s important that
education is adequate to ensure optimal child outcomes, and that
compensation is appropriate for the level of education achieved.
Child care centers and homes in the United States must be prepared
to serve an ever changing and increasingly diverse group. The
expansive growth of this demographic highlights the need for settings
that consider the language and culture of the children being served.
Children of refugees and immigrants now account for 25 percent of the
23 million children under the age of 6, compared to 14 percent in 1990.
States like California, Texas, New York, Florida, and Illinois account for
half of the number of children in immigrant families. Research has
20 Park, M. et al. (2015). Immigrant and Refugee Workers in the Early Childhood Field: Taking
a Closer Look. Migration Policy Institute. Retrieved June 23, 2016 from http://www.migrationpolicy.org/research/immigrant-and refugee-workers-early- childhood-field-taking-closer-look
21 Gould, “Child Care Workers Aren’t Paid Enough to Make Ends Meet.” Retrieved June 23, 2016 from http://www.epi.org/publication/child-care-workers-arent-paid-enough-to-make-ends-meet/#epi-toc-2
22 Child Care Aware of America. (2015). Parents and the High Cost of Child Care: 2015 Report. Retrieved May 19, 2016 from http://usa.childcareaware.org/wp-content/uploads/2016/05/Parents-and-the-High-Cost-of-Child-Care-2015-FINAL.pdf
23 Parents and the High Cost of Child Care: 2015 Report (Arlington, Va.: Child Care Aware of America, 2015). Retrieved June 23, 2016 from http://usa.childcareaware.org/wp-content/uploads/2016/05/Parents-and-the-High-Cost-of-Child-Care-2015-FINAL.pdf
24 Maclay, Kathleen, “Childcare Workers’ Pay Remains Stagnant, Study Shows,” Berkeley News. Retrieved June 23, 2016 from http://news.berkeley.edu/2015/01/21/child-care-workers-pay-remains-stagnant-study-shows/
25 Gould, “Child Care Workers Aren’t Paid Enough to Make Ends Meet.” Retrieved June 23, 2016 from http://www.epi.org/publication/child-care-workers-arent-paid-enough-to-make-ends-meet/#epi-toc-2

shown that these young children, especially dual language learners,
benefit from quality child care. 26
Unfortunately, poor-quality care has negative impacts on development,
especially for low-income and minority children. Young children of
immigrants, African-American and Latino children are less likely to access
quality child care programs.2728According to a March 2014 U.S.
Department of Education report, boys and African American children are
disproportionately expelled or suspended from early care and education
programs. For preschool programs outside state prekindergarten systems,
the rates were far higher. Thirty-nine percent of child care providers
reported at least one expulsion in the past year, an expulsion rate more
than 13 times higher than in children in K-12 schools.29
Although the early childhood education workforce is currently relatively
diverse, it is far from matching the diversity of children in the US, and
maintaining and growing this diversity in the workforce is extremely
important. Children from minority groups benefit from working with
teachers and caregivers from similar linguistic, racial or ethnic
backgrounds.30 In addition, children benefit from exposure to educators
and caregivers from diverse backgrounds at an early age as they
develop early perceptions of social categories.31
To remain competitive in the 21st-century global economy, the United
States must recognize the value of child care as an investment in early
childhood education and as a support system for working families.
Child Care in America: 2016 State Fact Sheets provides
important data to better understand America’s working families and the
circumstances they face. As such, it is a critical tool for child care
advocates, policymakers and program administrators to guide
decision-making about child care programs and costs.
This annual report uses federal and national data and information from
state Child Care Resource and Referral (CCR&R) agencies and other
state agencies to report on the following data broken into three
separate reports per state:
Child care facts including:
o data on infants and toddlers and school age care
o family characteristics related to the need for child care
o the supply of child care
26 Park, M., McHugh, M., Zong, J., and Batalova, J. (2015). Immigrant and refugee workers in
the early childhood field: Taking a closer look. Washington, DC: Migration Policy Institute.
27 CLASP & NCCP (2013). Investing in Young Children: A Fact Sheet on Early Care and Education Participation, Access, and Quality. Retrieved June 23, 2016 from http://eric.ed.gov/?id=ED547124
28 Barnett, S., Carolan, M., & Johns, D. (2013). Equity and excellence: African-American children’s access to quality preschool. New Brunswick, NJ: National Institute for Early Education Research. Retrieved from http://nieer.org/sites/nieer/files/Equity%20and%20Excellence%20African-American%20Children%E2%80%99s%20Access%20to%20Quality%20Preschool_0.pdf
29 Gilliam, W. S. (2005). Prekindergarteners left behind: Expulsion rates in state Prekindergarten programs. Retrieved June 23, 2016 from http://challengingbehavior.fmhi.usf.edu/explore/policy_docs/prek_expulsion.pdf
30 Julie Kashen, Halley Potter and Andrew Stettner (2016) Quality Jobs, Quality Child Care: The case for a well-paid, diverse early education workforce. Retrieved from https://tcf.org/content/report/quality-jobs-quality-child-care/
31 Reid, Kagan, Hilton, and Potter, A Better Start (12 April 2015) Retrieved June 23, 2016 from https://tcf.org/content/report/a-better-start/.
o the cost of child care
o the child care workforce
The services provided by and role of CCR&Rs in each state.
Participation in state initiatives for:
o quality
o health and wellness
o family engagement
o emergency preparation
Early in 2016, Child Care Aware® of America surveyed State CCR&R
Networks and other CCR&Rs and asked questions about child care
capacity, requests for referrals, training and technical assistance
provided by CCR&Rs and the average price for full time care child care
centers and family child care homes for three age groups. CCR&Rs
work with parents, child care providers and local and state
governments within communities in every state to strengthen the
quality of care and are uniquely positioned to provide this data. This
year, for school-age care, CCR&Rs reported on the price of care for a
nine-month programs, full-year programs, and summer programs. We
defined child care centers as all center-based child care providers,
including Head Start programs, license-exempt programs, school-
based programs and state-funded prekindergarten.
Additional national and state data were gathered in the spring of 2016
from the American Community Survey, U.S. Census Bureau; the Office
of Child Care, U.S. Department of Health and Human Services; the
Bureau of Labor Statistics, U.S. Department of Labor; and the College
Board Annual Survey of Colleges.
For some states, the cost of care was derived from the latest market
rate survey available. Rates based on information collected prior to
2015 were adjusted by the Consumer Price Index (i.e., reported in
2015 dollars using the Bureau of Labor Statistics Consumer Price
Index Inflation Calculator). National totals are rounded estimates. All
missing information is reported as “NR” (Not Reported). Alabama, DC,
Michigan, New Jersey and South Carolina did not respond to our
survey. In these states, cost of care data was pulled from our 2015
survey and adjusted for inflation where applicable.
Ensuring that all children have access to high quality and affordable
early childhood programs is essential; however, in every state, this
type of care can be hard to find and difficult to afford. Although the
reauthorization of the Child Care and Development Block Grant Act
has raised the floor for health and safety standards and encourages
quality programming for all child care settings, there is still much work
to be done. In particular, researchers have identified the education and
training of child care providers as one of the most important
components of a quality child care setting.
Quality child care benefits everyone: it promotes positive
developmental outcomes for children and allows parents to pursue
their own education and career goals, eventually increasing their
earning potential and their contribution to the economy. To improve the
state of U.S. child care nationally, we MUST work together to find
meaningful solutions that support working families and their children.

POPULATION ALABAMA UNITED STATES
Total residents 4,849,377 318,857,056
Children age birth to 4 years 291,160 19,757,997
Children age birth to 4 years living in poverty
88,958 4,658,187
Children age 5 to 11 428,834 28,761,402
Total families with children 486,248 33,106,587
Single parent families 180,109 10,993,697
Families in poverty 133,594 6,603,926
CHILDREN UNDER AGE 6
POTENTIALLY IN NEED OF CHILD
CARE ALABAMA UNITED STATES
Children in two-parent families, both parents in labor force
107,342 8,441,764
Children in single-parent families, parent in the labor force
103,664 6,360,521
Total children under age 6 potentially needing child care
211,006 14,802,285
NUMBER OF WORKING
MOTHERS ALABAMA UNITED STATES
With infants under one year 34,483 2,435,563
With any children under age 6 138,703 9,721,156
With children under age 6 only
80,335 5,422,464
With both children under age 6 AND children age 6 to 17
58,368 4,298,692
Married working mothers 209,429 15,306,983
Single working mothers 116,238 6,749,078
SPACES IN CHILD CARE PROGRAMS ALABAMA Total spaces/slots NR
Percent of spaces in child care center programs*
NR
Percent of total spaces in licensed FCC homes
NR
Percent of total spaces in school-age care programs
NR
Percent of total spaces in other programs NR Total spaces/slots of licensed programs NR
Percent of licensed spaces for infants and toddlers
NR
Percent of licensed spaces for preschool-aged children
NR
Percent of licensed spaces for school-aged children
NR
*Does not include school-aged programs
1 Unless otherwise noted, statistics in the Child Care Need sections are from the American Community Survey, U.S. Census Bureau, 2011-2013 three-year estimates (http://factfinder2.census.gov/faces/nav/jsf/pages/index.xhtml). 2 Unless otherwise noted, data for the rest of the Fact Sheet is provided by Child Care Resource and Referral Agencies for Child Care Aware® of America’s 2016 State Fact Sheet Survey. Data reflects the 2015 calendar year.
TYPES OF CHILD CARE ALABAMA
Number of center-based child care programs NR Percent of centers that are nationally accredited
NR
Do faith-based programs need to be regulated?
NR
Number of regulated faith-based programs NR Number of family child care (FCC) homes NR
Percent of FCC homes that are nationally accredited
NR
Number of school-aged care programs NR Number of other regulated child care centers NR Number of other regulated FCC homes NR
NUMBERS, INCOME, AND
SUPPORT OF THE CHILD CARE
WORKFORCE3 ALABAMA
UNITED
STATES
Child care workers (in
centers) 8,460 573,430
Average annual income of child care workers4
$18,690 $22,310
Total paid early childhood workforce5
N/A 2.2 million
CCR&R CONTACTS URL Childcare Resource Network
http://childcarealabama.com
Child Care Aware® of America
http://usa.childcareaware.org www.childcareaware.org
3 Statistics provided by the Office of Child Care from the Child Care Development Fund, and
are derived from monthly averages. Total number of child care providers includes paid relatives and other nonregulated caregivers. U.S. Totals include all 50 states and the District of Columbia (http://www.acf.hhs.gov/programs/occ/resource/fy-2013-ccdf-data-tables-preliminary)
4 Bureau of Labor Statistics, U.S. Department of Labor, Occupational Employment Survey, May 2013 estimates. Does not include child care administrators/managers, preschool teachers, special education teachers, or self-employed workers such as family child care business owners. (http://www.bls.gov/oes/current/oes_nat.htm)
5Weiss E. & Brandon, R. N. (2010). The Economic Value of the U.S. Early Childhood Sector. Partnership for America’s Economic Success.

6 Note: Alabama did not provide updated cost of care data for 2015. These figures reflect data collected in 2014 and adjusted for inflation.
$5,644
$4,877
$5,314
$4,807
$4,941
$4,767
$4,200
$4,400
$4,600
$4,800
$5,000
$5,200
$5,400
$5,600
$5,800
Infant Four-Year-Old School-Age Child
Center FCC

POPULATION ALASKA UNITED STATES
Total residents 736,732 318,857,056
Children age birth to 4 years 53,404 19,757,997
Children age birth to 4 years living in poverty
9,103 4,658,187
Children age 5 to 11 73,021 28,761,402
Total families with children 81,462 33,106,587
Single parent families 25,092 10,993,697
Families in poverty 10,631 6,603,926
CHILDREN UNDER AGE 6
POTENTIALLY IN NEED OF CHILD
CARE ALASKA UNITED STATES
Children in two-parent families, both parents in labor force
20,636 8,441,764
Children in single-parent families, parent in the labor force
15,345 6,360,521
Total children under age 6 potentially needing child care
35,981 14,802,285
NUMBER OF WORKING
MOTHERS ALASKA UNITED STATES
With infants under one year 6,177 2,435,563
With any children under age 6 23,544 9,721,156
With children under age 6 only
13,292 5,422,464
With both children under age 6 AND children age 6 to 17
10,252 4,298,692
Married working mothers 37,518 15,306,983
Single working mothers 13,587 6,749,078
SPACES IN CHILD CARE PROGRAMS ALASKA Total spaces/slots 30,756
Percent of spaces in child care center programs*
69%
Percent of total spaces in licensed FCC homes
15%
Percent of total spaces in school-age care programs
16%
Percent of total spaces in other programs 0% Total spaces/slots of licensed programs NR
Percent of licensed spaces for infants and toddlers
NR
Percent of licensed spaces for preschool-aged children
NR
Percent of licensed spaces for school-aged children
NR
*Does not include school-aged programs
1 Unless otherwise noted, statistics in the Child Care Need sections are from the American Community Survey, U.S. Census Bureau, 2011-2013 three-year estimates (http://factfinder2.census.gov/faces/nav/jsf/pages/index.xhtml). 2 Unless otherwise noted, data for the rest of the Fact Sheet is provided by Child Care Resource and Referral Agencies for Child Care Aware® of America’s 2016 State Fact Sheet Survey. Data reflects the 2015 calendar year.
TYPES OF CHILD CARE ALASKA
Number of center-based child care programs 476 Percent of centers that are nationally accredited
4%
Do faith-based programs need to be regulated?
Yes
Number of regulated faith-based programs 24 Number of family child care (FCC) homes 685
Percent of FCC homes that are nationally accredited
0%
Number of school-aged care programs 64 Number of other regulated child care centers 0 Number of other regulated FCC homes 0
NUMBERS, INCOME, AND
SUPPORT OF THE CHILD CARE
WORKFORCE3 ALASKA
UNITED
STATES
Child care workers (in
centers) 2,420 573,430
Average annual income of child care workers4
$25,640 $22,310
Total paid early childhood workforce5
N/A 2.2 million
CCR&R CONTACTS URL thread www.threadalaska.org Child Care Aware® of America
http://usa.childcareaware.org www.childcareaware.org
3 Statistics provided by the Office of Child Care from the Child Care Development Fund, and
are derived from monthly averages. Total number of child care providers includes paid relatives and other nonregulated caregivers. U.S. Totals include all 50 states and the District of Columbia (http://www.acf.hhs.gov/programs/occ/resource/fy-2013-ccdf-data-tables-preliminary)
4 Bureau of Labor Statistics, U.S. Department of Labor, Occupational Employment Survey, May 2013 estimates. Does not include child care administrators/managers, preschool teachers, special education teachers, or self-employed workers such as family child care business owners. (http://www.bls.gov/oes/current/oes_nat.htm)
5Weiss E. & Brandon, R. N. (2010). The Economic Value of the U.S. Early Childhood Sector. Partnership for America’s Economic Success.

$11,700$10,764
$10,101$9,645
$0
$2,000
$4,000
$6,000
$8,000
$10,000
$12,000
$14,000
Infant Four-Year-Old
Center FCC
$6,984
$5,648
$9,312
$7,530
$2,340
$0
$2,000
$4,000
$6,000
$8,000
$10,000
$12,000
$14,000
School-Aged Child
Center (9 months) FCC (9 months) Center (12 months)
FCC (12 months) Center (Summer)

POPULATION ARIZONA UNITED STATES
Total residents 6,731,484 318,857,056
Children age birth to 4 years 432,663 19,757,997
Children age birth to 4 years living in poverty
119,741 4,658,187
Children age 5 to 11 641,824 28,761,402
Total families with children 658,513 33,106,587
Single parent families 228,931 10,993,697
Families in poverty 155,170 6,603,926
CHILDREN UNDER AGE 6
POTENTIALLY IN NEED OF CHILD
CARE ARIZONA UNITED STATES
Children in two-parent families, both parents in labor force
150,566 8,441,764
Children in single-parent families, parent in the labor force
142,387 6,360,521
Total children under age 6 potentially needing child care
292,953 14,802,285
NUMBER OF WORKING
MOTHERS ARIZONA UNITED STATES
With infants under one year 44,656 2,435,563
With any children under age 6 181,012 9,721,156
With children under age 6 only
91,743 5,422,464
With both children under age 6 AND children age 6 to 17
89,269 4,298,692
Married working mothers 269,154 15,306,983
Single working mothers 132,856 6,749,078
SPACES IN CHILD CARE PROGRAMS ARIZONA Total spaces/slots 403,229
Percent of spaces in child care center programs*
55%
Percent of total spaces in licensed FCC homes
1%
Percent of total spaces in school-age care programs
43%
Percent of total spaces in other programs 1% Total spaces/slots of licensed programs 124,228
Percent of licensed spaces for infants and toddlers
30%
Percent of licensed spaces for preschool-aged children
45%
Percent of licensed spaces for school-aged children
25%
*Does not include school-aged programs
1 Unless otherwise noted, statistics in the Child Care Need sections are from the American Community Survey, U.S. Census Bureau, 2011-2013 three-year estimates (http://factfinder2.census.gov/faces/nav/jsf/pages/index.xhtml). 2 Unless otherwise noted, data for the rest of the Fact Sheet is provided by Child Care Resource and Referral Agencies for Child Care Aware® of America’s 2016 State Fact Sheet Survey. Data reflects the 2015 calendar year.
TYPES OF CHILD CARE ARIZONA
Number of center-based child care programs 2,060 Percent of centers that are nationally accredited
5%
Do faith-based programs need to be regulated?
Yes
Number of regulated faith-based programs 253 Number of family child care (FCC) homes 809
Percent of FCC homes that are nationally accredited
9%
Number of school-aged care programs 2,263 Number of other regulated child care centers 24 Number of other regulated FCC homes 249
NUMBERS, INCOME, AND
SUPPORT OF THE CHILD CARE
WORKFORCE3 ARIZONA
UNITED
STATES
Child care workers (in
centers) 6,790 573,430
Average annual income of child care workers4
$21,320 $22,310
Total paid early childhood workforce5
N/A 2.2 million
CCR&R CONTACTS URL Child & Family Resources, Inc 2800 E Broadway BLVD Tucson, AZ 85716
www.ArizonaChildCare.org
Child Care Aware® of America
http://usa.childcareaware.org www.childcareaware.org
3 Statistics provided by the Office of Child Care from the Child Care Development Fund, and
are derived from monthly averages. Total number of child care providers includes paid relatives and other nonregulated caregivers. U.S. Totals include all 50 states and the District of Columbia (http://www.acf.hhs.gov/programs/occ/resource/fy-2013-ccdf-data-tables-preliminary)
4 Bureau of Labor Statistics, U.S. Department of Labor, Occupational Employment Survey, May 2013 estimates. Does not include child care administrators/managers, preschool teachers, special education teachers, or self-employed workers such as family child care business owners. (http://www.bls.gov/oes/current/oes_nat.htm)
5Weiss E. & Brandon, R. N. (2010). The Economic Value of the U.S. Early Childhood Sector. Partnership for America’s Economic Success.

$9,993
$7,845
$11,982
$9,541
$6,883 $6,524
$0
$2,000
$4,000
$6,000
$8,000
$10,000
$12,000
$14,000
Infant Four-Year-Old
Center Accredited Center FCC
$3,707$3,134
$6,612 $6,302 $6,302
$0
$2,000
$4,000
$6,000
$8,000
$10,000
$12,000
$14,000
School-Aged Child
Center (9 months) FCC (9 months) Center (12 months)
FCC (12 months) FCC (Summer)
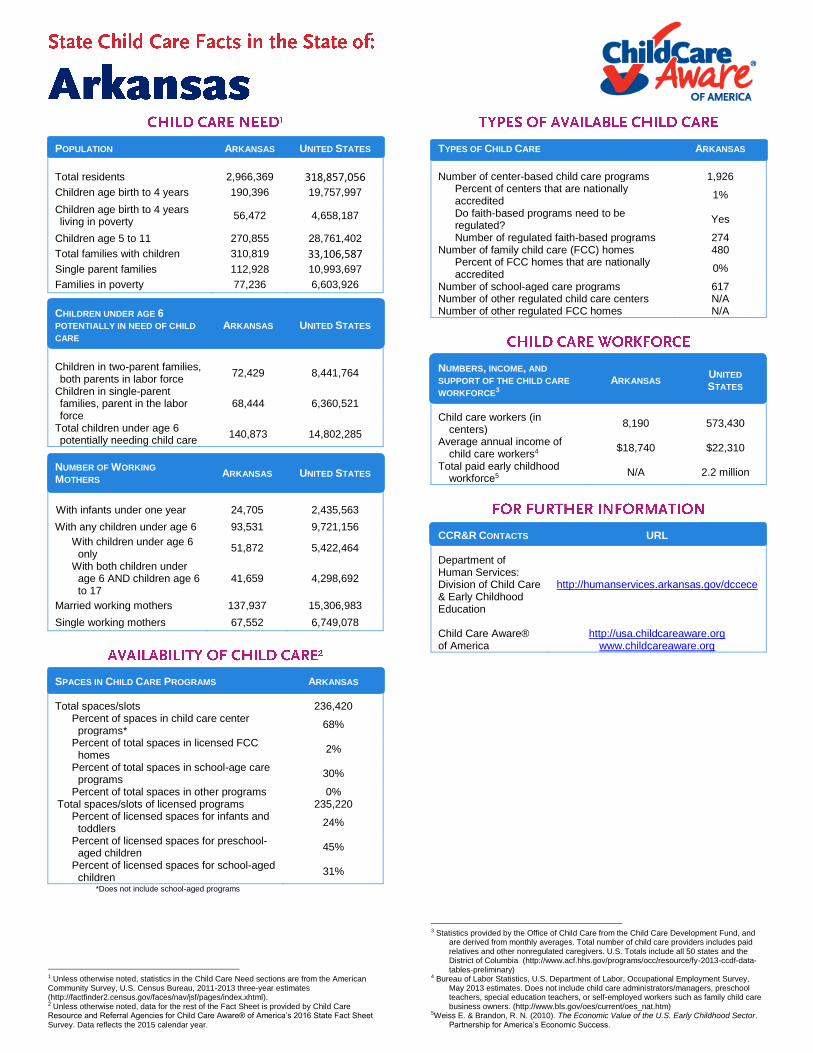
POPULATION ARKANSAS UNITED STATES
Total residents 2,966,369 318,857,056
Children age birth to 4 years 190,396 19,757,997
Children age birth to 4 years living in poverty
56,472 4,658,187
Children age 5 to 11 270,855 28,761,402
Total families with children 310,819 33,106,587
Single parent families 112,928 10,993,697
Families in poverty 77,236 6,603,926
CHILDREN UNDER AGE 6
POTENTIALLY IN NEED OF CHILD
CARE ARKANSAS UNITED STATES
Children in two-parent families, both parents in labor force
72,429 8,441,764
Children in single-parent families, parent in the labor force
68,444 6,360,521
Total children under age 6 potentially needing child care
140,873 14,802,285
NUMBER OF WORKING
MOTHERS ARKANSAS UNITED STATES
With infants under one year 24,705 2,435,563
With any children under age 6 93,531 9,721,156
With children under age 6 only
51,872 5,422,464
With both children under age 6 AND children age 6 to 17
41,659 4,298,692
Married working mothers 137,937 15,306,983
Single working mothers 67,552 6,749,078
SPACES IN CHILD CARE PROGRAMS ARKANSAS Total spaces/slots 236,420
Percent of spaces in child care center programs*
68%
Percent of total spaces in licensed FCC homes
2%
Percent of total spaces in school-age care programs
30%
Percent of total spaces in other programs 0% Total spaces/slots of licensed programs 235,220
Percent of licensed spaces for infants and toddlers
24%
Percent of licensed spaces for preschool-aged children
45%
Percent of licensed spaces for school-aged children
31%
*Does not include school-aged programs
1 Unless otherwise noted, statistics in the Child Care Need sections are from the American Community Survey, U.S. Census Bureau, 2011-2013 three-year estimates (http://factfinder2.census.gov/faces/nav/jsf/pages/index.xhtml). 2 Unless otherwise noted, data for the rest of the Fact Sheet is provided by Child Care Resource and Referral Agencies for Child Care Aware® of America’s 2016 State Fact Sheet Survey. Data reflects the 2015 calendar year.
TYPES OF CHILD CARE ARKANSAS
Number of center-based child care programs 1,926 Percent of centers that are nationally accredited
1%
Do faith-based programs need to be regulated?
Yes
Number of regulated faith-based programs 274 Number of family child care (FCC) homes 480
Percent of FCC homes that are nationally accredited
0%
Number of school-aged care programs 617 Number of other regulated child care centers N/A Number of other regulated FCC homes N/A
NUMBERS, INCOME, AND
SUPPORT OF THE CHILD CARE
WORKFORCE3 ARKANSAS
UNITED
STATES
Child care workers (in
centers) 8,190 573,430
Average annual income of child care workers4
$18,740 $22,310
Total paid early childhood workforce5
N/A 2.2 million
CCR&R CONTACTS URL Department of Human Services: Division of Child Care & Early Childhood Education
http://humanservices.arkansas.gov/dccece
Child Care Aware® of America
http://usa.childcareaware.org www.childcareaware.org
3 Statistics provided by the Office of Child Care from the Child Care Development Fund, and
are derived from monthly averages. Total number of child care providers includes paid relatives and other nonregulated caregivers. U.S. Totals include all 50 states and the District of Columbia (http://www.acf.hhs.gov/programs/occ/resource/fy-2013-ccdf-data-tables-preliminary)
4 Bureau of Labor Statistics, U.S. Department of Labor, Occupational Employment Survey, May 2013 estimates. Does not include child care administrators/managers, preschool teachers, special education teachers, or self-employed workers such as family child care business owners. (http://www.bls.gov/oes/current/oes_nat.htm)
5Weiss E. & Brandon, R. N. (2010). The Economic Value of the U.S. Early Childhood Sector. Partnership for America’s Economic Success.

$6,074
$5,057$5,223$4,754
$0
$1,000
$2,000
$3,000
$4,000
$5,000
$6,000
$7,000
Infant Four-Year-Old
Center FCC
Note: The State of Arkansas did not report any cost data for school-age child care.

POPULATION CALIFORNIA UNITED STATES
Total residents 38,802,500 318,857,056
Children age birth to 4 years 2,510,183 19,757,997
Children age birth to 4 years living in poverty
578,150 4,658,187
Children age 5 to 11 3,566,544 28,761,402
Total families with children 3,986,219 33,106,587
Single parent families 1,221,456 10,993,697
Families in poverty 820,200 6,603,926
CHILDREN UNDER AGE 6
POTENTIALLY IN NEED OF CHILD
CARE CALIFORNIA UNITED STATES
Children in two-parent families, both parents in labor force
1,009,060 8,441,764
Children in single-parent families, parent in the labor force
742,617 6,360,521
Total children under age 6 potentially needing child care
1,751,677 14,802,285
NUMBER OF WORKING
MOTHERS CALIFORNIA UNITED STATES
With infants under one year 264,477 2,435,563
With any children under age 6 1,134,621 9,721,156
With children under age 6 only
618,236 5,422,464
With both children under age 6 AND children age 6 to 17
516,385 4,298,692
Married working mothers 1,763,742 15,306,983
Single working mothers 695,253 6,749,078
SPACES IN CHILD CARE PROGRAMS CALIFORNIA Total spaces/slots 1,372,878
Percent of spaces in child care center programs*
53%
Percent of total spaces in licensed FCC homes
23%
Percent of total spaces in school-age care programs
25%
Percent of total spaces in other programs 0% Total spaces/slots of licensed programs 721,868
Percent of licensed spaces for infants and toddlers
6%
Percent of licensed spaces for preschool-aged children
74%
Percent of licensed spaces for school-aged children
20%
*Does not include school-aged programs
1 Unless otherwise noted, statistics in the Child Care Need sections are from the American Community Survey, U.S. Census Bureau, 2011-2013 three-year estimates (http://factfinder2.census.gov/faces/nav/jsf/pages/index.xhtml). 2 Unless otherwise noted, data for the rest of the Fact Sheet is provided by Child Care Resource and Referral Agencies for Child Care Aware® of America’s 2016 State Fact Sheet Survey. Data reflects the 2015 calendar year.
TYPES OF CHILD CARE CALIFORNIA
Number of center-based child care programs 11,230 Percent of centers that are nationally accredited
5%
Do faith-based programs need to be regulated?
Yes
Number of regulated faith-based programs NR Number of family child care (FCC) homes 30,699
Percent of FCC homes that are nationally accredited
0%
Number of school-aged care programs 4,811 Number of other regulated child care centers NR Number of other regulated FCC homes NR
NUMBERS, INCOME, AND
SUPPORT OF THE CHILD CARE
WORKFORCE3 CALIFORNIA
UNITED
STATES
Child care workers (in
centers) 59,690 573,430
Average annual income of child care workers4
$26,050 $22,310
Total paid early childhood workforce5
N/A 2.2 million
CCR&R CONTACTS URL California Child Care Resource & Referral Network
www.rrnetwork.org
Child Care Aware® of America
http://usa.childcareaware.org www.childcareaware.org
3 Statistics provided by the Office of Child Care from the Child Care Development Fund, and
are derived from monthly averages. Total number of child care providers includes paid relatives and other nonregulated caregivers. U.S. Totals include all 50 states and the District of Columbia (http://www.acf.hhs.gov/programs/occ/resource/fy-2013-ccdf-data-tables-preliminary)
4 Bureau of Labor Statistics, U.S. Department of Labor, Occupational Employment Survey, May 2013 estimates. Does not include child care administrators/managers, preschool teachers, special education teachers, or self-employed workers such as family child care business owners. (http://www.bls.gov/oes/current/oes_nat.htm)
5Weiss E. & Brandon, R. N. (2010). The Economic Value of the U.S. Early Childhood Sector. Partnership for America’s Economic Success.

$13,343
$9,117$8,472
$7,859
$0
$2,000
$4,000
$6,000
$8,000
$10,000
$12,000
$14,000
$16,000
Infant Four-Year-Old
Center FCC
$7,391$6,759
$0
$1,000
$2,000
$3,000
$4,000
$5,000
$6,000
$7,000
$8,000
School-Aged Child
Center (12 months) FCC (12 months)

POPULATION COLORADO UNITED STATES
Total residents 5,355,866 318,857,056
Children age birth to 4 years 332,058 19,757,997
Children age birth to 4 years living in poverty
53,093 4,658,187
Children age 5 to 11 498,114 28,761,402
Total families with children 600,605 33,106,587
Single parent families 177,987 10,993,697
Families in poverty 80,937 6,603,926
CHILDREN UNDER AGE 6
POTENTIALLY IN NEED OF CHILD
CARE COLORADO UNITED STATES
Children in two-parent families, both parents in labor force
165,709 8,441,764
Children in single-parent families, parent in the labor force
85,249 6,360,521
Total children under age 6 potentially needing child care
250,958 14,802,285
NUMBER OF WORKING
MOTHERS COLORADO UNITED STATES
With infants under one year 45,646 2,435,563
With any children under age 6 171,466 9,721,156
With children under age 6 only
100,361 5,422,464
With both children under age 6 AND children age 6 to 17
71,105 4,298,692
Married working mothers 286,166 15,306,983
Single working mothers 104,272 6,749,078
SPACES IN CHILD CARE PROGRAMS COLORADO Total spaces/slots 201,808
Percent of spaces in child care center programs*
53%
Percent of total spaces in licensed FCC homes
8%
Percent of total spaces in school-age care programs
39%
Percent of total spaces in other programs 0% Total spaces/slots of licensed programs NR
Percent of licensed spaces for infants and toddlers
NR
Percent of licensed spaces for preschool-aged children
NR
Percent of licensed spaces for school-aged children
NR
*Does not include school-aged programs
1 Unless otherwise noted, statistics in the Child Care Need sections are from the American Community Survey, U.S. Census Bureau, 2011-2013 three-year estimates (http://factfinder2.census.gov/faces/nav/jsf/pages/index.xhtml). 2 Unless otherwise noted, data for the rest of the Fact Sheet is provided by Child Care Resource and Referral Agencies for Child Care Aware® of America’s 2016 State Fact Sheet Survey. Data reflects the 2015 calendar year.
TYPES OF CHILD CARE COLORADO
Number of center-based child care programs 1,317 Percent of centers that are nationally accredited
22%
Do faith-based programs need to be regulated?
No
Number of regulated faith-based programs 0 Number of family child care (FCC) homes 2,334
Percent of FCC homes that are nationally accredited
2%
Number of school-aged care programs 968 Number of other regulated child care centers 0 Number of other regulated FCC homes 0
NUMBERS, INCOME, AND
SUPPORT OF THE CHILD CARE
WORKFORCE3 COLORADO
UNITED
STATES
Child care workers (in
centers) 8,260 573,430
Average annual income of child care workers4
$25,070 $22,310
Total paid early childhood workforce5
N/A 2.2 million
CCR&R CONTACTS URL NR www.coloradoofficeofearlychildhood.com Child Care Aware® of America
http://usa.childcareaware.org www.childcareaware.org
3 Statistics provided by the Office of Child Care from the Child Care Development Fund, and
are derived from monthly averages. Total number of child care providers includes paid relatives and other nonregulated caregivers. U.S. Totals include all 50 states and the District of Columbia (http://www.acf.hhs.gov/programs/occ/resource/fy-2013-ccdf-data-tables-preliminary)
4 Bureau of Labor Statistics, U.S. Department of Labor, Occupational Employment Survey, May 2013 estimates. Does not include child care administrators/managers, preschool teachers, special education teachers, or self-employed workers such as family child care business owners. (http://www.bls.gov/oes/current/oes_nat.htm)
5Weiss E. & Brandon, R. N. (2010). The Economic Value of the U.S. Early Childhood Sector. Partnership for America’s Economic Success.

$14,950
$11,089
$9,620$8,626
$0
$2,000
$4,000
$6,000
$8,000
$10,000
$12,000
$14,000
$16,000
Infant Four-Year-Old
Center FCC
$4,707 $3,621
$0
$2,000
$4,000
$6,000
$8,000
$10,000
$12,000
$14,000
$16,000
School-Aged Child
Center (9 months) FCC (9 months)

POPULATION CONNECTICUT UNITED STATES
Total residents 3,596,677 318,857,056
Children age birth to 4 years 188,811 19,757,997
Children age birth to 4 years living in poverty
31,297 4,658,187
Children age 5 to 11 299,740 28,761,402
Total families with children 379,021 33,106,587
Single parent families 121,669 10,993,697
Families in poverty 50,737 6,603,926
CHILDREN UNDER AGE 6
POTENTIALLY IN NEED OF CHILD
CARE CONNECTICUT UNITED STATES
Children in two-parent families, both parents in labor force
93,569 8,441,764
Children in single-parent families, parent in the labor force
63,379 6,360,521
Total children under age 6 potentially needing child care
156,948 14,802,285
NUMBER OF WORKING
MOTHERS CONNECTICUT UNITED STATES
With infants under one year 27,990 2,435,563
With any children under age 6 105,733 9,721,156
With children under age 6 only
58,920 5,422,464
With both children under age 6 AND children age 6 to 17
46,813 4,298,692
Married working mothers 189,344 15,306,983
Single working mothers 79,952 6,749,078
SPACES IN CHILD CARE PROGRAMS CONNECTICUT Total spaces/slots 151,763
Percent of spaces in child care center programs*
68%
Percent of total spaces in licensed FCC homes
12%
Percent of total spaces in school-age care programs
19%
Percent of total spaces in other programs 0% Total spaces/slots of licensed programs 122,425
Percent of licensed spaces for infants and toddlers
20%
Percent of licensed spaces for preschool-aged children
51%
Percent of licensed spaces for school-aged children
29%
*Does not include school-aged programs
1 Unless otherwise noted, statistics in the Child Care Need sections are from the American Community Survey, U.S. Census Bureau, 2011-2013 three-year estimates (http://factfinder2.census.gov/faces/nav/jsf/pages/index.xhtml). 2 Unless otherwise noted, data for the rest of the Fact Sheet is provided by Child Care Resource and Referral Agencies for Child Care Aware® of America’s 2016 State Fact Sheet Survey. Data reflects the 2015 calendar year.
TYPES OF CHILD CARE CONNECTICUT
Number of center-based child care programs 1,465 Percent of centers that are nationally accredited
25%
Do faith-based programs need to be regulated?
Yes
Number of regulated faith-based programs NR Number of family child care (FCC) homes 2,212
Percent of FCC homes that are nationally accredited
0%
Number of school-aged care programs 282 Number of other regulated child care centers NR Number of other regulated FCC homes NR
NUMBERS, INCOME, AND
SUPPORT OF THE CHILD CARE
WORKFORCE3 CONNECTICUT
UNITED
STATES
Child care workers (in
centers) 7,910 573,430
Average annual income of child care workers4
$24,370 $22,310
Total paid early childhood workforce5
N/A 2.2 million
CCR&R CONTACTS URL 2-1-1 Child Care http://www.211childcare.org/ Child Care Aware® of America
http://usa.childcareaware.org www.childcareaware.org
3 Statistics provided by the Office of Child Care from the Child Care Development Fund, and
are derived from monthly averages. Total number of child care providers includes paid relatives and other nonregulated caregivers. U.S. Totals include all 50 states and the District of Columbia (http://www.acf.hhs.gov/programs/occ/resource/fy-2013-ccdf-data-tables-preliminary)
4 Bureau of Labor Statistics, U.S. Department of Labor, Occupational Employment Survey, May 2013 estimates. Does not include child care administrators/managers, preschool teachers, special education teachers, or self-employed workers such as family child care business owners. (http://www.bls.gov/oes/current/oes_nat.htm)
5Weiss E. & Brandon, R. N. (2010). The Economic Value of the U.S. Early Childhood Sector. Partnership for America’s Economic Success.

$14,079
$11,669
$15,298
$12,147
$10,280 $9,798
$0
$2,000
$4,000
$6,000
$8,000
$10,000
$12,000
$14,000
$16,000
$18,000
Infant Four-Year-Old
Center Accredited Center FCC
$2,756
$6,393 $6,290
$0
$2,000
$4,000
$6,000
$8,000
$10,000
$12,000
$14,000
$16,000
$18,000
School-Aged Child
Center (9 months) Center (12 months) FCC (12 months)

POPULATION DELAWARE UNITED STATES
Total residents 935,614 318,857,056
Children age birth to 4 years 56,010 19,757,997
Children age birth to 4 years living in poverty
11,278 4,658,187
Children age 5 to 11 79,978 28,761,402
Total families with children 89,738 33,106,587
Single parent families 33,333 10,993,697
Families in poverty 15,160 6,603,926
CHILDREN UNDER AGE 6
POTENTIALLY IN NEED OF CHILD
CARE DELAWARE UNITED STATES
Children in two-parent families, both parents in labor force
25,004 8,441,764
Children in single-parent families, parent in the labor force
21,700 6,360,521
Total children under age 6 potentially needing child care
46,704 14,802,285
NUMBER OF WORKING
MOTHERS DELAWARE UNITED STATES
With infants under one year 8,148 2,435,563
With any children under age 6 29,838 9,721,156
With children under age 6 only
16,437 5,422,464
With both children under age 6 AND children age 6 to 17
13,401 4,298,692
Married working mothers 42,716 15,306,983
Single working mothers 21,500 6,749,078
SPACES IN CHILD CARE PROGRAMS DELAWARE Total spaces/slots 47,539
Percent of spaces in child care center programs*
61%
Percent of total spaces in licensed FCC homes
14%
Percent of total spaces in school-age care programs
25%
Percent of total spaces in other programs 0% Total spaces/slots of licensed programs NR
Percent of licensed spaces for infants and toddlers
NR
Percent of licensed spaces for preschool-aged children
NR
Percent of licensed spaces for school-aged children
NR
*Does not include school-aged programs
1 Unless otherwise noted, statistics in the Child Care Need sections are from the American Community Survey, U.S. Census Bureau, 2011-2013 three-year estimates (http://factfinder2.census.gov/faces/nav/jsf/pages/index.xhtml). 2 Unless otherwise noted, data for the rest of the Fact Sheet is provided by Child Care Resource and Referral Agencies for Child Care Aware® of America’s 2016 State Fact Sheet Survey. Data reflects the 2015 calendar year.
TYPES OF CHILD CARE DELAWARE
Number of center-based child care programs 300 Percent of centers that are nationally accredited
6%
Do faith-based programs need to be regulated?
Yes
Number of regulated faith-based programs 29 Number of family child care (FCC) homes 760
Percent of FCC homes that are nationally accredited
0%
Number of school-aged care programs 125 Number of other regulated child care centers NR Number of other regulated FCC homes NR
NUMBERS, INCOME, AND
SUPPORT OF THE CHILD CARE
WORKFORCE3 DELAWARE
UNITED
STATES
Child care workers (in
centers) 1,410 573,430
Average annual income of child care workers4
$21,740 $22,310
Total paid early childhood workforce5
N/A 2.2 million
CCR&R CONTACTS URL Children & Families First
www.cffde.org
Child Care Aware® of America
http://usa.childcareaware.org www.childcareaware.org
3 Statistics provided by the Office of Child Care from the Child Care Development Fund, and
are derived from monthly averages. Total number of child care providers includes paid relatives and other nonregulated caregivers. U.S. Totals include all 50 states and the District of Columbia (http://www.acf.hhs.gov/programs/occ/resource/fy-2013-ccdf-data-tables-preliminary)
4 Bureau of Labor Statistics, U.S. Department of Labor, Occupational Employment Survey, May 2013 estimates. Does not include child care administrators/managers, preschool teachers, special education teachers, or self-employed workers such as family child care business owners. (http://www.bls.gov/oes/current/oes_nat.htm)
5Weiss E. & Brandon, R. N. (2010). The Economic Value of the U.S. Early Childhood Sector. Partnership for America’s Economic Success.

$10,396
$8,308
$13,661
$11,842
$7,347$6,539
$0
$2,000
$4,000
$6,000
$8,000
$10,000
$12,000
$14,000
$16,000
Infant Four-Year-Old
Center Accredited Center FCC
$5,093$4,117
$0
$2,000
$4,000
$6,000
$8,000
$10,000
$12,000
$14,000
$16,000
School-Aged Child
Center (9 months) FCC (9 months)

POPULATION DISTRICT OF
COLUMBIA UNITED STATES
Total residents 658,893 318,857,056
Children age birth to 4 years 42,763 19,757,997
Children age birth to 4 years living in poverty
10,240 4,658,187
Children age 5 to 11 40,522 28,761,402
Total families with children 49,086 33,106,587
Single parent families 24,540 10,993,697
Families in poverty 12,178 6,603,926
CHILDREN UNDER AGE 6
POTENTIALLY IN NEED OF CHILD
CARE
DISTRICT OF
COLUMBIA UNITED STATES
Children in two-parent families, both parents in labor force
18,122 8,441,764
Children in single-parent families, parent in the labor force
15,754 6,360,521
Total children under age 6 potentially needing child care
33,876 14,802,285
NUMBER OF WORKING
MOTHERS DISTRICT OF
COLUMBIA UNITED STATES
With infants under one year 7,239 2,435,563
With any children under age 6 19,332 9,721,156
With children under age 6 only
13,375 5,422,464
With both children under age 6 AND children age 6 to 17
5,957 4,298,692
Married working mothers 18,474 15,306,983
Single working mothers 17,012 6,749,078
SPACES IN CHILD CARE PROGRAMS DISTRICT OF
COLUMBIA Total spaces/slots NR
Percent of spaces in child care center programs*
NR
Percent of total spaces in licensed FCC homes
NR
Percent of total spaces in school-age care programs
NR
Percent of total spaces in other programs NR Total spaces/slots of licensed programs NR
Percent of licensed spaces for infants and toddlers
NR
Percent of licensed spaces for preschool-aged children
NR
Percent of licensed spaces for school-aged children
NR
*Does not include school-aged programs
1 Unless otherwise noted, statistics in the Child Care Need sections are from the American Community Survey, U.S. Census Bureau, 2011-2013 three-year estimates (http://factfinder2.census.gov/faces/nav/jsf/pages/index.xhtml). 2 Unless otherwise noted, data for the rest of the Fact Sheet is provided by Child Care Resource and Referral Agencies for Child Care Aware® of America’s 2016 State Fact Sheet Survey. Data reflects the 2015 calendar year.
TYPES OF CHILD CARE DISTRICT OF
COLUMBIA
Number of center-based child care programs NR Percent of centers that are nationally accredited
NR
Do faith-based programs need to be regulated?
NR
Number of regulated faith-based programs NR Number of family child care (FCC) homes NR
Percent of FCC homes that are nationally accredited
NR
Number of school-aged care programs NR Number of other regulated child care centers NR Number of other regulated FCC homes NR
NUMBERS, INCOME, AND
SUPPORT OF THE CHILD CARE
WORKFORCE3
DISTRICT OF
COLUMBIA UNITED
STATES
Child care workers (in
centers) 1,420 573,430
Average annual income of child care workers4
$26,900 $22,310
Total paid early childhood workforce5
N/A 2.2 million
CCR&R CONTACTS URL DC Child Care Connections
http://www.childcareconnections.osse.dc.gov/
Child Care Aware® of America
http://usa.childcareaware.org www.childcareaware.org
3 Statistics provided by the Office of Child Care from the Child Care Development Fund, and
are derived from monthly averages. Total number of child care providers includes paid relatives and other nonregulated caregivers. U.S. Totals include all 50 states and the District of Columbia (http://www.acf.hhs.gov/programs/occ/resource/fy-2013-ccdf-data-tables-preliminary)
4 Bureau of Labor Statistics, U.S. Department of Labor, Occupational Employment Survey, May 2013 estimates. Does not include child care administrators/managers, preschool teachers, special education teachers, or self-employed workers such as family child care business owners. (http://www.bls.gov/oes/current/oes_nat.htm)
5Weiss E. & Brandon, R. N. (2010). The Economic Value of the U.S. Early Childhood Sector. Partnership for America’s Economic Success.

6 Note: The District of Columbia did not provide updated cost of care data for 2015. These figures reflect data collected in 2014 and adjusted for inflation.
$22,658
$17,863
$13,639
$16,025
$13,684
$8,467
$0
$5,000
$10,000
$15,000
$20,000
$25,000
Infant Four-Year-Old School-Age Child
Center FCC

POPULATION FLORIDA UNITED STATES
Total residents 19,893,297 318,857,056
Children age birth to 4 years 1,077,220 19,757,997
Children age birth to 4 years living in poverty
277,837 4,658,187
Children age 5 to 11 1,569,765 28,761,402
Total families with children 1,747,346 33,106,587
Single parent families 649,769 10,993,697
Families in poverty 390,720 6,603,926
CHILDREN UNDER AGE 6
POTENTIALLY IN NEED OF CHILD
CARE FLORIDA UNITED STATES
Children in two-parent families, both parents in labor force
414,293 8,441,764
Children in single-parent families, parent in the labor force
401,870 6,360,521
Total children under age 6 potentially needing child care
816,163 14,802,285
NUMBER OF WORKING
MOTHERS FLORIDA UNITED STATES
With infants under one year 129,262 2,435,563
With any children under age 6 510,647 9,721,156
With children under age 6 only
292,661 5,422,464
With both children under age 6 AND children age 6 to 17
217,986 4,298,692
Married working mothers 754,970 15,306,983
Single working mothers 411,768 6,749,078
SPACES IN CHILD CARE PROGRAMS FLORIDA Total spaces/slots 891,508
Percent of spaces in child care center programs*
82%
Percent of total spaces in licensed FCC homes
3%
Percent of total spaces in school-age care programs
15%
Percent of total spaces in other programs 0% Total spaces/slots of licensed programs NR
Percent of licensed spaces for infants and toddlers
NR
Percent of licensed spaces for preschool-aged children
NR
Percent of licensed spaces for school-aged children
NR
*Does not include school-aged programs
1 Unless otherwise noted, statistics in the Child Care Need sections are from the American Community Survey, U.S. Census Bureau, 2011-2013 three-year estimates (http://factfinder2.census.gov/faces/nav/jsf/pages/index.xhtml). 2 Unless otherwise noted, data for the rest of the Fact Sheet is provided by Child Care Resource and Referral Agencies for Child Care Aware® of America’s 2016 State Fact Sheet Survey. Data reflects the 2015 calendar year.
TYPES OF CHILD CARE FLORIDA
Number of center-based child care programs 6,971 Percent of centers that are nationally accredited
26%
Do faith-based programs need to be regulated?
No
Number of regulated faith-based programs 0 Number of family child care (FCC) homes 3,018
Percent of FCC homes that are nationally accredited
8%
Number of school-aged care programs 1,336 Number of other regulated child care centers 0 Number of other regulated FCC homes 0
NUMBERS, INCOME, AND
SUPPORT OF THE CHILD CARE
WORKFORCE3 FLORIDA
UNITED
STATES
Child care workers (in
centers) 33,860 573,430
Average annual income of child care workers4
$21,210 $22,310
Total paid early childhood workforce5
N/A 2.2 million
CCR&R CONTACTS URL Child Care Resource and Referral State Network
www.floridaearlylearning.com
Child Care Aware® of America
http://usa.childcareaware.org www.childcareaware.org
3 Statistics provided by the Office of Child Care from the Child Care Development Fund, and
are derived from monthly averages. Total number of child care providers includes paid relatives and other nonregulated caregivers. U.S. Totals include all 50 states and the District of Columbia (http://www.acf.hhs.gov/programs/occ/resource/fy-2013-ccdf-data-tables-preliminary)
4 Bureau of Labor Statistics, U.S. Department of Labor, Occupational Employment Survey, May 2013 estimates. Does not include child care administrators/managers, preschool teachers, special education teachers, or self-employed workers such as family child care business owners. (http://www.bls.gov/oes/current/oes_nat.htm)
5Weiss E. & Brandon, R. N. (2010). The Economic Value of the U.S. Early Childhood Sector. Partnership for America’s Economic Success.

$8,719
$6,897
$9,783
$7,796$7,642
$6,470
$8,792
$7,341
$0
$2,000
$4,000
$6,000
$8,000
$10,000
$12,000
Infant Four-Year-Old
Center Accredited Center FCC Accredited FCC
$4,057 $4,247 $4,505 $4,583
$1,463 $1,397
$0
$2,000
$4,000
$6,000
$8,000
$10,000
$12,000
School-Aged Child
Center (9 months) FCC (9 months) Center (12 months)
FCC (12 months) Center (Summer) FCC (Summer)

POPULATION GEORGIA UNITED STATES
Total residents 10,097,343 318,857,056
Children age birth to 4 years 654,395 19,757,997
Children age birth to 4 years living in poverty
191,237 4,658,187
Children age 5 to 11 990,930 28,761,402
Total families with children 1,104,957 33,106,587
Single parent families 401,185 10,993,697
Families in poverty 264,628 6,603,926
CHILDREN UNDER AGE 6
POTENTIALLY IN NEED OF CHILD
CARE GEORGIA UNITED STATES
Children in two-parent families, both parents in labor force
256,799 8,441,764
Children in single-parent families, parent in the labor force
237,229 6,360,521
Total children under age 6 potentially needing child care
494,028 14,802,285
NUMBER OF WORKING
MOTHERS GEORGIA UNITED STATES
With infants under one year 83,195 2,435,563
With any children under age 6 333,524 9,721,156
With children under age 6 only
177,738 5,422,464
With both children under age 6 AND children age 6 to 17
155,786 4,298,692
Married working mothers 478,209 15,306,983
Single working mothers 261,695 6,749,078
SPACES IN CHILD CARE PROGRAMS GEORGIA Total spaces/slots 368,357
Percent of spaces in child care center programs*
89%
Percent of total spaces in licensed FCC homes
3%
Percent of total spaces in school-age care programs
7%
Percent of total spaces in other programs 1% Total spaces/slots of licensed programs 359,459
Percent of licensed spaces for infants and toddlers
91%
Percent of licensed spaces for preschool-aged children
3%
Percent of licensed spaces for school-aged children
6%
*Does not include school-aged programs
1 Unless otherwise noted, statistics in the Child Care Need sections are from the American Community Survey, U.S. Census Bureau, 2011-2013 three-year estimates (http://factfinder2.census.gov/faces/nav/jsf/pages/index.xhtml). 2 Unless otherwise noted, data for the rest of the Fact Sheet is provided by Child Care Resource and Referral Agencies for Child Care Aware® of America’s 2016 State Fact Sheet Survey. Data reflects the 2015 calendar year.
TYPES OF CHILD CARE GEORGIA
Number of center-based child care programs 2,952 Percent of centers that are nationally accredited
42%
Do faith-based programs need to be regulated?
No
Number of regulated faith-based programs NR Number of family child care (FCC) homes 2,049
Percent of FCC homes that are nationally accredited
6%
Number of school-aged care programs 258 Number of other regulated child care centers 998 Number of other regulated FCC homes 0
NUMBERS, INCOME, AND
SUPPORT OF THE CHILD CARE
WORKFORCE3 GEORGIA
UNITED
STATES
Child care workers (in
centers) 21,820 573,430
Average annual income of child care workers4
$20,580 $22,310
Total paid early childhood workforce5
N/A 2.2 million
CCR&R CONTACTS URL Quality Care for Children
www.qualitycareforchildren.org
Child Care Aware® of America
http://usa.childcareaware.org www.childcareaware.org
3 Statistics provided by the Office of Child Care from the Child Care Development Fund, and
are derived from monthly averages. Total number of child care providers includes paid relatives and other nonregulated caregivers. U.S. Totals include all 50 states and the District of Columbia (http://www.acf.hhs.gov/programs/occ/resource/fy-2013-ccdf-data-tables-preliminary)
4 Bureau of Labor Statistics, U.S. Department of Labor, Occupational Employment Survey, May 2013 estimates. Does not include child care administrators/managers, preschool teachers, special education teachers, or self-employed workers such as family child care business owners. (http://www.bls.gov/oes/current/oes_nat.htm)
5Weiss E. & Brandon, R. N. (2010). The Economic Value of the U.S. Early Childhood Sector. Partnership for America’s Economic Success.

$7,597$6,851
$10,557
$8,625
$6,136$5,565
$6,789$6,319
$0
$2,000
$4,000
$6,000
$8,000
$10,000
$12,000
Infant Four-Year-Old
Center Accredited Center FCC Accredited FCC
$4,451$3,786
$5,935$5,048
$917 $777
$0
$2,000
$4,000
$6,000
$8,000
$10,000
$12,000
School-Aged Child
Center (9 months) FCC (9 months) Center (12 months)
FCC (12 months) Center (Summer) FCC (Summer)

POPULATION HAWAII UNITED STATES
Total residents 1,419,561 318,857,056
Children age birth to 4 years 90,316 19,757,997
Children age birth to 4 years living in poverty
12,175 4,658,187
Children age 5 to 11 121,845 28,761,402
Total families with children 123,162 33,106,587
Single parent families 32,866 10,993,697
Families in poverty 17,323 6,603,926
CHILDREN UNDER AGE 6
POTENTIALLY IN NEED OF CHILD
CARE HAWAII UNITED STATES
Children in two-parent families, both parents in labor force
36,149 8,441,764
Children in single-parent families, parent in the labor force
24,975 6,360,521
Total children under age 6 potentially needing child care
61,124 14,802,285
NUMBER OF WORKING
MOTHERS HAWAII UNITED STATES
With infants under one year 12,525 2,435,563
With any children under age 6 40,912 9,721,156
With children under age 6 only
22,714 5,422,464
With both children under age 6 AND children age 6 to 17
18,198 4,298,692
Married working mothers 61,739 15,306,983
Single working mothers 19,183 6,749,078
SPACES IN CHILD CARE PROGRAMS HAWAII Total spaces/slots 26,098
Percent of spaces in child care center programs*
91%
Percent of total spaces in licensed FCC homes
9%
Percent of total spaces in school-age care programs
0%
Percent of total spaces in other programs 0% Total spaces/slots of licensed programs 87,868
Percent of licensed spaces for infants and toddlers
29%
Percent of licensed spaces for preschool-aged children
38%
Percent of licensed spaces for school-aged children
33%
*Does not include school-aged programs
1 Unless otherwise noted, statistics in the Child Care Need sections are from the American Community Survey, U.S. Census Bureau, 2011-2013 three-year estimates (http://factfinder2.census.gov/faces/nav/jsf/pages/index.xhtml). 2 Unless otherwise noted, data for the rest of the Fact Sheet is provided by Child Care Resource and Referral Agencies for Child Care Aware® of America’s 2016 State Fact Sheet Survey. Data reflects the 2015 calendar year.
TYPES OF CHILD CARE HAWAII
Number of center-based child care programs 509 Percent of centers that are nationally accredited
37%
Do faith-based programs need to be regulated?
Yes
Number of regulated faith-based programs 378 Number of family child care (FCC) homes 415
Percent of FCC homes that are nationally accredited
1%
Number of school-aged care programs NR Number of other regulated child care centers NR Number of other regulated FCC homes NR
NUMBERS, INCOME, AND
SUPPORT OF THE CHILD CARE
WORKFORCE3 HAWAII
UNITED
STATES
Child care workers (in
centers) 2,510 573,430
Average annual income of child care workers4
$20,280 $22,310
Total paid early childhood workforce5
N/A 2.2 million
CCR&R CONTACTS URL PATCH (People Attentive to Children)
www.patchhawaii.org
Child Care Aware® of America
http://usa.childcareaware.org www.childcareaware.org
3 Statistics provided by the Office of Child Care from the Child Care Development Fund, and
are derived from monthly averages. Total number of child care providers includes paid relatives and other nonregulated caregivers. U.S. Totals include all 50 states and the District of Columbia (http://www.acf.hhs.gov/programs/occ/resource/fy-2013-ccdf-data-tables-preliminary)
4 Bureau of Labor Statistics, U.S. Department of Labor, Occupational Employment Survey, May 2013 estimates. Does not include child care administrators/managers, preschool teachers, special education teachers, or self-employed workers such as family child care business owners. (http://www.bls.gov/oes/current/oes_nat.htm)
5Weiss E. & Brandon, R. N. (2010). The Economic Value of the U.S. Early Childhood Sector. Partnership for America’s Economic Success.

$13,584
$11,232
$7,836 $7,680
$0
$2,000
$4,000
$6,000
$8,000
$10,000
$12,000
$14,000
$16,000
Infant Four-Year-Old
Center FCC
$5,805 $5,832$7,740 $7,776
$0
$5,000
$10,000
$15,000
$20,000
$25,000
$30,000
$35,000
School-Aged Child
Center (9 months) FCC (9 months) Center (12 months) FCC (12 months)

POPULATION IDAHO UNITED STATES
Total residents 1,634,464 318,857,056
Children age birth to 4 years 111,707 19,757,997
Children age birth to 4 years living in poverty
24,274 4,658,187
Children age 5 to 11 172,009 28,761,402
Total families with children 180,224 33,106,587
Single parent families 48,625 10,993,697
Families in poverty 31,172 6,603,926
CHILDREN UNDER AGE 6
POTENTIALLY IN NEED OF CHILD
CARE IDAHO UNITED STATES
Children in two-parent families, both parents in labor force
49,174 8,441,764
Children in single-parent families, parent in the labor force
24,720 6,360,521
Total children under age 6 potentially needing child care
73,894 14,802,285
NUMBER OF WORKING
MOTHERS IDAHO UNITED STATES
With infants under one year 11,954 2,435,563
With any children under age 6 45,426 9,721,156
With children under age 6 only
23,838 5,422,464
With both children under age 6 AND children age 6 to 17
21,588 4,298,692
Married working mothers 83,997 15,306,983
Single working mothers 25,833 6,749,078
SPACES IN CHILD CARE PROGRAMS IDAHO Total spaces/slots 68,886
Percent of spaces in child care center programs*
54%
Percent of total spaces in licensed FCC homes
7%
Percent of total spaces in school-age care programs
39%
Percent of total spaces in other programs 0% Total spaces/slots of licensed programs 114,724
Percent of licensed spaces for infants and toddlers
34%
Percent of licensed spaces for preschool-aged children
33%
Percent of licensed spaces for school-aged children
33%
*Does not include school-aged programs
1 Unless otherwise noted, statistics in the Child Care Need sections are from the American Community Survey, U.S. Census Bureau, 2011-2013 three-year estimates (http://factfinder2.census.gov/faces/nav/jsf/pages/index.xhtml). 2 Unless otherwise noted, data for the rest of the Fact Sheet is provided by Child Care Resource and Referral Agencies for Child Care Aware® of America’s 2016 State Fact Sheet Survey. Data reflects the 2015 calendar year.
TYPES OF CHILD CARE IDAHO
Number of center-based child care programs 675 Percent of centers that are nationally accredited
3%
Do faith-based programs need to be regulated?
Yes
Number of regulated faith-based programs 77 Number of family child care (FCC) homes 524
Percent of FCC homes that are nationally accredited
1%
Number of school-aged care programs 781 Number of other regulated child care centers 0 Number of other regulated FCC homes 0
NUMBERS, INCOME, AND
SUPPORT OF THE CHILD CARE
WORKFORCE3 IDAHO
UNITED
STATES
Child care workers (in
centers) 2,120 573,430
Average annual income of child care workers4
$19,290 $22,310
Total paid early childhood workforce5
N/A 2.2 million
CCR&R CONTACTS URL University of Idaho - IdahoSTARS
www.idahostars.org
Child Care Aware® of America
http://usa.childcareaware.org www.childcareaware.org
3 Statistics provided by the Office of Child Care from the Child Care Development Fund, and
are derived from monthly averages. Total number of child care providers includes paid relatives and other nonregulated caregivers. U.S. Totals include all 50 states and the District of Columbia (http://www.acf.hhs.gov/programs/occ/resource/fy-2013-ccdf-data-tables-preliminary)
4 Bureau of Labor Statistics, U.S. Department of Labor, Occupational Employment Survey, May 2013 estimates. Does not include child care administrators/managers, preschool teachers, special education teachers, or self-employed workers such as family child care business owners. (http://www.bls.gov/oes/current/oes_nat.htm)
5Weiss E. & Brandon, R. N. (2010). The Economic Value of the U.S. Early Childhood Sector. Partnership for America’s Economic Success.

$7,385$6,527
$10,164
$8,115
$6,563$6,061
$5,360
$0
$2,000
$4,000
$6,000
$8,000
$10,000
$12,000
Infant Four-Year-Old
Center Accredited Center FCC Accredited FCC
$4,598 $4,407
$0
$2,000
$4,000
$6,000
$8,000
$10,000
$12,000
School-Aged Child
Center (9 months) FCC (9 months)
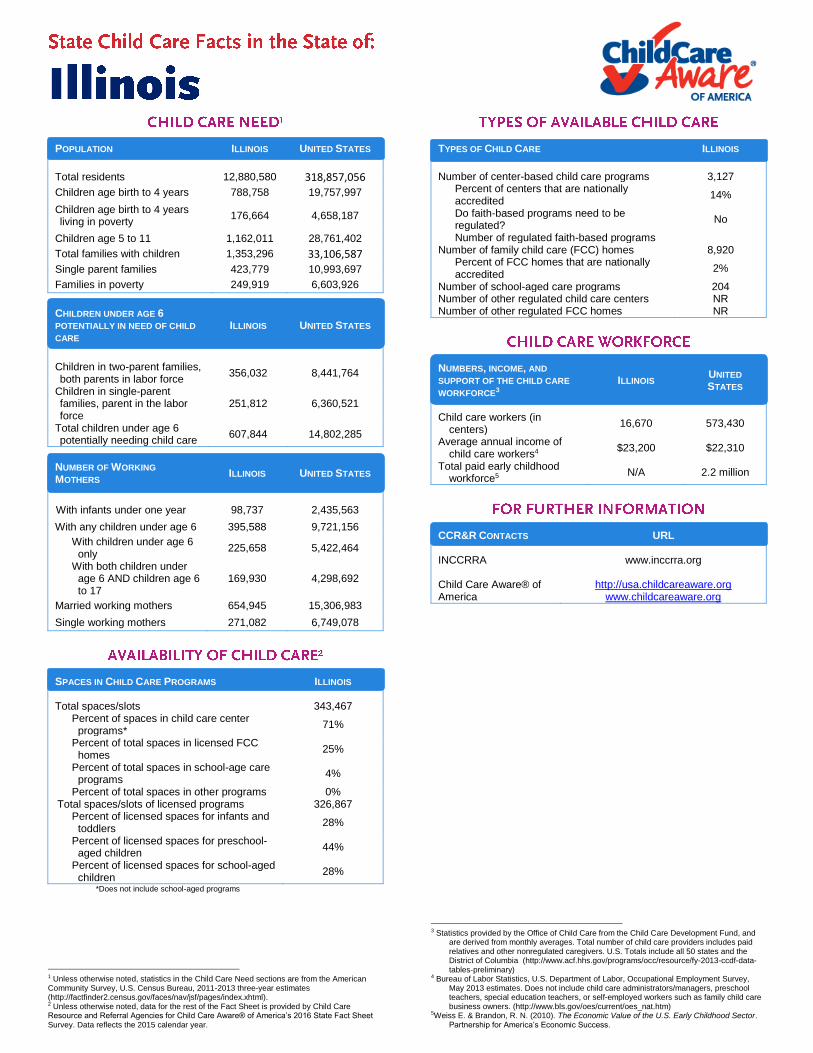
POPULATION ILLINOIS UNITED STATES
Total residents 12,880,580 318,857,056
Children age birth to 4 years 788,758 19,757,997
Children age birth to 4 years living in poverty
176,664 4,658,187
Children age 5 to 11 1,162,011 28,761,402
Total families with children 1,353,296 33,106,587
Single parent families 423,779 10,993,697
Families in poverty 249,919 6,603,926
CHILDREN UNDER AGE 6
POTENTIALLY IN NEED OF CHILD
CARE ILLINOIS UNITED STATES
Children in two-parent families, both parents in labor force
356,032 8,441,764
Children in single-parent families, parent in the labor force
251,812 6,360,521
Total children under age 6 potentially needing child care
607,844 14,802,285
NUMBER OF WORKING
MOTHERS ILLINOIS UNITED STATES
With infants under one year 98,737 2,435,563
With any children under age 6 395,588 9,721,156
With children under age 6 only
225,658 5,422,464
With both children under age 6 AND children age 6 to 17
169,930 4,298,692
Married working mothers 654,945 15,306,983
Single working mothers 271,082 6,749,078
SPACES IN CHILD CARE PROGRAMS ILLINOIS Total spaces/slots 343,467
Percent of spaces in child care center programs*
71%
Percent of total spaces in licensed FCC homes
25%
Percent of total spaces in school-age care programs
4%
Percent of total spaces in other programs 0% Total spaces/slots of licensed programs 326,867
Percent of licensed spaces for infants and toddlers
28%
Percent of licensed spaces for preschool-aged children
44%
Percent of licensed spaces for school-aged children
28%
*Does not include school-aged programs
1 Unless otherwise noted, statistics in the Child Care Need sections are from the American Community Survey, U.S. Census Bureau, 2011-2013 three-year estimates (http://factfinder2.census.gov/faces/nav/jsf/pages/index.xhtml). 2 Unless otherwise noted, data for the rest of the Fact Sheet is provided by Child Care Resource and Referral Agencies for Child Care Aware® of America’s 2016 State Fact Sheet Survey. Data reflects the 2015 calendar year.
TYPES OF CHILD CARE ILLINOIS
Number of center-based child care programs 3,127 Percent of centers that are nationally accredited
14%
Do faith-based programs need to be regulated?
No
Number of regulated faith-based programs Number of family child care (FCC) homes 8,920
Percent of FCC homes that are nationally accredited
2%
Number of school-aged care programs 204 Number of other regulated child care centers NR Number of other regulated FCC homes NR
NUMBERS, INCOME, AND
SUPPORT OF THE CHILD CARE
WORKFORCE3 ILLINOIS
UNITED
STATES
Child care workers (in
centers) 16,670 573,430
Average annual income of child care workers4
$23,200 $22,310
Total paid early childhood workforce5
N/A 2.2 million
CCR&R CONTACTS URL INCCRRA www.inccrra.org Child Care Aware® of America
http://usa.childcareaware.org www.childcareaware.org
3 Statistics provided by the Office of Child Care from the Child Care Development Fund, and
are derived from monthly averages. Total number of child care providers includes paid relatives and other nonregulated caregivers. U.S. Totals include all 50 states and the District of Columbia (http://www.acf.hhs.gov/programs/occ/resource/fy-2013-ccdf-data-tables-preliminary)
4 Bureau of Labor Statistics, U.S. Department of Labor, Occupational Employment Survey, May 2013 estimates. Does not include child care administrators/managers, preschool teachers, special education teachers, or self-employed workers such as family child care business owners. (http://www.bls.gov/oes/current/oes_nat.htm)
5Weiss E. & Brandon, R. N. (2010). The Economic Value of the U.S. Early Childhood Sector. Partnership for America’s Economic Success.

$13,176
$9,758
$14,829
$11,112
$8,157$7,575
$8,963$8,289
$0
$2,000
$4,000
$6,000
$8,000
$10,000
$12,000
$14,000
$16,000
Infant Four-Year-Old
Center Accredited Center FCC Accredited FCC
$4,618$3,740
$2,183 $1,725
$0
$2,000
$4,000
$6,000
$8,000
$10,000
$12,000
$14,000
$16,000
School-Aged Child
Center (9 months) FCC (9 months) Center (Summer) FCC (Summer)

POPULATION INDIANA UNITED STATES
Total residents 6,596,855 318,857,056
Children age birth to 4 years 417,310 19,757,997
Children age birth to 4 years living in poverty
106,695 4,658,187
Children age 5 to 11 614,952 28,761,402
Total families with children 708,919 33,106,587
Single parent families 247,814 10,993,697
Families in poverty 141,697 6,603,926
CHILDREN UNDER AGE 6
POTENTIALLY IN NEED OF CHILD
CARE INDIANA UNITED STATES
Children in two-parent families, both parents in labor force
183,879 8,441,764
Children in single-parent families, parent in the labor force
145,884 6,360,521
Total children under age 6 potentially needing child care
329,763 14,802,285
NUMBER OF WORKING
MOTHERS INDIANA UNITED STATES
With infants under one year 54,787 2,435,563
With any children under age 6 209,714 9,721,156
With children under age 6 only
112,458 5,422,464
With both children under age 6 AND children age 6 to 17
97,256 4,298,692
Married working mothers 335,963 15,306,983
Single working mothers 154,294 6,749,078
SPACES IN CHILD CARE PROGRAMS INDIANA Total spaces/slots 164,487
Percent of spaces in child care center programs*
42%
Percent of total spaces in licensed FCC homes
21%
Percent of total spaces in school-age care programs
38%
Percent of total spaces in other programs 0% Total spaces/slots of licensed programs NR
Percent of licensed spaces for infants and toddlers
NR
Percent of licensed spaces for preschool-aged children
NR
Percent of licensed spaces for school-aged children
NR
*Does not include school-aged programs
1 Unless otherwise noted, statistics in the Child Care Need sections are from the American Community Survey, U.S. Census Bureau, 2011-2013 three-year estimates (http://factfinder2.census.gov/faces/nav/jsf/pages/index.xhtml). 2 Unless otherwise noted, data for the rest of the Fact Sheet is provided by Child Care Resource and Referral Agencies for Child Care Aware® of America’s 2016 State Fact Sheet Survey. Data reflects the 2015 calendar year.
TYPES OF CHILD CARE INDIANA
Number of center-based child care programs 671 Percent of centers that are nationally accredited
27%
Do faith-based programs need to be regulated?
Yes
Number of regulated faith-based programs 695 Number of family child care (FCC) homes 2,683
Percent of FCC homes that are nationally accredited
5%
Number of school-aged care programs 750 Number of other regulated child care centers NR Number of other regulated FCC homes NR
NUMBERS, INCOME, AND
SUPPORT OF THE CHILD CARE
WORKFORCE3 INDIANA
UNITED
STATES
Child care workers (in
centers) 10,570 573,430
Average annual income of child care workers4
$20,090 $22,310
Total paid early childhood workforce5
N/A 2.2 million
CCR&R CONTACTS URL Early Learning Indiana earlylearningin.org Child Care Aware® of America
http://usa.childcareaware.org www.childcareaware.org
3 Statistics provided by the Office of Child Care from the Child Care Development Fund, and
are derived from monthly averages. Total number of child care providers includes paid relatives and other nonregulated caregivers. U.S. Totals include all 50 states and the District of Columbia (http://www.acf.hhs.gov/programs/occ/resource/fy-2013-ccdf-data-tables-preliminary)
4 Bureau of Labor Statistics, U.S. Department of Labor, Occupational Employment Survey, May 2013 estimates. Does not include child care administrators/managers, preschool teachers, special education teachers, or self-employed workers such as family child care business owners. (http://www.bls.gov/oes/current/oes_nat.htm)
5Weiss E. & Brandon, R. N. (2010). The Economic Value of the U.S. Early Childhood Sector. Partnership for America’s Economic Success.

6 Note: Indiana did not provide updated cost of care data for 2015. These figures reflect data collected in 2014 and adjusted for inflation.
$8,929
$6,768
$4,725
$6,833
$5,571
$3,061
$0
$1,000
$2,000
$3,000
$4,000
$5,000
$6,000
$7,000
$8,000
$9,000
$10,000
Infant Four-Year-Old School-Age Child
Center FCC

POPULATION IOWA UNITED STATES
Total residents 3,107,126 318,857,056
Children age birth to 4 years 193,454 19,757,997
Children age birth to 4 years living in poverty
30,978 4,658,187
Children age 5 to 11 286,850 28,761,402
Total families with children 349,168 33,106,587
Single parent families 103,185 10,993,697
Families in poverty 49,700 6,603,926
CHILDREN UNDER AGE 6
POTENTIALLY IN NEED OF CHILD
CARE IOWA UNITED STATES
Children in two-parent families, both parents in labor force
113,652 8,441,764
Children in single-parent families, parent in the labor force
57,900 6,360,521
Total children under age 6 potentially needing child care
171,552 14,802,285
NUMBER OF WORKING
MOTHERS IOWA UNITED STATES
With infants under one year 31,549 2,435,563
With any children under age 6 116,814 9,721,156
With children under age 6 only
64,882 5,422,464
With both children under age 6 AND children age 6 to 17
51,932 4,298,692
Married working mothers 198,386 15,306,983
Single working mothers 60,430 6,749,078
SPACES IN CHILD CARE PROGRAMS IOWA Total spaces/slots 161,356
Percent of spaces in child care center programs*
64%
Percent of total spaces in licensed FCC homes
21%
Percent of total spaces in school-age care programs
15%
Percent of total spaces in other programs 6% Total spaces/slots of licensed programs NR
Percent of licensed spaces for infants and toddlers
NR
Percent of licensed spaces for preschool-aged children
NR
Percent of licensed spaces for school-aged children
NR
*Does not include school-aged programs
1 Unless otherwise noted, statistics in the Child Care Need sections are from the American Community Survey, U.S. Census Bureau, 2011-2013 three-year estimates (http://factfinder2.census.gov/faces/nav/jsf/pages/index.xhtml). 2 Unless otherwise noted, data for the rest of the Fact Sheet is provided by Child Care Resource and Referral Agencies for Child Care Aware® of America’s 2016 State Fact Sheet Survey. Data reflects the 2015 calendar year.
TYPES OF CHILD CARE IOWA
Number of center-based child care programs 1,694 Percent of centers that are nationally accredited
8%
Do faith-based programs need to be regulated?
Yes
Number of regulated faith-based programs NR Number of family child care (FCC) homes 3,131
Percent of FCC homes that are nationally accredited
0%
Number of school-aged care programs 289 Number of other regulated child care centers 0 Number of other regulated FCC homes 1,834
NUMBERS, INCOME, AND
SUPPORT OF THE CHILD CARE
WORKFORCE3 IOWA
UNITED
STATES
Child care workers (in
centers) 7,280 573,430
Average annual income of child care workers4
$18,930 $22,310
Total paid early childhood workforce5
N/A 2.2 million
CCR&R CONTACTS URL Child Care Resource & Referral of Northwest Iowa - Mid-Sioux Opportunity, Inc.
www.iowaccrr.org
Child Care Aware® of America
http://usa.childcareaware.org www.childcareaware.org
3 Statistics provided by the Office of Child Care from the Child Care Development Fund, and
are derived from monthly averages. Total number of child care providers includes paid relatives and other nonregulated caregivers. U.S. Totals include all 50 states and the District of Columbia (http://www.acf.hhs.gov/programs/occ/resource/fy-2013-ccdf-data-tables-preliminary)
4 Bureau of Labor Statistics, U.S. Department of Labor, Occupational Employment Survey, May 2013 estimates. Does not include child care administrators/managers, preschool teachers, special education teachers, or self-employed workers such as family child care business owners. (http://www.bls.gov/oes/current/oes_nat.htm)
5Weiss E. & Brandon, R. N. (2010). The Economic Value of the U.S. Early Childhood Sector. Partnership for America’s Economic Success.

$10,015
$8,433
$12,860
$9,824
$6,944 $6,593$7,107 $7,150
$0
$2,000
$4,000
$6,000
$8,000
$10,000
$12,000
$14,000
Infant Four-Year-Old
Center Accredited Center FCC Accredited FCC
$3,053$2,395
$7,243
$6,085
$0
$2,000
$4,000
$6,000
$8,000
$10,000
$12,000
$14,000
School-Aged Child
Center (9 months) FCC (9 months) Center (12 months) FCC (12 months)

POPULATION KANSAS UNITED STATES
Total residents 2,904,021 318,857,056
Children age birth to 4 years 199,348 19,757,997
Children age birth to 4 years living in poverty
38,045 4,658,187
Children age 5 to 11 283,455 28,761,402
Total families with children 326,391 33,106,587
Single parent families 98,570 10,993,697
Families in poverty 52,328 6,603,926
CHILDREN UNDER AGE 6
POTENTIALLY IN NEED OF CHILD
CARE KANSAS UNITED STATES
Children in two-parent families, both parents in labor force
96,305 8,441,764
Children in single-parent families, parent in the labor force
60,674 6,360,521
Total children under age 6 potentially needing child care
156,979 14,802,285
NUMBER OF WORKING
MOTHERS KANSAS UNITED STATES
With infants under one year 24,304 2,435,563
With any children under age 6 101,492 9,721,156
With children under age 6 only
55,076 5,422,464
With both children under age 6 AND children age 6 to 17
46,416 4,298,692
Married working mothers 163,528 15,306,983
Single working mothers 58,339 6,749,078
SPACES IN CHILD CARE PROGRAMS KANSAS Total spaces/slots 129,099
Percent of spaces in child care center programs*
40%
Percent of total spaces in licensed FCC homes
36%
Percent of total spaces in school-age care programs
24%
Percent of total spaces in other programs 0% Total spaces/slots of licensed programs 192,111
Percent of licensed spaces for infants and toddlers
34%
Percent of licensed spaces for preschool-aged children
28%
Percent of licensed spaces for school-aged children
39%
*Does not include school-aged programs
1 Unless otherwise noted, statistics in the Child Care Need sections are from the American Community Survey, U.S. Census Bureau, 2011-2013 three-year estimates (http://factfinder2.census.gov/faces/nav/jsf/pages/index.xhtml). 2 Unless otherwise noted, data for the rest of the Fact Sheet is provided by Child Care Resource and Referral Agencies for Child Care Aware® of America’s 2016 State Fact Sheet Survey. Data reflects the 2015 calendar year.
TYPES OF CHILD CARE KANSAS
Number of center-based child care programs 823 Percent of centers that are nationally accredited
4%
Do faith-based programs need to be regulated?
Yes
Number of regulated faith-based programs N/R Number of family child care (FCC) homes 4,419
Percent of FCC homes that are nationally accredited
<1%
Number of school-aged care programs 350 Number of other regulated child care centers 0 Number of other regulated FCC homes 0
NUMBERS, INCOME, AND
SUPPORT OF THE CHILD CARE
WORKFORCE3 KANSAS
UNITED
STATES
Child care workers (in
centers) 5,570 573,430
Average annual income of child care workers4
$19,840 $22,310
Total paid early childhood workforce5
N/A 2.2 million
CCR&R CONTACTS URL Child Care Aware of Kansas
www.ks.childcareaware.org
Child Care Aware® of America
http://usa.childcareaware.org www.childcareaware.org
3 Statistics provided by the Office of Child Care from the Child Care Development Fund, and
are derived from monthly averages. Total number of child care providers includes paid relatives and other nonregulated caregivers. U.S. Totals include all 50 states and the District of Columbia (http://www.acf.hhs.gov/programs/occ/resource/fy-2013-ccdf-data-tables-preliminary)
4 Bureau of Labor Statistics, U.S. Department of Labor, Occupational Employment Survey, May 2013 estimates. Does not include child care administrators/managers, preschool teachers, special education teachers, or self-employed workers such as family child care business owners. (http://www.bls.gov/oes/current/oes_nat.htm)
5Weiss E. & Brandon, R. N. (2010). The Economic Value of the U.S. Early Childhood Sector. Partnership for America’s Economic Success.

$11,482
$8,065
$14,483
$9,315
$6,830$6,005
$8,450$7,150
$0
$2,000
$4,000
$6,000
$8,000
$10,000
$12,000
$14,000
$16,000
Infant Four-Year-Old
Center Accredited Center FCC Accredited FCC
$3,226$2,485
$6,468$5,384
$1,164
$0
$2,000
$4,000
$6,000
$8,000
$10,000
$12,000
$14,000
$16,000
School-Aged Child
Center (9 months) FCC (9 months) Center (12 months)
FCC (12 months) Center (Summer)

POPULATION KENTUCKY UNITED STATES
Total residents 4,413,457 318,857,056
Children age birth to 4 years 274,632 19,757,997
Children age birth to 4 years living in poverty
80,612 4,658,187
Children age 5 to 11 400,053 28,761,402
Total families with children 464,816 33,106,587
Single parent families 157,134 10,993,697
Families in poverty 119,432 6,603,926
CHILDREN UNDER AGE 6
POTENTIALLY IN NEED OF CHILD
CARE KENTUCKY UNITED STATES
Children in two-parent families, both parents in labor force
113,225 8,441,764
Children in single-parent families, parent in the labor force
85,669 6,360,521
Total children under age 6 potentially needing child care
198,894 14,802,285
NUMBER OF WORKING
MOTHERS KENTUCKY UNITED STATES
With infants under one year 35,241 2,435,563
With any children under age 6 134,809 9,721,156
With children under age 6 only
78,479 5,422,464
With both children under age 6 AND children age 6 to 17
56,330 4,298,692
Married working mothers 215,430 15,306,983
Single working mothers 90,263 6,749,078
SPACES IN CHILD CARE PROGRAMS KENTUCKY Total spaces/slots 199,911
Percent of spaces in child care center programs*
83%
Percent of total spaces in licensed FCC homes
1%
Percent of total spaces in school-age care programs
16%
Percent of total spaces in other programs NR Total spaces/slots of licensed programs NR
Percent of licensed spaces for infants and toddlers
NR
Percent of licensed spaces for preschool-aged children
NR
Percent of licensed spaces for school-aged children
NR
*Does not include school-aged programs
1 Unless otherwise noted, statistics in the Child Care Need sections are from the American Community Survey, U.S. Census Bureau, 2011-2013 three-year estimates (http://factfinder2.census.gov/faces/nav/jsf/pages/index.xhtml). 2 Unless otherwise noted, data for the rest of the Fact Sheet is provided by Child Care Resource and Referral Agencies for Child Care Aware® of America’s 2016 State Fact Sheet Survey. Data reflects the 2015 calendar year.
TYPES OF CHILD CARE KENTUCKY
Number of center-based child care programs 2,269 Percent of centers that are nationally accredited
4%
Do faith-based programs need to be regulated?
Yes
Number of regulated faith-based programs NR Number of family child care (FCC) homes 298
Percent of FCC homes that are nationally accredited
0%
Number of school-aged care programs 267 Number of other regulated child care centers NR Number of other regulated FCC homes NR
NUMBERS, INCOME, AND
SUPPORT OF THE CHILD CARE
WORKFORCE3 KENTUCKY
UNITED
STATES
Child care workers (in
centers) 12,670 573,430
Average annual income of child care workers4
$20,200 $22,310
Total paid early childhood workforce5
N/A 2.2 million
CCR&R
CONTACTS URL
NR https://www.kentuckypartnership.org/home/Main Child Care Aware® of America
http://usa.childcareaware.org www.childcareaware.org
3 Statistics provided by the Office of Child Care from the Child Care Development Fund, and
are derived from monthly averages. Total number of child care providers includes paid relatives and other nonregulated caregivers. U.S. Totals include all 50 states and the District of Columbia (http://www.acf.hhs.gov/programs/occ/resource/fy-2013-ccdf-data-tables-preliminary)
4 Bureau of Labor Statistics, U.S. Department of Labor, Occupational Employment Survey, May 2013 estimates. Does not include child care administrators/managers, preschool teachers, special education teachers, or self-employed workers such as family child care business owners. (http://www.bls.gov/oes/current/oes_nat.htm)
5Weiss E. & Brandon, R. N. (2010). The Economic Value of the U.S. Early Childhood Sector. Partnership for America’s Economic Success.

$7,800
$7,020$6,500
$5,720
$0
$1,000
$2,000
$3,000
$4,000
$5,000
$6,000
$7,000
$8,000
$9,000
Infant Four-Year-Old
Center FCC
$3,510 $3,315
$6,500
$5,200
$1,625 $1,527
$0
$1,000
$2,000
$3,000
$4,000
$5,000
$6,000
$7,000
$8,000
$9,000
School-Aged Child
Center (9 months) FCC (9 months) Center (12 months)
FCC (12 months) Center (Summer) FCC (Summer)

POPULATION LOUISIANA UNITED STATES
Total residents 4,649,676 318,857,056
Children age birth to 4 years 305,453 19,757,997
Children age birth to 4 years living in poverty
95,165 4,658,187
Children age 5 to 11 440,357 28,761,402
Total families with children 468,682 33,106,587
Single parent families 197,638 10,993,697
Families in poverty 122,754 6,603,926
CHILDREN UNDER AGE 6
POTENTIALLY IN NEED OF CHILD
CARE LOUISIANA UNITED STATES
Children in two-parent families, both parents in labor force
107,300 8,441,764
Children in single-parent families, parent in the labor force
127,492 6,360,521
Total children under age 6 potentially needing child care
234,792 14,802,285
NUMBER OF WORKING
MOTHERS LOUISIANA UNITED STATES
With infants under one year 34,324 2,435,563
With any children under age 6 151,939 9,721,156
With children under age 6 only
82,190 5,422,464
With both children under age 6 AND children age 6 to 17
69,749 4,298,692
Married working mothers 183,566 15,306,983
Single working mothers 122,832 6,749,078
SPACES IN CHILD CARE PROGRAMS LOUISIANA Total spaces/slots NR
Percent of spaces in child care center programs*
NR
Percent of total spaces in licensed FCC homes
NR
Percent of total spaces in school-age care programs
NR
Percent of total spaces in other programs NR Total spaces/slots of licensed programs NR
Percent of licensed spaces for infants and toddlers
NR
Percent of licensed spaces for preschool-aged children
NR
Percent of licensed spaces for school-aged children
NR
*Does not include school-aged programs
1 Unless otherwise noted, statistics in the Child Care Need sections are from the American Community Survey, U.S. Census Bureau, 2011-2013 three-year estimates (http://factfinder2.census.gov/faces/nav/jsf/pages/index.xhtml). 2 Unless otherwise noted, data for the rest of the Fact Sheet is provided by Child Care Resource and Referral Agencies for Child Care Aware® of America’s 2016 State Fact Sheet Survey. Data reflects the 2015 calendar year.
TYPES OF CHILD CARE LOUISIANA
Number of center-based child care programs 1,524 Percent of centers that are nationally accredited
2%
Do faith-based programs need to be regulated?
Yes
Number of regulated faith-based programs 169 Number of family child care (FCC) homes 0
Percent of FCC homes that are nationally accredited
0%
Number of school-aged care programs 55 Number of other regulated child care centers 0 Number of other regulated FCC homes 467
NUMBERS, INCOME, AND
SUPPORT OF THE CHILD CARE
WORKFORCE3 LOUISIANA
UNITED
STATES
Child care workers (in
centers) 8,270 573,430
Average annual income of child care workers4
$18,870 $22,310
Total paid early childhood workforce5
N/A 2.2 million
CCR&R CONTACTS URL NR www.louisianabelieves.com Child Care Aware® of America
http://usa.childcareaware.org www.childcareaware.org
3 Statistics provided by the Office of Child Care from the Child Care Development Fund, and
are derived from monthly averages. Total number of child care providers includes paid relatives and other nonregulated caregivers. U.S. Totals include all 50 states and the District of Columbia (http://www.acf.hhs.gov/programs/occ/resource/fy-2013-ccdf-data-tables-preliminary)
4 Bureau of Labor Statistics, U.S. Department of Labor, Occupational Employment Survey, May 2013 estimates. Does not include child care administrators/managers, preschool teachers, special education teachers, or self-employed workers such as family child care business owners. (http://www.bls.gov/oes/current/oes_nat.htm)
5Weiss E. & Brandon, R. N. (2010). The Economic Value of the U.S. Early Childhood Sector. Partnership for America’s Economic Success.

$5,754
$4,920$4,849 $4,673
$0
$1,000
$2,000
$3,000
$4,000
$5,000
$6,000
$7,000
Infant Four-Year-Old
Center FCC
$1,105
$2,029
$0
$500
$1,000
$1,500
$2,000
$2,500
School-Aged Child
Center (9 months) FCC (9 months)

POPULATION MAINE UNITED STATES
Total residents 1,330,089 318,857,056
Children age birth to 4 years 62,882 19,757,997
Children age birth to 4 years living in poverty
15,507 4,658,187
Children age 5 to 11 101,384 28,761,402
Total families with children 129,124 33,106,587
Single parent families 47,047 10,993,697
Families in poverty 24,997 6,603,926
CHILDREN UNDER AGE 6
POTENTIALLY IN NEED OF CHILD
CARE MAINE UNITED STATES
Children in two-parent families, both parents in labor force
28,394 8,441,764
Children in single-parent families, parent in the labor force
20,820 6,360,521
Total children under age 6 potentially needing child care
49,214 14,802,285
NUMBER OF WORKING
MOTHERS MAINE UNITED STATES
With infants under one year 9,192 2,435,563
With any children under age 6 32,854 9,721,156
With children under age 6 only
19,469 5,422,464
With both children under age 6 AND children age 6 to 17
13,385 4,298,692
Married working mothers 62,794 15,306,983
Single working mothers 25,386 6,749,078
SPACES IN CHILD CARE PROGRAMS MAINE Total spaces/slots NR
Percent of spaces in child care center programs*
NR
Percent of total spaces in licensed FCC homes
NR
Percent of total spaces in school-age care programs
NR
Percent of total spaces in other programs NR Total spaces/slots of licensed programs NR
Percent of licensed spaces for infants and toddlers
NR
Percent of licensed spaces for preschool-aged children
NR
Percent of licensed spaces for school-aged children
NR
*Does not include school-aged programs
1 Unless otherwise noted, statistics in the Child Care Need sections are from the American Community Survey, U.S. Census Bureau, 2011-2013 three-year estimates (http://factfinder2.census.gov/faces/nav/jsf/pages/index.xhtml). 2 Unless otherwise noted, data for the rest of the Fact Sheet is provided by Child Care Resource and Referral Agencies for Child Care Aware® of America’s 2016 State Fact Sheet Survey. Data reflects the 2015 calendar year.
TYPES OF CHILD CARE MAINE
Number of center-based child care programs NR Percent of centers that are nationally accredited
NR
Do faith-based programs need to be regulated?
NR
Number of regulated faith-based programs NR Number of family child care (FCC) homes NR
Percent of FCC homes that are nationally accredited
NR
Number of school-aged care programs NR Number of other regulated child care centers NR Number of other regulated FCC homes NR
NUMBERS, INCOME, AND
SUPPORT OF THE CHILD CARE
WORKFORCE3 MAINE
UNITED
STATES
Child care workers (in
centers) 2,830 573,430
Average annual income of child care workers4
$22,190 $22,310
Total paid early childhood workforce5
N/A 2.2 million
CCR&R CONTACTS
Department of Health and Human Services Office of Child and Family Services
http://www.childcarechoices.me/SearchForChildcare.aspx
Child Care Aware® of America http://usa.childcareaware.org
www.childcareaware.org
3 Statistics provided by the Office of Child Care from the Child Care Development Fund, and
are derived from monthly averages. Total number of child care providers includes paid relatives and other nonregulated caregivers. U.S. Totals include all 50 states and the District of Columbia (http://www.acf.hhs.gov/programs/occ/resource/fy-2013-ccdf-data-tables-preliminary)
4 Bureau of Labor Statistics, U.S. Department of Labor, Occupational Employment Survey, May 2013 estimates. Does not include child care administrators/managers, preschool teachers, special education teachers, or self-employed workers such as family child care business owners. (http://www.bls.gov/oes/current/oes_nat.htm)
5Weiss E. & Brandon, R. N. (2010). The Economic Value of the U.S. Early Childhood Sector. Partnership for America’s Economic Success.

6 Note: Maine did not provide updated cost of care data for 2015. These figures reflect data collected in 2014 and adjusted for inflation.
$9,677
$6,989
$4,516
$6,989$6,719
$3,830
$0
$1,000
$2,000
$3,000
$4,000
$5,000
$6,000
$7,000
$8,000
$9,000
$10,000
Infant Four-Year-Old School-Age Child
Center FCC

POPULATION MARYLAND UNITED STATES
Total residents 5,976,407 318,857,056
Children age birth to 4 years 367,283 19,757,997
Children age birth to 4 years living in poverty
48,634 4,658,187
Children age 5 to 11 517,118 28,761,402
Total families with children 626,666 33,106,587
Single parent families 209,436 10,993,697
Families in poverty 75,216 6,603,926
CHILDREN UNDER AGE 6
POTENTIALLY IN NEED OF CHILD
CARE MARYLAND UNITED STATES
Children in two-parent families, both parents in labor force
180,448 8,441,764
Children in single-parent families, parent in the labor force
125,831 6,360,521
Total children under age 6 potentially needing child care
306,279 14,802,285
NUMBER OF WORKING
MOTHERS MARYLAND UNITED STATES
With infants under one year 48,558 2,435,563
With any children under age 6 202,212 9,721,156
With children under age 6 only
116,899 5,422,464
With both children under age 6 AND children age 6 to 17
85,313 4,298,692
Married working mothers 316,769 15,306,983
Single working mothers 138,148 6,749,078
SPACES IN CHILD CARE PROGRAMS MARYLAND Total spaces/slots 252,248
Percent of spaces in child care center programs*
66%
Percent of total spaces in licensed FCC homes
20%
Percent of total spaces in school-age care programs
14%
Percent of total spaces in other programs 0% Total spaces/slots of licensed programs 252,248
Percent of licensed spaces for infants and toddlers
10%
Percent of licensed spaces for preschool-aged children
76%
Percent of licensed spaces for school-aged children
14%
*Does not include school-aged programs
1 Unless otherwise noted, statistics in the Child Care Need sections are from the American Community Survey, U.S. Census Bureau, 2011-2013 three-year estimates (http://factfinder2.census.gov/faces/nav/jsf/pages/index.xhtml). 2 Unless otherwise noted, data for the rest of the Fact Sheet is provided by Child Care Resource and Referral Agencies for Child Care Aware® of America’s 2016 State Fact Sheet Survey. Data reflects the 2015 calendar year.
TYPES OF CHILD CARE MARYLAND
Number of center-based child care programs 3,501 Percent of centers that are nationally accredited
5%
Do faith-based programs need to be regulated?
Yes
Number of regulated faith-based programs 218 Number of family child care (FCC) homes 6,533
Percent of FCC homes that are nationally accredited
2%
Number of school-aged care programs 620 Number of other regulated child care centers NR Number of other regulated FCC homes NR
NUMBERS, INCOME, AND
SUPPORT OF THE CHILD CARE
WORKFORCE3 MARYLAND
UNITED
STATES
Child care workers (in
centers) 9,310 573,430
Average annual income of child care workers4
$24,440 $22,310
Total paid early childhood workforce5
N/A 2.2 million
CCR&R CONTACTS URL NR www.marylandfamilynetwork.org Child Care Aware® of America
http://usa.childcareaware.org www.childcareaware.org
3 Statistics provided by the Office of Child Care from the Child Care Development Fund, and
are derived from monthly averages. Total number of child care providers includes paid relatives and other nonregulated caregivers. U.S. Totals include all 50 states and the District of Columbia (http://www.acf.hhs.gov/programs/occ/resource/fy-2013-ccdf-data-tables-preliminary)
4 Bureau of Labor Statistics, U.S. Department of Labor, Occupational Employment Survey, May 2013 estimates. Does not include child care administrators/managers, preschool teachers, special education teachers, or self-employed workers such as family child care business owners. (http://www.bls.gov/oes/current/oes_nat.htm)
5Weiss E. & Brandon, R. N. (2010). The Economic Value of the U.S. Early Childhood Sector. Partnership for America’s Economic Success.

$14,726
$10,039
$18,597
$12,608
$10,149
$8,338
$11,875
$9,569
$0
$2,000
$4,000
$6,000
$8,000
$10,000
$12,000
$14,000
$16,000
$18,000
$20,000
Infant Four-Year-Old
Center Accredited Center FCC Accredited FCC
$4,423 $3,784
$6,440$5,565
$0
$2,000
$4,000
$6,000
$8,000
$10,000
$12,000
$14,000
$16,000
$18,000
$20,000
School-Aged Child
Center (9 months) FCC (9 months) Center (12 months) FCC (12 months)

POPULATION MASSACHUSETTS UNITED STATES
Total residents 6,745,408 318,857,056
Children age birth to 4 years 364,441 19,757,997
Children age birth to 4 years living in poverty
61,148 4,658,187
Children age 5 to 11 527,286 28,761,402
Total families with children 697,497 33,106,587
Single parent families 217,696 10,993,697
Families in poverty 99,860 6,603,926
CHILDREN UNDER AGE 6
POTENTIALLY IN NEED OF
CHILD CARE MASSACHUSETTS UNITED STATES
Children in two-parent families, both parents in labor force
191,294 8,441,764
Children in single-parent families, parent in the labor force
109,782 6,360,521
Total children under age 6 potentially needing child care
301,076 14,802,285
NUMBER OF WORKING
MOTHERS MASSACHUSETTS UNITED STATES
With infants under one year 51,214 2,435,563
With any children under age 6
208,482 9,721,156
With children under age 6 only
126,156 5,422,464
With both children under age 6 AND children age 6 to 17
82,326 4,298,692
Married working mothers 363,273 15,306,983
Single working mothers 144,723 6,749,078
SPACES IN CHILD CARE PROGRAMS MASSACHUSETTS Total spaces/slots 271,322
Percent of spaces in child care center programs*
51%
Percent of total spaces in licensed FCC homes
17%
Percent of total spaces in school-age care programs
15%
Percent of total spaces in other programs 17% Total spaces/slots of licensed programs 203,912
Percent of licensed spaces for infants and toddlers
23%
Percent of licensed spaces for preschool-aged children
49%
Percent of licensed spaces for school-aged children
28%
*Does not include school-aged programs
1 Unless otherwise noted, statistics in the Child Care Need sections are from the American Community Survey, U.S. Census Bureau, 2011-2013 three-year estimates (http://factfinder2.census.gov/faces/nav/jsf/pages/index.xhtml). 2 Unless otherwise noted, data for the rest of the Fact Sheet is provided by Child Care Resource and Referral Agencies for Child Care Aware® of America’s 2016 State Fact Sheet Survey. Data reflects the 2015 calendar year.
TYPES OF CHILD CARE MASSACHUSETTS
Number of center-based child care programs 2,182 Percent of centers that are nationally accredited
30%
Do faith-based programs need to be regulated?
No
Number of regulated faith-based programs Number of family child care (FCC) homes 6,080
Percent of FCC homes that are nationally accredited
4%
Number of school-aged care programs 788 Number of other regulated child care centers 873 Number of other regulated FCC homes 0
NUMBERS, INCOME, AND
SUPPORT OF THE CHILD CARE
WORKFORCE3 MASSACHUSETTS
UNITED
STATES
Child care workers (in
centers) 12,320 573,430
Average annual income of child care workers4
$26,330 $22,310
Total paid early childhood workforce5
N/A 2.2 million
CCR&R CONTACTS URL Kim Dion www.machildcareresourcesonline.org Child Care Aware® of America
http://usa.childcareaware.org www.childcareaware.org
3 Statistics provided by the Office of Child Care from the Child Care Development Fund, and
are derived from monthly averages. Total number of child care providers includes paid relatives and other nonregulated caregivers. U.S. Totals include all 50 states and the District of Columbia (http://www.acf.hhs.gov/programs/occ/resource/fy-2013-ccdf-data-tables-preliminary)
4 Bureau of Labor Statistics, U.S. Department of Labor, Occupational Employment Survey, May 2013 estimates. Does not include child care administrators/managers, preschool teachers, special education teachers, or self-employed workers such as family child care business owners. (http://www.bls.gov/oes/current/oes_nat.htm)
5Weiss E. & Brandon, R. N. (2010). The Economic Value of the U.S. Early Childhood Sector. Partnership for America’s Economic Success.

6 Note: Massachusetts did not provide updated cost of care data for 2015. These figures reflect data collected in 2014 and adjusted for inflation.
$17,082
$12,796
$3,418
$10,679$10,012
$3,960
$0
$2,000
$4,000
$6,000
$8,000
$10,000
$12,000
$14,000
$16,000
$18,000
Infant Four-Year-Old School-Age Child
Center FCC

POPULATION MICHIGAN UNITED STATES
Total residents 9,909,877 318,857,056
Children age birth to 4 years 568,712 19,757,997
Children age birth to 4 years living in poverty
145,517 4,658,187
Children age 5 to 11 859,172 28,761,402
Total families with children 1,027,462 33,106,587
Single parent families 355,769 10,993,697
Families in poverty 213,550 6,603,926
CHILDREN UNDER AGE 6
POTENTIALLY IN NEED OF CHILD
CARE MICHIGAN UNITED STATES
Children in two-parent families, both parents in labor force
245,500 8,441,764
Children in single-parent families, parent in the labor force
193,859 6,360,521
Total children under age 6 potentially needing child care
439,359 14,802,285
NUMBER OF WORKING
MOTHERS MICHIGAN UNITED STATES
With infants under one year 81,285 2,435,563
With any children under age 6 291,786 9,721,156
With children under age 6 only
166,751 5,422,464
With both children under age 6 AND children age 6 to 17
125,035 4,298,692
Married working mothers 479,340 15,306,983
Single working mothers 215,657 6,749,078
SPACES IN CHILD CARE PROGRAMS MICHIGAN Total spaces/slots NR
Percent of spaces in child care center programs*
NR
Percent of total spaces in licensed FCC homes
NR
Percent of total spaces in school-age care programs
NR
Percent of total spaces in other programs NR Total spaces/slots of licensed programs NR
Percent of licensed spaces for infants and toddlers
NR
Percent of licensed spaces for preschool-aged children
NR
Percent of licensed spaces for school-aged children
NR
*Does not include school-aged programs
1 Unless otherwise noted, statistics in the Child Care Need sections are from the American Community Survey, U.S. Census Bureau, 2011-2013 three-year estimates (http://factfinder2.census.gov/faces/nav/jsf/pages/index.xhtml). 2 Unless otherwise noted, data for the rest of the Fact Sheet is provided by Child Care Resource and Referral Agencies for Child Care Aware® of America’s 2016 State Fact Sheet Survey. Data reflects the 2015 calendar year.
TYPES OF CHILD CARE MICHIGAN
Number of center-based child care programs NR Percent of centers that are nationally accredited
NR
Do faith-based programs need to be regulated?
NR
Number of regulated faith-based programs NR Number of family child care (FCC) homes NR
Percent of FCC homes that are nationally accredited
NR
Number of school-aged care programs NR Number of other regulated child care centers NR Number of other regulated FCC homes NR
NUMBERS, INCOME, AND
SUPPORT OF THE CHILD CARE
WORKFORCE3 MICHIGAN
UNITED
STATES
Child care workers (in
centers) 16,990 573,430
Average annual income of child care workers4
$22,140 $22,310
Total paid early childhood workforce5
N/A 2.2 million
CCR&R CONTACTS URL NR NR Child Care Aware® of America
http://usa.childcareaware.org www.childcareaware.org
3 Statistics provided by the Office of Child Care from the Child Care Development Fund, and
are derived from monthly averages. Total number of child care providers includes paid relatives and other nonregulated caregivers. U.S. Totals include all 50 states and the District of Columbia (http://www.acf.hhs.gov/programs/occ/resource/fy-2013-ccdf-data-tables-preliminary)
4 Bureau of Labor Statistics, U.S. Department of Labor, Occupational Employment Survey, May 2013 estimates. Does not include child care administrators/managers, preschool teachers, special education teachers, or self-employed workers such as family child care business owners. (http://www.bls.gov/oes/current/oes_nat.htm)
5Weiss E. & Brandon, R. N. (2010). The Economic Value of the U.S. Early Childhood Sector. Partnership for America’s Economic Success.

6 Note: Massachusetts did not provide updated cost of care data for 2015. These figures reflect data collected in 2014 and adjusted for inflation.
$9,894
$6,772
$4,212
$6,772 $6,560
$4,139
$0
$2,000
$4,000
$6,000
$8,000
$10,000
$12,000
Infant Four-Year-Old School-Age Child
Center FCC

POPULATION MINNESOTA UNITED STATES
Total residents 5,457,173 318,857,056
Children age birth to 4 years 346,825 19,757,997
Children age birth to 4 years living in poverty
58,603 4,658,187
Children age 5 to 11 508,125 28,761,402
Total families with children 604,987 33,106,587
Single parent families 174,462 10,993,697
Families in poverty 80,707 6,603,926
CHILDREN UNDER AGE 6
POTENTIALLY IN NEED OF CHILD
CARE MINNESOTA UNITED STATES
Children in two-parent families, both parents in labor force
210,973 8,441,764
Children in single-parent families, parent in the labor force
90,827 6,360,521
Total children under age 6 potentially needing child care
301,800 14,802,285
NUMBER OF WORKING
MOTHERS MINNESOTA UNITED STATES
With infants under one year 57,190 2,435,563
With any children under age 6 200,433 9,721,156
With children under age 6 only
114,324 5,422,464
With both children under age 6 AND children age 6 to 17
86,109 4,298,692
Married working mothers 346,078 15,306,983
Single working mothers 104,670 6,749,078
SPACES IN CHILD CARE PROGRAMS MINNESOTA Total spaces/slots 265,553
Percent of spaces in child care center programs*
45%
Percent of total spaces in licensed FCC homes
40%
Percent of total spaces in school-age care programs
15%
Percent of total spaces in other programs 0% Total spaces/slots of licensed programs 265,553
Percent of licensed spaces for infants and toddlers
NR
Percent of licensed spaces for preschool-aged children
NR
Percent of licensed spaces for school-aged children
NR
*Does not include school-aged programs
1 Unless otherwise noted, statistics in the Child Care Need sections are from the American Community Survey, U.S. Census Bureau, 2011-2013 three-year estimates (http://factfinder2.census.gov/faces/nav/jsf/pages/index.xhtml). 2 Unless otherwise noted, data for the rest of the Fact Sheet is provided by Child Care Resource and Referral Agencies for Child Care Aware® of America’s 2016 State Fact Sheet Survey. Data reflects the 2015 calendar year.
TYPES OF CHILD CARE MINNESOTA
Number of center-based child care programs 1,654 Percent of centers that are nationally accredited
28%
Do faith-based programs need to be regulated?
Yes
Number of regulated faith-based programs 0 Number of family child care (FCC) homes 9,249
Percent of FCC homes that are nationally accredited
<1%
Number of school-aged care programs 520 Number of other regulated child care centers NR Number of other regulated FCC homes NR
NUMBERS, INCOME, AND
SUPPORT OF THE CHILD CARE
WORKFORCE3 MINNESOTA
UNITED
STATES
Child care workers (in
centers) 9,580 573,430
Average annual income of child care workers4
$23,450 $22,310
Total paid early childhood workforce5
N/A 2.2 million
CCR&R CONTACTS URL Child Care Aware of Minnesota
www.childcareawaremn.org
Child Care Aware® of America
http://usa.childcareaware.org www.childcareaware.org
3 Statistics provided by the Office of Child Care from the Child Care Development Fund, and
are derived from monthly averages. Total number of child care providers includes paid relatives and other nonregulated caregivers. U.S. Totals include all 50 states and the District of Columbia (http://www.acf.hhs.gov/programs/occ/resource/fy-2013-ccdf-data-tables-preliminary)
4 Bureau of Labor Statistics, U.S. Department of Labor, Occupational Employment Survey, May 2013 estimates. Does not include child care administrators/managers, preschool teachers, special education teachers, or self-employed workers such as family child care business owners. (http://www.bls.gov/oes/current/oes_nat.htm)
5Weiss E. & Brandon, R. N. (2010). The Economic Value of the U.S. Early Childhood Sector. Partnership for America’s Economic Success.

$14,826
$11,420
$17,442
$13,174
$8,033$7,295
$10,362$8,909
$0
$2,000
$4,000
$6,000
$8,000
$10,000
$12,000
$14,000
$16,000
$18,000
$20,000
Infant Four-Year-Old
Center Accredited Center FCC Accredited FCC
$9,457
$6,556
$0
$1,000
$2,000
$3,000
$4,000
$5,000
$6,000
$7,000
$8,000
$9,000
$10,000
School-Aged Child
Center (12 months) FCC (12 months)

POPULATION MISSISSIPPI UNITED STATES
Total residents 2,994,079 318,857,056
Children age birth to 4 years 192,007 19,757,997
Children age birth to 4 years living in poverty
59,634 4,658,187
Children age 5 to 11 287,678 28,761,402
Total families with children 305,689 33,106,587
Single parent families 131,687 10,993,697
Families in poverty 90,403 6,603,926
CHILDREN UNDER AGE 6
POTENTIALLY IN NEED OF CHILD
CARE MISSISSIPPI UNITED STATES
Children in two-parent families, both parents in labor force
65,508 8,441,764
Children in single-parent families, parent in the labor force
88,176 6,360,521
Total children under age 6 potentially needing child care
153,684 14,802,285
NUMBER OF WORKING
MOTHERS MISSISSIPPI UNITED STATES
With infants under one year 23,747 2,435,563
With any children under age 6 95,750 9,721,156
With children under age 6 only
49,920 5,422,464
With both children under age 6 AND children age 6 to 17
45,830 4,298,692
Married working mothers 125,098 15,306,983
Single working mothers 83,881 6,749,078
SPACES IN CHILD CARE PROGRAMS MISSISSIPPI Total spaces/slots 194,127
Percent of spaces in child care center programs*
65%
Percent of total spaces in licensed FCC homes
0%
Percent of total spaces in school-age care programs
35%
Percent of total spaces in other programs 0% Total spaces/slots of licensed programs 229,946
Percent of licensed spaces for infants and toddlers
34%
Percent of licensed spaces for preschool-aged children
43%
Percent of licensed spaces for school-aged children
22%
*Does not include school-aged programs
1 Unless otherwise noted, statistics in the Child Care Need sections are from the American Community Survey, U.S. Census Bureau, 2011-2013 three-year estimates (http://factfinder2.census.gov/faces/nav/jsf/pages/index.xhtml). 2 Unless otherwise noted, data for the rest of the Fact Sheet is provided by Child Care Resource and Referral Agencies for Child Care Aware® of America’s 2016 State Fact Sheet Survey. Data reflects the 2015 calendar year.
TYPES OF CHILD CARE MISSISSIPPI
Number of center-based child care programs 1,513 Percent of centers that are nationally accredited
2%
Do faith-based programs need to be regulated?
Yes
Number of regulated faith-based programs 334 Number of family child care (FCC) homes 9
Percent of FCC homes that are nationally accredited
0%
Number of school-aged care programs 819 Number of other regulated child care centers NR Number of other regulated FCC homes NR
NUMBERS, INCOME, AND
SUPPORT OF THE CHILD CARE
WORKFORCE3 MISSISSIPPI
UNITED
STATES
Child care workers (in
centers) 6,690 573,430
Average annual income of child care workers4
$18,480 $22,310
Total paid early childhood workforce5
N/A 2.2 million
CCR&R CONTACTS URL Mississippi Child Care Resource & Referral Network
www.earlyyearsnetwork.msucares.com
Child Care Aware® of America
http://usa.childcareaware.org www.childcareaware.org
3 Statistics provided by the Office of Child Care from the Child Care Development Fund, and
are derived from monthly averages. Total number of child care providers includes paid relatives and other nonregulated caregivers. U.S. Totals include all 50 states and the District of Columbia (http://www.acf.hhs.gov/programs/occ/resource/fy-2013-ccdf-data-tables-preliminary)
4 Bureau of Labor Statistics, U.S. Department of Labor, Occupational Employment Survey, May 2013 estimates. Does not include child care administrators/managers, preschool teachers, special education teachers, or self-employed workers such as family child care business owners. (http://www.bls.gov/oes/current/oes_nat.htm)
5Weiss E. & Brandon, R. N. (2010). The Economic Value of the U.S. Early Childhood Sector. Partnership for America’s Economic Success.
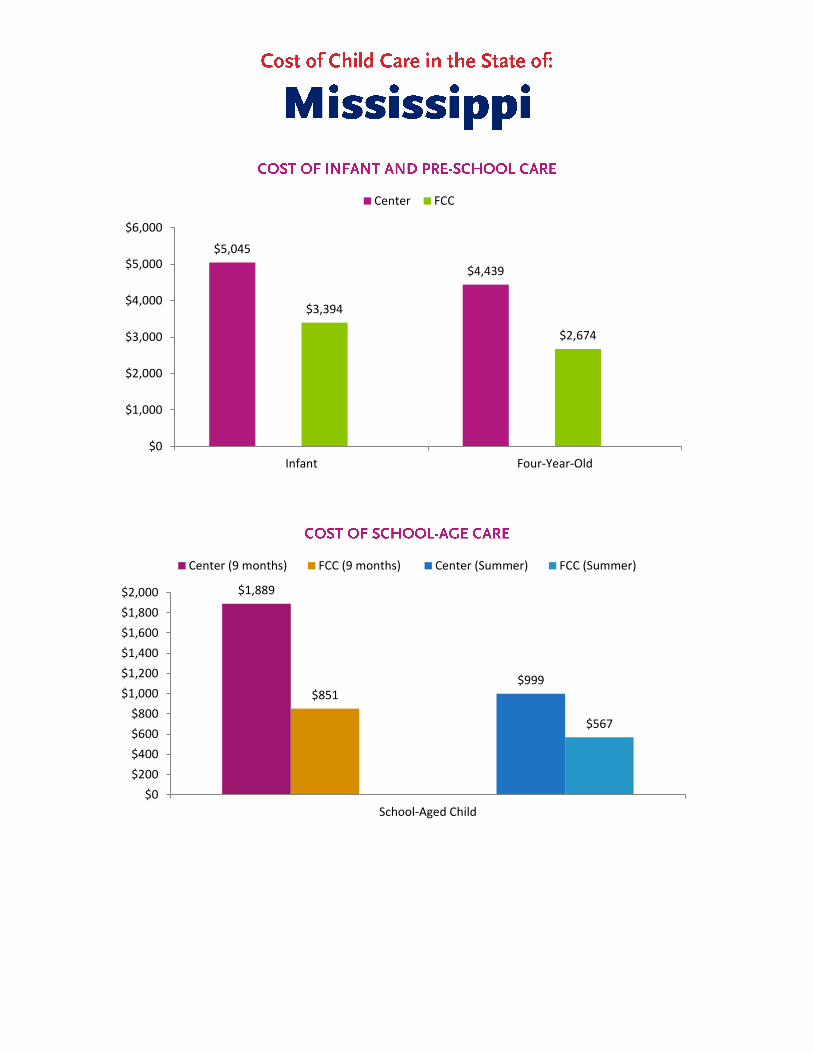
$5,045
$4,439
$3,394
$2,674
$0
$1,000
$2,000
$3,000
$4,000
$5,000
$6,000
Infant Four-Year-Old
Center FCC
$1,889
$851$999
$567
$0
$200
$400
$600
$800
$1,000
$1,200
$1,400
$1,600
$1,800
$2,000
School-Aged Child
Center (9 months) FCC (9 months) Center (Summer) FCC (Summer)

POPULATION MISSOURI UNITED STATES
Total residents 6,063,589 318,857,056
Children age birth to 4 years 372,028 19,757,997
Children age birth to 4 years living in poverty
91,062 4,658,187
Children age 5 to 11 545,702 28,761,402
Total families with children 631,286 33,106,587
Single parent families 211,939 10,993,697
Families in poverty 122,842 6,603,926
CHILDREN UNDER AGE 6
POTENTIALLY IN NEED OF CHILD
CARE MISSOURI UNITED STATES
Children in two-parent families, both parents in labor force
170,464 8,441,764
Children in single-parent families, parent in the labor force
118,373 6,360,521
Total children under age 6 potentially needing child care
288,837 14,802,285
NUMBER OF WORKING
MOTHERS MISSOURI UNITED STATES
With infants under one year 48,125 2,435,563
With any children under age 6 189,376 9,721,156
With children under age 6 only
107,631 5,422,464
With both children under age 6 AND children age 6 to 17
81,745 4,298,692
Married working mothers 310,939 15,306,983
Single working mothers 125,935 6,749,078
SPACES IN CHILD CARE PROGRAMS MISSOURI Total spaces/slots 163,734
Percent of spaces in child care center programs*
79%
Percent of total spaces in licensed FCC homes
6%
Percent of total spaces in school-age care programs
15%
Percent of total spaces in other programs 0% Total spaces/slots of licensed programs NR
Percent of licensed spaces for infants and toddlers
NR
Percent of licensed spaces for preschool-aged children
NR
Percent of licensed spaces for school-aged children
NR
*Does not include school-aged programs
1 Unless otherwise noted, statistics in the Child Care Need sections are from the American Community Survey, U.S. Census Bureau, 2011-2013 three-year estimates (http://factfinder2.census.gov/faces/nav/jsf/pages/index.xhtml). 2 Unless otherwise noted, data for the rest of the Fact Sheet is provided by Child Care Resource and Referral Agencies for Child Care Aware® of America’s 2016 State Fact Sheet Survey. Data reflects the 2015 calendar year.
TYPES OF CHILD CARE MISSOURI
Number of center-based child care programs 1,993 Percent of centers that are nationally accredited
7%
Do faith-based programs need to be regulated?
Yes
Number of regulated faith-based programs 539 Number of family child care (FCC) homes 1,032
Percent of FCC homes that are nationally accredited
1%
Number of school-aged care programs 371 Number of other regulated child care centers 622 Number of other regulated FCC homes 3,718
NUMBERS, INCOME, AND
SUPPORT OF THE CHILD CARE
WORKFORCE3 MISSOURI
UNITED
STATES
Child care workers (in
centers) 12,570 573,430
Average annual income of child care workers4
$20,360 $22,310
Total paid early childhood workforce5
N/A 2.2 million
CCR&R CONTACTS URL Child Care Aware of Missouri
www.mo.childcareaware.org
Child Care Aware® of America
http://usa.childcareaware.org www.childcareaware.org
3 Statistics provided by the Office of Child Care from the Child Care Development Fund, and
are derived from monthly averages. Total number of child care providers includes paid relatives and other nonregulated caregivers. U.S. Totals include all 50 states and the District of Columbia (http://www.acf.hhs.gov/programs/occ/resource/fy-2013-ccdf-data-tables-preliminary)
4 Bureau of Labor Statistics, U.S. Department of Labor, Occupational Employment Survey, May 2013 estimates. Does not include child care administrators/managers, preschool teachers, special education teachers, or self-employed workers such as family child care business owners. (http://www.bls.gov/oes/current/oes_nat.htm)
5Weiss E. & Brandon, R. N. (2010). The Economic Value of the U.S. Early Childhood Sector. Partnership for America’s Economic Success.

$9,100
$6,396$5,720
$4,992
$0
$1,000
$2,000
$3,000
$4,000
$5,000
$6,000
$7,000
$8,000
$9,000
$10,000
Infant Four-Year-Old
Center FCC
$3,861
$3,042
$0
$1,000
$2,000
$3,000
$4,000
$5,000
$6,000
$7,000
$8,000
$9,000
$10,000
School-Aged Child
Center (9 months) FCC (9 months)

POPULATION MONTANA UNITED STATES
Total residents 1,023,579 318,857,056
Children age birth to 4 years 59,775 19,757,997
Children age birth to 4 years living in poverty
11,325 4,658,187
Children age 5 to 11 90,801 28,761,402
Total families with children 99,401 33,106,587
Single parent families 30,189 10,993,697
Families in poverty 17,585 6,603,926
CHILDREN UNDER AGE 6
POTENTIALLY IN NEED OF CHILD
CARE MONTANA UNITED STATES
Children in two-parent families, both parents in labor force
30,587 8,441,764
Children in single-parent families, parent in the labor force
15,027 6,360,521
Total children under age 6 potentially needing child care
45,614 14,802,285
NUMBER OF WORKING
MOTHERS MONTANA UNITED STATES
With infants under one year 7,167 2,435,563
With any children under age 6 28,264 9,721,156
With children under age 6 only
15,510 5,422,464
With both children under age 6 AND children age 6 to 17
12,754 4,298,692
Married working mothers 50,452 15,306,983
Single working mothers 15,141 6,749,078
SPACES IN CHILD CARE PROGRAMS MONTANA Total spaces/slots 25,334
Percent of spaces in child care center programs*
48%
Percent of total spaces in licensed FCC homes
27%
Percent of total spaces in school-age care programs
25%
Percent of total spaces in other programs 0% Total spaces/slots of licensed programs 25,972
Percent of licensed spaces for infants and toddlers
41%
Percent of licensed spaces for preschool-aged children
34%
Percent of licensed spaces for school-aged children
25%
*Does not include school-aged programs
1 Unless otherwise noted, statistics in the Child Care Need sections are from the American Community Survey, U.S. Census Bureau, 2011-2013 three-year estimates (http://factfinder2.census.gov/faces/nav/jsf/pages/index.xhtml). 2 Unless otherwise noted, data for the rest of the Fact Sheet is provided by Child Care Resource and Referral Agencies for Child Care Aware® of America’s 2016 State Fact Sheet Survey. Data reflects the 2015 calendar year.
TYPES OF CHILD CARE MONTANA
Number of center-based child care programs 255 Percent of centers that are nationally accredited
3%
Do faith-based programs need to be regulated?
Yes
Number of regulated faith-based programs 173 Number of family child care (FCC) homes 701
Percent of FCC homes that are nationally accredited
1%
Number of school-aged care programs 506 Number of other regulated child care centers 0 Number of other regulated FCC homes 0
NUMBERS, INCOME, AND
SUPPORT OF THE CHILD CARE
WORKFORCE3 MONTANA
UNITED
STATES
Child care workers (in
centers) 2,560 573,430
Average annual income of child care workers4
$20,490 $22,310
Total paid early childhood workforce5
N/A 2.2 million
CCR&R CONTACTS URL Family Connections MT www.familyconnectionsmt.org Child Care Aware® of America
http://usa.childcareaware.org www.childcareaware.org
3 Statistics provided by the Office of Child Care from the Child Care Development Fund, and
are derived from monthly averages. Total number of child care providers includes paid relatives and other nonregulated caregivers. U.S. Totals include all 50 states and the District of Columbia (http://www.acf.hhs.gov/programs/occ/resource/fy-2013-ccdf-data-tables-preliminary)
4 Bureau of Labor Statistics, U.S. Department of Labor, Occupational Employment Survey, May 2013 estimates. Does not include child care administrators/managers, preschool teachers, special education teachers, or self-employed workers such as family child care business owners. (http://www.bls.gov/oes/current/oes_nat.htm)
5Weiss E. & Brandon, R. N. (2010). The Economic Value of the U.S. Early Childhood Sector. Partnership for America’s Economic Success.

$9,383
$8,299$8,840 $8,840
$7,436$7,017
$8,119$7,760
$0
$1,000
$2,000
$3,000
$4,000
$5,000
$6,000
$7,000
$8,000
$9,000
$10,000
Infant Four-Year-Old
Center Accredited Center FCC Accredited FCC
$6,099
$5,252
$8,132
$7,003
$1,939 $1,670
$0
$1,000
$2,000
$3,000
$4,000
$5,000
$6,000
$7,000
$8,000
$9,000
$10,000
School-Aged Child
Center (9 months) FCC (9 months) Center (12 months)
FCC (12 months) Center (Summer) FCC (Summer)

POPULATION NEBRASKA UNITED STATES
Total residents 1,881,503 318,857,056
Children age birth to 4 years 130,326 19,757,997
Children age birth to 4 years living in poverty
24,268 4,658,187
Children age 5 to 11 186,087 28,761,402
Total families with children 217,373 33,106,587
Single parent families 66,597 10,993,697
Families in poverty 32,786 6,603,926
CHILDREN UNDER AGE 6
POTENTIALLY IN NEED OF CHILD
CARE NEBRASKA UNITED STATES
Children in two-parent families, both parents in labor force
74,850 8,441,764
Children in single-parent families, parent in the labor force
37,407 6,360,521
Total children under age 6 potentially needing child care
112,257 14,802,285
NUMBER OF WORKING
MOTHERS NEBRASKA UNITED STATES
With infants under one year 20,322 2,435,563
With any children under age 6 72,910 9,721,156
With children under age 6 only
38,808 5,422,464
With both children under age 6 AND children age 6 to 17
34,102 4,298,692
Married working mothers 118,876 15,306,983
Single working mothers 44,006 6,749,078
SPACES IN CHILD CARE PROGRAMS NEBRASKA Total spaces/slots 115,049
Percent of spaces in child care center programs*
56%
Percent of total spaces in licensed FCC homes
20%
Percent of total spaces in school-age care programs
24%
Percent of total spaces in other programs 0% Total spaces/slots of licensed programs NR
Percent of licensed spaces for infants and toddlers
NR
Percent of licensed spaces for preschool-aged children
NR
Percent of licensed spaces for school-aged children
NR
*Does not include school-aged programs
1 Unless otherwise noted, statistics in the Child Care Need sections are from the American Community Survey, U.S. Census Bureau, 2011-2013 three-year estimates (http://factfinder2.census.gov/faces/nav/jsf/pages/index.xhtml). 2 Unless otherwise noted, data for the rest of the Fact Sheet is provided by Child Care Resource and Referral Agencies for Child Care Aware® of America’s 2016 State Fact Sheet Survey. Data reflects the 2015 calendar year.
TYPES OF CHILD CARE NEBRASKA
Number of center-based child care programs 883 Percent of centers that are nationally accredited
9%
Do faith-based programs need to be regulated?
Yes
Number of regulated faith-based programs NR Number of family child care (FCC) homes 2,214
Percent of FCC homes that are nationally accredited
0%
Number of school-aged care programs 244 Number of other regulated child care centers NR Number of other regulated FCC homes NR
NUMBERS, INCOME, AND
SUPPORT OF THE CHILD CARE
WORKFORCE3 NEBRASKA
UNITED
STATES
Child care workers (in
centers) 6,450 573,430
Average annual income of child care workers4
$20,580 $22,310
Total paid early childhood workforce5
N/A 2.2 million
CCR&R CONTACTS URL Nebraska Department of Education
https://www.education.ne.gov/oec/ectc.html
Child Care Aware® of America
http://usa.childcareaware.org www.childcareaware.org
3 Statistics provided by the Office of Child Care from the Child Care Development Fund, and
are derived from monthly averages. Total number of child care providers includes paid relatives and other nonregulated caregivers. U.S. Totals include all 50 states and the District of Columbia (http://www.acf.hhs.gov/programs/occ/resource/fy-2013-ccdf-data-tables-preliminary)
4 Bureau of Labor Statistics, U.S. Department of Labor, Occupational Employment Survey, May 2013 estimates. Does not include child care administrators/managers, preschool teachers, special education teachers, or self-employed workers such as family child care business owners. (http://www.bls.gov/oes/current/oes_nat.htm)
5Weiss E. & Brandon, R. N. (2010). The Economic Value of the U.S. Early Childhood Sector. Partnership for America’s Economic Success.

$9,043
$7,935
$7,104$6,551
$0
$1,000
$2,000
$3,000
$4,000
$5,000
$6,000
$7,000
$8,000
$9,000
$10,000
Infant Four-Year-Old
Center FCC
$6,749$6,215
$0
$1,000
$2,000
$3,000
$4,000
$5,000
$6,000
$7,000
$8,000
$9,000
$10,000
School-Aged Child
Center (12 months) FCC (12 months)

POPULATION NEVADA UNITED STATES
Total residents 2,839,099 318,857,056
Children age birth to 4 years 175,735 19,757,997
Children age birth to 4 years living in poverty
46,749 4,658,187
Children age 5 to 11 262,460 28,761,402
Total families with children 278,839 33,106,587
Single parent families 102,720 10,993,697
Families in poverty 52,749 6,603,926
CHILDREN UNDER AGE 6
POTENTIALLY IN NEED OF CHILD
CARE NEVADA UNITED STATES
Children in two-parent families, both parents in labor force
67,646 8,441,764
Children in single-parent families, parent in the labor force
69,424 6,360,521
Total children under age 6 potentially needing child care
137,070 14,802,285
NUMBER OF WORKING
MOTHERS NEVADA UNITED STATES
With infants under one year 20,660 2,435,563
With any children under age 6 83,677 9,721,156
With children under age 6 only
46,314 5,422,464
With both children under age 6 AND children age 6 to 17
37,363 4,298,692
Married working mothers 119,802 15,306,983
Single working mothers 58,536 6,749,078
SPACES IN CHILD CARE PROGRAMS NEVADA Total spaces/slots 67,794
Percent of spaces in child care center programs*
58%
Percent of total spaces in licensed FCC homes
4%
Percent of total spaces in school-age care programs
30%
Percent of total spaces in other programs 8% Total spaces/slots of licensed programs 41,774
Percent of licensed spaces for infants and toddlers
100%
Percent of licensed spaces for preschool-aged children
NR
Percent of licensed spaces for school-aged children
NR
*Does not include school-aged programs
1 Unless otherwise noted, statistics in the Child Care Need sections are from the American Community Survey, U.S. Census Bureau, 2011-2013 three-year estimates (http://factfinder2.census.gov/faces/nav/jsf/pages/index.xhtml). 2 Unless otherwise noted, data for the rest of the Fact Sheet is provided by Child Care Resource and Referral Agencies for Child Care Aware® of America’s 2016 State Fact Sheet Survey. Data reflects the 2015 calendar year.
TYPES OF CHILD CARE NEVADA
Number of center-based child care programs 386 Percent of centers that are nationally accredited
12%
Do faith-based programs need to be regulated?
Yes
Number of regulated faith-based programs NR Number of family child care (FCC) homes 286
Percent of FCC homes that are nationally accredited
2%
Number of school-aged care programs 388 Number of other regulated child care centers 148 Number of other regulated FCC homes 985
NUMBERS, INCOME, AND
SUPPORT OF THE CHILD CARE
WORKFORCE3 NEVADA
UNITED
STATES
Child care workers (in
centers) 2,250 573,430
Average annual income of child care workers4
$22,340 $22,310
Total paid early childhood workforce5
N/A 2.2 million
CCR&R CONTACTS URL No formal network. Partner CCR&R in southern Nevada: Las Vegas Urban League
www.childrenscabinet.org www.lvul.org
Child Care Aware® of America
http://usa.childcareaware.org www.childcareaware.org
3 Statistics provided by the Office of Child Care from the Child Care Development Fund, and
are derived from monthly averages. Total number of child care providers includes paid relatives and other nonregulated caregivers. U.S. Totals include all 50 states and the District of Columbia (http://www.acf.hhs.gov/programs/occ/resource/fy-2013-ccdf-data-tables-preliminary)
4 Bureau of Labor Statistics, U.S. Department of Labor, Occupational Employment Survey, May 2013 estimates. Does not include child care administrators/managers, preschool teachers, special education teachers, or self-employed workers such as family child care business owners. (http://www.bls.gov/oes/current/oes_nat.htm)
5Weiss E. & Brandon, R. N. (2010). The Economic Value of the U.S. Early Childhood Sector. Partnership for America’s Economic Success.

$10,317
$8,768
$12,078
$10,013
$857
$8,013$8,516
$8,038
$0
$2,000
$4,000
$6,000
$8,000
$10,000
$12,000
$14,000
Infant Four-Year-Old
Center Accredited Center FCC Accredited FCC
$5,955
$4,711
$8,056 $7,804
$0
$2,000
$4,000
$6,000
$8,000
$10,000
$12,000
$14,000
School-Aged Child
Center (9 months) FCC (9 months) Center (12 months) FCC (12 months)

POPULATION NEW
HAMPSHIRE UNITED STATES
Total residents 1,326,813 318,857,056
Children age birth to 4 years 65,082 19,757,997
Children age birth to 4 years living in poverty
10,600 4,658,187
Children age 5 to 11 103,630 28,761,402
Total families with children 138,293 33,106,587
Single parent families 43,352 10,993,697
Families in poverty 16,390 6,603,926
CHILDREN UNDER AGE 6
POTENTIALLY IN NEED OF CHILD
CARE
NEW
HAMPSHIRE UNITED STATES
Children in two-parent families, both parents in labor force
31,910 8,441,764
Children in single-parent families, parent in the labor force
20,181 6,360,521
Total children under age 6 potentially needing child care
52,091 14,802,285
NUMBER OF WORKING
MOTHERS NEW
HAMPSHIRE UNITED STATES
With infants under one year 10,075 2,435,563
With any children under age 6 35,058 9,721,156
With children under age 6 only
20,597 5,422,464
With both children under age 6 AND children age 6 to 17
14,461 4,298,692
Married working mothers 69,712 15,306,983
Single working mothers 26,109 6,749,078
SPACES IN CHILD CARE PROGRAMS NEW HAMPSHIRE Total spaces/slots 57,618
Percent of spaces in child care center programs*
74%
Percent of total spaces in licensed FCC homes
4%
Percent of total spaces in school-age care programs
23%
Percent of total spaces in other programs 0% Total spaces/slots of licensed programs 30,797
Percent of licensed spaces for infants and toddlers
31%
Percent of licensed spaces for preschool-aged children
39%
Percent of licensed spaces for school-aged children
30%
*Does not include school-aged programs
1 Unless otherwise noted, statistics in the Child Care Need sections are from the American Community Survey, U.S. Census Bureau, 2011-2013 three-year estimates (http://factfinder2.census.gov/faces/nav/jsf/pages/index.xhtml). 2 Unless otherwise noted, data for the rest of the Fact Sheet is provided by Child Care Resource and Referral Agencies for Child Care Aware® of America’s 2016 State Fact Sheet Survey. Data reflects the 2015 calendar year.
TYPES OF CHILD CARE NEW
HAMPSHIRE
Number of center-based child care programs 750 Percent of centers that are nationally accredited
8%
Do faith-based programs need to be regulated?
Yes
Number of regulated faith-based programs 40 Number of family child care (FCC) homes 183
Percent of FCC homes that are nationally accredited
0%
Number of school-aged care programs 213 Number of other regulated child care centers NR Number of other regulated FCC homes NR
NUMBERS, INCOME, AND
SUPPORT OF THE CHILD CARE
WORKFORCE3 NEW HAMPSHIRE
UNITED
STATES
Child care workers (in
centers) 2,590 573,430
Average annual income of child care workers4
$22,200 $22,310
Total paid early childhood workforce5
N/A 2.2 million
CCR&R CONTACTS URL Child Care Aware® of New Hampshire A Child Care Resource and Referral Program of Southern New Hampshire Services
http://nh.childcareaware.org/
Child Care Aware® of America
http://usa.childcareaware.org www.childcareaware.org
3 Statistics provided by the Office of Child Care from the Child Care Development Fund, and
are derived from monthly averages. Total number of child care providers includes paid relatives and other nonregulated caregivers. U.S. Totals include all 50 states and the District of Columbia (http://www.acf.hhs.gov/programs/occ/resource/fy-2013-ccdf-data-tables-preliminary)
4 Bureau of Labor Statistics, U.S. Department of Labor, Occupational Employment Survey, May 2013 estimates. Does not include child care administrators/managers, preschool teachers, special education teachers, or self-employed workers such as family child care business owners. (http://www.bls.gov/oes/current/oes_nat.htm)
5Weiss E. & Brandon, R. N. (2010). The Economic Value of the U.S. Early Childhood Sector. Partnership for America’s Economic Success.

$12,399
$10,259
$14,563
$11,875
$9,193$8,479
$0
$2,000
$4,000
$6,000
$8,000
$10,000
$12,000
$14,000
$16,000
Infant Four-Year-Old
Center Accredited Center FCC
$3,283 $2,845
$0
$2,000
$4,000
$6,000
$8,000
$10,000
$12,000
$14,000
$16,000
School-Aged Child
Center (9 months) FCC (9 months)

POPULATION NEW JERSEY UNITED STATES
Total residents 8,938,175 318,857,056
Children age birth to 4 years 532,010 19,757,997
Children age birth to 4 years living in poverty
93,679 4,658,187
Children age 5 to 11 778,421 28,761,402
Total families with children 973,268 33,106,587
Single parent families 282,133 10,993,697
Families in poverty 134,517 6,603,926
CHILDREN UNDER AGE 6
POTENTIALLY IN NEED OF CHILD
CARE NEW JERSEY UNITED STATES
Children in two-parent families, both parents in labor force
251,540 8,441,764
Children in single-parent families, parent in the labor force
160,491 6,360,521
Total children under age 6 potentially needing child care
412,031 14,802,285
NUMBER OF WORKING
MOTHERS NEW JERSEY UNITED STATES
With infants under one year 68,733 2,435,563
With any children under age 6 263,383 9,721,156
With children under age 6 only
155,640 5,422,464
With both children under age 6 AND children age 6 to 17
107,743 4,298,692
Married working mothers 489,860 15,306,983
Single working mothers 185,721 6,749,078
SPACES IN CHILD CARE PROGRAMS NEW JERSEY Total spaces/slots NR
Percent of spaces in child care center programs*
NR
Percent of total spaces in licensed FCC homes
NR
Percent of total spaces in school-age care programs
NR
Percent of total spaces in other programs NR Total spaces/slots of licensed programs NR
Percent of licensed spaces for infants and toddlers
NR
Percent of licensed spaces for preschool-aged children
NR
Percent of licensed spaces for school-aged children
NR
*Does not include school-aged programs
1 Unless otherwise noted, statistics in the Child Care Need sections are from the American Community Survey, U.S. Census Bureau, 2011-2013 three-year estimates (http://factfinder2.census.gov/faces/nav/jsf/pages/index.xhtml). 2 Unless otherwise noted, data for the rest of the Fact Sheet is provided by Child Care Resource and Referral Agencies for Child Care Aware® of America’s 2016 State Fact Sheet Survey. Data reflects the 2015 calendar year.
TYPES OF CHILD CARE NEW JERSEY
Number of center-based child care programs NR Percent of centers that are nationally accredited
NR
Do faith-based programs need to be regulated?
NR
Number of regulated faith-based programs NR Number of family child care (FCC) homes NR
Percent of FCC homes that are nationally accredited
NR
Number of school-aged care programs NR Number of other regulated child care centers NR Number of other regulated FCC homes NR
NUMBERS, INCOME, AND
SUPPORT OF THE CHILD CARE
WORKFORCE3 NEW JERSEY
UNITED
STATES
Child care workers (in
centers) 18,420 573,430
Average annual income of child care workers4
$24,560 $22,310
Total paid early childhood workforce5
N/A 2.2 million
CCR&R CONTACTS URL Child Care Resources http://www.ccrnj.org Child Care Aware® of America
http://usa.childcareaware.org www.childcareaware.org
3 Statistics provided by the Office of Child Care from the Child Care Development Fund, and
are derived from monthly averages. Total number of child care providers includes paid relatives and other nonregulated caregivers. U.S. Totals include all 50 states and the District of Columbia (http://www.acf.hhs.gov/programs/occ/resource/fy-2013-ccdf-data-tables-preliminary)
4 Bureau of Labor Statistics, U.S. Department of Labor, Occupational Employment Survey, May 2013 estimates. Does not include child care administrators/managers, preschool teachers, special education teachers, or self-employed workers such as family child care business owners. (http://www.bls.gov/oes/current/oes_nat.htm)
5Weiss E. & Brandon, R. N. (2010). The Economic Value of the U.S. Early Childhood Sector. Partnership for America’s Economic Success.

6 Note: New Jersey did not provide updated cost of care data for 2015. These figures reflect data collected in 2014 and adjusted for inflation.
$11,548
$9,557
$3,479
$8,709
$7,799
$3,272
$0
$2,000
$4,000
$6,000
$8,000
$10,000
$12,000
$14,000
Infant Four-Year-Old School-Age Child
Center FCC

POPULATION NEW MEXICO UNITED STATES
Total residents 2,085,572 318,857,056
Children age birth to 4 years 135,416 19,757,997
Children age birth to 4 years living in poverty
44,771 4,658,187
Children age 5 to 11 195,078 28,761,402
Total families with children 205,484 33,106,587
Single parent families 81,467 10,993,697
Families in poverty 59,711 6,603,926
CHILDREN UNDER AGE 6
POTENTIALLY IN NEED OF CHILD
CARE NEW MEXICO UNITED STATES
Children in two-parent families, both parents in labor force
42,270 8,441,764
Children in single-parent families, parent in the labor force
49,789 6,360,521
Total children under age 6 potentially needing child care
92,059 14,802,285
NUMBER OF WORKING
MOTHERS NEW MEXICO UNITED STATES
With infants under one year 15,920 2,435,563
With any children under age 6 58,694 9,721,156
With children under age 6 only
29,671 5,422,464
With both children under age 6 AND children age 6 to 17
29,023 4,298,692
Married working mothers 78,863 15,306,983
Single working mothers 45,837 6,749,078
SPACES IN CHILD CARE PROGRAMS* NEW MEXICO Total spaces/slots 66,417
Percent of spaces in child care center programs**
68%
Percent of total spaces in licensed FCC homes
3%
Percent of total spaces in school-age care programs
14%
Percent of total spaces in other programs 15% Total spaces/slots of licensed programs 56,705
Percent of licensed spaces for infants and toddlers
NR
Percent of licensed spaces for preschool-aged children
NR
Percent of licensed spaces for school-aged children
NR
Note: Data does not disaggregate based on the age categories listed here. In addition, these
data do not include data from Tribal, PED PreK, non-state-funded Head Starts, and other types
of programs not regulated by the state.
*Does not include school-aged programs
1 Unless otherwise noted, statistics in the Child Care Need sections are from the American Community Survey, U.S. Census Bureau, 2011-2013 three-year estimates (http://factfinder2.census.gov/faces/nav/jsf/pages/index.xhtml). 2 Unless otherwise noted, data for the rest of the Fact Sheet is provided by Child Care Resource and Referral Agencies for Child Care Aware® of America’s 2016 State Fact Sheet Survey. Data reflects the 2015 calendar year.
TYPES OF CHILD CARE NEW MEXICO
Number of center-based child care programs 748 Percent of centers that are nationally accredited
23%
Do faith-based programs need to be regulated?
Yes
Number of regulated faith-based programs 137 Number of family child care (FCC) homes 238
Percent of FCC homes that are nationally accredited
3%
Number of school-aged care programs 117 Number of other regulated child care centers NR Number of other regulated FCC homes 2,428
NUMBERS, INCOME, AND
SUPPORT OF THE CHILD CARE
WORKFORCE3 NEW MEXICO
UNITED
STATES
Child care workers (in
centers) 2,880 573,430
Average annual income of child care workers4
$20,130 $22,310
Total paid early childhood workforce5
N/A 2.2 million
CCR&R CONTACTS URL NewMexicoKids Child Care Resource and Referral
www.newmexicokids.org
Child Care Aware® of America
http://usa.childcareaware.org www.childcareaware.org
3 Statistics provided by the Office of Child Care from the Child Care Development Fund, and
are derived from monthly averages. Total number of child care providers includes paid relatives and other nonregulated caregivers. U.S. Totals include all 50 states and the District of Columbia (http://www.acf.hhs.gov/programs/occ/resource/fy-2013-ccdf-data-tables-preliminary)
4 Bureau of Labor Statistics, U.S. Department of Labor, Occupational Employment Survey, May 2013 estimates. Does not include child care administrators/managers, preschool teachers, special education teachers, or self-employed workers such as family child care business owners. (http://www.bls.gov/oes/current/oes_nat.htm)
5Weiss E. & Brandon, R. N. (2010). The Economic Value of the U.S. Early Childhood Sector. Partnership for America’s Economic Success.
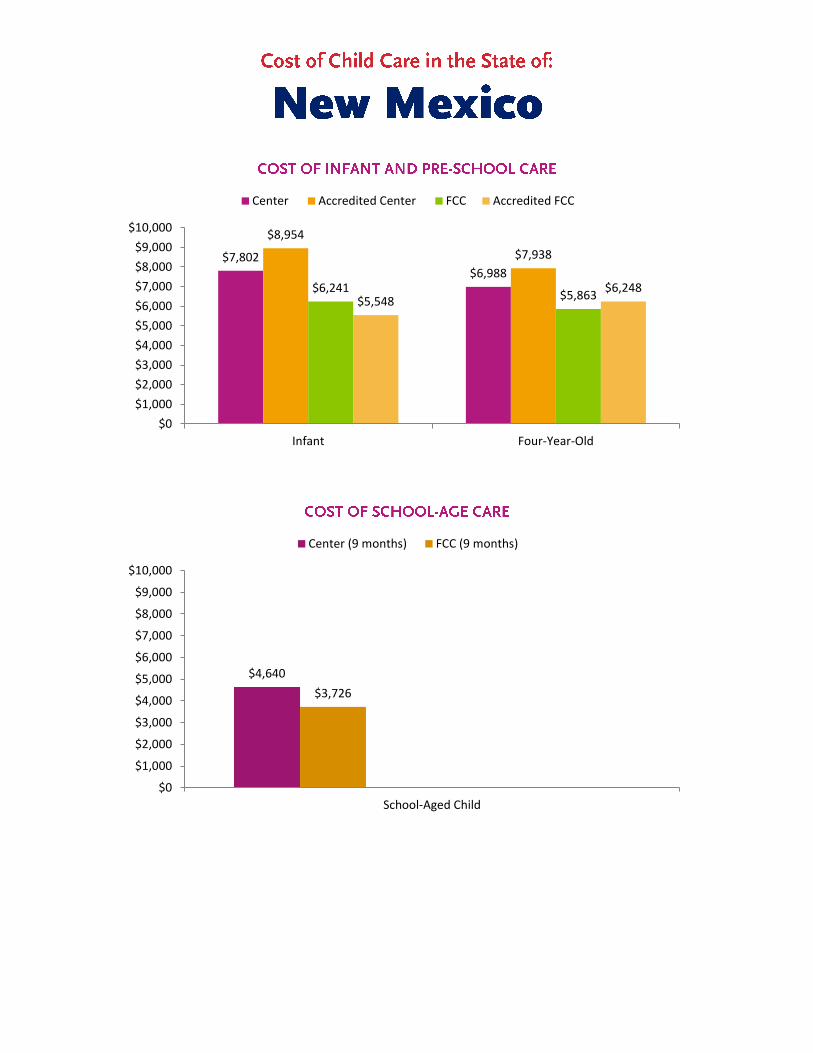
$7,802$6,988
$8,954
$7,938
$6,241$5,863$5,548
$6,248
$0
$1,000
$2,000
$3,000
$4,000
$5,000
$6,000
$7,000
$8,000
$9,000
$10,000
Infant Four-Year-Old
Center Accredited Center FCC Accredited FCC
$4,640
$3,726
$0
$1,000
$2,000
$3,000
$4,000
$5,000
$6,000
$7,000
$8,000
$9,000
$10,000
School-Aged Child
Center (9 months) FCC (9 months)

POPULATION NEW YORK UNITED STATES
Total residents 19,746,227 318,857,056
Children age birth to 4 years 1,177,076 19,757,997
Children age birth to 4 years living in poverty
278,542 4,658,187
Children age 5 to 11 1,612,099 28,761,402
Total families with children 1,945,443 33,106,587
Single parent families 669,263 10,993,697
Families in poverty 409,527 6,603,926
CHILDREN UNDER AGE 6
POTENTIALLY IN NEED OF CHILD
CARE NEW YORK UNITED STATES
Children in two-parent families, both parents in labor force
509,509 8,441,764
Children in single-parent families, parent in the labor force
371,282 6,360,521
Total children under age 6 potentially needing child care
880,791 14,802,285
NUMBER OF WORKING
MOTHERS NEW YORK UNITED STATES
With infants under one year 140,581 2,435,563
With any children under age 6 576,785 9,721,156
With children under age 6 only
328,613 5,422,464
With both children under age 6 AND children age 6 to 17
248,172 4,298,692
Married working mothers 889,990 15,306,983
Single working mothers 412,305 6,749,078
SPACES IN CHILD CARE PROGRAMS NEW YORK Total spaces/slots 761,971
Percent of spaces in child care center programs*
40%
Percent of total spaces in licensed FCC homes
21%
Percent of total spaces in school-age care programs
39%
Percent of total spaces in other programs 0% Total spaces/slots of licensed programs 497,826
Percent of licensed spaces for infants and toddlers
9%
Percent of licensed spaces for preschool-aged children
20%
Percent of licensed spaces for school-aged children
71%
*Does not include school-aged programs
1 Unless otherwise noted, statistics in the Child Care Need sections are from the American Community Survey, U.S. Census Bureau, 2011-2013 three-year estimates (http://factfinder2.census.gov/faces/nav/jsf/pages/index.xhtml). 2 Unless otherwise noted, data for the rest of the Fact Sheet is provided by Child Care Resource and Referral Agencies for Child Care Aware® of America’s 2016 State Fact Sheet Survey. Data reflects the 2015 calendar year.
TYPES OF CHILD CARE NEW YORK
Number of center-based child care programs 4,302 Percent of centers that are nationally accredited
7%
Do faith-based programs need to be regulated?
No
Number of regulated faith-based programs Number of family child care (FCC) homes 12,881
Percent of FCC homes that are nationally accredited
0%
Number of school-aged care programs 2,736 Number of other regulated child care centers NR Number of other regulated FCC homes NR
NUMBERS, INCOME, AND
SUPPORT OF THE CHILD CARE
WORKFORCE3 NEW YORK
UNITED
STATES
Child care workers (in
centers) 42,520 573,430
Average annual income of child care workers4
$26,280 $22,310
Total paid early childhood workforce5
N/A 2.2 million
CCR&R CONTACTS URL Early Care & Learning Council 230 Washington Ave Ext. Albany, NY 12203
http://www.earlycareandlearning.org/
Child Care Aware® of America
http://usa.childcareaware.org www.childcareaware.org
3 Statistics provided by the Office of Child Care from the Child Care Development Fund, and
are derived from monthly averages. Total number of child care providers includes paid relatives and other nonregulated caregivers. U.S. Totals include all 50 states and the District of Columbia (http://www.acf.hhs.gov/programs/occ/resource/fy-2013-ccdf-data-tables-preliminary)
4 Bureau of Labor Statistics, U.S. Department of Labor, Occupational Employment Survey, May 2013 estimates. Does not include child care administrators/managers, preschool teachers, special education teachers, or self-employed workers such as family child care business owners. (http://www.bls.gov/oes/current/oes_nat.htm)
5Weiss E. & Brandon, R. N. (2010). The Economic Value of the U.S. Early Childhood Sector. Partnership for America’s Economic Success.
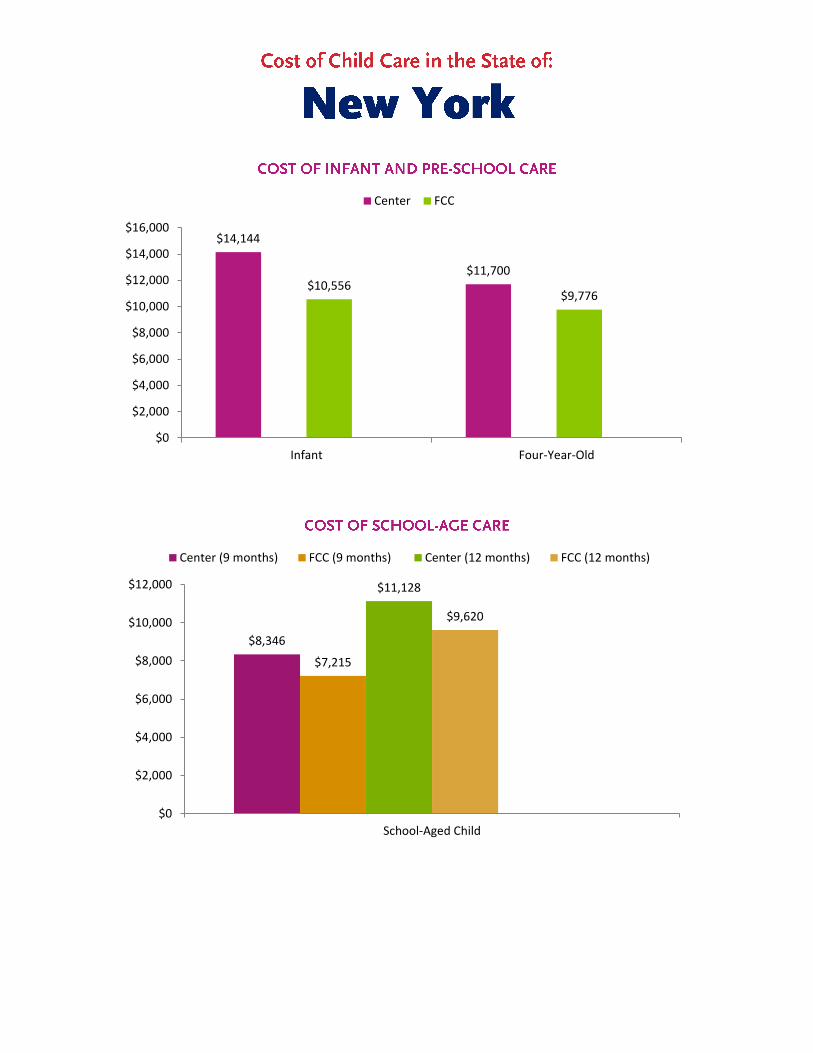
$14,144
$11,700$10,556
$9,776
$0
$2,000
$4,000
$6,000
$8,000
$10,000
$12,000
$14,000
$16,000
Infant Four-Year-Old
Center FCC
$8,346
$7,215
$11,128
$9,620
$0
$2,000
$4,000
$6,000
$8,000
$10,000
$12,000
School-Aged Child
Center (9 months) FCC (9 months) Center (12 months) FCC (12 months)

POPULATION NORTH
CAROLINA UNITED STATES
Total residents 9,943,964 318,857,056
Children age birth to 4 years 601,542 19,757,997
Children age birth to 4 years living in poverty
161,821 4,658,187
Children age 5 to 11 911,716 28,761,402
Total families with children 1,056,105 33,106,587
Single parent families 370,587 10,993,697
Families in poverty 237,143 6,603,926
CHILDREN UNDER AGE 6
POTENTIALLY IN NEED OF CHILD
CARE
NORTH
CAROLINA UNITED STATES
Children in two-parent families, both parents in labor force
247,516 8,441,764
Children in single-parent families, parent in the labor force
210,620 6,360,521
Total children under age 6 potentially needing child care
458,136 14,802,285
NUMBER OF WORKING
MOTHERS NORTH
CAROLINA UNITED STATES
With infants under one year 76,545 2,435,563
With any children under age 6 308,581 9,721,156
With children under age 6 only
178,593 5,422,464
With both children under age 6 AND children age 6 to 17
129,988 4,298,692
Married working mothers 475,076 15,306,983
Single working mothers 236,571 6,749,078
SPACES IN CHILD CARE PROGRAMS NORTH CAROLINA Total spaces/slots 388,299
Percent of spaces in child care center programs*
78%
Percent of total spaces in licensed FCC homes
4%
Percent of total spaces in school-age care programs
17%
Percent of total spaces in other programs 0% Total spaces/slots of licensed programs 388,299
Percent of licensed spaces for infants and toddlers
27%
Percent of licensed spaces for preschool-aged children
47%
Percent of licensed spaces for school-aged children
26%
*Does not include school-aged programs
1 Unless otherwise noted, statistics in the Child Care Need sections are from the American Community Survey, U.S. Census Bureau, 2011-2013 three-year estimates (http://factfinder2.census.gov/faces/nav/jsf/pages/index.xhtml). 2 Unless otherwise noted, data for the rest of the Fact Sheet is provided by Child Care Resource and Referral Agencies for Child Care Aware® of America’s 2016 State Fact Sheet Survey. Data reflects the 2015 calendar year.
TYPES OF CHILD CARE NORTH
CAROLINA
Number of center-based child care programs 4,060 Percent of centers that are nationally accredited
4%
Do faith-based programs need to be regulated?
Yes
Number of regulated faith-based programs 366 Number of family child care (FCC) homes 2,173
Percent of FCC homes that are nationally accredited
0%
Number of school-aged care programs 636 Number of other regulated child care centers NR Number of other regulated FCC homes NR
NUMBERS, INCOME, AND
SUPPORT OF THE CHILD CARE
WORKFORCE3 NORTH CAROLINA
UNITED
STATES
Child care workers (in
centers) 24,570 573,430
Average annual income of child care workers4
$20,980 $22,310
Total paid early childhood workforce5
N/A 2.2 million
CCR&R CONTACTS URL Main CCR&R contact: Child Care Resources Inc. (CCRI) "Network": NC Child Care Resource and Referral Council (NC CCR&R Council)
CCRI: http://www.childcareresourcesinc.org/
NC CCR&R Council: http://childcarerrnc.org/
Child Care Aware® of America
http://usa.childcareaware.org www.childcareaware.org
3 Statistics provided by the Office of Child Care from the Child Care Development Fund, and
are derived from monthly averages. Total number of child care providers includes paid relatives and other nonregulated caregivers. U.S. Totals include all 50 states and the District of Columbia (http://www.acf.hhs.gov/programs/occ/resource/fy-2013-ccdf-data-tables-preliminary)
4 Bureau of Labor Statistics, U.S. Department of Labor, Occupational Employment Survey, May 2013 estimates. Does not include child care administrators/managers, preschool teachers, special education teachers, or self-employed workers such as family child care business owners. (http://www.bls.gov/oes/current/oes_nat.htm)
5Weiss E. & Brandon, R. N. (2010). The Economic Value of the U.S. Early Childhood Sector. Partnership for America’s Economic Success.

$6,254
$7,920$7,412
$6,548
$0
$1,000
$2,000
$3,000
$4,000
$5,000
$6,000
$7,000
$8,000
$9,000
Infant Four-Year-Old
Center FCC
$3,275 $2,994
$5,032$4,481
$1,679 $1,462
$0
$1,000
$2,000
$3,000
$4,000
$5,000
$6,000
$7,000
$8,000
$9,000
School-Aged Child
Center (9 months) FCC (9 months) Center (12 months)
FCC (12 months) Center (Summer) FCC (Summer)

POPULATION NORTH
DAKOTA UNITED STATES
Total residents 739,482 318,857,056
Children age birth to 4 years 49,977 19,757,997
Children age birth to 4 years living in poverty
8,134 4,658,187
Children age 5 to 11 68,369 28,761,402
Total families with children 84,780 33,106,587
Single parent families 25,722 10,993,697
Families in poverty 11,538 6,603,926
CHILDREN UNDER AGE 6
POTENTIALLY IN NEED OF CHILD
CARE
NORTH
DAKOTA UNITED STATES
Children in two-parent families, both parents in labor force
25,898 8,441,764
Children in single-parent families, parent in the labor force
14,051 6,360,521
Total children under age 6 potentially needing child care
39,949 14,802,285
NUMBER OF WORKING
MOTHERS NORTH
DAKOTA UNITED STATES
With infants under one year 8,481 2,435,563
With any children under age 6 27,215 9,721,156
With children under age 6 only
14,805 5,422,464
With both children under age 6 AND children age 6 to 17
12,410 4,298,692
Married working mothers 45,716 15,306,983
Single working mothers 14,323 6,749,078
SPACES IN CHILD CARE PROGRAMS NORTH DAKOTA Total spaces/slots 43,064
Percent of spaces in child care center programs*
49%
Percent of total spaces in licensed FCC homes
31%
Percent of total spaces in school-age care programs
20%
Percent of total spaces in other programs 0% Total spaces/slots of licensed programs NR
Percent of licensed spaces for infants and toddlers
NR
Percent of licensed spaces for preschool-aged children
NR
Percent of licensed spaces for school-aged children
NR
*Does not include school-aged programs
1 Unless otherwise noted, statistics in the Child Care Need sections are from the American Community Survey, U.S. Census Bureau, 2011-2013 three-year estimates (http://factfinder2.census.gov/faces/nav/jsf/pages/index.xhtml). 2 Unless otherwise noted, data for the rest of the Fact Sheet is provided by Child Care Resource and Referral Agencies for Child Care Aware® of America’s 2016 State Fact Sheet Survey. Data reflects the 2015 calendar year.
TYPES OF CHILD CARE NORTH
DAKOTA
Number of center-based child care programs 316 Percent of centers that are nationally accredited
2%
Do faith-based programs need to be regulated?
Yes
Number of regulated faith-based programs 26 Number of family child care (FCC) homes 1,067
Percent of FCC homes that are nationally accredited
0%
Number of school-aged care programs 138 Number of other regulated child care centers NR Number of other regulated FCC homes NR
NUMBERS, INCOME, AND
SUPPORT OF THE CHILD CARE
WORKFORCE3 NORTH DAKOTA
UNITED
STATES
Child care workers (in
centers) 2,840 573,430
Average annual income of child care workers4
$20,550 $22,310
Total paid early childhood workforce5
N/A 2.2 million
CCR&R CONTACTS URL Child Care Aware of North Dakota
www.ndchildcare.org
Child Care Aware® of America
http://usa.childcareaware.org www.childcareaware.org
3 Statistics provided by the Office of Child Care from the Child Care Development Fund, and
are derived from monthly averages. Total number of child care providers includes paid relatives and other nonregulated caregivers. U.S. Totals include all 50 states and the District of Columbia (http://www.acf.hhs.gov/programs/occ/resource/fy-2013-ccdf-data-tables-preliminary)
4 Bureau of Labor Statistics, U.S. Department of Labor, Occupational Employment Survey, May 2013 estimates. Does not include child care administrators/managers, preschool teachers, special education teachers, or self-employed workers such as family child care business owners. (http://www.bls.gov/oes/current/oes_nat.htm)
5Weiss E. & Brandon, R. N. (2010). The Economic Value of the U.S. Early Childhood Sector. Partnership for America’s Economic Success.

$8,431
$7,630
$10,963
$9,017
$7,107 $6,799
$8,450
$7,453
$0
$2,000
$4,000
$6,000
$8,000
$10,000
$12,000
Infant Four-Year-Old
Center Accredited Center FCC Accredited FCC
Note: The State of North Dakota did not report any cost data for school-age child care.

POPULATION OHIO UNITED STATES
Total residents 11,594,163 318,857,056
Children age birth to 4 years 688,681 19,757,997
Children age birth to 4 years living in poverty
181,987 4,658,187
Children age 5 to 11 1,027,344 28,761,402
Total families with children 1,220,121 33,106,587
Single parent families 452,514 10,993,697
Families in poverty 263,004 6,603,926
CHILDREN UNDER AGE 6
POTENTIALLY IN NEED OF CHILD
CARE OHIO UNITED STATES
Children in two-parent families, both parents in labor force
298,645 8,441,764
Children in single-parent families, parent in the labor force
246,835 6,360,521
Total children under age 6 potentially needing child care
545,480 14,802,285
NUMBER OF WORKING
MOTHERS OHIO UNITED STATES
With infants under one year 89,077 2,435,563
With any children under age 6 360,773 9,721,156
With children under age 6 only
204,255 5,422,464
With both children under age 6 AND children age 6 to 17
156,518 4,298,692
Married working mothers 566,819 15,306,983
Single working mothers 287,221 6,749,078
SPACES IN CHILD CARE PROGRAMS OHIO Total spaces/slots 521,890
Percent of spaces in child care center programs*
77%
Percent of total spaces in licensed FCC homes
7%
Percent of total spaces in school-age care programs
16%
Percent of total spaces in other programs 0% Total spaces/slots of licensed programs 322,968
Percent of licensed spaces for infants and toddlers
24%
Percent of licensed spaces for preschool-aged children
44%
Percent of licensed spaces for school-aged children
32%
*Does not include school-aged programs
1 Unless otherwise noted, statistics in the Child Care Need sections are from the American Community Survey, U.S. Census Bureau, 2011-2013 three-year estimates (http://factfinder2.census.gov/faces/nav/jsf/pages/index.xhtml). 2 Unless otherwise noted, data for the rest of the Fact Sheet is provided by Child Care Resource and Referral Agencies for Child Care Aware® of America’s 2016 State Fact Sheet Survey. Data reflects the 2015 calendar year.
TYPES OF CHILD CARE OHIO
Number of center-based child care programs 5,512 Percent of centers that are nationally accredited
2%
Do faith-based programs need to be regulated?
Yes
Number of regulated faith-based programs NR Number of family child care (FCC) homes 3,564
Percent of FCC homes that are nationally accredited
1%
Number of school-aged care programs 2,412 Number of other regulated child care centers NR Number of other regulated FCC homes NR
NUMBERS, INCOME, AND
SUPPORT OF THE CHILD CARE
WORKFORCE3 OHIO
UNITED
STATES
Child care workers (in
centers) 20,000 573,430
Average annual income of child care workers4
$21,950 $22,310
Total paid early childhood workforce5
N/A 2.2 million
CCR&R CONTACTS URL Ohio Child Care Resource & Referral Association (OCCRRA)
www.occrra.org
Child Care Aware® of America
http://usa.childcareaware.org www.childcareaware.org
3 Statistics provided by the Office of Child Care from the Child Care Development Fund, and
are derived from monthly averages. Total number of child care providers includes paid relatives and other nonregulated caregivers. U.S. Totals include all 50 states and the District of Columbia (http://www.acf.hhs.gov/programs/occ/resource/fy-2013-ccdf-data-tables-preliminary)
4 Bureau of Labor Statistics, U.S. Department of Labor, Occupational Employment Survey, May 2013 estimates. Does not include child care administrators/managers, preschool teachers, special education teachers, or self-employed workers such as family child care business owners. (http://www.bls.gov/oes/current/oes_nat.htm)
5Weiss E. & Brandon, R. N. (2010). The Economic Value of the U.S. Early Childhood Sector. Partnership for America’s Economic Success.

$8,985
$7,320
$11,257
$9,185
$6,981$6,185
$8,753$7,791
$0
$2,000
$4,000
$6,000
$8,000
$10,000
$12,000
Infant Four-Year-Old
Center Accredited Center FCC Accredited FCC
$4,045 $3,767
$6,260$5,461
$7,927
$5,901
$0
$2,000
$4,000
$6,000
$8,000
$10,000
$12,000
School-Aged Child
Center (9 months) FCC (9 months) Center (12 months)
FCC (12 months) Center (Summer) FCC (Summer)

POPULATION OKLAHOMA UNITED STATES
Total residents 3,878,051 318,857,056
Children age birth to 4 years 263,795 19,757,997
Children age birth to 4 years living in poverty
63,597 4,658,187
Children age 5 to 11 376,390 28,761,402
Total families with children 419,101 33,106,587
Single parent families 143,745 10,993,697
Families in poverty 89,959 6,603,926
CHILDREN UNDER AGE 6
POTENTIALLY IN NEED OF CHILD
CARE OKLAHOMA UNITED STATES
Children in two-parent families, both parents in labor force
100,866 8,441,764
Children in single-parent families, parent in the labor force
84,708 6,360,521
Total children under age 6 potentially needing child care
185,574 14,802,285
NUMBER OF WORKING
MOTHERS OKLAHOMA UNITED STATES
With infants under one year 30,531 2,435,563
With any children under age 6 125,321 9,721,156
With children under age 6 only
70,163 5,422,464
With both children under age 6 AND children age 6 to 17
55,158 4,298,692
Married working mothers 183,338 15,306,983
Single working mothers 83,720 6,749,078
SPACES IN CHILD CARE PROGRAMS OKLAHOMA Total spaces/slots 134,243
Percent of spaces in child care center programs*
77%
Percent of total spaces in licensed FCC homes
12%
Percent of total spaces in school-age care programs
10%
Percent of total spaces in other programs 0% Total spaces/slots of licensed programs NR
Percent of licensed spaces for infants and toddlers
NR
Percent of licensed spaces for preschool-aged children
NR
Percent of licensed spaces for school-aged children
NR
*Does not include school-aged programs
1 Unless otherwise noted, statistics in the Child Care Need sections are from the American Community Survey, U.S. Census Bureau, 2011-2013 three-year estimates (http://factfinder2.census.gov/faces/nav/jsf/pages/index.xhtml). 2 Unless otherwise noted, data for the rest of the Fact Sheet is provided by Child Care Resource and Referral Agencies for Child Care Aware® of America’s 2016 State Fact Sheet Survey. Data reflects the 2015 calendar year.
TYPES OF CHILD CARE OKLAHOMA
Number of center-based child care programs 1,542 Percent of centers that are nationally accredited
3%
Do faith-based programs need to be regulated?
Yes
Number of regulated faith-based programs 115 Number of family child care (FCC) homes 1,880
Percent of FCC homes that are nationally accredited
1%
Number of school-aged care programs 223 Number of other regulated child care centers 0 Number of other regulated FCC homes 0
NUMBERS, INCOME, AND
SUPPORT OF THE CHILD CARE
WORKFORCE3 OKLAHOMA
UNITED
STATES
Child care workers (in
centers) 7,350 573,430
Average annual income of child care workers4
$19,150 $22,310
Total paid early childhood workforce5
N/A 2.2 million
CCR&R CONTACTS URL Oklahoma Child Care Resource & Referral Association
www.oklahomachildcare.org
Child Care Aware® of America
http://usa.childcareaware.org www.childcareaware.org
3 Statistics provided by the Office of Child Care from the Child Care Development Fund, and
are derived from monthly averages. Total number of child care providers includes paid relatives and other nonregulated caregivers. U.S. Totals include all 50 states and the District of Columbia (http://www.acf.hhs.gov/programs/occ/resource/fy-2013-ccdf-data-tables-preliminary)
4 Bureau of Labor Statistics, U.S. Department of Labor, Occupational Employment Survey, May 2013 estimates. Does not include child care administrators/managers, preschool teachers, special education teachers, or self-employed workers such as family child care business owners. (http://www.bls.gov/oes/current/oes_nat.htm)
5Weiss E. & Brandon, R. N. (2010). The Economic Value of the U.S. Early Childhood Sector. Partnership for America’s Economic Success.

$6,572
$5,280
$9,653
$7,450
$5,619$5,143
$7,522
$6,498
$0
$2,000
$4,000
$6,000
$8,000
$10,000
$12,000
Infant Four-Year-Old
Center Accredited Center FCC Accredited FCC
$4,265$4,647
$0
$2,000
$4,000
$6,000
$8,000
$10,000
$12,000
School-Aged Child
Center (9 months) FCC (9 months)

POPULATION OREGON UNITED STATES
Total residents 3,970,239 318,857,056
Children age birth to 4 years 226,219 19,757,997
Children age birth to 4 years living in poverty
56,351 4,658,187
Children age 5 to 11 339,940 28,761,402
Total families with children 399,932 33,106,587
Single parent families 131,135 10,993,697
Families in poverty 80,373 6,603,926
CHILDREN UNDER AGE 6
POTENTIALLY IN NEED OF CHILD
CARE OREGON UNITED STATES
Children in two-parent families, both parents in labor force
103,917 8,441,764
Children in single-parent families, parent in the labor force
61,985 6,360,521
Total children under age 6 potentially needing child care
165,902 14,802,285
NUMBER OF WORKING
MOTHERS OREGON UNITED STATES
With infants under one year 25,477 2,435,563
With any children under age 6 110,726 9,721,156
With children under age 6 only
60,957 5,422,464
With both children under age 6 AND children age 6 to 17
49,769 4,298,692
Married working mothers 188,108 15,306,983
Single working mothers 75,857 6,749,078
SPACES IN CHILD CARE PROGRAMS OREGON Total spaces/slots 136,828
Percent of spaces in child care center programs*
48%
Percent of total spaces in licensed FCC homes
24%
Percent of total spaces in school-age care programs
28%
Percent of total spaces in other programs NR Total spaces/slots of licensed programs 132,845
Percent of licensed spaces for infants and toddlers
10%
Percent of licensed spaces for preschool-aged children
15%
Percent of licensed spaces for school-aged children
74%
*Does not include school-aged programs
1 Unless otherwise noted, statistics in the Child Care Need sections are from the American Community Survey, U.S. Census Bureau, 2011-2013 three-year estimates (http://factfinder2.census.gov/faces/nav/jsf/pages/index.xhtml). 2 Unless otherwise noted, data for the rest of the Fact Sheet is provided by Child Care Resource and Referral Agencies for Child Care Aware® of America’s 2016 State Fact Sheet Survey. Data reflects the 2015 calendar year.
TYPES OF CHILD CARE OREGON
Number of center-based child care programs 1,146 Percent of centers that are nationally accredited
3%
Do faith-based programs need to be regulated?
Yes
Number of regulated faith-based programs 147 Number of family child care (FCC) homes 2,899
Percent of FCC homes that are nationally accredited
1%
Number of school-aged care programs 287 Number of other regulated child care centers NR Number of other regulated FCC homes NR
NUMBERS, INCOME, AND
SUPPORT OF THE CHILD CARE
WORKFORCE3 OREGON
UNITED
STATES
Child care workers (in
centers) 4,850 573,430
Average annual income of child care workers4
$24,410 $22,310
Total paid early childhood workforce5
N/A 2.2 million
CCR&R CONTACTS URL Central Coordination of Child Care Resource and Referral
http://triwou.org/projects/ccccrr
Child Care Aware® of America
http://usa.childcareaware.org www.childcareaware.org
3 Statistics provided by the Office of Child Care from the Child Care Development Fund, and
are derived from monthly averages. Total number of child care providers includes paid relatives and other nonregulated caregivers. U.S. Totals include all 50 states and the District of Columbia (http://www.acf.hhs.gov/programs/occ/resource/fy-2013-ccdf-data-tables-preliminary)
4 Bureau of Labor Statistics, U.S. Department of Labor, Occupational Employment Survey, May 2013 estimates. Does not include child care administrators/managers, preschool teachers, special education teachers, or self-employed workers such as family child care business owners. (http://www.bls.gov/oes/current/oes_nat.htm)
5Weiss E. & Brandon, R. N. (2010). The Economic Value of the U.S. Early Childhood Sector. Partnership for America’s Economic Success.

$11,964
$9,108
$14,976
$11,364
$7,836$7,248
$10,188$9,084
$0
$2,000
$4,000
$6,000
$8,000
$10,000
$12,000
$14,000
$16,000
Infant Four-Year-Old
Center Accredited Center FCC Accredited FCC
$3,636
$4,221
$5,562$5,799
$1,926$1,578
$0
$1,000
$2,000
$3,000
$4,000
$5,000
$6,000
$7,000
School-Aged Child
Center (9 months) FCC (9 months) Center (12 months)
FCC (12 months) Center (Summer) FCC (Summer)

POPULATION PENNSYLVANIA UNITED STATES
Total residents 12,787,209 318,857,056
Children age birth to 4 years 711,227 19,757,997
Children age birth to 4 years living in poverty
153,142 4,658,187
Children age 5 to 11 1,039,382 28,761,402
Total families with children 1,259,449 33,106,587
Single parent families 415,048 10,993,697
Families in poverty 224,000 6,603,926
CHILDREN UNDER AGE 6
POTENTIALLY IN NEED OF CHILD
CARE PENNSYLVANIA UNITED STATES
Children in two-parent families, both parents in labor force
322,918 8,441,764
Children in single-parent families, parent in the labor force
234,463 6,360,521
Total children under age 6 potentially needing child care
557,381 14,802,285
NUMBER OF WORKING
MOTHERS PENNSYLVANIA UNITED STATES
With infants under one year 93,098 2,435,563
With any children under age 6 369,703 9,721,156
With children under age 6 only
215,052 5,422,464
With both children under age 6 AND children age 6 to 17
154,651 4,298,692
Married working mothers 621,346 15,306,983
Single working mothers 247,321 6,749,078
SPACES IN CHILD CARE PROGRAMS PENNSYLVANIA Total spaces/slots 360,198
Percent of spaces in child care center programs*
94%
Percent of total spaces in licensed FCC homes
6%
Percent of total spaces in school-age care programs
0%
Percent of total spaces in other programs 0% Total spaces/slots of licensed programs NR
Percent of licensed spaces for infants and toddlers
NR
Percent of licensed spaces for preschool-aged children
NR
Percent of licensed spaces for school-aged children
NR
*Does not include school-aged programs
1 Unless otherwise noted, statistics in the Child Care Need sections are from the American Community Survey, U.S. Census Bureau, 2011-2013 three-year estimates (http://factfinder2.census.gov/faces/nav/jsf/pages/index.xhtml). 2 Unless otherwise noted, data for the rest of the Fact Sheet is provided by Child Care Resource and Referral Agencies for Child Care Aware® of America’s 2016 State Fact Sheet Survey. Data reflects the 2015 calendar year.
TYPES OF CHILD CARE PENNSYLVANIA
Number of center-based child care programs 4,753 Percent of centers that are nationally accredited
0%
Do faith-based programs need to be regulated?
Yes
Number of regulated faith-based programs NR Number of family child care (FCC) homes 3,165
Percent of FCC homes that are nationally accredited
0%
Number of school-aged care programs 5,013 Number of other regulated child care centers NR Number of other regulated FCC homes NR
NUMBERS, INCOME, AND
SUPPORT OF THE CHILD CARE
WORKFORCE3 PENNSYLVANIA
UNITED
STATES
Child care workers (in
centers) 21,950 573,430
Average annual income of child care workers4
$21,010 $22,310
Total paid early childhood workforce5
N/A 2.2 million
CCR&R CONTACTS URL NR NR Child Care Aware® of America
http://usa.childcareaware.org www.childcareaware.org
3 Statistics provided by the Office of Child Care from the Child Care Development Fund, and
are derived from monthly averages. Total number of child care providers includes paid relatives and other nonregulated caregivers. U.S. Totals include all 50 states and the District of Columbia (http://www.acf.hhs.gov/programs/occ/resource/fy-2013-ccdf-data-tables-preliminary)
4 Bureau of Labor Statistics, U.S. Department of Labor, Occupational Employment Survey, May 2013 estimates. Does not include child care administrators/managers, preschool teachers, special education teachers, or self-employed workers such as family child care business owners. (http://www.bls.gov/oes/current/oes_nat.htm)
5Weiss E. & Brandon, R. N. (2010). The Economic Value of the U.S. Early Childhood Sector. Partnership for America’s Economic Success.

6 Note: Pennsylvania did not provide updated cost of care data for 2015. These figures reflect data collected in 2014 and adjusted for inflation.
$11,978
$9,119$7,966
$7,148
$0
$2,000
$4,000
$6,000
$8,000
$10,000
$12,000
$14,000
Infant Four-Year-Old
Center FCC
$5,699
$5,354
$5,100
$5,200
$5,300
$5,400
$5,500
$5,600
$5,700
$5,800
School-Aged Child
Center FCC

POPULATION RHODE
ISLAND UNITED STATES
Total residents 1,055,173 318,857,056
Children age birth to 4 years 54,856 19,757,997
Children age birth to 4 years living in poverty
12,746 4,658,187
Children age 5 to 11 80,346 28,761,402
Total families with children 108,679 33,106,587
Single parent families 42,324 10,993,697
Families in poverty 21,018 6,603,926
CHILDREN UNDER AGE 6
POTENTIALLY IN NEED OF CHILD
CARE
RHODE
ISLAND UNITED STATES
Children in two-parent families, both parents in labor force
26,265 8,441,764
Children in single-parent families, parent in the labor force
20,953 6,360,521
Total children under age 6 potentially needing child care
47,218 14,802,285
NUMBER OF WORKING
MOTHERS RHODE
ISLAND UNITED STATES
With infants under one year 7,333 2,435,563
With any children under age 6 32,916 9,721,156
With children under age 6 only
19,372 5,422,464
With both children under age 6 AND children age 6 to 17
13,544 4,298,692
Married working mothers 52,134 15,306,983
Single working mothers 27,430 6,749,078
SPACES IN CHILD CARE PROGRAMS RHODE ISLAND Total spaces/slots NR
Percent of spaces in child care center programs*
NR
Percent of total spaces in licensed FCC homes
NR
Percent of total spaces in school-age care programs
NR
Percent of total spaces in other programs NR Total spaces/slots of licensed programs NR
Percent of licensed spaces for infants and toddlers
NR
Percent of licensed spaces for preschool-aged children
NR
Percent of licensed spaces for school-aged children
NR
*Does not include school-aged programs
1 Unless otherwise noted, statistics in the Child Care Need sections are from the American Community Survey, U.S. Census Bureau, 2011-2013 three-year estimates (http://factfinder2.census.gov/faces/nav/jsf/pages/index.xhtml). 2 Unless otherwise noted, data for the rest of the Fact Sheet is provided by Child Care Resource and Referral Agencies for Child Care Aware® of America’s 2016 State Fact Sheet Survey. Data reflects the 2015 calendar year.
TYPES OF CHILD CARE RHODE
ISLAND
Number of center-based child care programs 311 Percent of centers that are nationally accredited 10% Do faith-based programs need to be regulated? Yes Number of regulated faith-based programs
Number of family child care (FCC) homes 552 Percent of FCC homes that are nationally accredited
0%
Number of school-aged care programs 101 Number of other regulated child care centers NR Number of other regulated FCC homes NR
NUMBERS, INCOME, AND
SUPPORT OF THE CHILD CARE
WORKFORCE3 RHODE ISLAND
UNITED
STATES
Child care workers (in
centers) 2,100 573,430
Average annual income of child care workers4
$22,700 $22,310
Total paid early childhood workforce5
N/A 2.2 million
CCR&R CONTACTS URL
NR Brightstars.org
earlyeducationmatters.org Child Care Aware® of America
http://usa.childcareaware.org www.childcareaware.org
3 Statistics provided by the Office of Child Care from the Child Care Development Fund, and
are derived from monthly averages. Total number of child care providers includes paid relatives and other nonregulated caregivers. U.S. Totals include all 50 states and the District of Columbia (http://www.acf.hhs.gov/programs/occ/resource/fy-2013-ccdf-data-tables-preliminary)
4 Bureau of Labor Statistics, U.S. Department of Labor, Occupational Employment Survey, May 2013 estimates. Does not include child care administrators/managers, preschool teachers, special education teachers, or self-employed workers such as family child care business owners. (http://www.bls.gov/oes/current/oes_nat.htm)
5Weiss E. & Brandon, R. N. (2010). The Economic Value of the U.S. Early Childhood Sector. Partnership for America’s Economic Success.

6 Note: Rhode Island did not provide updated cost of care data for 2015. These figures reflect data collected in 2014 and adjusted for inflation.
$12,882
$10,052$10,052$9,258
$0
$2,000
$4,000
$6,000
$8,000
$10,000
$12,000
$14,000
Infant Four-Year-Old
Center FCC
$5,380 $4,497
$5,415$5,952
$2,428 $2,066
$0
$2,000
$4,000
$6,000
$8,000
$10,000
$12,000
$14,000
School-Aged Child
Center (9 months) FCC (9 months) Center (12 months)
FCC (12 months) Center (Summer) FCC (Summer)

POPULATION SOUTH
CAROLINA UNITED STATES
Total residents 4,832,482 318,857,056
Children age birth to 4 years 286,928 19,757,997
Children age birth to 4 years living in poverty
83,438 4,658,187
Children age 5 to 11 436,155 28,761,402
Total families with children 464,469 33,106,587
Single parent families 179,242 10,993,697
Families in poverty 117,911 6,603,926
CHILDREN UNDER AGE 6
POTENTIALLY IN NEED OF CHILD
CARE
SOUTH
CAROLINA UNITED STATES
Children in two-parent families, both parents in labor force
110,505 8,441,764
Children in single-parent families, parent in the labor force
111,025 6,360,521
Total children under age 6 potentially needing child care
221,530 14,802,285
NUMBER OF WORKING
MOTHERS SOUTH
CAROLINA UNITED STATES
With infants under one year 35,688 2,435,563
With any children under age 6 148,856 9,721,156
With children under age 6 only
82,546 5,422,464
With both children under age 6 AND children age 6 to 17
66,310 4,298,692
Married working mothers 201,809 15,306,983
Single working mothers 117,635 6,749,078
SPACES IN CHILD CARE PROGRAMS SOUTH CAROLINA Total spaces/slots NR
Percent of spaces in child care center programs*
NR
Percent of total spaces in licensed FCC homes
NR
Percent of total spaces in school-age care programs
NR
Percent of total spaces in other programs NR Total spaces/slots of licensed programs NR
Percent of licensed spaces for infants and toddlers
NR
Percent of licensed spaces for preschool-aged children
NR
Percent of licensed spaces for school-aged children
NR
*Does not include school-aged programs
1 Unless otherwise noted, statistics in the Child Care Need sections are from the American Community Survey, U.S. Census Bureau, 2011-2013 three-year estimates (http://factfinder2.census.gov/faces/nav/jsf/pages/index.xhtml). 2 Unless otherwise noted, data for the rest of the Fact Sheet is provided by Child Care Resource and Referral Agencies for Child Care Aware® of America’s 2016 State Fact Sheet Survey. Data reflects the 2015 calendar year.
TYPES OF CHILD CARE SOUTH
CAROLINA
Number of center-based child care programs NR Percent of centers that are nationally accredited
NR
Do faith-based programs need to be regulated?
NR
Number of regulated faith-based programs NR Number of family child care (FCC) homes NR
Percent of FCC homes that are nationally accredited
NR
Number of school-aged care programs NR Number of other regulated child care centers NR Number of other regulated FCC homes NR
NUMBERS, INCOME, AND
SUPPORT OF THE CHILD CARE
WORKFORCE3 SOUTH CAROLINA
UNITED
STATES
Child care workers (in
centers) 5,710 573,430
Average annual income of child care workers4
$19,240 $22,310
Total paid early childhood workforce5
N/A 2.2 million
CCR&R CONTACTS URL SC Child Care Resource & Referral Network
http://www.sc-ccrr.org/
Child Care Aware® of America
http://usa.childcareaware.org www.childcareaware.org
3 Statistics provided by the Office of Child Care from the Child Care Development Fund, and
are derived from monthly averages. Total number of child care providers includes paid relatives and other nonregulated caregivers. U.S. Totals include all 50 states and the District of Columbia (http://www.acf.hhs.gov/programs/occ/resource/fy-2013-ccdf-data-tables-preliminary)
4 Bureau of Labor Statistics, U.S. Department of Labor, Occupational Employment Survey, May 2013 estimates. Does not include child care administrators/managers, preschool teachers, special education teachers, or self-employed workers such as family child care business owners. (http://www.bls.gov/oes/current/oes_nat.htm)
5Weiss E. & Brandon, R. N. (2010). The Economic Value of the U.S. Early Childhood Sector. Partnership for America’s Economic Success.

6 Note: South Carolina did not provide updated cost of care data for 2015. These figures reflect data collected in 2014 and adjusted for inflation.
$6,483
$4,657
$2,260
$4,590
$4,050
$1,848
$0
$1,000
$2,000
$3,000
$4,000
$5,000
$6,000
$7,000
Infant Four-Year-Old School-Age Child
Center FCC

POPULATION SOUTH
DAKOTA UNITED STATES
Total residents 853,175 318,857,056
Children age birth to 4 years 60,355 19,757,997
Children age birth to 4 years living in poverty
13,450 4,658,187
Children age 5 to 11 81,687 28,761,402
Total families with children 88,396 33,106,587
Single parent families 28,631 10,993,697
Families in poverty 14,992 6,603,926
CHILDREN UNDER AGE 6
POTENTIALLY IN NEED OF CHILD
CARE
SOUTH
DAKOTA UNITED STATES
Children in two-parent families, both parents in labor force
33,637 8,441,764
Children in single-parent families, parent in the labor force
17,478 6,360,521
Total children under age 6 potentially needing child care
51,115 14,802,285
NUMBER OF WORKING
MOTHERS SOUTH
DAKOTA UNITED STATES
With infants under one year 7,329 2,435,563
With any children under age 6 30,784 9,721,156
With children under age 6 only
16,080 5,422,464
With both children under age 6 AND children age 6 to 17
14,704 4,298,692
Married working mothers 48,721 15,306,983
Single working mothers 17,640 6,749,078
SPACES IN CHILD CARE PROGRAMS SOUTH DAKOTA Total spaces/slots 46,839
Percent of spaces in child care center programs*
47%
Percent of total spaces in licensed FCC homes
17%
Percent of total spaces in school-age care programs
36%
Percent of total spaces in other programs 0% Total spaces/slots of licensed programs 139,953
Percent of licensed spaces for infants and toddlers
NR
Percent of licensed spaces for preschool-aged children
NR
Percent of licensed spaces for school-aged children
NR
*Does not include school-aged programs
1 Unless otherwise noted, statistics in the Child Care Need sections are from the American Community Survey, U.S. Census Bureau, 2011-2013 three-year estimates (http://factfinder2.census.gov/faces/nav/jsf/pages/index.xhtml). 2 Unless otherwise noted, data for the rest of the Fact Sheet is provided by Child Care Resource and Referral Agencies for Child Care Aware® of America’s 2016 State Fact Sheet Survey. Data reflects the 2015 calendar year.
TYPES OF CHILD CARE SOUTH
DAKOTA
Number of center-based child care programs 261 Percent of centers that are nationally accredited
2%
Do faith-based programs need to be regulated?
Yes
Number of regulated faith-based programs NR Number of family child care (FCC) homes 694
Percent of FCC homes that are nationally accredited
0%
Number of school-aged care programs 154 Number of other regulated child care centers 0 Number of other regulated FCC homes 0
NUMBERS, INCOME, AND
SUPPORT OF THE CHILD CARE
WORKFORCE3 SOUTH DAKOTA
UNITED
STATES
Child care workers (in
centers) 2,510 573,430
Average annual income of child care workers4
$20,380 $22,310
Total paid early childhood workforce5
N/A 2.2 million
CCR&R CONTACTS URL
NR www.helplinecenter.org
www.dss.sd.gov/childcare Child Care Aware® of America
http://usa.childcareaware.org www.childcareaware.org
3 Statistics provided by the Office of Child Care from the Child Care Development Fund, and
are derived from monthly averages. Total number of child care providers includes paid relatives and other nonregulated caregivers. U.S. Totals include all 50 states and the District of Columbia (http://www.acf.hhs.gov/programs/occ/resource/fy-2013-ccdf-data-tables-preliminary)
4 Bureau of Labor Statistics, U.S. Department of Labor, Occupational Employment Survey, May 2015 estimates. Does not include child care administrators/managers, preschool teachers, special education teachers, or self-employed workers such as family child care business owners. (http://www.bls.gov/oes/current/oes_nat.htm)
5Weiss E. & Brandon, R. N. (2010). The Economic Value of the U.S. Early Childhood Sector. Partnership for America’s Economic Success.

$6,143$5,810
$4,852 $4,810
$0
$1,000
$2,000
$3,000
$4,000
$5,000
$6,000
$7,000
Infant Four-Year-Old
Center FCC
$4,310
$3,670
$3,200
$3,400
$3,600
$3,800
$4,000
$4,200
$4,400
School-Aged Child
Center (9 months) FCC (9 months)

POPULATION TENNESSEE UNITED STATES
Total residents 6,549,352 318,857,056
Children age birth to 4 years 398,196 19,757,997
Children age birth to 4 years living in poverty
114,324 4,658,187
Children age 5 to 11 586,183 28,761,402
Total families with children 684,986 33,106,587
Single parent families 236,895 10,993,697
Families in poverty 174,131 6,603,926
CHILDREN UNDER AGE 6
POTENTIALLY IN NEED OF CHILD
CARE TENNESSEE UNITED STATES
Children in two-parent families, both parents in labor force
157,258 8,441,764
Children in single-parent families, parent in the labor force
133,925 6,360,521
Total children under age 6 potentially needing child care
291,183 14,802,285
NUMBER OF WORKING
MOTHERS TENNESSEE UNITED STATES
With infants under one year 52,012 2,435,563
With any children under age 6 198,265 9,721,156
With children under age 6 only
113,158 5,422,464
With both children under age 6 AND children age 6 to 17
85,107 4,298,692
Married working mothers 306,365 15,306,983
Single working mothers 146,365 6,749,078
SPACES IN CHILD CARE PROGRAMS TENNESSEE Total spaces/slots 325,705
Percent of spaces in child care center programs*
98%
Percent of total spaces in licensed FCC homes
2%
Percent of total spaces in school-age care programs**
99%
Percent of total spaces in other programs <1% Total spaces/slots of licensed programs 325,277
Percent of licensed spaces for infants and toddlers
NR
Percent of licensed spaces for preschool-aged children
NR
Percent of licensed spaces for school-aged children
NR
*Does not include school-aged programs
**This is the total number of program slots that serve at least some school-age
children.
1 Unless otherwise noted, statistics in the Child Care Need sections are from the American Community Survey, U.S. Census Bureau, 2011-2013 three-year estimates (http://factfinder2.census.gov/faces/nav/jsf/pages/index.xhtml). 2 Unless otherwise noted, data for the rest of the Fact Sheet is provided by Child Care Resource and Referral Agencies for Child Care Aware® of America’s 2016 State Fact Sheet Survey. Data reflects the 2015 calendar year.
TYPES OF CHILD CARE TENNESSEE
Number of center-based child care programs 3,711 Percent of centers that are nationally accredited
30%
Do faith-based programs need to be regulated?
Yes
Number of regulated faith-based programs 419 Number of family child care (FCC) homes 715
Percent of FCC homes that are nationally accredited
10%
Number of school-aged care programs 3,645 Number of other regulated child care centers 7 Number of other regulated FCC homes 0
NUMBERS, INCOME, AND
SUPPORT OF THE CHILD CARE
WORKFORCE3 TENNESSEE
UNITED
STATES
Child care workers (in
centers) 10,150 573,430
Average annual income of child care workers4
$20,140 $22,310
Total paid early childhood workforce5
N/A 2.2 million
CCR&R CONTACTS URL TN CCR&R Network managed by Signal Centers, Inc.
www.tnccrr.org
Child Care Aware® of America
http://usa.childcareaware.org www.childcareaware.org
3 Statistics provided by the Office of Child Care from the Child Care Development Fund, and
are derived from monthly averages. Total number of child care providers includes paid relatives and other nonregulated caregivers. U.S. Totals include all 50 states and the District of Columbia (http://www.acf.hhs.gov/programs/occ/resource/fy-2013-ccdf-data-tables-preliminary)
4 Bureau of Labor Statistics, U.S. Department of Labor, Occupational Employment Survey, May 2013 estimates. Does not include child care administrators/managers, preschool teachers, special education teachers, or self-employed workers such as family child care business owners. (http://www.bls.gov/oes/current/oes_nat.htm)
5Weiss E. & Brandon, R. N. (2010). The Economic Value of the U.S. Early Childhood Sector. Partnership for America’s Economic Success.

$8,378
$7,113
$6,115$5,508
$0
$1,000
$2,000
$3,000
$4,000
$5,000
$6,000
$7,000
$8,000
$9,000
Infant Four-Year-Old
Center FCC
$2,508 $2,540
$3,344 $3,387
$1,118 $1,075
$0
$1,000
$2,000
$3,000
$4,000
$5,000
$6,000
$7,000
$8,000
$9,000
School-Aged Child
Center (9 months) FCC (9 months) Center (12 months)
FCC (12 months) Center (Summer) FCC (Summer)

POPULATION TEXAS UNITED STATES
Total residents 26,956,958 318,857,056
Children age birth to 4 years 1,945,497 19,757,997
Children age birth to 4 years living in poverty
511,892 4,658,187
Children age 5 to 11 2,808,392 28,761,402
Total families with children 3,042,473 33,106,587
Single parent families 986,960 10,993,697
Families in poverty 681,865 6,603,926
CHILDREN UNDER AGE 6
POTENTIALLY IN NEED OF CHILD
CARE TEXAS UNITED STATES
Children in two-parent families, both parents in labor force
723,115 8,441,764
Children in single-parent families, parent in the labor force
618,939 6,360,521
Total children under age 6 potentially needing child care
1,342,054 14,802,285
NUMBER OF WORKING
MOTHERS TEXAS UNITED STATES
With infants under one year 213,300 2,435,563
With any children under age 6 875,011 9,721,156
With children under age 6 only
453,762 5,422,464
With both children under age 6 AND children age 6 to 17
421,249 4,298,692
Married working mothers 1,280,171 15,306,983
Single working mothers 628,046 6,749,078
SPACES IN CHILD CARE PROGRAMS TEXAS Total spaces/slots 1,089,521
Percent of spaces in child care center programs*
93%
Percent of total spaces in licensed FCC homes
7%
Percent of total spaces in school-age care programs
NR
Percent of total spaces in other programs 0% Total spaces/slots of licensed programs 1,013,254
Percent of licensed spaces for infants and toddlers
NR
Percent of licensed spaces for preschool-aged children
NR
Percent of licensed spaces for school-aged children
NR
*Does not include school-aged programs
1 Unless otherwise noted, statistics in the Child Care Need sections are from the American Community Survey, U.S. Census Bureau, 2011-2013 three-year estimates (http://factfinder2.census.gov/faces/nav/jsf/pages/index.xhtml). 2 Unless otherwise noted, data for the rest of the Fact Sheet is provided by Child Care Resource and Referral Agencies for Child Care Aware® of America’s 2016 State Fact Sheet Survey. Data reflects the 2015 calendar year.
TYPES OF CHILD CARE TEXAS
Number of center-based child care programs 9,416 Percent of centers that are nationally accredited
8%
Do faith-based programs need to be regulated?
Yes
Number of regulated faith-based programs NR Number of family child care (FCC) homes 6,249
Percent of FCC homes that are nationally accredited
2%
Number of school-aged care programs NR Number of other regulated child care centers NR Number of other regulated FCC homes NR
NUMBERS, INCOME, AND
SUPPORT OF THE CHILD CARE
WORKFORCE3 TEXAS
UNITED
STATES
Child care workers (in
centers) 56,950 573,430
Average annual income of child care workers4
$20,240 $22,310
Total paid early childhood workforce5
N/A 2.2 million
CCR&R CONTACTS URL Texas Association of Child Care Resource and Referral Agencies (TACCRRA)
www.taccrra.net
Child Care Aware® of America
http://usa.childcareaware.org www.childcareaware.org
3 Statistics provided by the Office of Child Care from the Child Care Development Fund, and
are derived from monthly averages. Total number of child care providers includes paid relatives and other nonregulated caregivers. U.S. Totals include all 50 states and the District of Columbia (http://www.acf.hhs.gov/programs/occ/resource/fy-2013-ccdf-data-tables-preliminary)
4 Bureau of Labor Statistics, U.S. Department of Labor, Occupational Employment Survey, May 2013 estimates. Does not include child care administrators/managers, preschool teachers, special education teachers, or self-employed workers such as family child care business owners. (http://www.bls.gov/oes/current/oes_nat.htm)
5Weiss E. & Brandon, R. N. (2010). The Economic Value of the U.S. Early Childhood Sector. Partnership for America’s Economic Success.

6 Note: Texas did not provide updated cost of care data for 2015. These figures reflect data collected in 2014 and adjusted for inflation.
$8,770
$6,738
$3,220
$6,642
$5,206
$2,649
$0
$1,000
$2,000
$3,000
$4,000
$5,000
$6,000
$7,000
$8,000
$9,000
$10,000
Infant Four-Year-Old School-Age Child
Center FCC

POPULATION UTAH UNITED STATES
Total residents 2,942,902 318,857,056
Children age birth to 4 years 249,809 19,757,997
Children age birth to 4 years living in poverty
35,438 4,658,187
Children age 5 to 11 364,723 28,761,402
Total families with children 352,992 33,106,587
Single parent families 70,506 10,993,697
Families in poverty 44,436 6,603,926
CHILDREN UNDER AGE 6
POTENTIALLY IN NEED OF CHILD
CARE UTAH UNITED STATES
Children in two-parent families, both parents in labor force
110,030 8,441,764
Children in single-parent families, parent in the labor force
39,454 6,360,521
Total children under age 6 potentially needing child care
149,484 14,802,285
NUMBER OF WORKING
MOTHERS UTAH UNITED STATES
With infants under one year 25,532 2,435,563
With any children under age 6 102,878 9,721,156
With children under age 6 only
52,617 5,422,464
With both children under age 6 AND children age 6 to 17
50,261 4,298,692
Married working mothers 168,192 15,306,983
Single working mothers 43,591 6,749,078
SPACES IN CHILD CARE PROGRAMS UTAH Total spaces/slots 60,257
Percent of spaces in child care center programs*
45%
Percent of total spaces in licensed FCC homes
16%
Percent of total spaces in school-age care programs
39%
Percent of total spaces in other programs 6% Total spaces/slots of licensed programs 37,227
Percent of licensed spaces for infants and toddlers
17%
Percent of licensed spaces for preschool-aged children
55%
Percent of licensed spaces for school-aged children
28%
*Does not include school-aged programs
1 Unless otherwise noted, statistics in the Child Care Need sections are from the American Community Survey, U.S. Census Bureau, 2011-2013 three-year estimates (http://factfinder2.census.gov/faces/nav/jsf/pages/index.xhtml). 2 Unless otherwise noted, data for the rest of the Fact Sheet is provided by Child Care Resource and Referral Agencies for Child Care Aware® of America’s 2016 State Fact Sheet Survey. Data reflects the 2015 calendar year.
TYPES OF CHILD CARE UTAH
Number of center-based child care programs 298 Percent of centers that are nationally accredited
6%
Do faith-based programs need to be regulated?
Yes
Number of regulated faith-based programs NR Number of family child care (FCC) homes 769
Percent of FCC homes that are nationally accredited
1%
Number of school-aged care programs 301 Number of other regulated child care centers Number of other regulated FCC homes 498
NUMBERS, INCOME, AND
SUPPORT OF THE CHILD CARE
WORKFORCE3 UTAH
UNITED
STATES
Child care workers (in
centers) 5,420 573,430
Average annual income of child care workers4
$21,930 $22,310
Total paid early childhood workforce5
N/A 2.2 million
CCR&R CONTACTS URL Karrie Phillips Utah Office of Child Care
www.careaboutchildcare.utah.gov
Child Care Aware® of America
http://usa.childcareaware.org www.childcareaware.org
3 Statistics provided by the Office of Child Care from the Child Care Development Fund, and
are derived from monthly averages. Total number of child care providers includes paid relatives and other nonregulated caregivers. U.S. Totals include all 50 states and the District of Columbia (http://www.acf.hhs.gov/programs/occ/resource/fy-2013-ccdf-data-tables-preliminary)
4 Bureau of Labor Statistics, U.S. Department of Labor, Occupational Employment Survey, May 2013 estimates. Does not include child care administrators/managers, preschool teachers, special education teachers, or self-employed workers such as family child care business owners. (http://www.bls.gov/oes/current/oes_nat.htm)
5Weiss E. & Brandon, R. N. (2010). The Economic Value of the U.S. Early Childhood Sector. Partnership for America’s Economic Success.

$9,183
$7,167
$12,037
$8,646
$6,950$6,143$6,184 $5,856
$0
$2,000
$4,000
$6,000
$8,000
$10,000
$12,000
$14,000
Infant Four-Year-Old
Center Accredited Center FCC Accredited FCC
$4,946$4,333
$6,594$5,778
$1,648 $1,444
$0
$2,000
$4,000
$6,000
$8,000
$10,000
$12,000
$14,000
School-Aged Child
Center (9 months) FCC (9 months) Center (12 months)
FCC (12 months) Center (Summer) FCC (Summer)

POPULATION VERMONT UNITED STATES
Total residents 626,562 318,857,056
Children age birth to 4 years 30,881 19,757,997
Children age birth to 4 years living in poverty
5,278 4,658,187
Children age 5 to 11 47,342 28,761,402
Total families with children 65,749 33,106,587
Single parent families 22,952 10,993,697
Families in poverty 10,006 6,603,926
CHILDREN UNDER AGE 6
POTENTIALLY IN NEED OF CHILD
CARE VERMONT UNITED STATES
Children in two-parent families, both parents in labor force
15,648 8,441,764
Children in single-parent families, parent in the labor force
10,781 6,360,521
Total children under age 6 potentially needing child care
26,429 14,802,285
NUMBER OF WORKING
MOTHERS VERMONT UNITED STATES
With infants under one year 4,962 2,435,563
With any children under age 6 19,434 9,721,156
With children under age 6 only
11,867 5,422,464
With both children under age 6 AND children age 6 to 17
7,567 4,298,692
Married working mothers 34,155 15,306,983
Single working mothers 13,317 6,749,078
SPACES IN CHILD CARE PROGRAMS VERMONT Total spaces/slots 32,482
Percent of spaces in child care center programs*
51%
Percent of total spaces in licensed FCC homes
23%
Percent of total spaces in school-age care programs
26%
Percent of total spaces in other programs 0% Total spaces/slots of licensed programs 32,521
Percent of licensed spaces for infants and toddlers
22%
Percent of licensed spaces for preschool-aged children
37%
Percent of licensed spaces for school-aged children
41%
*Does not include school-aged programs
1 Unless otherwise noted, statistics in the Child Care Need sections are from the American Community Survey, U.S. Census Bureau, 2011-2013 three-year estimates (http://factfinder2.census.gov/faces/nav/jsf/pages/index.xhtml). 2 Unless otherwise noted, data for the rest of the Fact Sheet is provided by Child Care Resource and Referral Agencies for Child Care Aware® of America’s 2016 State Fact Sheet Survey. Data reflects the 2015 calendar year.
TYPES OF CHILD CARE VERMONT
Number of center-based child care programs 522 Percent of centers that are nationally accredited
11%
Do faith-based programs need to be regulated?
Yes
Number of regulated faith-based programs 0 Number of family child care (FCC) homes 788
Percent of FCC homes that are nationally accredited
2%
Number of school-aged care programs 147 Number of other regulated child care centers NR Number of other regulated FCC homes NR
NUMBERS, INCOME, AND
SUPPORT OF THE CHILD CARE
WORKFORCE3 VERMONT
UNITED
STATES
Child care workers (in
centers) 1,000 573,430
Average annual income of child care workers4
$24,850 $22,310
Total paid early childhood workforce5
N/A 2.2 million
CCR&R CONTACTS URL Vermont Association of Child Care Resource and Referral Agencies (VACCRRA)
http://www.vermontchildcare.org/
Child Care Aware® of America
http://usa.childcareaware.org www.childcareaware.org
3 Statistics provided by the Office of Child Care from the Child Care Development Fund, and
are derived from monthly averages. Total number of child care providers includes paid relatives and other nonregulated caregivers. U.S. Totals include all 50 states and the District of Columbia (http://www.acf.hhs.gov/programs/occ/resource/fy-2013-ccdf-data-tables-preliminary)
4 Bureau of Labor Statistics, U.S. Department of Labor, Occupational Employment Survey, May 2013 estimates. Does not include child care administrators/managers, preschool teachers, special education teachers, or self-employed workers such as family child care business owners. (http://www.bls.gov/oes/current/oes_nat.htm)
5Weiss E. & Brandon, R. N. (2010). The Economic Value of the U.S. Early Childhood Sector. Partnership for America’s Economic Success.

$11,513$10,440
$8,205$7,749
$0
$2,000
$4,000
$6,000
$8,000
$10,000
$12,000
$14,000
Infant Four-Year-Old
Center FCC
$4,061$3,446
$2,400$1,794
$0
$2,000
$4,000
$6,000
$8,000
$10,000
$12,000
$14,000
School-Aged Child
Center (9 months) FCC (9 months) Center (Summer) FCC (Summer)

POPULATION VIRGINIA UNITED STATES
Total residents 8,326,289 318,857,056
Children age birth to 4 years 507,550 19,757,997
Children age birth to 4 years living in poverty
84,421 4,658,187
Children age 5 to 11 730,562 28,761,402
Total families with children 902,882 33,106,587
Single parent families 265,596 10,993,697
Families in poverty 132,672 6,603,926
CHILDREN UNDER AGE 6
POTENTIALLY IN NEED OF CHILD
CARE VIRGINIA UNITED STATES
Children in two-parent families, both parents in labor force
247,162 8,441,764
Children in single-parent families, parent in the labor force
146,245 6,360,521
Total children under age 6 potentially needing child care
393,407 14,802,285
NUMBER OF WORKING
MOTHERS VIRGINIA UNITED STATES
With infants under one year 74,395 2,435,563
With any children under age 6 272,599 9,721,156
With children under age 6 only
156,083 5,422,464
With both children under age 6 AND children age 6 to 17
116,516 4,298,692
Married working mothers 449,373 15,306,983
Single working mothers 170,718 6,749,078
SPACES IN CHILD CARE PROGRAMS VIRGINIA Total spaces/slots 364,817
Percent of spaces in child care center programs*
68%
Percent of total spaces in licensed FCC homes
4%
Percent of total spaces in school-age care programs
25%
Percent of total spaces in other programs 7% Total spaces/slots of licensed programs NR
Percent of licensed spaces for infants and toddlers
NR
Percent of licensed spaces for preschool-aged children
NR
Percent of licensed spaces for school-aged children
NR
*Does not include school-aged programs
1 Unless otherwise noted, statistics in the Child Care Need sections are from the American Community Survey, U.S. Census Bureau, 2011-2013 three-year estimates (http://factfinder2.census.gov/faces/nav/jsf/pages/index.xhtml). 2 Unless otherwise noted, data for the rest of the Fact Sheet is provided by Child Care Resource and Referral Agencies for Child Care Aware® of America’s 2016 State Fact Sheet Survey. Data reflects the 2015 calendar year.
TYPES OF CHILD CARE VIRGINIA
Number of center-based child care programs 2,507 Percent of centers that are nationally accredited
8%
Do faith-based programs need to be regulated?
Yes
Number of regulated faith-based programs 1,006 Number of family child care (FCC) homes 1,331
Percent of FCC homes that are nationally accredited
0%
Number of school-aged care programs 1,144 Number of other regulated child care centers 403 Number of other regulated FCC homes 2,960
NUMBERS, INCOME, AND
SUPPORT OF THE CHILD CARE
WORKFORCE3 VIRGINIA
UNITED
STATES
Child care workers (in
centers) 14,310 573,430
Average annual income of child care workers4
$22,440 $22,310
Total paid early childhood workforce5
N/A 2.2 million
CCR&R CONTACTS URL Child Care Aware of Virginia
www.va.childcareaware.org
Child Care Aware® of America
http://usa.childcareaware.org www.childcareaware.org
3 Statistics provided by the Office of Child Care from the Child Care Development Fund, and
are derived from monthly averages. Total number of child care providers includes paid relatives and other nonregulated caregivers. U.S. Totals include all 50 states and the District of Columbia (http://www.acf.hhs.gov/programs/occ/resource/fy-2013-ccdf-data-tables-preliminary)
4 Bureau of Labor Statistics, U.S. Department of Labor, Occupational Employment Survey, May 2013 estimates. Does not include child care administrators/managers, preschool teachers, special education teachers, or self-employed workers such as family child care business owners. (http://www.bls.gov/oes/current/oes_nat.htm)
5Weiss E. & Brandon, R. N. (2010). The Economic Value of the U.S. Early Childhood Sector. Partnership for America’s Economic Success.

$12,220
$9,256
$15,340
$12,376
$10,088
$8,164
$10,244$9,464
$0
$2,000
$4,000
$6,000
$8,000
$10,000
$12,000
$14,000
$16,000
$18,000
Infant Four-Year-Old
Center Accredited Center FCC Accredited FCC
$4,368$3,471
$1,937 $1,768
$0
$2,000
$4,000
$6,000
$8,000
$10,000
$12,000
$14,000
$16,000
$18,000
School-Aged Child
Center (9 months) FCC (9 months) Center (Summer) FCC (Summer)

POPULATION WASHINGTON UNITED STATES
Total residents 7,061,530 318,857,056
Children age birth to 4 years 443,642 19,757,997
Children age birth to 4 years living in poverty
84,154 4,658,187
Children age 5 to 11 630,487 28,761,402
Total families with children 741,402 33,106,587
Single parent families 217,833 10,993,697
Families in poverty 115,098 6,603,926
CHILDREN UNDER AGE 6
POTENTIALLY IN NEED OF CHILD
CARE WASHINGTON UNITED STATES
Children in two-parent families, both parents in labor force
191,018 8,441,764
Children in single-parent families, parent in the labor force
115,633 6,360,521
Total children under age 6 potentially needing child care
306,651 14,802,285
NUMBER OF WORKING
MOTHERS WASHINGTON UNITED STATES
With infants under one year 49,406 2,435,563
With any children under age 6 207,131 9,721,156
With children under age 6 only
115,139 5,422,464
With both children under age 6 AND children age 6 to 17
91,992 4,298,692
Married working mothers 342,617 15,306,983
Single working mothers 123,956 6,749,078
SPACES IN CHILD CARE PROGRAMS WASHINGTON Total spaces/slots 166,348
Percent of spaces in child care center programs*
64%
Percent of total spaces in licensed FCC homes
22%
Percent of total spaces in school-age care programs
14%
Percent of total spaces in other programs 0% Total spaces/slots of licensed programs 179,037
Percent of licensed spaces for infants and toddlers
17%
Percent of licensed spaces for preschool-aged children
44%
Percent of licensed spaces for school-aged children
39%
*Does not include school-aged programs
1 Unless otherwise noted, statistics in the Child Care Need sections are from the American Community Survey, U.S. Census Bureau, 2011-2013 three-year estimates (http://factfinder2.census.gov/faces/nav/jsf/pages/index.xhtml). 2 Unless otherwise noted, data for the rest of the Fact Sheet is provided by Child Care Resource and Referral Agencies for Child Care Aware® of America’s 2016 State Fact Sheet Survey. Data reflects the 2015 calendar year.
TYPES OF CHILD CARE WASHINGTON
Number of center-based child care programs 1,554 Percent of centers that are nationally accredited
10%
Do faith-based programs need to be regulated?
Yes
Number of regulated faith-based programs 224 Number of family child care (FCC) homes 3,706
Percent of FCC homes that are nationally accredited
2%
Number of school-aged care programs 500 Number of other regulated child care centers NR Number of other regulated FCC homes NR
NUMBERS, INCOME, AND
SUPPORT OF THE CHILD CARE
WORKFORCE3 WASHINGTON
UNITED
STATES
Child care workers (in
centers) 7,950 573,430
Average annual income of child care workers4
$25,110 $22,310
Total paid early childhood workforce5
N/A 2.2 million
CCR&R CONTACTS URL Child Care Aware of Washington
http://www.childcarenet.org/
Child Care Aware® of America
http://usa.childcareaware.org www.childcareaware.org
3 Statistics provided by the Office of Child Care from the Child Care Development Fund, and
are derived from monthly averages. Total number of child care providers includes paid relatives and other nonregulated caregivers. U.S. Totals include all 50 states and the District of Columbia (http://www.acf.hhs.gov/programs/occ/resource/fy-2013-ccdf-data-tables-preliminary)
4 Bureau of Labor Statistics, U.S. Department of Labor, Occupational Employment Survey, May 2013 estimates. Does not include child care administrators/managers, preschool teachers, special education teachers, or self-employed workers such as family child care business owners. (http://www.bls.gov/oes/current/oes_nat.htm)
5Weiss E. & Brandon, R. N. (2010). The Economic Value of the U.S. Early Childhood Sector. Partnership for America’s Economic Success.

$13,110
$9,887
$15,480
$11,820
$9,741
$8,293$9,469
$7,946
$0
$2,000
$4,000
$6,000
$8,000
$10,000
$12,000
$14,000
$16,000
$18,000
Infant Four-Year-Old
Center Accredited Center FCC Accredited FCC
$4,590$4,014
$0
$2,000
$4,000
$6,000
$8,000
$10,000
$12,000
$14,000
$16,000
$18,000
School-Aged Child
Center (9 months) FCC (9 months)

POPULATION WEST
VIRGINIA UNITED STATES
Total residents 1,850,326 318,857,056
Children age birth to 4 years 102,437 19,757,997
Children age birth to 4 years living in poverty
28,795 4,658,187
Children age 5 to 11 147,566 28,761,402
Total families with children 167,743 33,106,587
Single parent families 58,669 10,993,697
Families in poverty 42,921 6,603,926
CHILDREN UNDER AGE 6
POTENTIALLY IN NEED OF CHILD
CARE
WEST
VIRGINIA UNITED STATES
Children in two-parent families, both parents in labor force
35,895 8,441,764
Children in single-parent families, parent in the labor force
30,563 6,360,521
Total children under age 6 potentially needing child care
66,458 14,802,285
NUMBER OF WORKING
MOTHERS WEST
VIRGINIA UNITED STATES
With infants under one year 8,989 2,435,563
With any children under age 6 43,749 9,721,156
With children under age 6 only
24,366 5,422,464
With both children under age 6 AND children age 6 to 17
19,383 4,298,692
Married working mothers 73,136 15,306,983
Single working mothers 30,007 6,749,078
SPACES IN CHILD CARE PROGRAMS WEST VIRGINIA Total spaces/slots 33,073
Percent of spaces in child care center programs*
78%
Percent of total spaces in licensed FCC homes
22%
Percent of total spaces in school-age care programs
NR
Percent of total spaces in other programs NR Total spaces/slots of licensed programs NR
Percent of licensed spaces for infants and toddlers
NR
Percent of licensed spaces for preschool-aged children
NR
Percent of licensed spaces for school-aged children
NR
*Does not include school-aged programs
1 Unless otherwise noted, statistics in the Child Care Need sections are from the American Community Survey, U.S. Census Bureau, 2011-2013 three-year estimates (http://factfinder2.census.gov/faces/nav/jsf/pages/index.xhtml). 2 Unless otherwise noted, data for the rest of the Fact Sheet is provided by Child Care Resource and Referral Agencies for Child Care Aware® of America’s 2016 State Fact Sheet Survey. Data reflects the 2015 calendar year.
TYPES OF CHILD CARE WEST
VIRGINIA
Number of center-based child care programs 349 Percent of centers that are nationally accredited 7% Do faith-based programs need to be regulated? Yes Number of regulated faith-based programs NR
Number of family child care (FCC) homes 1,235 Percent of FCC homes that are nationally accredited
NR
Number of school-aged care programs 96 Number of other regulated child care centers NR Number of other regulated FCC homes NR
NUMBERS, INCOME, AND
SUPPORT OF THE CHILD CARE
WORKFORCE3 WEST VIRGINIA
UNITED
STATES
Child care workers (in
centers) 2,610 573,430
Average annual income of child care workers4
$19,950 $22,310
Total paid early childhood workforce5
N/A 2.2 million
CCR&R CONTACTS
State Contact Information www.connectccrr.org/
www.linkccrr.org www.wvdhhr.org/choices/
www.ccrcwv.org http://mountainheartwv.com/ccnorthjoom/ http://mountainheartwv.org/ccsouth/childcarewebj/index.php
Child Care Aware® of America
http://usa.childcareaware.org www.childcareaware.org
3 Statistics provided by the Office of Child Care from the Child Care Development Fund, and
are derived from monthly averages. Total number of child care providers includes paid relatives and other nonregulated caregivers. U.S. Totals include all 50 states and the District of Columbia (http://www.acf.hhs.gov/programs/occ/resource/fy-2013-ccdf-data-tables-preliminary)
4 Bureau of Labor Statistics, U.S. Department of Labor, Occupational Employment Survey, May 2013 estimates. Does not include child care administrators/managers, preschool teachers, special education teachers, or self-employed workers such as family child care business owners. (http://www.bls.gov/oes/current/oes_nat.htm)
5Weiss E. & Brandon, R. N. (2010). The Economic Value of the U.S. Early Childhood Sector. Partnership for America’s Economic Success.

$12,961
$10,530
$14,001
$11,570
$13,000 $13,000$14,040 $14,040
$0
$2,000
$4,000
$6,000
$8,000
$10,000
$12,000
$14,000
$16,000
Infant Four-Year-Old
Center Accredited Center FCC Accredited FCC
$7,897
$9,750$10,530
$13,000
$0
$2,000
$4,000
$6,000
$8,000
$10,000
$12,000
$14,000
$16,000
School-Aged Child
Center (9 months) FCC (9 months) Center (12 months) FCC (12 months)

POPULATION WISCONSIN UNITED STATES
Total residents 5,757,564 318,857,056
Children age birth to 4 years 338,837 19,757,997
Children age birth to 4 years living in poverty
71,868 4,658,187
Children age 5 to 11 512,219 28,761,402
Total families with children 634,411 33,106,587
Single parent families 217,036 10,993,697
Families in poverty 108,108 6,603,926
CHILDREN UNDER AGE 6
POTENTIALLY IN NEED OF CHILD
CARE WISCONSIN UNITED STATES
Children in two-parent families, both parents in labor force
182,897 8,441,764
Children in single-parent families, parent in the labor force
106,625 6,360,521
Total children under age 6 potentially needing child care
289,522 14,802,285
NUMBER OF WORKING
MOTHERS WISCONSIN UNITED STATES
With infants under one year 46,816 2,435,563
With any children under age 6 189,782 9,721,156
With children under age 6 only
106,107 5,422,464
With both children under age 6 AND children age 6 to 17
83,675 4,298,692
Married working mothers 329,915 15,306,983
Single working mothers 126,099 6,749,078
SPACES IN CHILD CARE PROGRAMS WISCONSIN Total spaces/slots 161,418
Percent of spaces in child care center programs*
71%
Percent of total spaces in licensed FCC homes
9%
Percent of total spaces in school-age care programs
17%
Percent of total spaces in other programs 7% Total spaces/slots of licensed programs 36,667
Percent of licensed spaces for infants and toddlers
19%
Percent of licensed spaces for preschool-aged children
33%
Percent of licensed spaces for school-aged children
48%
*Does not include school-aged programs
1 Unless otherwise noted, statistics in the Child Care Need sections are from the American Community Survey, U.S. Census Bureau, 2011-2013 three-year estimates (http://factfinder2.census.gov/faces/nav/jsf/pages/index.xhtml). 2 Unless otherwise noted, data for the rest of the Fact Sheet is provided by Child Care Resource and Referral Agencies for Child Care Aware® of America’s 2016 State Fact Sheet Survey. Data reflects the 2015 calendar year.
TYPES OF CHILD CARE WISCONSIN
Number of center-based child care programs 1,825 Percent of centers that are nationally accredited
15%
Do faith-based programs need to be regulated?
No
Number of regulated faith-based programs Number of family child care (FCC) homes 1,764
Percent of FCC homes that are nationally accredited
2%
Number of school-aged care programs 514 Number of other regulated child care centers NR Number of other regulated FCC homes 1,011
NUMBERS, INCOME, AND
SUPPORT OF THE CHILD CARE
WORKFORCE3 WISCONSIN
UNITED
STATES
Child care workers (in
centers) 7,880 573,430
Average annual income of child care workers4
$21,280 $22,310
Total paid early childhood workforce5
N/A 2.2 million
CCR&R CONTACTS URL Supporting Families Together Association
www.supportingfamiliestogether.org
Child Care Aware® of America
http://usa.childcareaware.org www.childcareaware.org
3 Statistics provided by the Office of Child Care from the Child Care Development Fund, and
are derived from monthly averages. Total number of child care providers includes paid relatives and other nonregulated caregivers. U.S. Totals include all 50 states and the District of Columbia (http://www.acf.hhs.gov/programs/occ/resource/fy-2013-ccdf-data-tables-preliminary)
4 Bureau of Labor Statistics, U.S. Department of Labor, Occupational Employment Survey, May 2013 estimates. Does not include child care administrators/managers, preschool teachers, special education teachers, or self-employed workers such as family child care business owners. (http://www.bls.gov/oes/current/oes_nat.htm)
5Weiss E. & Brandon, R. N. (2010). The Economic Value of the U.S. Early Childhood Sector. Partnership for America’s Economic Success.

$11,750
$9,598
$13,942
$10,981
$9,263$8,274
$9,819$8,973
$0
$2,000
$4,000
$6,000
$8,000
$10,000
$12,000
$14,000
$16,000
Infant Four-Year-Old
Center Accredited Center FCC Accredited FCC
$9,094$8,050
$8,932$7,929 $7,949
$0
$2,000
$4,000
$6,000
$8,000
$10,000
$12,000
$14,000
$16,000
School-Aged Child
Center (9 months) FCC (9 months) Center (12 months)
FCC (12 months) Center (Summer)

POPULATION WYOMING UNITED STATES
Total residents 584,153 318,857,056
Children age birth to 4 years 37,929 19,757,997
Children age birth to 4 years living in poverty
5,298 4,658,187
Children age 5 to 11 55,899 28,761,402
Total families with children 63,433 33,106,587
Single parent families 17,935 10,993,697
Families in poverty 8,395 6,603,926
CHILDREN UNDER AGE 6
POTENTIALLY IN NEED OF CHILD
CARE WYOMING UNITED STATES
Children in two-parent families, both parents in labor force
18,436 8,441,764
Children in single-parent families, parent in the labor force
8,205 6,360,521
Total children under age 6 potentially needing child care
26,641 14,802,285
NUMBER OF WORKING
MOTHERS WYOMING UNITED STATES
With infants under one year 4,424 2,435,563
With any children under age 6 19,123 9,721,156
With children under age 6 only
10,974 5,422,464
With both children under age 6 AND children age 6 to 17
8,149 4,298,692
Married working mothers 32,933 15,306,983
Single working mothers 9,265 6,749,078
SPACES IN CHILD CARE PROGRAMS WYOMING Total spaces/slots 43,034
Percent of spaces in child care center programs*
49%
Percent of total spaces in licensed FCC homes
7%
Percent of total spaces in school-age care programs
8%
Percent of total spaces in other programs 42% Total spaces/slots of licensed programs NR
Percent of licensed spaces for infants and toddlers
NR
Percent of licensed spaces for preschool-aged children
NR
Percent of licensed spaces for school-aged children
NR
*Does not include school-aged programs
1 Unless otherwise noted, statistics in the Child Care Need sections are from the American Community Survey, U.S. Census Bureau, 2011-2013 three-year estimates (http://factfinder2.census.gov/faces/nav/jsf/pages/index.xhtml). 2 Unless otherwise noted, data for the rest of the Fact Sheet is provided by Child Care Resource and Referral Agencies for Child Care Aware® of America’s 2016 State Fact Sheet Survey. Data reflects the 2015 calendar year.
TYPES OF CHILD CARE WYOMING
Number of center-based child care programs 726 Percent of centers that are nationally accredited
3%
Do faith-based programs need to be regulated?
Yes
Number of regulated faith-based programs NR Number of family child care (FCC) homes 301
Percent of FCC homes that are nationally accredited
2%
Number of school-aged care programs 44 Number of other regulated child care centers 272 Number of other regulated FCC homes 153
NUMBERS, INCOME, AND
SUPPORT OF THE CHILD CARE
WORKFORCE3 WYOMING
UNITED
STATES
Child care workers (in
centers) 1,430 573,430
Average annual income of child care workers4
$21,890 $22,310
Total paid early childhood workforce5
N/A 2.2 million
CCR&R CONTACTS URL Tania Trujillo, CCR&R Coordinator, State of Wyoming
https://sites.google.com/a/wyo.gov/early-childcare-and-licensing/
Child Care Aware® of America
http://usa.childcareaware.org www.childcareaware.org
3 Statistics provided by the Office of Child Care from the Child Care Development Fund, and
are derived from monthly averages. Total number of child care providers includes paid relatives and other nonregulated caregivers. U.S. Totals include all 50 states and the District of Columbia (http://www.acf.hhs.gov/programs/occ/resource/fy-2013-ccdf-data-tables-preliminary)
4 Bureau of Labor Statistics, U.S. Department of Labor, Occupational Employment Survey, May 2013 estimates. Does not include child care administrators/managers, preschool teachers, special education teachers, or self-employed workers such as family child care business owners. (http://www.bls.gov/oes/current/oes_nat.htm)
5Weiss E. & Brandon, R. N. (2010). The Economic Value of the U.S. Early Childhood Sector. Partnership for America’s Economic Success.

$9,110
$7,841
$9,110
$7,841$7,800$7,280
$7,800$7,280
$0
$1,000
$2,000
$3,000
$4,000
$5,000
$6,000
$7,000
$8,000
$9,000
$10,000
Infant Four-Year-Old
Center Accredited Center FCC Accredited FCC
$6,510
$7,280
$6,510
$7,280
$0
$1,000
$2,000
$3,000
$4,000
$5,000
$6,000
$7,000
$8,000
$9,000
$10,000
School-Aged Child
Center (9 months) FCC (9 months) Center (12 months) FCC (12 months)